Article

Finite Element Modeling of Different Types of Hydrogen Pressure Vessels Under Extreme Conditions for Space Applications

1
Department of Mechanical Engineering, Faculty of Engineering, Suez University, Suez P.O. Box 43221, Egypt
2
Department of Mechanical Engineering, College of Engineering, Imam Mohammad Ibn Saud Islamic University, Riyadh 11432, Saudi Arabia
*
Authors to whom correspondence should be addressed.
Processes 2025, 13(5), 1429; https://doi.org/10.3390/pr13051429
Submission received: 14 April 2025 / Revised: 2 May 2025 / Accepted: 4 May 2025 / Published: 7 May 2025

Abstract

:
Fuel cells, propulsion systems, and reaction control systems (RCSs) are just a few of the space applications that depend on pressure vessels (PVs) to safely hold high-pressure fluids while enduring extreme environmental conditions both during launch and in orbit. Under these challenging circumstances, PVs must be lightweight while retaining structural integrity in order to increase the efficiency and lower the launch costs. PVs have significant challenges in space conditions, such as extreme vibrations during launch, the complete vacuum of space, and sudden temperature changes based on their location within the satellite and orbit types. Determining the operational temperature limits and endurance of PVs in space applications requires assessing the combined effects of these factors. As the main propellant for satellites and rockets, hydrogen has great promise for use in future space missions. This study aimed to assess the structural integrity and determine the thermal operating limits of different types of hydrogen pressure vessels using finite element analysis (FEA) with Ansys 2019 R3 Workbench. The impact of extreme space conditions on the performances of various kinds of hydrogen pressure vessels was analyzed numerically in this work. This study determined the safe operating temperature ranges for Type 4, Type 3, and Type 1 PVs at an operating hydrogen storage pressure of 35 MPa in an absolute vacuum. Additionally, the dynamic performance was assessed through modal and random vibration analyses. Various aspects of Ansys Workbench were explored, including the influence of the mesh element size, composite modeling methods, and their combined impact on the result accuracy. In terms of the survival temperature limits, the Type 4 PVs, which consisted of a Nylon 6 liner and a carbon fiber-reinforced epoxy (CFRE) prepreg composite shell, offered the optimal balance between the weight (56.2 kg) and a relatively narrow operating temperature range of 10–100 °C. The Type 3 PVs, which featured an Aluminum 6061-T6 liner, provided a broader operational temperature range of 0–145 °C but at a higher weight of 63.7 kg. Meanwhile, the Type 1 PVs demonstrated a superior cryogenic performance, with an operating range of −55–54 °C, though they were nearly twice as heavy as the Type 4 PVs, with a weight of 106 kg. The absolute vacuum environment had a negligible effect on the mechanical performance of all the PVs. Additionally, all the analyzed PV types maintained structural integrity and safety under launch-induced vibration loads. This study provided critical insights for selecting the most suitable pressure vessel type for space applications by considering operational temperature constraints and weight limitations, thereby ensuring an optimal mechanical–thermal performance and structural efficiency.

1. Introduction

In space applications, pressure vessels (PVs) are essential parts that are used to store and control gases and fluids under high pressure. PVs are essential for a spacecraft’s reaction control systems (RCSs), which allow for accurate orientation and maneuvering changes [1]. PVs are also used in satellites and rockets to store gaseous or liquid propellants for propulsion systems, including liquid hydrogen and liquid oxygen (LOX) [2,3].
PVs are also essential for storing the hydrogen and compressed oxygen gases used for power cells. Without burning, these cells produce heat, water, and electricity through electrochemical reactions between hydrogen and oxygen [2,4]. Because they offer dependable, long-duration power for spacecraft, satellites, space stations, and crewed missions, fuel cells are very important in space applications. Fuel cells are perfect for deep-space and crewed missions that take place in remote or gloomy areas of space because they can provide power continuously, unlike solar panels, which depend on sunshine.
Hydrogen offers a high exhaust velocity, making it an ideal fuel for upper-stage rocket engines that operate in space. Hydrogen-fueled engines deliver excellent thrust while maintaining a low spacecraft weight. In fact, hydrogen produces the highest exhaust velocity of any rocket fuel [5]. Additionally, hydrogen’s extremely low boiling point (−253 °C) enables it to effectively cool spacecraft systems, sensors, and instruments, as it efficiently absorbs and transfers heat, preventing the overheating of critical components [3]. As a result, hydrogen pressure vessels are substantial in space applications, given hydrogen’s unique properties and its integral role in various essential systems.
Hydrogen can be stored in various states, each offering distinct characteristics. Compressed gaseous hydrogen (GH2), which is stored at room temperature and high pressures up to 700 bar, is lightweight but requires large storage volumes, resulting in a low energy density and up to 10% energy loss during compression. Liquid hydrogen (LH2), which is stored at cryogenic temperatures ranging from −240 °C to −253 °C and at low pressures of approximately 10 bar, offers a higher energy density but necessitates strict insulation and leads to up to 40% energy loss during liquefaction. Cryo-compressed hydrogen (CcH2), which is stored at cryogenic temperatures between −196 °C and −240 °C and moderate pressures of 150–350 bar, combines the advantages of both GH2 and LH2 [6].
As illustrated in Figure 1, various pressure vessel designs are available for storing different types of fuel. Type 1 pressure vessels (PVs) are typically made from steel or aluminum, forming a metallic cylinder. These are the heaviest PVs, with a weight of approximately 1.4 kg per liter. Seamless metallic PVs are the most widely used in vehicle gas storage applications [6,7,8,9].
Type 2 PVs feature a thick metal liner, usually made of steel or aluminum, with a cylindrical straight side wrapped in composite fibers, typically consisting of glass, aramid, or carbon fibers. The unwrapped domes must be strong enough to withstand loads [7,8].
Type 3 PVs are characterized by a seamless metal liner, often aluminum, fully covered by a fiber resin system. The composite overwrap bears the majority of the structural loads, contributing 75–90% of the vessel’s strength. The metal liner not only adds extra strength but also serves as a gas barrier and enhances the impact resistance. Compared with Type 2 PVs, Type 3 PVs offer significant weight savings by substantially reducing the thickness of the metal liner [7,8].
In Type 4 pressure vessels (PVs), the fiber–resin system, typically composed of carbon fiber or hybrid carbon/glass fibers, completely envelops the polymeric liner. Due to the use of plastic liners, these PVs exhibit improved gravimetric performance [7,8,10,11].
Type 3 and Type 4 PVs are categorized as composite pressure vessels (CPVs) [7,10,11]. When designing and manufacturing CPVs for specific applications, it is crucial to understand how various factors influence the performance. The materials utilized for the liner and composite, the liner’s geometry, the composite layers’ winding configuration, the filament-winding process parameters, the winding sequence, and curing features are important variables. Particular consideration must be given to the design of the dome profile in Type 3 and Type 4 CPVs, where the composite material is wrapped around the entire vessel, in order to account for the winding potential [7,10,11,12].
Different dome head designs of pressure vessels lead to variations in their mechanical properties [7,13,14]. The profiles of various dome shapes are illustrated in Figure 2a–e [7,14]. Ellipsoidal dome types represent a geometry that falls between a hemispherical head, which is designed to withstand the maximum load, and an isotensoidal dome, which is used to prevent fiber slippage. Because it minimizes the possibility of fiber slippage, the isotensoidal dome head is regarded as the best option for a composite winding employing filament-winding technology [7,12,14].
A previous study conducted by the first author, R. Reda et al. [7], examined the influence of winding angles and patterns on the burst pressure and thickness of Type 4 CPVs using a numerical analysis. A nylon 6 liner with a carbon fiber-reinforced epoxy (CFRE) prepreg composite shell was used. They recommended the [80/−80/20/−20] winding angle pattern. This winding pattern uses 20° and 80° angles in both positive and negative directions, and it shows the highest burst pressure of 81.26 MPa. This arrangement neutralizes the complex stress generated in wound composite layers, including hoop, axial, and shear stresses. This may be the reason for the exceptional performance of combining the positive and negative angles, i.e., the same angle in opposite directions. Furthermore, from a practical standpoint, using too many single-direction angles results in delamination between layers because of shear stresses. This combination offers an excellent strength-to-weight ratio, durability, and compatibility for high-pressure hydrogen storage applications [7].
Optimizing the stacking sequence is an effective method for improving the structural performance, as demonstrated in a previous study by Canale et al. [15] on aerospace composite structures. Recent work by Yang and Liang [16] employed a Bayesian optimization computational framework to optimize the stacking sequence of composite laminates for maximizing the fundamental frequency.
Park et al. [17] studied the effects of the low Earth orbit environment on unidirectional high-modulus carbon fiber-reinforced composites used in satellite body fabrication for long-term durability (500 cycles). This environment involved a high-vacuum state and thermal cycling in the temperature range between 120 °C and −175 °C. These conditions were applied experimentally. They stated that it was difficult to reach a definite conclusion because of the considerable scatter inherent in the data. They found that the vacuum thermal cycling resulted in the mechanical property degradation of the fiber–matrix interface, which was facilitated by the weak fiber–matrix bond. They also recommended that the formation of a more tenacious interfacial bond between the fiber and the matrix can improve the mechanical response of unidirectional carbon fiber/epoxy laminates exposed to cyclic vacuum thermal conditions.
NASA has conducted research on composite pressure vessels (CPVs) for energy storage and aerospace applications, comparing between the Type 3 CPVs with a thin-walled metal liner and Type 4 CPVs [18]. Findings indicate that at low pressures around 2 MPa, Type 3 CPVs offer a little weight advantage over the metal tanks due to the required liner thickness. However, at higher pressures around 12.41 MPa, Type 4 CPVs provide significant weight savings, making them ideal for high-pressure applications.
Pressure vessels must have several aspects to perform well in space environments, including (i) structural integrity in extreme conditions, which ensures that high-pressure fluids are robustly contained while enduring launch stresses and space conditions; (ii) a high strength-to-weight ratio, which requires that the vessel be lightweight and able to withstand high internal pressures to minimize the payload weight and launch cost and maximize the efficiency; (iii) resistance to oxidation and corrosion: it should be able to withstand exposure to the hostile space environment and corrosion from chemicals that are stored; (iv) temperature resistance: needs to withstand sharp temperature swings from cryogenic settings to intense heat exposure; (v) durable and leak-proof: this feature must guarantee that there are no leaks during extended operation in vacuum and microgravity environments; (vi) resistance to impact and vibration: should be made to endure the powerful shocks and vibrations that occur during launch and re-entry; (vii) non-reactive with stored fluids: the substance needs to be chemically compatible with liquids and gases that have been stored; and (viii) redundancy and safety features: several safety features, like multilayered containment and pressure release valves, are frequently included in designs [2,9,19,20].
The sharp temperature swings that the pressure vessels can be subjected to, i.e., from cryogenic temperature to intense heat exposure, depend on the position of the PV in the satellite and the orbit type. The pressure vessels may operate within very high temperatures if positioned near an active propulsion system. In liquid rocket engines, for instance, pressure vessels placed near thrusters can encounter significantly elevated temperatures. The orbit type and its light and shadow periods significantly affect the performance of the satellite payload. Therefore, one of the key concepts involved in performing a successful thermal control analysis is determining the operating conditions and weight of each component within the satellite, which depends on many parameters, such as the orbit type, materials, outer shell surface roughness, and applied insulation.
There is a significant scarcity in research papers that define the service temperature limits and survival attributes allowable for each type of pressure vessel. The main goal of this study was to examine the influence of the extreme space conditions on the structural integrity of the different types of designed pressure vessels used for hydrogen storage. These extreme conditions include an external absolute vacuum and temperature change from cryogenic to high temperature during service, along with the internal high pressure of the compressed hydrogen gas.
This study involved identifying the operating temperature limits for the Type 4, Type 3, and Type 1 PVs to store compressed hydrogen gas at a 55 MPa internal pressure under extreme conditions. To better comprehend how PVs behave dynamically under extreme vibration conditions during launching, modal and random vibration analyses were essential. These analyses were used to determine the natural frequencies, the deformation in each direction at the natural frequencies, and the maximum stress encountered due to the vibration. These modules examined the structure’s integrity and its ability to survive in the extreme conditions in space. Through better comprehending the influence of these extreme space conditions and constraints, this paper offers essential guidance for selecting the suitable pressure vessel type based on operational temperature requirements and weight constraints, ensuring an optimal balance between mechanical–thermal performance and structural efficiency for space applications.

2. Methodology

2.1. Service Temperature Indication of Satellites Using FreeFlyer

As an indication of the shadow and light oscillation, the path that a satellite passes through at different altitudes and beta angles was calculated using FreeFlyer software [21]. The Two-Line Elements (TLEs) were obtained from Foster [22], and the paths were tested at 421 km, 2000 km, and 35,786 km. Each altitude was measured at 0 and 75.1 beta angles. Using FreeFlyer software (version 7.9.1), a 2D map that illustrated the shadow and light zones was obtained; such data reveal the sharp temperature changes the satellite and its components are subject to during service.

2.2. Finite Element Modeling (FEM)

2.2.1. Geometry and Isotensoid Calculations

First, SolidWorks 2023 software was used to draw the CAD model of the PVs, as shown in Figure 3. The main dimensions were a 1026 mm total length and 304 mm diameter, which were taken from a previous work [7,12,14]. An isotensoid dome profile is recommended for such applications, as it prevents slippage of the fiber during the filament-winding process [7].
The dome isotensoid profile was obtained using the baseline method. The isotensoid was calculated by iterating the following set of equations [12,14]:
x = x + Δ x
r = r Δ r
where x represents the dome height and r denotes the vessel radius.
r o = R × S I N ( a _ )
Ψ = Ψ + D Ψ
The angle Ψ represents the curvature angle normal to the shell surface, as demonstrated in Figure 4 [14].
r m = r ( c o s ( Y ) ) × 2 ( t a n ( a ) ) 2
Δ r = r m × Δ Ψ × s i n ( Ψ _ ) _
Δ x = r m × Δ Ψ × c o s ( Ψ _ ) _
The angle a represents the winding angle of the filament around the liner.
The isotensoid dome profile was calculated iteratively using Microsoft Excel, and the results were exported to the CAD model in a compatible file format (STEP) to ensure seamless integration with Ansys.
Figure 4. Curvature angle (Ψ) normal to the shell surface (left) and dome height (x) with radius (r) (right) [12].
Processes 13 01429 g004

2.2.2. Types and Materials

The performances of the Type 4, Type 3, and Type 1 PVs under extreme space conditions, namely, high and low temperature exposures, a surrounding absolute vacuum, and mechanical vibration, were analyzed in this study through FEM using the Ansys workbench.
The Type 4 CPVs were made of a Nylon 6 liner with a CFRE prepreg overwrapped composite. The Type 3 CPVs were made of an aluminum alloy 6061 T6 liner with a CFRE prepreg overwrapped composite. The Type 1 PVs were made of Aluminum 6061 T6 liner. Aluminum 6061 T6 is commonly used due to its high strength-to-weight ratio, good weldability, and lower cost [9].
The material properties for each pressure vessel are defined in the Ansys Engineering Data with their thermal and mechanical properties. The properties of the Aluminum 6061 T6 and Nylon 6 are presented in Table 1. The properties of the CFRE unidirectional prepreg composite material are demonstrated in Table 2. These data are quoted from the Ansys Composite Pre/Post (Ansys ACP) data library.

2.2.3. Building the Composite Layers

Ansys Composite Pre/Post (Ansys ACP) is a specialized module within Ansys that is designed for the modeling, simulation, and analysis of composite materials and structures. It provides a comprehensive suite of tools for defining layered composite structures, simulating their behavior under various loading and environmental conditions, and evaluating failure criteria and mechanisms.
The process begins with defining the fabric thickness, specifying the material properties, and assigning rosettes. Subsequently, the composite layers are configured with the appropriate winding angles, as illustrated in Figure 5. The selected initial layer-winding pattern was [80, −80, 20, −20]₂₆, meaning the sequence 80, −80, 20, −20 was repeated 26 times, where each layer had a thickness of 0.5 mm. This pattern was adopted based on the findings of a previous study conducted by the first author [7]. Figure 6 illustrates the winding angle orientation of the composite relative to the main axis of the cylinder, as modeled using the Ansys ACP Pre/Post module.
Applying the composite materials using the Ansys ACP module requires specifying the modeling method, i.e., either solid or shell composite modeling methods. Depending on the geometry, the mesh model can be created as a line, shell, or solid. The solid mesh model has three degrees of freedom (UX, UY, UZ) and the shell mesh model has six (UX, UY, UZ, ROTX, ROTY, ROTZ) [23,24].
The shell and solid composite modeling methods were tested using maximum principal stress theory to identify the most stable and suitable composite-modeling method that ensured the result accuracy and saved the solving time.

2.2.4. Meshing and Mesh Quality

The mesh element size in FEM is a crucial factor in determining the model’s accuracy. After numerous attempts, the ideal mesh element type and size were chosen in order to produce high-precision results and reduce the solving time.
Hexahedral elements predominate in meshes created using the quadrilateral-dominant meshing method. Ansys uses two key criteria to evaluate the mesh quality, namely, skewness and orthogonal quality. According to Ansys workbench standards, a high orthogonal quality close to or more than 1.0 and low skewness in the 0 to 0.9 range are necessary to produce a good mesh quality [7].
A mesh quality study was performed for both the liner and composite materials in the Type 4 CPVs, and the results were applied to the other PV types.
The maximum principal stress theory was used to examine the performance of the composite part of the Type 4 CPVs in the mesh quality study to examine the convergency of the results to increase the accuracy and find the balance between the computer capabilities, computing time, and measurement reliability. This study was performed at an internal pressure of 70 MPa and employed a safety factor of 2 at a 35 MPa operating pressure of the hydrogen gas, according to the ASME Boiler and Pressure Vessel Code [25]. Also, the maximum principal stress was tested against the mesh element size.

2.2.5. Boundary Conditions

Along with high internal pressure applications, there are other boundary conditions that were defined to ensure an accurate simulation of the pressure vessel’s performance under operational and extreme conditions of space applications.
One of the extreme conditions in space applications is the surrounding vacuum. Different vacuum levels and the corresponding pressure are demonstrated in Table 3. The external environment was modeled as an absolute vacuum to represent the most extreme space conditions, which eliminated any external pressure to study its influence on the performance of the other PV types as compared with atmospheric pressure.
Thermal boundary conditions were also incorporated. The outer surface was subjected to temperature profiles that ranged from cryogenic (−100 °C) to high-temperature conditions (up to 145 °C), depending on the material’s thermal–mechanical performance limits. The analysis considered material-specific properties, such as the thermal expansion, thermal conductivity, and stress–strain response, under these conditions.
To simulate the boundary conditions encountered during operation, fixed supports were applied at both outer ends of the pressure vessel. For the vibration analysis, fixed supports were applied at the vessel’s body tips to ensure structural stability.
Figure 7 illustrates the various boundary conditions applied to the studied pressure vessels to simulate different extreme conditions.

2.2.6. Structural and Thermal Analysis

The static structural module of Ansys Workbench was used to simulate the mechanical and thermal service conditions of the pressure vessels designed for hydrogen gas storage. Figure 8 illustrates the Ansys work schematic for the analysis of the Type 4 CPVs.
A structural analysis was performed to evaluate the stress distributions and identify potential failure points under the defined extreme space conditions, including a high internal pressure, an external absolute vacuum, and external thermal loads. The operating temperature ranges for each pressure vessel were determined based on the material property limits and the vessel’s structural performance.
Various failure theories were employed to predict the material failure, with the choice of theory depending on the material’s mechanical behavior (brittle or ductile). Maximum principal stress theory, commonly used for brittle materials, posits that failure occurs when the maximum principal stress exceeds the material’s uniaxial tensile strength, leading to fracture. In contrast, equivalent stress theory, or the von Mises criterion, is typically used for ductile materials. According to this criterion, ductile materials fail when the equivalent stress exceeds the material’s yield strength [7].
For the Type 4 CPVs, maximum principal stress theory was applied to analyze the CFRE composite and Nylon 6 liner. The Nylon 6 liner was maintained at a thickness of 5.17 mm, as the polymeric liner does not contribute to load-bearing alongside the composite shell [7,12]. The analysis was conducted under both absolute vacuum and atmospheric pressure conditions to compare the effects of evacuation and assess any deviation in the results from the atmospheric pressure scenario.
In the Type 3 CPVs simulation, the number of composite layers, layer thickness, mesh element size, and boundary conditions were the same as for the Type 4 CPVs, except that the liner material was identified as Aluminum 6061 T6. Moreover, the Type 1 PVs with Aluminum 6061 T6 material were studied.
Equivalent stress theory was chosen to analyze Aluminum 6061 T6, as it accurately predicts failure in ductile materials [26].
In the Type 1 PVs, thicknesses of 5, 10, 20, 30, 40, 50, and 60 mm were tested to obtain the suitable thickness that was able to withstand the defined space extreme conditions.

2.2.7. Composite Failure Criteria

Both the maximum principal stress theory in the static structural module and the inverse reverse factor (IRF) failure tool of Ansys ACP Post were used to identify the failure of the composite material.
The IRF is a dimensionless parameter used in failure detection to assess the performance and safety of composite materials under applied loads. It represents the ratio between the applied stress and the material’s maximum strength. When the IRF equals 1, the material has reached its failure point. If the IRF exceeds 1, the structure fails, as the stress exceeds the material’s allowable strength.
The IRF for composite materials was calculated using Ansys ACP Post, as it provides reliable and precise results.
Both of these failure criteria were analyzed by applying a high internal pressure under extreme space conditions, including an external temperature change and absolute vacuum environment.
The working composite failure mechanism was analyzed for detecting fiber failure, matrix failure, and delamination between composite layers using the composite failure tool according to maximum stress theory.
The active composite failure mechanisms—fiber failure, matrix failure, and interlayer delamination—were analyzed using the composite failure tool based on maximum stress theory.

2.2.8. Modal and Random Vibration Analyses

Modal and random vibration analyses were conducted using Ansys Workbench’s modules for all the studied pressure vessels at a 55 MPa internal pressure and under an absolute vacuum. Each vessel was clamped from both ends.
Modal analysis was used to determine the natural frequencies under free vibration in ten modes for all the studied pressure vessels to ensure that each PV’s natural frequencies were far from the stimulated frequencies in space applications and ensure resonance failure was avoided.
In the random vibration analysis, excitation was defined using a power spectral density (PSD) input in terms of the acceleration (g2/Hz), which was derived from the Shuttle Hitchhiker Experiment Launcher System (SHELS) spectrum.
The PSD basically measures the amount of average power present in the frequencies and can be expressed in terms of the acceleration, displacement, or velocity [27]. In the current analysis, the “PSD G Acceleration” boundary condition was applied to the X-, Y-, and Z-directions, where G stands for the G-force.
The Acceleration Spectral Density (ASD) curve was provided in ANSYS Workbench as tabular data, where it covered a frequency range from approximately 20 to 2000 Hz. Figure 9 displays the applied random vibrational spectrum data [28].
Random vibration analysis, which necessitates the application of a load, is used to determine the maximum deformation at natural frequencies and the corresponding equivalent stress results to ensure that these values are in the acceptable limits for each pressure vessel type.

3. Results and Discussion

3.1. Service Temperature Variation in Satellites

Satellites operate in a variety of orbital environments, including a low Earth orbit (LEO), medium Earth orbit (MEO), geostationary orbit (GEO), highly elliptical orbit (HEO), Molniya orbit, and Sun-synchronous orbit, each of which presents distinct thermal conditions. These orbital variations lead to different heating and cooling patterns. To better understand these conditions, several orbital data sets were analyzed using FreeFlyer software 7.9.1, as outlined below.
The Hubble Space Telescope’s orbit is considered a low earth orbit (LEO) as its altitude is about 500 km. A 2D map of the LEO Hubble Space Telescope’s orbit showing the shadow and light zones using FreeFlyer software 7.9.1 is shown in Figure 10. The TLE obtained from the NASA NSSDC Master Catalog [29] was used to analyze and map the orbit; the orange line indicates light, and the cyan line indicates shadow. This analysis demonstrated that this orbit, during its 94.6 min period, faced about 35.0769 min in the penumbral region and 34.769 min in the umbral region.
Using the TLE from the NASA NSSDC Master Catalog [30], a 2D map of the COSMOS 2023 (GLONASS) orbit was analyzed and mapped by using FreeFlyer software 7.9.1, illustrating the shadow and light zones, as shown in Figure 11. The orange line indicates light, and the cyan line indicates shadow. The COSMOS 2023 (GLONASS) orbit is considered a medium Earth orbit, as its altitude is about 19,129 km, and during its 675.7 min period, it faces about 17.495117188 min in the penumbral region and 9.194335938 min in the umbral region (these numbers were obtained as an indication, as in this case, such numbers vary from one spin to another). Such a small period indicates a higher overheating risk.
The GOES 16 orbit is considered a geostationary Earth orbit, as its altitude is 35,786 km. Using the TLE obtained from the NASA NSSDC Master Catalog [31], a 2D map of the GOES 16 orbit was analyzed and mapped using FreeFlyer software 7.9.1, illustrating the shadow and light zones, as presented in Figure 12. During its 24 h period, it faces about 12 h in shadow and 12 h in light, as revealed from the analysis. Such an orbit requires a strong active thermal control subsystem to withstand such extreme conditions.
For an LEO, the satellite operates at an altitude of 500–1500 km, with a range of −65 °C to +125 °C, depending on the orbit height [18]. For a GEO, a satellite may encounter temperatures from −196 °C to +128 °C [18]. The temperature of deep space may reach down to −269 °C. Furthermore, the combustion temperature for the thrust chambers may reach 1000, 2500, and 3500 °C [32]. This elevated temperature range comes from the combustion in thrusters, the albedo (energy reflected from the Earth), the solar flux emitted from the Sun on the satellite body, the infrared energy emitted from the Earth to the satellite body, and the generated heat inside the satellite because of the operating devices. These results give actual knowledge of the sudden and severe temperature changes the satellite and its components are subject to during service in space and confirm the utmost importance of studying the impact of these severe and extreme conditions on the service performance and material behavior of the components used in space applications.

3.2. Isotensoid Dome and Minimum Winding Angle

As mentioned before, the isotensoid dome shape was chosen in the current study to prevent fiber slippage during the actual manufacturing of the Type 4 and Type 3 CPVs, as reported previously [7,12,14]. Using the set of isotensoid equations (1:7), the minimum allowable winding angle could be calculated. By applying the isotensoid equations, the generated isotensoid curve proved that 20° was the minimum winding angle to avoid the fiber intersecting and tangling during the design and, moreover, to avoid fiber slippage during winding. Figure 13 shows the isotensoid dome profile obtained from equations (1:7) for a 20° winding angle. Table 4 presents the calculation results of the isotensoid equation’s parameters.
The selected winding pattern to be employed in the current study, [80°, −80°, 20°, −20°], solved this issue. This winding pattern had proven to be very efficient over other patterns studied by Reda et al. [7], as it provides a high burst pressure for a low-weight vessel.

3.3. Type 4 Composite Pressure Vessels Under Extreme Conditions

3.3.1. Aspects of Type 4 CPVs in FEM

In this part, the performance of the Type 4 CPVs, which were composed of a Nylon 6 liner and 26 composite layers according to the winding pattern of [80/−80/20/−20], was studied at a 70 MPa internal pressure under extreme conditions using both maximum principal stress theory and the IRF failure criterion.
Different FEM aspects for the Type 4 CPVs were studied to examine their influences on the results accuracy. These FEM aspects included studying the mesh quality through analyzing the influence of the mesh element size on the skewness and orthogonal quality. Moreover, the influence of the mesh element size was studied regarding the convergency of the resultant maximum principal stress values.
Another aspect of FEM’s difference in applying solid or shell composite modeling methods on the result’s convergency was studied. To make an accurate opinion in this aspect, both methods were used, and the influence was studied on the convergency of the resultant maximum principal stress values, taking into account the influence of the mesh element size. Moreover, the maximum principal stress values were analyzed at different temperatures using both composite modeling methods to demonstrate their influence on the results accuracy.
The influence of the extreme space conditions, which involved the external absolute vacuum and the temperature change from cryogenic to high temperature, on the performance of the Type 4 CPVs was then studied utilizing the selected optimal FEM’s aspects.

Mesh Quality Analysis

The skewness and orthogonal quality are two important metrics Ansys uses to assess the mesh quality. A low skewness and high orthogonal quality are required to provide a good mesh quality. A separate study was performed on the Nylon 6 liner and composite part of the Type 4 CPVs.
For the Nylon 6 liner, the influence of the mesh element size on the skewness and orthogonal quality was examined over a range of element sizes from 2 to 30 mm. As previously mentioned, a good mesh quality is characterized by skewness values in the range of 0 to 0.9 and orthogonal quality values close to or greater than 1.0.
As shown in Figure 14, the mesh element size had a strong impact on the skewness, but only a slight influence on the orthogonal quality. It was found that mesh element sizes between 3 and 5 mm resulted in the lowest skewness and a consistently high orthogonal quality, indicating an optimal mesh quality and more accurate results.
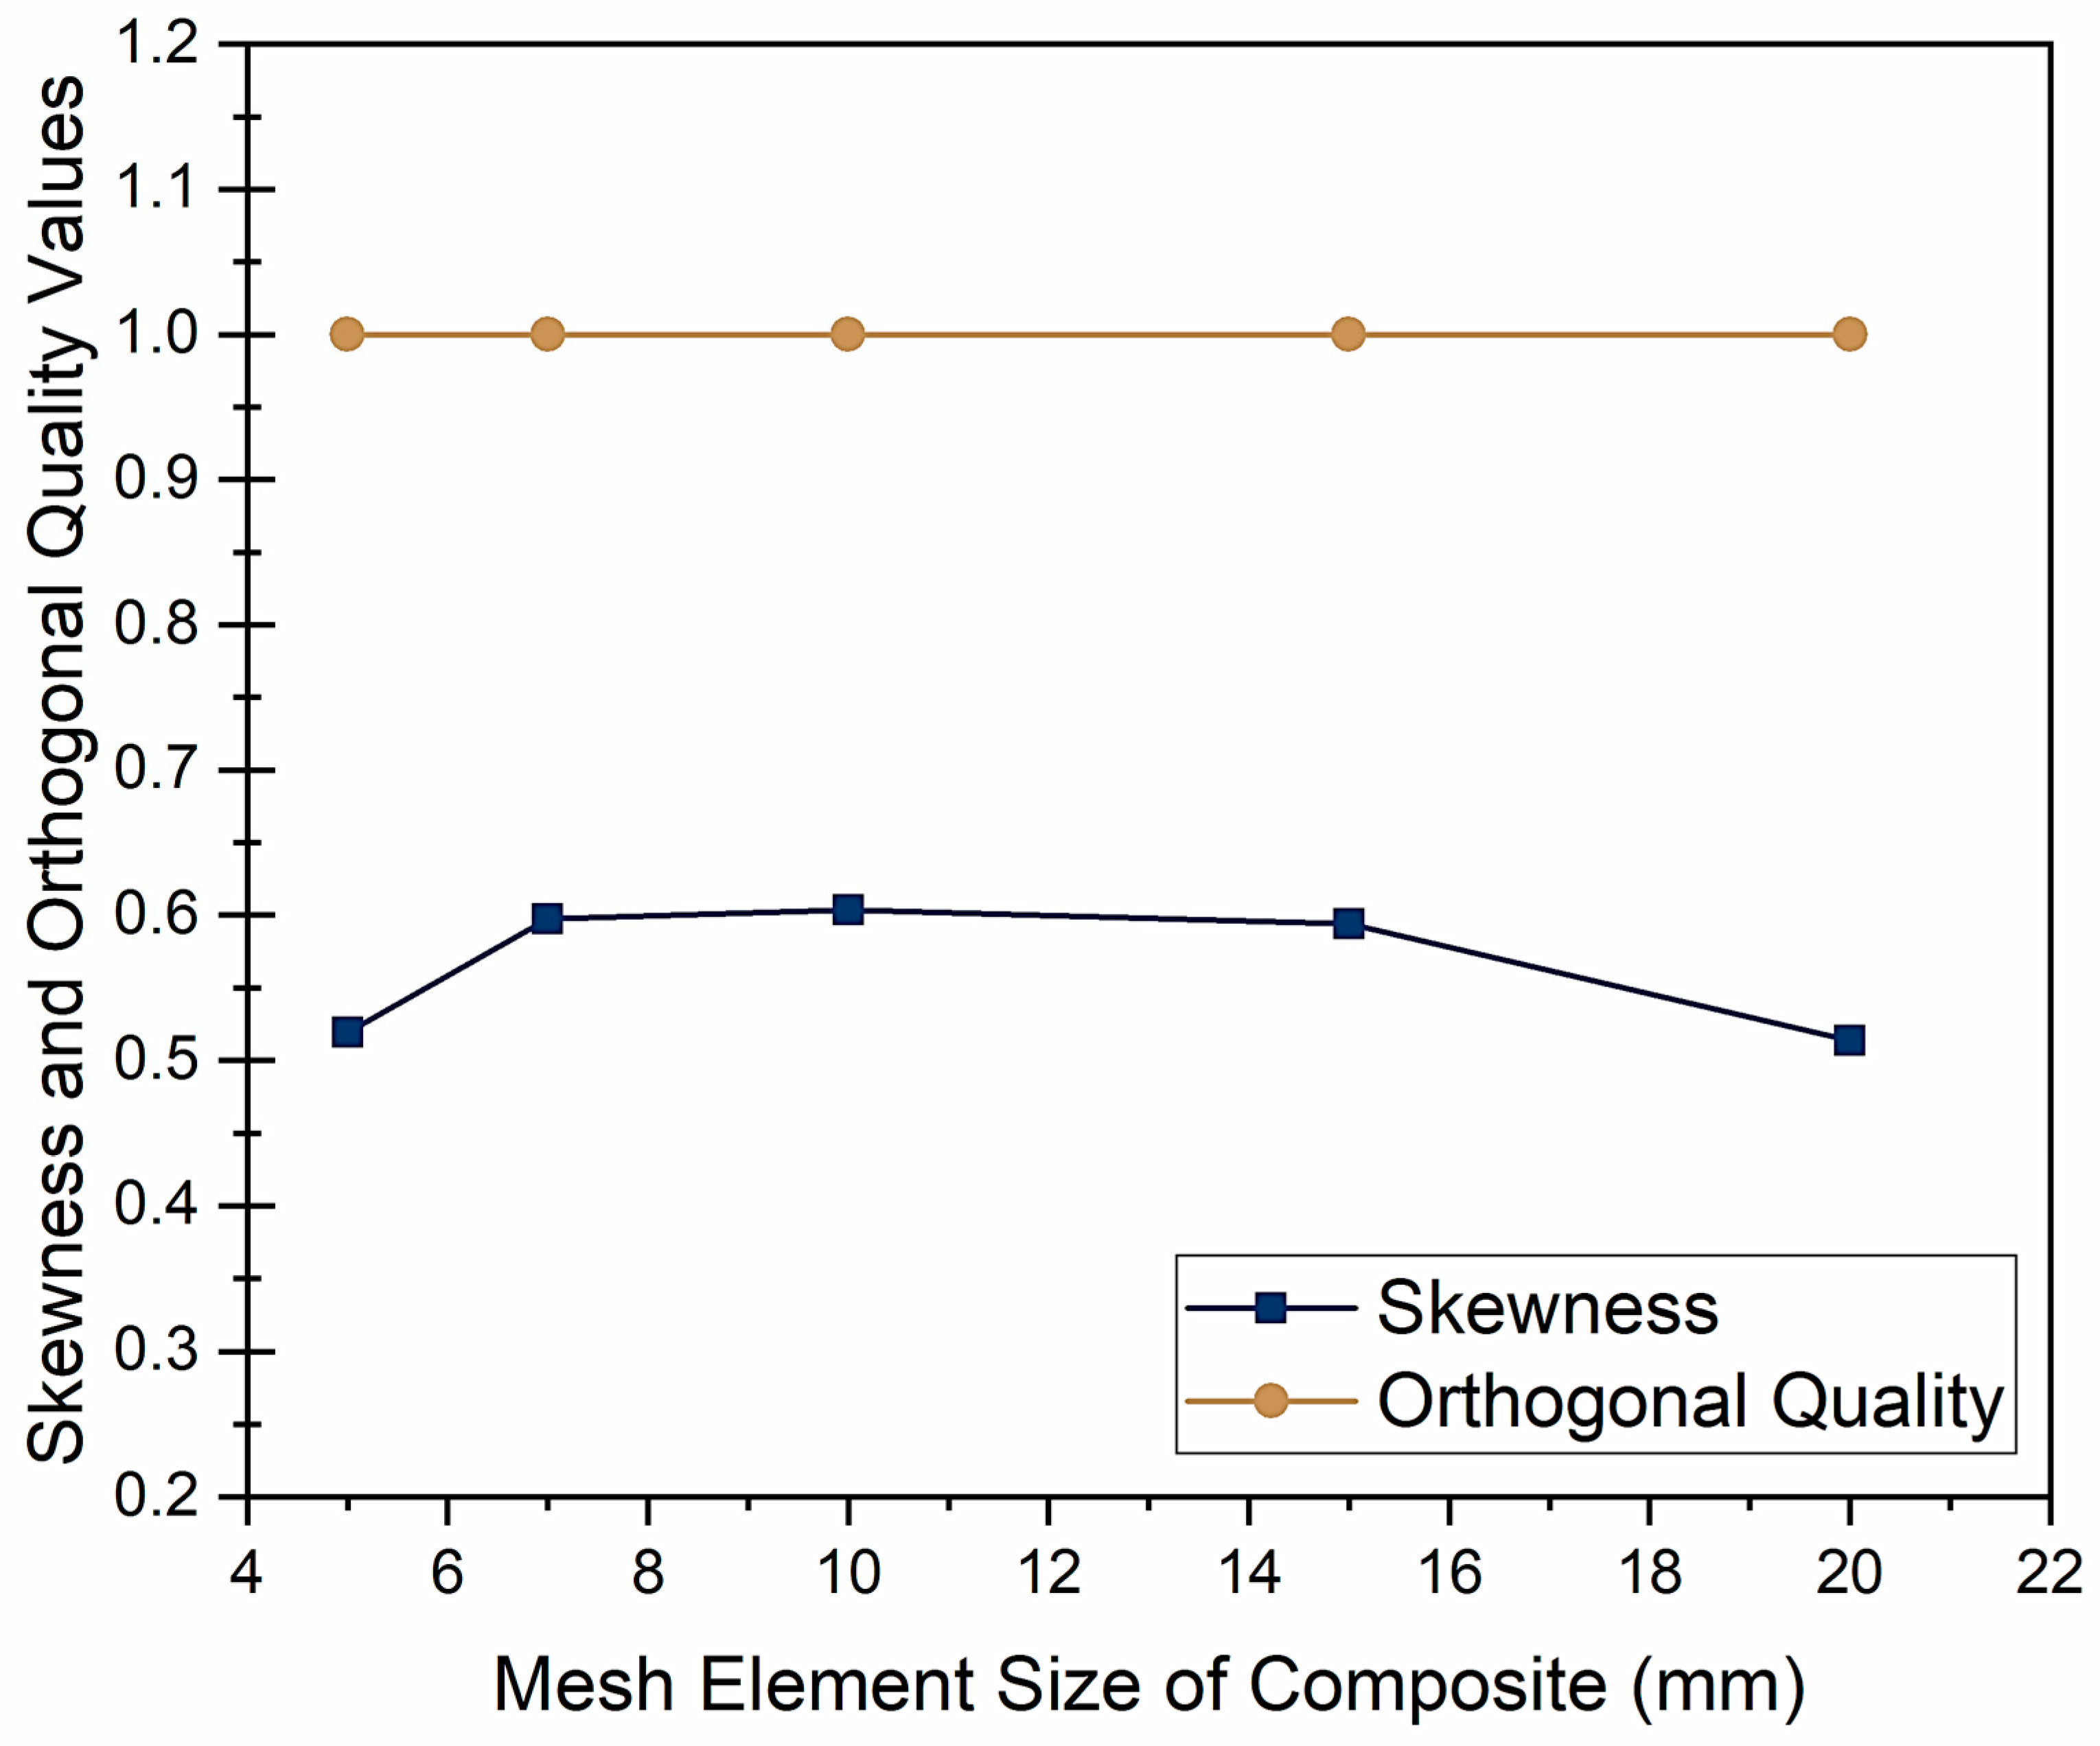
For the composite layers, the mesh element size was varied within the range of 5 to 20 mm, and the effects on the skewness and orthogonal quality were evaluated. As depicted in Figure 15, mesh element sizes of 5, 15, and 20 mm produced the lowest skewness and a stable high orthogonal quality, indicating an excellent mesh quality and reliable results.
From these results, it can be concluded that using a 5 mm mesh element size for the Nylon 6 liner and a 15 mm mesh element size for the composite layers offered a good balance between the solving time and analysis precision.
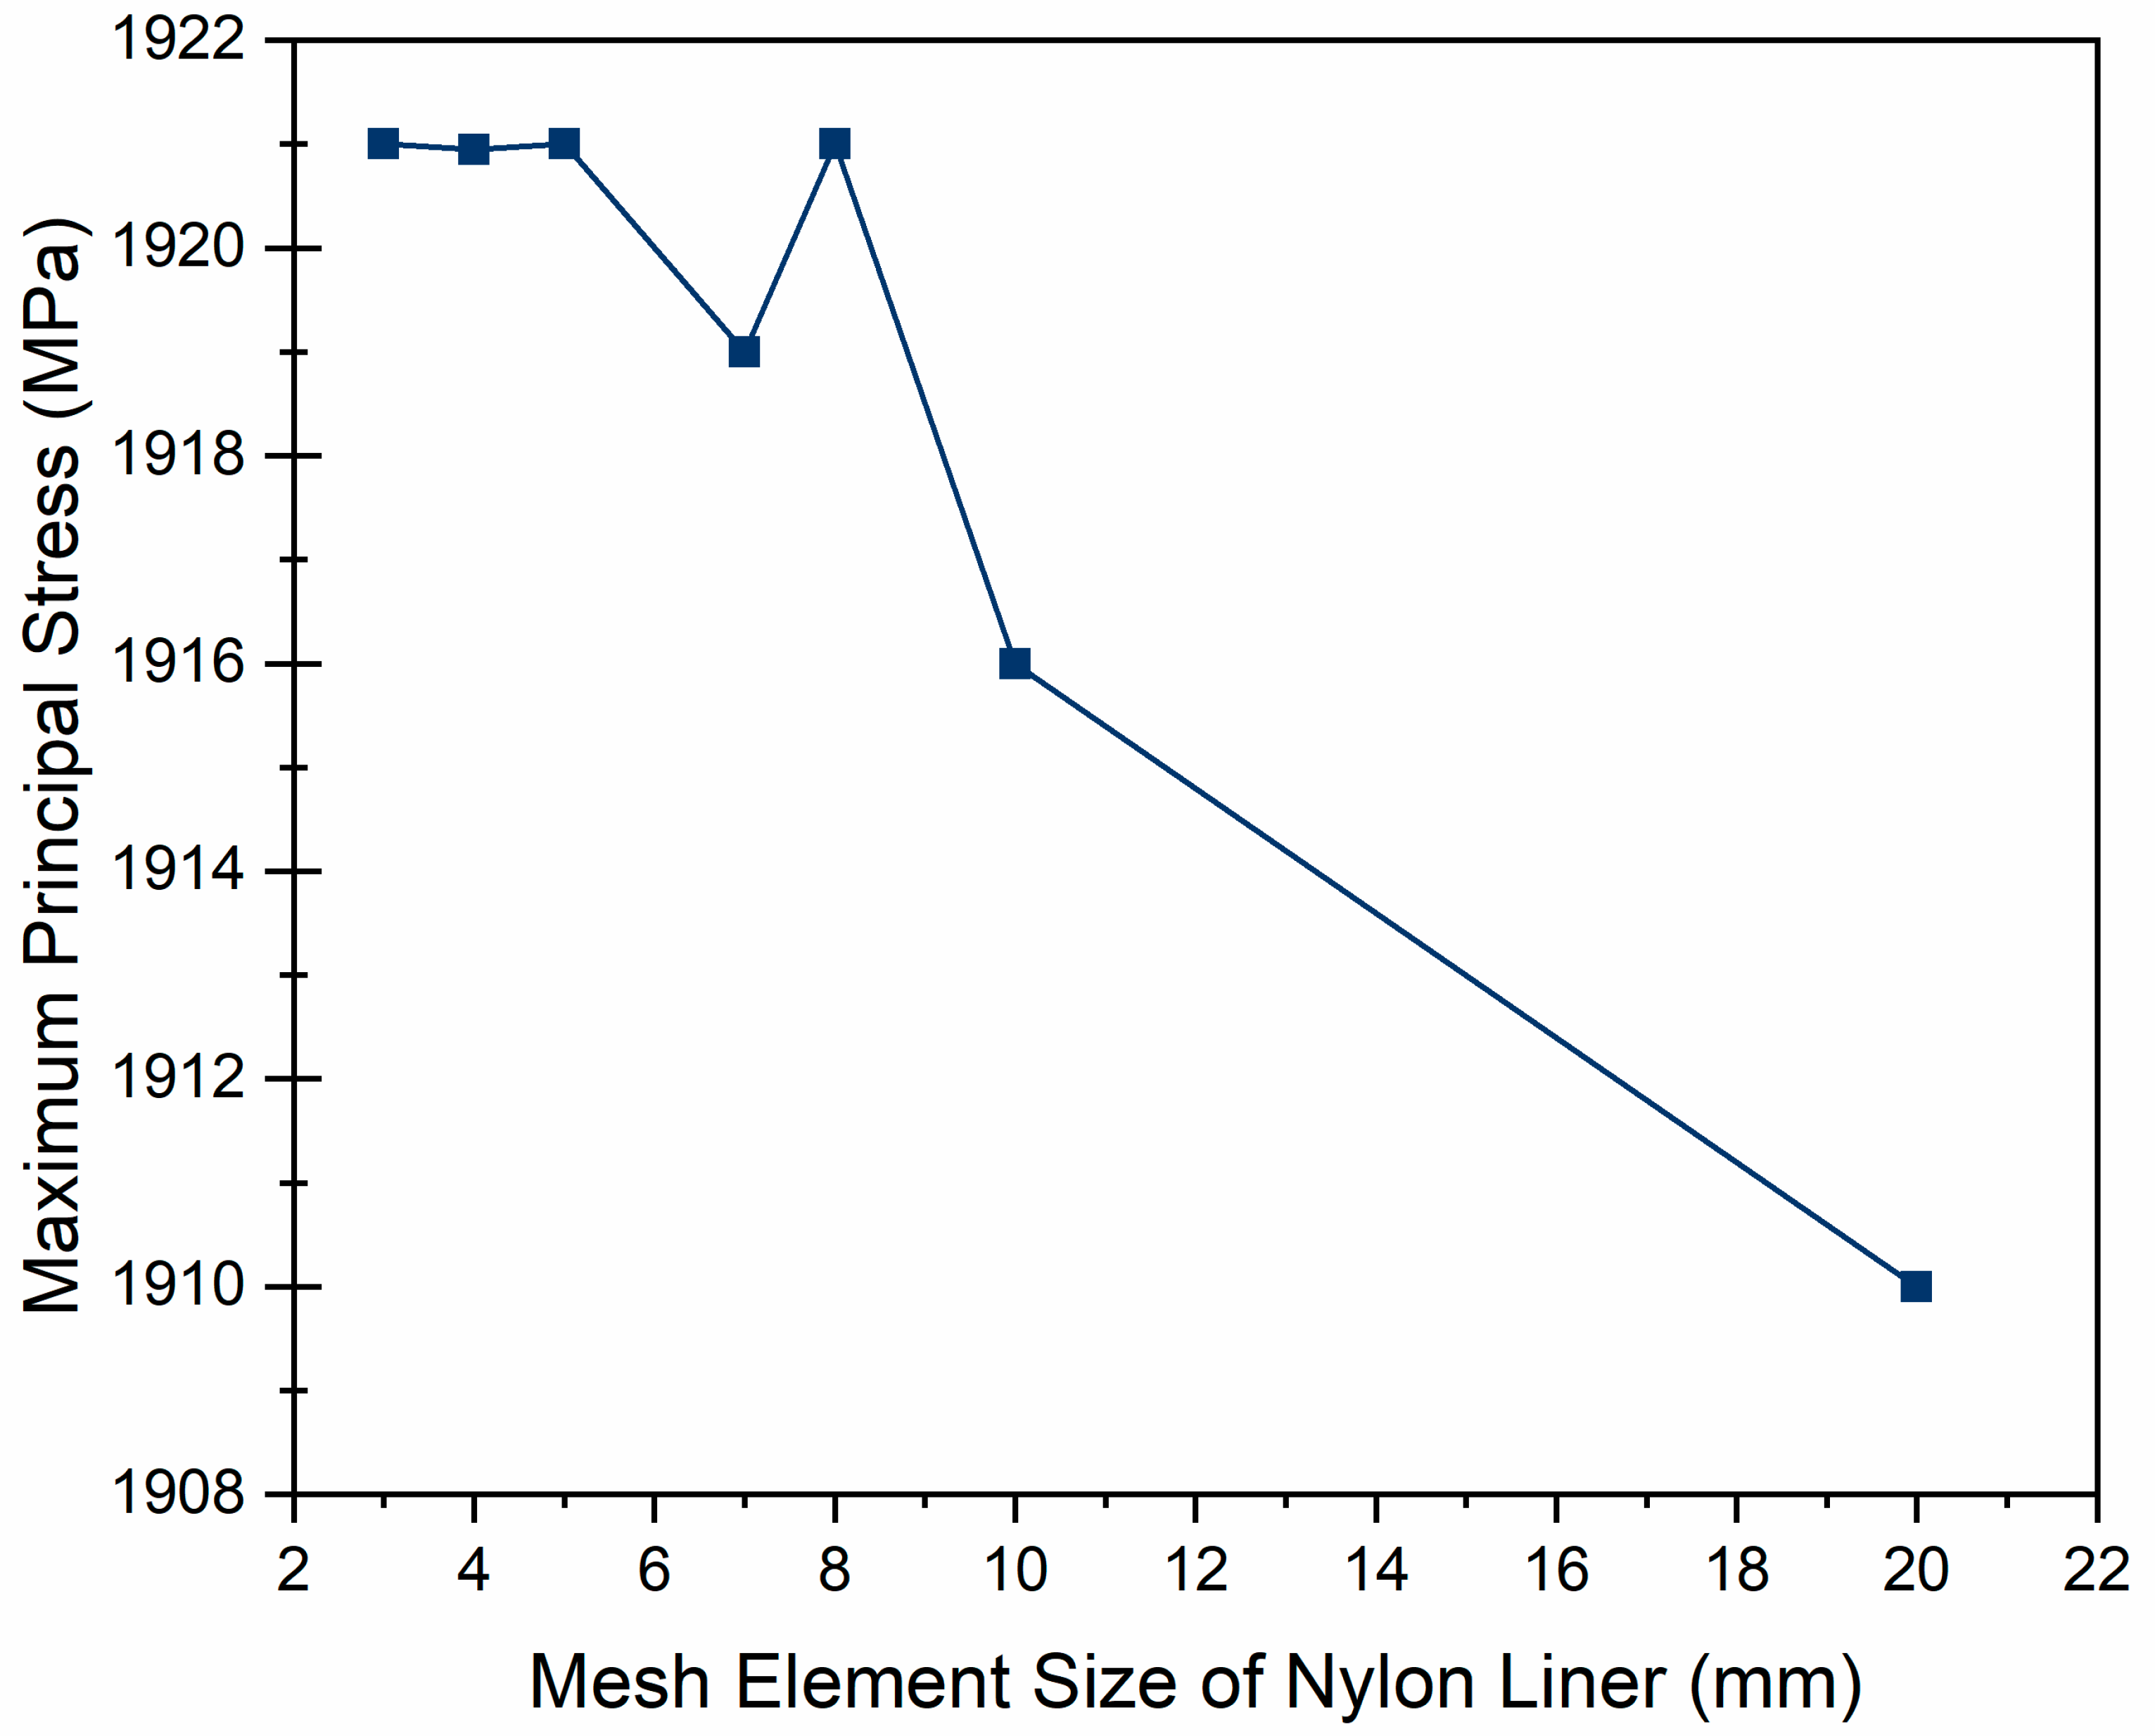
To ensure the accuracy of the FEM results, the influence of the mesh element size of the Nylon 6 liner on the convergence of the maximum principal stress values was further investigated. This study was conducted under the conditions of a 70 MPa internal pressure and atmospheric pressure, using a 15 mm mesh element size for the composite part modeled with the solid method.
As illustrated in Figure 16, the maximum principal stress values showed good convergence when the Nylon 6 liner mesh element size ranged between 3 mm and 5 mm. However, larger mesh sizes led to significant fluctuations and discrepancies in the maximum principal stress values. This result aligns with the mesh quality study, where the skewness and orthogonal quality metrics indicate that smaller mesh sizes yielded more stable and accurate results.

Solid and Shell Modeling Methods for Composite Part

In Ansys ACP, composite parts can be modeled using either solid or shell composite modeling methods. The solid modeling method treats the composite part as a 3D solid model, where multiple material layers are stacked within the solid volume. In contrast, the shell modeling method simplifies the composite part into a 2D shell model with assigned laminate properties, which results in faster computational times.
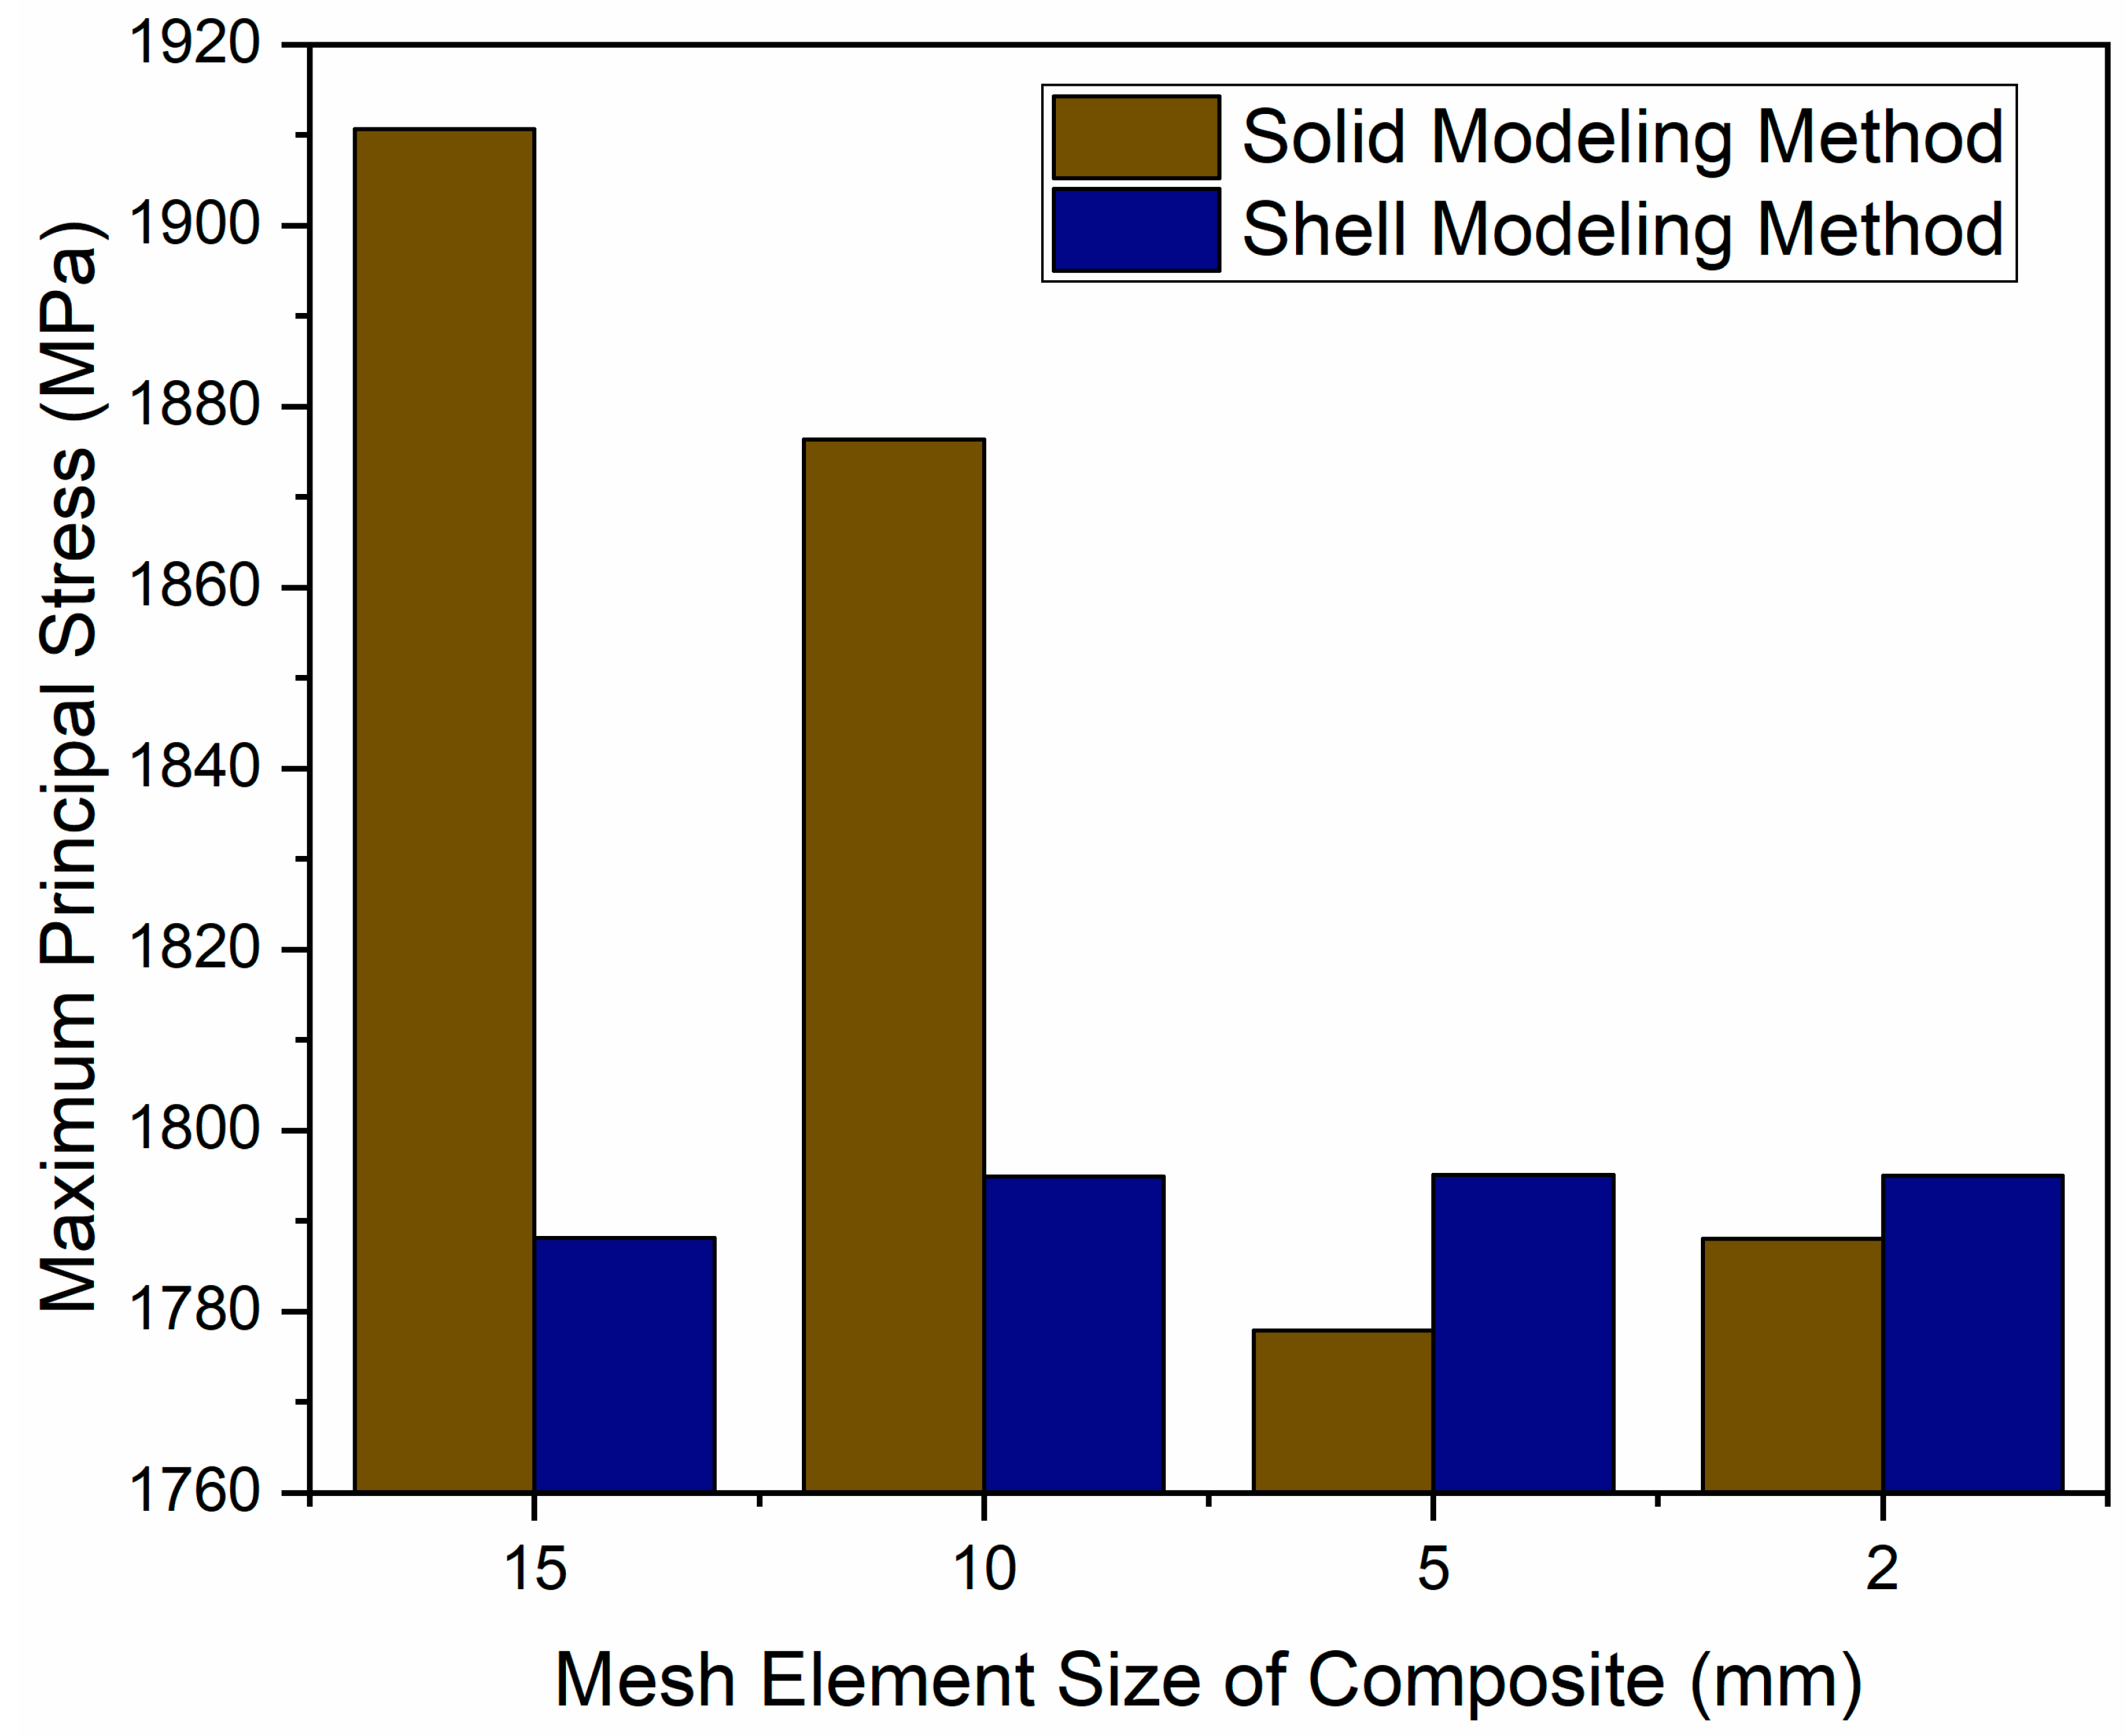
The influences of both modeling methods on the accuracy and convergence of the maximum principal stress for the Type 4 CPVs, which consisted of 26 composite layers, was studied under the conditions of a 70 MPa internal pressure and atmospheric pressure. This study was conducted with different composite mesh element sizes, while a 5 mm mesh element size was used for the Nylon 6 liner. The results of this study are presented in Figure 17.
As shown, the solid composite modeling method revealed significant fluctuations and discrepancies in the value of the maximum principal stress when varying the composite mesh element size from 2 to 15 mm. In contrast, the shell composite modeling method produced more stable results, demonstrating high convergence within the studied range of the mesh element sizes. Moreover, at a very small composite mesh element size of 2 mm, the solid modeling method began to yield accurate and stable results that were comparable with those obtained using the shell composite modeling method across the studied range.
Therefore, the shell composite modeling method was more efficient at achieving high-accuracy results at larger mesh element sizes for the composite part, which reduced the calculation time by up to 50%. These findings are consistent with the results presented by G. İrsel [33].
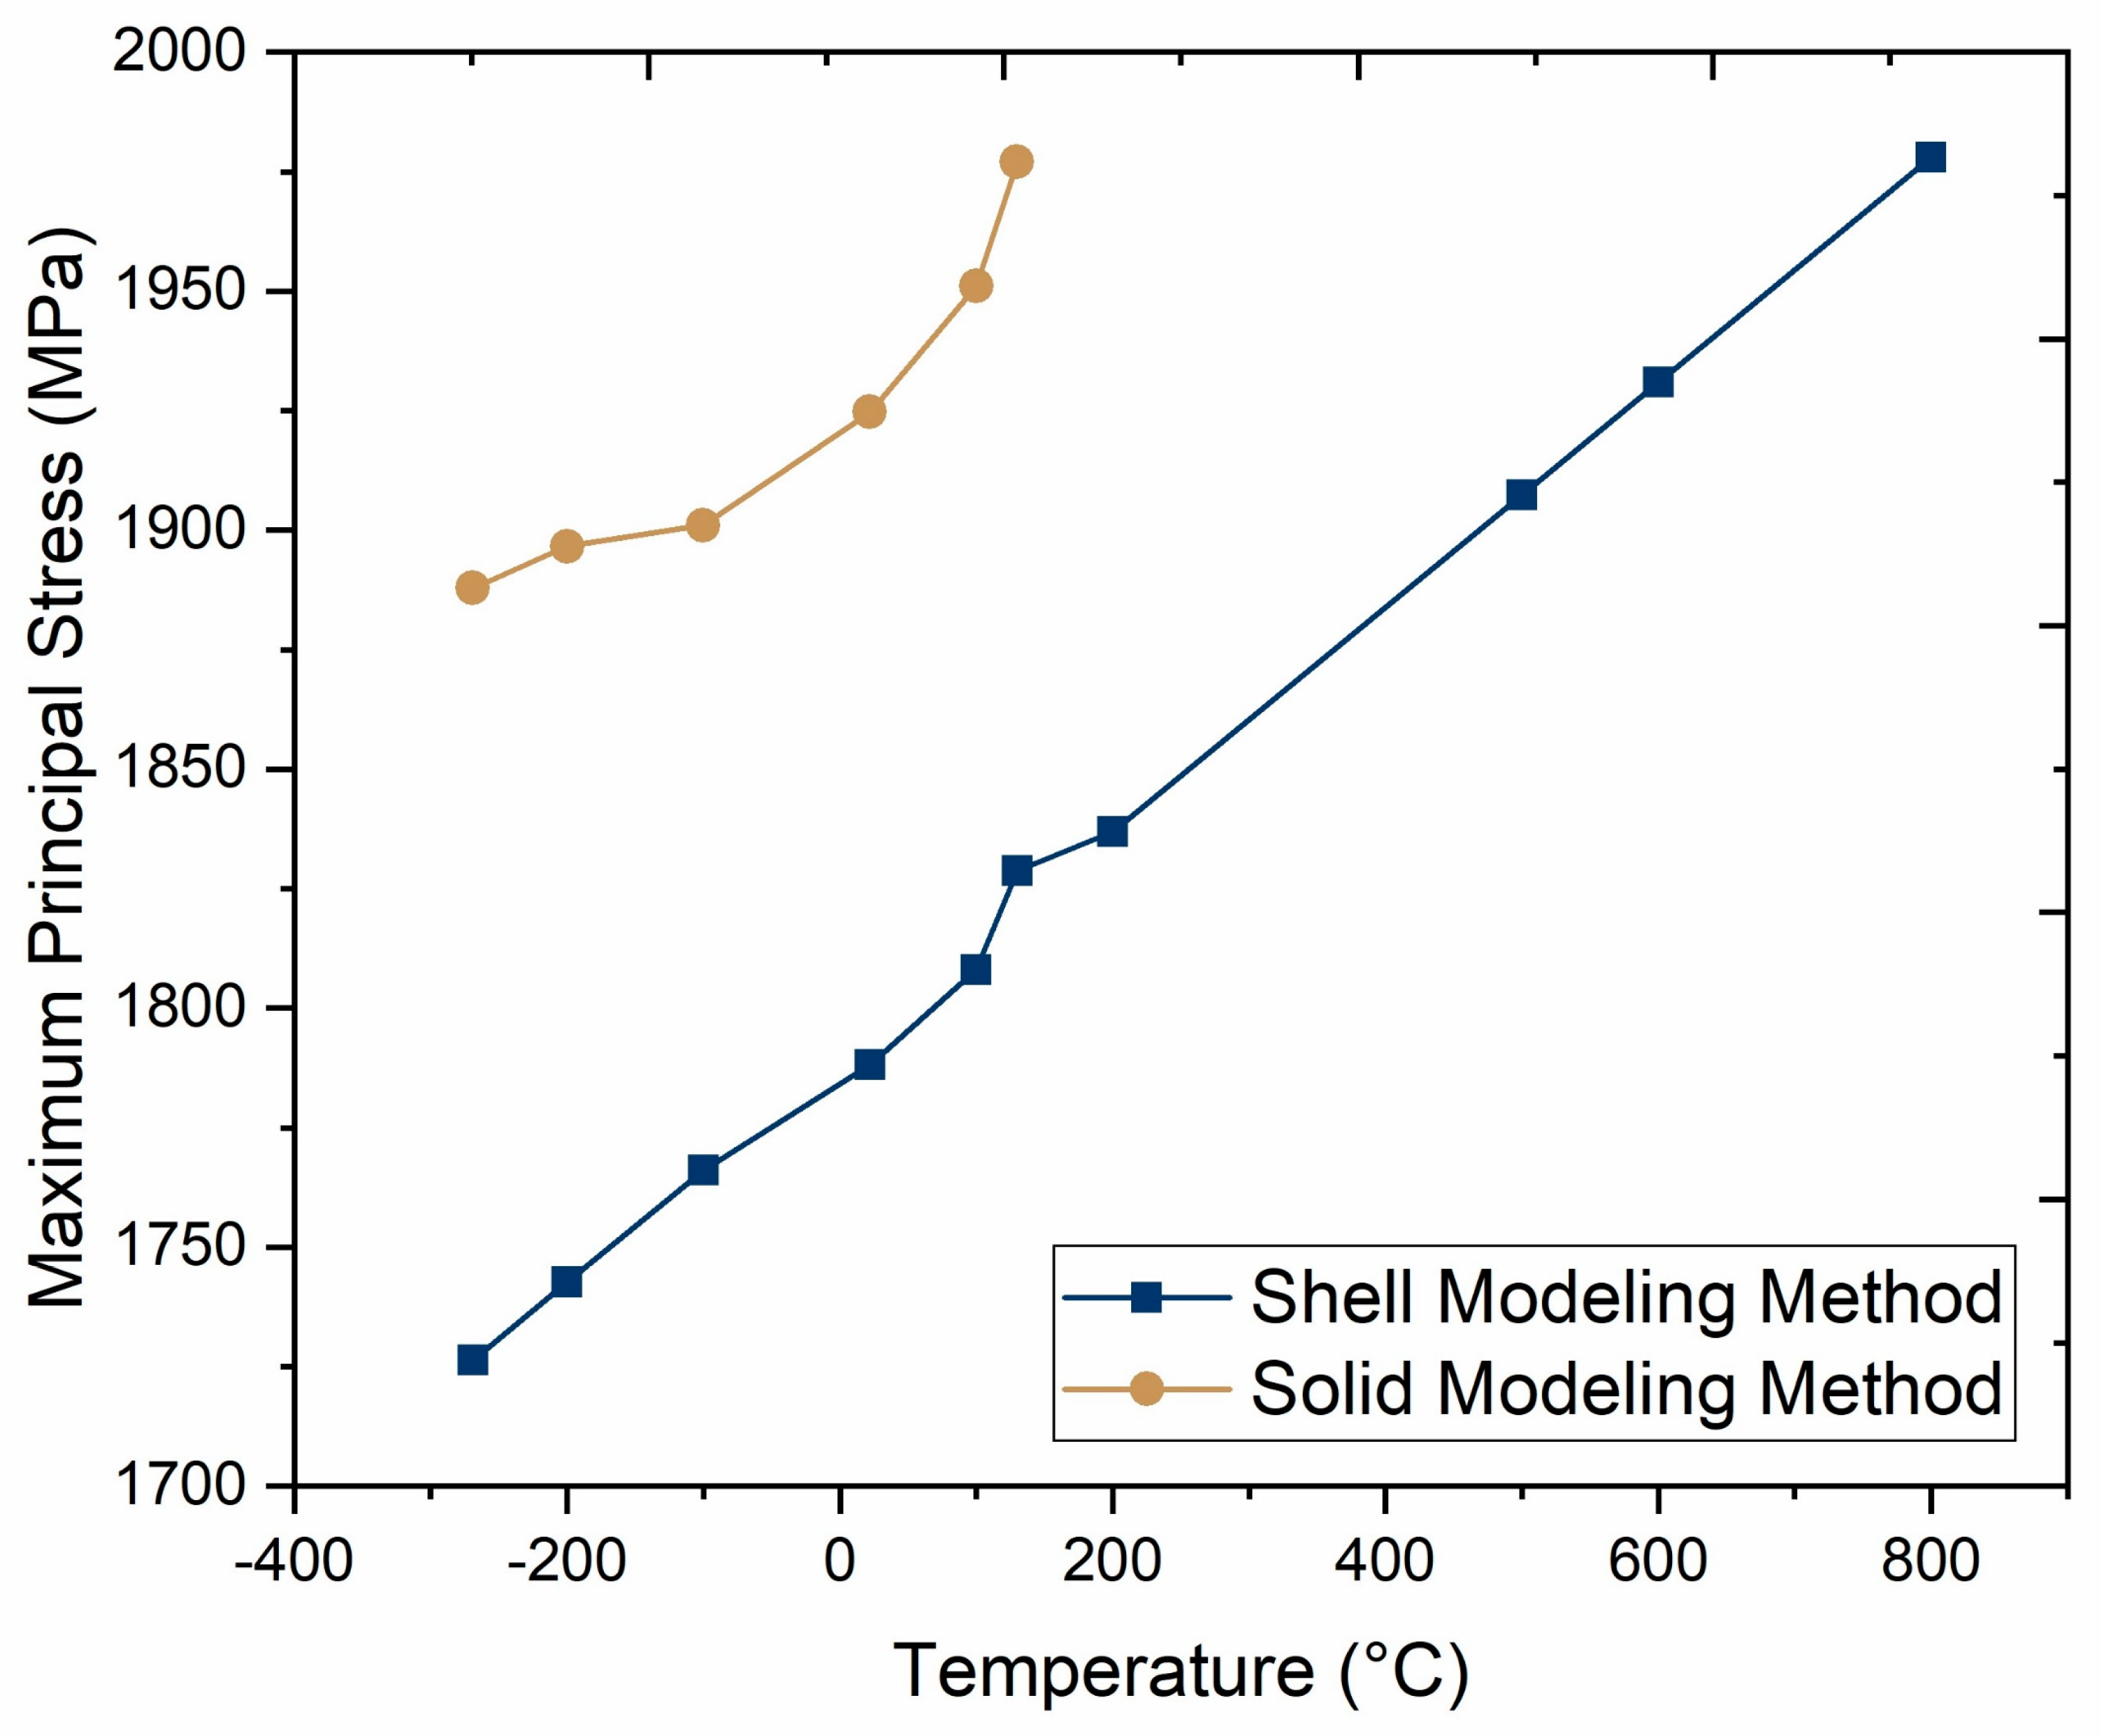
Another analysis was conducted to determine the most efficient modeling method for the composite part and to ensure the accuracy of the mechanical response obtained from the studied FEM across different temperatures. The maximum principal stress of the Type 4 CPVs at a 70 MPa internal pressure and atmospheric pressure over a temperature range was analyzed using both solid and shell composite modeling methods (Figure 18). This study was performed with a composite mesh element size of 15 mm and a 5 mm mesh element size for the Nylon 6 liner. The temperature range spanned from −269 °C to 800 °C, with 800 °C being the temperature at which the maximum principal stress reached the ultimate tensile stress (UTS) of the CFRE unidirectional prepreg composite material (1979 MPa), theoretically indicating failure.
It was clearly observed that the shell composite modeling method offered a more efficient analysis compared with the solid composite modeling method. The shell composite modeling method demonstrated stable behavior across the studied temperature conditions. In contrast, the solid composite modeling method reached composite failure when the maximum principal stress attained its UTS at a much lower temperature of 130 °C, while the shell composite modeling method only reached composite failure at a much higher temperature of 800 °C.
These results reveal the stable and efficient analysis resulted from employing the shell modeling method for composite parts, which enables studying the mechanical behavior of the composite material over a wide range of service conditions.

3.3.2. Failure Detection Under Extreme Conditions for Type 4 CPVs

To study the potential failure of the Type 4 CPVs, such as plastic deformation of the liner or delamination of the composite layers, under extreme space conditions, an accurate numerical analysis was essential. Employing the optimal mesh element sizes of 5 mm for the Nylon 6 liner and 15 mm for composite layers, according to the undertaken mesh quality study, and utilizing the shell composite modeling method, the failure detection study was carried out. The studied extreme space conditions included the influence of an external absolute vacuum and a temperature change from cryogenic to high temperatures on the mechanical performances of both the Nylon 6 liner and the composite shell of the Type 4 CPVs.
The maximum principal stress criterion is a straightforward approach for predicting material failure. It assumes that failure occurs when the maximum principal stress reaches the ultimate tensile strength (UTS) of the material.
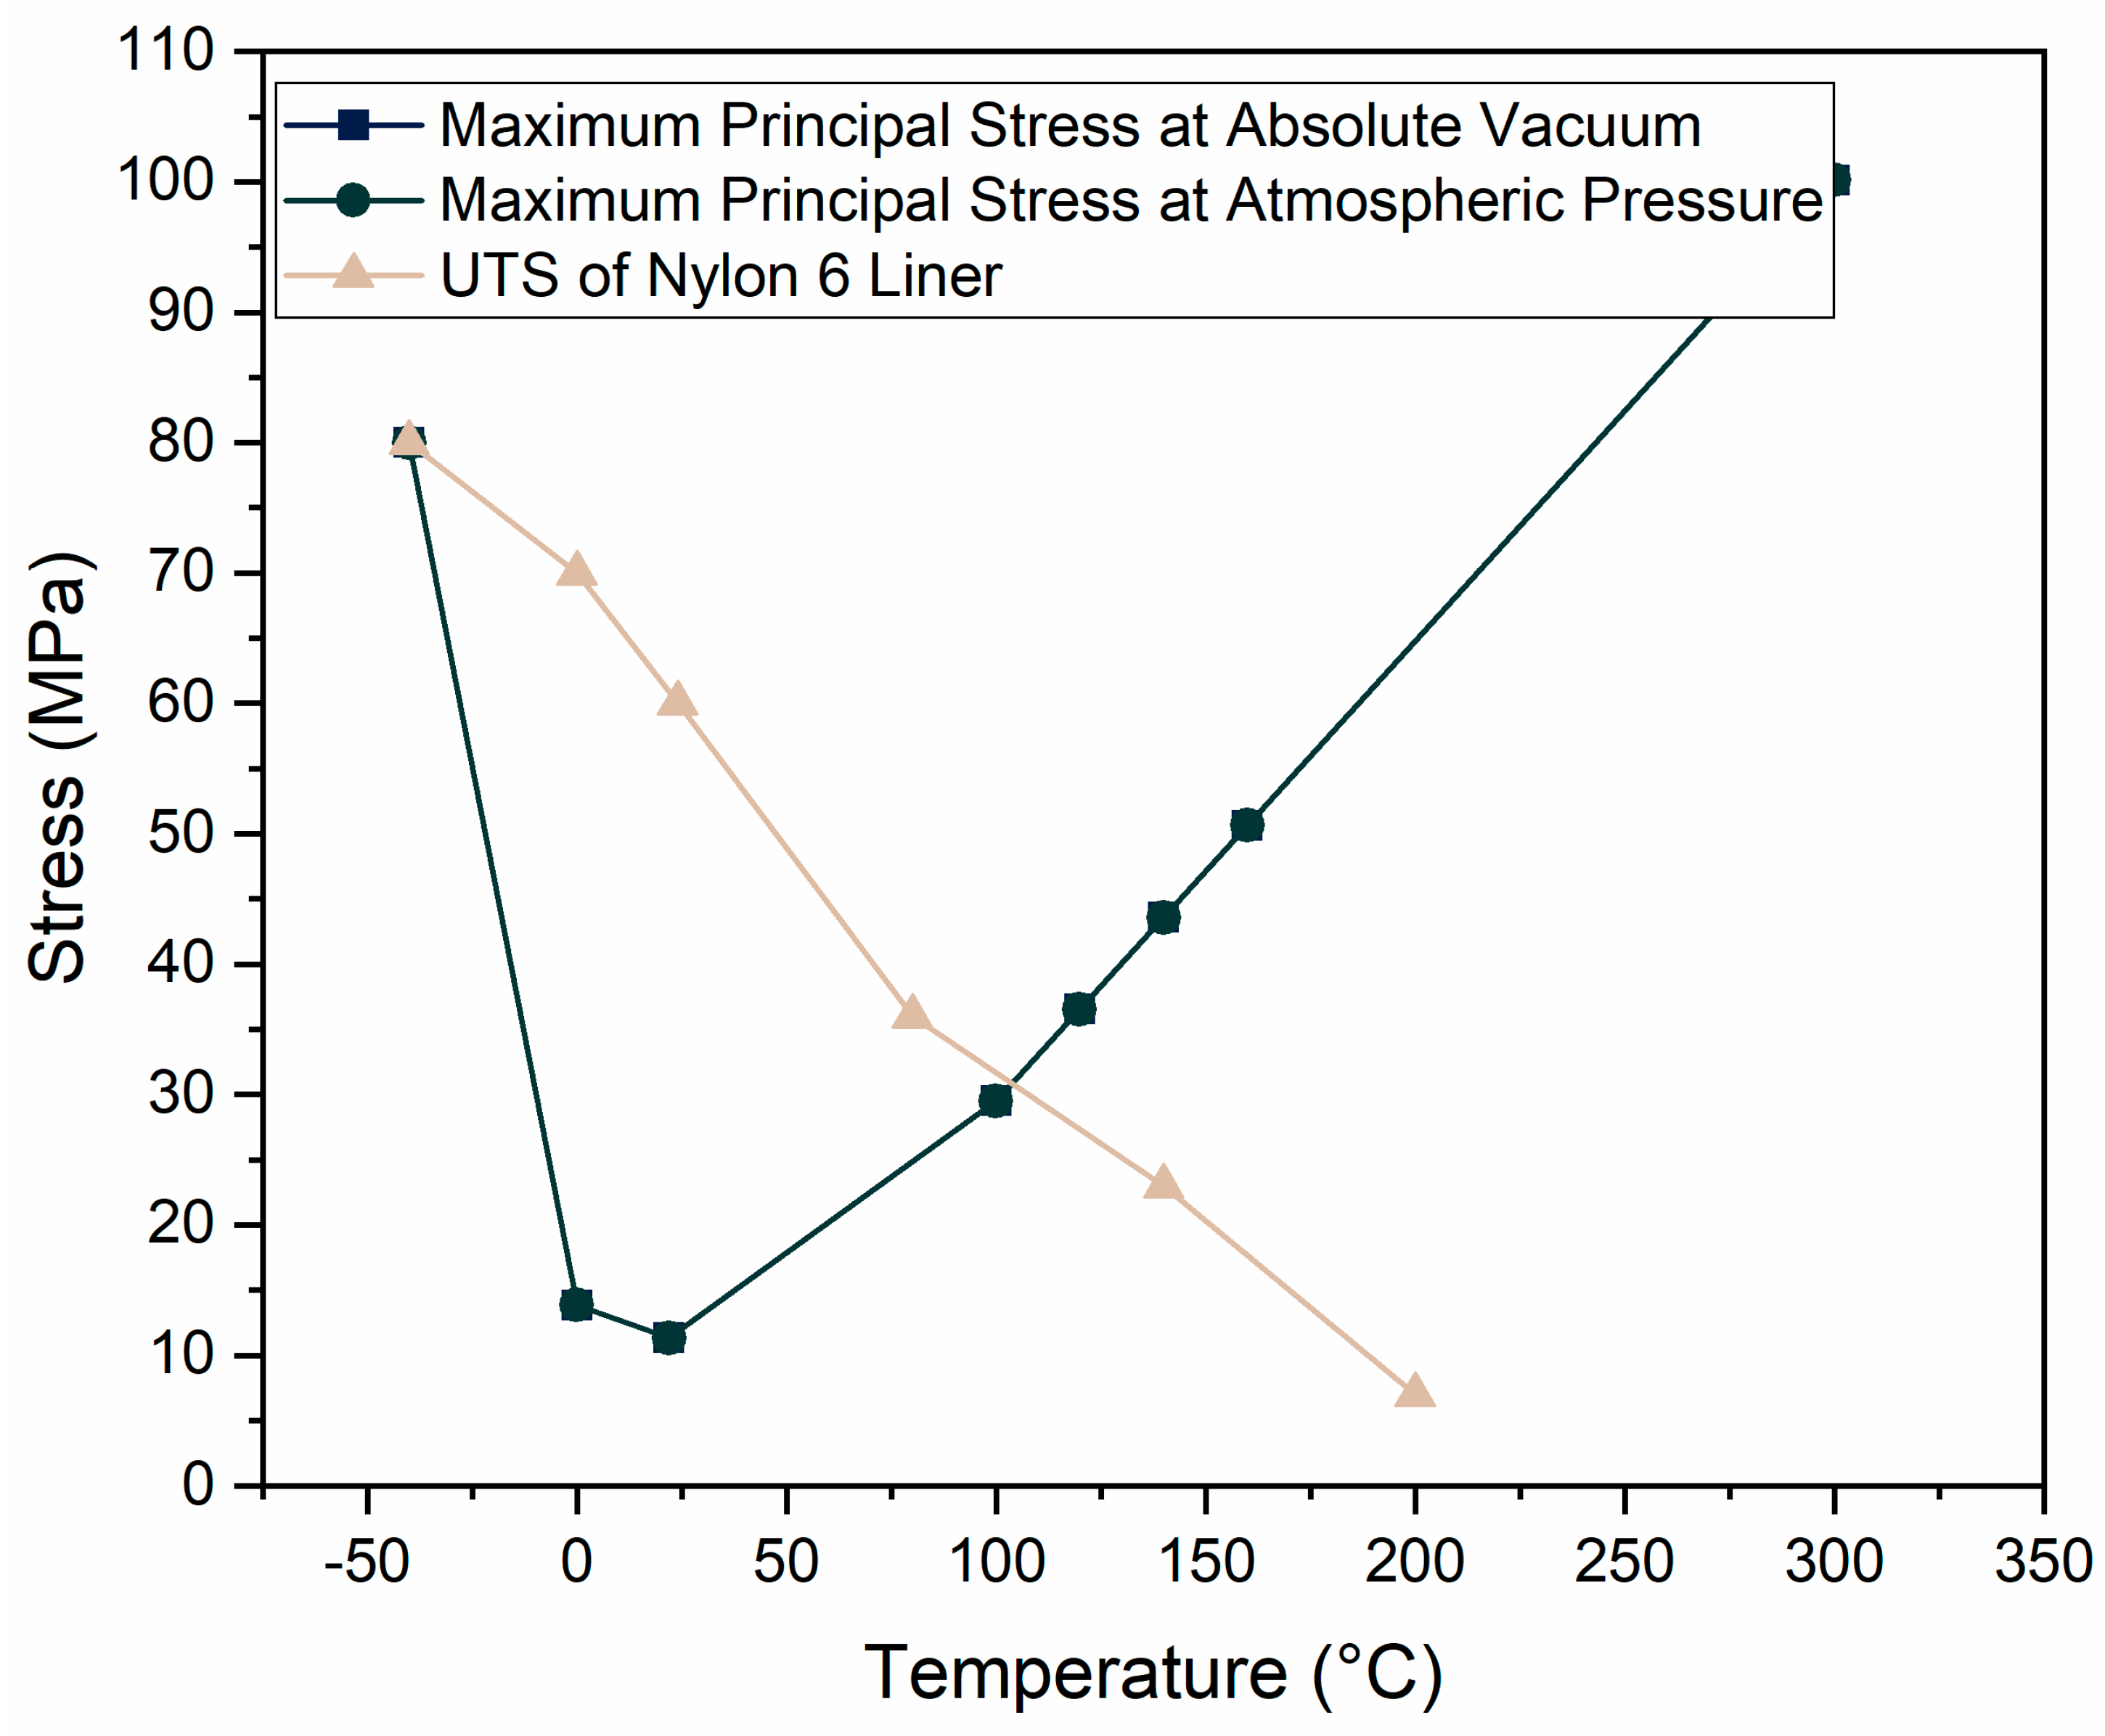
Figure 19 shows the behavior of the maximum principal stress of the Nylon 6 liner of the Type 4 CPVs at a 55 MPa internal pressure over a range of temperatures (−40 to 300 °C) at both atmospheric and absolute vacuum pressures compared with its UTS [34]. The results indicate that the Nylon 6 liner safely operated within the temperature range of −40 to 100 °C, as its maximum principal stress remained below its UTS in this temperature range.
Failure theories, like maximum principal stress theory, are used to analyze structures in order to ascertain the material’s durability under the given loading circumstances. Although the maximum principal stress theory method can provide a basic understanding of failure, it has limitations when applied to composite materials, especially pressure vessels. Composite materials have different mechanical properties in different directions. The maximum principal stress criterion does not fully account for this anisotropy, leading to potential inaccuracies. Composite materials can fail through various mechanisms, such as fiber fracture, matrix cracking, or delamination.
The number of layers, the strength of the layer-to-layer bond, and the fiber orientations of the composite material with respect to the applied load are some of the possible factors that must be taken into consideration during the composite shell’s design.
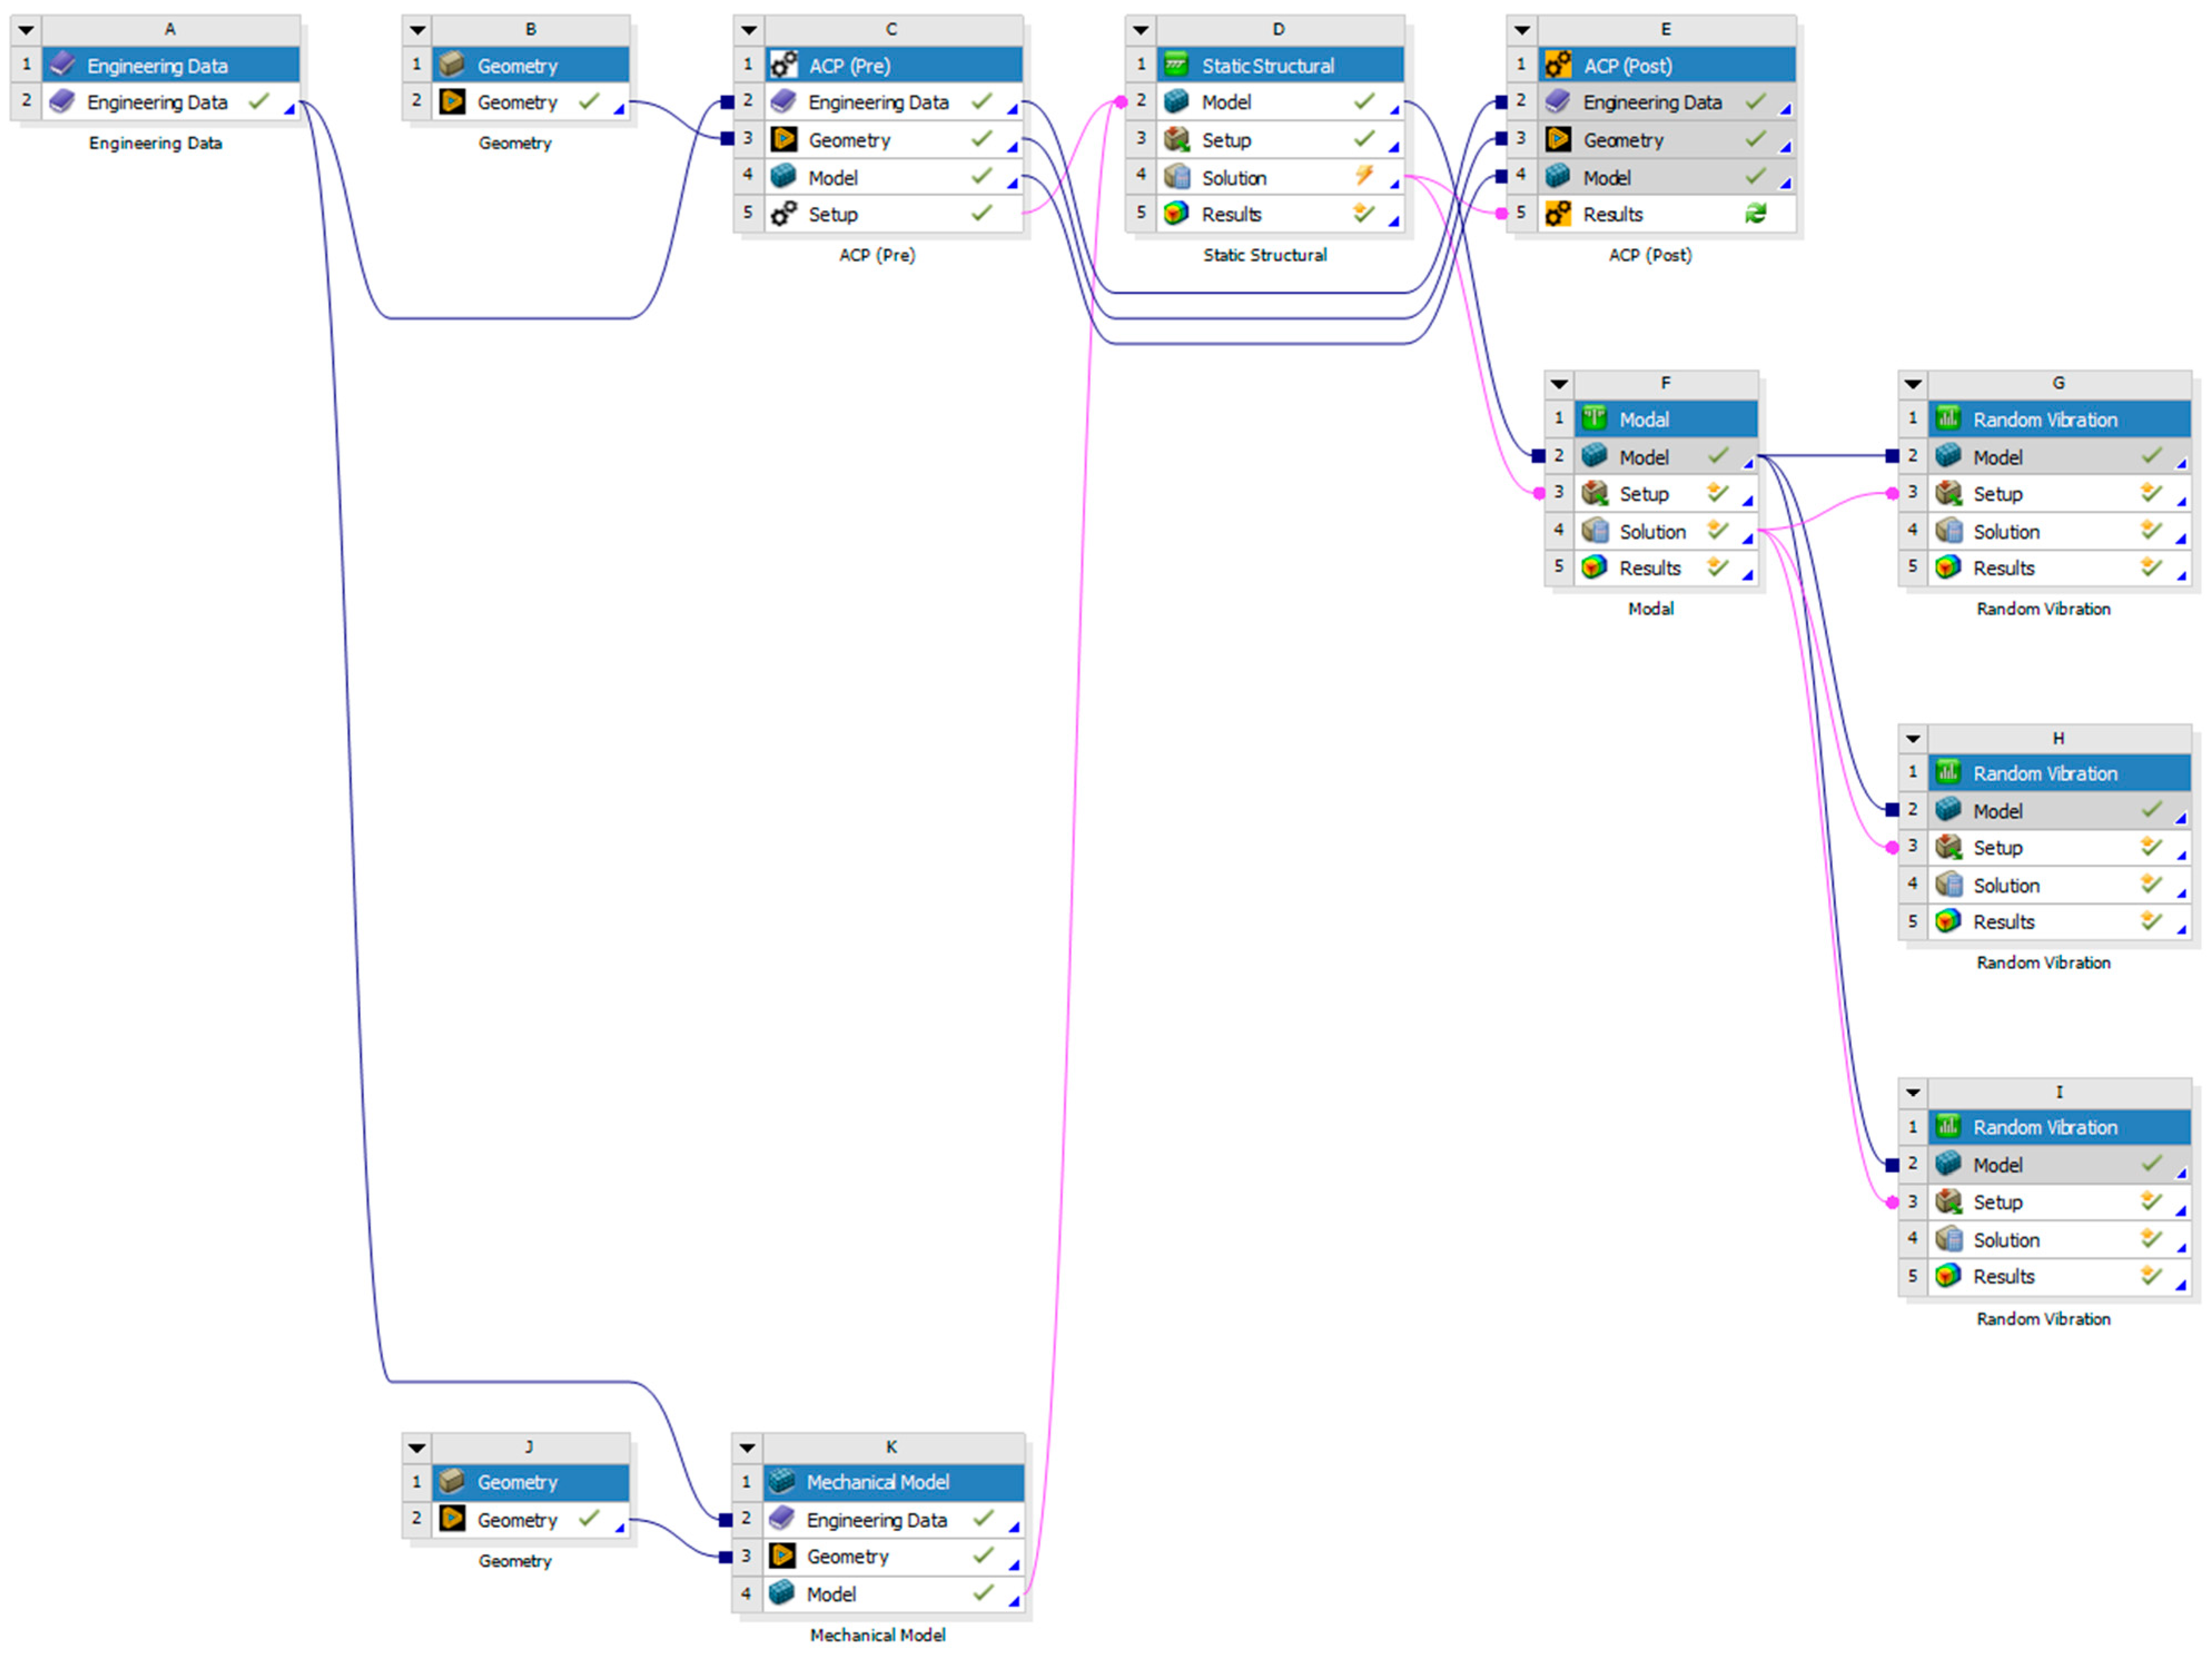
The fiber-stacking sequence and winding angles of each lamination in the composite shell were modeled using Ansys Composite Pre/Post (ACP (Pre)), while the advanced analysis findings were performed using specific failure tools in Ansys ACP (Post), an add-on module for Ansys.
The IRF is another more precise failure criterion that is frequently applied to composite materials using Ansys ACP (Post) because of its high safety limits.
The IRF represents the ratio between the maximum applied load that can be imposed on the structure and the ultimate strength the material can withstand without failure. If the IRF value is less than 1, the vessel is considered safe because the applied load is below the material’s ultimate strength. However, if the IRF value exceeds 1, the vessel is deemed unsafe, as this indicates that the applied load surpasses the material’s strength.
Although, according to maximum principal stress theory, the designed Type 4 CPVs with 26 composite layers were safe at a 70 MPa internal pressure (as shown in Figure 16, Figure 17 and Figure 18), the maximum principal stress values were lower than the ultimate tensile strength (UTS) of the carbon fiber-reinforced epoxy (CFRE) prepreg composite (1979 MPa).
However, using the IRF failure criterion showed that the 26 layers were insufficient for the applied 70 MPa pressure, as the calculated IRF values from the FEM study exceeded 1, indicating potential failure. To address this, a redesign was performed using an iterative technique, which revealed that 64 layers, with each layer measuring 0.5 mm, were the minimum number of composite layers required to achieve an IRF value less than 1.
Additionally, the internal hydrogen pressure was set to 55 MPa, which corresponded to a safety factor of 1.5 over the 35 MPa operating pressure. This was used instead of applying a safety factor of 2, as permitted by the ASME Boiler and Pressure Vessel Code [25], to avoid unnecessarily increasing the number of composite layers and overall weight while ensuring that the IRF was reduced below one.
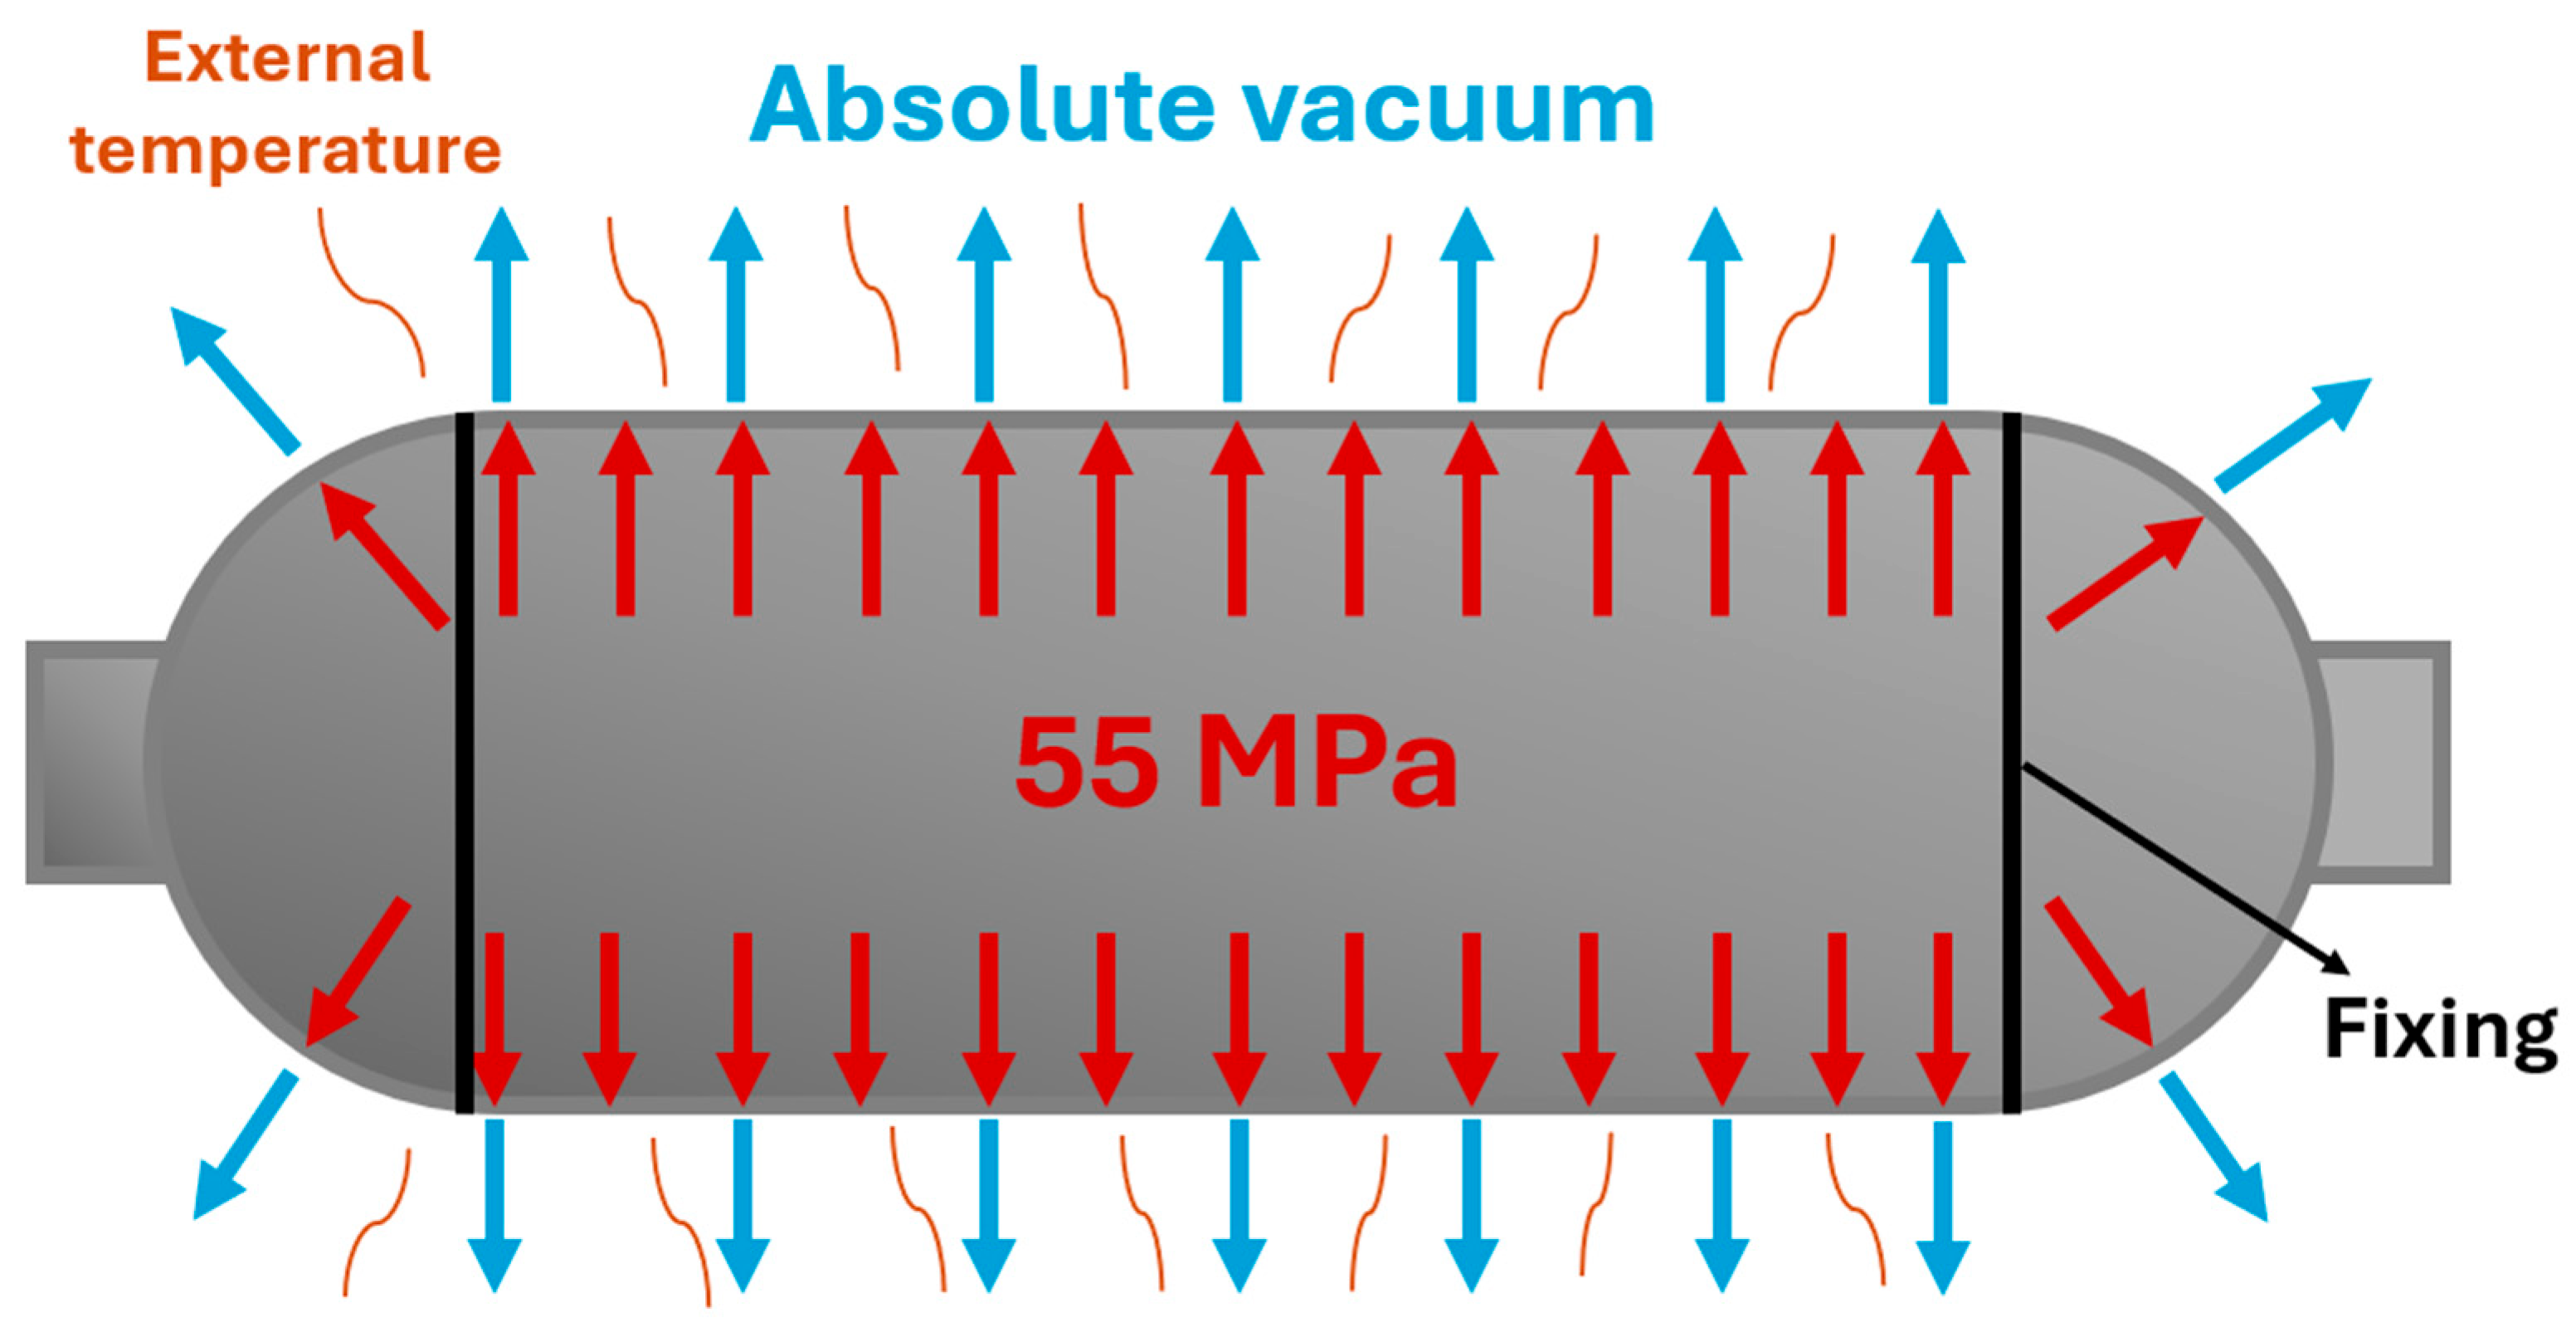
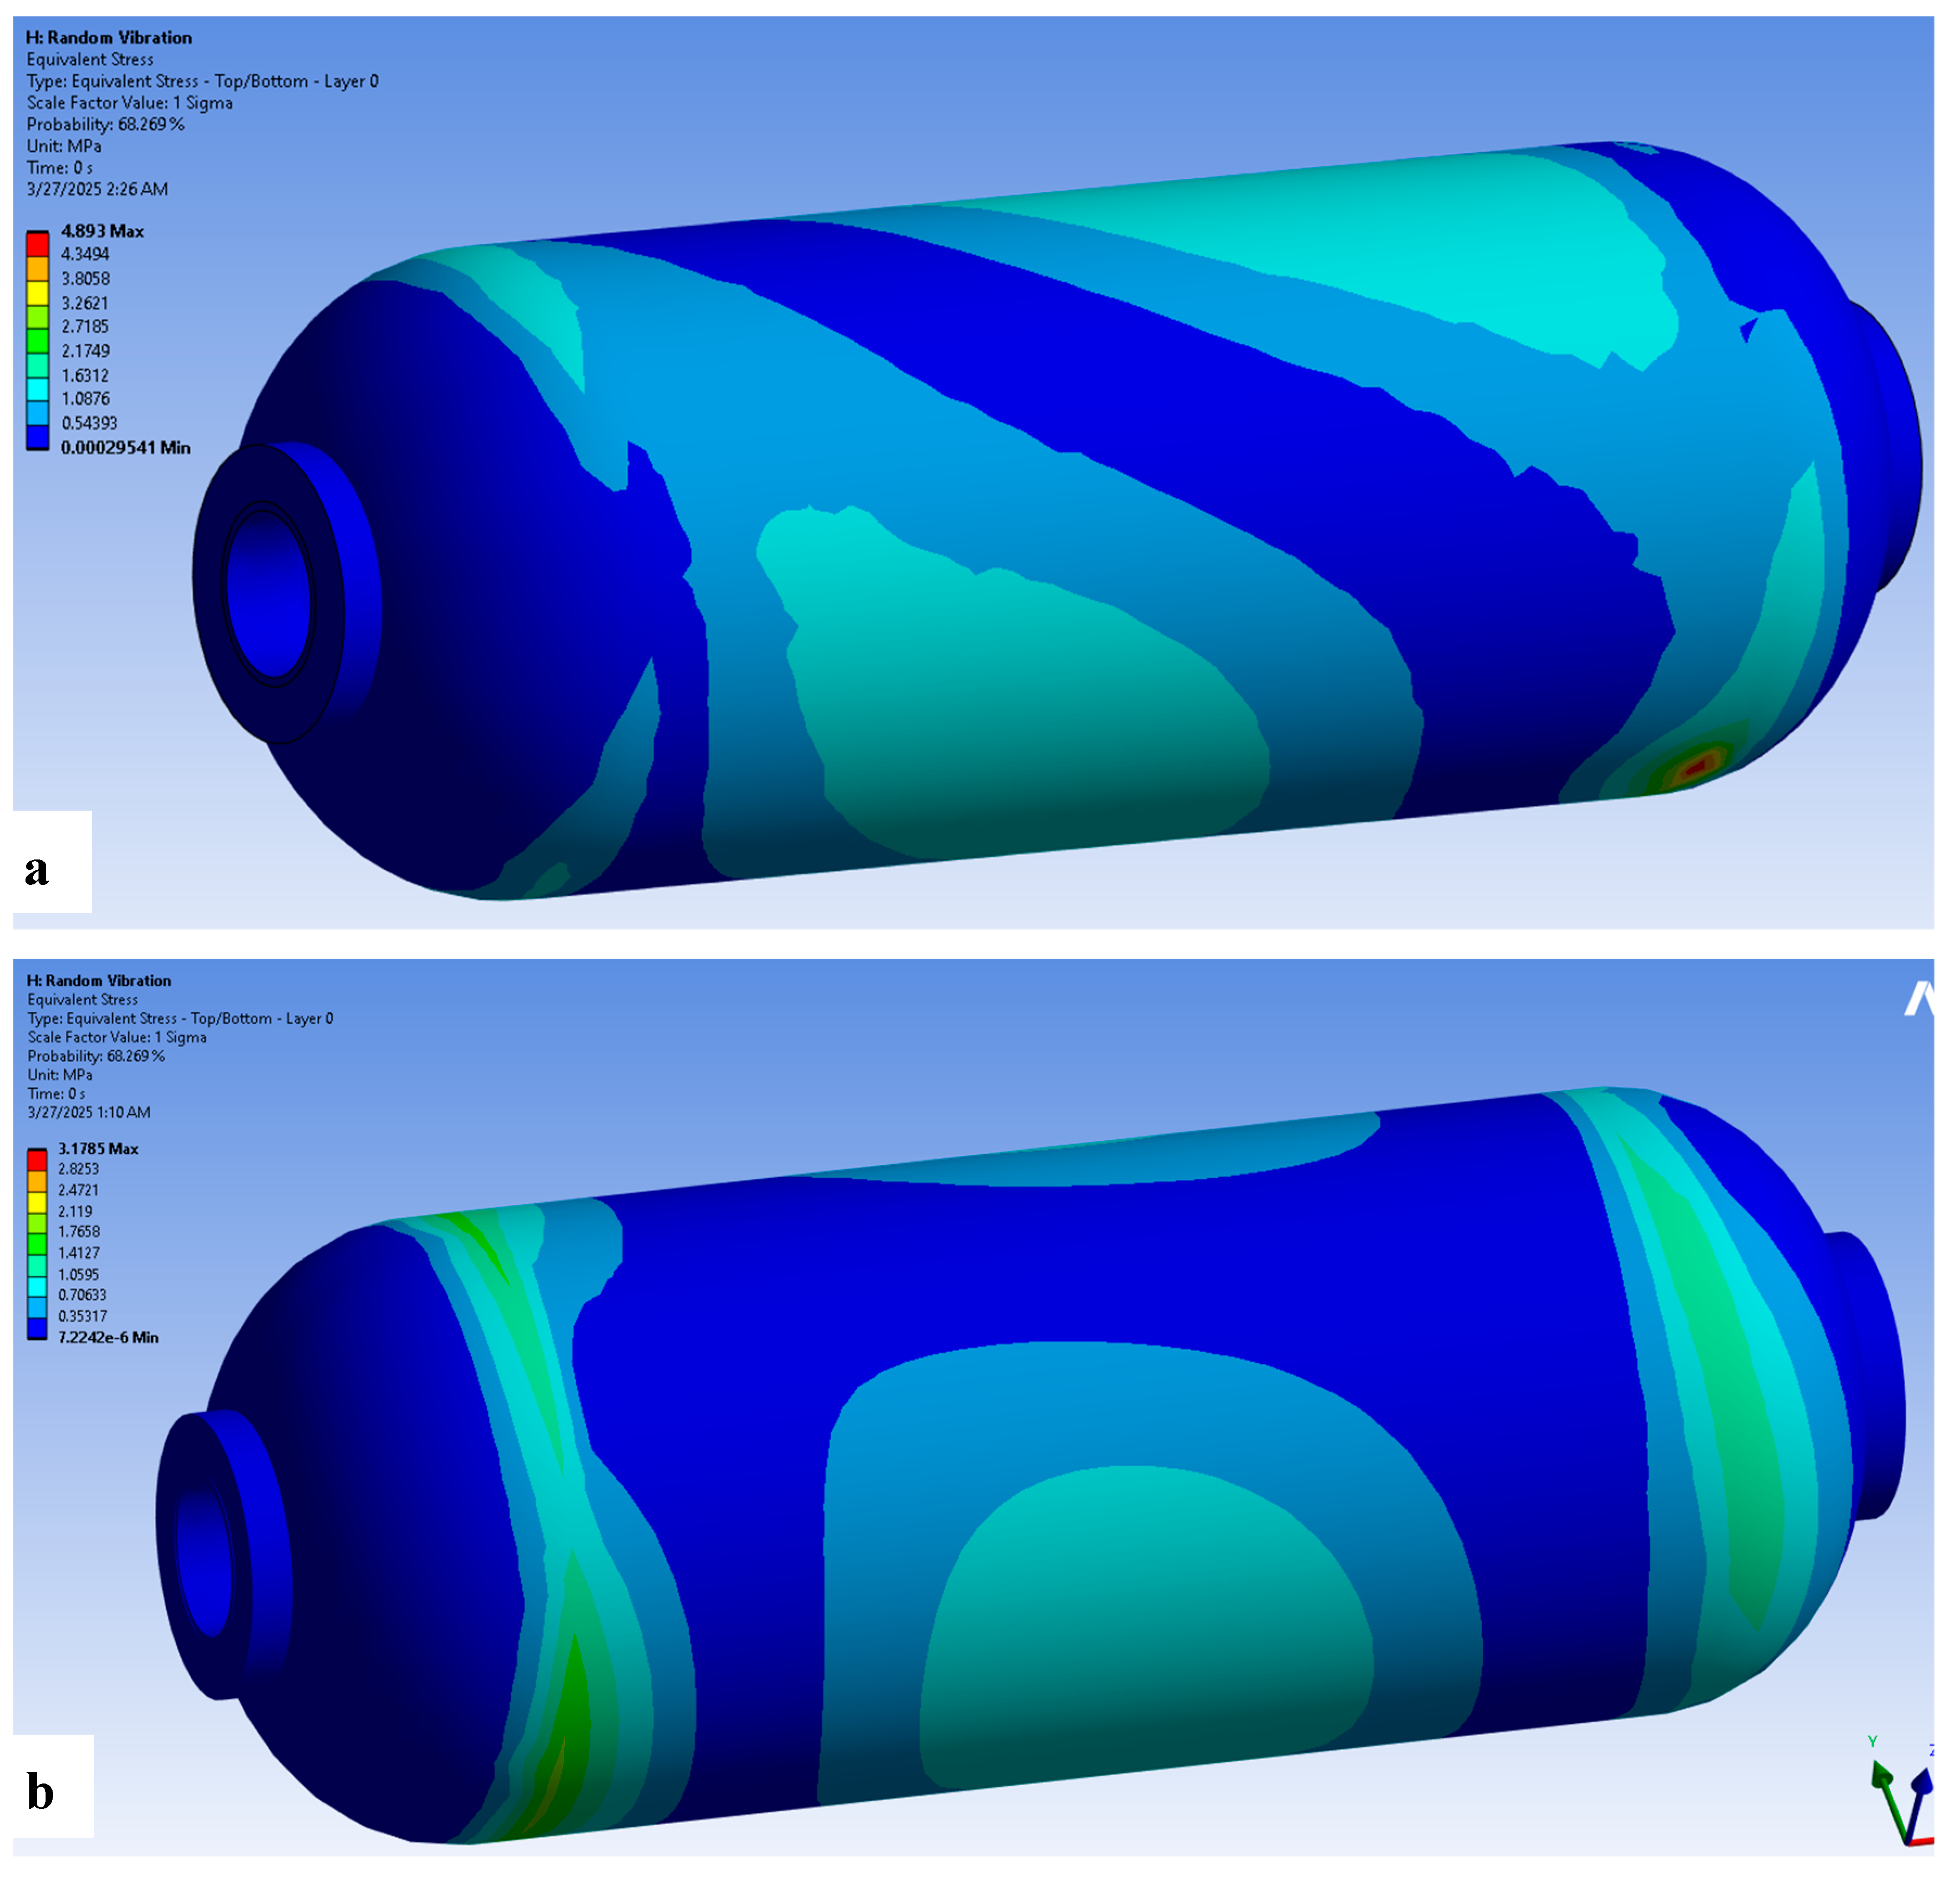
As one of the extreme conditions for space applications is the external vacuum environment, the effect of applying an external vacuum, as opposed to atmospheric pressure, was examined on both the maximum principal stress and IRF values over a temperature range from −40 °C to 300 °C.
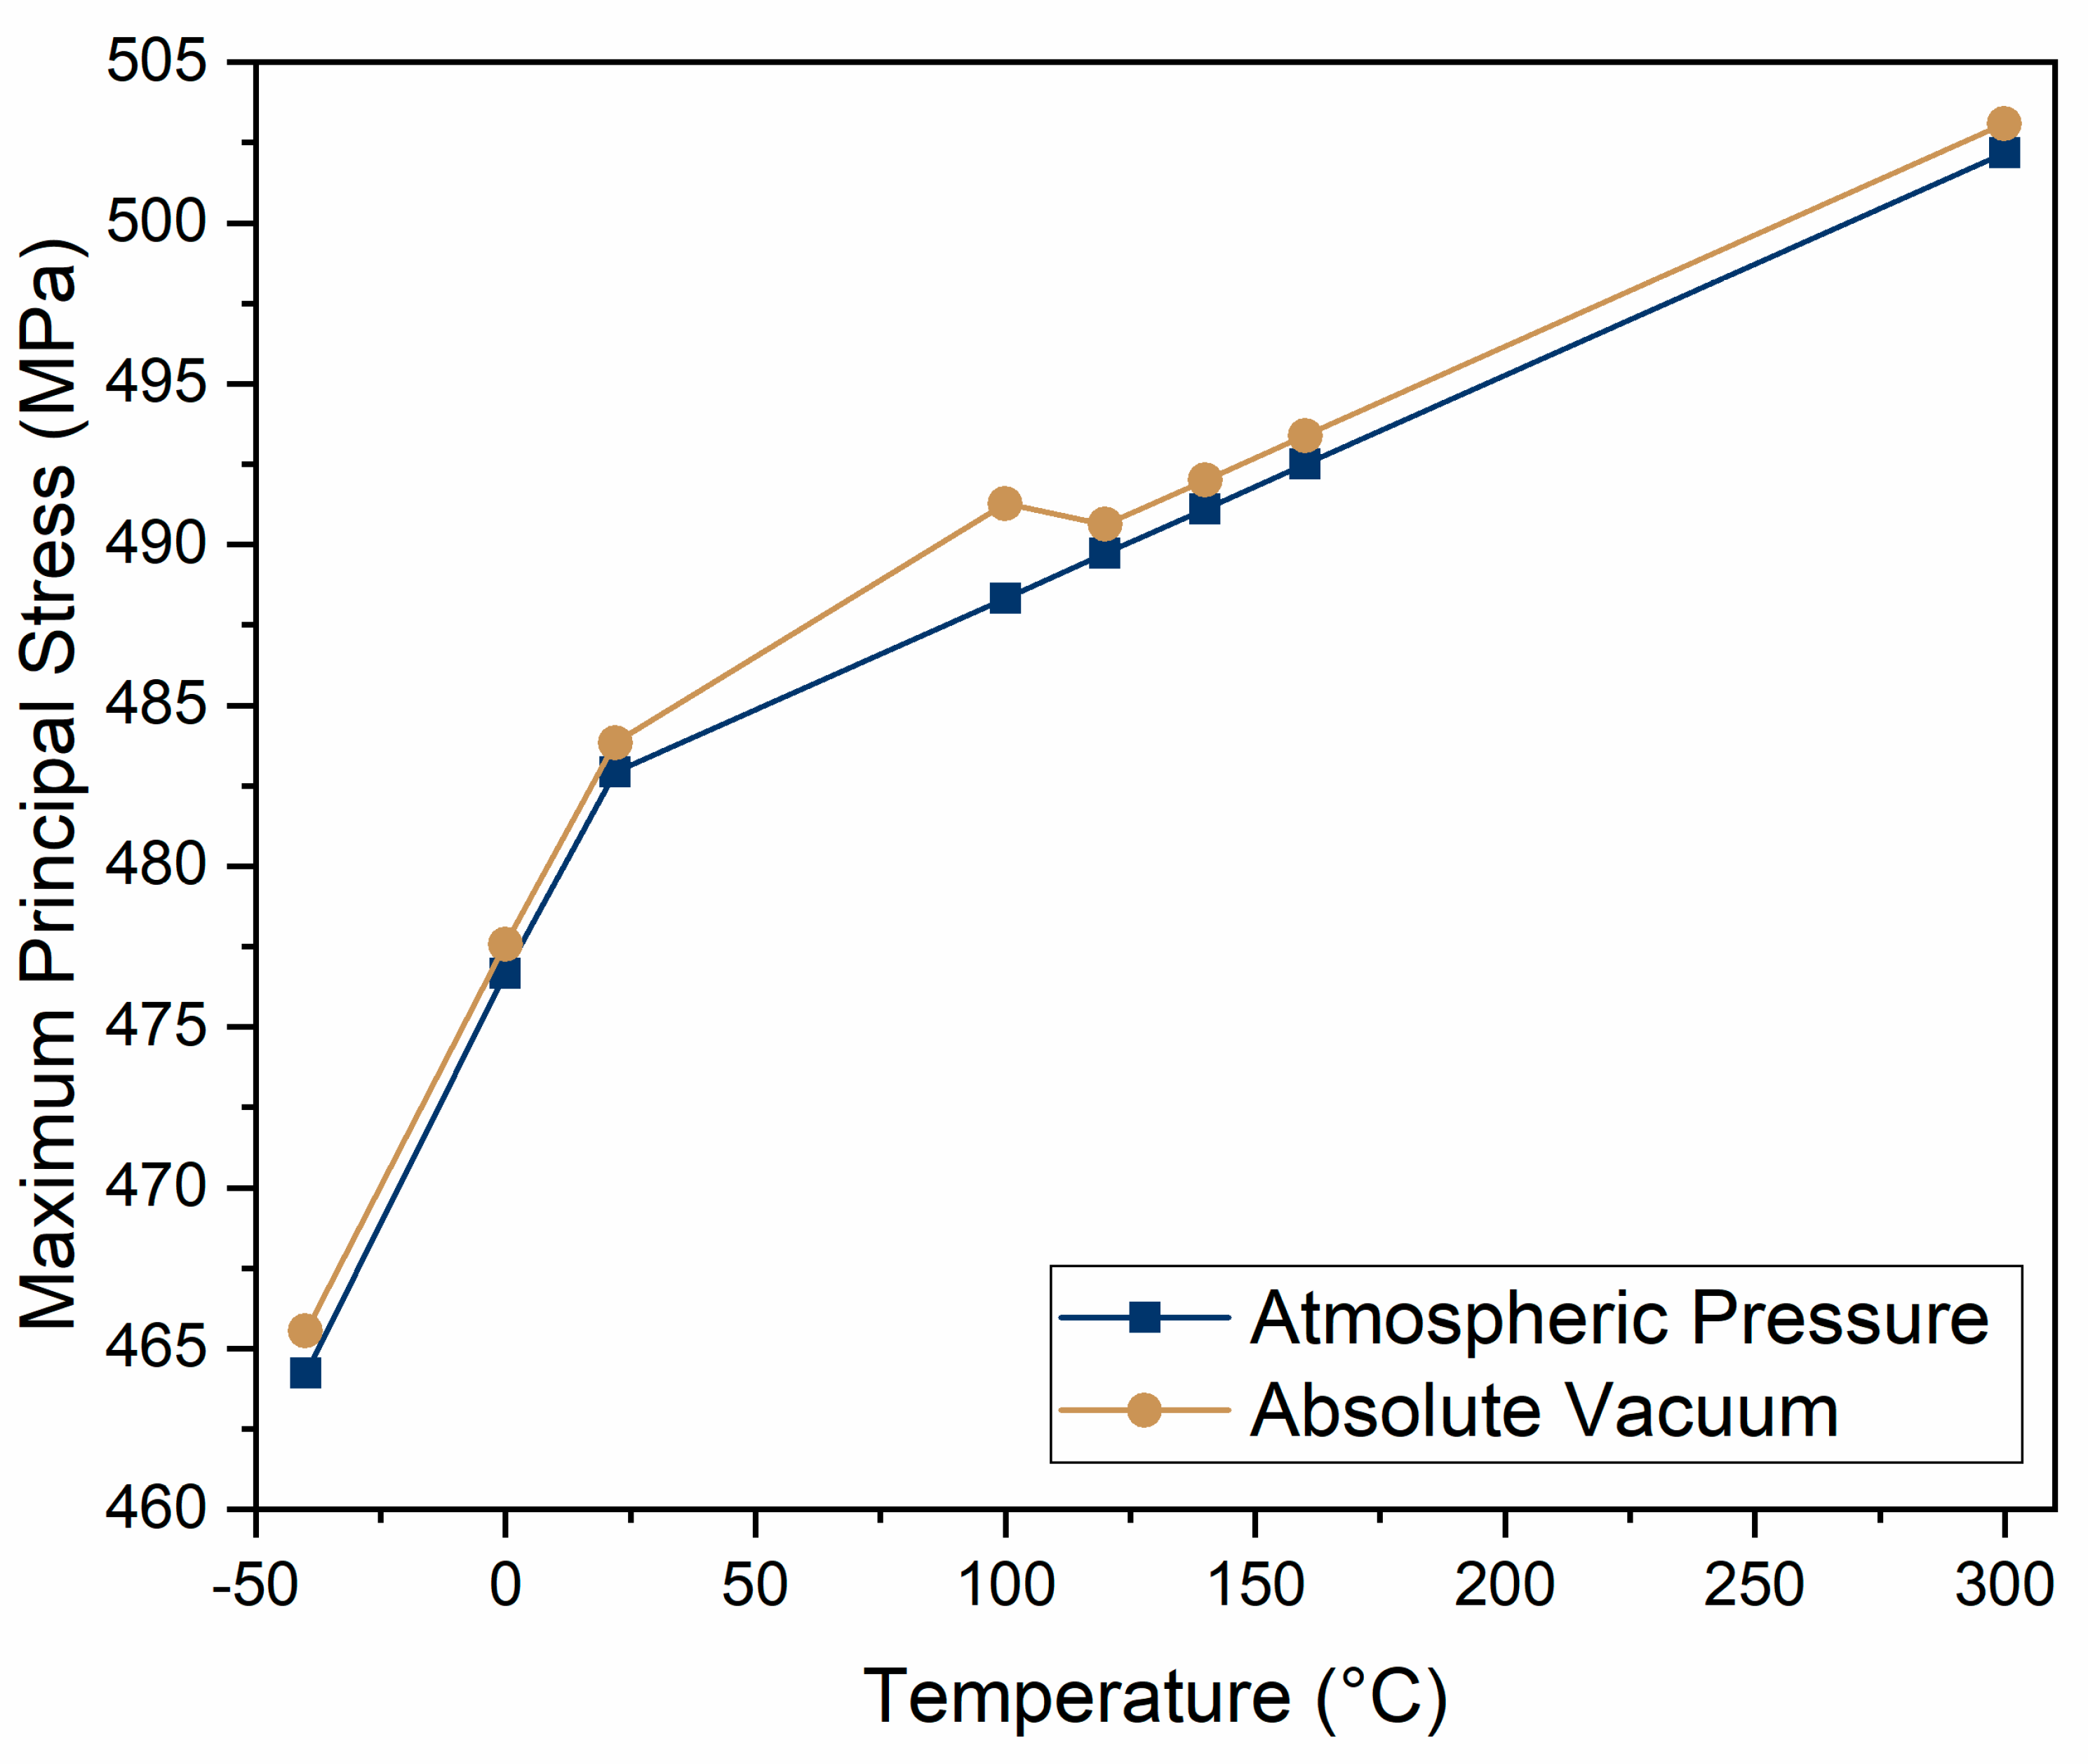
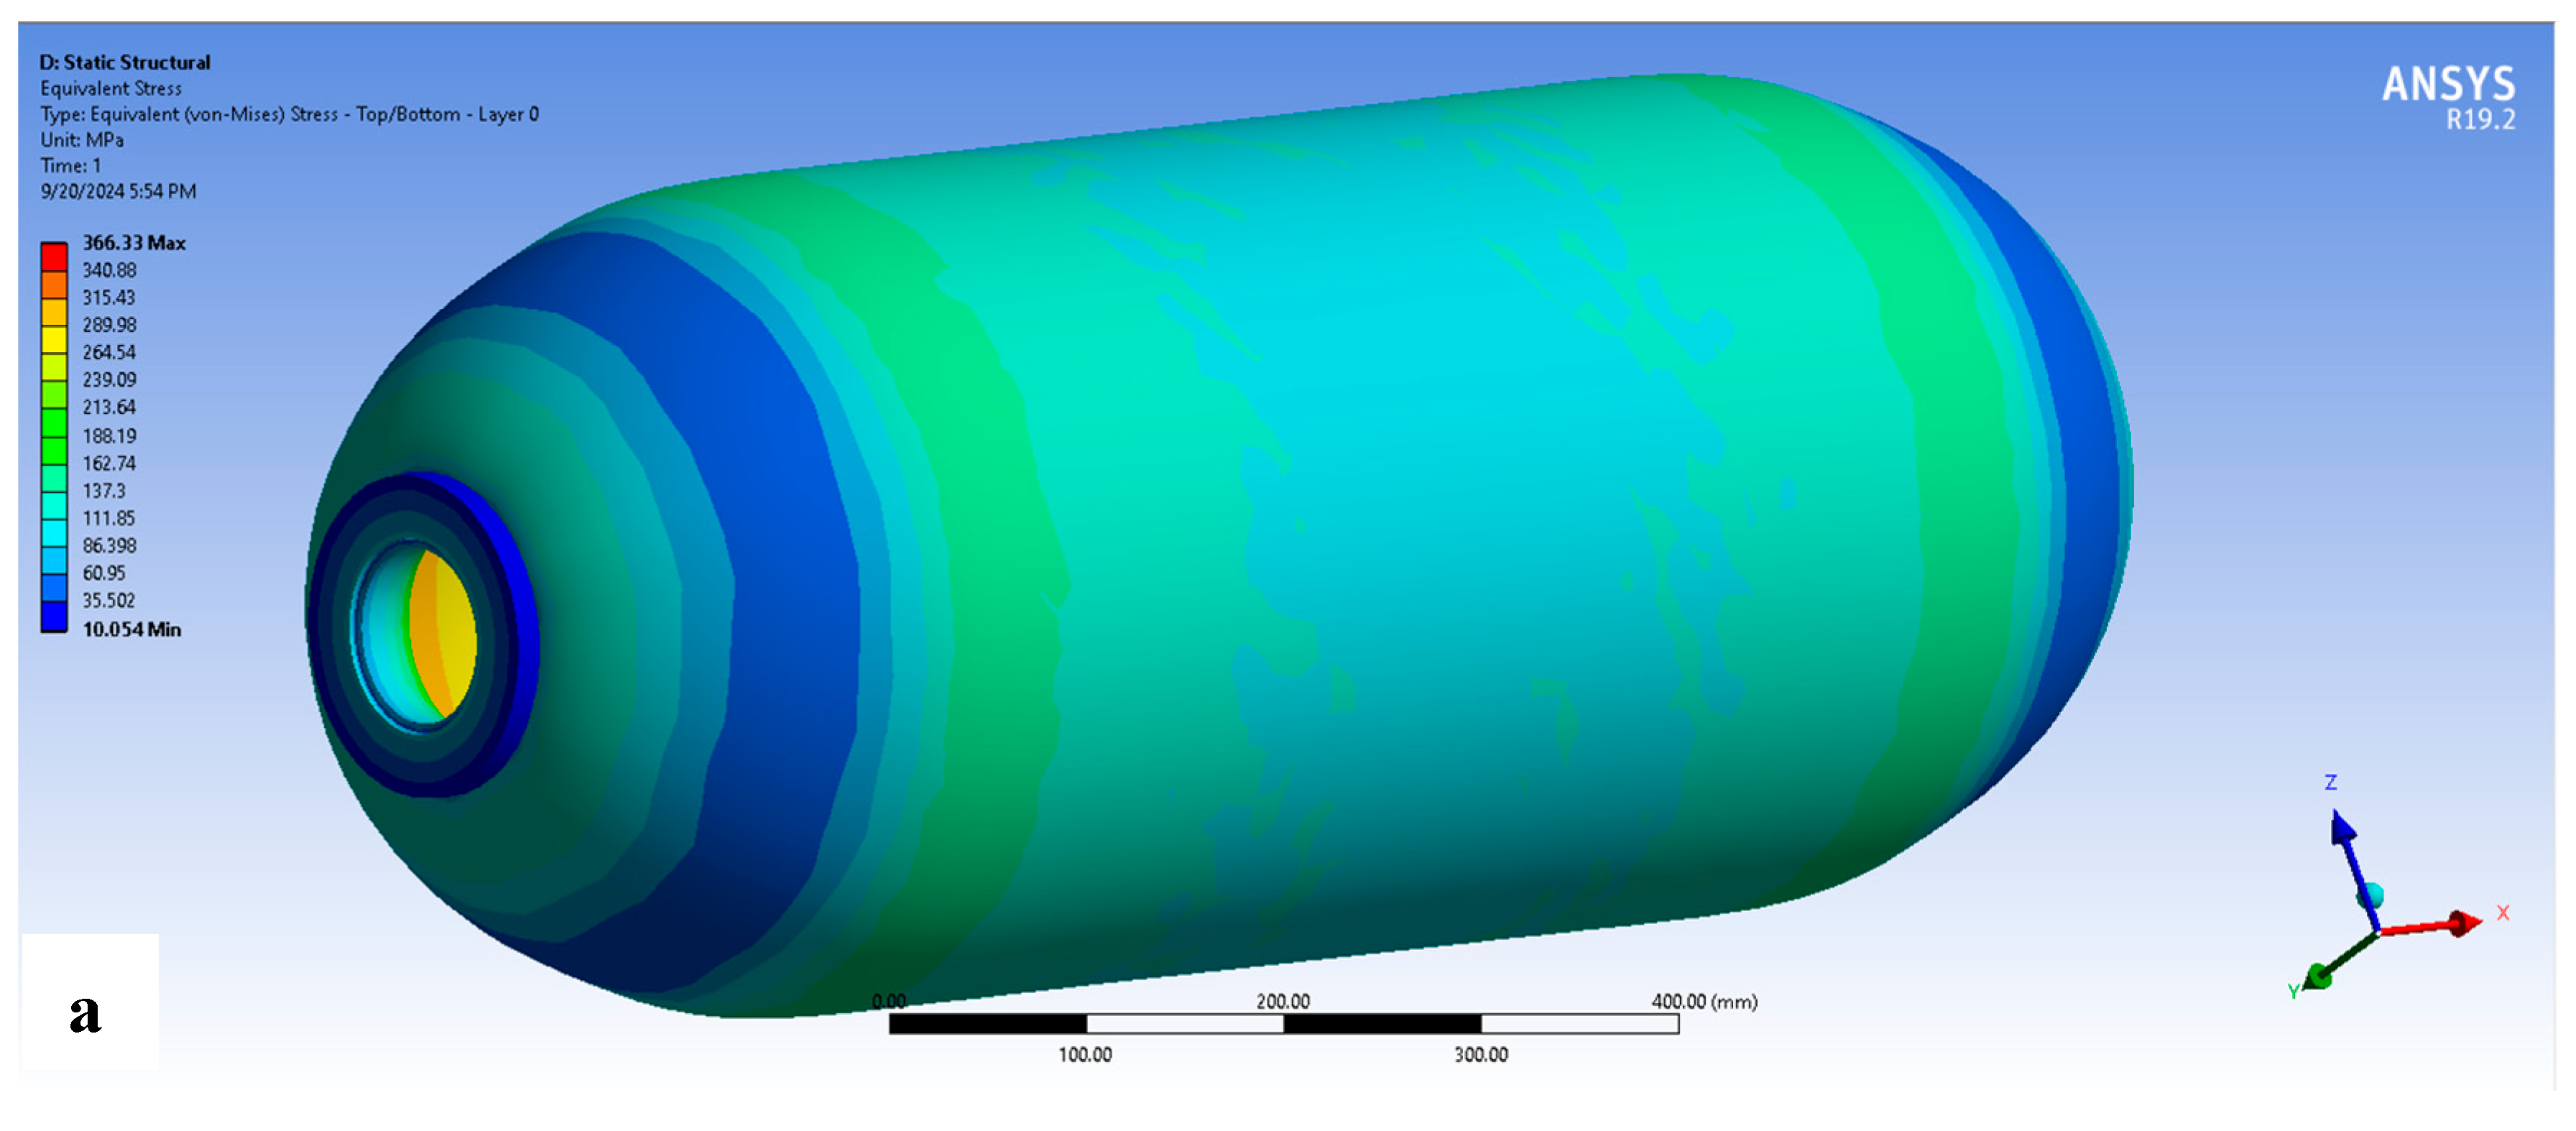
Figure 20 presents the behavior of maximum principal stress for the composite shell, which was composed of 64 layers, of the Type 4 CPVs with a Nylon 6 liner at a 55 MPa internal pressure under both atmospheric and external absolute vacuum conditions over a range of temperatures (−40 to 300 °C). As observed, the atmospheric pressure and absolute vacuum environments showed comparable influences on the maximum principal stress.
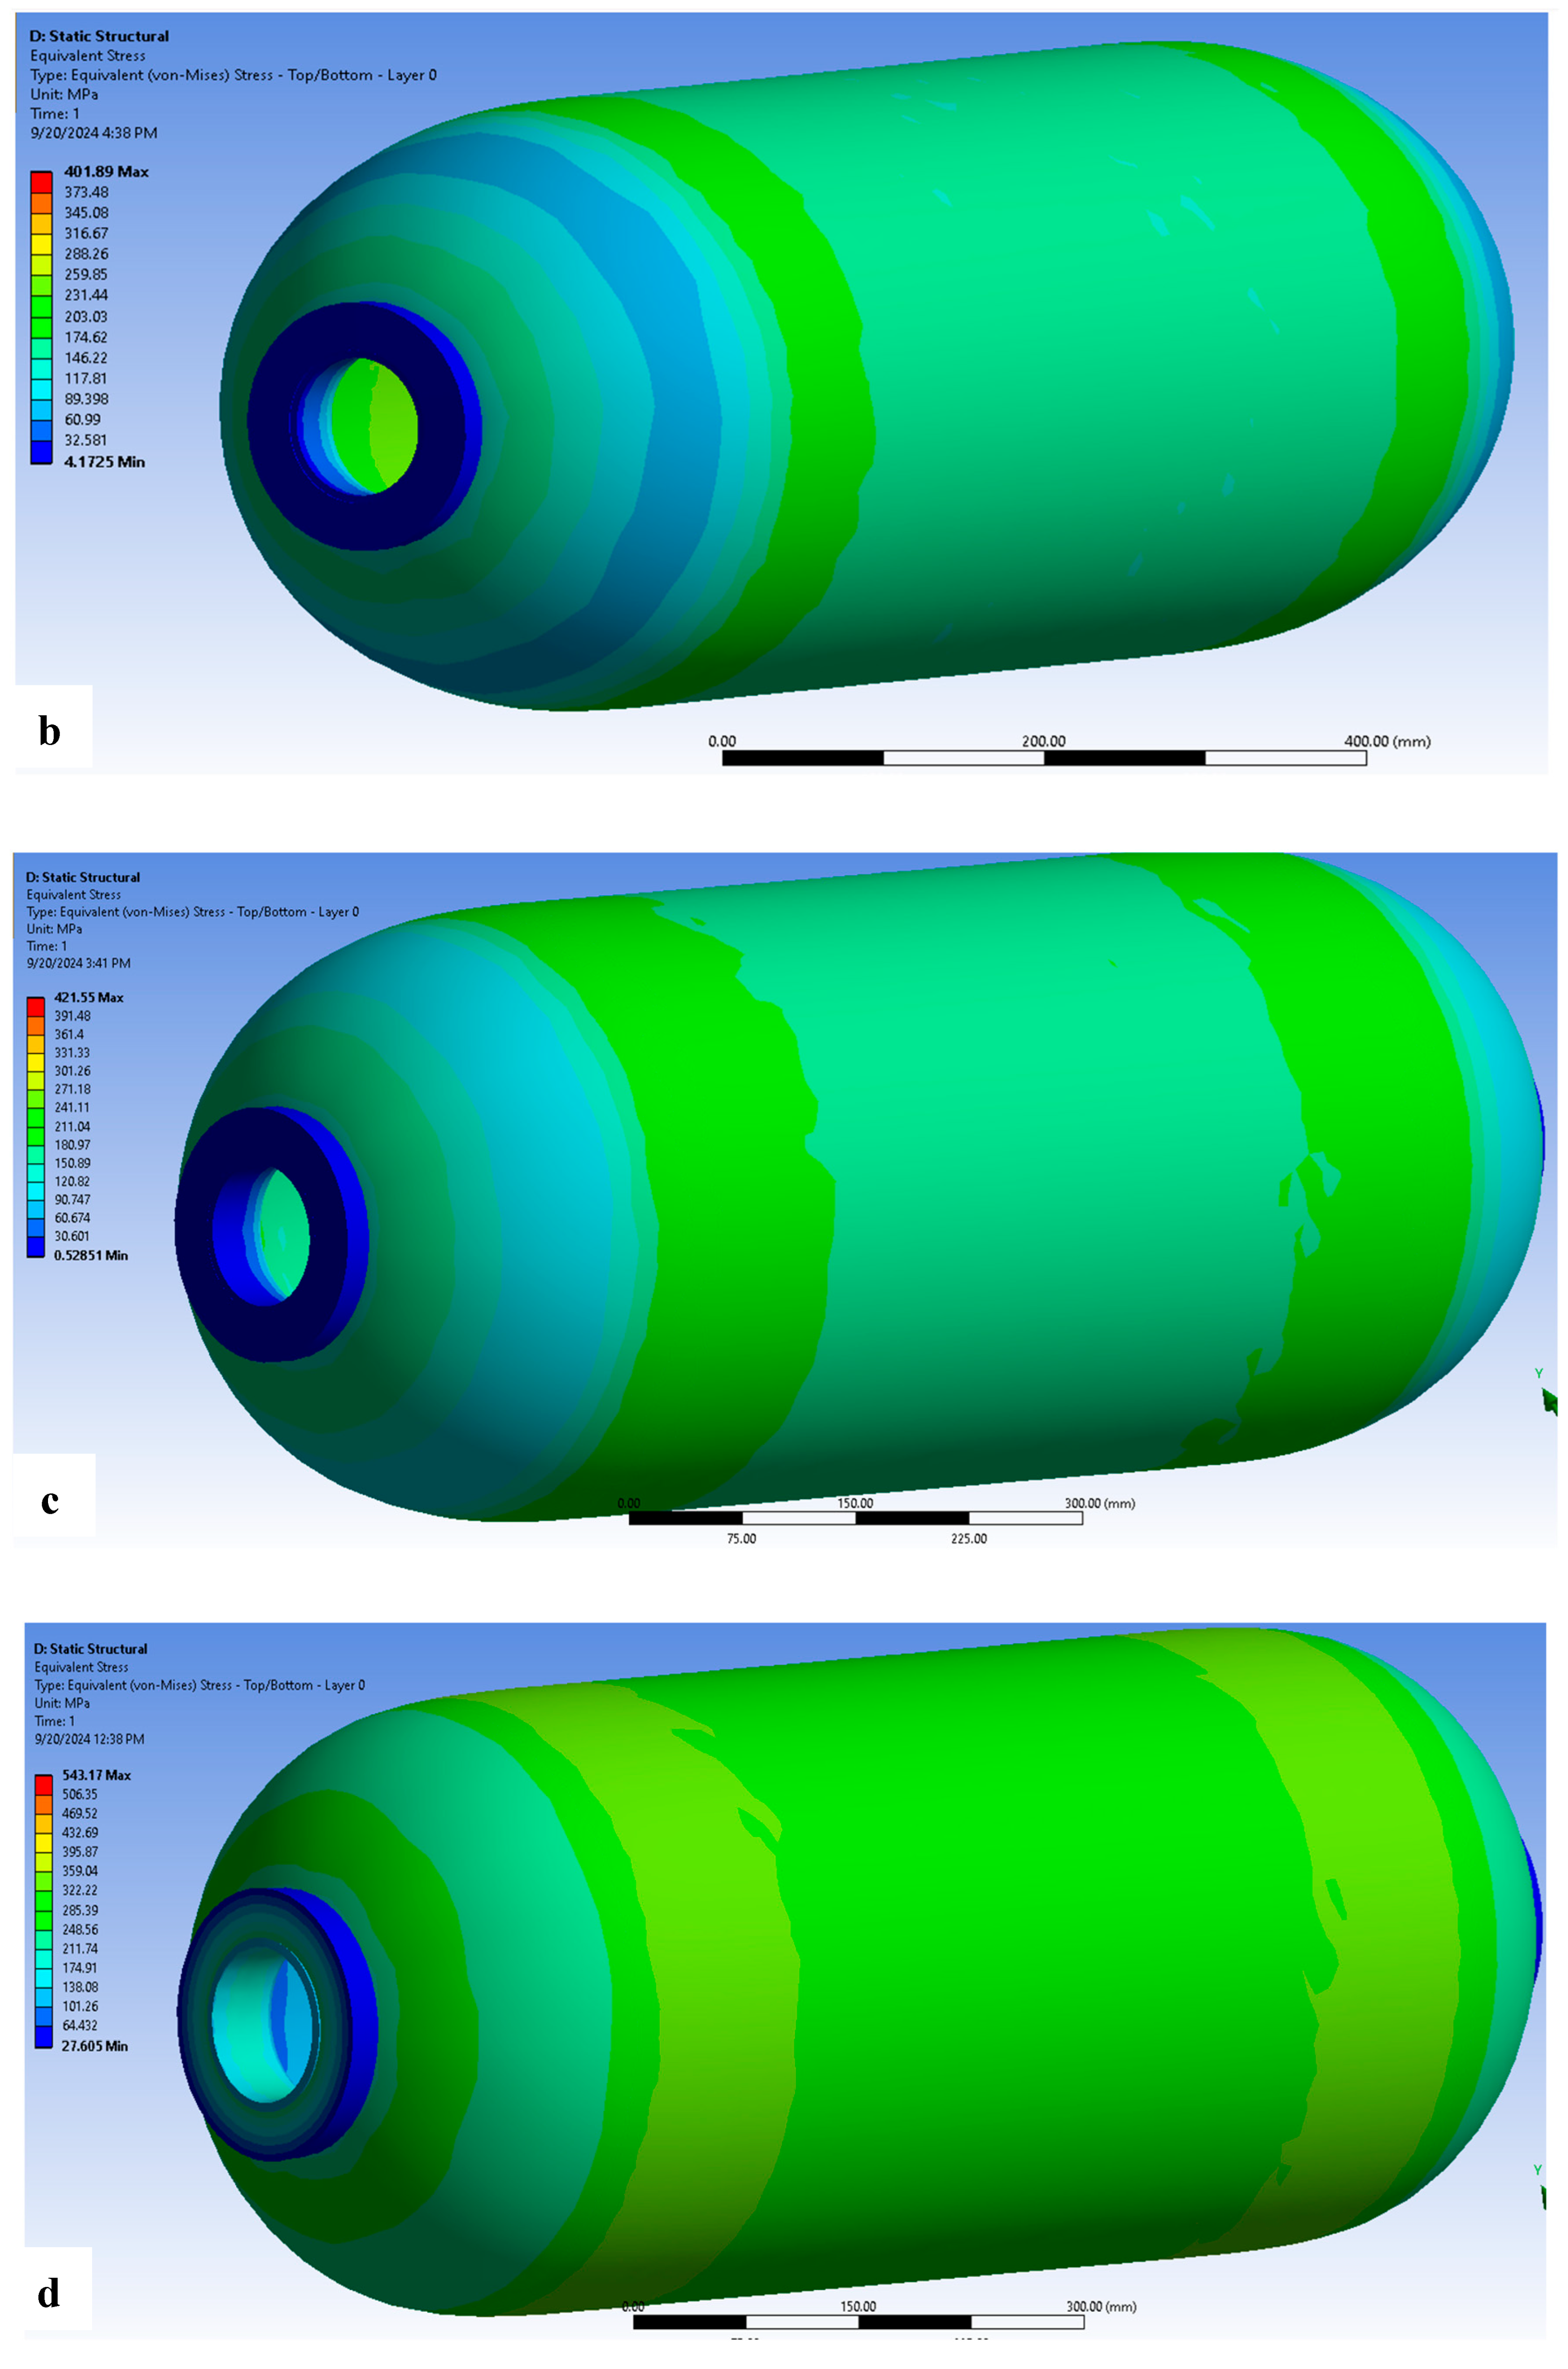
The influence of the external absolute vacuum environment versus the atmospheric pressure on the IRF value was also examined over a range of temperatures (−40 to 300 °C), as presented in Figure 21. The results confirm the negligible influence of the external absolute vacuum environment in the current case. The same behavior of the negligible influence of the external absolute vacuum environment as compared with the atmospheric pressure environment was observed in the liner’s maximum principal stress (Figure 19), composite maximum principal stress (Figure 20), and IRF failure analyses (Figure 21).
It is important to note that one atmospheric pressure represents 0.101325 MPa, and an absolute vacuum represents zero pressure. Given these comparable values, their influence on the mechanical performance of the PVs with a 55 MPa internal pressure was expected to be similar.
As a summary of the previous data, the safe operating range of the Type 4 CPVs was found to be between 10 and 100 °C.
As observed from Figure 21, although the maximum principal stress for the composite shell of the Type 4 CPVs was much lower than the ultimate tensile strength (UTS) of the CFRE composite material over the studied temperature range (as shown in Figure 20), the IRF failure tool detected the failure of the CFRE composite at a maximum temperature of 300 °C and a minimum of 10 °C. These findings align with the specified CFRE composite operating temperature range from 10 to 300 °C, as stated by MatWeb [35].
Ansys Failure Criteria incorporates more sophisticated models that address the limitations of simpler methods, like the maximum principal stress criterion. From the previous analysis, the failure criteria method was chosen as the best approach to identify the composite material failure, consistent with the findings of Pietropaoli [23] and Riccio et al. [24].
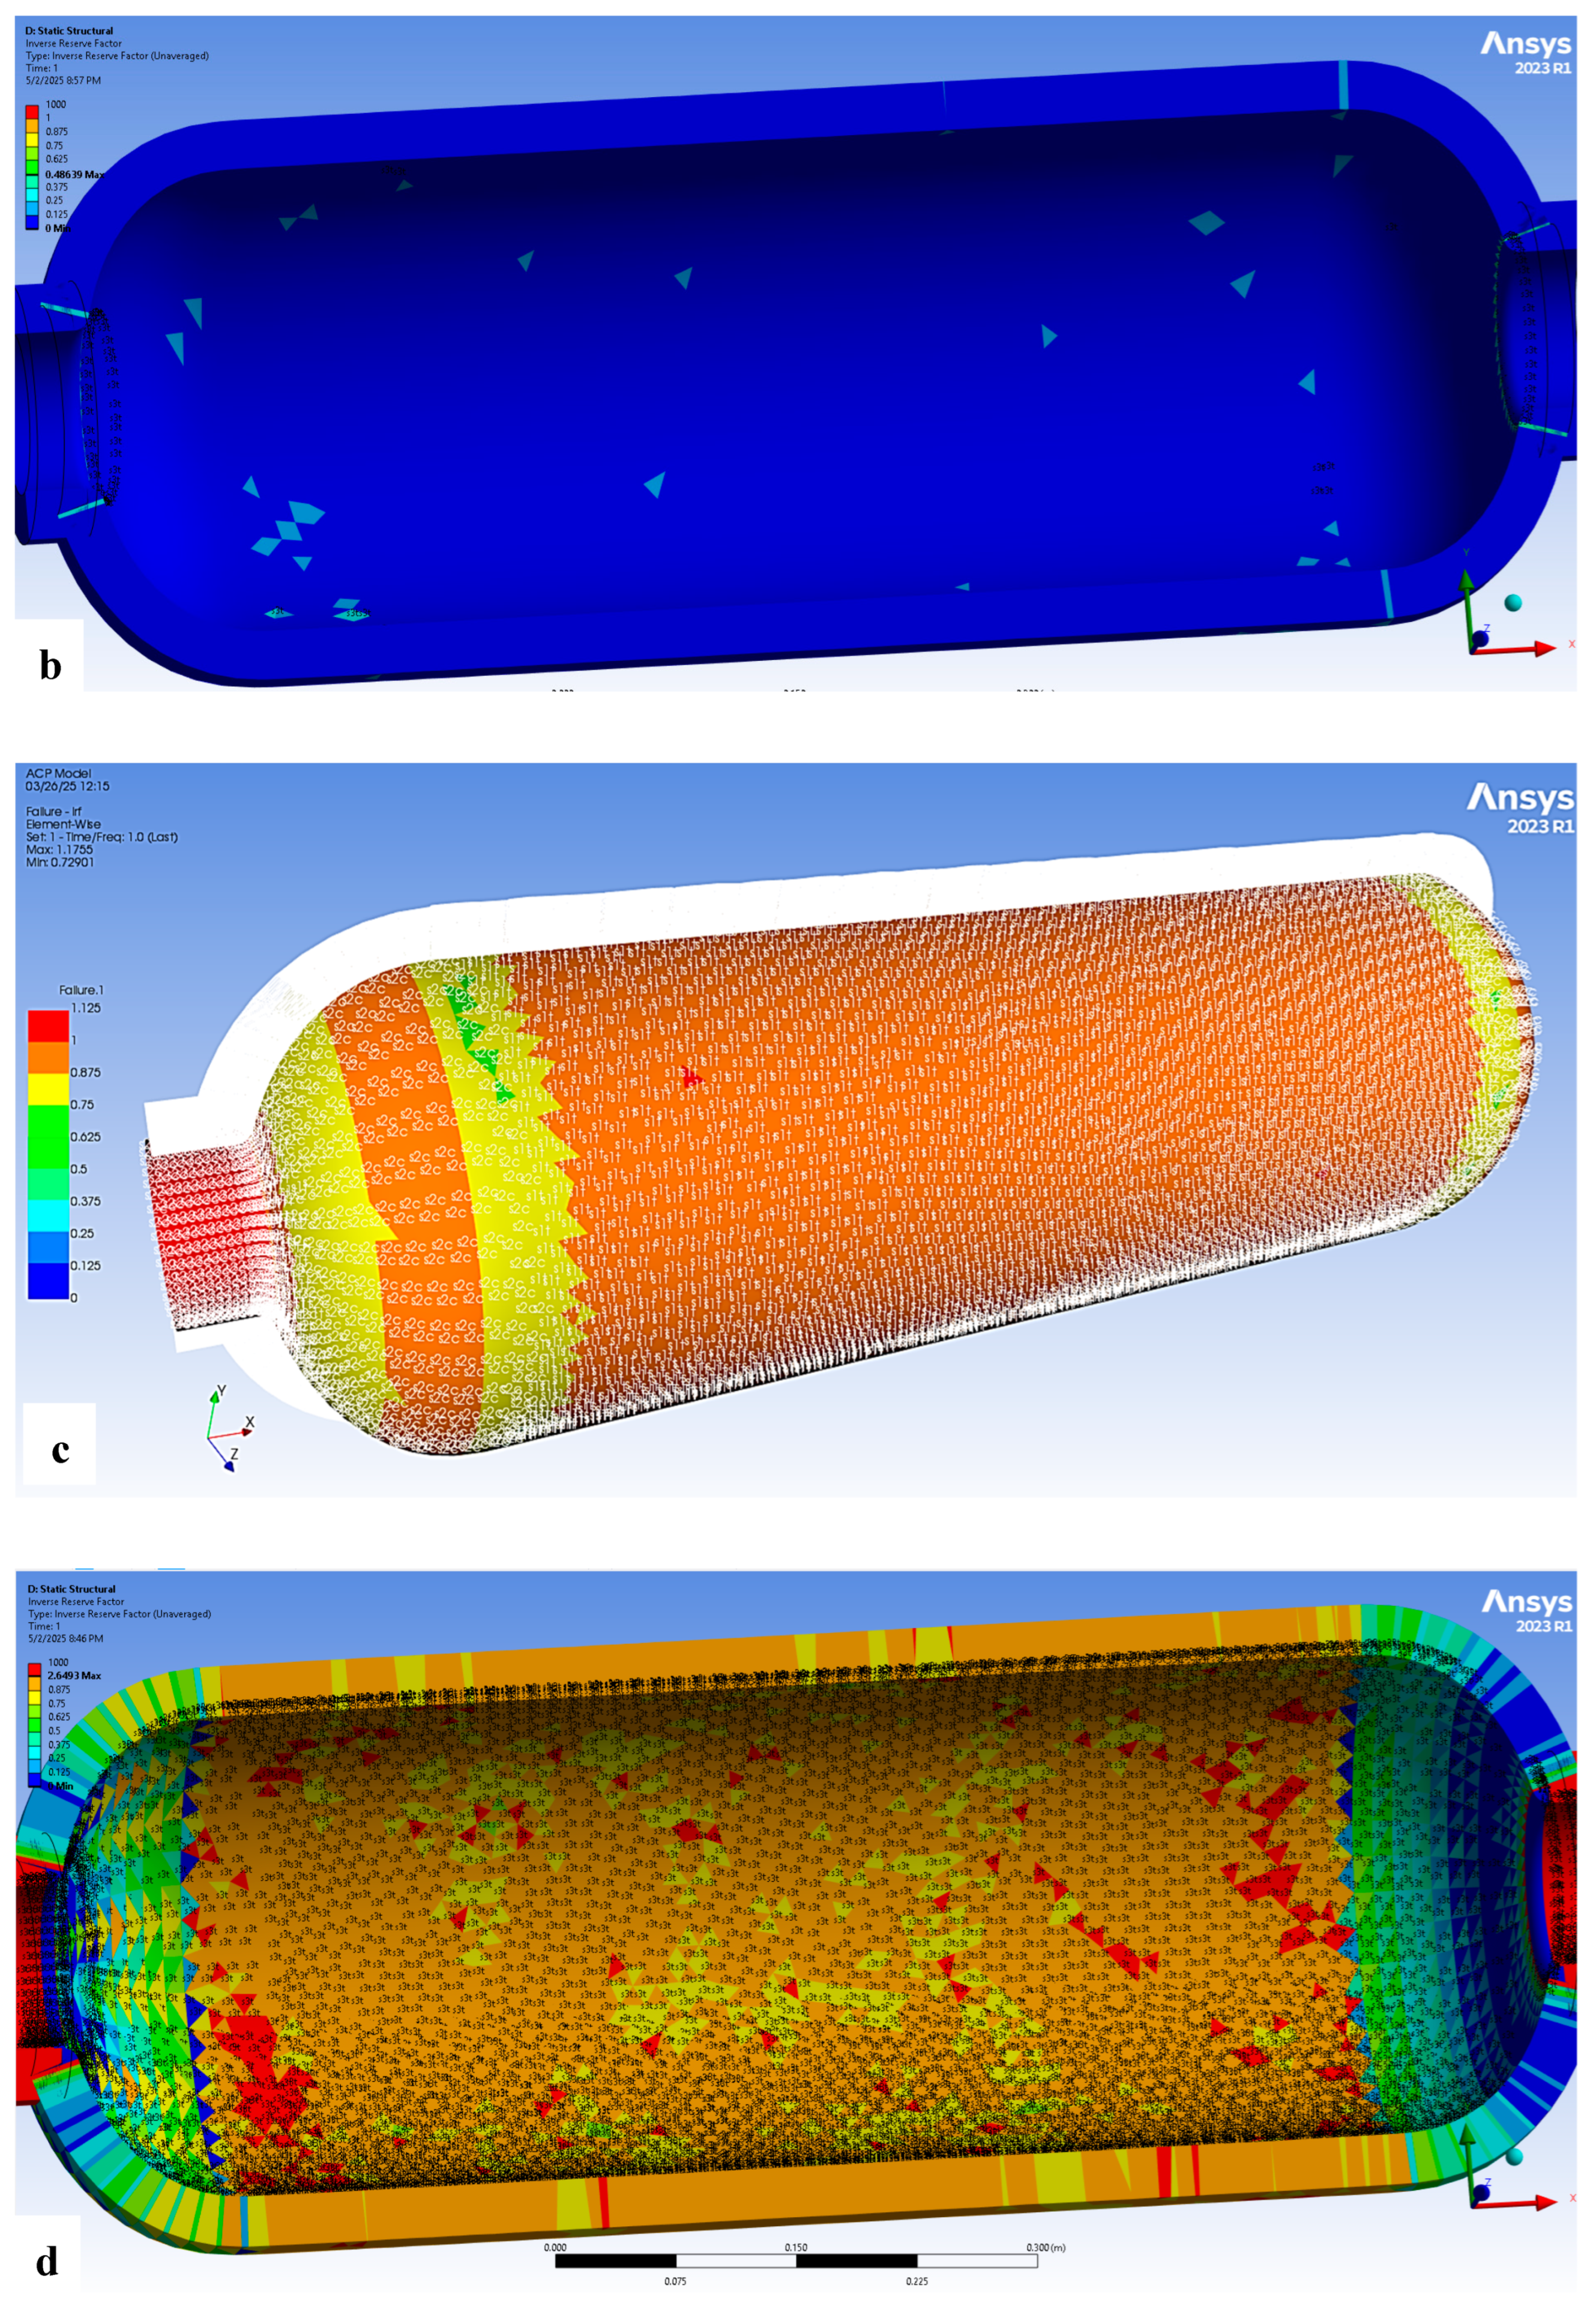
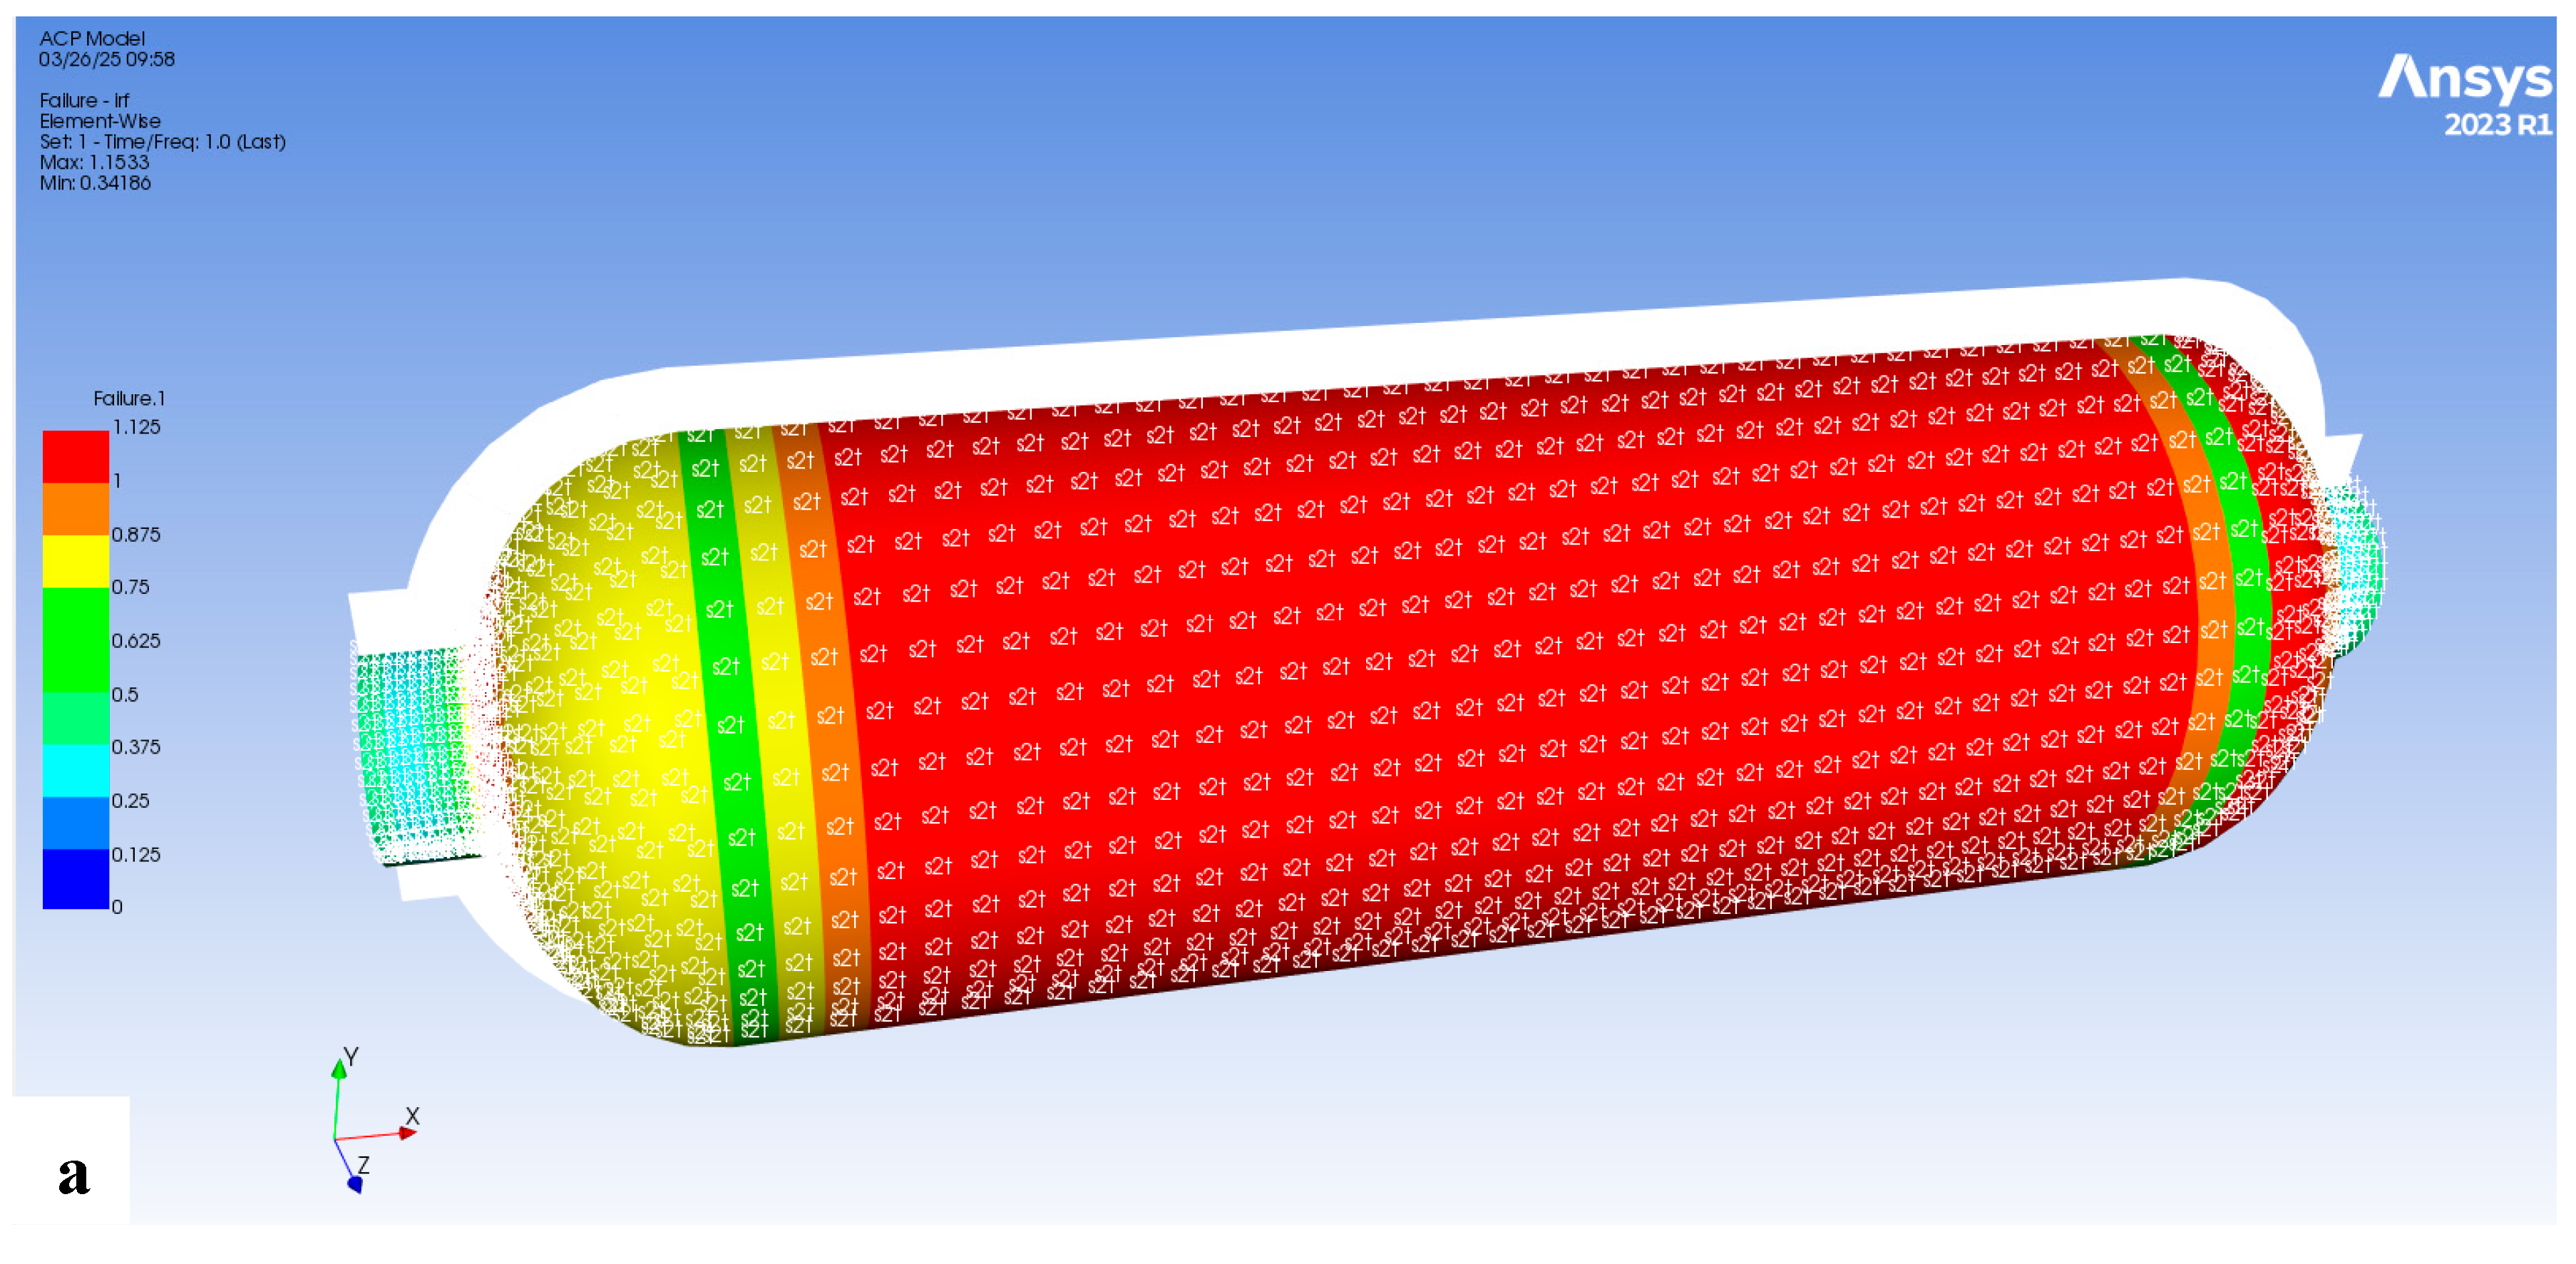
The composite failure modes for the Type 4 CPVs at a 55 MPa internal pressure under an absolute vacuum at 10 °C and 300 °C are presented in Figure 22.
At 10 °C, according to the maximum stress configuration of the composite failure tool in Ansys Workbench, “s2t” represents the mode of failure due to the second-direction tensile strength (Figure 22a), indicating matrix failure. The critical area in the composite shell was located in the straight cylindrical part, suggesting safe burst behavior [7]. At low temperatures (0–10 °C), the matrix became more brittle and stiffer, making it more prone to cracking under transverse tensile stresses, which is represented by “s2t”. This increased the risk of matrix microcracking or fiber–matrix debonding in the transverse direction. These results are consistent with previous findings, which suggests that composites exposed to low temperatures are prone to embrittlement and delamination damage [36,37].
The composite failure tool was also used to detect the potential occurrence of delamination between the layers at 10 °C under the studied conditions. As shown in Figure 22b, slight delamination was observed in isolated regions, indicating that the dominant composite failure mechanisms under these conditions were matrix failure and fiber–matrix debonding.
At 300 °C, according to the maximum stress configuration of the composite failure tool in Ansys Workbench, “s2c” represents the mode of failure due to the second-direction compressive strength of the dome part (Figure 22c), indicating matrix failure. At elevated temperatures (300 °C), the polymer matrix softened or degraded. The dominant “s2c” failure mode represented a transverse direction compressive failure as the matrix softened, which reduced its ability to resist compressive loads. This led to fiber micro-buckling and delamination, which, in turn, reduced the stiffness and strength in the transverse (s2) direction, making it susceptible to compression-induced failure.
The compression failure “s2c’’ occurred earlier than the “s2t’’ tensile failure due to matrix softening. This proved that the temperature significantly affected the mode of composite failure.
“s1t” represents the mode of failure due to the first-direction tensile strength of the straight cylindrical part, indicating fiber failure, with the critical area in the neck. The “s1t” remained relatively stable at low temperatures because carbon fibers are less affected by cold temperatures. However, it started to degrade at high temperatures.
The composite failure tool was also employed to identify the possible circumstances of the layer delamination at 300 °C. Extensive delamination was observed throughout the vessel, as seen in Figure 22d, indicating that matrix failure, fiber failure, and interlaminar delamination were the main composite failure modes at this temperature.

3.4. Type 3 Composite Pressure Vessel Under Extreme Conditions

In this section, the Type 3 CPVs composed of an Aluminum 6061 T6 liner and 64 composite layers, according to the winding pattern of [80/−80/20/−20], were examined under a 55 MPa internal pressure at extreme conditions, with a specific focus on the external temperature changes and absolute vacuum environment.
To assess the safe temperature limits for the Type 3 CPVs in space applications, it was essential to study the influence of the exposure temperature range on both the equivalent stress of the Aluminum 6061 T6 liner (5.17 mm thickness) and the composite material, especially concerning their ultimate tensile strength (UTS).
The UTS of Aluminum 6061 T6 at different temperatures was obtained from MatWeb within the temperature range of −80 to 300 °C [38]. As previously mentioned, equivalent stress theory is most suitable for ductile materials. According to this theory, the material is considered safe if its strength exceeds the value of the equivalent stress under the studied conditions.
As demonstrated in Figure 23, for the Aluminum 6061 T6 liner of the Type 3 CPVs with 64 composite layers at a 55 MPa internal pressure under an absolute vacuum, equivalent stress theory indicated that the safe operating temperature range for the aluminum liner was −40 to 145 °C.
Figure 24 presents the distribution of the equivalent stress for the Aluminum 6061 T6 liner of the Type 3 CPVs at a 55 MPa internal pressure under an absolute vacuum at various temperatures: −40 °C, 0 °C, 22 °C, and 150 °C.
Figure 25 illustrates the maximum principal stress for the composite shell of the Type 3 CPVs at a 55 MPa internal pressure under an absolute vacuum at 5 °C, 22 °C, and 300 °C.
The IRF values for the composite shell of the Type 3 CPVs with an Aluminum 6061 T6 liner using 64 composite layers at a 55 MPa internal pressure under an absolute vacuum over a temperature range of −80 °C to 300 °C are shown in Figure 26. The failure criteria indicate that the allowable operating temperature limits for the CFRE composite were between 0 °C and 245 °C.
The composite failure mode using Ansys ACP (Post) for the Type 3 CPVs at a 55 MPa internal pressure under an absolute vacuum at 0 °C and 245 °C is demonstrated in Figure 27.
At 0 °C for the Type 3 CPVs, the maximum stress configuration of the composite failure tool in Ansys Workbench showed that the “s2t” represented the mode of failure (Figure 27a), indicating matrix failure due to brittleness from cracking and fiber–matrix debonding in the transverse direction. The critical area of the composite shell was found in the straight cylindrical part and in the curvature between the nozzle and dome. Although the cryogenic environment enhanced the tensile strength of the CFRE composite, it also introduced brittleness, which can lead to premature failure. Given the internal high pressure, this trade-off between strength and brittleness is the cause of these results [26].
The composite failure tool was utilized to identify the possible occurrence of layer delamination at 0 °C. A modest degree of delamination was seen in distinct regions, as seen in Figure 27b. This suggests that matrix failure and fiber–matrix debonding were the main composite failure mechanisms in these circumstances.
At 245 °C for the Type 3 CPVs, the maximum stress configuration of the composite failure tool in Ansys Workbench showed that the “s2c” represented the mode of failure (Figure 27c), indicating matrix failure by softening and micro-buckling, as well as fiber buckling and delamination due to the maximum compressive stress before failure in the transverse direction. The critical area of the composite shell was located between the dome and the straight cylindrical part.
Additionally, the composite failure tool was used to determine the potential conditions for layer delamination at 245 °C. As shown in Figure 27d, a high degree of delamination was found throughout the vessel, suggesting that the primary composite failure modes at this temperature were matrix failure, fiber failure, and interlaminar delamination.
In conclusion, the operating temperature range for the Type 3 CPVs, considering the safe temperature limits for both the liner and composite shell, was found to be from 0 °C to 145 °C.

3.5. Type 1 Pressure Vessel Under Extreme Conditions

In this part, the Type 1 PVs of Aluminum 6061 T6 at a 55 MPa internal pressure were examined under extreme conditions, namely, external temperature changes and an absolute vacuum.
To determine the optimal vessel thickness that could withstand both the internal gas pressure and external absolute vacuum, equivalent stress theory was applied to various thicknesses under these extreme conditions, as shown in Figure 28. The minimum safe thickness required to withstand the internal pressure must result in an equivalent stress lower than the strength of Aluminum 6061 T6. It was found that 37 mm was the minimum thickness required. To maintain consistency across all the studied vessels, the Type 1 PVs were kept at a thickness of 37.17 mm.
The influence of the temperature range of −80 to 100 °C on the equivalent stress of the 37.17 mm thick Aluminum 6061 T6 Type 1 PVs at a 55 MPa internal pressure under an absolute vacuum against its corresponding ultimate tensile strength [38] is presented in Figure 29. It was found that the safe operating temperature was in the range of −55 to 54 °C.
Note that the Aluminum 6061 T6 would operate within a significantly higher temperature range in different cases, such as a lower internal pressure or higher vessel thickness.

3.6. Vibration Behavior Under Extreme Space Conditions

Modal analysis is a module that analyzes a system’s dynamics in the frequency domain under free vibration to ensure safety. It identifies intrinsic dynamic properties, such as natural frequencies and mode shapes. Natural frequencies are those at which resonance failure results from the structure absorbing all of the energy applied to it. A system’s intrinsic vibration frequencies must be known by the designer to guarantee that the natural frequencies are distant from the stimulation frequencies and avoid resonance failure.
In random vibration analysis, instead of focusing on a specific frequency or amplitude at a given point in time, the analysis statistically examines how a structure reacts to random vibrations. In this scenario, the structure responds to all driving frequencies simultaneously. This type of analysis is particularly important in situations where the structure is subjected to random, non-uniform forces, such as during rocket launches, where the forcing component is random and varies throughout the launch sequence.
A vibration study can confirm the structural stability of pressure vessels (PVs) by introducing random vibrations through mechanical interfaces and those generated during satellite launches. A widely used technique to assess the degree of damage caused by random vibration is the power spectral density (PSD) of acceleration analysis, which calculates the power intensity of a vibration signal in the frequency domain. By evaluating the fluctuating acceleration, the average value of all the amplitudes within a particular frequency range is obtained. Despite continuous changes, the average acceleration value at a given frequency tends to remain fairly constant over time [28].
Modal analysis was applied to the three types of PVs at a 55 MPa internal pressure under an absolute vacuum to simulate the full range of extreme space conditions using Ansys Workbench. The natural frequencies for ten modes, which were obtained through the modal analysis, are presented in Table 5. The minimum natural frequencies, which refer to the first mode, for the Type 4, Type 3, and Type 1 PVs were 1219.3 Hz, 1318.7 Hz, and 1337.5 Hz, respectively.
According to the Shuttle Hitchhiker Experiment Launcher System (SHELS) user manual, the satellite’s natural frequencies should not be less than 50 Hz [28]. The values derived from the modal analysis were significantly higher than the required minimum launch frequency. Therefore, the PV structures were deemed safe against vibration and will not fail due to resonance with the launch vehicle interface.
Random vibration analysis was conducted on the PVs along the X-, Y-, and Z-axes individually using Ansys Workbench. This approach considers every potential excitation orientation that the PVs might experience during operation, while also monitoring the PVs’ reactions to random vibration in each direction.
This analysis helped to evaluate the worst-case scenario, as the directional deformation and the equivalent stress encountered along each axis were assessed during this study.
Table 6 presents the directional deformation and maximum equivalent stress from the random vibration analysis in the X-, Y-, and Z-directions for the studied pressure vessels at an internal pressure of 55 MPa under an absolute vacuum. This study was based on a power spectral density (PSD) input that ranged from 20 to 2000 Hz (g2/Hz).
The results indicate that the deformations along the X-, Y-, and Z-axes were sufficiently small when the acceleration was applied along the X-direction. According to Table 6, the greatest deformation occurred along the Z-axis for the Type 4 CPVs, with a deformation of 0.0012999 mm; along the Y-axis for the Type 1 PVs, with a deformation of 4.6769 × 10⁻⁶ mm; and in both the Y- and Z-axes for the Type 3 CPVs, with a deformation of 8.6522 × 10⁻⁶ mm.
Despite the loading being applied in the X-direction, it is evident that the stress and resulting deformation along the X-axis exhibited the lowest values. This could be attributed to the high internal pressure, the axial long dimension with axial stress, and the small radial dimension with a high hoop stress. These unique characteristics of the PVs could explain why the X-axis experienced the least deformation and stress.
As presented in Table 6, the maximum equivalent stress of the investigated PVs when applying random vibration along the X-direction was 0.70485 MPa for the Type 4 CPVs, 0.0059824 MPa for the Type 3 CPVs, and 0.0034102 MPa for the Type 1 PVs. These values were sufficiently small compared with the ultimate tensile strength (UTS) of the PVs’ manufacturing materials.
These results ensure that the deformations along the X-, Y-, and Z-axes remained similarly safe for the second scenario, which involved applying random vibrations along the Y-direction. According to Table 6, the maximum deformation occurred along the Y-axis for all PV types, with 0.011287 mm for the Type 4 CPVs, 0.0079878 mm for the Type 3 CPVs, and 0.0079258 mm for the Type 1 PVs.
As shown in Table 6, the maximum equivalent stress of the investigated PVs when applying random vibrations along the Y-direction was 4.893 MPa for the Type 4 CPVs, 3.1785 MPa for the Type 3 CPVs, and 5.7057 MPa for the Type 1 PVs. These values remained sufficiently low compared with the UTS of the PVs’ manufacturing materials.
The results also indicate that the deformations along the X-, Y-, and Z-axes were safe for the third scenario of applying the acceleration along the Z-direction. The Z-axis exhibited the maximum deformation, which was 0.010233 mm for the Type 4 CPVs, 0.0079926 mm for the Type 3 CPVs, and 0.0079352 mm for the Type 1 PVs.
As presented in Table 6, the maximum equivalent stress of the investigated PVs when applying random vibrations along the Z-direction was 2.6965 MPa for the Type 4 CPVs, 2.9186 MPa for the Type 3 CPVs, and 6.0952 MPa for the Type 1 PVs. These values were sufficiently small compared with the ultimate tensile strength (UTS) of the PVs’ manufacturing materials.
Therefore, the worst-case scenario for the Type 4 and Type 3 CPVs occurred when the loading was detected in the Y-direction, while for the Type 1 PVs, the worst-case scenario occurred when the Z-direction loading was applied. This is shown in Figure 30a–c, which illustrates the distribution of the maximum equivalent stress in the studied pressure vessels subjected to an internal pressure of 55 MPa under an absolute vacuum, as evaluated through random vibration analysis with a power spectral density (PSD) input that ranged from 20 to 2000 Hz (g2/Hz).
The results indicate that the PVs will not distort during launch, as the stresses for all three loading scenarios were quite moderate and well within the permitted bounds when considering the strength of the materials used in their construction. Given the overall stiffness and durability of the design, all stress values were acceptable.

3.7. Optimizing Hydrogen Pressure Vessel Types for Space Applications

The use of hydrogen as an energy carrier in different applications is growing day by day because of its advantages in comparison with other technologies and its environmentally friendly nature. Hydrogen has the highest specific energy of any chemical fuel, making it ideal for space travel. Hydrogen is used in fuel cells for energy storage, ensuring a continuous power supply for satellites, space stations, and deep-space missions. Hydrogen, particularly in its liquid form, is a primary fuel used in rocket propulsion when combined with liquid oxygen in engines, like the Space Launch System (SLS) and the Space Shuttle Main Engine (SSME). Therefore, hydrogen pressure vessels are essential components in space applications. PVs should withstand the harsh space environment and have lightweight designs to lower the launch costs and increase the efficiency.
Pressure vessels (PVs) intended for hydrogen storage must be able to survive the severe environments of space while keeping a lightweight structure in order to maximize launch costs and efficiency, given the crucial role that hydrogen plays in space applications. The main objective of this study was to assess the structural integrity of several kinds of hydrogen pressure vessels in extreme space environments. These conditions include exposure to an absolute vacuum, the high internal pressure exerted by compressed hydrogen gas, and temperature variations ranging from cryogenic to high operational levels.
This study aimed to determine the working temperature limits for the Type 4, Type 3, and Type 1 PVs to store compressed hydrogen gas at an internal pressure of 55 MPa under harsh circumstances.
The operating temperature limits and weights of the studied PV types are presented in Table 7. Although the Type 4 and Type 3 CPVs offered a low weight, and hence, a high strength-to-weight ratio, which reduces the total payload and weight, and hence, improves the launch cost and performance of satellites, it was found that the designed CFRE composite materials are impractical in cryogenic applications. CFRE composites are subject to high brittleness at cryogenic temperature and become prone to cracking under the influence of their high internal pressure and the external extreme space conditions.
The Type 1 PVs revealed a suitable, safe cryogenic temperature range for some space applications, but at a heavy weight.
It is worth mentioning that the safe temperature limits for the Aluminum 6061 T6 liner were −40 to 145 °C, while the same material, when employed as the main vessel without the composite shell, had safe temperature limits that diminished to −55:54 °C. This can be illustrated by the fact that due to the low thermal conductivity of the composite shell, it acts as a protective layer for the Aluminum 6061 T6 liner, isolating the liner from the externally applied temperature, and hence, expanding its safe temperature limit under the studied conditions.
The trade-off between the weight reduction and permissible temperature limits in hydrogen pressure vessels intended for extreme space conditions was highlighted in this study. According to the findings, the Type 3 CPVs offered a more well-rounded option, which made them ideal for missions that need to be able to withstand both cryogenic and mild temperatures while still maintaining an acceptable weight.
The applied external absolute vacuum was found to have little effect on the combined mechanical–thermal performance of the designs, considering the fact that temperature was a major factor in defining the surviving working limits.
Modal and random vibration examinations are crucial to understanding how PVs respond dynamically during a launch under severe vibration conditions. The natural frequencies, the maximum stress experienced as a result of vibration, and the deformation in each direction at the natural frequencies were all determined by these analyses. These modules examined the structure’s durability and capacity to withstand extreme space conditions.
Although all the studied PV types revealed safe vibration behavior, and the applied external absolute vacuum showed a slight influence on the combined effect of the mechanical–thermal performance of the studied designs, there are still challenges in achieving the optimal performance under extreme space conditions. Combining the attributes of a low strength-to-weight ratio and wide safe operating temperature limits is a challenge and requires extensive studies.
Future work is necessary to optimize the design, structure, weight, and performance of the PVs for space application and widen the safe temperature limits. For the composite shell of the pressure vessels, this can be performed by studying the influence of different material selections, winding patterns, thicknesses, etc., on the weight and the combined effect of the mechanical–thermal performance in extreme space conditions. Moreover, proper selections of the polymeric matrix and liner are essential to ensure the structural integrity of the pressure vessels. For metallic liners or pressure vessels, the influence of different processing conditions on the strength-to-weight ratio, the thermal stability, and the mechanical and embrittlement performances should be addressed.
Moreover, instead of studying the influence of each single temperature on the performance of the pressure vessels, the influence of the sudden change in the temperature within a proposed thermal cycle should be considered to ensure long-term performance in these severe environments. Furthermore, the operational conditions expose pressure vessels to frequent pressure changes, which, over time, may result in gradual material deterioration and fatigue failure. Therefore, fatigue analysis under extreme environmental conditions will also be addressed in the future study.

4. Conclusions

This paper presents comprehensive thermal and structural analyses of different hydrogen pressure vessel (PV) types, specifically Type 4, Type 3, and Type 1 PVs, under extreme space conditions. Using simulation tools, such as Ansys Static Structural and Ansys Composite Pre/Post (ACP), the effects of high internal pressures, extreme temperatures, and an absolute vacuum on the PV performance were evaluated. The findings underscore the critical influence of material selection, composite layering, and structural design in determining the operational temperature limits of these vessels.
Estimating the temperature limits of pressure vessels (PVs) is crucial for designing a satellite’s thermal control subsystem, as it determines the necessary insulation requirements. Additionally, these limits influence the overall weight distribution, which is a key factor in structural subsystem design, ensuring satellite balance and stability.
The Type 4 composite pressure vessels (CPVs), which featured a Nylon 6 liner and a carbon fiber-reinforced epoxy (CFRE) composite shell, demonstrated effective operation within a temperature range of 10 °C to 100 °C, which aligned with the material specifications. The Type 3 CPVs, which incorporated an Aluminum 6061-T6 liner and a CFRE composite shell, exhibited a broader operational range of 0 °C to 145 °C.
The Type 3 CPVs exhibited a higher weight (63.7 kg) compared with the Type 4 CPVs (56.2 kg), primarily due to aluminum’s greater density relative to Nylon 6. However, both CPV types were constrained by the limitations of the composite material in extreme temperature environments. While cryogenic conditions enhanced the CFRE composite’s tensile strength, they also induced matrix brittleness, which led to cracks and fiber–matrix debonding under high internal pressure. At elevated temperatures, matrix softening occurred, which resulted in fiber micro-buckling and delamination.
The Type 1 PVs, which were constructed entirely of aluminum, demonstrated the best cryogenic performance with an operational range of −55 °C to 54 °C, but were significantly heavier (106 kg).
This study highlighted the trade-off between acceptable temperature limits and weight reduction in hydrogen pressure vessels for extreme space environments. The findings suggest that the Type 3 CPVs provide a more balanced solution, making them suitable for missions requiring both cryogenic and moderate-temperature resistance.
The results of this study demonstrate that the applied external absolute vacuum had a negligible effect on the overall mechanical–thermal performance of the pressure vessel designs.
To ensure that the natural vibration frequencies of the pressure vessels (PVs) remain sufficiently high to prevent resonance with excitation frequencies, modal and random vibration analyses were performed using Ansys Workbench. The results confirmed that all the designed PV types maintained structural integrity under launch-induced vibrations, with minimal stress levels across the three loading scenarios, which would prevent distortion during a launch.
Additionally, several finite element modeling (FEM) parameters were meticulously evaluated to ensure the result accuracy and reliability. These parameters included the mesh element quality for each component and the composite modeling approach. The combined effects of these factors were analyzed in terms of the result convergence, accuracy, and computational efficiency.
This research provided valuable insights into the design of pressure vessels for space applications, offering guidance on optimizing the material selection and structural configurations to enhance the performance in future missions.

Author Contributions

R.R.: writing—review and editing, project administration, conceptualization, software, and visualization. S.A.: conceptualization, supervision, resources, and funding acquisition. All authors reviewed this manuscript. A.A.: conceptualization, writing—original draft, software, visualization, and formal analysis. All authors have read and agreed to the published version of the manuscript.

Funding

This work was supported and funded by the Deanship of Scientific Research at Imam Mohammad Ibn Saud Islamic University (IMSIU) (grant number IMSIU-DDRSP2503).

Data Availability Statement

Data will be available upon request.

Conflicts of Interest

The authors declare no conflicts of interest.

References

  1. Romeo, G.; Danzi, F.; Cestino, E.; Borello, F. Design and optimization of a composite vessel for hydrogen storage subject to internal pressure and in-flight loads for UAVs. J. Aerosp. Sci. 2013, 2, 124–137. [Google Scholar]
  2. Colozza, A.J. Hydrogen Storage for Aircraft Applications Overview; NASA Technical Reports, NASA/CR-2002-211867. Available online: https://www.researchgate.net/publication/24316784_Hydrogen_Storage_for_Aircraft_Applications_Overview (accessed on 11 February 2025).
  3. Meyer, M.L.; Motil, S.M.; Kortes, T.F.; Taylor, W.J.; McRight, P.S. Cryogenic Propellant Storage and Transfer Technology Demonstration for Long Duration in-Space Missions; NASA Technical Memorandum, NASA/TM-2012-217642. Available online: https://ntrs.nasa.gov/citations/20120009208 (accessed on 10 January 2025).
  4. Boeing. Hydrogen and Sustainable Aviation. Fact Sheet, 2024, Doc. No. 328182 03/24 AQ. Available online: https://www.boeing.com/content/dam/boeing/boeingdotcom/principles/sustainability/assets/pdf/Hydrogen_Factsheet.pdf (accessed on 1 January 2025).
  5. NASA. Water-Powered Engines Offer Satellite Mobility. NASA Spinoff. 2020. Available online: https://spinoff.nasa.gov/Spinoff2020/t_6.html (accessed on 15 January 2025).
  6. Reda, R.; Ashraf, A.; Magdy, I.; Ragab, M.; Eldabaa, N.; Elmagd, M.A.; Abdelhafiz, M.; El-Banna, O.; Fouad, A.; Aly, H.A.; et al. An investigation on the potential of utilizing aluminum alloys in the production and storage of hydrogen gas. Materials 2024, 17, 4032. [Google Scholar] [CrossRef]
  7. Reda, R.; Khamis, M.; Ragab, A.E.; Elsayed, A.; Negm, A.M. Numerical analysis of the impact of winding angles on the mechanical performance of filament wound type 4 composite pressure vessels for compressed hydrogen gas storage. Heliyon 2024, 10, e33796. [Google Scholar] [CrossRef]
  8. Azeem, M.; Ya, H.H.; Alam, M.A.; Kumar, M.; Stabla, P.; Smolnicki, M.; Gemi, L.; Khan, R.; Ahmed, T.; Ma, Q.; et al. Application of Filament Winding Technology in Composite Pressure Vessels and Challenges: A Review. J. Energy Storage 2022, 49, 103468. [Google Scholar] [CrossRef]
  9. Pramod, R.; Shanmugam, N.S.; Krishnadasan, C.K.; Radhakrishnan, G.; Thomas, M. Design and development of aluminum alloy 6061-T6 pressure vessel liner for aerospace applications: A technical brief. Proc. Inst. Mech. Eng. Part L J. Mater. Des. Appl. 2022, 236, 1130–1148. [Google Scholar] [CrossRef]
  10. Park, G.; Jang, H.; Kim, C. Design of composite layer and liner for structure safety of hydrogen pressure vessel (Type 4). J. Mech. Sci. Technol. 2021, 35, 3507–3517. [Google Scholar] [CrossRef]
  11. Sapre, S.; Pareek, K.; Vyas, M. Investigation of structural stability of Type IV compressed hydrogen storage tank during refueling of fuel cell vehicle. Energy Storage 2020, 2, e150. [Google Scholar] [CrossRef]
  12. Sharma, P.; Bera, T.; Semwal, K.; Badhe, R.M.; Sharma, A.; Ramakumar, S.S.V.; Neogi, S. Theoretical analysis of design of filament wound type 3 composite cylinder for the storage of compressed hydrogen gas. Int. J. Hydrogen Energy 2020, 45, 25386–25397. [Google Scholar] [CrossRef]
  13. Jois, K.C.; Welsh, M.; Gries, T.; Sackmann, J. Numerical analysis of filament wound cylindrical composite pressure vessels accounting for variable dome contour. J. Compos. Sci. 2021, 5, 56. [Google Scholar] [CrossRef]
  14. Sharma, P.; Sharma, S.; Bera, T.; Semwal, K.; Badhe, R.M.; Sharma, A.; Kapur, G.S.; Ramakumar, S.S.V.; Neogi, S. Effects of dome shape on burst and weight performance of a type-3 composite pressure vessel for storage of compressed hydrogen. Compos. Struct. 2022, 293, 115732. [Google Scholar] [CrossRef]
  15. Canale, G.; Andrews, S.; Rubino, F.; Maligno, A.; Citarella, R.; Weaver, P.M. Realistic stacking sequence optimisation of an aero-engine fan blade-like structure subjected to frequency, deformation and manufacturing constraints. Open Mech. Eng. J. 2018, 12, 151–163. [Google Scholar] [CrossRef]
  16. Yang, S.-T.; Liang, Y.-J. Stacking sequence optimization of composite laminates for maximum fundamental frequency using Bayesian optimization computational framework. Results Eng. 2024, 23, 102586. [Google Scholar] [CrossRef]
  17. Park, S.Y.; Choi, H.S.; Choi, W.J.; Kwon, H. Effect of vacuum thermal cyclic exposures on unidirectional carbon fiber/epoxy composites for low earth orbit space applications. Compos. Part B 2012, 43, 726–738. [Google Scholar] [CrossRef]
  18. Plante, J.; Lee, B. Environmental Conditions for Space Flight Hardware—A Survey. NASA Electronic Parts and Packaging (NEPP) Program. 2004. Available online: https://ntrs.nasa.gov/citations/20060013394 (accessed on 18 January 2025).
  19. Uzun, M.; Bozkurt, S. Design and analysis of a pressure vessel according to EU 2014/29. Mater. Test. 2020, 62, 756–760. [Google Scholar] [CrossRef]
  20. Kim, J.-S.; Kim, H.-K.; Kim, M.; Kim, H.-D. On-orbit thermal analysis for verification of thermal design of 6U nano-satellite with multiple payloads. J. Korean Soc. Aeronaut. Space Sci. 2020, 48, 455–466. [Google Scholar] [CrossRef]
  21. A.I. Solutions, Inc. FreeFlyer® Software; Version 7.9.1; A.I. Solutions, Inc.: Lanham, MD, USA, 2022; Available online: https://ai-solutions.com/freeflyer/ (accessed on 27 January 2025).
  22. Foster, I. Small Satellite Thermal Modeling Guide, Air Force Research Laboratory, AFRL20222564, Space Vehicles Directorate. 2022. Available online: https://www.researchgate.net/publication/361102967_Small_Satellite_Thermal_Modeling_Guide (accessed on 22 January 2025).
  23. Pietropaoli, E. Progressive failure analysis of composite structures using a constitutive material model (USERMAT) developed and implemented in Ansys. Appl. Compos. Mater. 2012, 19, 657–668. [Google Scholar] [CrossRef]
  24. Riccio, A.; Palumbo, C.; Acanfora, V.; Sellitto, A.; Russo, A. Influence of failure criteria and intralaminar damage progression numerical models on the prediction of the mechanical behavior of composite laminates. J. Compos. Sci. 2021, 5, 310. [Google Scholar] [CrossRef]
  25. ASME Boiler and Pressure Vessel Committee. ASME Boiler and Pressure Vessel Code, Section VIII, Division 2—Alternative Rules for Construction of Pressure Vessels; American Society of Mechanical Engineers (ASME): New York, NY, USA, 2021. [Google Scholar]
  26. Grubenmann, M.; Heingärtner, J.; Hora, P.; Bassan, D. Influence of temperature on in-plane and out-of-plane mechanical behavior of GFRP composite. J. Phys. Conf. Ser. 2018, 1063, 012146. [Google Scholar] [CrossRef]
  27. Barsoum, G.I.; Ibrahim, H.H.; Fawzy, M.A. Static and Random Vibration Analyses of a University CubeSat Project. J. Phys. Conf. Ser. 2019, 1264, 012019. [Google Scholar] [CrossRef]
  28. Reda, R.; Ahmed, Y.; Magdy, I.; Nabil, H.; Khamis, M.; Lila, M.A.; Refaey, A.; Eldabaa, N.; Elmagd, M.A.; Ragab, A.E.; et al. Wall panel structure design optimization of a hexagonal satellite. Heliyon 2024, 10, 24159. [Google Scholar] [CrossRef]
  29. NASA Space Science Data Coordinated Archive. HST, NSSDCA/COSPAR ID: 1990-037B. Available online: https://nssdc.gsfc.nasa.gov/nmc/spacecraft/display.action?id=1990-037B (accessed on 20 February 2025).
  30. NASA Space Science Data Coordinated Archive. Cosmos 2023, NSSDCA/COSPAR ID: 1989-039B. Available online: https://nssdc.gsfc.nasa.gov/nmc/spacecraft/display.action?id=1989-039B (accessed on 20 February 2025).
  31. NASA Space Science Data Coordinated Archive. GOES-R, NSSDCA/COSPAR ID: 2016-071A. Available online: https://nssdc.gsfc.nasa.gov/nmc/spacecraft/display.action?id=2016-071A (accessed on 20 February 2025).
  32. Fagherazzi, M.; Santi, M.; Barato, F.; Pizzarelli, M. A simplified thermal analysis model for regeneratively cooled rocket engine thrust chambers. Aerospace 2023, 10, 403. [Google Scholar] [CrossRef]
  33. İrsel, G. The effect of using shell and solid models in structural stress analysis. Vibroeng. Procedia 2019, 27, 115–120. [Google Scholar] [CrossRef]
  34. Overview of Materials for Nylon 6, Extruded. MatWeb. Available online: https://www.matweb.com/search/DataSheet.aspx?MatGUID=726845c457b94b7cafe31d2e65739e1d&ckck (accessed on 25 February 2025).
  35. Overview of Materials for Epoxy/Carbon Fiber Composite. MatWeb. Available online: https://www.matweb.com/search/datasheet.aspx?matguid=39e40851fc164b6c9bda29d798bf3726&ckck&ckck=1 (accessed on 25 February 2025).
  36. Battaglia, J.-L.; Saboul, M.; Pailhès, J.; Saci, A.; Kusiak, A. Carbon epoxy composites thermal conductivity at 77 K and 300 K. J. Appl. Phys. 2014, 115, 223516. [Google Scholar] [CrossRef]
  37. Li, Y.; Meng, J.; Luo, J.; Wang, P.; Ma, J.; Zhao, Z.; Lei, H. Cryogenic mechanics and damage behaviors of carbon fiber reinforced polymer composites. Compos. Part A 2023, 169, 107484. [Google Scholar] [CrossRef]
  38. Aluminum 6061-T6; 6061-T651. MatWeb. Available online: https://www.matweb.com/search/DataSheet.aspx?MatGUID=b8d536e0b9b54bd7b69e4124d8f1d20a&ckck (accessed on 20 February 2025).
Figure 1. Classification of pressure vessels: (a) Type 1, (b) Type 2, (c) Type 3, and (d) Type 4 [7].
Processes 13 01429 g001
Figure 2. Various dome profiles of pressure vessels: (a) hemispherical, (b) ellipsoidal (I), (c) ellipsoidal (II), (d) ellipsoidal (III), and (e) isotensoid [7].
Processes 13 01429 g002
Figure 3. CAD model illustrating the main dimensions of the pressure vessel [7].
Processes 13 01429 g003
Figure 5. Winding angle setting step in Ansys ACP Pre.
Processes 13 01429 g005
Figure 6. Winding angle orientation of the composite using the Ansys ACP Pre/Post module: (a) 20°, (b) −20°, (c) 80°, and (d) −80°.
Processes 13 01429 g006
Figure 7. A representation of the different boundary conditions applied to the studied pressure vessels.
Processes 13 01429 g007
Figure 8. Ansys Workbench schematic for Type 4 pressure vessels.
Processes 13 01429 g008
Figure 9. Random vibration spectrum data [28].
Processes 13 01429 g009
Figure 10. Two-dimensional map of the Hubble Space Telescope’s low Earth orbit (LEO), illustrating the shadow and light zones. The simulation was performed using FreeFlyer software (version 7.9.1) with Two-Line Element (TLE) data obtained from the NASA NSSDC Master Catalog [29]. The orange line represents illuminated regions, while the cyan line denotes shadowed regions.
Processes 13 01429 g010
Figure 11. Two-dimensional map of the COSMOS 2023 (GLONASS) orbit, illustrating the shadow and light zones. The simulation was conducted using FreeFlyer software (version 7.9.1), with Two-Line Element (TLE) data obtained from the NASA NSSDC Master Catalog [30]. The orange line represents illuminated regions, while the cyan line indicates shadowed regions.
Processes 13 01429 g011
Figure 12. Two-dimensional map of the GOES 16 orbit, illustrating the shadow and light zones. The simulation was conducted using FreeFlyer software (version 7.9.1), with Two-Line Element (TLE) data obtained from the NASA NSSDC Master Catalog [31]. The orange line represents illuminated regions, while the cyan line indicates shadowed regions.
Processes 13 01429 g012
Figure 13. Calculated isotensoid dome profile for a 20° winding angle.
Processes 13 01429 g013
Figure 14. Skewness and orthogonal quality at different mesh element sizes for the Nylon 6 liner of the Type 4 pressure vessel.
Processes 13 01429 g014
Figure 15. Skewness and orthogonal quality at different mesh element sizes for the composite layers of the Type 4 pressure vessel.
Processes 13 01429 g015
Figure 16. Maximum principal stress of the 26 composite layers of the Type 4 pressure vessels at a 70 MPa internal pressure and atmospheric pressure at different mesh element sizes for the Nylon 6 liner using a 15 mm mesh element size for the composite identified by the solid modeling method.
Processes 13 01429 g016
Figure 17. Maximum principal stress of the 26 composite layers of the Type 4 pressure vessels at a 70 MPa internal pressure and atmospheric pressure for different composite mesh element sizes using solid and shell modeling methods, with a 5 mm mesh element size for the Nylon 6 liner.
Processes 13 01429 g017
Figure 18. Maximum principal stress of the 26 composite layers of the Type 4 pressure vessels at a 70 MPa internal pressure and atmospheric pressure over the temperature range using solid and shell composite modeling methods, with composite mesh element sizes of 15 mm and a 5 mm mesh element size for the Nylon 6 liner.
Processes 13 01429 g018
Figure 19. Maximum principal stress of the Nylon liner of the Type 4 pressure vessels at different temperatures under a 55 MPa internal pressure at atmospheric pressure and an absolute vacuum compared with its ultimate tensile strength (UTS) [34].
Processes 13 01429 g019
Figure 20. Maximum principal stress of the composite shell (64 layers) of the Type 4 pressure vessels at a 55 MPa internal pressure under atmospheric pressure and an absolute vacuum over a range of temperatures.
Processes 13 01429 g020
Figure 21. IRF value of the composite shell (64 layers) of the Type 4 pressure vessels at a 55 MPa internal pressure under atmospheric pressure and absolute vacuum over a range of temperatures.
Processes 13 01429 g021
Figure 22. Composite failure modes using Ansys ACP (Post) for Type 4 pressure vessels at 55 MPa internal pressure under absolute vacuum: (a) matrix and fiber failure at 10 °C, (b) delamination failure at 10 °C, (c) matrix and fiber failure at 300 °C, and (d) delamination failure at 300 °C.
Processes 13 01429 g022aProcesses 13 01429 g022b
Figure 23. Equivalent stress of the Aluminum 6061 T6 liner of the Type 3 pressure vessels using 64 composite layers at a 55 MPa internal pressure under an absolute vacuum.
Processes 13 01429 g023
Figure 24. Effects of different temperatures on the equivalent stress of the aluminum liner in the Type 3 pressure vessels at a 55 MPa internal pressure under an absolute vacuum: (a) −40 °C, (b) 0 °C, (c) 22 °C, and (d) 150 °C.
Processes 13 01429 g024aProcesses 13 01429 g024b
Figure 25. Maximum principal stress for the composite shell of the Type 3 pressure vessels at a 55 MPa internal pressure under an absolute vacuum at (a) 5 °C, (b) 22 °C, and (c) 300 °C.
Processes 13 01429 g025
Figure 26. IRF value of the composite shell in the Type 3 pressure vessels with an Aluminum 6061 T6 liner using 64 composite layers at a 55 MPa internal pressure under an absolute vacuum.
Processes 13 01429 g026
Figure 27. Composite failure modes using Ansys ACP (Post) for Type 3 pressure vessels at 55 MPa internal pressure under absolute vacuum: (a) matrix and fiber failure at 0 °C, (b) delamination failure at 0 °C, (c) matrix and fiber failure at 245 °C, and (d) delamination failure at 245 °C.
Processes 13 01429 g027aProcesses 13 01429 g027b
Figure 28. Equivalent stress of the Aluminum 6061 T6 Type 1 pressure vessels at different vessel thicknesses at a 55 MPa internal pressure and an absolute vacuum.
Processes 13 01429 g028
Figure 29. Equivalent stress of the Aluminum 6061 T6 Type 1 pressure vessels (37.17 mm thickness) at a 55 MPa internal pressure under an absolute vacuum at different temperatures and its corresponding ultimate tensile strength [38].
Processes 13 01429 g029
Figure 30. Maximum equivalent stress distribution in the studied pressure vessels subjected to an internal pressure of 55 MPa under an absolute vacuum, as evaluated through random vibration analysis with a power spectral density (PSD) input that ranged from 20 to 2000 Hz (g2/Hz): (a) Y-direction for the Type 4, (b) Y-direction for the Type 3, and (c) Z-direction for the Type 1.
Processes 13 01429 g030aProcesses 13 01429 g030b
Table 1. Properties of Aluminum 6061 T6 and Nylon 6.
PropertyAl-6061 T6 ValueNylon 6 Value
Density2710 kg m−31140 kg m−3
Coefficient of thermal expansion2.33 × 10−5 C−10.000147 C−1
Young’s modulus68,300 MPa1060 MPa
Poisson’s ratio0.330.35
Bulk modulus66,960 MPa1178 MPa
Shear modulus25,677 MPa392.59 MPa
Tensile yield strength259 MPa43.1 MPa
Tensile ultimate strength313 MPa49.7 MPa
Isotropic thermal conductivity160 J m−1 S C−10.243 J m−1 S C−1
Table 2. Properties of epoxy-carbon unidirectional prepreg composite.
PropertyValue
Density1540 kg m−3
Coefficient of thermal expansion X-direction−4 × 10⁷ C−1
Coefficient of thermal expansion Y-direction3 × 105 C−1
Coefficient of thermal expansion Z-direction3 × 105 C−1
Young’s modulus X-direction209 GPa
Young’s modulus Y-direction9450 MPa
Young’s modulus Z-direction9450 MPa
Poisson’s ratio XY0.27
Poisson’s ratio YZ0.4
Poisson’s ratio XZ0.27
Shear modulus XY5500 MPa
Shear modulus YZ3900 MPa
Shear modulus XZ5500 MPa
Tensile X-direction1979 MPa
Tensile Y-direction26 MPa
Tensile Z-direction26 MPa
Compressive X-direction−893 MPa
Compressive Y-direction−139 MPa
Compressive Z-direction−139 MPa
Shear XY100 MPa
Shear YZ50 MPa
Shear XZ100 MPa
Table 3. Different vacuum levels and their corresponding pressures.
Type of VacuumPressurePressure
Atmospheric pressure760 Torr101 KPa
Medium vacuum0.75 to 7.5 × 10⁻⁴ Torr100 Pa to 0.1 Pa
High vacuum7.5 × 10−4 to 7.5 × 10⁻⁹ Torr0.1 Pa to 1 µPa
Ultra-high vacuum7.5 × 10−9 to 7.5 × 10⁻¹⁵ Torr1 µPa to 1 pPa
Outer space1 × 10−6 to <3 × 10⁻¹⁷ Torr100 µPa to <3 fPa
Absolute vacuum0 Torr0 Pa
Table 4. Calculation results of the isotensoid equation parameters.
xrroaDYYrm∆r∆x
0.0006.000 0.00
0.1615.9922.05210.34910.050.053.21680.00800.1606
0.3215.9762.05210.34960.050.103.22530.01610.1605
0.4815.9522.05210.35050.050.153.23830.02420.1601
0.6415.9192.05210.35200.050.203.25600.03230.1596
0.8005.8792.05210.35400.050.253.27860.04060.1588
0.9585.8302.05210.35660.050.303.30620.04890.1579
1.1145.7732.05210.35970.050.353.33920.05730.1568
1.2705.7072.05210.36340.050.403.37800.06580.1556
1.4245.6322.05210.36780.050.453.42310.07440.1541
1.5775.5492.05210.37290.050.503.47500.08330.1525
1.7275.4572.05210.37880.050.553.53450.09240.1507
1.8765.3552.05210.38550.050.603.60250.10170.1487
2.0225.2442.05210.39330.050.653.68010.11140.1465
2.1665.1222.05210.40210.050.703.76880.12140.1441
2.3084.9902.05210.41220.050.753.87030.13190.1416
2.4474.8472.05210.42380.050.803.98710.14300.1389
2.5834.6932.05210.43710.050.854.12240.15490.1360
2.7164.5252.05210.45260.050.904.28060.16770.1330
2.8464.3432.05210.47070.050.954.46790.18170.1299
2.9734.1462.05210.49210.051.004.69370.19750.1268
3.0963.9302.05210.51780.051.054.97290.21570.1237
3.2173.6922.05210.54940.051.105.33130.23760.1209
3.3363.4272.05210.58930.051.155.82020.26560.1189
3.4553.1212.05210.64210.051.206.56330.30590.1189
3.5812.7422.05210.71750.051.257.99250.37920.1260
3.7702.0622.05210.84580.051.3014.11550.68010.1888
Table 5. Natural frequencies at different modes obtained through the modal analysis for the studied pressure vessels at a 55 MPa internal pressure under an absolute vacuum.
ModeNatural Frequency (Hz)
Type 4Type 3Type 1
11219.31318.71337.5
21237.91319.11337.9
31472.11603.71346.8
41476.31603.81347
51543.91803.91934.5
62212.12424.62198.4
72217.62424.82199
82249.726732579.2
92264.42674.12579.5
102344.73057.22640.2
Table 6. Directional deformation and maximum equivalent stress from random vibration analyses in the X-, Y-, and Z-directions for the studied pressure vessels at an internal pressure of 55 MPa under an absolute vacuum, based on a PSD input (g2/Hz) that spanned 20–2000 Hz.
PV TypeDirectional Deformation (mm) and Stress (MPa)Applied Acceleration Direction
X-DirectionY-DirectionZ-Direction
Type 4Deformation in x-axis0.000823620.00139820.0019027
Deformation in y-axis0.000357560.0112870.0015782
Deformation in z-axis0.00129990.00106650.010233
Max. equivalent stress 0.704854.8932.6965
Type 3Deformation in x-axis1.1943 × 10−70.000367970.00037268
Deformation in y-axis8.6522 × 10−60.00798780.00010934
Deformation in z-axis8.6522 × 10−60.0079878 0.0079926
Max. equivalent stress 0.00598243.17852.9186
Type 1Deformation in x-axis7.8567 × 10−70.00129130.0012923
Deformation in y-axis4.6769 × 10−60.00792580.00028163
Deformation in z-axis4.0303 × 10−60.000282070.0079352
Max. equivalent stress 0.00341025.70576.0952
Table 7. Operating temperature limits and weights of the studied pressure vessel types.
PV TypeOperating Temperature LimitsWeight
Type 410–100 °C56.2 kg
Type 30–145 °C63.7 kg
Type 1−55–54 °C106 kg
Disclaimer/Publisher’s Note: The statements, opinions and data contained in all publications are solely those of the individual author(s) and contributor(s) and not of MDPI and/or the editor(s). MDPI and/or the editor(s) disclaim responsibility for any injury to people or property resulting from any ideas, methods, instructions or products referred to in the content.

