Article

Aerodynamic Characteristics of Typical Operating Conditions and the Impact of Inlet Flow Non-Uniformity in a Multi-Stage Transonic Axial Compressor

1
AECC Sichuan Gas Turbine Estab, Mianyang 621000, China
2
School of Energy and Power Engineering, Chongqing University, Chongqing 400044, China
3
Key Laboratory of Low-Grade Energy Utilization Technologies and Systems, Chongqing University, Ministry of Education, Chongqing 400030, China
*
Author to whom correspondence should be addressed.
Processes 2025, 13(5), 1428; https://doi.org/10.3390/pr13051428
Submission received: 30 March 2025 / Revised: 29 April 2025 / Accepted: 30 April 2025 / Published: 7 May 2025
(This article belongs to the Special Issue Numerical Simulation of Flow and Heat Transfer Processes)

Abstract

:
Multi-stage axial compressors play a crucial role in aerospace propulsion systems, as their exit flow field characteristics directly impact engine performance and stability. This study conducted numerical simulations on the first 3.5 stages of the NASA 74A transonic multi-stage axial compressor to analyze the exit flow field characteristics under different typical operating conditions. The research primarily investigated airflow deflection angle, radial velocity distribution, and their variation patterns. Additionally, the effects of inlet airflow angle and pressure variations on the exit flow field under non-uniform inlet conditions were examined in detail. The results indicate that at 68% rotational speed, the exit flow field of the NASA 74A compressor deteriorates significantly, with noticeable changes in distribution patterns. For the other four operating conditions, as the rotational speed decreases, both velocity and airflow angle exhibit a positive correlation with rotational speed. Compared to the design condition, peak velocity decreases by 2%, 3.7%, and 7%, while airflow deflection angle changes remain within 3°. Under non-uniform inlet conditions, when the inlet airflow angle decreases from 90° to 70°, variations in peak and average exit velocities remain within 2%, and the changes in peak and average airflow deflection angles are within 1%. However, when the inlet airflow angle decreases from 90° to 70°, the curve of the airflow deflection angle exhibits a leftward shift, with a deviation of 2.6%. Meanwhile, changes in inlet pressure under non-uniform conditions have a relatively minor impact on the overall flow field but significantly affect local distributions. When the inlet pressure increases from 1 atm to 1.05 atm, peak velocity increases by 0.98%, and average velocity rises by 3%. The maximum velocity difference reaches 6%, while the average airflow deflection angle differs by 0.7%, with a maximum deviation of 1.9°. Overall, the compressor exit flow field undergoes significant variations under different operating conditions, with increased flow instability at lower rotational speeds leading to flow separation, low-energy fluid accumulation, and non-uniform pressure distribution. In contrast, non-uniform inlet conditions have a relatively minor effect on the overall flow field but induce noticeable local changes, providing theoretical insights for compressor design optimization and performance evaluation.

1. Introduction

The multi-stage axial-flow compressor is one of the most critical components in the aerospace power system. The flow field information at the compressor outlet not only serves as an indicator of overall engine performance but also provides essential inlet boundary conditions for subsequent analyses of the aerodynamic and thermal performance of the combustion chamber, turbine, and other components. Additionally, it serves as the target flow field for the combustion chamber inlet simulation device in ground tests [1,2,3].
Furthermore, during the actual operation of an aero-engine, the inlet conditions of the compressor may not always remain uniform. For example, inlet distortion [4,5,6,7] can alter both the velocity and direction of the incoming airflow, thereby affecting the compressor’s stability and efficiency. Therefore, conducting an in-depth study of the compressor outlet flow field characteristics through numerical simulation is crucial for optimizing blade design, improving compressor efficiency, and enhancing overall engine performance [8].
Scholars worldwide have conducted extensive research on the flow field characteristics of various types of pressurized engines using different methodologies. Liu et al. [9] employed parallel algorithms to perform numerical simulations on an 8.5-stage axial-flow pressurized engine under steady and unsteady flow conditions. The results closely matched experimental data, with an error margin of only 1–2%. Jiang et al. [10] numerically simulated the three-dimensional turbulent flow field in the impeller of a multi-stage axial pressurized gasifier. They utilized a high-precision, high-resolution third-order ENN scheme to accurately capture excitation waves and turbulent flow characteristics, and applied the LU-SGS implicit solution method to enhance computational speed, forming an accurate and efficient numerical solution system for turbulent flow in a multi-stage transonic axial pressurized gasifier.
Similarly, Jia et al. [11] simulated the Rotor 37 transonic compressor stage and compared the calculated flow field with experimental results. The combination of the multi-step Runge–Kutta method and a finite difference scheme demonstrated advantages in terms of rapid convergence and practical feasibility. Wang et al. [12] investigated an 11-stage axial-flow compressor, conducting numerical simulations of its modeling and flow field using three-dimensional computational software. They analyzed the characteristics under design conditions, varying operating conditions, and different guide vane installation angles. The resulting flow–pressure ratio and flow efficiency characteristic curves were compared with experimental test data, with the errors remaining within the allowable range.
The intake air of a pressurized gas compressor is typically subject to various disturbances that create inhomogeneous intake airflow fields. These inlet variations significantly affect the pressurized air, primarily through non-uniform total pressure [13], total temperature [14], and cyclonic flow [15] at the inlet, which lead to deteriorations in aerodynamic performance, stability margins, and overall flow characteristics. Pan et al. [16] experimentally investigated the instability evolution of the compressor under circumferential non-uniform inlet conditions. Two stall inception modes with different spatial scales and initial locations were analyzed to assess their impact on compressor stability. Dong et al. [17] assumed a uniform static pressure at the inlet and converted temperature variations into pressure variations to determine the static pressure distribution at the outlet. Kikuchi et al. [18] conducted a full-channel numerical simulation and experimental study of a transonic pressurized aircraft. Jerez et al. [19] carried out a full-channel non-stoichiometric study of the NASA Rotor 67. Sun et al. [20,21] performed a numerical simulation of a transonic fan under three-dimensional unsteady conditions, investigating total pressure distortion at different distortion degrees and angles. They analyzed and summarized the changes in flow field characteristics and system parameters under various total pressure distortion conditions. Gao et al. [22] studied the intake total pressure distortion effects on the fan booster stage performance of a high-bypass-ratio turbofan engine. The results showed that inlet total pressure distortion elevates the operating point of the outer fan, thereby reducing its surge margin. Compared with uniform inlet conditions, total pressure distortion increases both the corrected mass flow rate and pressure ratio, with the corrected mass flow rate increasing by approximately 0.2% to 1% as the corrected rotational speed varies from 0.3 to 0.8.
Current research on the NASA 74A is primarily focused on aerodynamic performance optimization, surge boundary prediction, thermodynamic and structural optimization, guide vane adjustment optimization, and optimization under high-load operating conditions. Wang et al. [23] investigated the first 3.5 stages of a NASA 74A pressurized air compressor, utilizing the source term method to explore the effects of inter-stage air injection on overall performance and internal flow characteristics. The increase in gas flow, resulting from a reduction in the inlet flow incidence angle and the mitigation of flow separation at the trailing edge of the blade, was identified as a key factor in enhancing efficiency. Additionally, induced gas contributed to an increased stability margin for the pressurized compressor. Zhang et al. [24] developed a performance prediction and guide vane optimization method for multi-stage axial-flow compressors based on a one-dimensional flow model and optimization methods. The method was validated using the NASA 74A compressor. The results show that the method accurately predicts performance and improves efficiency, with significant application value for compressor design and regulation.
In this study, high-fidelity numerical simulations based on computational fluid dynamics methods were performed for the first 3.5 stages of the NASA 74A transonic multi-stage axial compressor to analyze the flow field characteristics at the compressor outlet under varying rotational speeds. Particular emphasis was placed on studying airflow deflection angles, radial velocity distribution, and their variation patterns. Through simulations of typical operating conditions—including design point, climb, cruise, approach, and ground idle—the impact of rotational speed variations on the outlet flow structure of the pressurized air compressor was examined. The findings aim to provide theoretical support for the design optimization and performance evaluation of pressurized air compressors. Furthermore, this study explored the variations in the outlet flow field under non-uniform inlet conditions, investigating how different inlet airflow angles and pressure conditions affect the outlet velocity distribution and airflow deflection angles.

2. Numerical Analysis
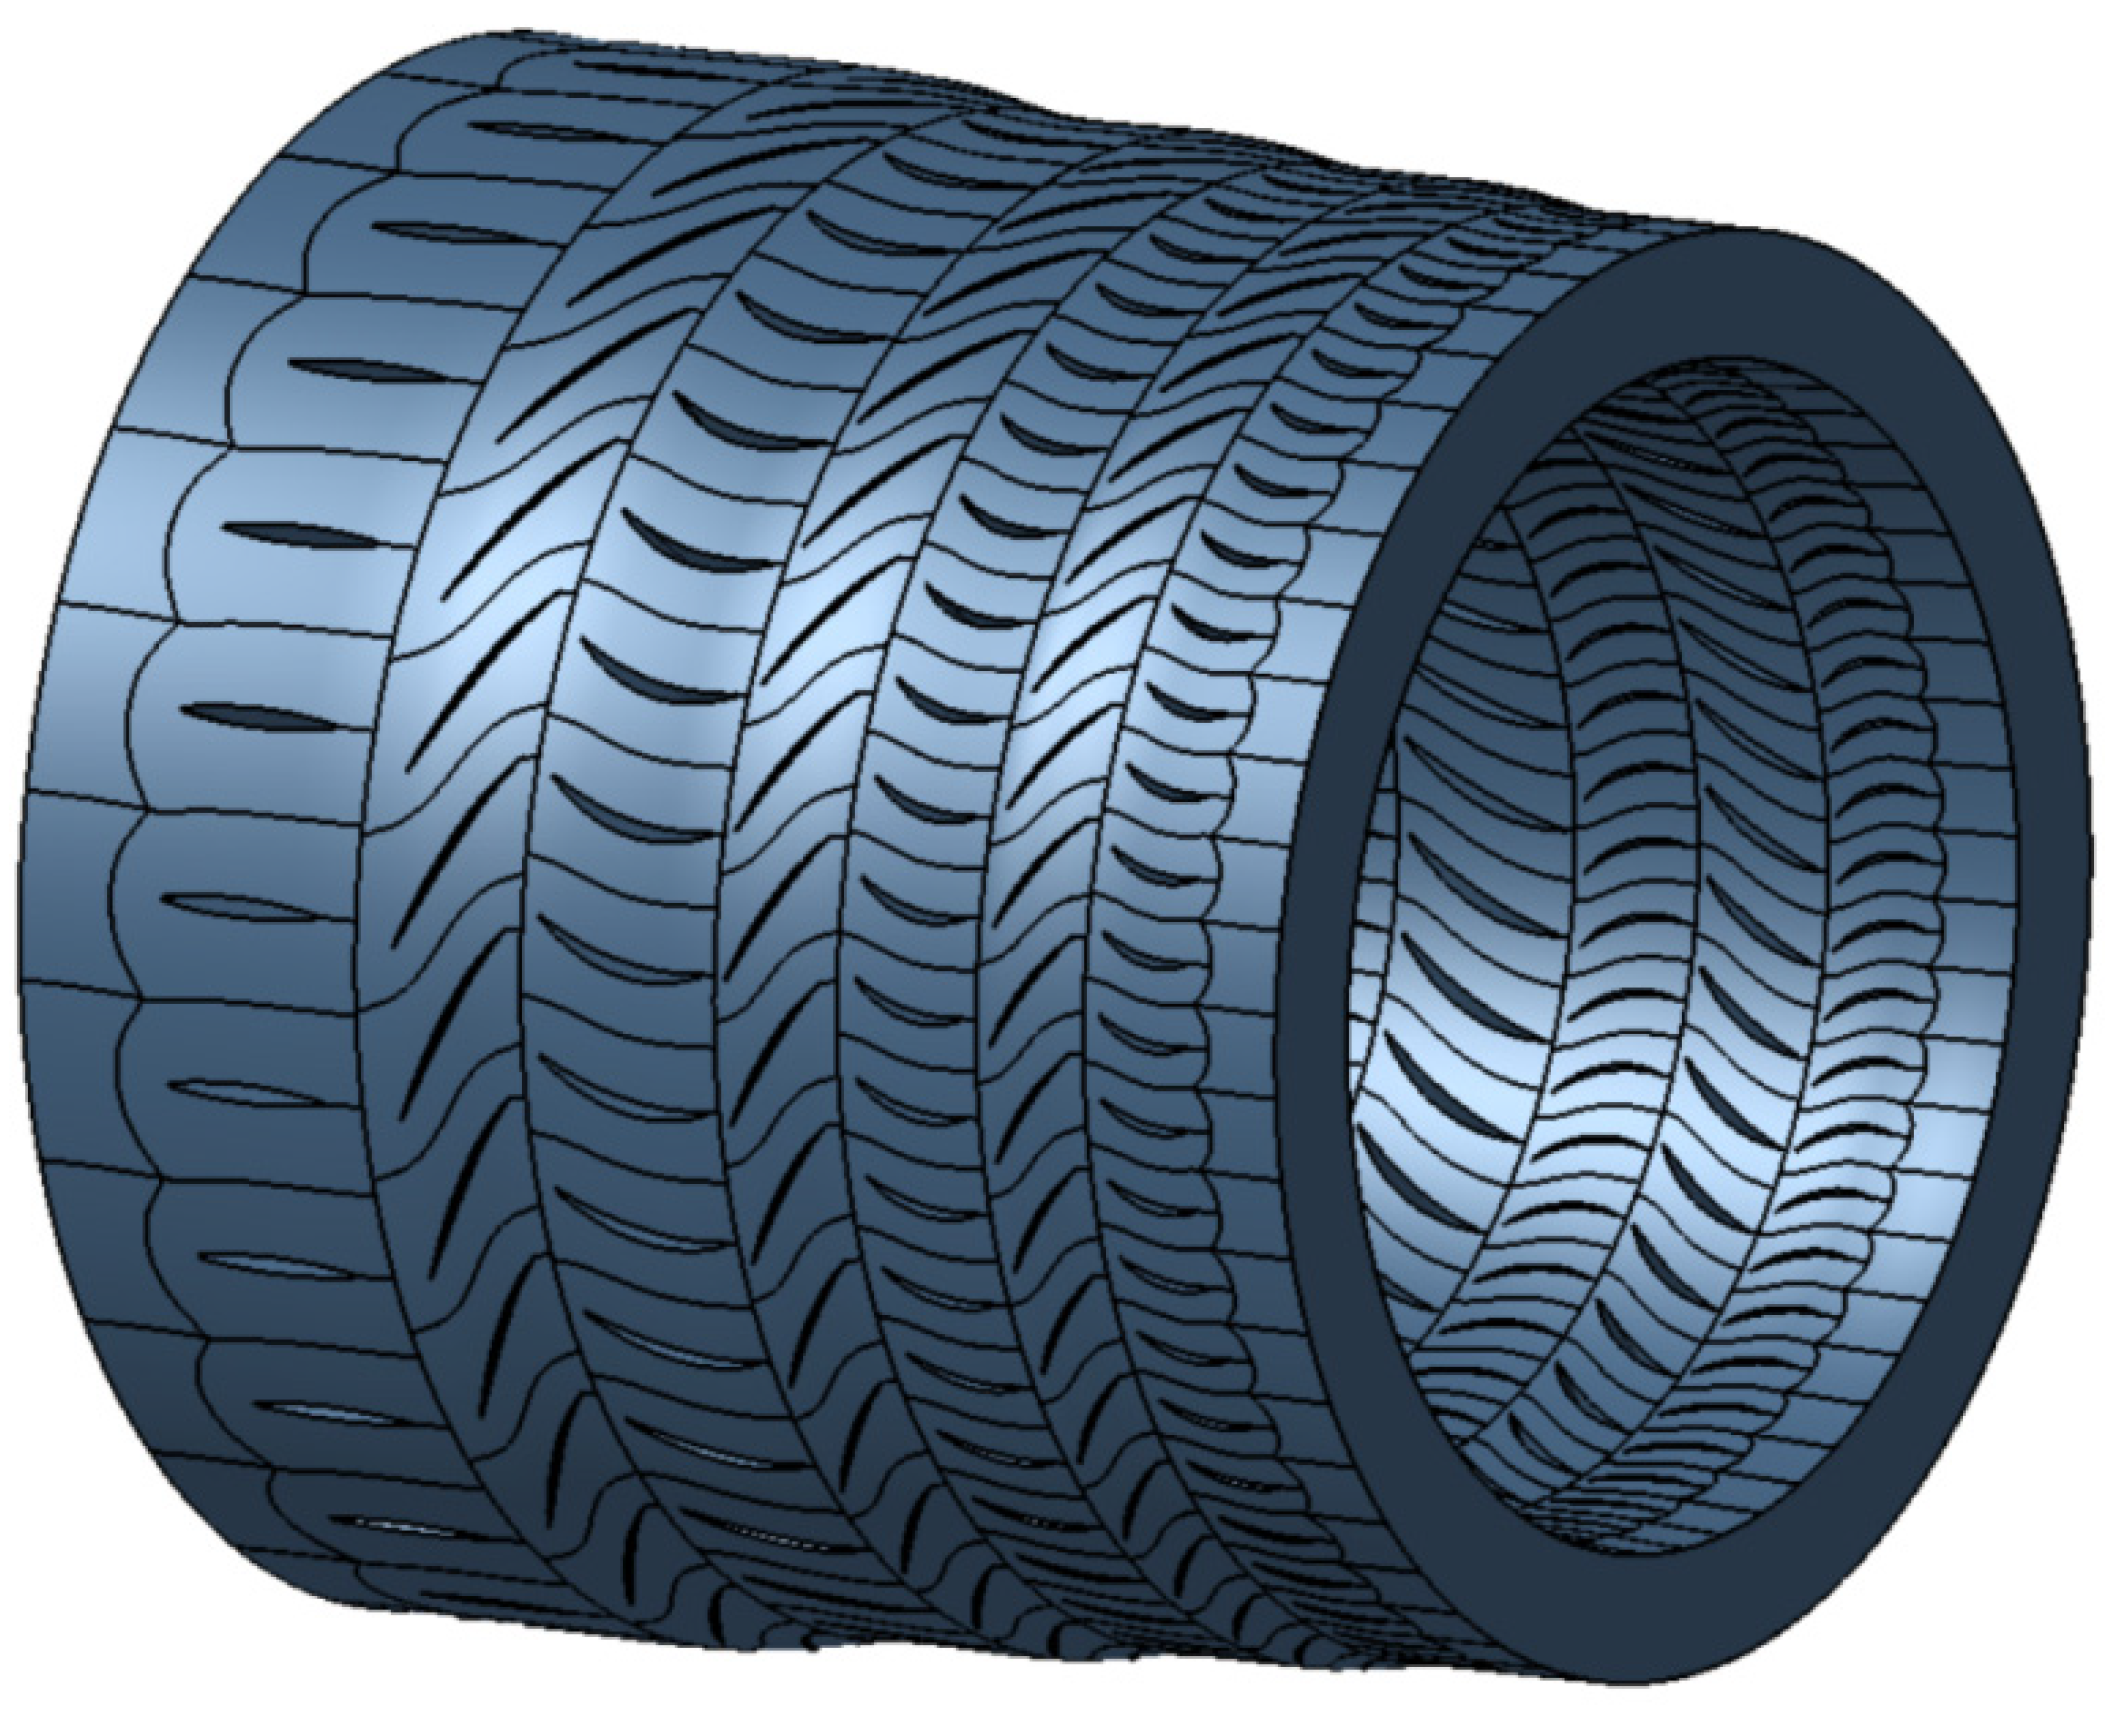
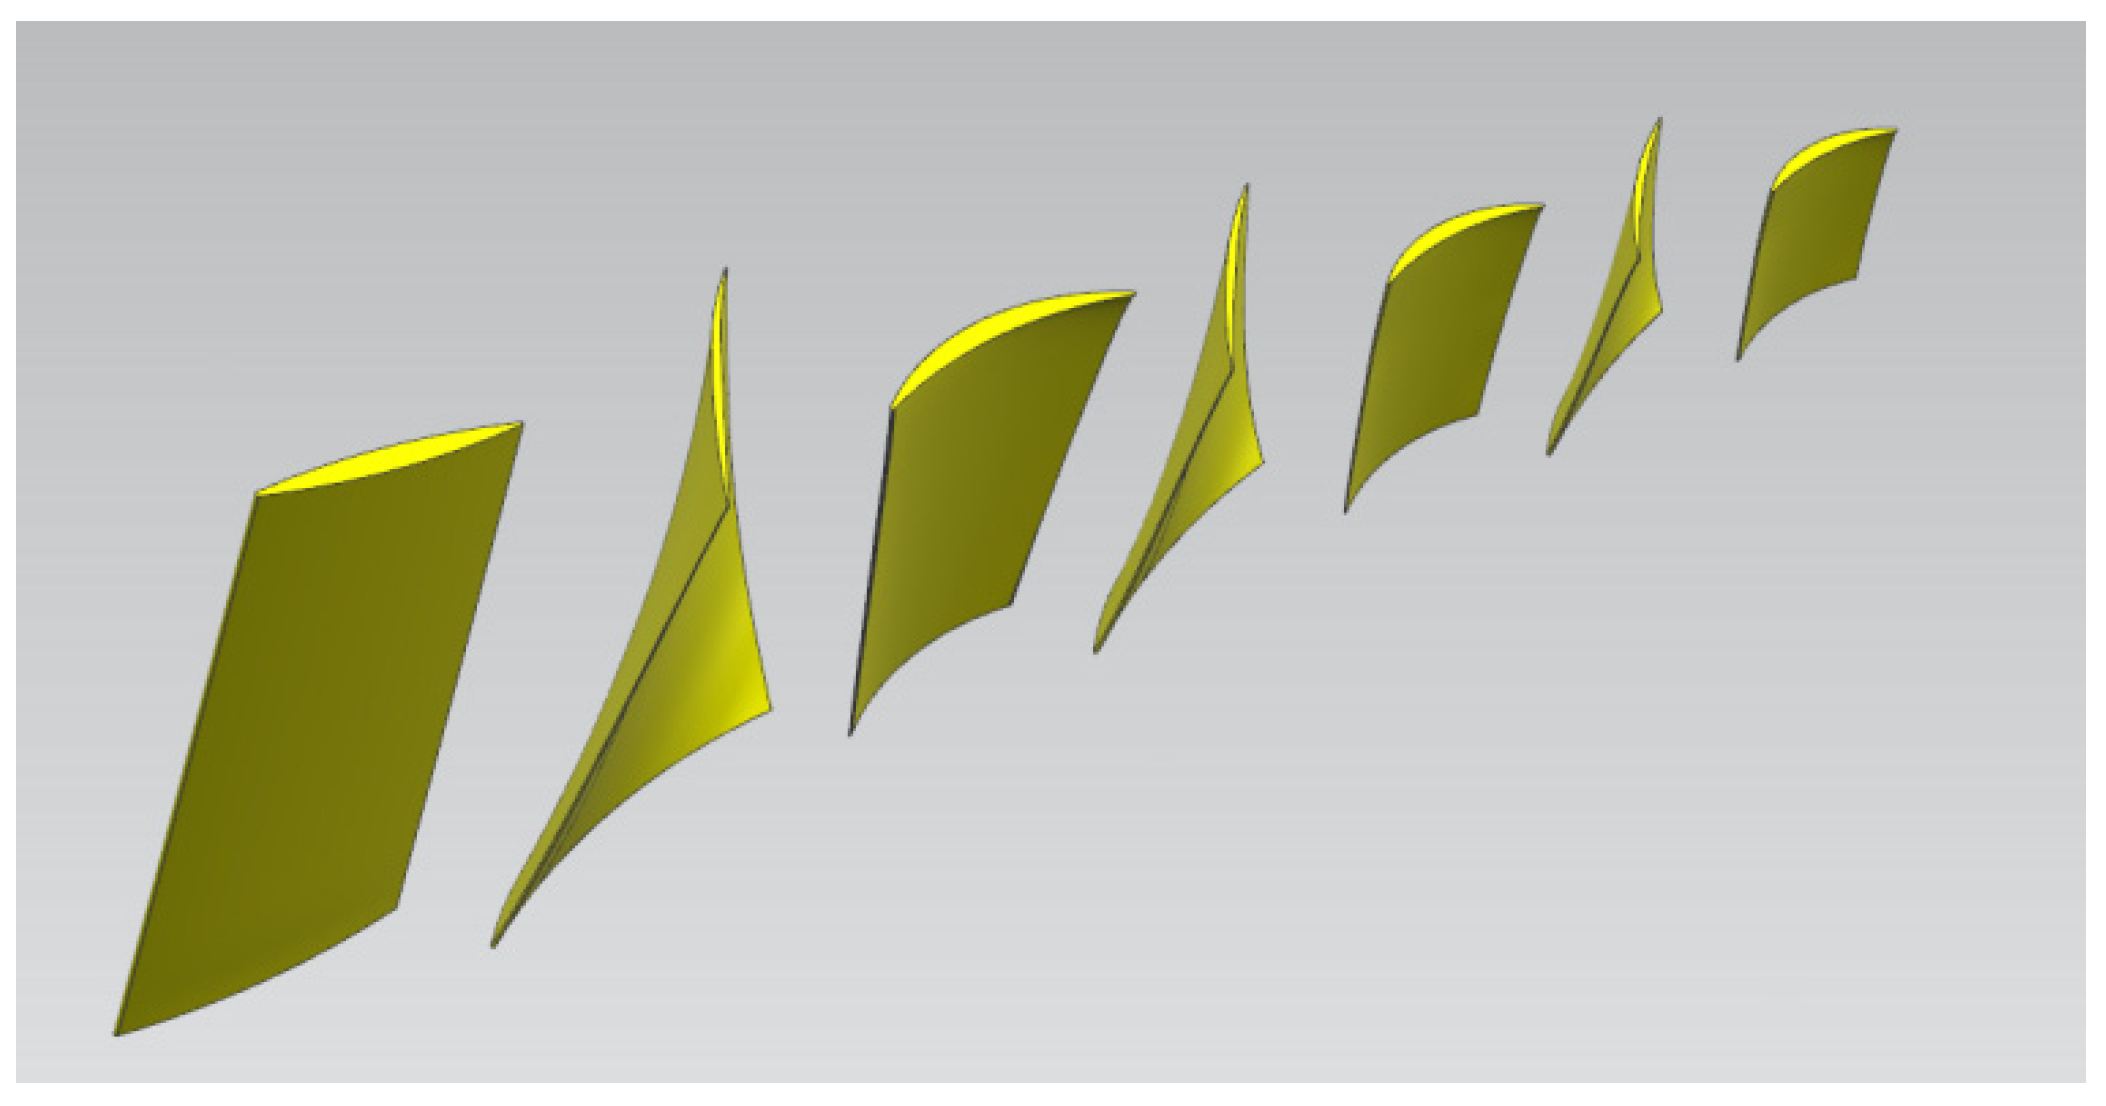
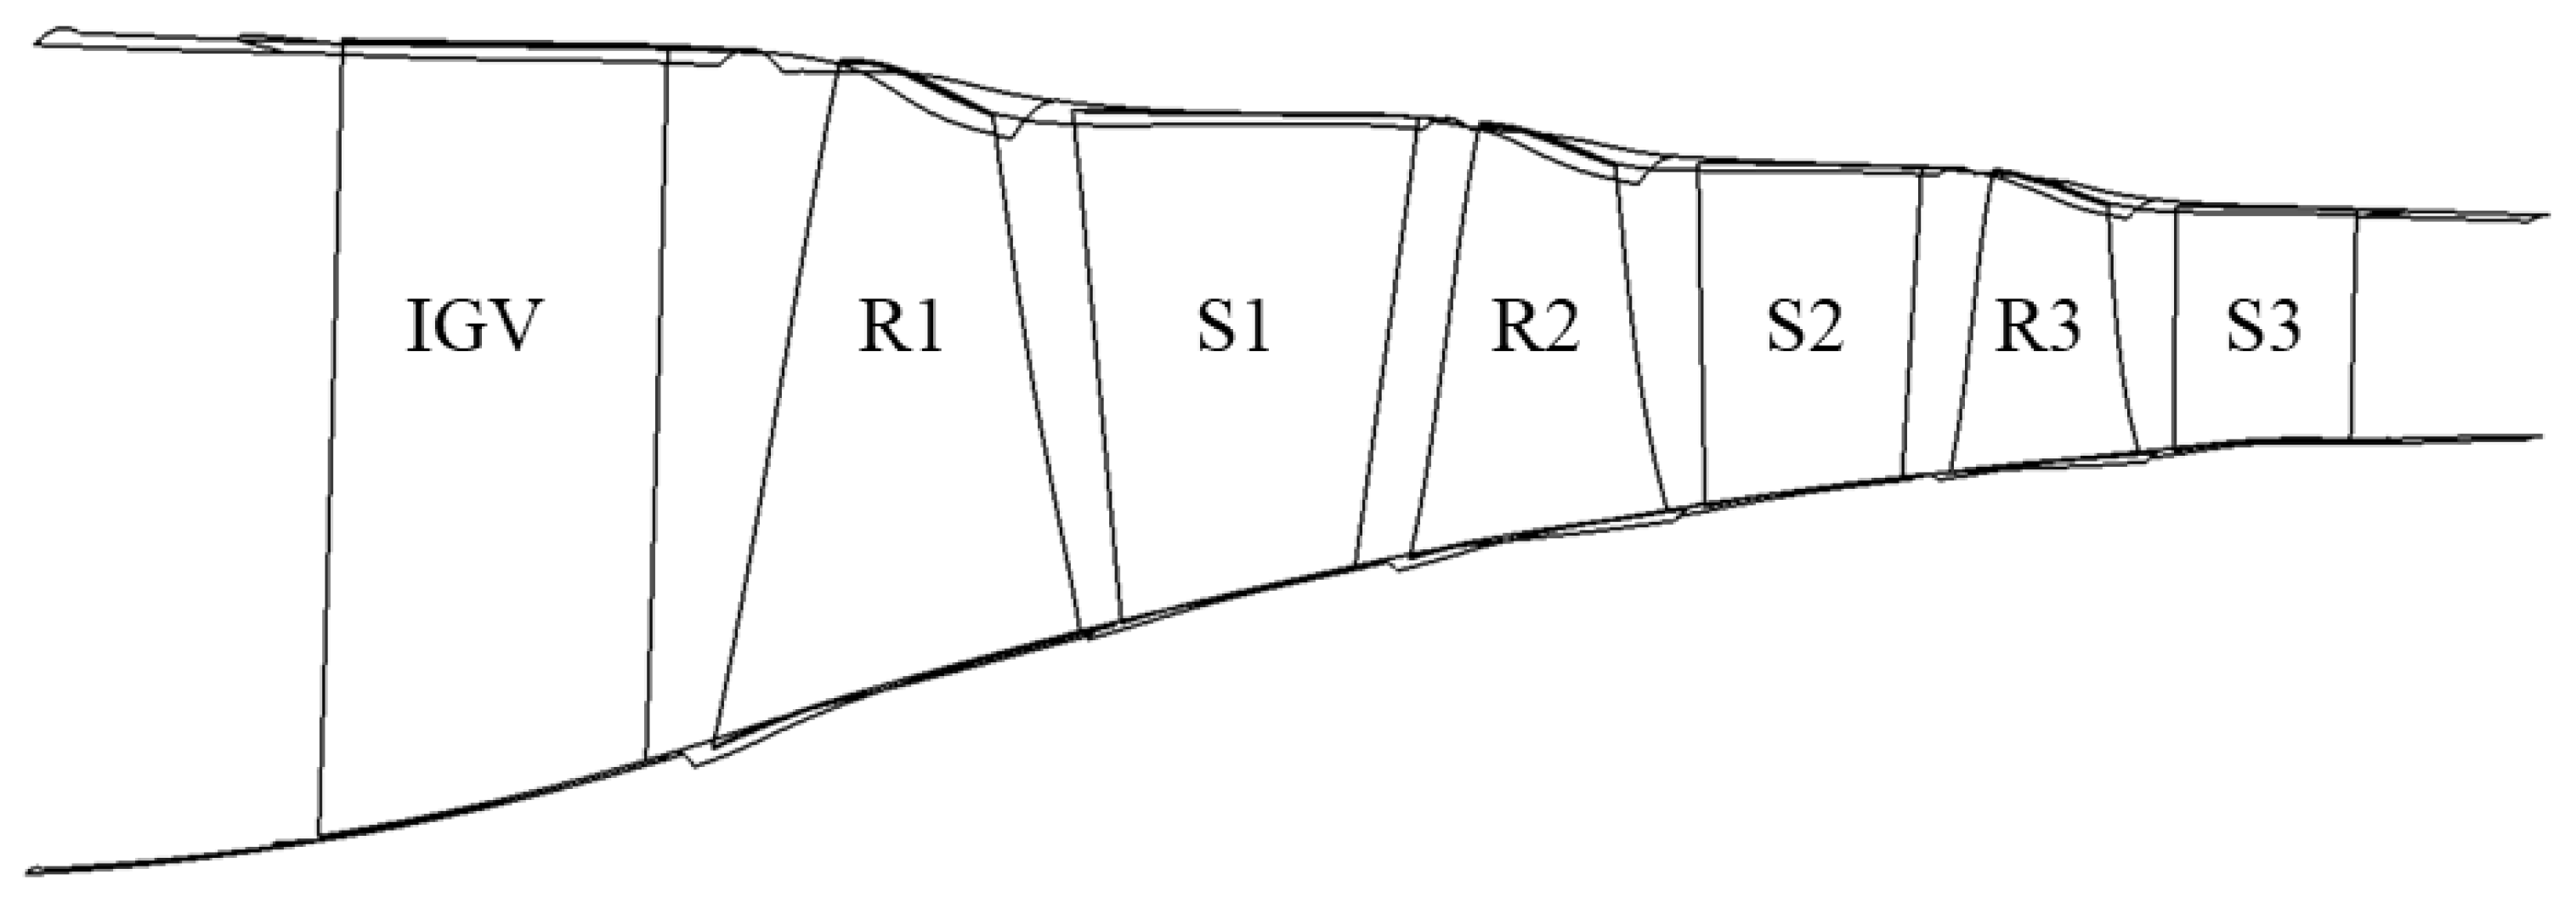
2.1. Physical Model

In this study, the first 3.5 stages (comprising the inlet guide vane and the first three stages) of the NASA 74A transonic axial-flow compressor were selected for analysis. The NASA 74A, a multi-stage axial-flow compressor developed by the National Aeronautics and Space Administration for aerodynamic performance studies of aero-engines and turbomachinery, is designed for experiments involving high pressure ratios and high loads. This compressor provides valuable data on airflow characteristics, flow separation, airflow angles, and aerodynamic efficiency.
Table 1 presents the main design parameters of the first three stages of the NASA 74A. Numerical simulations were conducted using Numeca software (version 16.1), while the compressor was modeled in UG software (version 10.0) based on the original 1986 NASA report by Steinke et al. [25].
The blade structural parameters—including chord length, mounting angle, axial position of key points, blade angle, and blade thickness—were used for blade cross-sectioning. Additionally, the line connecting the positions of maximum thickness along the arcs in the blade pattern was designated as the radial stacking line. Figure 1 and Figure 2 illustrate the results of the blade modeling, while Figure 3 provides a schematic diagram of the NASA 74A radial runner.

2.2. Numerical Model

The internal flow of the NASA 74A, which is the subject of analysis in this study, is a viscous, compressible gas flow. The conservation equations for mass, momentum, and energy are expressed in the following forms [26,27,28,29,30,31]:
ρ t + × ρ v = 0
t ρ v + × ρ v v = × p I k + Γ
t ρ E + × ρ v E = × p I k + Γ × v × q
In this context, I = { δ i j } represents the identity tensor, while   Γ = { τ i j } denotes the viscous stress tensor.
For a Newtonian fluid, the following equation holds:
τ i j = 2 3 μ u k x k δ i j + μ u i x j + u j x i
a = a i represents the heat flux vector. For a heated fluid, Fourier’s law of heat conduction applies, which yields the following:
q = K × T
E = e + 1 2 v × v represents the total energy per unit mass of the fluid, while e denotes the internal energy per unit mass flow. v is the velocity vector, K is the thermal conductivity, and T represents the temperature.
The above equations are also known as the Navier–Stokes equations for a compressible viscous gas, neglecting body forces.
For a compressible gas, the governing equations are the following:
P ρ = R T
In these equations: ρ represents the fluid density, P denotes the pressure, and T is the temperature.
The viscosity coefficient μ varies with temperature, and its value is determined using the Sutherland equation:
μ T μ 0 = T T 0 3 2 T 0 + T s T + T s
In these equations, T represents the static temperature, and T 0 is the reference temperature, set at 293.15 K; T s   is the Sutherland constant, which for air is Ts = 110.55 K; μ denotes the dynamic viscosity coefficient, while μ 0 is the viscosity at the reference temperature T 0 , with a value of 1.716 × 10⁻⁵ Pa∙s.

2.3. Parameter Indicators

The radial velocity refers to the total velocity of airflow in the radial direction and is denoted by V.
In a multi-stage axial-flow compressor, the airflow deflection angle represents the degree of change in the flow direction after passing through the compressor blades. This parameter significantly impacts compressor performance. In existing research, two common methods are used to express the airflow deflection angle:
(1) the angle between the airflow direction and the axial direction.
(2) the angle between the airflow direction and the circumferential direction. This study adopted the second method, using the angle between the airflow and the circumferential direction, denoted as α.
In subsequent investigations on non-uniform inlet conditions, the presence of an inlet airflow angle in the compressor results in different intake positions at the compressor inlet, exhibiting corresponding deflection angles relative to the circumferential direction.
The equation for the airflow deflection angle is given by the following:
α = a t a n V z V t
Vz represents the axial component of the airflow velocity, while Vt denotes the tangential component of the airflow velocity.
When analyzing velocity and airflow deflection angles at the compressor outlet, a circumferential averaging method is used to obtain parameter distribution curves along the blade height direction.
The airflow in the compressor flow passage typically exhibits strong periodicity and non-uniformity. Due to the influence of blade geometry and flow disturbances, the flow field contains significant circumferential fluctuations. Therefore, compared to directly extracting line segments from the surface, circumferential averaging provides a more representative and smoother flow field characteristic curve, facilitating the analysis of the overall airflow behavior.

3. Verification of the Numerical Method

3.1. Boundary Conditions

The steady-state simulation of the NASA 74A follows the convergence criteria outlined below [18]:
The computational residuals must be less than 10−6.
The inlet and outlet mass flow rates should remain nearly constant or exhibit periodic variations (in cases where large separation vortices exist), with a relative error of less than 0.5%.
Compressor performance parameters, including efficiency, pressure ratio, axial force, and torque, should stabilize.
The flow field simulation was conducted using the FINE™/Turbo solver developed by NUMECA (Brussels, Belgium). The working fluid is treated as ideal air, and the computational approach follows a steady-state, single-passage Reynolds-averaged Navier–Stokes (RANS) method. The Spalart–Allmaras turbulence model was employed. It is particularly well-suited for wall-bounded flow simulations, such as those found in compressors, due to its ability to accurately model boundary layer behavior while maintaining computational efficiency. Spatial discretization was performed using a central difference scheme [32].
Under design conditions, the total inlet pressure was set to 101,325 Pa, and the total inlet temperature was 288.2 K. The outlet average static pressure is specified, and by varying the outlet static pressure, the compressor characteristic curve is obtained. Additionally, by adjusting both rotational speed and outlet static pressure, characteristic curves for different rotational speed conditions are derived.

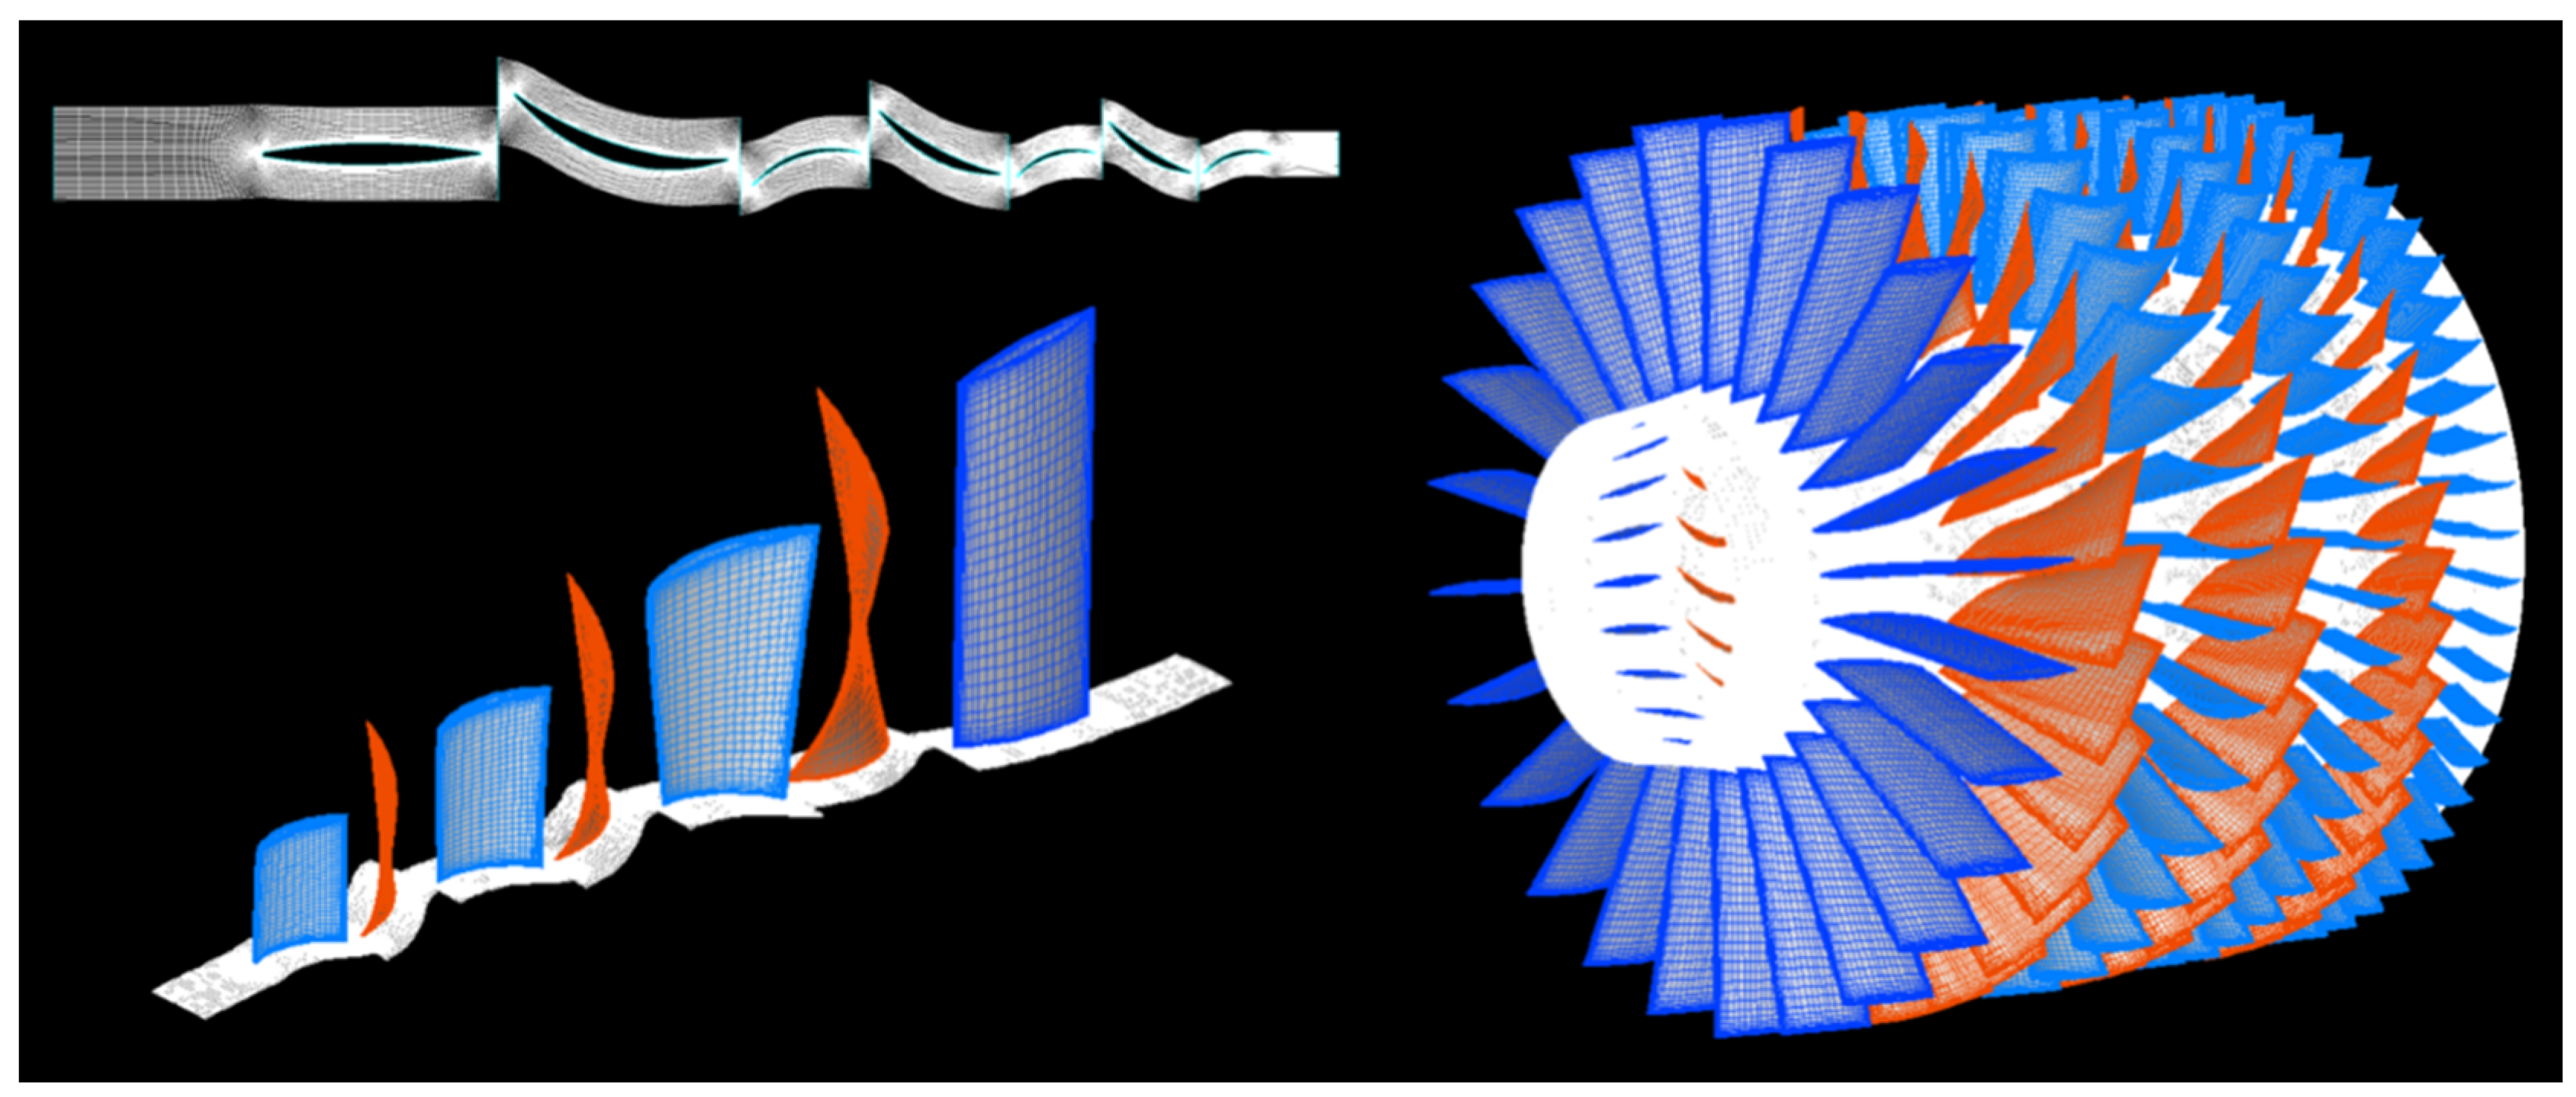
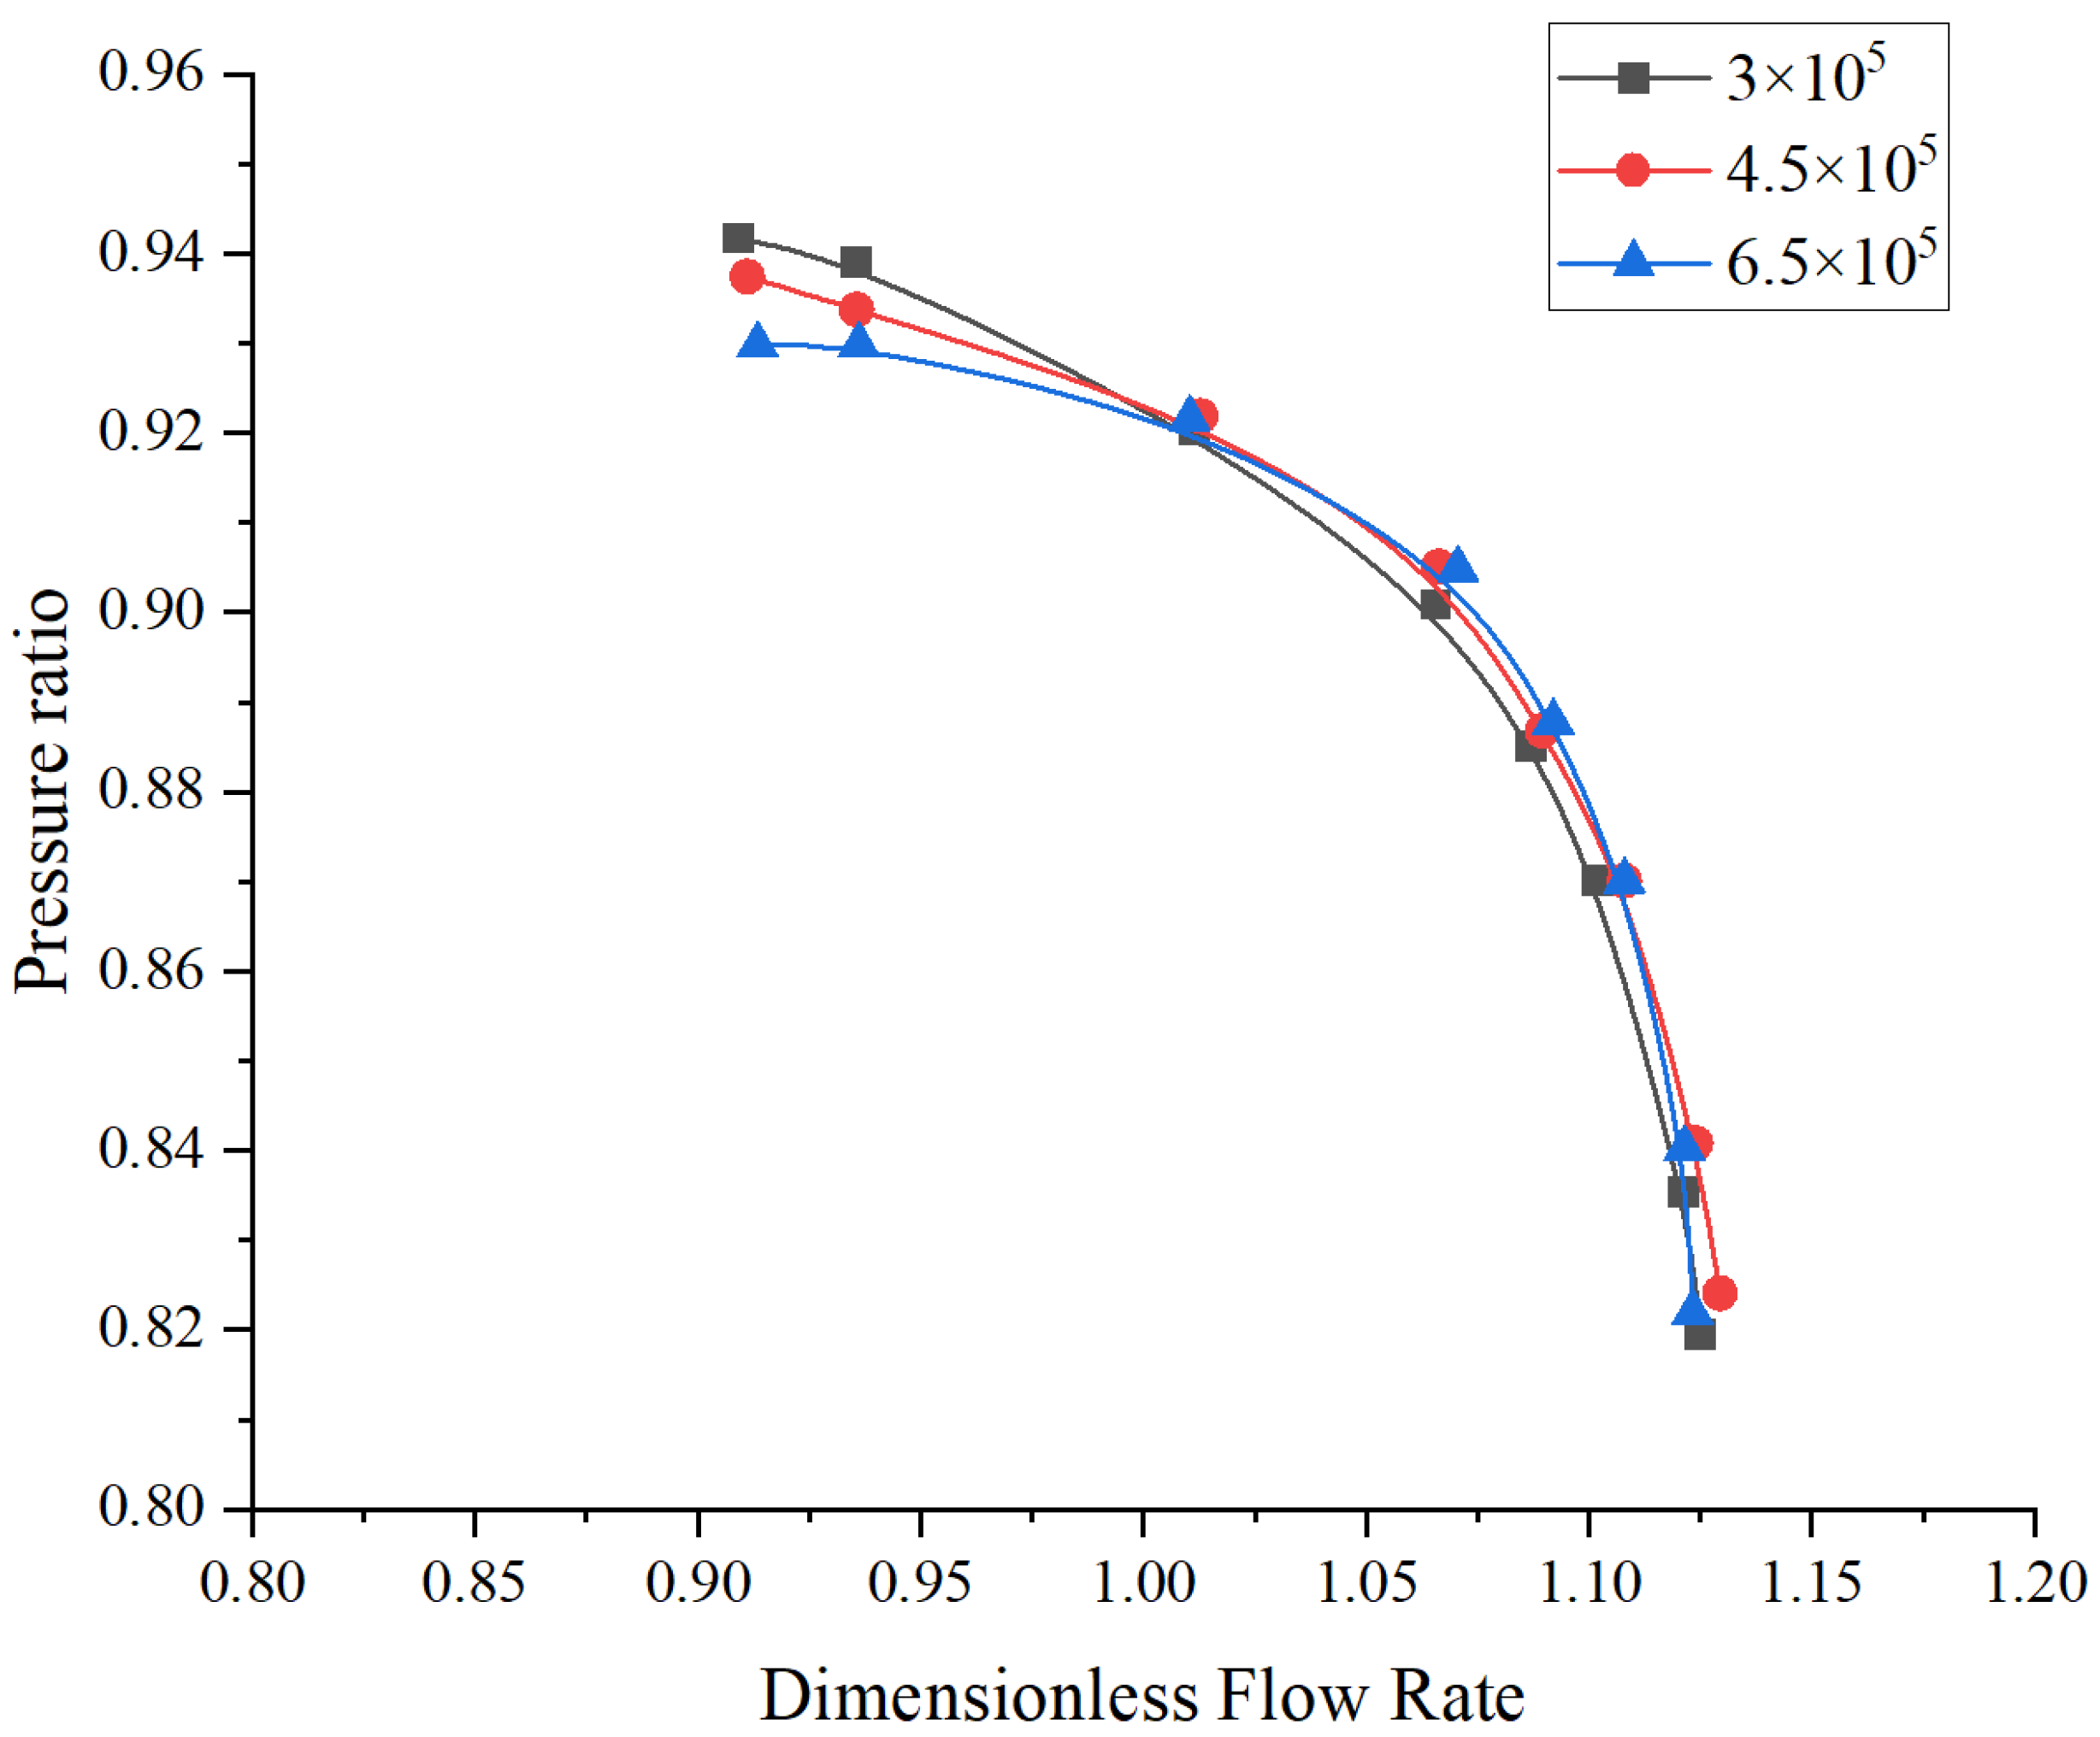
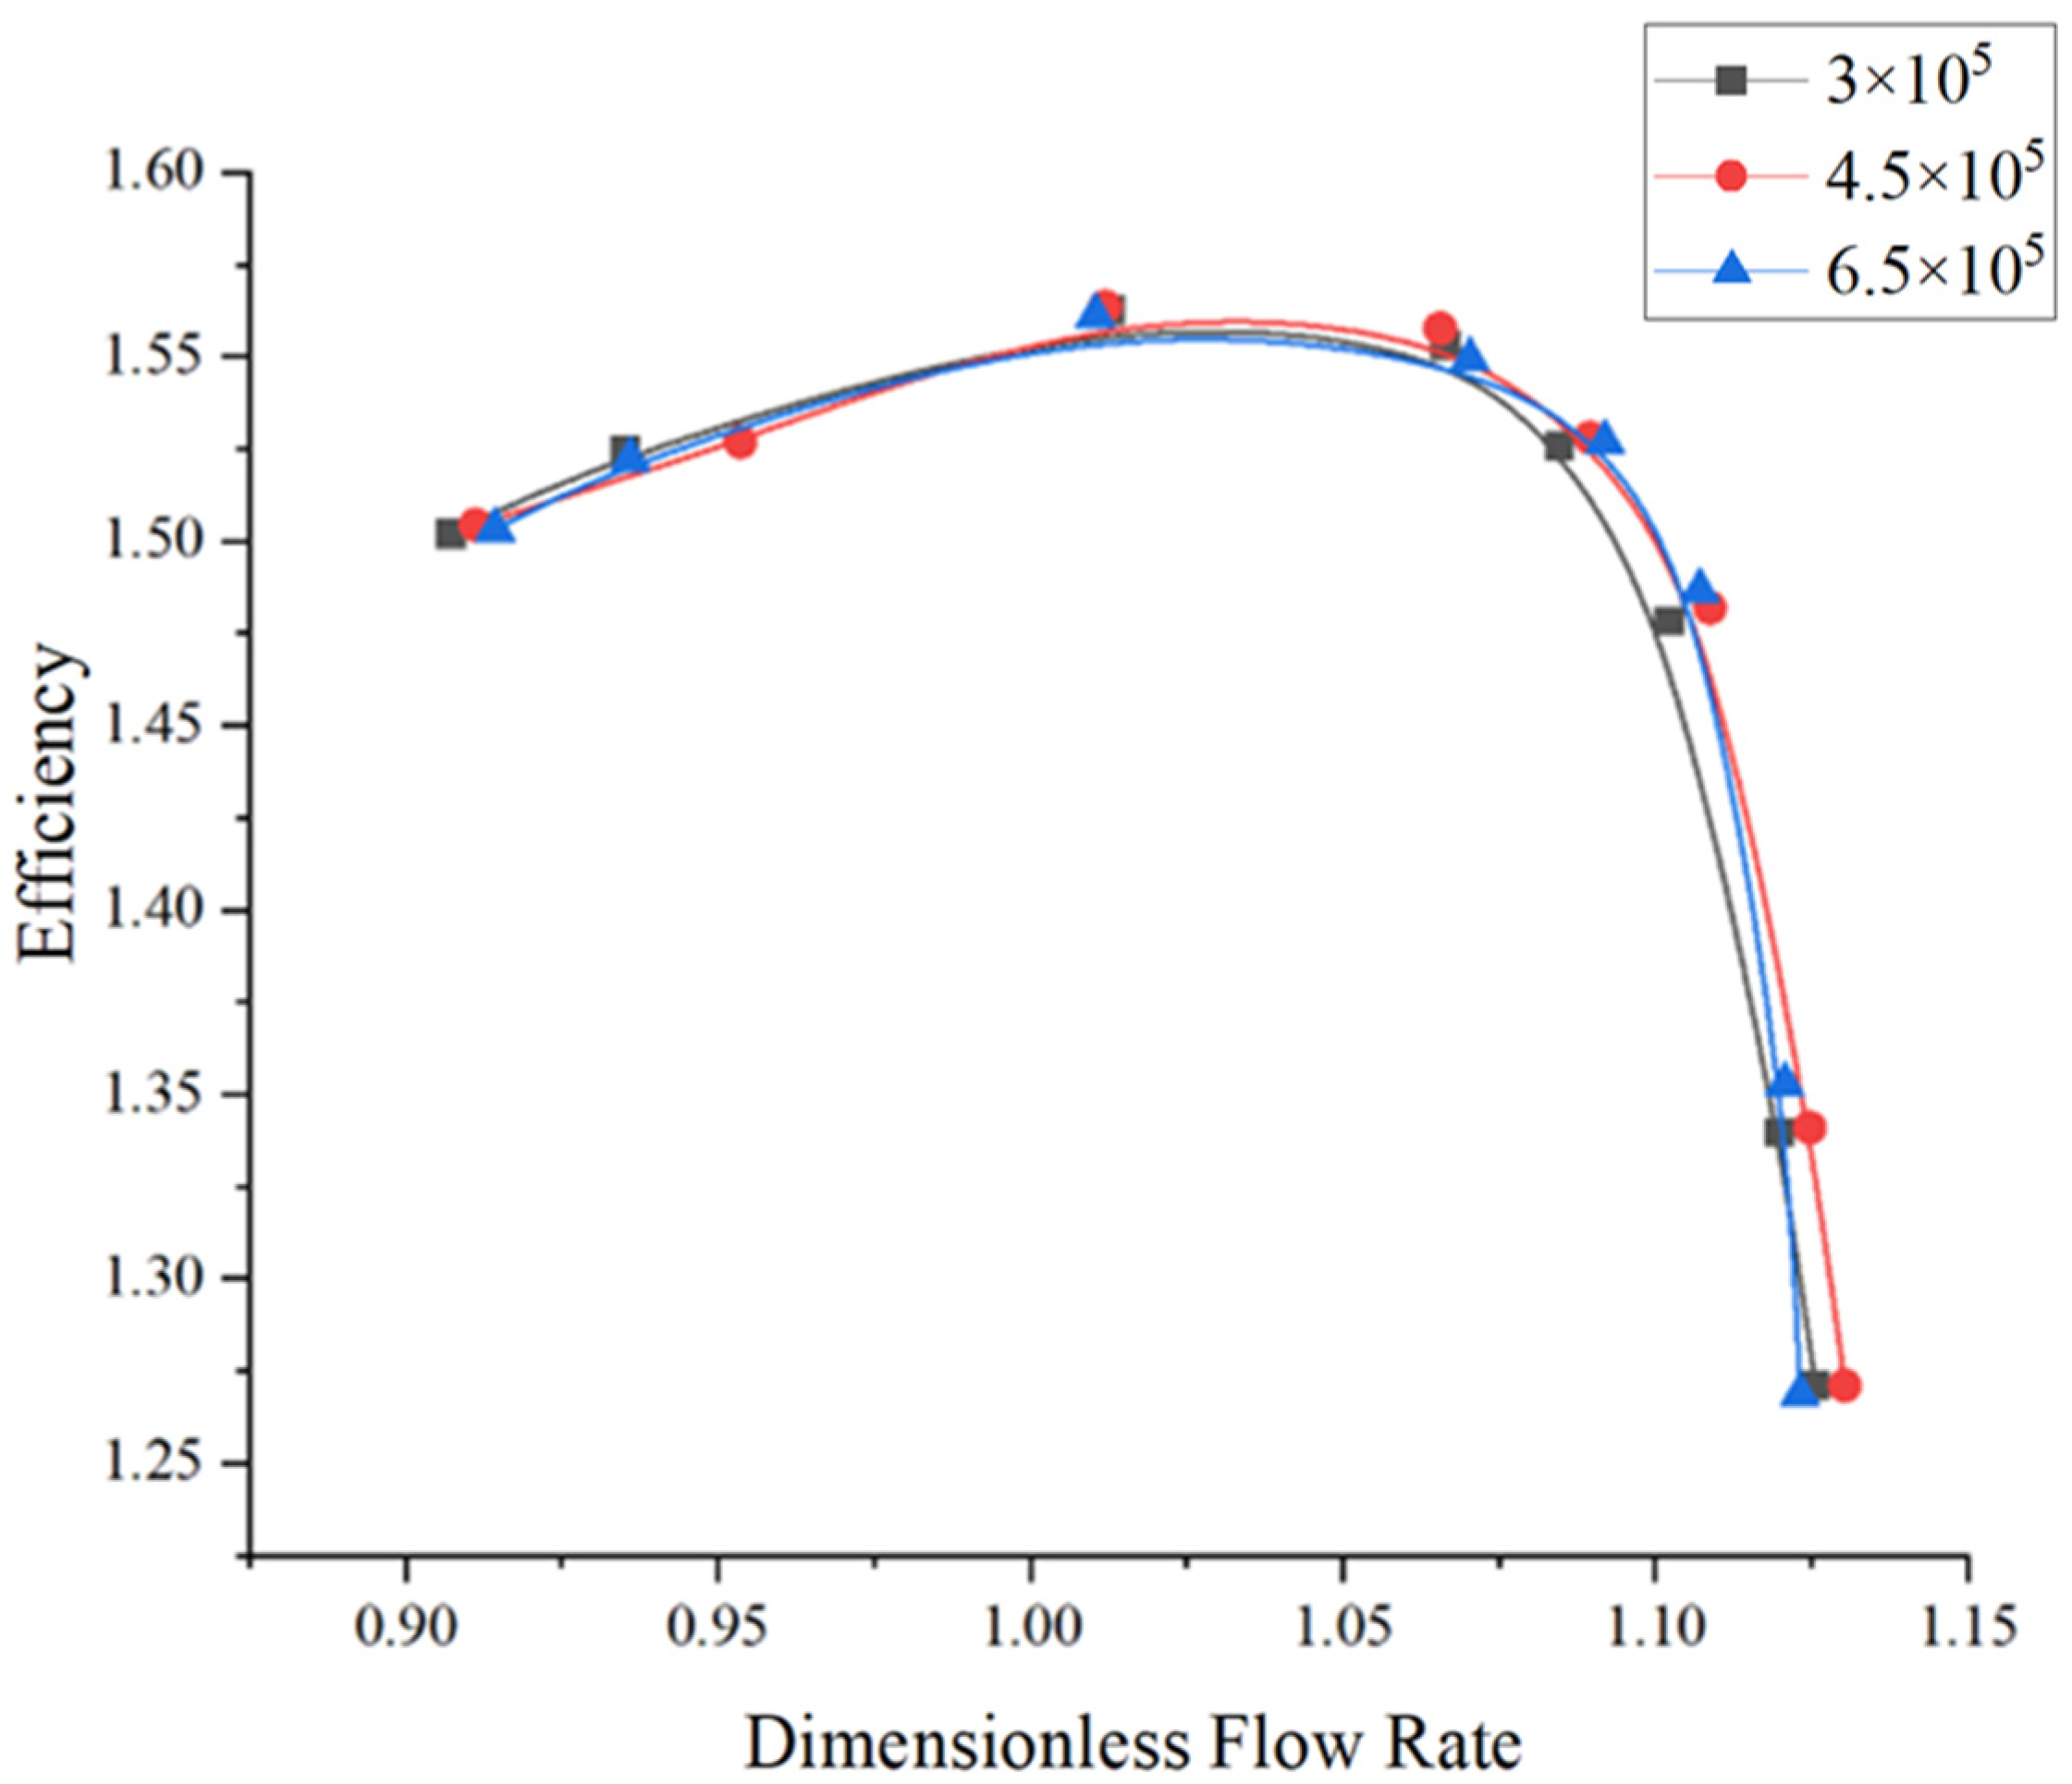
3.2. Numerical Model and Grid Independence Verification

The grid generation was performed using the AutoGrid5 pre-processing module developed by NUMECA International (Brussels, Belgium), with an H-O-H topology. Specifically, the inlet and outlet sections utilized an H-type grid, while the blade-surrounding region adopted an O-type structured grid, with mesh refinement near the wall surfaces. The number of radial grid nodes in the gap was set to 17, and the cell width was 0.003 mm. The compressor meridional plane, single-passage, and full-annulus grids are shown in Figure 4. To ensure grid independence, three mesh configurations containing 3 million, 4.5 million, and 6 million elements were tested, with the computational results presented in Figure 5 and Figure 6. As observed in the figures, the computed compressor characteristics exhibited minimal variation with different grid resolutions. Considering both accuracy and computational cost, the 4.5 million-element grid was selected for subsequent numerical simulations [33]. The distribution of the grid’s y+ values is shown in Figure 7. This grid configuration ensured a minimum orthogonal angle greater than 20°, a maximum aspect ratio below 5000, and a maximum expansion ratio below 5, meeting the computational requirements.

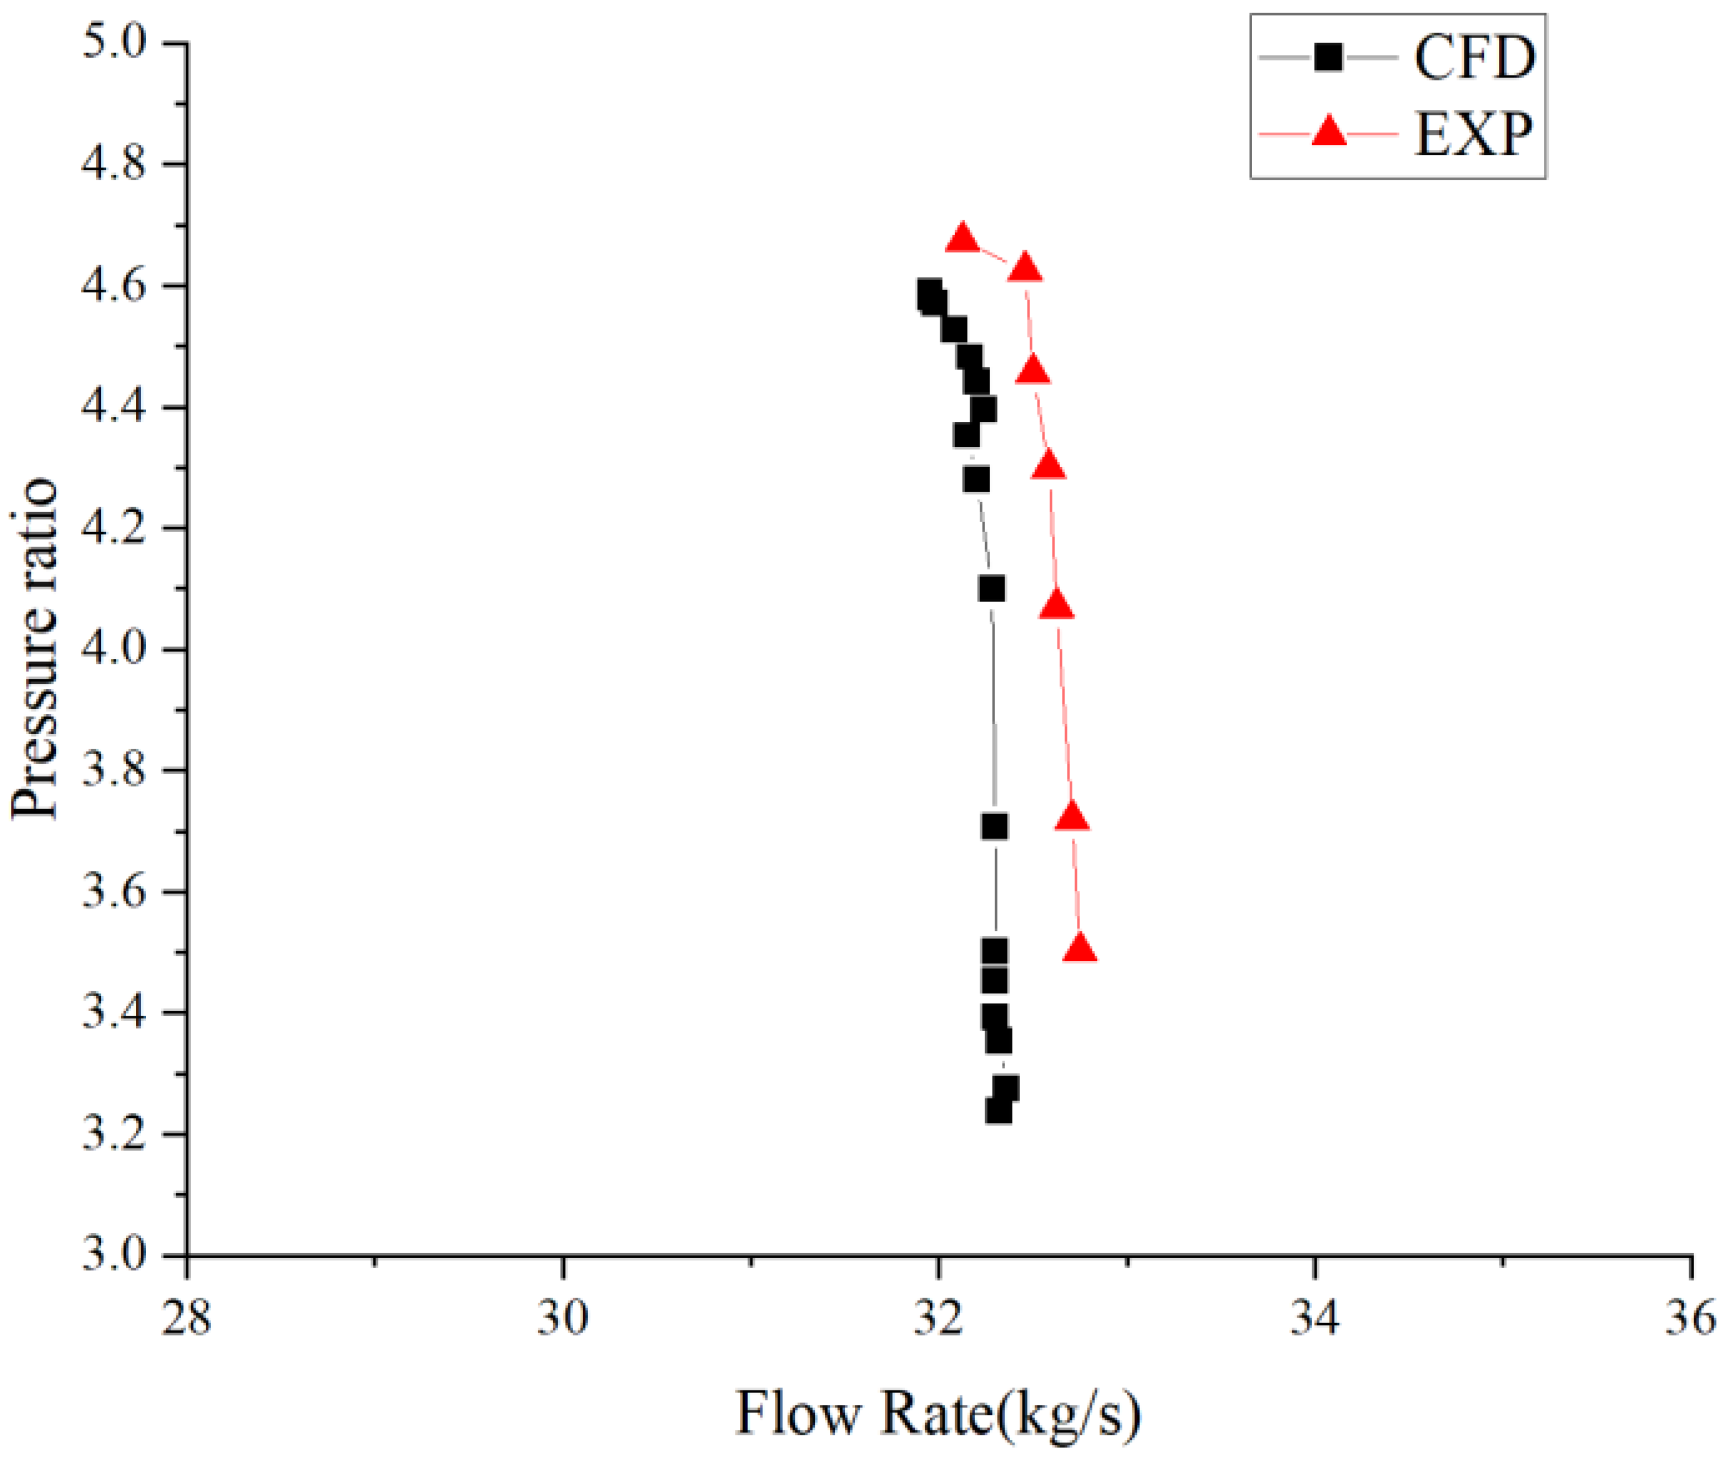
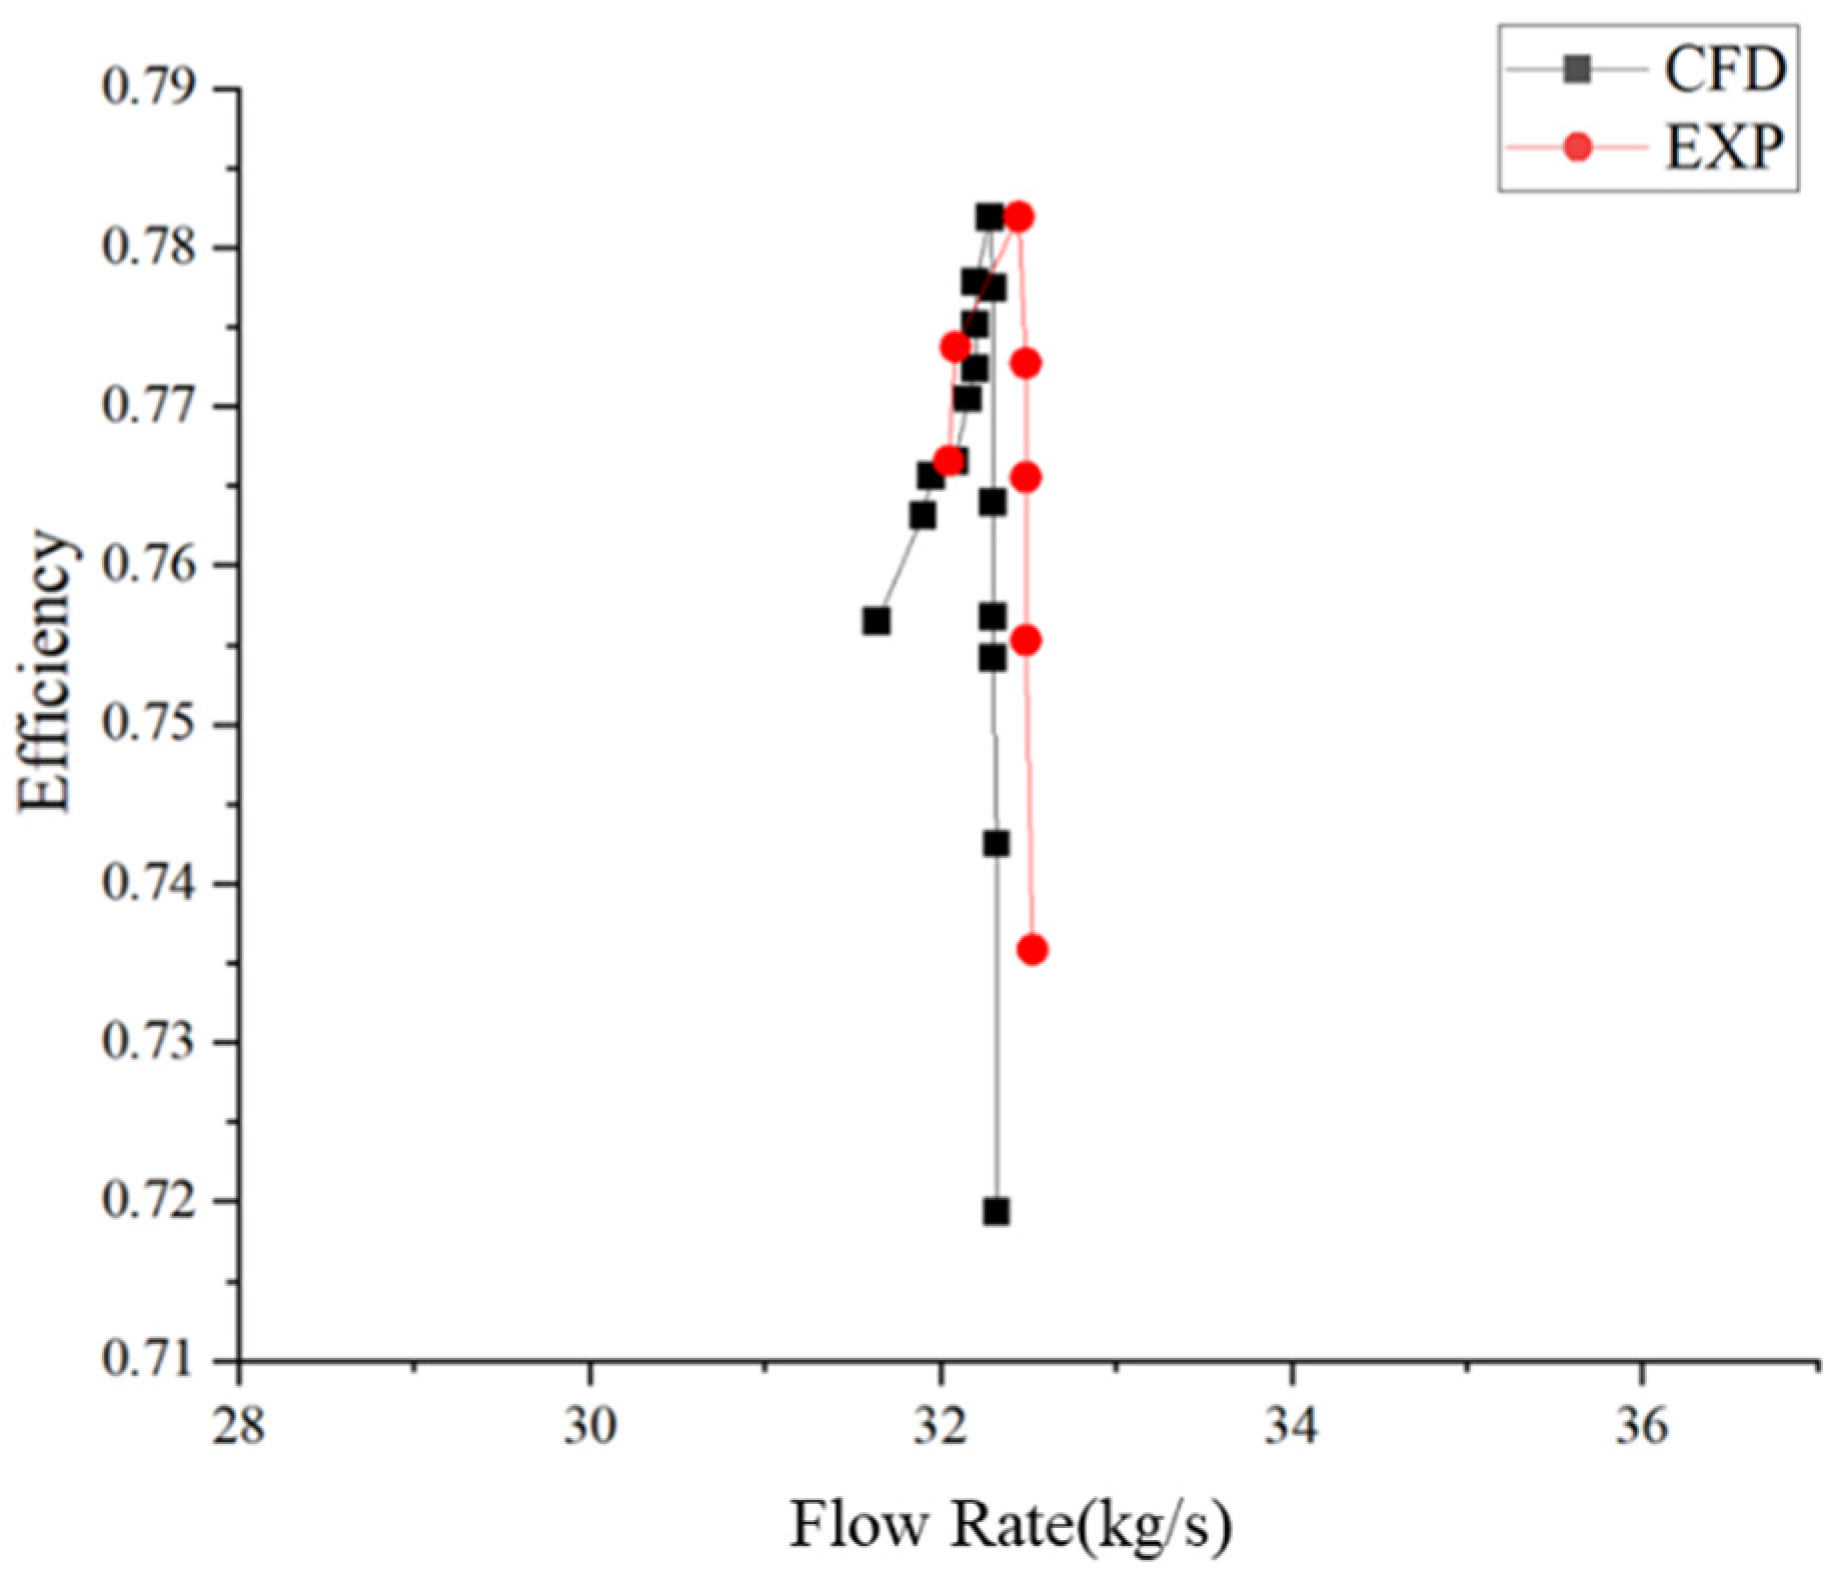
3.3. Feasibility Verification of Numerical Method

The numerical method mentioned earlier was applied to simulate the design operating condition of the NASA 74A compressor, specifically at 100% n0 (where n0 is the design rotational speed). Under a constant rotational speed, the relationship between the compressor’s pressure ratio and efficiency as a function of mass flow rate is commonly referred to as the compressor characteristic curve. By maintaining a rotational speed of 100%, the compressor mass flow rate was regulated by adjusting the outlet backpressure. The operating point at which a further decrease in backpressure no longer results in an increase in flow rate is defined as the choke point. Conversely, by increasing the backpressure until numerical calculations diverge, the last converged solution is identified as the near-stall operating point. On the efficiency–mass flow characteristic curve, a peak efficiency value is observed. To the right of this peak, the efficiency decreases steeply with increasing mass flow rate, whereas on the left, the efficiency decline is more gradual.
The numerical simulation results were compared with experimental data, as shown in Figure 8 and Figure 9. It can be seen that the pressure ratio characteristics align well with the experimental results. The simulated choke flow rate was 32.32 kg/s, while the experimental value was 32.75 kg/s, yielding a relative error of 1.3%. The simulated stall flow rate was 31.95 kg/s, compared to the experimental value of 32.125 kg/s, with a relative error of 5.432%. In the mass flow–efficiency characteristic curve, the error in the flow rate corresponding to peak efficiency is 0.63%, while the maximum efficiency error is 0.06%.
In conclusion, the numerical simulation results demonstrate high accuracy, confirming the feasibility of using this computational model for further research.

4. Results and Discussion

This study selected five typical compressor operating conditions of an aircraft engine for simulation and analysis: take-off (design point, 100% n0), climb (94% n0), cruise (93% n0), approach (89% n0), and ground idle (68% n0), where n0 represents the design speed. These conditions cover nearly all representative points within the operational envelope. The study focused on the impact of these conditions on the compressor exit flow field, analyzing parameters such as airflow deflection angles and the radial peak values of the inlet airflow and their corresponding positions.

4.1. Simulation and Analysis of Compressor Exit Flow Field Under Different Typical Operating Conditions

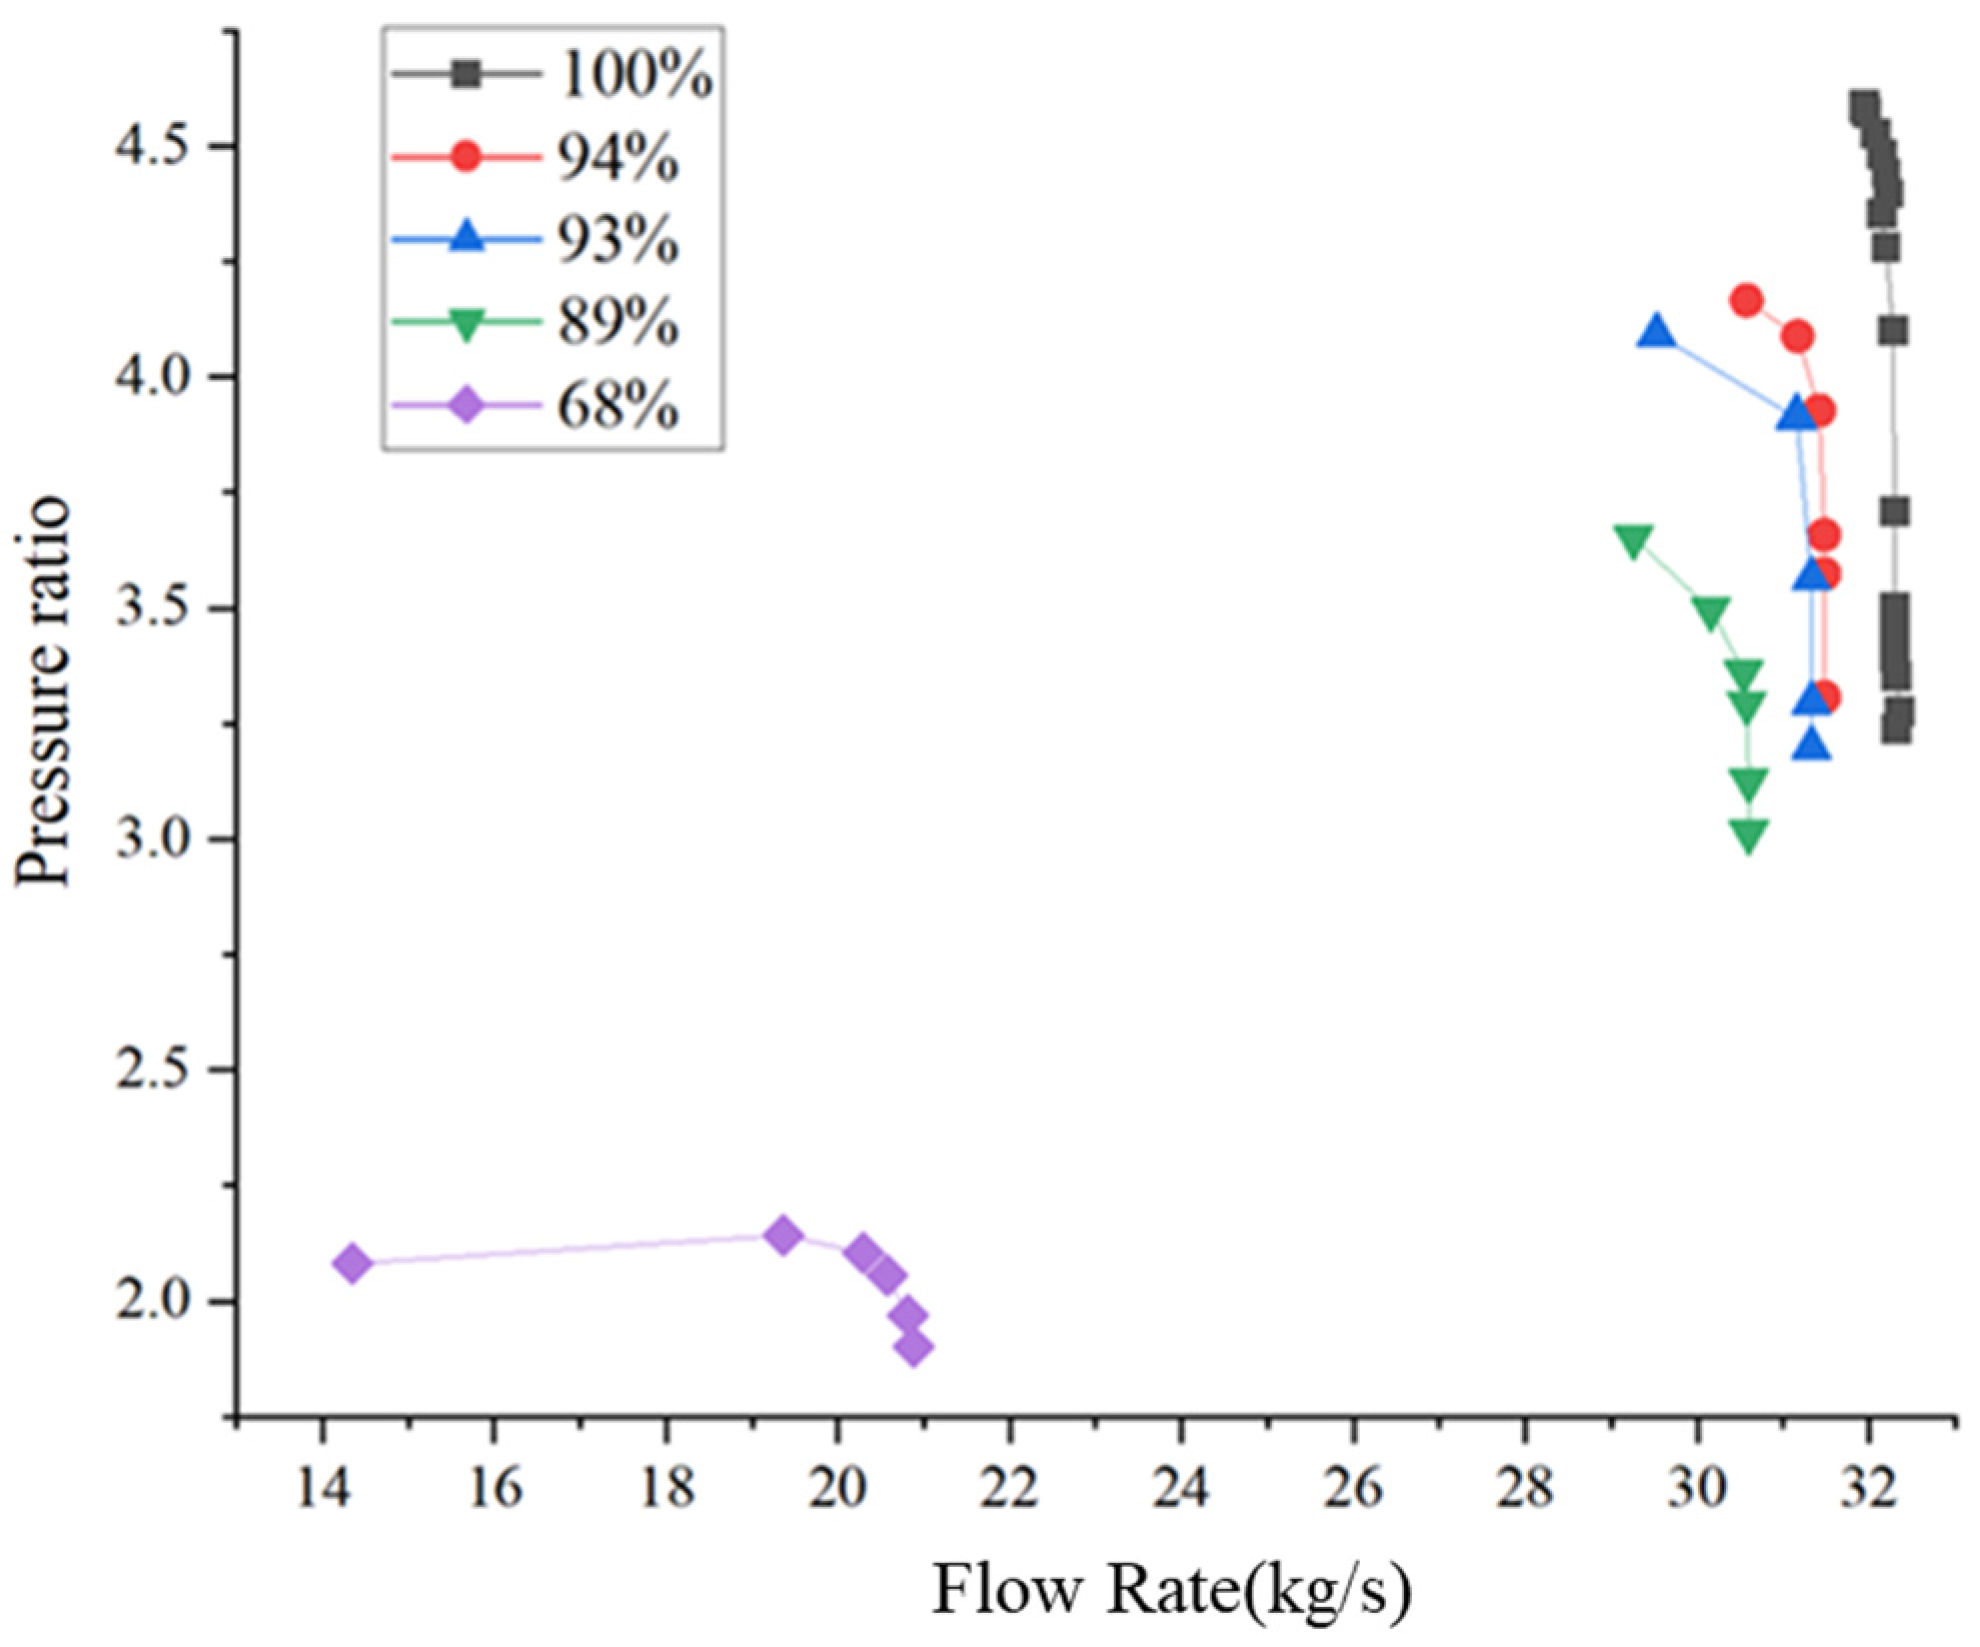
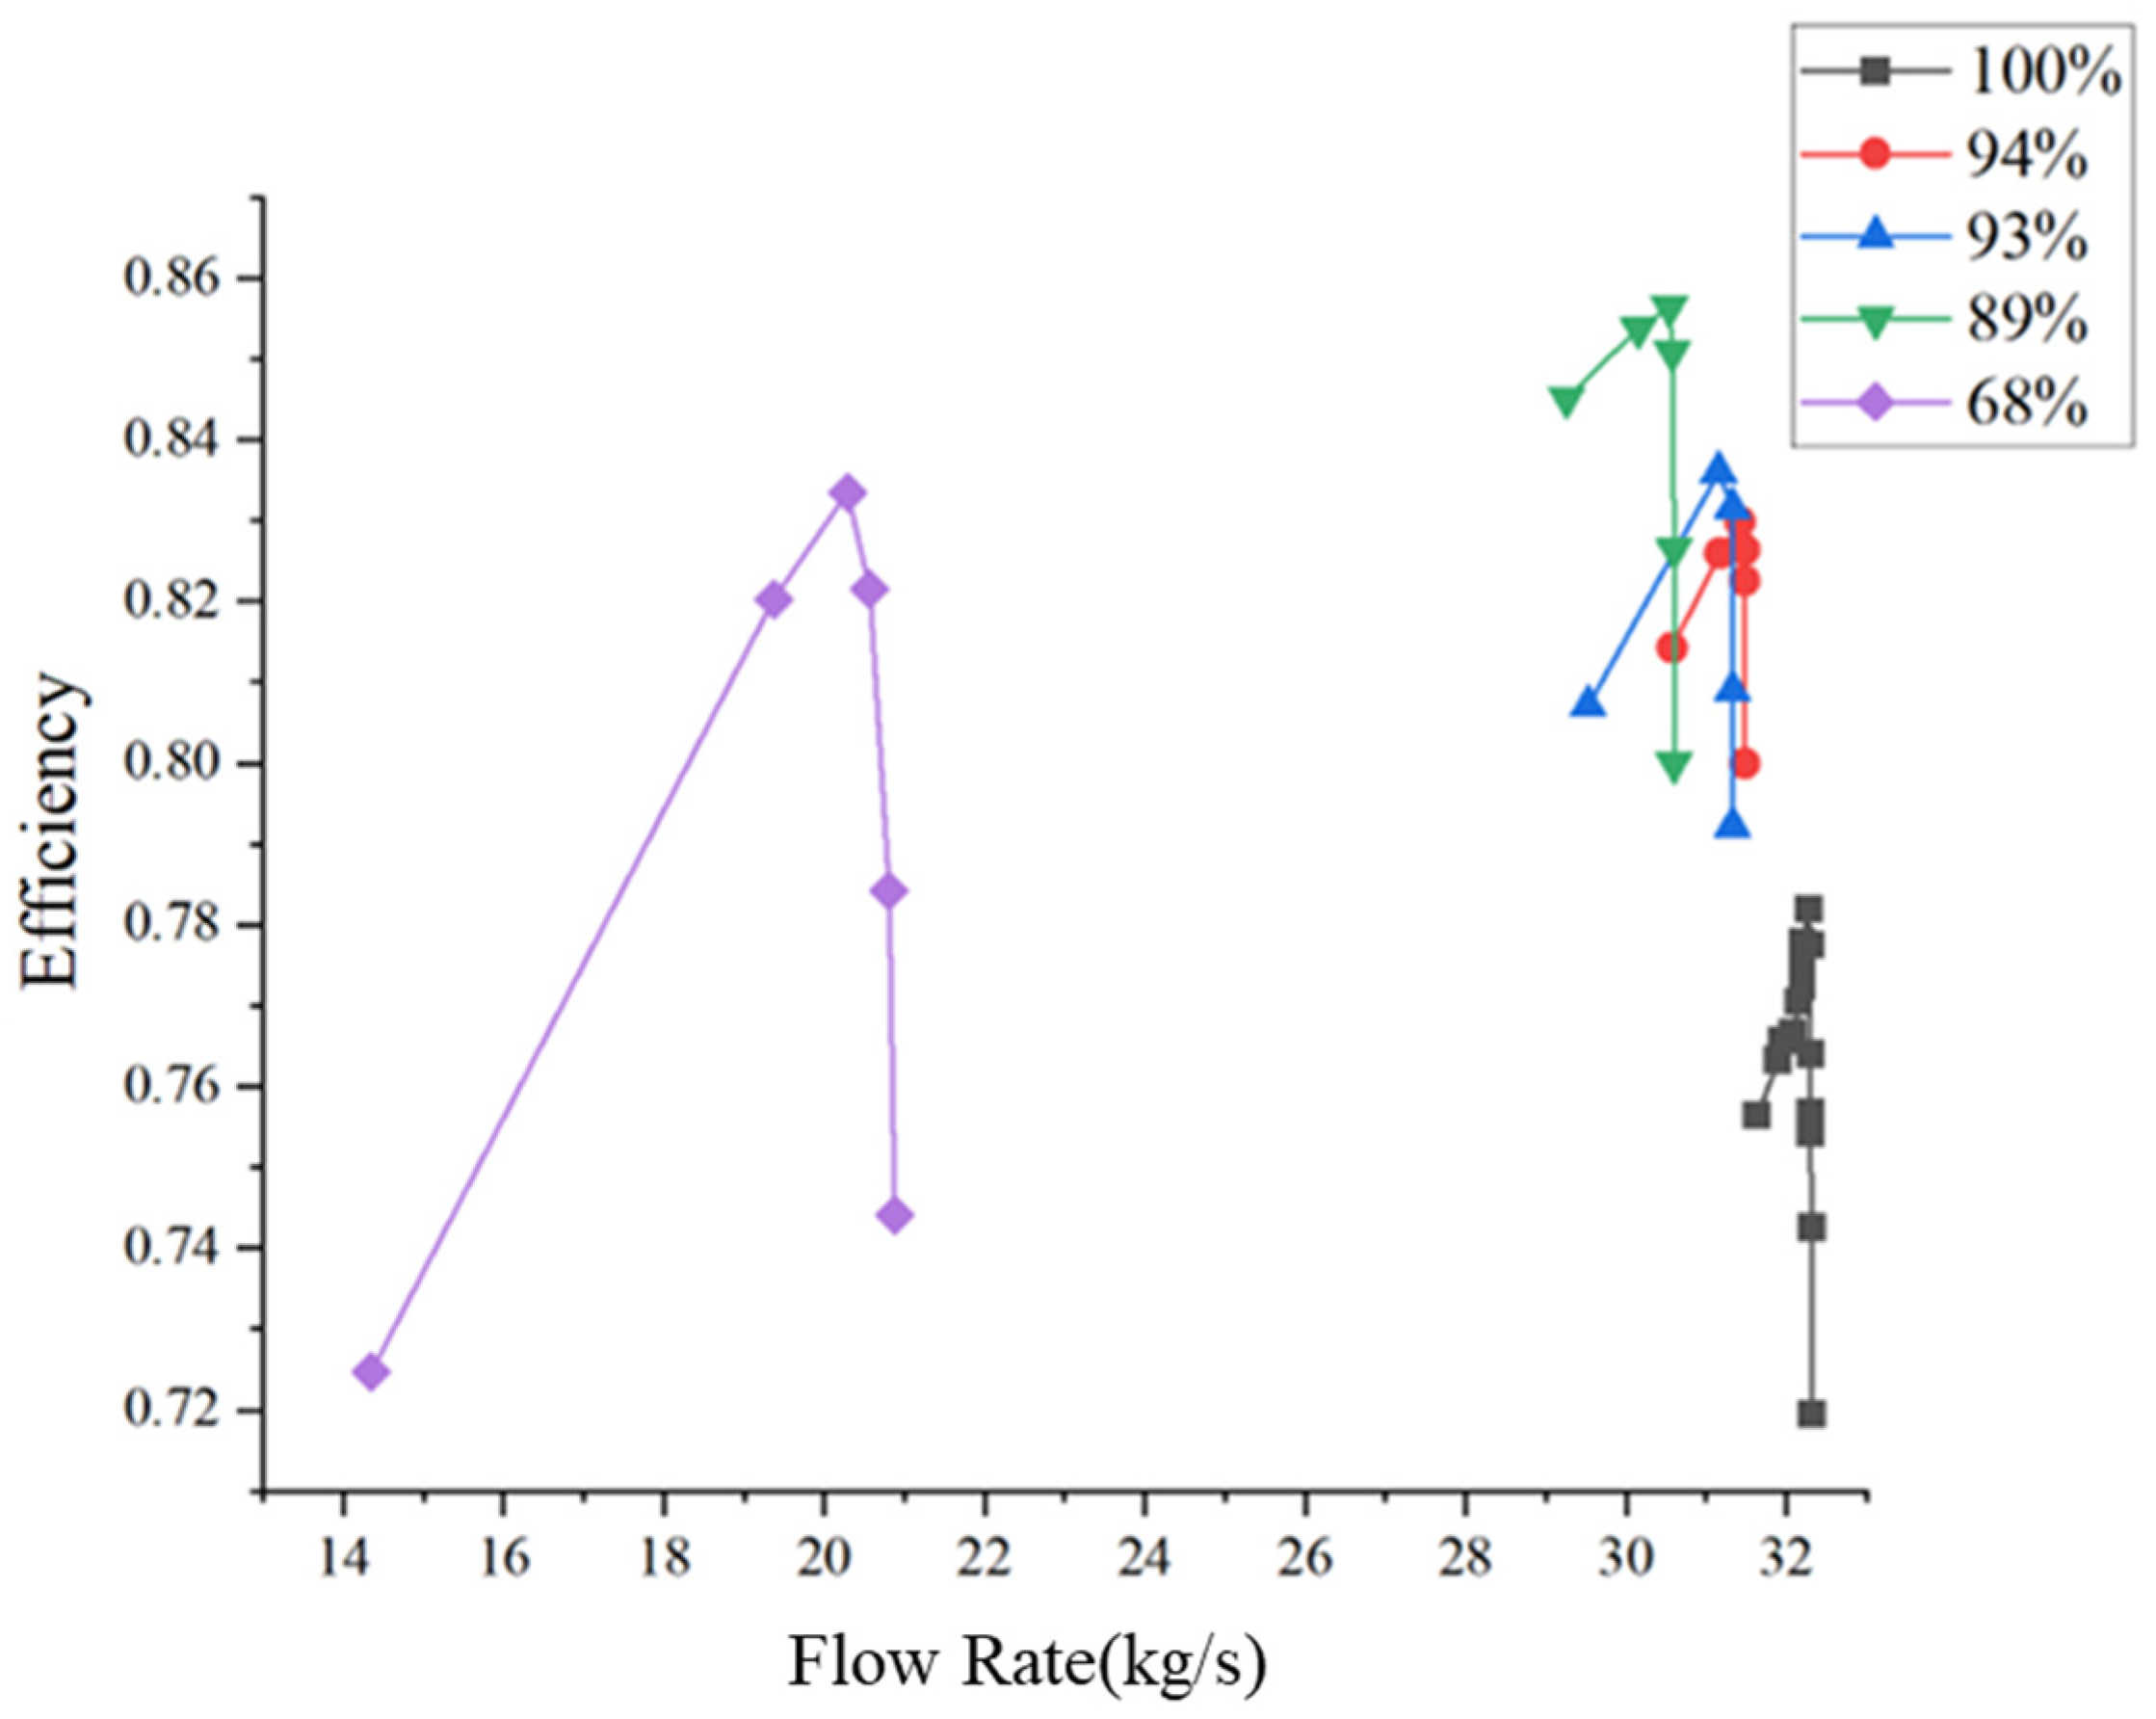
4.1.1. Analysis of Overall Compressor Performance Under Various Rotational Speed Conditions

The numerical method mentioned earlier was employed to simulate the 74A compressor at five rotational speeds: 100% n0, 94% n0, 93% n0, 89% n0, and 68% n0. The corresponding rotational speeds for these operating conditions were 16,042 r/min, 15,079.5 r/min, 14,919 r/min, 14,277.4 r/min, and 10,716 r/min, respectively. At each rotational speed, the compressor mass flow rate was adjusted by modifying the outlet backpressure. As the backpressure decreases, the compressor mass flow rate shows a gradual increase. The operating point at which a further reduction in backpressure no longer increases the mass flow rate was defined as the choke point for that speed. Conversely, by increasing the backpressure until numerical calculations diverged, the last converged solution was identified as the near-stall point for that speed. On each mass flow–efficiency characteristic curve, there exists a peak efficiency point. To the right of this peak, efficiency decreases sharply as the mass flow rate increases, whereas on the left, the efficiency decline Is more gradual.
As shown in Figure 10 and Figure 11, the characteristic curves for the first four rotational speeds (100% n0, 94% n0, 93% n0, 89% n0) are relatively close to each other, with choke flow rates and peak efficiency points distributed within approximately 30–32 kg/s, exhibiting minimal variation. In contrast, the pressure ratio–mass flow curve at 68% n0 deviates significantly, with a mass flow distribution around 20 kg/s—approximately 35% lower than that of the first four conditions—indicating a substantial deviation from the design operating condition.

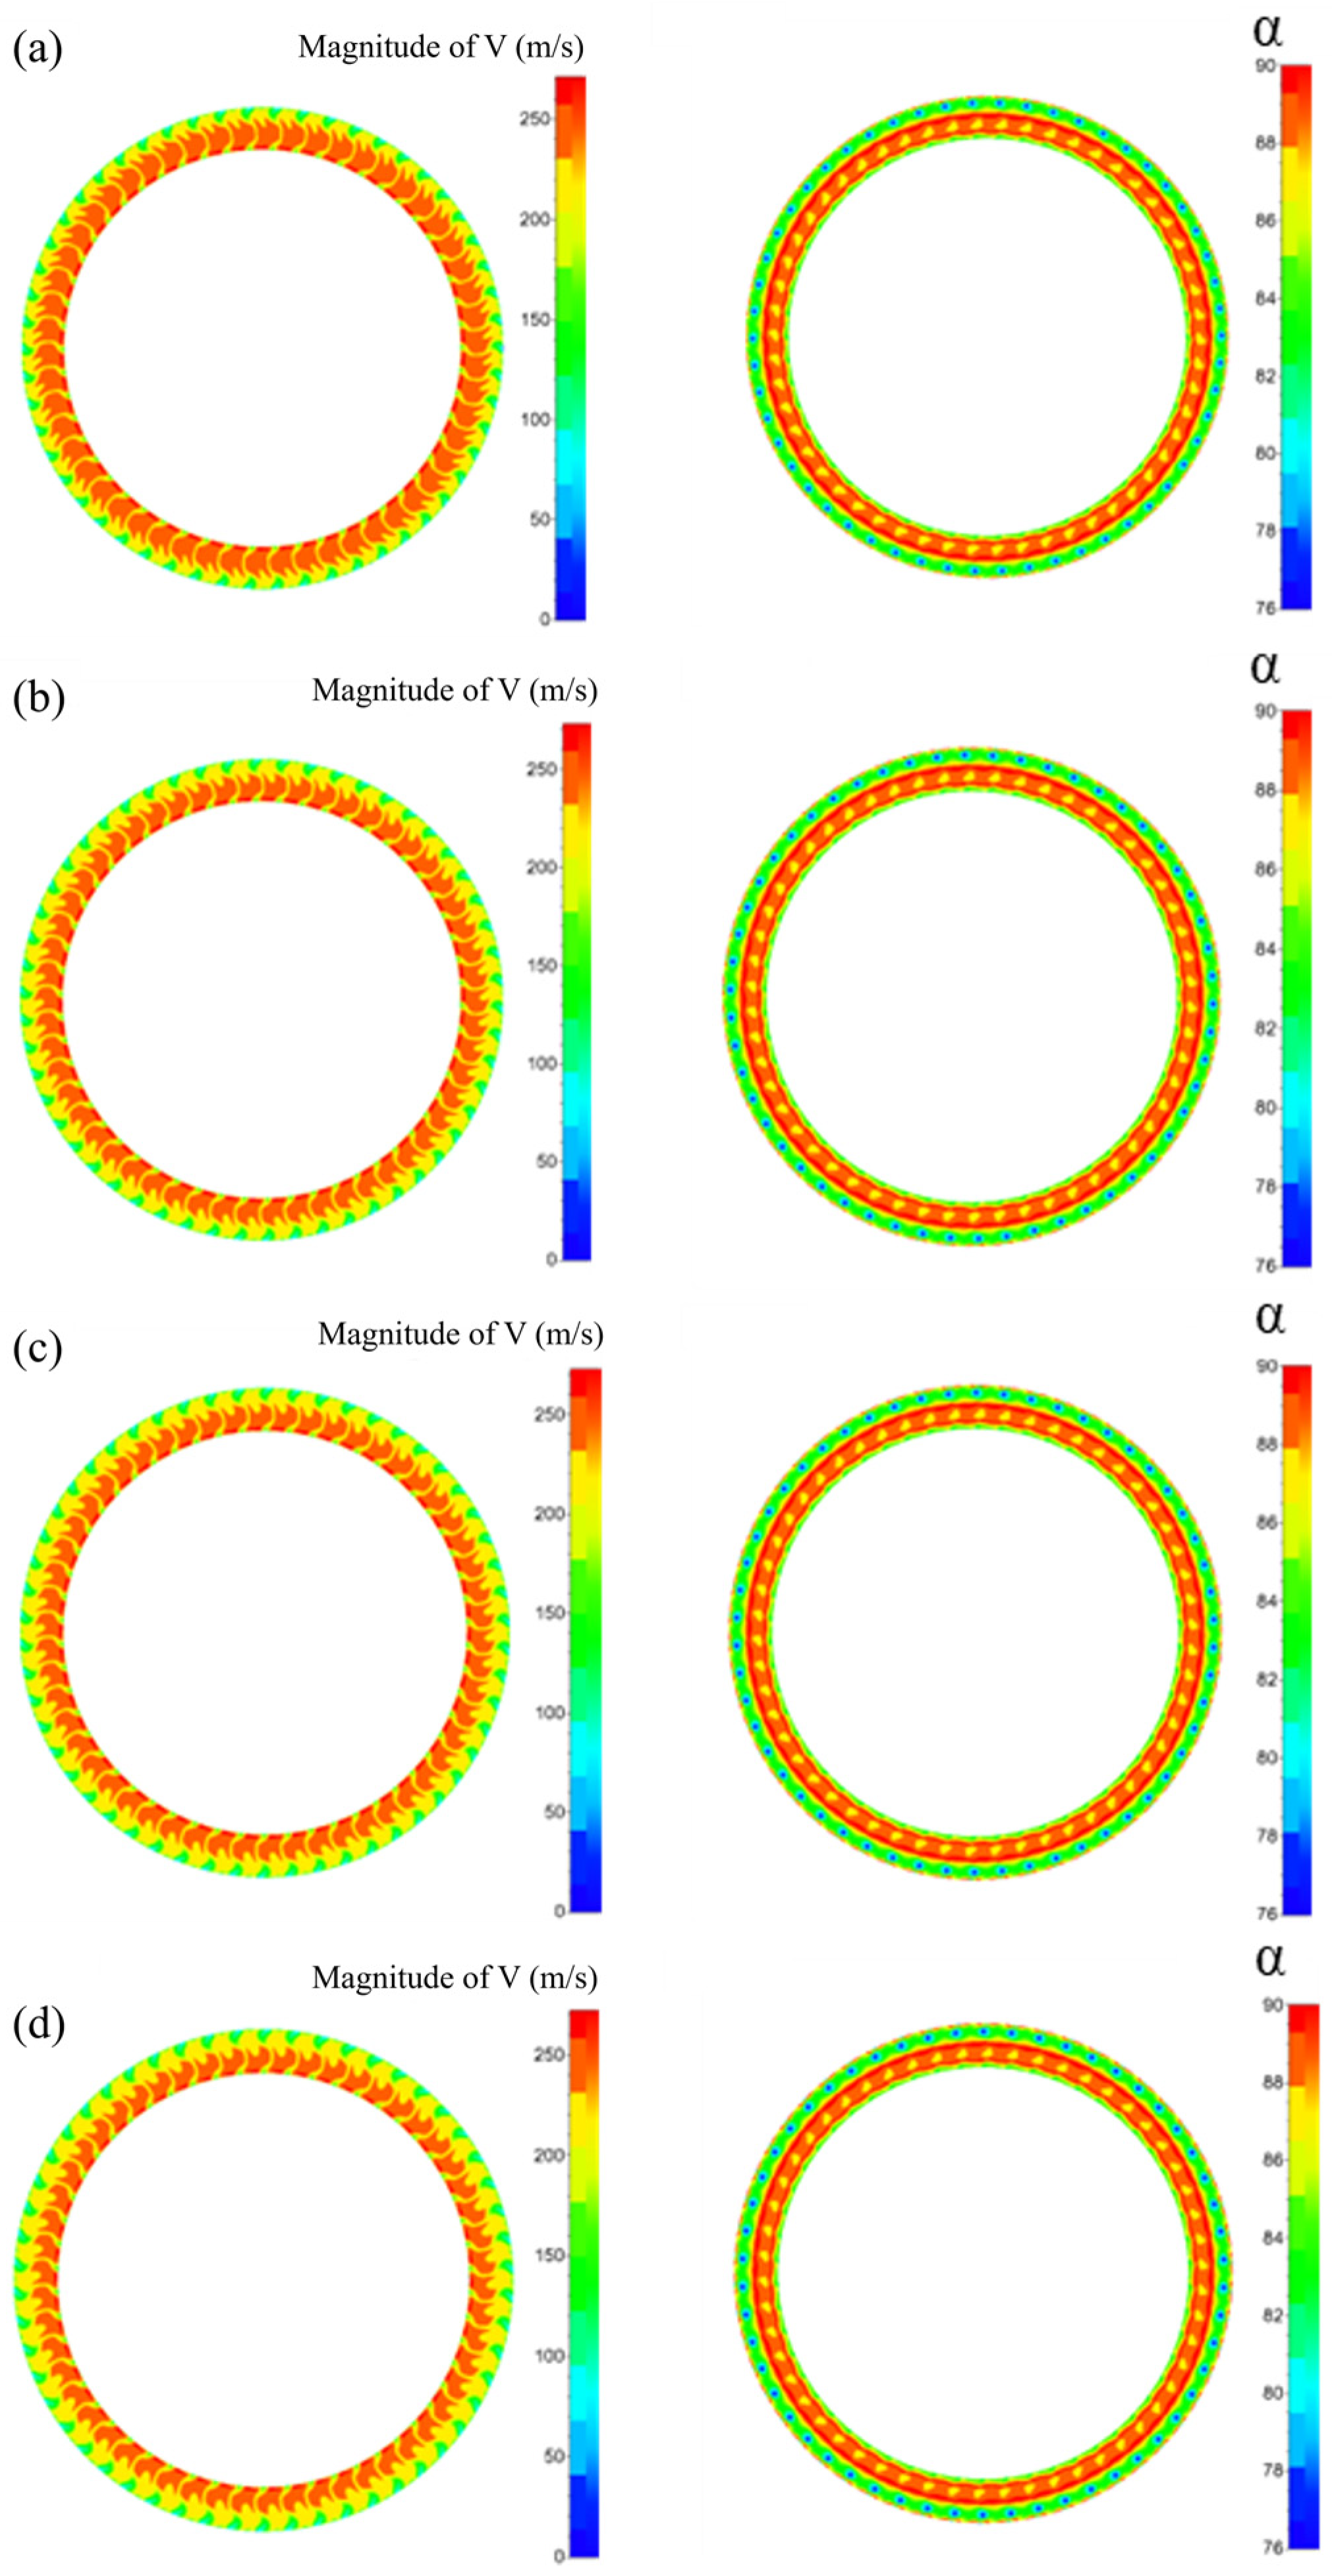
4.1.2. Distribution Pattern of Total Velocity at the Compressor Exit Under Different Typical Operating Conditions

The total velocity contour maps at the NASA 74A compressor exit under different rotational speeds are shown in Figure 12. These contour maps reveal the flow field characteristics and velocity distribution patterns across various operating conditions. It can be observed that as the rotational speed decreases, the high-velocity region progressively shrinks. However, the overall contour distribution pattern remains similar, with velocity decreasing along the blade height from the root to the tip. The high-velocity regions are primarily concentrated in the middle and root sections of the blade height.
The flow field distributions at 94% n0 and 93% n0 rotational speeds closely resemble those observed under the design condition. Compared to 100% n0, the total exit velocity exhibits a slight decline, but the velocity distribution remains highly consistent. This indicates that at operating conditions close to the design speed, the compressor’s performance varies only slightly, and the flow field structure remains largely stable.
At 89% n0, which corresponds to the approach condition, significant changes in the total exit velocity distribution begin to emerge. The high-velocity region further contracts, while the velocity gradient in certain areas near the blade tip increases. The contour distribution deviates considerably from that of the design condition, suggesting the onset of flow instability, which may lead to localized low-energy fluid accumulation or flow separation. These phenomena could negatively impact compressor efficiency and stability.
At 68% n0, representing the low-speed operating condition, the total exit velocity decreases significantly, and the velocity distribution becomes increasingly non-uniform. Low-velocity regions expand considerably, while high-velocity regions almost disappear, indicating a severe deterioration in the energy distribution within the flow field. At low rotational speeds, phenomena such as flow separation and recirculation become more pronounced, potentially pushing the compressor operating point far from the optimal design condition, thereby reducing overall performance.
Figure 13 presents the radial-averaged total velocity distribution curves along the blade height at the compressor exit under different typical operating conditions (100% n0, 94% n0, 93% n0, 89% n0, and 68% n0). A comparative analysis reveals that the effect of rotational speed variation on the exit velocity distribution is primarily reflected in changes in both the velocity peak and the distribution pattern.
At the design speed (100% n0), the velocity distribution curve reaches its highest overall values, with a peak velocity of approximately 242.7 m/s. The velocity peak is located near the middle of the blade height, and a distinct velocity drop is observed in the 0.03 m–0.043 m region. The average velocity at 100% n0 is 219.44 m/s, which is higher than the average velocities of the four lower-speed conditions: 208.65 m/s (94% n0), 206.31 m/s (93% n0), 201.28 m/s (89% n0), and 210.25 m/s (68% n0). This indicates that at the design speed, the airflow kinetic energy utilization is more efficient. Additionally, except for the 68% n0 condition, the average velocity consistently decreases with decreasing rotational speed.
As the speed decreases (94% n0, 93% n0, and 89% n0), the velocity curves exhibit a highly regular downward trend, with a significant drop near the blade root, while the blade tip regions remain relatively aligned. The peak velocities at these speeds are 237.6 m/s, 233.6 m/s, and 225.5 m/s, respectively. Compared to 100% n0, the peak velocities decrease by approximately 2%, 3.7%, and 7%, respectively, while the peak positions remain nearly unchanged. The reduction in velocity near the blade tip is relatively small, and all conditions exhibit a general downward trend.
When the speed decreases to 68% n0, the velocity distribution deteriorates further, exhibiting significant changes in its pattern. The peak velocity shifts from the blade root region to the middle section, resulting in a maximum deviation of 11.4% from the design condition. Additionally, the velocity distribution near the blade tip becomes relatively smooth, in stark contrast to the downward trends observed in other conditions, indicating a severe deviation from the design point.

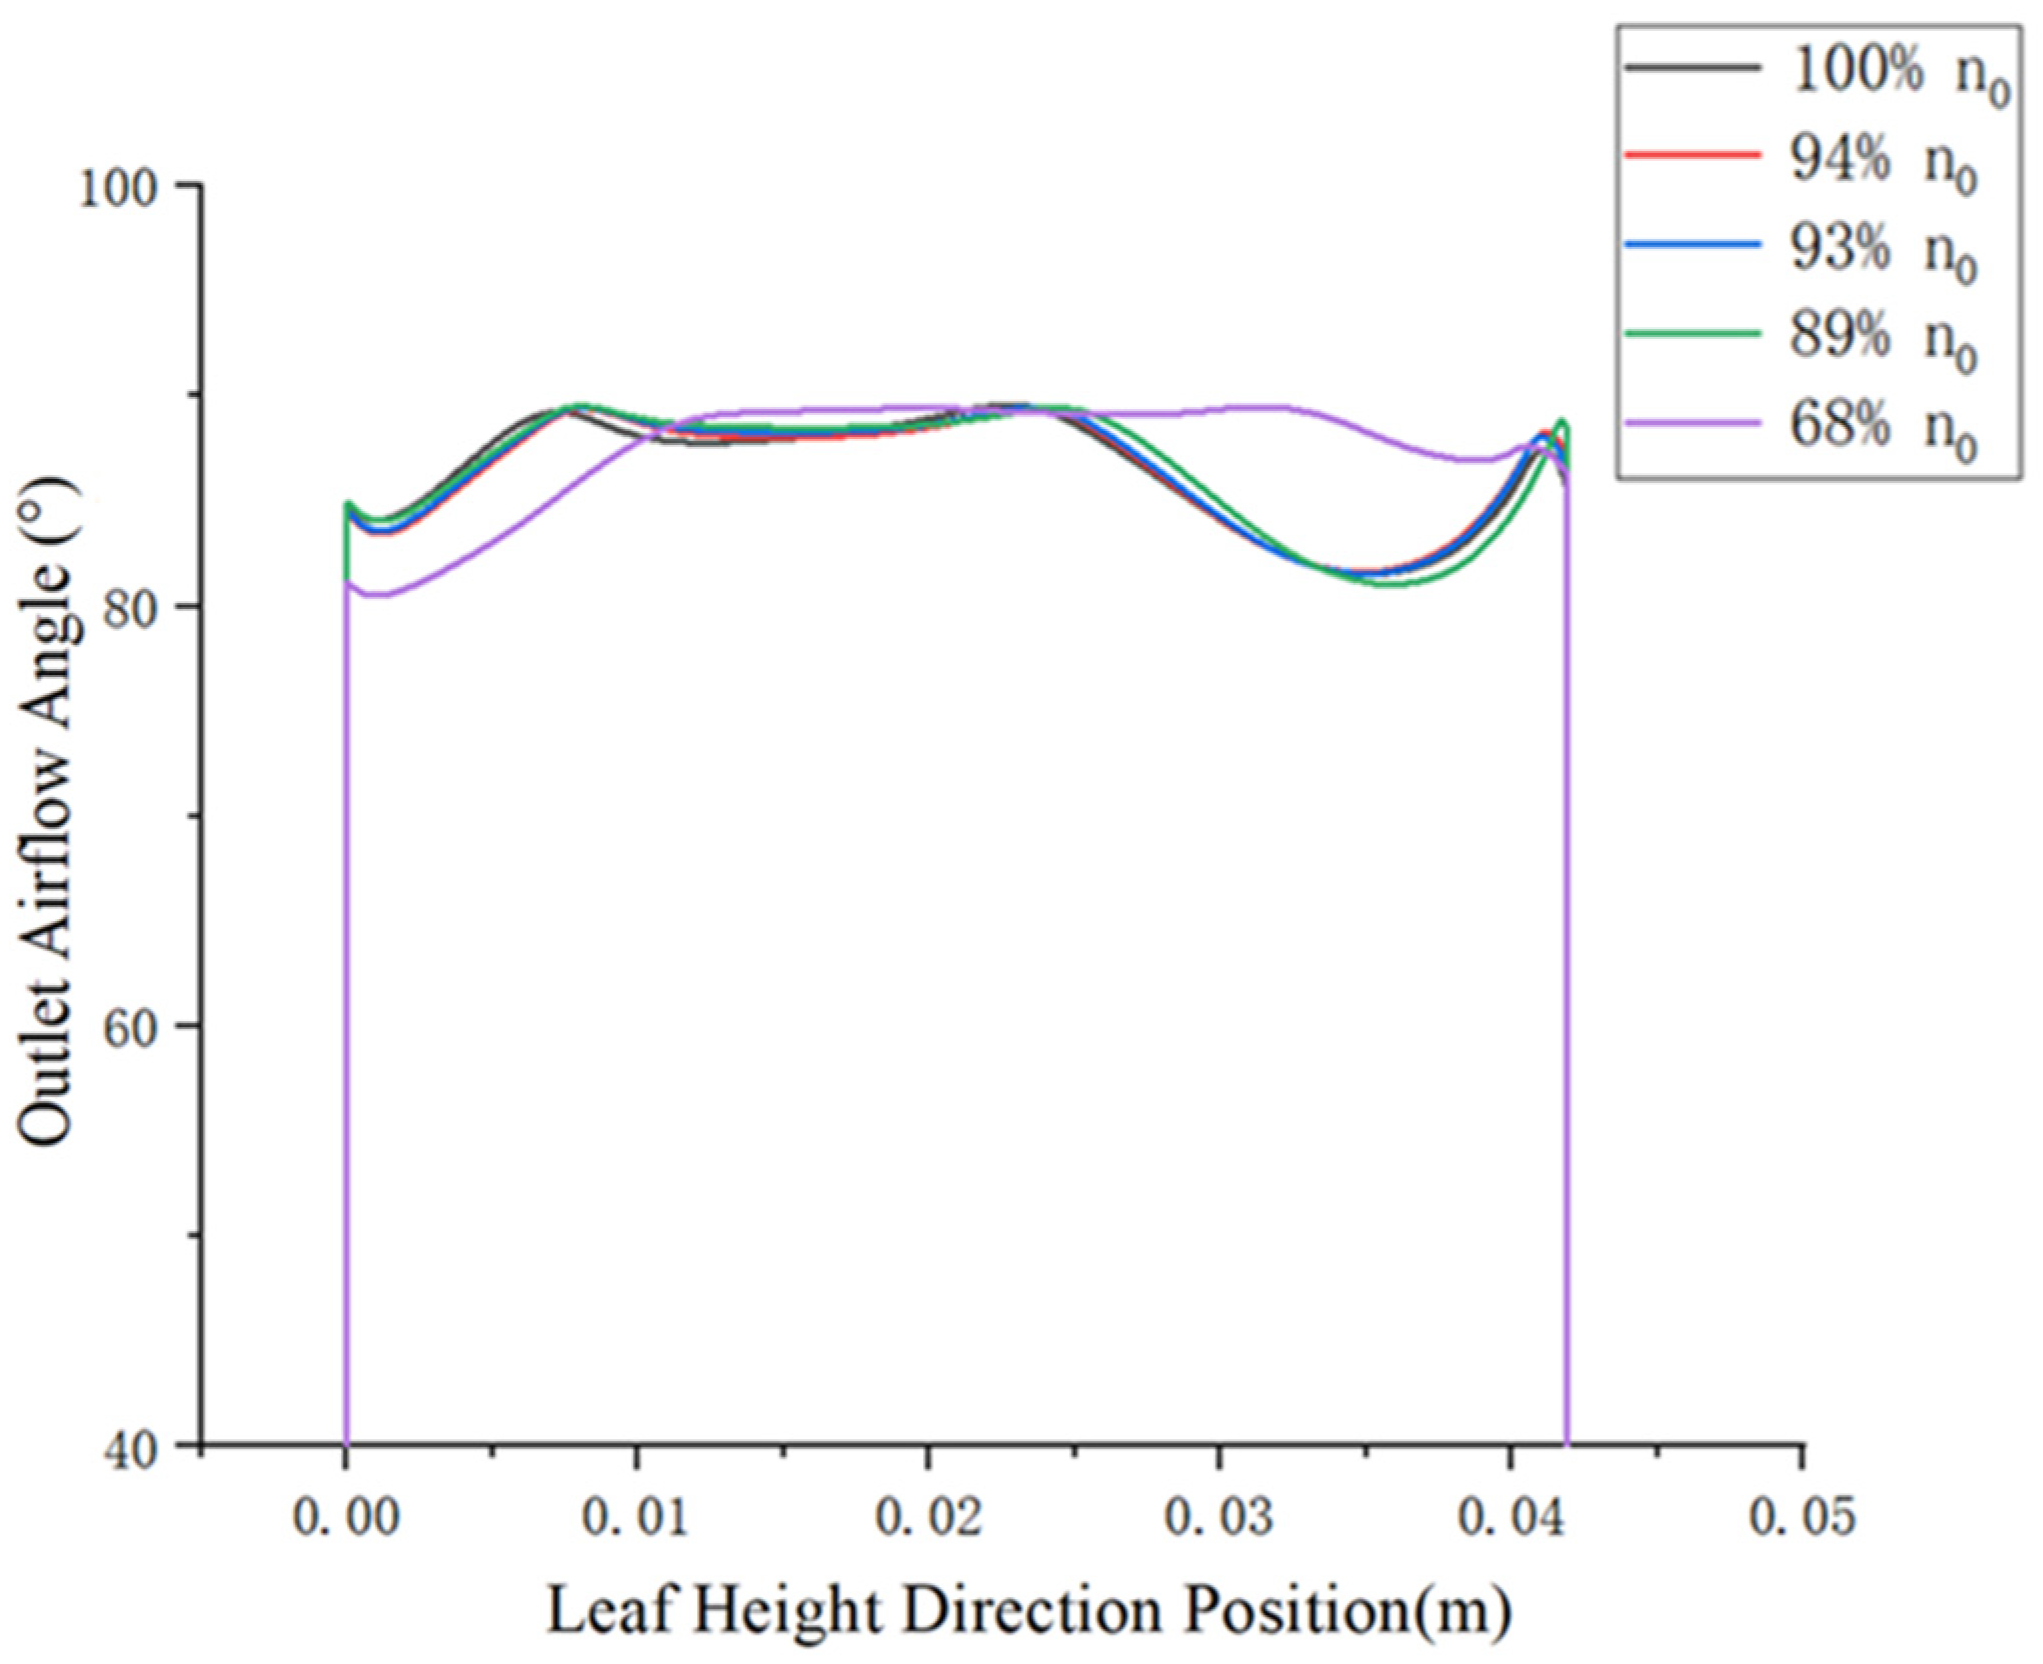
4.1.3. Distribution Pattern of Airflow Deflection Angle at the Compressor Exit Under Different Typical Operating Conditions

Figure 14 presents the distribution contour maps of the outlet airflow deflection angle for the multi-stage axial-flow compressor under different typical operating conditions (100% n0, 94% n0, 93% n0, 89% n0, and 68% n0).
At the design speed of 100% n0 (Figure 14a), the airflow deflection angles are primarily concentrated between 85° and 90°, indicating a relatively uniform flow direction and good flow field homogeneity. The stable distribution of high-velocity regions suggests that the design speed exhibits favorable aerodynamic performance.
At 94% n0 (Figure 14b) and 93% n0 (Figure 14c), the airflow deflection angle distribution remains similar to that of the design condition, though the range of angle variation increases, particularly near the blade tip and root. This may be attributed to the reduction in rotational speed, which decreases the aerodynamic loading on the blades and slightly weakens the airflow guidance.
When the speed is further reduced to 89% n0 (Figure 14d), noticeable changes in the airflow deflection angle distribution begin to emerge, especially near the blade root, where certain regions exhibit angle values dropping below 82°. This variation reflects an increase in asymmetry within the blade passage flow at lower rotational speeds, potentially leading to localized flow separation or low-energy fluid accumulation.
Figure 15 presents the distribution curves of the average airflow deflection angle along the blade height under different rotational speeds (100% n0, 94% n0, 93% n0, 89% n0, and 68% n0). The analysis indicates that, compared to the first parameter, no significant changes are observed.
At 100% n0, the airflow deflection angle is distributed relatively uniformly, ranging approximately from 84° to 88°, with an overall smooth variation. The small amplitude of deflection angle fluctuations indicates a stable flow field and high airflow turning efficiency.
Under 94% n0, 93% n0, and 89% n0 conditions, the airflow deflection angle curves exhibit similar distributions with minimal differences. Specifically, the deflection angle remains within the range of approximately 75° to 87°, with variations within 1°, suggesting that changes in rotational speed have a limited effect on the airflow deflection angle, and the flow field stability remains high.
At 68% n0, deflection angle fluctuations increase significantly. In particular, the deflection angle rises sharply in the blade root and blade tip regions, indicating the possible presence of stronger flow separation or secondary flow effects at low rotational speeds. The peak values and locations of the deflection angle at the blade root (x ≤ 0.005 m) and blade tip (x ≥ 0.04 m) differ noticeably from those at other rotational speeds, especially in the blade root region, where the deflection angle reaches a significantly higher peak.
Across all operating conditions, the deflection angle remains relatively stable, approximately between 75° and 85°, with variations ranging from 1° to 3°. This suggests that the flow field in this region exhibits high stability and low sensitivity to changes in rotational speed.
Overall, as the rotational speed decreases, the magnitude of deflection angle fluctuations increases, with particularly pronounced variations at low speeds (68% n0), likely associated with the intensification of flow separation or secondary flow effects at lower rotational speeds.

4.2. Effect of Non-Uniform Inlet Flow on Compressor Exit Flow Field Under Design Conditions

4.2.1. Configuration of Non-Uniform Inlet Flow Conditions

The NASA 74A is a high-bypass turbofan engine model designed for research purposes. The design parameters of its front fan are not explicitly disclosed in publicly available literature. Based on typical high-bypass turbofan engine designs, the pressure ratio of the front fan in an aircraft engine compressor generally ranges between 1 and 1.1, resulting in an airflow deflection of approximately 10° to 20° relative to the axial direction.
Accordingly, for this design condition, the pressure was set to 1 atm and 1.05 atm, with each pressure condition incorporating four inlet flow angles α of 90°, 80°, 75°, and 70°. Table 2 presents the computational conditions under non-uniform inlet airflow.

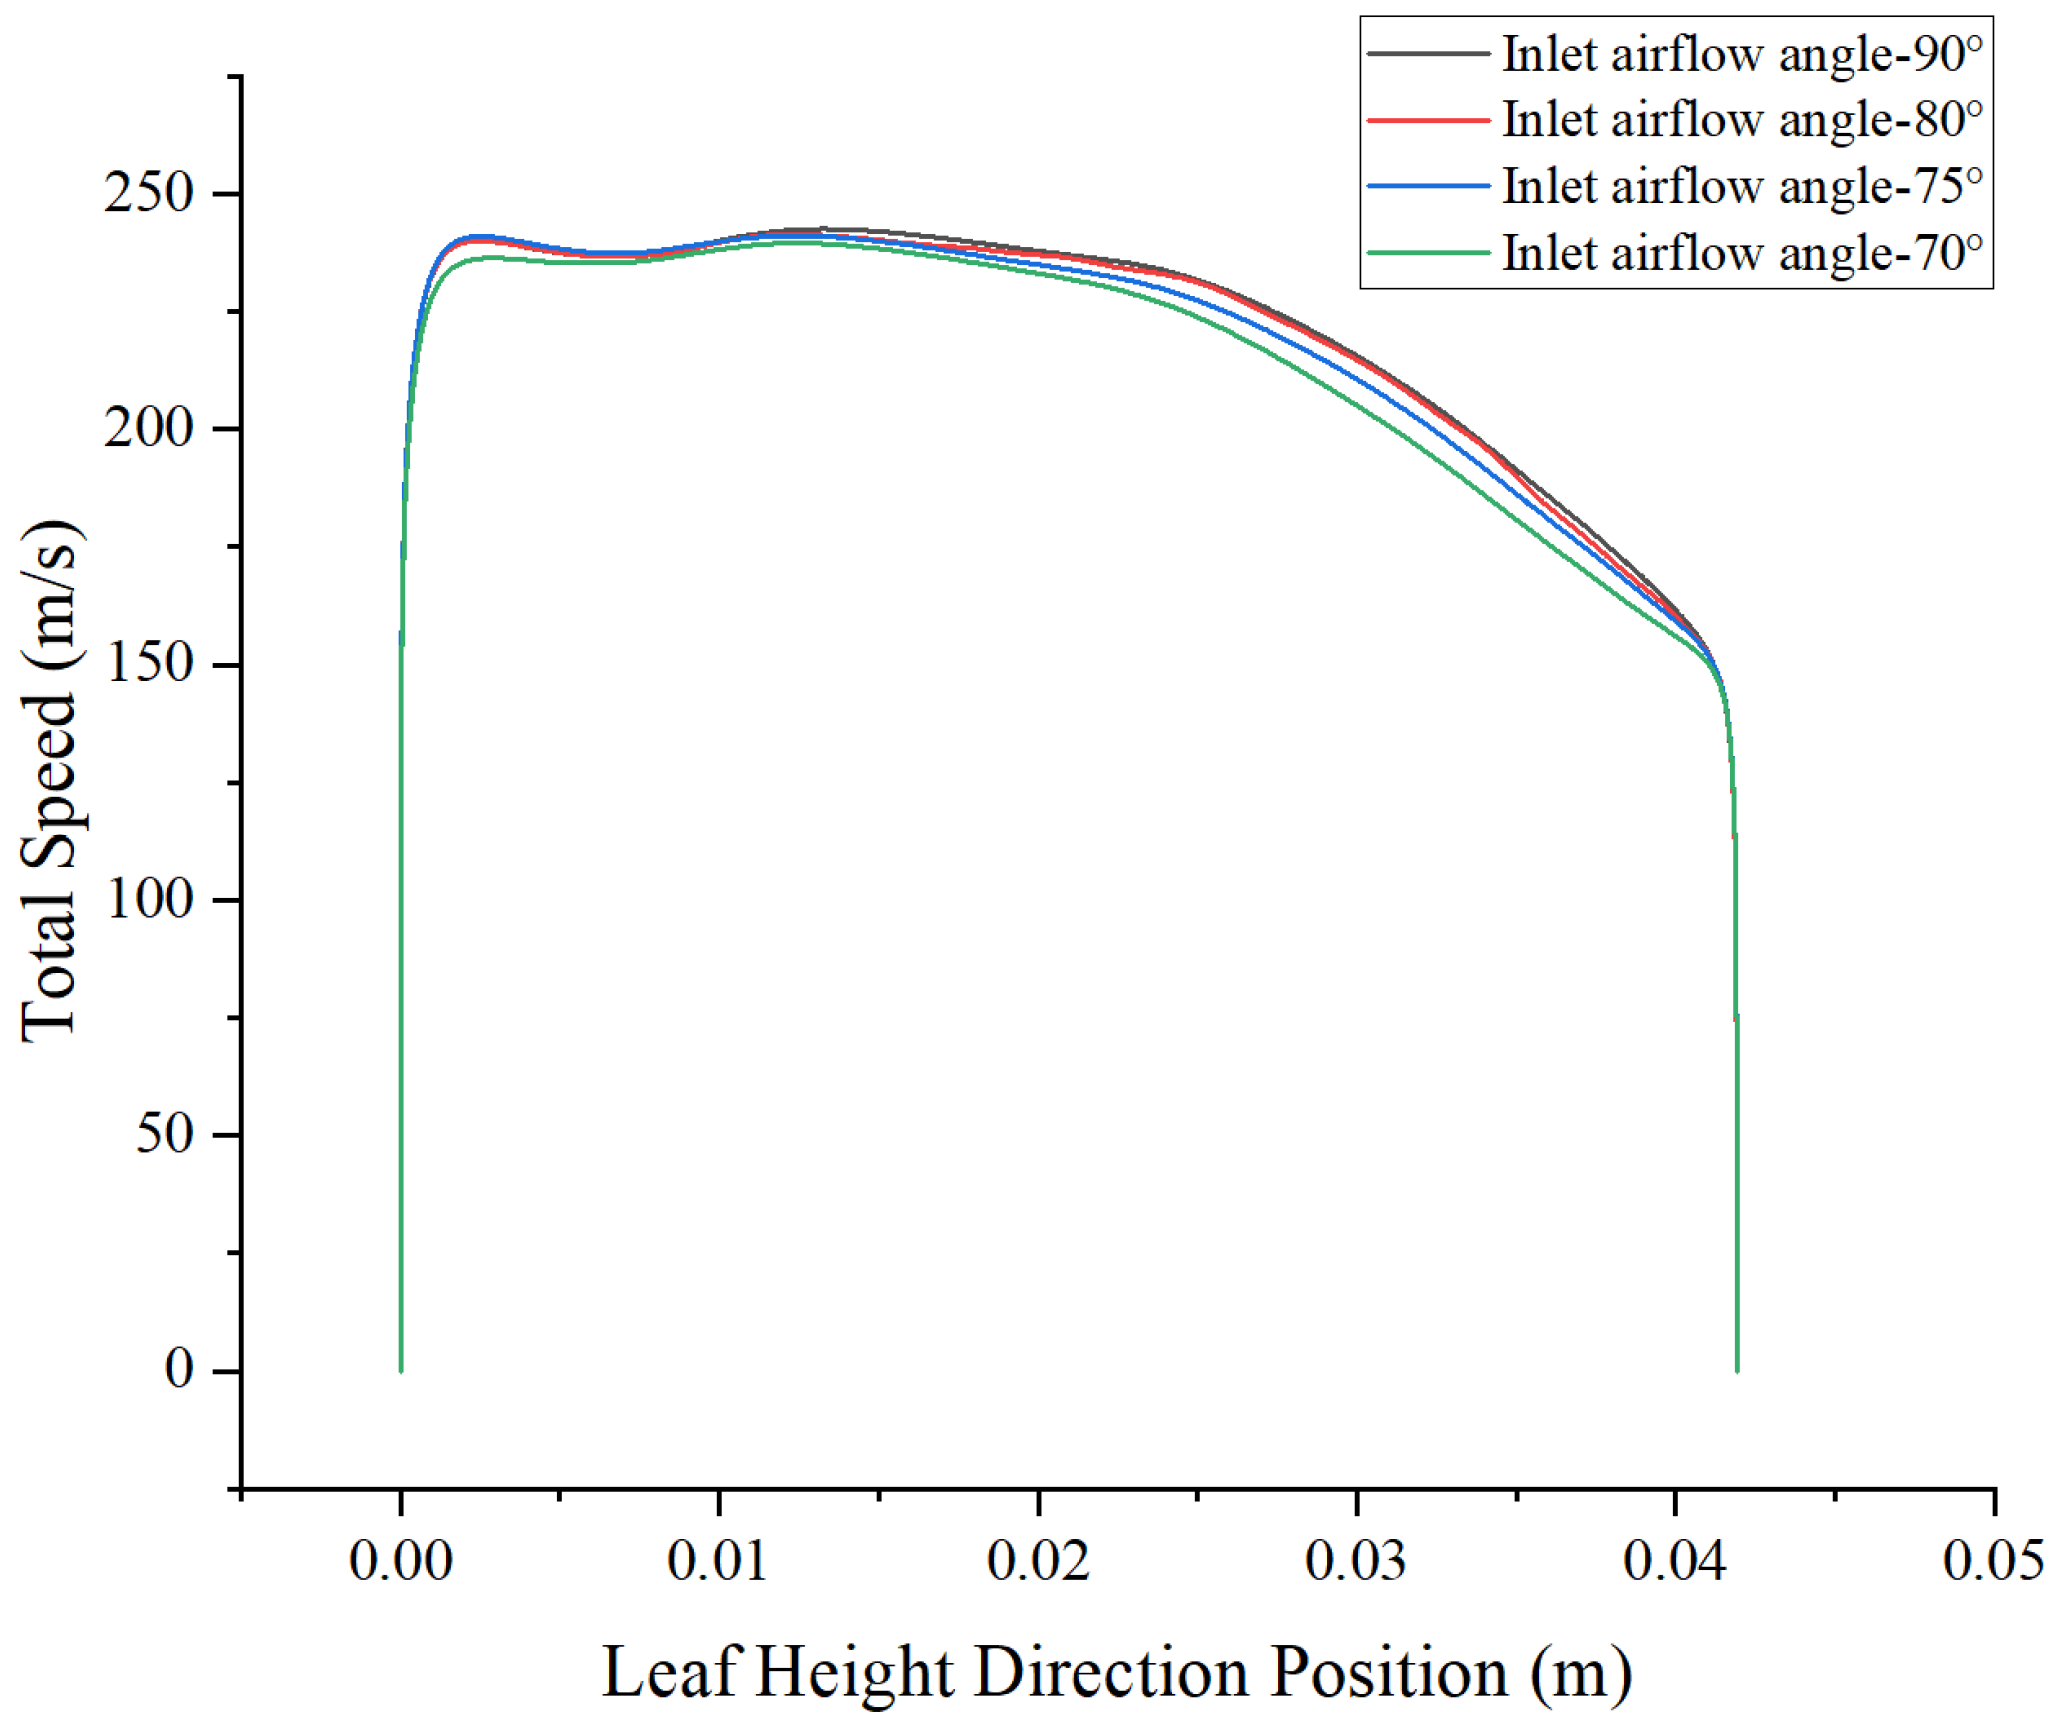
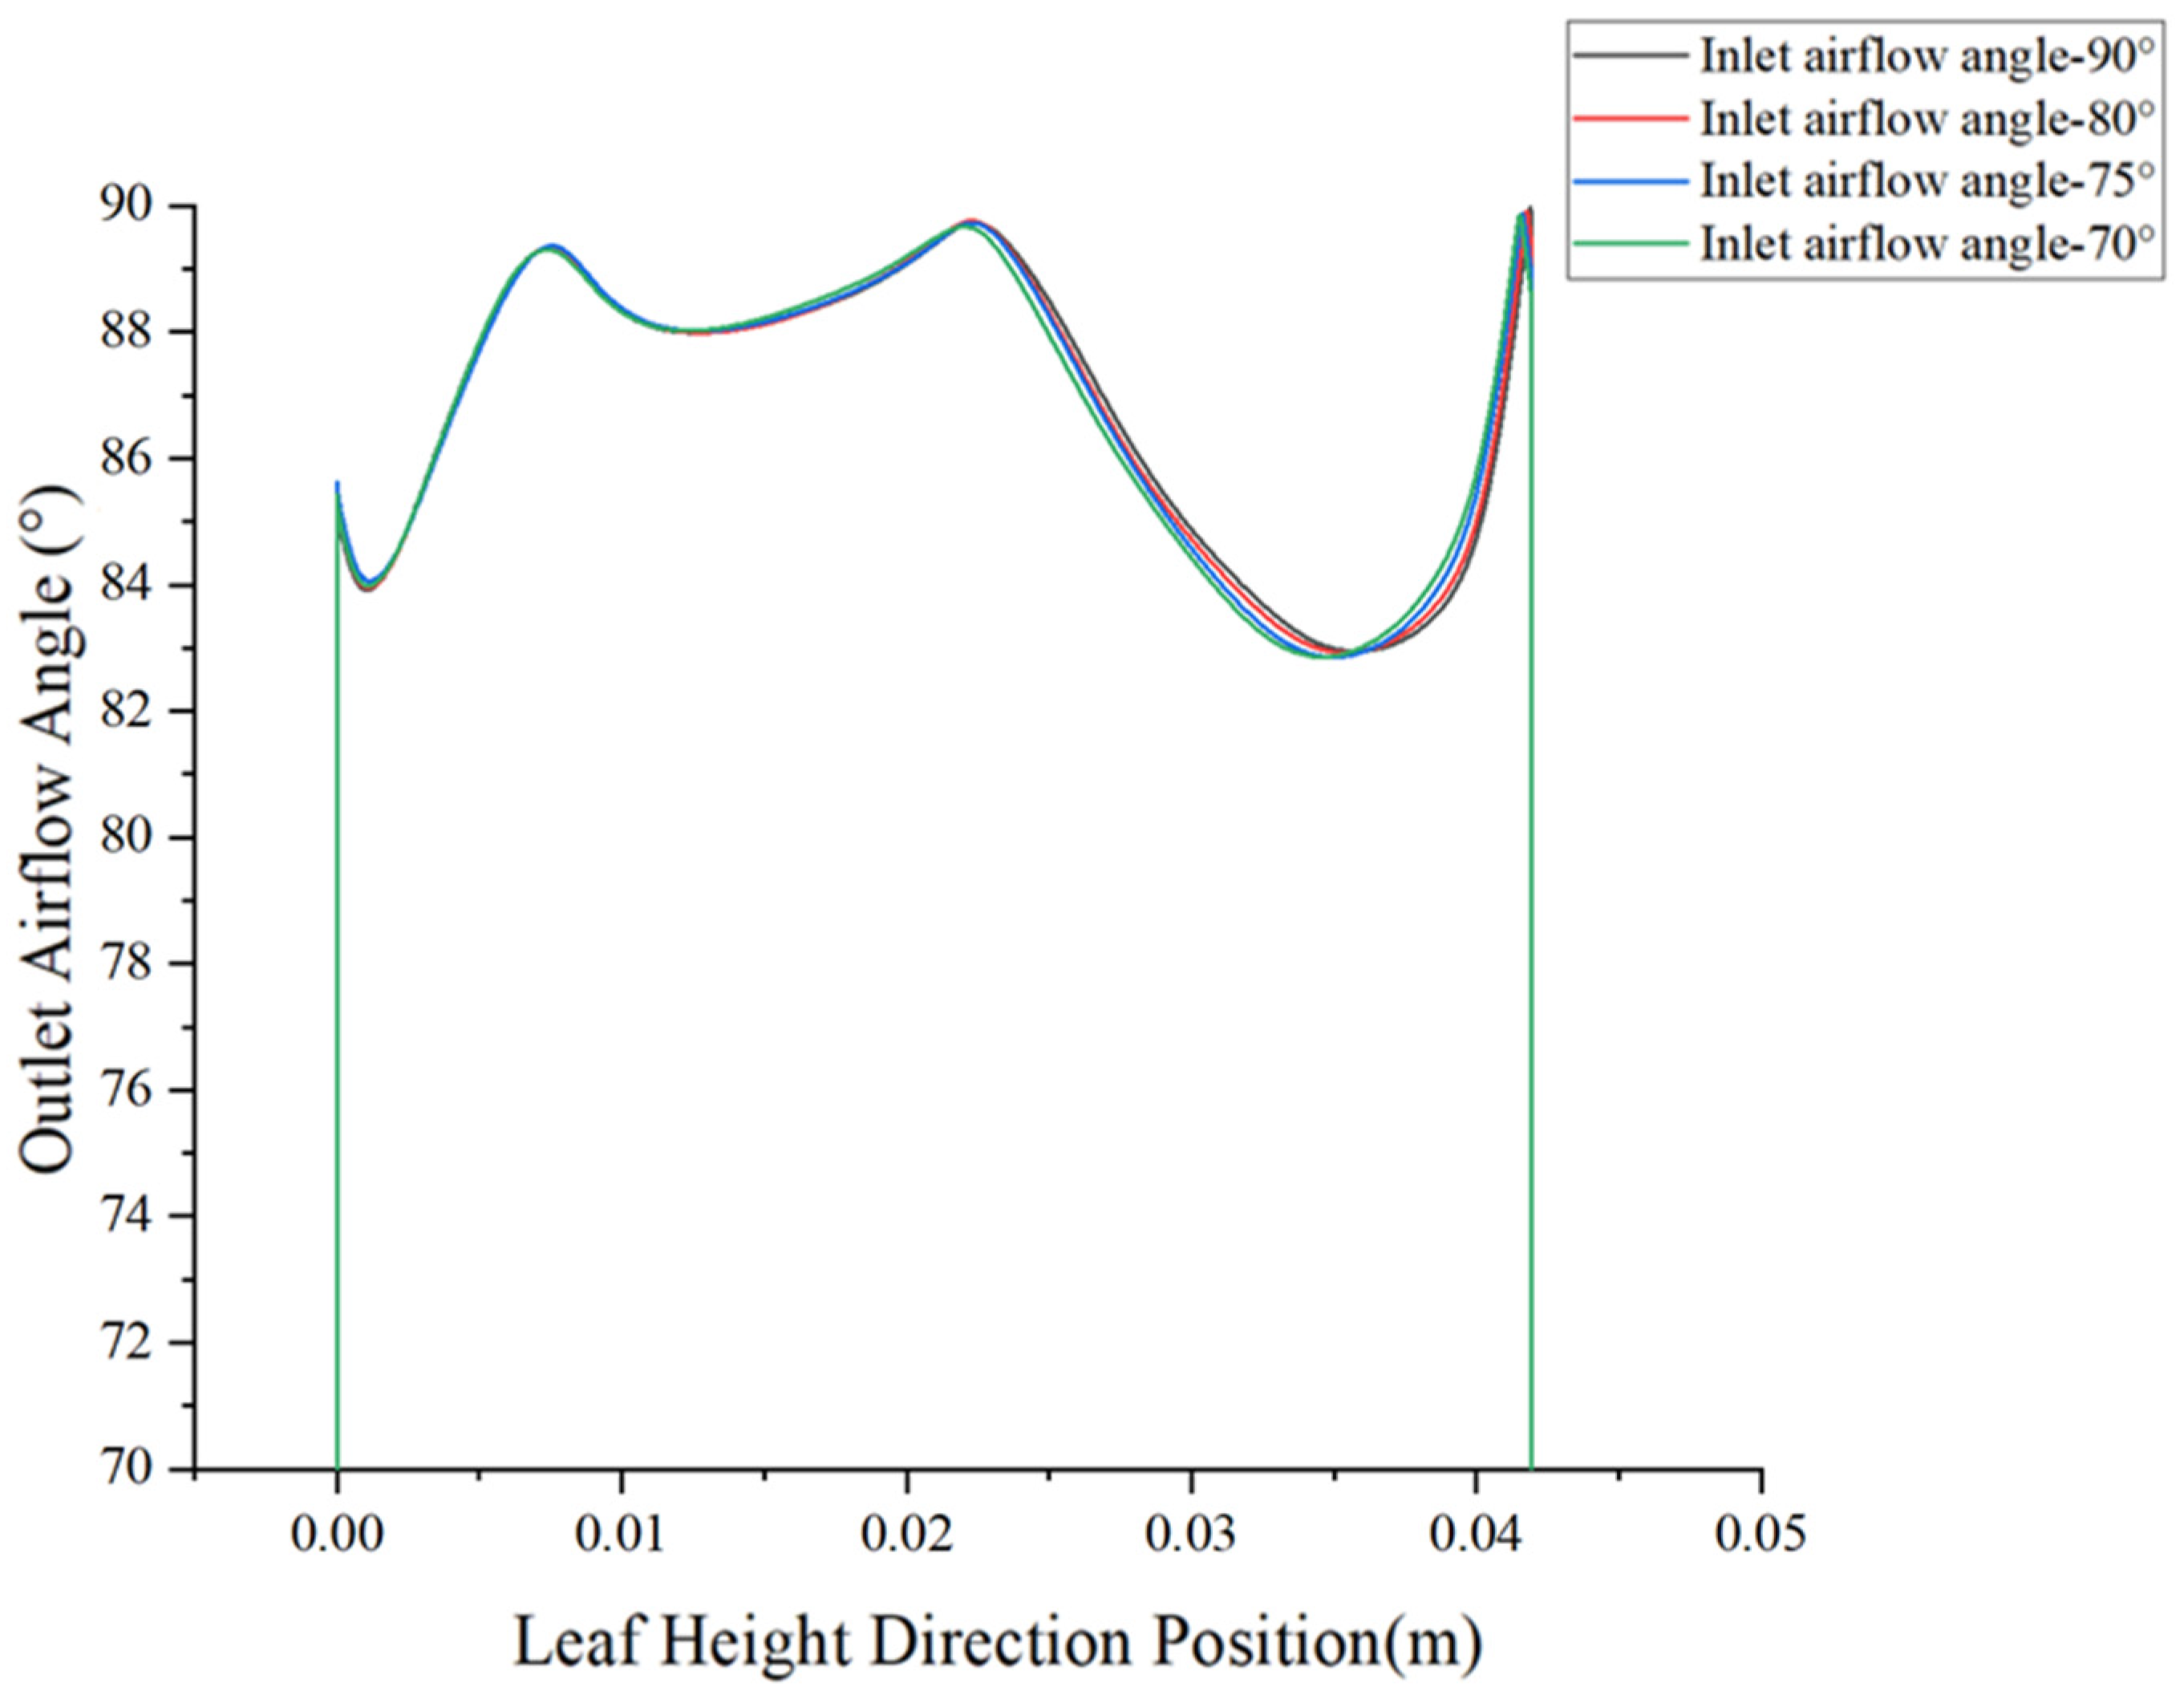
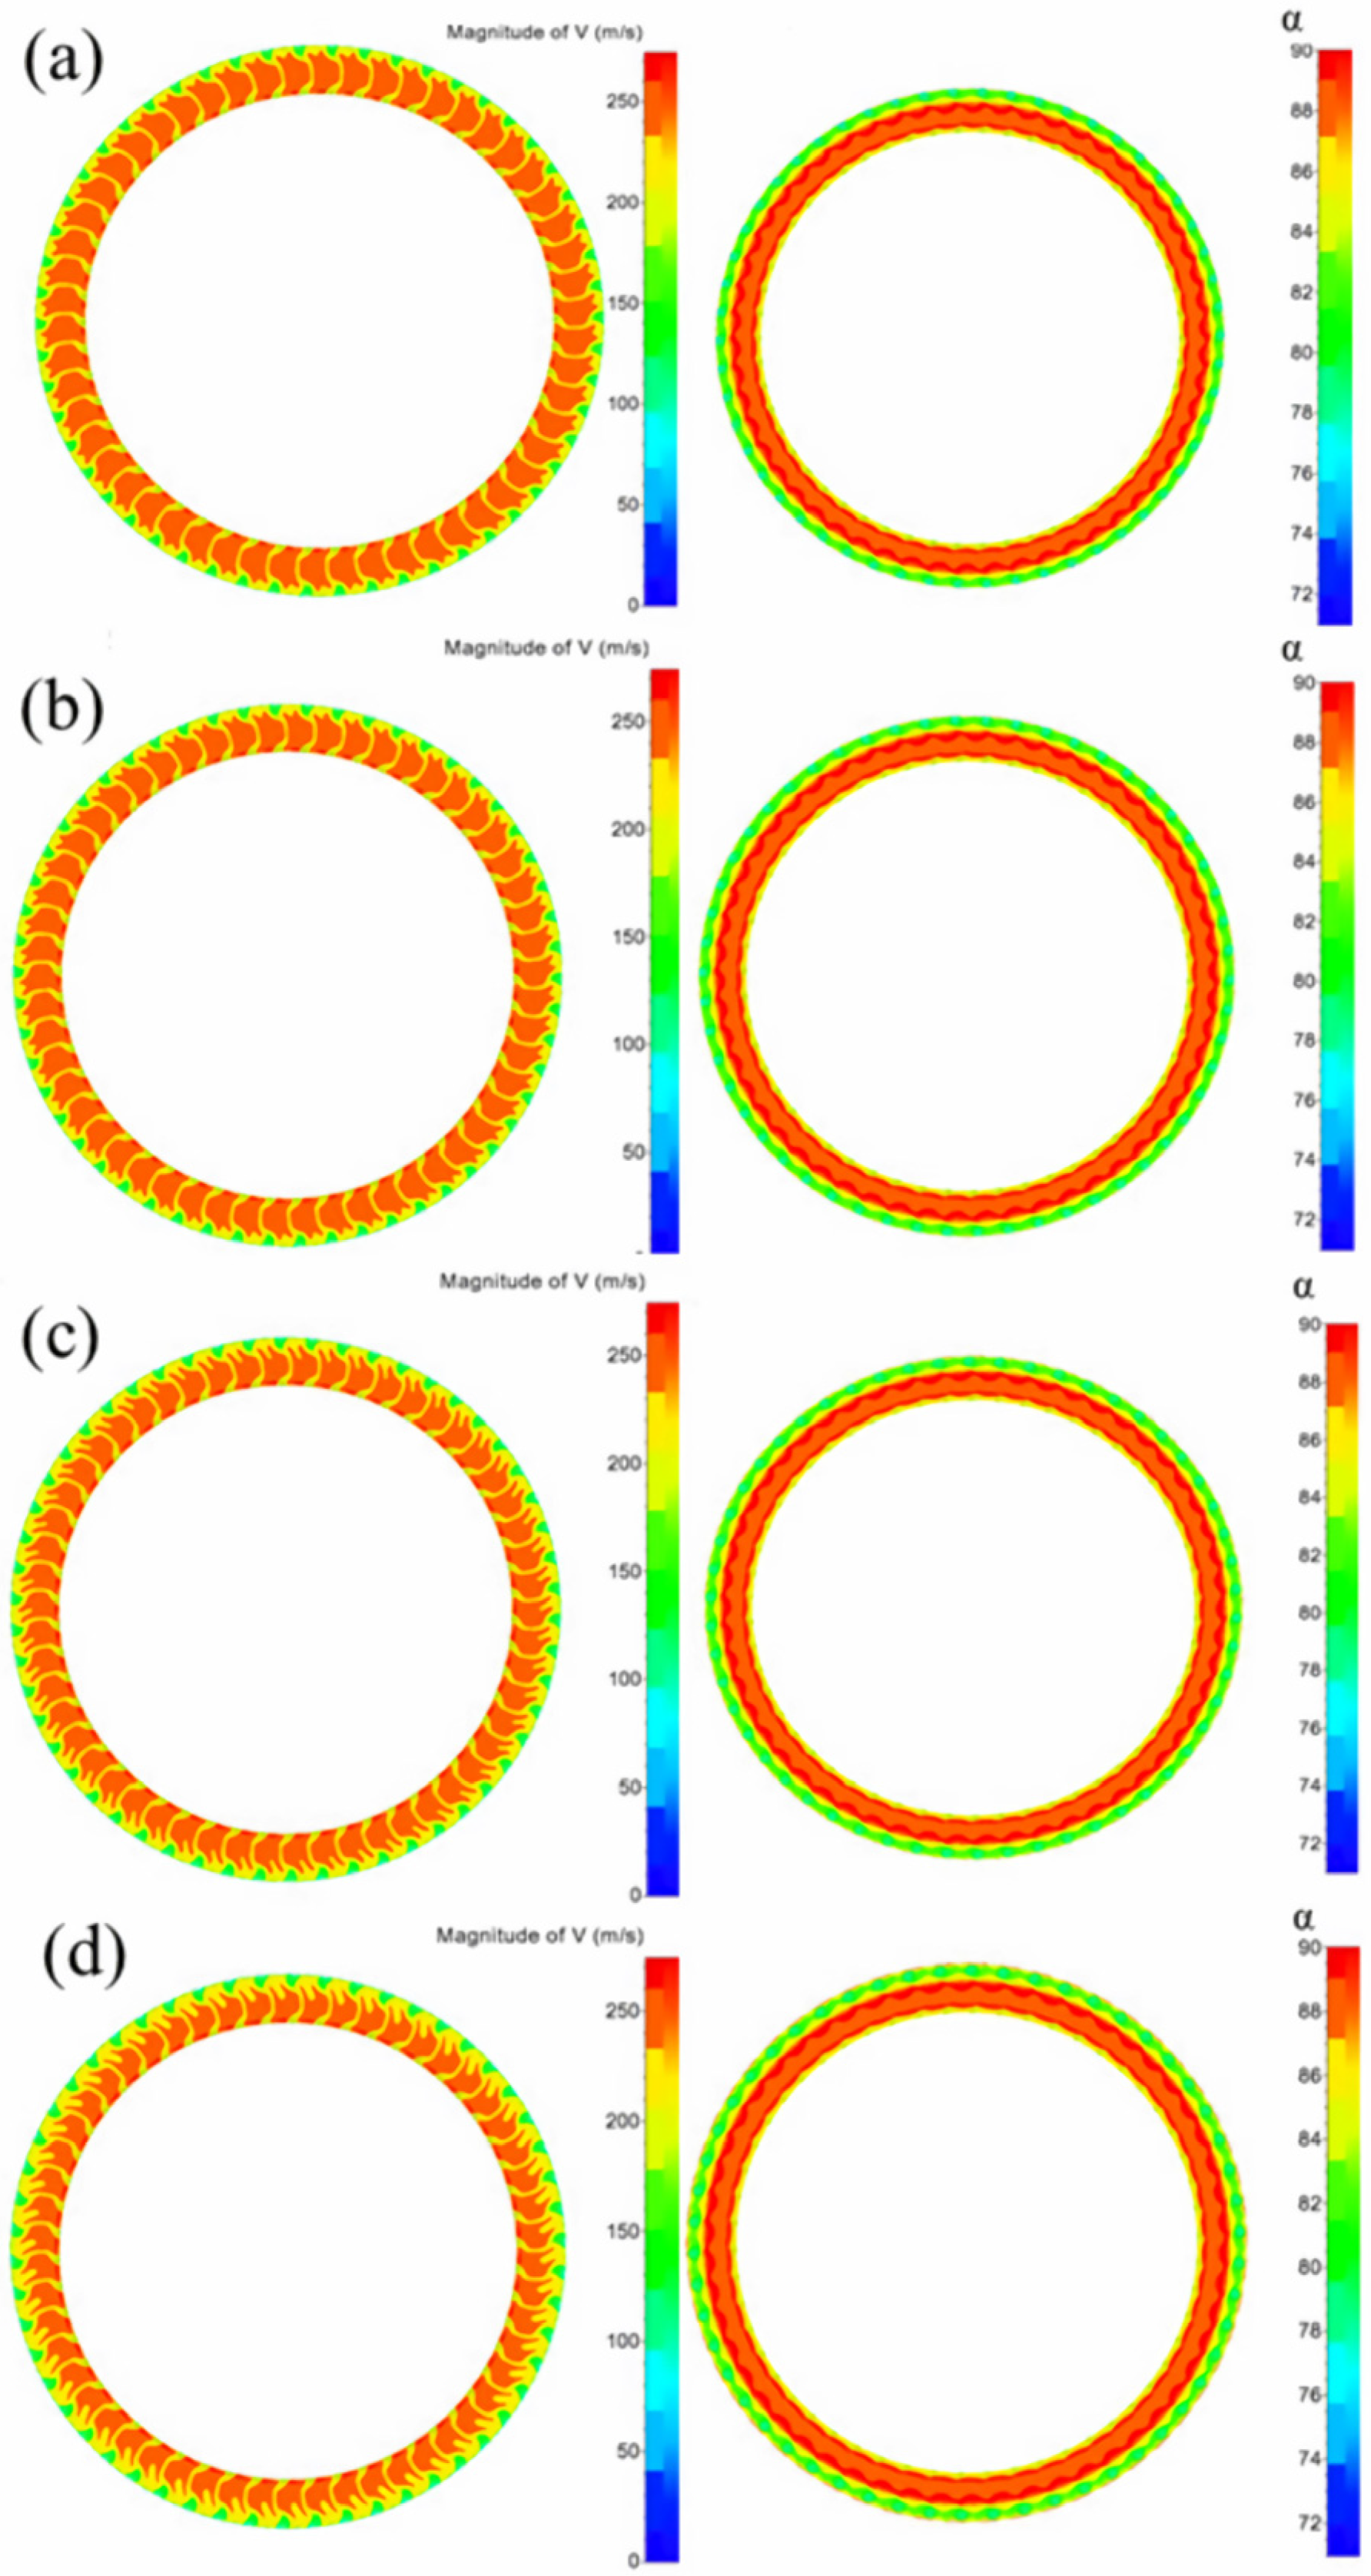
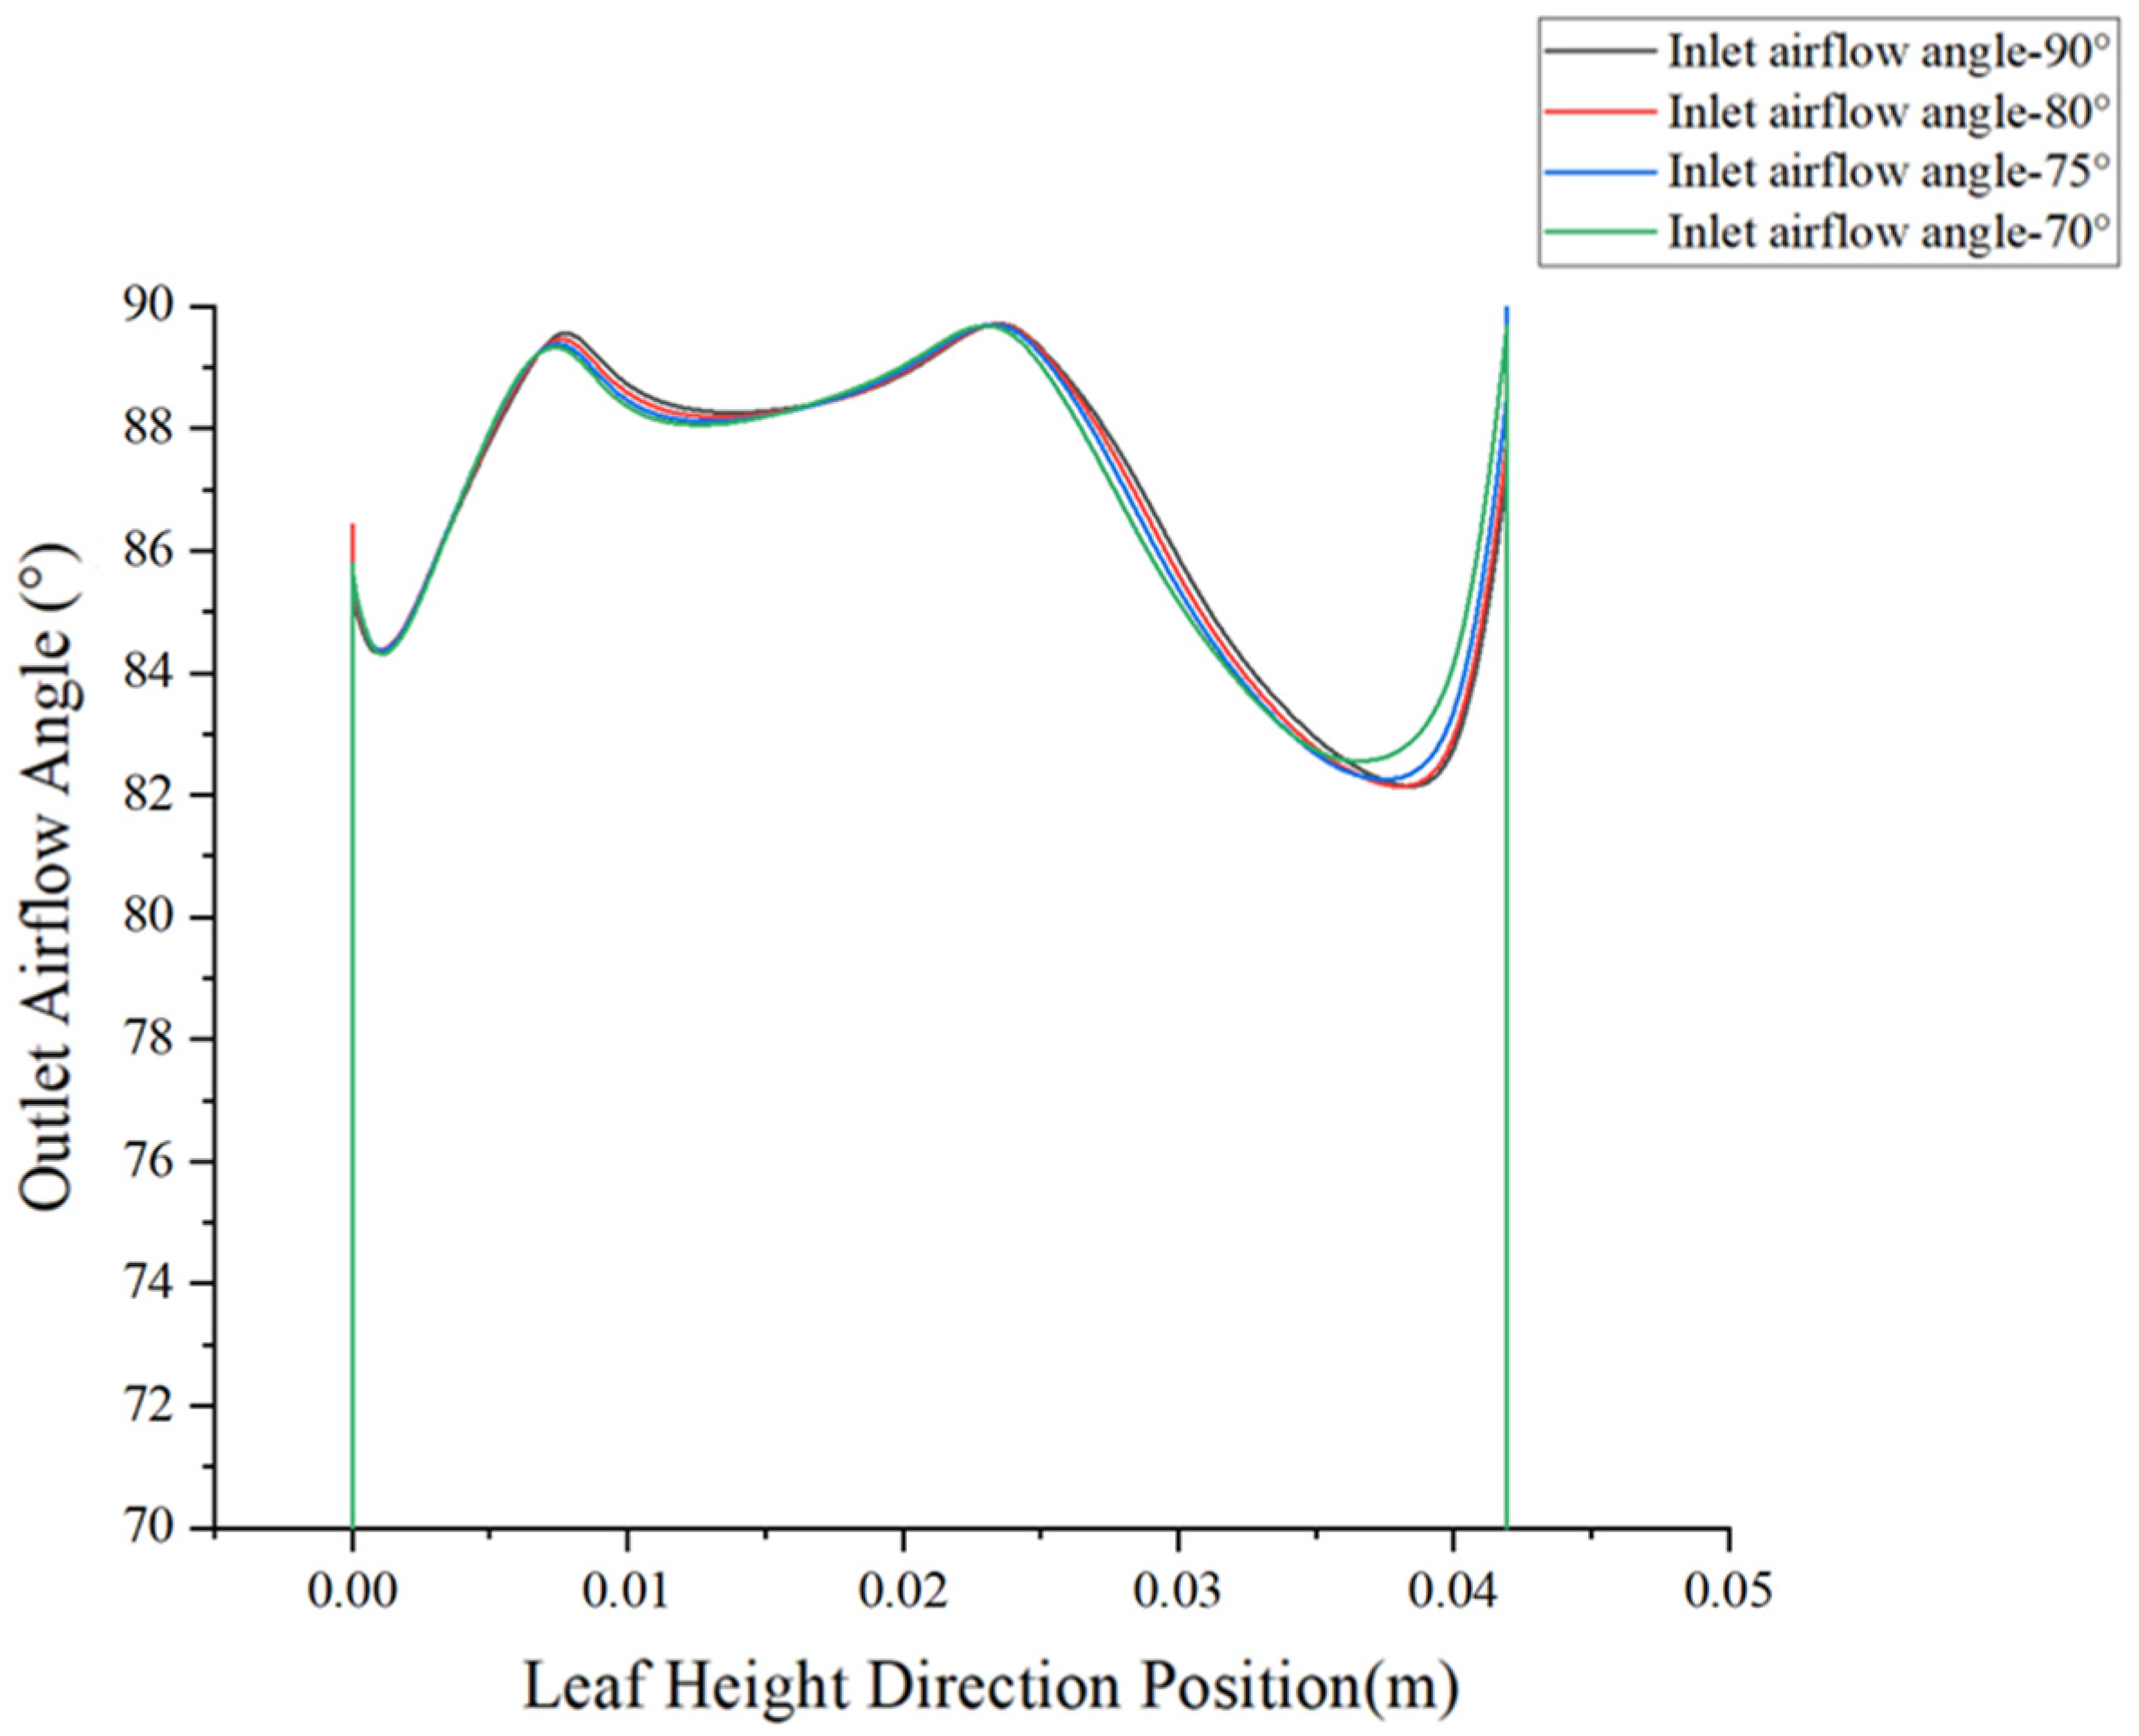
4.2.2. Effect of Different Inlet Airflow Angles at an Inlet Pressure of 1 atm

Figure 16a–d present the distribution contour maps of the total velocity and airflow deflection angle at the compressor exit under a pressure of 1 atm, with inlet airflow angles of 90°, 80°, 75°, and 70°, respectively.
Across all operating conditions, the high-velocity regions are primarily concentrated near the blade root. As the inlet airflow angle decreases, the extent of the high-velocity region gradually reduces. For instance, when the inlet angle is 90° (Figure 16a), the high-velocity region is the most symmetrical, whereas at an inlet angle of 70° (Figure 16d), the high-velocity region contracts significantly, indicating increased flow losses. Simultaneously, the low-velocity region expands as the inlet angle decreases. At an inlet angle of 70°, the low-velocity region becomes more prominent, leading to a reduction in airflow energy utilization. When the inlet angle is 90° or 80°, the velocity distribution remains relatively uniform. However, as the inlet angle decreases to 75° and 70°, the velocity gradient increases significantly, reflecting a decline in flow field stability.
High deflection angle values (close to 90°) are primarily distributed in the central region of the blade, indicating that the airflow direction in this region aligns well with the blade’s designed flow guidance. When the inlet angle is 90°, the overall contour of the exit airflow deflection angle exhibits a well-structured, stepped distribution. At inlet angles of 80°, 75°, and 70°, the contour distribution of the exit airflow deflection angle remains largely unchanged, with high and low values positioned similarly, suggesting that within this inlet angle range, variations in inlet angle have a minimal effect on the exit airflow deflection angle.
Figure 17 and Figure 18 illustrate the radial total velocity distributions and airflow deflection angle distributions at the compressor exit under 1 atm for inlet airflow angles of 90°, 80°, 75°, and 70°.
Figure 17 illustrates the radial total velocity distributions under different inlet airflow angles. For each inlet angle condition, the total velocity curve rises rapidly near the blade root region (0.00–0.01 m) before slightly leveling off and stabilizing. However, as the inlet airflow angle decreases from 90° to 70°, both the peak and overall exit total velocity exhibit a downward trend. This effect is particularly noticeable in the 0.02–0.04 m range, where the curve gradually shifts downward. The peak velocity decreases from 242 m/s at an inlet angle of 90° to 239 m/s at 70°, representing a reduction of approximately 1.2%. Similarly, the average velocity decreases from 219.44 m/s to 214.44 m/s, corresponding to a 2.2% reduction. These results indicate that a decrease in inlet airflow angle slightly weakens compressor performance, although the effect remains minimal.
Figure 18 presents distributions of airflow deflection angles along the blade height under different inlet airflow angles. The deflection angle curves exhibit significant variations near the blade root and tip regions (approximately 0.00 m and 0.04 m, respectively), while remaining relatively stable in the middle section of the blade (0.01–0.03 m). As the inlet airflow angle decreases, the deflection angle curves shift leftward overall, although the peak values remain largely unchanged. The peak deflection angle decreases slightly from 82.89° at an inlet angle of 90° to 82.8° at 70°, with a negligible difference of only 0.1%. Additionally, the peak position shifts from 0.03565 m at an inlet angle of 90° to 0.03417 m at 70°, resulting in a deviation of 1.48 mm. The average deflection angle decreases from 85.45° to 84.18°, representing a reduction of 1.5%.
In summary, within a 20° variation in inlet airflow angle, the peak velocity changes by only 1.2%, the average velocity by 2.2%, the peak deflection angle by 0.1%, the peak position shifts by 1.48 mm, and the average deflection angle decreases by 1.5%. These findings indicate that the distribution of exit total velocity and airflow deflection angle is only minimally affected by variations in inlet airflow angle.

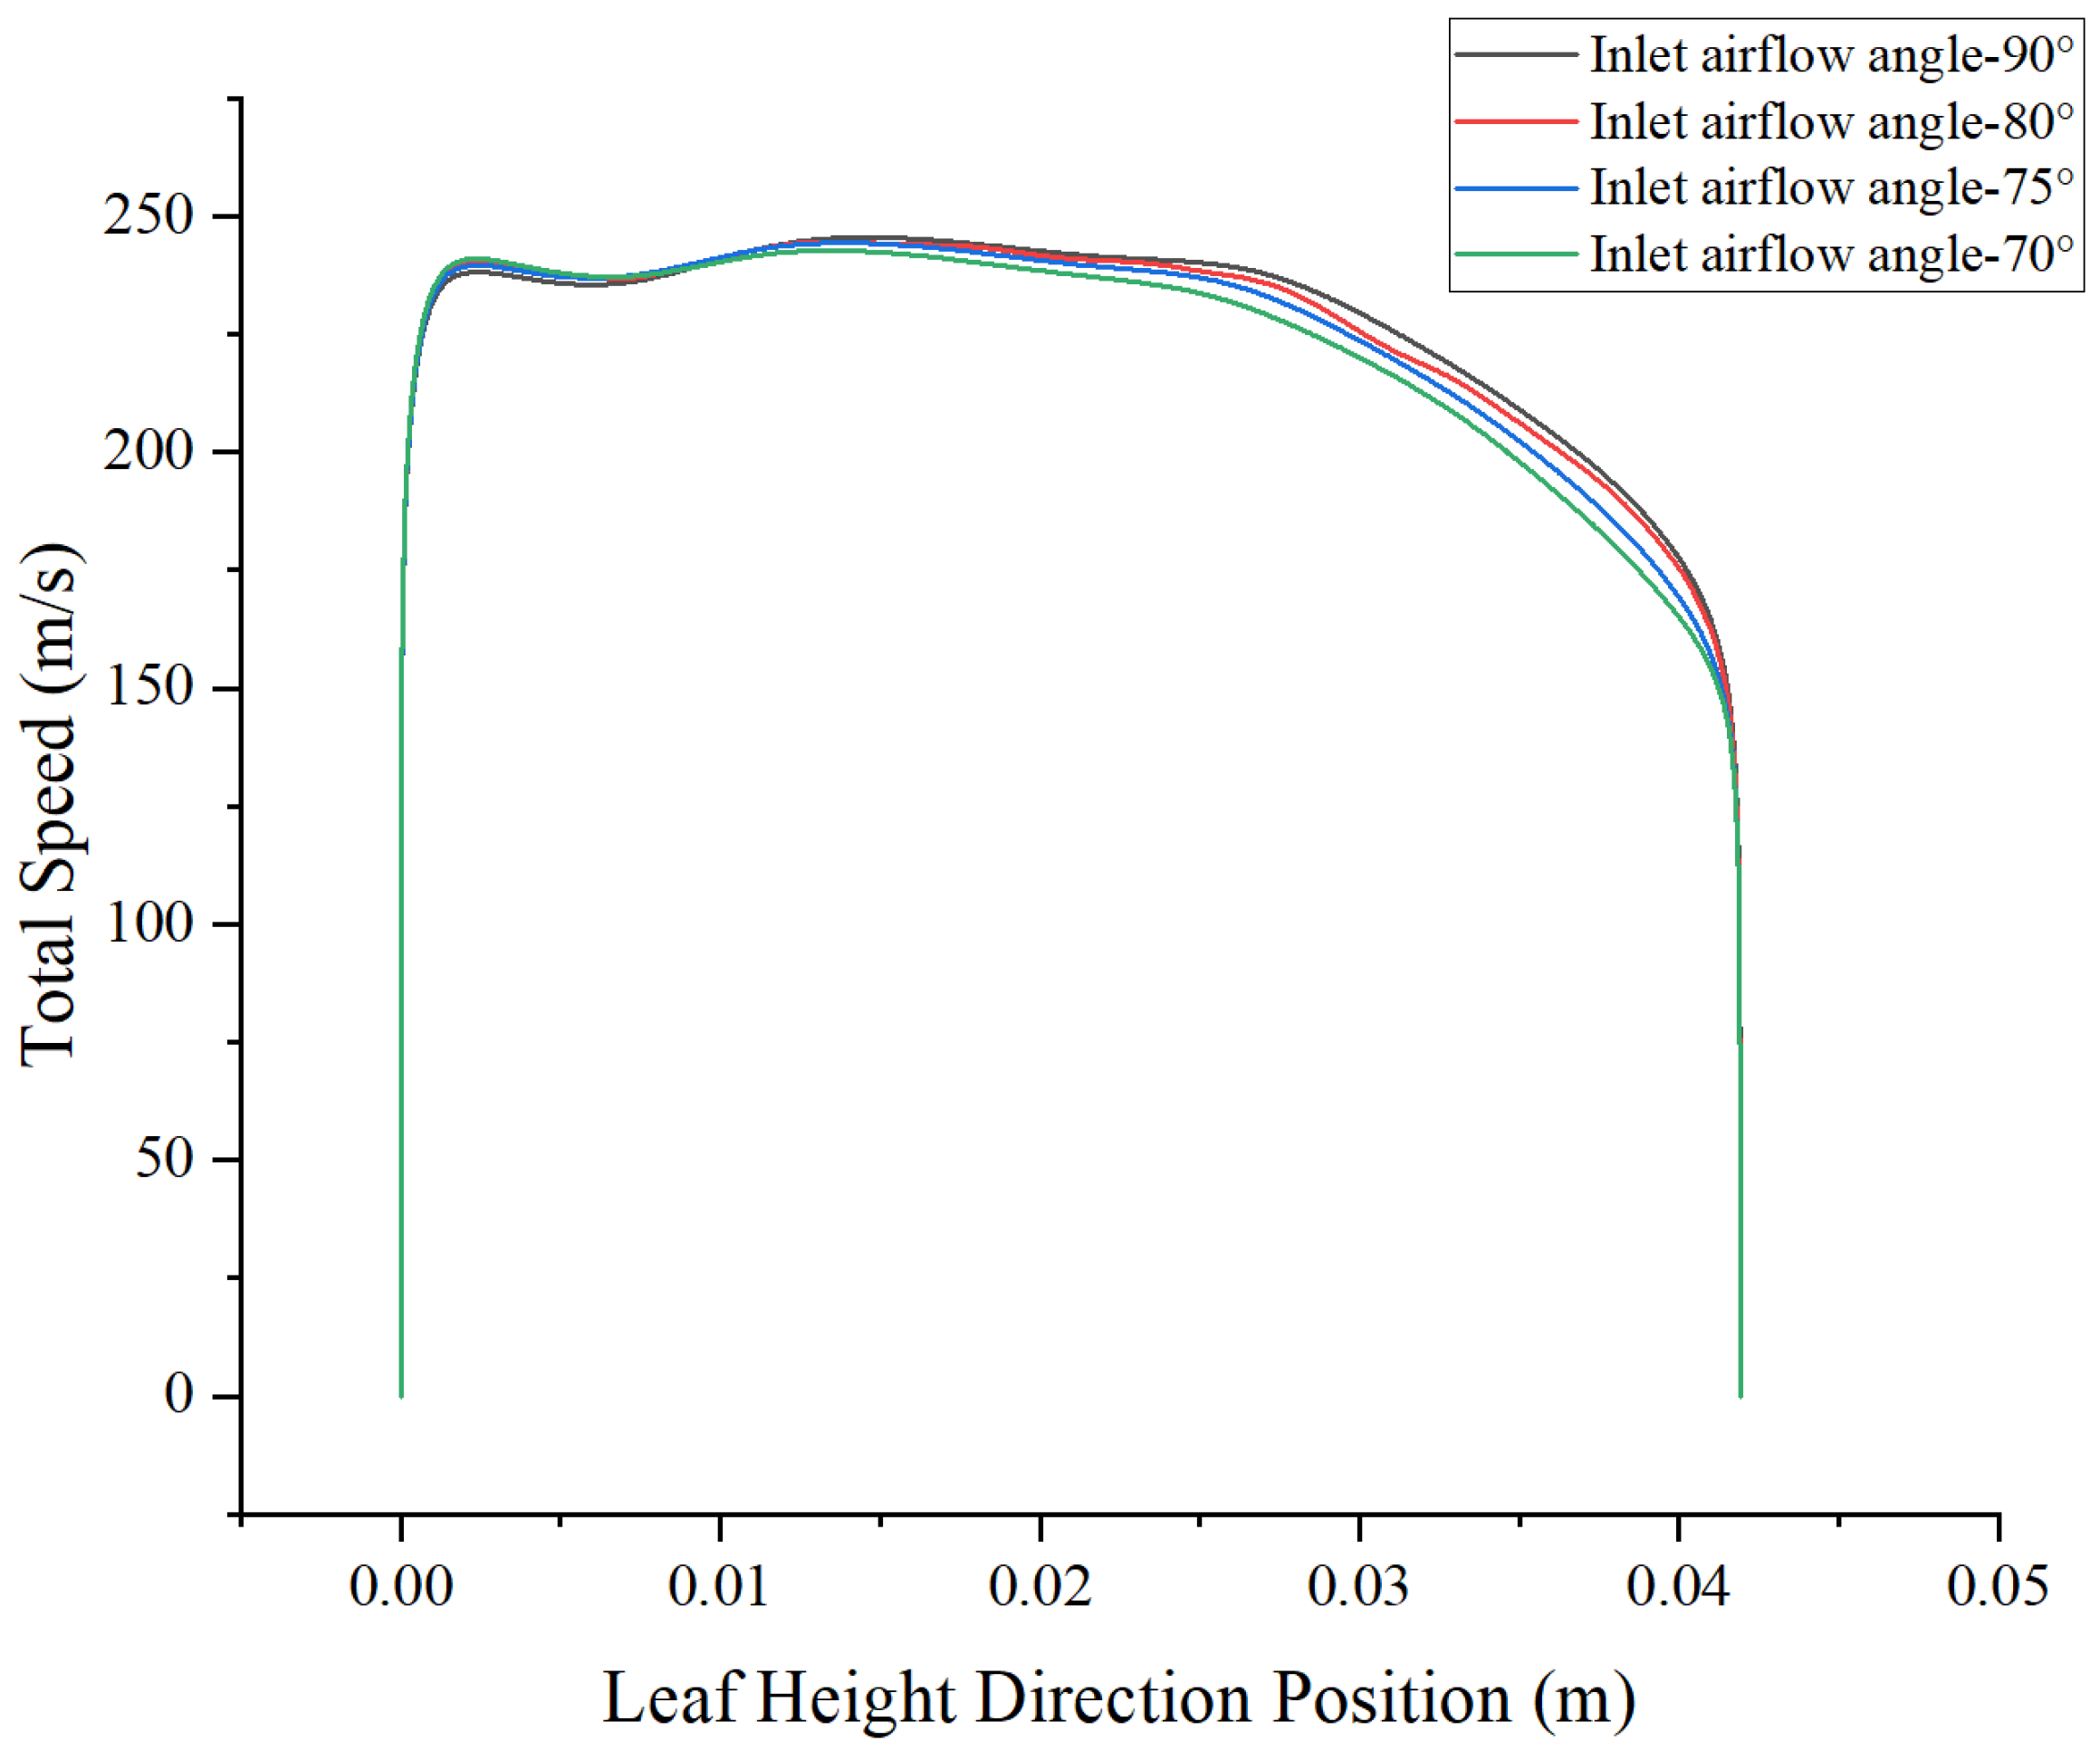
4.2.3. Effect of Different Inlet Airflow Angles at an Inlet Pressure of 1.05 atm

Figure 19a–d present the distribution contour maps of the total velocities and airflow deflection angles at the exit of the multi-stage axial-flow compressor under an inlet total pressure of 1.05 atm and inlet airflow angles of 90°, 80°, 75°, and 70°. The variations in inlet airflow under the 1.05 atm condition exhibit a similar trend to those observed under the 1 atm condition.
Across all operating conditions, the high-velocity region is primarily concentrated from the middle of the blade to the blade root. As the inlet airflow angle decreases, the extent of the high-velocity region gradually shrinks, and the velocity distribution becomes more non-uniform. When the inlet airflow angle is 90° (Figure 19a), the high-velocity region at the exit is the most symmetrical and evenly distributed, with the highest peak velocity. In contrast, at an inlet airflow angle of 70° (Figure 19d), the high-velocity region contracts while the low-velocity region expands, particularly near the blade tip and root, indicating increased flow losses and a slight degradation in local flow performance.
High deflection angle values (close to 90°) are primarily concentrated in the central region of the blade, indicating that the airflow direction in this region closely aligns with the blade’s intended aerodynamic guidance. At larger inlet airflow angles (90° and 80°), the high deflection angle region is more extensive, suggesting better directional alignment with the blade design. As the inlet airflow angle decreases (75° and 70°), the high deflection angle region gradually contracts, implying reduced airflow guidance by the blade and decreased flow field stability. Low deflection angle regions (below 76°) are primarily distributed near the blade tip and root, and as the inlet airflow angle decreases, these regions expand, though the variation remains relatively small.
Figure 20 presents the total velocity distributions along the blade height (radial direction) at different inlet airflow angles (90°, 80°, 75°, and 70°). Under an inlet pressure of 1.05 atm, a key difference from the 1 atm condition is the monotonic decrease in peak velocity as the inlet airflow angle decreases. At an inlet airflow angle of 90°, the peak velocity reaches 245.6 m/s, while at 70°, it decreases to approximately 242.7 m/s, representing a deviation of 1.18%. However, the average velocity follows the same trend as under the 1 atm condition, decreasing from 227.033 m/s to 221.736 m/s, a reduction of 2.3%.
As the inlet airflow angle decreases (from 90° to 70°), the velocity distribution gradually becomes more non-uniform, with velocity increasing near the blade root and decreasing near the blade tip. At an inlet airflow angle of 70°, the exit velocity distribution exhibits the highest degree of non-uniformity, indicating reduced flow field stability and significantly increased flow losses.
Figure 21 presents the distributions of airflow deflection angles α along the blade height under different inlet airflow angles (90°, 80°, 75°, and 70°). As the inlet airflow angle increases, the curve exhibits a monotonic shift towards the upper left. The peak exit airflow deflection angle increases from 82.1° at an inlet angle of 90° to 82.53° at 70°, a difference of 0.5%. The peak position shifts from x = 0.03826 m to x = 0.03713 m, with a displacement of 1.13 mm. Meanwhile, the average deflection angle decreases from 84.86° to 84.21°, a reduction of 0.76%.
The high deflection angle region (close to 90°) is primarily concentrated in the mid-blade region, with a relatively wide distribution, indicating strong airflow guidance. In contrast, the low deflection angle region (below 85°) is mainly distributed near the blade tip and root, suggesting more pronounced flow separation and turbulence.
In summary, under an inlet pressure of 1.05 atm, inlet airflow deflection angles below 20° have a minimal effect on the exit total velocity and airflow deflection angle. The maximum deviation in peak velocity is 0.7%, while the maximum deviation in average velocity is 0.43%. The peak deflection angle changes by 0.5%, with the peak position shifting by 1.13 mm and a deflection angle difference of 2.6°. The average airflow deflection angle varies by 0.76%.

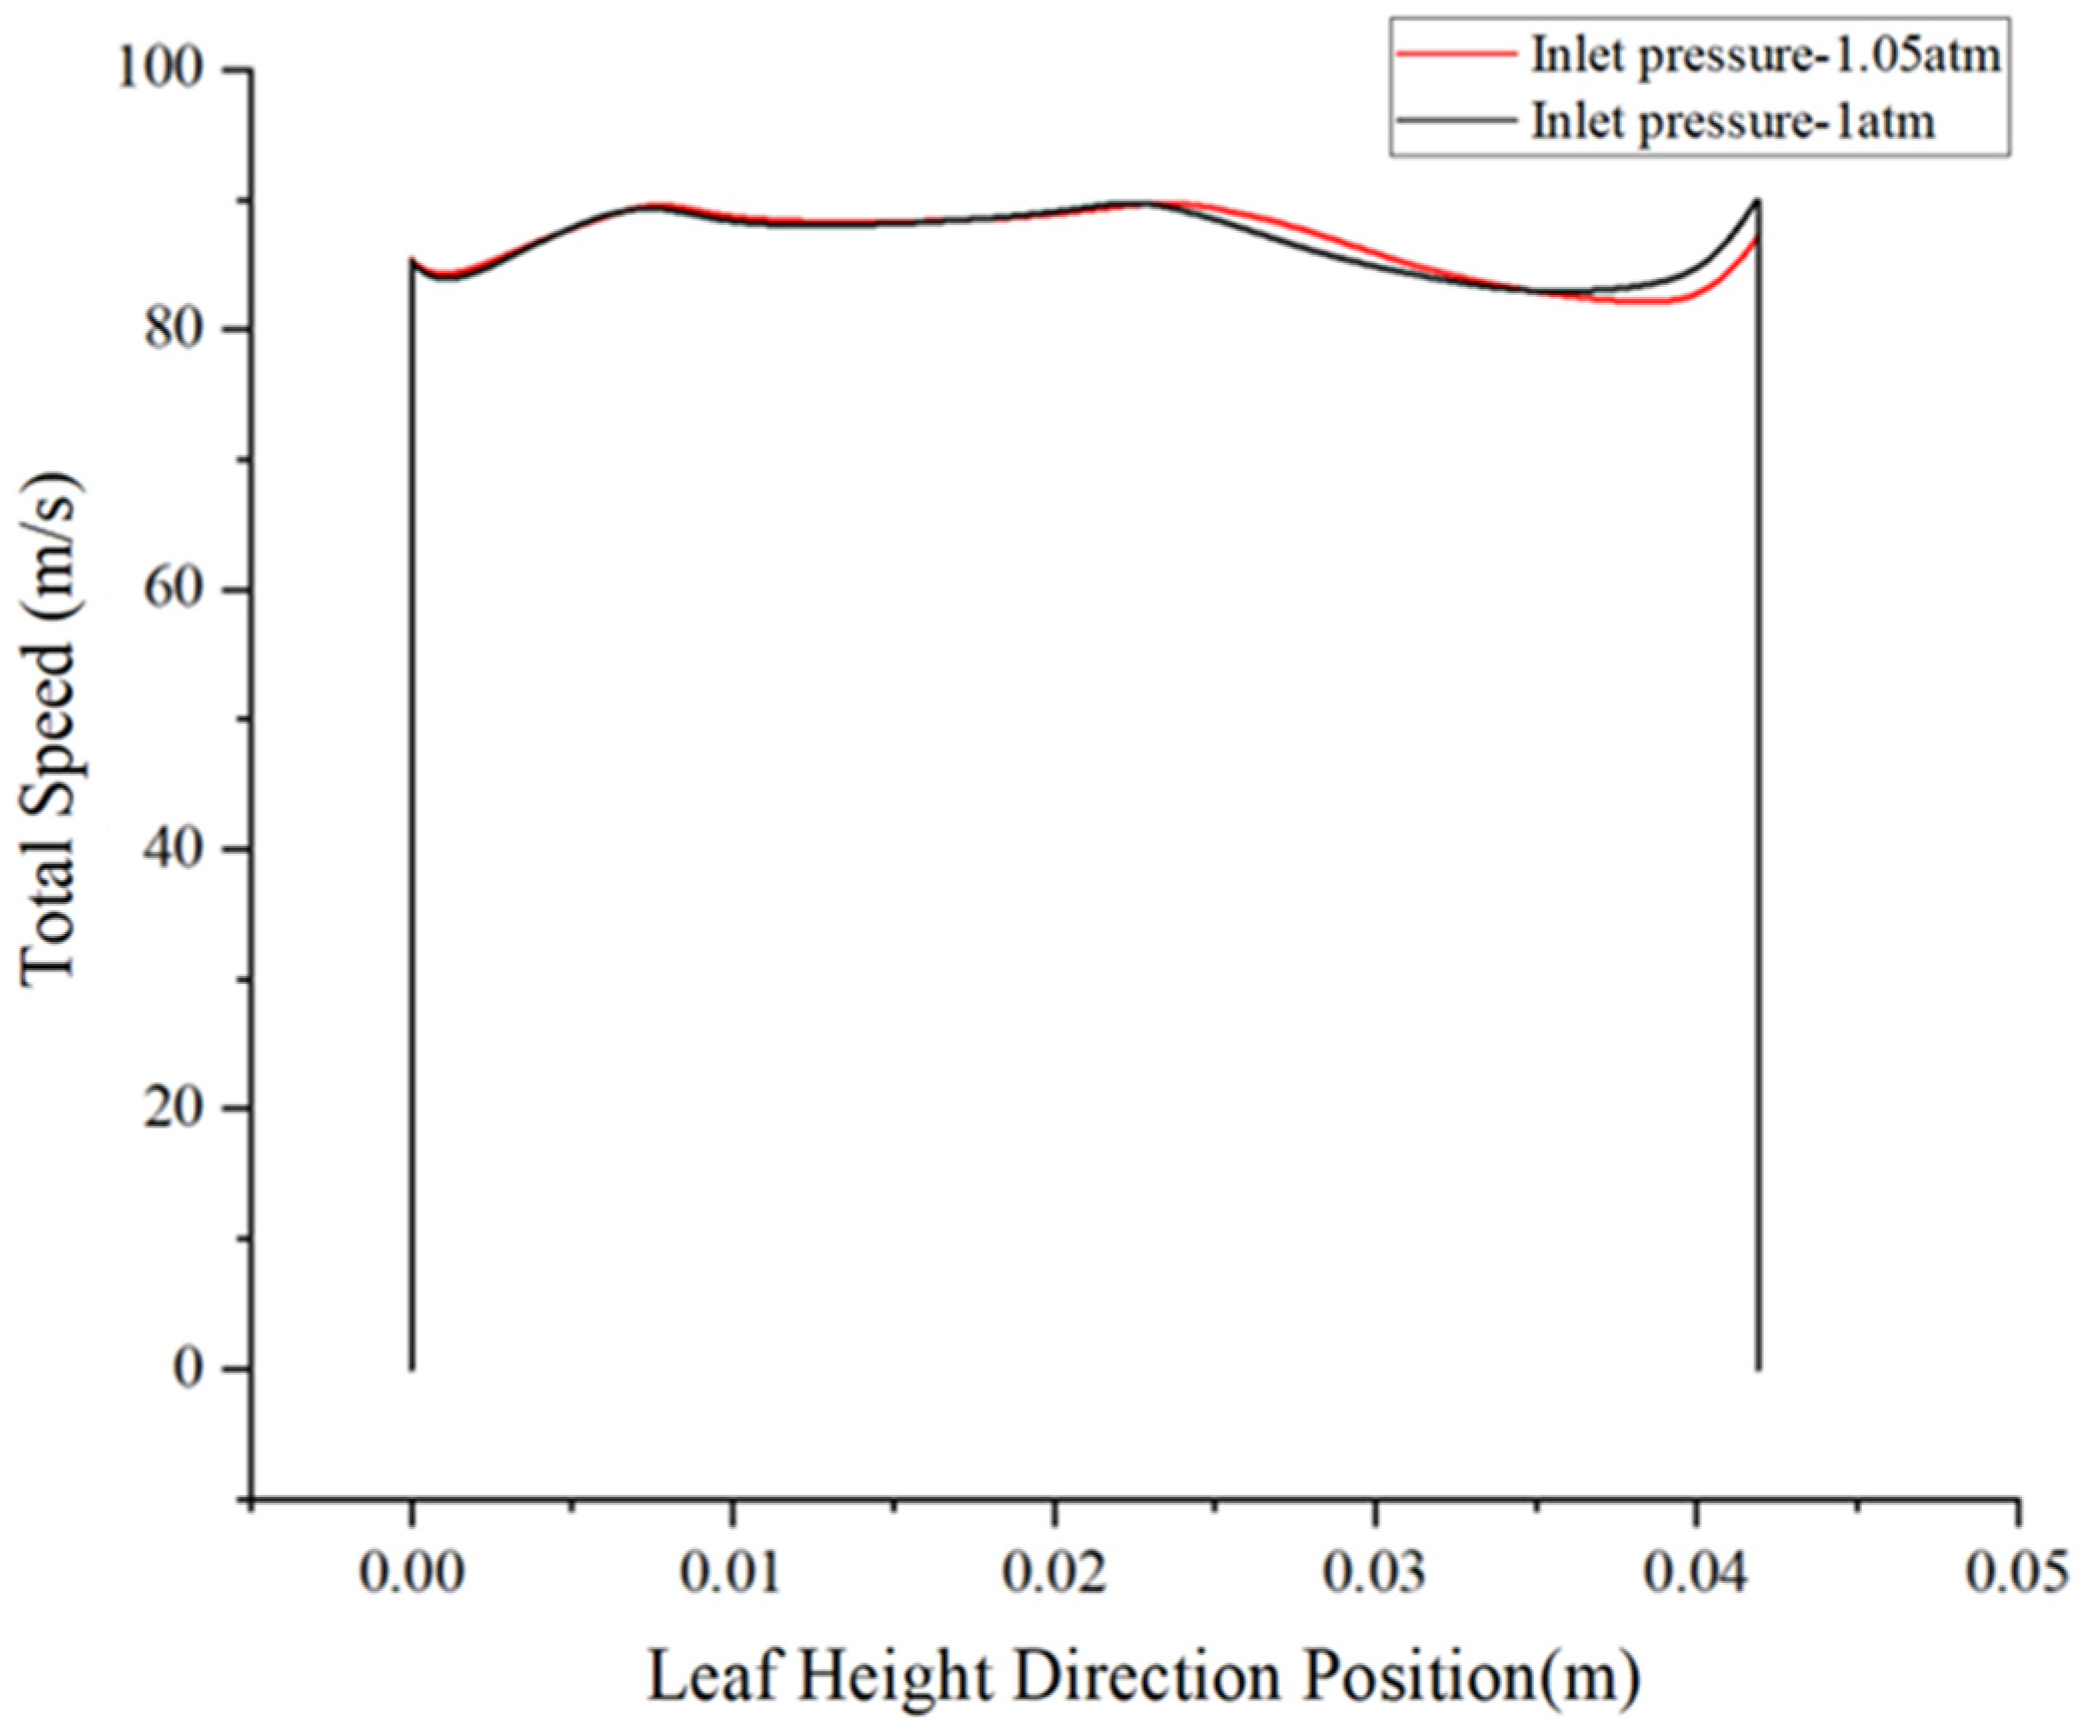
4.2.4. Effect of Different Compressor Inlet Pressures on the Exit Flow Field

Figure 22 and Figure 23 illustrate the radial midline total velocity distributions and airflow deflection angle distributions at the compressor exit under inlet pressures of 1.05 atm and 1 atm, respectively.
Figure 22 presents distributions of the average radial total velocity at the exit under different inlet pressures. The overall velocity distribution trends under both pressure conditions are highly consistent. However, at an inlet pressure of 1.05 atm, the total exit velocity is slightly higher than that under the 1 atm condition, with the difference being more pronounced in the mid-blade region. An increase in inlet pressure enhances airflow density, thereby improving mass flow and exit kinetic energy, which explains the overall increase in total velocity under the 1.05 atm condition. Under both pressure conditions, the velocity is lower at the blade tip due to boundary layer effects and local flow losses. The peak velocity at an inlet pressure of 1.05 atm is 245 m/s, compared to 242.6 m/s at 1 atm, representing a difference of 0.98%. The average velocities are 227.033 m/s and 219.44 m/s, respectively, with a deviation of 3%. Additionally, at the point of maximum difference, the velocities are 212 m/s and 198 m/s, respectively, resulting in a 6% variation.
Figure 23 presents distributions of the exit airflow deflection angle under different inlet pressures. Under both pressure conditions, the deflection angle ranges approximately between 80° and 90°. At an inlet pressure of 1.05 atm, the overall deflection angle is slightly higher than that under the 1 atm condition, with smaller variations, indicating that higher inlet pressure helps improve airflow guidance. Under the 1.05 atm condition, the deflection angle distribution is smoother and more uniform, particularly in the mid-blade region. The average deflection angles at 1.05 atm and 1 atm are 84.8° and 84.2°, respectively, with a difference of 0.7%. Additionally, at the point of maximum difference, the deflection angles are 84.4° at 1 atm and 82.5° at 1.05 atm, resulting in a deviation of 1.9°.
In summary, a slight increase in inlet pressure results in a generally consistent distribution trend for both exit velocity and airflow deflection angle at the compressor exit, indicating that variations in inlet pressure have a minimal impact on the overall flow field structure.

4.2.5. Summary of the Effects of Inlet Flow Angle and Inlet Pressure on Exit Flow Field Characteristics

Table 3 shows the variations in the compressor exit flow field characteristics (exit velocity and airflow deflection angle) under different inlet flow angles (90°, 80°, 75°, and 70°) and two inlet pressures (1 atm and 1.05 atm). The table provides the peak exit velocity, average exit velocity, peak airflow deflection angle, and average airflow deflection angle for each operating condition, offering a clearer illustration of how changes in inlet pressure and flow angle impact the exit flow field.
Under both 1 atm and 1.05 atm inlet pressures, as the inlet flow angle decreases, both the peak and average exit velocities gradually decrease. For instance, when the inlet flow angle decreases from 90° to 70°, the peak exit velocity decreases from 242.7 m/s to 239 m/s at 1 atm, representing a 1.5% reduction. Similarly, the average exit velocity decreases from 219.44 m/s to 214.44 m/s, a decrease of approximately 2.3%. At the same time, the airflow deflection angles (both peak and average) increase, particularly at lower inlet flow angles, with more pronounced changes observed.
An increase in inlet pressure from 1 atm to 1.05 atm results in a noticeable increase in both peak and average exit velocities. For example, under 1 atm, the peak velocity is 242.7 m/s, while under 1.05 atm, it increases to 244.5 m/s, a 0.98% increase. The increase in inlet pressure also leads to slight changes in the exit airflow deflection angle, with the maximum deviation being 1.9°.
These data further validate earlier conclusions and provide a more detailed explanation of how changes in inlet flow angle and pressure affect the exit flow field characteristics of the compressor.

5. Conclusions

This study investigated the flow field characteristics at the exit of the first 3.5 stages of the NASA 74A transonic multi-stage axial compressor under various rotational speed conditions using numerical simulations. The analysis primarily focused on airflow deflection angle, radial velocity distribution, and their variation patterns. By comparing numerical simulation data with actual operating conditions, the following conclusions are drawn:
(1) A decrease in compressor rotational speed leads to a reduction in both peak and average exit velocity, thereby progressively weakening flow field stability and overall performance. Under the design condition (100% n0), the peak velocity at the compressor exit is 242.7 m/s, with an average velocity of 219.44 m/s, indicating efficient kinetic energy utilization and a stable flow field structure. As the rotational speed decreases to 94% n0, 93% n0, and 89% n0, the peak exit velocity gradually declines to 237.6 m/s, 233.6 m/s, and 225.5 m/s, respectively, with corresponding average velocities of 208.65 m/s, 206.31 m/s, and 201.28 m/s, respectively. The peak velocity reductions of approximately 2%, 3.7%, and 7% suggest a progressive decline in flow field stability and compressor performance. At 68% n0, the lowest rotational speed condition, the peak exit velocity drops significantly to 220 m/s, representing an 11.4% deviation from the design condition. The velocity distribution becomes increasingly non-uniform, with pronounced flow separation and low-energy fluid accumulation, leading to a substantial reduction in overall performance.
(2) The effect of compressor rotational speed variation on the exit airflow deflection angle is relatively minor. Under the design condition (100% n0), the airflow deflection angle is primarily concentrated between 85° and 90°, with a variation range within 3°, indicating a relatively uniform and stable flow field with low sensitivity to rotational speed changes. However, as the rotational speed decreases, fluctuations in the deflection angle gradually increase. At 68% n0, the deflection angle range expands significantly, the low-speed region enlarges, and airflow guidance weakens considerably, suggesting intensified flow instability and increased energy loss.
(3) Under non-uniform inlet conditions, an increase in the inlet airflow angle slightly reduces the exit total velocity while shifting the airflow deflection angle curve leftward. At inlet pressures of 1 atm and 1.05 atm, when the inlet airflow angle decreases from 90° to 70°, the variations in peak and average exit velocities remain within 2%, while the peak and average airflow deflection angle changes are within approximately 1%. However, the overall curve exhibits a leftward shift with a deviation of 2.6%.
(4) Changes in inlet pressure have a significant impact on the local flow field distribution while exerting a relatively minor effect on the overall flow structure. When the inlet pressure increases from 1 atm to 1.05 atm, the mass flow rate and kinetic energy increase, leading to a slight rise in velocity, particularly in the mid-blade region. The peak velocity difference is 0.98%, and the average velocity deviation is 3%. At the point of maximum difference, the velocity variation reaches 6%. The average airflow deflection angle differs by 0.7%, with a maximum deviation of 1.9°. These findings indicate that while an increase in inlet pressure significantly affects local velocity and airflow deflection angle, its influence on the overall flow field distribution remains relatively small.

Author Contributions

D.J.: Methodology, Conceptualization. H.L.: Investigation, Data curation. C.L.: Writing—review and editing, Data curation. Y.H.: Writing—original draft, Writing—review and editing, Data curation. Y.L.: Data curation. Y.Y.: Methodology, Funding acquisition. C.Z.: Writing—review and editing. All authors have read and agreed to the published version of the manuscript.

Funding

This research received no external funding.

Data Availability Statement

No data was used for the research described in the article.

Acknowledgments

This research is derived from the outsourced project of AECC Sichuan Gas Turbine Estab.

Conflicts of Interest

Author Dong Jiang, Huadong Li, Chongyang Liu was employed by the company AECC Sichuan Gas Turbine Estab. The remaining authors declare that the research was conducted in the absence of any commercial or financial relationships that could be construed as a potential conflict of interest.

References

  1. Semlitsch, B. Boundary conditions to represent the wave impedance characteristics of axial compressors. Appl. Acoust. 2023, 204, 109236. [Google Scholar] [CrossRef]
  2. Lamarque, N.; Poinsot, T. Boundary Conditions for Acoustic Eigenmodes Computation in Gas turbine Combustion Chambers. AIAA J. 2008, 46, 2282–2292. [Google Scholar] [CrossRef]
  3. Silva, C.F.; Durán, I.; Nicoud, F.; Moreau, S. Boundary Conditions for the Computation of Thermoacoustic Modes in Combustion Chambers. AIAA J. 2014, 52, 1180–1193. [Google Scholar] [CrossRef]
  4. Sun, Y. The Influence of Inlet Distortion on the Operating Characteristics of Transonic Axial-Flow Compressor. Master’s Thesis, Harbin Engineering University, Harbin, China, 2020. [Google Scholar]
  5. Mistry, C.S.; Pradeep, A.M. Investigations on the effect of inflow distortion on the performance of a high aspect ratio, low-speed contra-rotating fan stage. In Proceedings of the ASME Turbo Expo: Turbine Technical Conference & Exposition, V06AT35A005, San Antonio, TX, USA, 3–7 June 2013. [Google Scholar]
  6. Wartzek, F.; Schiffer, H.P.; Haug, J.P. Investigation of engine distortion interaction. In Proceedings of the ASME Turbo Expo: Turbomachinery Technical Conference and Exposition, Seoul, Republic of Korea, 13–17 June 2016. [Google Scholar]
  7. Zhang, L.; Liu, Y.; Sun, S. Numerical study on the effects of different total temperature inlet distortions on the aerodynamic performance and stability of the centrifugal compressor. Aerosp. Sci. Technol. 2025, 110292. [Google Scholar] [CrossRef]
  8. Gui, X.; Teng, J.; Liu, B.; Ning, F. Aviation Compressor Aerodynamic Thermodynamic Theory and Application; Shanghai Jiao Tong University Press: Shanghai, China, 2014. [Google Scholar]
  9. Liu, A.; Ju, Y.; Zhang, C.; Dai, R. Parallel steady/unsteady flow simulations of an 8.5-stage axial compressor. Aerosp. Sci. Technol. 2024, 145, 108853. [Google Scholar] [CrossRef]
  10. Jiang, J.; Liu, B.; Wang, Y.; Nan, X. Numerical Simulation to Three-Dimensional Turbulent Flow in Multistage Axial Compressor Blade Row. J. Appl. Mech. 2007, 2, 21–25+170. [Google Scholar] [CrossRef]
  11. Jia, H.; Wu, H. Numerical simulation of three-dimensional flow field in transonic compressor rotor. Aeronaut. Comput. Tech. 2005, 35, 94–97. [Google Scholar]
  12. Wang, F.; Zhao, L.; He, L.; Zhang, M. Three-Dimensional CFD Flow Field Analysis and Aerodynamic Optimization of a Multi-Stage Axial Compressor. Therm. Turbine 2012, 41, 215–219. [Google Scholar]
  13. Zhang, L.; Liu, Y.; Sun, S. Numerical study on effects of total pressure distortion on unsteady effect of impeller-diffuser interaction in centrifugal compressor. Propuls. Technol. 2025, 1–14. [Google Scholar]
  14. Ma, N.; Nan, X.; Tang, F.; Zhang, J.; Liu, R. Numerical study on evolution mechanism of inlet total temperature distortion in an axi-centrifugal compressor. J. Propuls. Technol. 2024; online first. [Google Scholar]
  15. Tian, W.; Tu, B.; Hu, J. Numerical Simulation of Influence of Swirl Distortion and Total Pressure Distortion on Performance and Stability of Booster Stage. J. Nav. Aviat. Univ. 2025, 40, 213–227. [Google Scholar]
  16. Pan, T.; Yan, J.; Lu, H.; Li, Q. Impact of circumferential inlet distortion on different types of stall inceptions in a transonic compressor. Chin. J. Aeronaut. 2024, 37, 107–117. [Google Scholar] [CrossRef]
  17. Dong, J.; Wang, M. Effect on Stability of Compressor with Total Temperature and Pressure Distortions. J. Aerosp. Power 2003, 18, 788–793. [Google Scholar]
  18. Kikuchi, K.; Tamura, A.; Matsuo, Y.; Hirai, K.; Kodama, H.; Nozaki, O. Unsteady three-dimensional analysis of inlet distortion in turbomachinery. In Proceedings of the 33rd Joint Propulsion Conference and Exhibit, Seattle, WA, USA, 6–9 July 1997. [Google Scholar]
  19. Fidalgo, V.J.; Hall, C.A.; Colin, Y. A study of fan-distortion interaction within the NASA Rotor 67 transonic stage. ASME Turbo Expo Power Land Sea Air 2012, 134, 051011. [Google Scholar] [CrossRef]
  20. Sun, P.; Feng, G. Numerical simulation of effects of steady circumferential total pressure distortion on a small fan. Propuls. Technol. 2006, 27, 239–242. [Google Scholar]
  21. Sun, P.; Feng, G.; Kui, D. Numerical Simulation of the Impact of Total-pressure Distortion on the Aerodynamic Performance of Small-sized Fans. Therm. Power Eng. 2006, 21, 259–263. [Google Scholar]
  22. Gao, Q.; Yang, X.; Liu, S. Experiment on inlet distortion of high bypass ratio fan and booster. J. Aerosp. Power 2025, 40, 44–52. [Google Scholar]
  23. Wang, W.; He, T.; Sun, W.; Wang, X.; He, W.; Wang, B. Numerical Investigation of Bleed Rate on Performance of Multistage Axial Compressor. Gas Turbine Technol. 2024, 37, 1–10. [Google Scholar]
  24. Zhang, X.-W.; Ju, Y.-P.; Zhang, C.-H. Performance prediction and IGV-stator adjustment optimization of a multi-stage axial-flow compressor. J. Eng. Thermophys. 2020, 41, 1418–1427. [Google Scholar]
  25. Steinke, R.J. Design of 9.271-Pressure-Ratio Five-Stage Core Compressor and Overall Performance for First Three Stages. In NASA Technical Paper 2597; National Aeronautics and Space Administration: Cleveland, OH, USA, 1986. [Google Scholar]
  26. Liu, C. Aerodynamic Stability Numerical Simulation Method Study of Compressor Component Running in Gas Turbine Engine. Master’s Thesis, Nanjing University of Aeronautics and Astronautics, Nanjing, China, 2012. [Google Scholar]
  27. Peng, Z. Principles of Aviation Gas Turbines; National Defense Industry Press: Beijing, China, 2008. [Google Scholar]
  28. Liu, X.; Guo, S.; Wang, Y.; Wang, D.; Wang, G.; Li, H. CFD-based unsteady simulation and performance analysis of scroll compressor. Int. J. Refrig. 2025, 170, 150–163. [Google Scholar] [CrossRef]
  29. Huang, P.; Bu, X.; Lin, G.; Wen, D. Numerical simulations of ice crystal icing within a 1.5-stage compressor in an aero-engine. Case Stud. Therm. Eng. 2025, 69, 106026. [Google Scholar] [CrossRef]
  30. Jiang, Q.; Yao, J.; Tan, Y.; Jiang, W. Design and Numerical Investigation of a Six-stage Industrial Axial Compressor Using Different Vortex Laws. Comput. Simul. 2024, 41, 33–41+87. [Google Scholar]
  31. Wang, L.; Mao, X.; Ma, G.; Liu, Y.; Gao, L. Investigation of unsteady characteristics in a counter-rotating compressor based on unsteady numerical simulation and mode decomposition methods. Aerosp. Sci. Technol. 2025, 158, 109848. [Google Scholar] [CrossRef]
  32. Milidonis, K.; Semlitsch, B.; Hynes, T. Effect of Clocking on Compressor Noise Generation. AIAA J. 2018, 56, 4225–4231. [Google Scholar] [CrossRef]
  33. Celik, I.; Ghia, U.; Roache, P.J.; Freitas, C.J. Procedure for Estimation and Reporting of Uncertainty Due to Discretization in CFD Applications. J. Fluids Eng. 2008, 130, 078001. [Google Scholar]
Figure 1. Schematic diagram of the full-annulus structure of the NASA 74A compressor.
Processes 13 01428 g001
Figure 2. Blade model of the NASA 74A compressor.
Processes 13 01428 g002
Figure 3. Schematic diagram of the meridional flow passage of the NASA 74A compressor.
Processes 13 01428 g003
Figure 4. Schematic diagram of the meridional plane, single passage, and full-annulus mesh of the NASA 74A. Blue elements represent stator blades, while orange elements indicate rotor blades.
Processes 13 01428 g004
Figure 5. Grid independence validation of pressure ratio–mass flow.
Processes 13 01428 g005
Figure 6. Grid independence validation of efficiency–mass flow.
Processes 13 01428 g006
Figure 7. Distribution of grid y+ values.
Processes 13 01428 g007
Figure 8. Pressure ratio–mass flow characteristic curves.
Processes 13 01428 g008
Figure 9. Efficiency–mass flow characteristic curves.
Processes 13 01428 g009
Figure 10. Pressure ratio–mass flow characteristic curves under different typical operating conditions.
Processes 13 01428 g010
Figure 11. Efficiency–mass flow characteristic curves under different typical operating conditions.
Processes 13 01428 g011
Figure 12. Distributions of total velocity contours at the compressor exit under different typical operating conditions: (a) 100% n0, (b) 94% n0, (c) 93% n0, (d) 89% n0, (e) 68% n0.
Processes 13 01428 g012
Figure 13. Comparison of average total velocity distributions along the radial direction under different typical operating conditions.
Processes 13 01428 g013
Figure 14. Distributions of airflow deflection angle contours at the compressor exit under different typical operating conditions: (a) 100% n0, (b) 94% n0, (c) 93% n0, (d) 89% n0, (e) 68% n0.
Processes 13 01428 g014
Figure 15. Comparison of average airflow deflection angle distributions along the radial direction under different typical operating conditions.
Processes 13 01428 g015
Figure 16. Distributions of total velocities and airflow deflection angles at the exit under 1 atm inlet pressure with different inlet airflow angles: (a) 90°, (b) 80°, (c) 75°, (d) 70°.
Processes 13 01428 g016
Figure 17. Distributions of average total velocities along the radial direction at the exit under 1 atm inlet pressure with different inlet airflow angles.
Processes 13 01428 g017
Figure 18. Distributions of average airflow deflection angles along the radial direction at the exit under 1 atm inlet pressure with different inlet airflow angles.
Processes 13 01428 g018
Figure 19. Distributions of total velocities and airflow deflection angles at the exit under 1.05 atm inlet pressure with different inlet airflow angles: (a) 90°, (b) 80°, (c) 75°, (d) 70°.
Processes 13 01428 g019
Figure 20. Distributions of average total velocities along the radial direction at the exit under 1.05 atm inlet pressure with different inlet airflow angles.
Processes 13 01428 g020
Figure 21. Distributions of average airflow deflection angles along the radial direction at the exit under 1.05 atm inlet pressure with different inlet airflow angles.
Processes 13 01428 g021
Figure 22. Distributions of average total velocities along the radial direction at the exit under 1.05 atm inlet pressure.
Processes 13 01428 g022
Figure 23. Distributions of average airflow deflection angles along the radial direction at the exit under 1.05 atm inlet pressure.
Processes 13 01428 g023
Table 1. Basic parameters of the first 3.5 stages of NASA 74A.
ParameterValue
Total pressure ratio4.474
Total temperature ratio1.663
Adiabatic efficiency0.799
Polytropic efficiency0.836
Mass flow rate (kg/s)29.71
Rotational speed (r/min)16,042.3
Tip speed (m/s)430.29
Number of IGV blades26
Number of stage 1 rotor blades28
Number of stage 1 stator blades34
Number of stage 2 rotor blades32
Number of stage 2 stator blades46
Number of stage 3 rotor blades39
Number of stage 3 stator blades54
Tip clearance (mm)0.408
Table 2. Parameters of non-uniform inlet flow conditions.
Inlet PressureInlet Airflow Angle α (°)
Non-uniform inlet1.05 atm90
80
75
70
1 atm90
80
75
70
Table 3. Variations in exit flow angles and velocities.
Inlet Flow Angle
(°)
Peak Exit Velocity
(m/s)
Average Exit Velocity
(m/s)
Average Flow
Deflection Angle
(°)
190242.7219.4485.45
80241217.685
75240215.584.5
70239214.4484.18
1.0590245.6227.03384.86
80244.5225.66184.5
75243.3223.18784.3
70242.7221.73684.21
Disclaimer/Publisher’s Note: The statements, opinions and data contained in all publications are solely those of the individual author(s) and contributor(s) and not of MDPI and/or the editor(s). MDPI and/or the editor(s) disclaim responsibility for any injury to people or property resulting from any ideas, methods, instructions or products referred to in the content.

