Abstract
The strength of soft rock masses progressively deteriorates under dissolution effects, leading to extensive pore development and structural loosening within the rock matrix. This process induces water and sand inrush phenomena at excavation faces, posing substantial challenges to construction safety. This study systematically investigates the strength degradation mechanisms and engineering disaster evolution of soft rock subjected to water–rock interactions. Utilizing representative water-rich soft rock specimens from a tunnel in central Yunnan, a multi-scale analytical framework incorporating X-ray diffraction mineral analysis systems, triaxial mechanical testing systems for rocks, scanning electron microscopy (SEM), and nuclear magnetic resonance (NMR) was implemented. This integrated methodology comprehensively elucidates the macro–meso damage evolution mechanisms of soft rock under water–rock coupling interactions. The results indicate that as the dolomite content decreases and the impurity content increases, the softening grade of the rock rises, leading to more extensive pore development. Uniaxial compression tests revealed that the Poisson’s ratio of soft rock is significantly higher than that of typical rock. Triaxial compression tests demonstrated that confining pressure has a substantial impact on soft rock, particularly affecting Poisson’s ratio. Increased water content was found to significantly reduce the strength of the soft rock. Compared to loose soft rock, the radial strain of denser soft rock was markedly greater than the axial strain, and the soaking damage effect was more pronounced. This study provides a valuable insight into the mechanical and permeability behavior of soft rock under different conditions, and provides valuable insights into the solutions for soft rock in geological engineering such as tunnel excavations.
1. Introduction
Soft rock is generally categorized into two types by scholars: geological soft rock and engineering soft rock. Geological soft rock refers to loose, weak rock strata with low strength, high porosity, poor cohesion, significant structural plane influence, and susceptibility to weathering. Engineering soft rock, on the other hand, refers to rock masses that can undergo significant plastic deformation under engineering forces [1]. Existing domestic literature indicates that with the construction of water conservancy and transportation projects, the phenomenon of soft rock softening has been observed in regions such as Yunnan, Guizhou, Sichuan, Chongqing, and Hubei. This softening often results in the deformation of the surrounding rock in underground tunnels, difficulties in grouting on tunnel faces, and issues such as underground karst failure and the inrush of water and sand [2,3,4].
Tunnel collapse, the large deformation of the surrounding rock, and water and mud inrush are the major geological disasters in soft rock tunnel construction. Li et al. [5] noted that the process of water inrush disasters in tunnels involves the formation of water inrush channels, characterized by the development, expansion, penetration, and eventual fracture of rock mass cracks under construction interference and high permeability water pressure. Utilizing fracture mechanics theory, Chen et al. [6] investigated the initiation criteria and characteristics of discontinuous cracks under the combined effects of ground stress and water pressure. They derived an expression for the critical water pressure necessary for water inrush and established an instability criterion for water-isolated rock masses. Among them, tunnel collapse has the most serious impact on tunnel construction. Some results show that the groundwater condition and the integrity of the rock mass are the main influencing factors leading to a soft rock tunnel collapse [7,8].
It is of great practical significance to study the microscopic mechanisms and strength damage laws of deep rock masses under the coupling action of water and rock. Sun et al. [9] analyzed the variation characteristics of micro-pores, medium pores, and large pores softened with different strengths. Based on the Weibull distribution damage constitutive model and the Drucker–Prager failure criterion, a failure constitutive model is obtained for different water saturation levels, and the validity of the model is verified. Zhang et al. [10] researched the creep characteristics and mechanism of red-bed soft rock under the water–rock interaction; fluid–structure coupling triaxial compression tests and creep tests under stepwise loading were carried out. By studying the failure mechanism of weakly cemented soft rock under water–rock coupling, Zhao [11] found that the change in the microstructure of red sandstone under a high humidity environment is the main reason for the deterioration of its macro-mechanical properties. Some studies have concluded that the higher the water content state, the greater the extent of pore and fracture development, the faster the speed for the generation of volumetric fractures, and the greater the likelihood of penetration failure [9,12,13]. Zhang et al. [14,15] found that while Poisson’s ratio anisotropy minimally affects collapse pressure under low anisotropy, elastic modulus anisotropy significantly influences it, with poly-axial criteria showing heightened sensitivity to elastic anisotropy. They developed an enhanced Mohr–Coulomb strength criterion using three Lode angle shape functions (elliptical, hyperbolic, and spatial slip plane-based), achieving experimental prediction accuracy comparable to or surpassing existing multi-axial criteria with minimal fitting errors. Yang et al. [16] have explained the influence of the structural heterogeneity and wettability heterogeneity of liquid in rocks through the study of a micro-scale immiscible two-phase flow model.
The existing research mainly focuses on the analysis of the basic geological process of soft rock softening, but systematic research into soft rock softening mechanisms, engineering behavior characterization, deformation failure mechanisms, and engineering mitigation measures is lacking. In addition, the composition and structural characteristics of soft rock are controlled by the geological environment and sedimentary environment, and have obvious regional differences, which brings challenges to the popularization and application of research results. To bridge these gaps, this study uniquely captures the cross-scale interaction between macroscopic mechanical degradation and microscopic pore rupture evolution by developing an integrated multi-scale experimental framework that collaborates macroscopic mechanical testing (uniaxial/triaxial compression), meso-scale mineral analysis (X-ray diffraction), and microstructure characterization (SEM and NMR). Thus, the limitation of single-scale analysis in previous studies is overcome. The quantitative establishment of mineralogical criteria for softening prediction provides a new method for assessing regional soft rock stability based on mineral composition and solves the challenge of regional variability by correlating the reduction in dolomite content and the accumulation of impurities with pore development and strength loss. The research system reveals the damage mechanism of soft rock under the action of water–rock coupling, and provides in-depth insights into the problem of water and sand gushing into water-rich tunnels.
2. Engineering Background
The water diversion project in central Yunnan Province is the key water source project of Xingdian strategy being implemented in Yunnan Province. The length of the Yuxi section is 77.069 km. The sanded Baiyun cave section in the Yuxi section is 14.406 km long, accounting for 19.8% of the total tunnel length. The surrounding rocks of Class IV and Class V account for 97.6% of the rocks in the sandy dolomite cave section.
Typical photos of dolomites with different sanding grades are shown in Figure 1c–f. The main geological characteristics and engineering geological properties of the micro-sandy dolomite rock mass are basically consistent with those of other hard rock masses. Under the action of multi-stage tectonic stress, the integrity of a weakly sanded dolomite rock mass is mostly broken and the local integrity is poor. It is a kind of jointed rock mass, which has certain particularities compared with other hard rock masses. Under multi-stage tectonic stress and corrosion, the joints of a strongly sanded dolomite rock mass are characterized by “disordered, small spacing and short extension”. Most of the rock mass structures are cataclastic and granular, the integrity of the rock mass is broken, and the engineering geological properties are different, so it is a special rock mass with joint polar development. Under the action of dissolution, weathering, and multi-stage structural stress, the severely sanded dolomite has basically no rock structure or structural characteristics, nor rock mass structural characteristics. The particle composition is mainly fine sand, and the interparticle composition is porous medium. The physical properties such as density, particle composition, and pore ratio are basically consistent with the physical properties of soil.
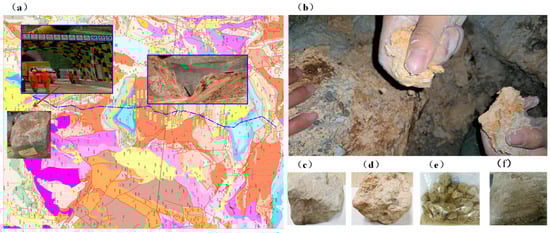
Figure 1.
Scanning electron microscope image: (a) Engineering address. (b) Site surrounding the rock. (c) Slight softening. (d) Weak softening. (e) Strong softening. (f) Severe softening.
3. Mechanical Characteristics of the Microstructure
3.1. XRD Whole-Rock Mineral Analysis
This experiment is grounded in the Stokes settling theorem of fluid mechanics. Clay mineral samples with particle sizes less than 10 microns are utilized to ascertain the total relative content of the clay minerals present in the primary rocks. Samples with particle sizes under 2 microns are employed to evaluate the relative contents of various clay minerals. The TD-3500 X-ray diffractometer was selected for the test. The divergence slit was 1.5 mm, the receiving slit was 0.8 mm, the angle was 10~90°, the step width was 0.03°, the sampling time was 0.5 s, the tube voltage was 30 kV, and the tube current was 20 mA. During the test, the scanning mode of the equipment was continuous scanning, and the driving mode of two-axis linkage was adopted. MID jade 6.5 software was used for phase analysis. The samples were finely ground and dispersed by a rock mechanical press. The treated sample was screened with a standard sample with a diameter of ϕ0.45 mm. After several grinding and screening treatments, all the drilled samples pass through the sieve holes.
Soft rock is predominantly composed of dolomite, which constitutes over 50% of its composition, and is frequently intermixed with quartz, feldspar, calcite, and clay minerals. Mo et al. [17] measured the dolomite mineral composition of dolomite by XRD experiment (CaMg(CO3)2), ferrodolomite (Ca(Fe, Mg, Mn)(CO3)2), quartz (SiO2), and clay minerals (kaolin (A12Si2O5(OH)4)), mainly, 74.38~96.41%. The more intense the degree of sanding, the lower the content of dolomite and iron dolomite, and the higher the content of quartz and clay minerals, resulting in a greater degree of softening inside the rock. Soft rock can be divided into three categories according to its genesis: primary soft rock, diagenetic soft rock, and epigenetic soft rock. From the structural point of view, it can be further divided into granular crystalline soft rock, residual heterogeneous soft rock, clastic soft rock, and micro-crystalline soft rock. The mineral composition of the field analysis sample is shown in Table 1 and Table 2 and Figure 2.

Table 1.
Table of mineral composition.
Table 2.
Table of mineral composition (Mo et al. [17]).
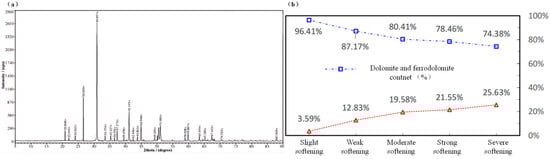
Figure 2.
Measured map of dolomite mineral composition content: (a) sample test. (b) Referenced from Mo et al. [17].
3.2. SEM Scanning Electron Microscopy
In this study, a focused ion beam-scanning electron microscopy (FIB-SEM) combined system was used to achieve the full-scale characterization of the rock and mineral phases and the pore space through micrometer–nanometer three-dimensional reconstruction technology. A two-dimensional large-field scanning method is established, and a multi-resolution hierarchical scanning of a 12.64 mm × 12.83 mm standard area is implemented by using the high-precision image Mosaic algorithm. This method can achieve cross-scale correlation analysis of macro-scale mineral distribution and micro-pore structures while maintaining a low relative error rate, and quantitatively characterizes the unique solution pore network, the orientation characteristics of layered silicates, and the microfracture propagation mode of soft rocks. It provides a key experimental basis for revealing the evolution mechanism of the mineral–liquid interface in the water–rock coupling process.
The microstructural development of soft rocks varies significantly with different softening grades. As the softening grade increases, the interaction forces between the soft rock particles decrease, leading to the formation of more particles, reduced cementation, and diminished mechanical strength. Solution pores form on the surface of the soft rock, further decreasing the cementation between crystals. Under the influence of fluids, noticeable crystal expansion occurs, ultimately causing the dissolution and formation of small particles in bulk. This process results in an increased softening degree of the soft rock, as illustrated in Figure 3.
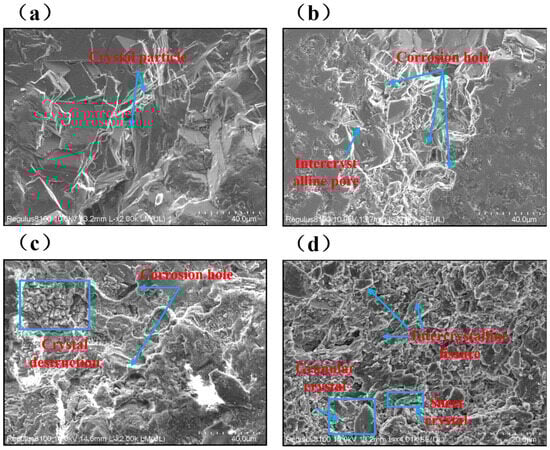
Figure 3.
Scanning electron microscope images: (a) Slight softening. (b) Weak softening. (c) Strong softening. (d) Severe softening.
- (1)
- Slight softening: More regular white cloud crystal particles can be seen on the surface of the sample, with a few particles disintegrating and scattering.
- (2)
- Weak softening: The surface of the soft rock forms a dissolution pore, and the interaction force between the crystals decreases.
- (3)
- Strong softening: Small particles fill in the pores, in the late cementation, with small particles and dolomite particles cementing to each other.
- (4)
- Severe softening: Under the action of fluid, visible traces of crystal expansion appear on the surface of the sample, soft rock crystals have obvious dissolution and fall off to form small particles, and small particles in bulk accumulate to form white cloud powder.
3.3. Test of Thin Section
The thin section method is used to identify transparent minerals and rocks under a polarizing microscope. This involves injecting dyed resin or liquid glue into the rock’s pore spaces under vacuum conditions. The resin or liquid glue is then solidified at a specific temperature and pressure. Subsequently, the rock is ground into thin slices, allowing the observation of pores, throats, and their interconnected and coordinated two-dimensional spatial structures under a polarizing microscope.
The soft rock gradually expands from trace cracks until it breaks, and the particle size gradually becomes smaller, resulting in an increase in the softening degree of the soft rock, as shown in Figure 4.
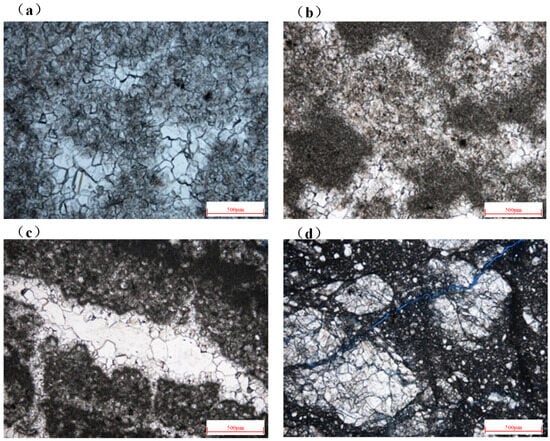
Figure 4.
Image of thin section: (a) Slight softening. (b) Weak softening. (c) Strong softening. (d) Severe softening.
- (1)
- Slight softening: The crystalline soft rock have particle sizes 120~200 μm; the crystals become embedded with each other, effective pores do not develop, and a small number of micro-cracks develop.
- (2)
- Weak softening: The algal soft rock has mass distribution, intercavity dolomite filling, partial cavity dissolution formation, and the development of intergranular pores and micro-cracks.
- (3)
- Strong softening: With algal soft rock, the dolomite filling is between the two stages, with early powder crystal, late fine crystal–medium crystal, or giant crystal dolomite filling.
- (4)
- Severe softening: With clastic soft rock, diameters 0.5~2 mm, the complex base is mainly argillaceous and silty, and the gravel is broken.
3.4. Mercury Injection Aperture Distribution Test
The mercury injection method is used to determine the pore size distribution of partial and large pores. The basic principle relies on mercury’s non-wetting behavior with general solids, requiring external pressure to enter the pores. The greater the external pressure, the smaller the radius of the pores that mercury can penetrate. By measuring the amount of mercury entering the pores under varying external pressures, the pore volume corresponding to each pore size can be determined.
The results of the fracture pore development test show that the softening grade of the rock mass is positively correlated with the degree of pore development, and its evolution sequence follows the progressive rule of severe softening > strong softening > weak softening > micro-softening. The coupling mechanism of the pore-softening effect revealed in Figure 5 shows that the formation of a secondary pore network intensifies the contact deterioration between mineral particles, which is the key factor leading to the exponential decline of rock strength.
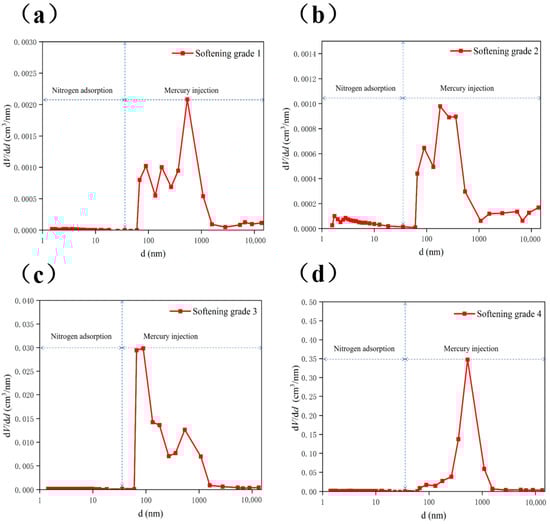
Figure 5.
Pore mapping: (a) Slight softening. (b) Weak softening. (c) Strong softening. (d) Severe softening.
- (1)
- Slight softening: Meso-porous pores are mainly distributed in 2~10 nm, and the maximum pore volume is 2.4 × 10⁻⁵ cm3/nm; macro-porous pores are mainly distributed in the range of 50~1000 nm, and the maximum pore volume is 0.002 cm3/nm.
- (2)
- Weak softening: Meso-porous pores are mainly distributed in the range of 2~10 nm, and the maximum pore volume is 5.76 × 10⁻⁵ cm3/nm; macro-porous pores are mainly distributed in the range of 50~1000 nm, and the maximum pore volume is 0.030 cm3/nm.
- (3)
- Strong softening: Meso-porous pores are mainly distributed in 2~10 nm, and the maximum pore volume is 9.32 × 10⁻⁵ cm3/nm; macro-porous pores are mainly distributed in 100~1000 nm, and the maximum pore volume is 0.17 cm3/nm.
- (4)
- Severe softening: Meso-porous pores are mainly distributed in 2~10 nm, and the maximum pore volume is 5.76 × 10⁻⁵ cm3/nm; macro-pores are mainly distributed in the range of 50~1000 nm, and the maximum pore volume is 0.035 cm3/nm.
3.5. CT Scan
The experimental equipment adopts the GE-LightSpeed Plus series CT scanner, as shown in Figure 6. Its biggest feature is to obtain 16 lines of scan data simultaneously through a 24-line detector and a 16-line data acquisition system. Through the CT scan of the experimental sample, the following results were found:
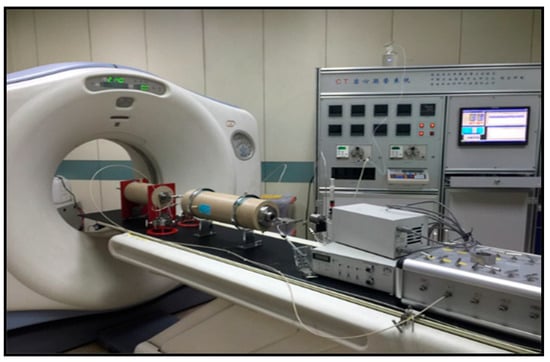
Figure 6.
CT scanning device.
Slight softening—Red indicates the internal particles of soft rock, and blue indicates the development of pores and cracks in the soft rock. As can be seen from Figure 7a, cracks are developed inside the soft rock, and there is a tendency to form fracture networks.
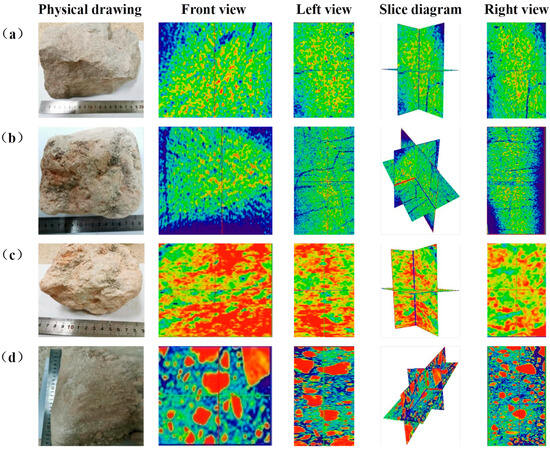
Figure 7.
CT scanning of specimens under different viewing angles: (a) Slight softening. (b) Weak softening. (c) Strong softening. (d) Severe softening.
Weak softening—Red indicates the internal particles of soft rock, and blue indicates the development of pores and cracks in it. As can be seen from Figure 7b, cracks in the soft rock are connected to each other, forming a fracture network.
Strong softening—Red indicates the internal particles of soft rock, and blue indicates the development of pores and fractures in the soft rock. It can be seen from Figure 7c that cracks and pore networks in the soft rock develop together and have a tendency to crack.
Severe softening—Red indicates the internal particles of soft rock, and blue indicates the development of pores and cracks in it. As can be seen from Figure 7d, soft rock fragments continue to soften, the pore networks are highly developed, and the hard fragments gradually decrease.
3.6. Compressive Strength Test
The mechanical properties of soft rock under different conditions were measured by uniaxial and triaxial compression tests. Because the samples taken were not enough, in order to save samples and perform more adequate experiments, the test sample for each condition was 1 piece. The test results included compressive strength, elastic modulus, Poisson’s ratio, and other yield parameters, as shown in Figure 8a–c. In addition, the development of cracks and the final failure state were also observed during the experiment, as shown in Figure 8d,e. The surface of the soft rock shows micro-cracks and the internal pore structure is complex.
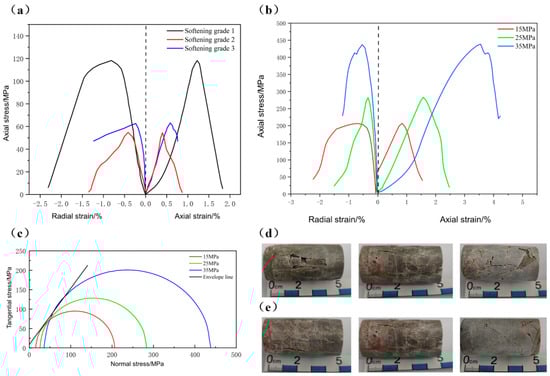
Figure 8.
Mechanical properties and failure modes of soft rock: (a) Uniaxial stress–strain curve. (b) Triaxial stress–strain curve. (c) Soft rock Mohr circle. (d) Uniaxial failure mode. (e) Three-axis failure mode.
In order to study the stress-sensitive damage of soft rock under different confining pressures and the change law of initial permeability with confining pressure (simulated formation pressure), the confining pressure was set as 15, 25, and 35 MPa for 3 hydrostatic pressure states in this test, and the stress-sensitive test and water–rock coupling damage analysis were carried out on different samples with the loading rate of 0.05 MPa/s. After each stage of confining pressure loading, the constant load was maintained for 300 s, and radial strain monitoring was used to determine whether the adjustment of the pore structure was completed.
The uniaxial compressive strength of the soft rock ranges from 50 MPa to 120 MPa, with an elastic modulus of 10 to 16 GPa and a Poisson’s ratio of 0.4 to 0.7 (Table 3). The pore structure of the soft rock varies significantly with different degrees of softening. Although the uniaxial compressive strength fluctuates, the elastic modulus remains relatively constant. The Poisson’s ratio obtained from the uniaxial compression tests is notably higher than that of typical rock (Table 3). The underlying mechanism may be that the high porosity of soft rock (Figure 5 and Figure 7) and the micro-crack network may lead to significant lateral expansion under uniaxial compression. Pore closure or micro-crack propagation may preferentially induce lateral strain, thus increasing Poisson’s ratio.
Table 3.
Mechanical properties of soft rock under uniaxial compression. (Experimental data and comparison from Hu et al. [18]).
During triaxial compression, the strength of soft rock gradually increases with confining pressure in Table 4. When the confining pressure exceeds 30 MPa, the strength of the soft rock significantly increases. This phenomenon may be due to the compression and densification of pores within the soft rock under high confining pressure, leading to hardening. Under confining pressure, the elastic modulus of soft rock increases to a range of 20 to 22 GPa, compared to its uniaxial state. Poisson’s ratio significantly decreases and continues to decrease as the confining pressure increases. The impact of confining pressure on soft rock is more pronounced than on other rock types, especially regarding Poisson’s ratio.
Table 4.
Parameters of the mechanical properties of soft rock under triaxial compression of softening level 1. (Experimental data and comparison from Li S. [19]).
4. Water–Rock Coupling Mechanism
4.1. Analysis of Seepage Characteristics
4.1.1. NMR Water Absorption Test
Nuclear magnetic resonance (NMR) is a non-destructive testing method used to analyze the physical properties of rocks by measuring their hydrogen content. The NMR T2 spectrum effectively reflects the pore structure and fluid distribution characteristics within the rock. A higher T2 value indicates a larger pore diameter for the deposited fluid. Additionally, a greater amount of fluid in rock with a specific aperture corresponds to a higher T2 spectrum amplitude. By measuring the T2 spectrum of tight reservoir samples during the imbibition process, the distribution characteristics of pore fluid saturation driven by capillary permeability can be accurately determined. The experimental setup is illustrated in Figure 9.
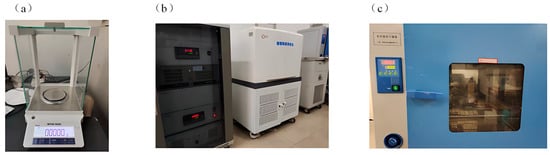
Figure 9.
Imbibition experimental equipment: (a) Analytical balance. (b) Nuclear magnetic resonance analyzer. (c) Drying oven.
The results of the nuclear magnetic resonance (NMR) water absorption test on soft rock at different temperatures (Figure 10) indicate that as the water absorption time increases, the microscopic pores gradually dissolve, leading to an increase in larger pores. Additionally, higher temperatures result in a shorter time required to reach saturation.
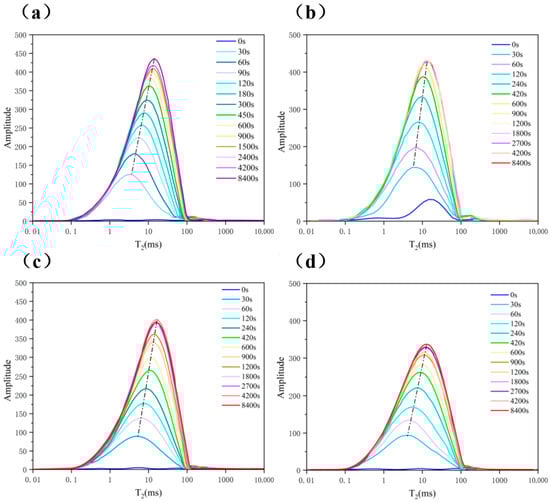
Figure 10.
T2 spectrum of the water absorption of soft rock at different temperatures: (a) 20 °C. (b) 30 °C. (c) 40 °C. (d) 50 °C.
4.1.2. Water Absorption and Air Drying Test
Soft rock exhibits high porosity and a complex internal pore structure. Yang et al. [20,21] found that water in the water absorption process of the dense core mainly exists in the nano–micro–meso-porous system. At the initial stage of spontaneous/forced imbibition, both the water absorption and ion concentration increase linearly with the square root of time, and the ion diffusion duration is longer than the imbibition. Experimental results show that the content and type of clay minerals (especially montmorillonite and Aemon mixed layer clay) significantly affect the imbibition capacity of the rock samples, and the two are significantly positively correlated. To investigate the water absorption characteristics of A and B soft rocks with different lithologies, spontaneous water absorption tests were conducted on various samples. The experimental procedure is as follows:
- (1)
- The soft rock sample was processed into smaller specimens with dimensions of 5.0 cm in length and 2.5 cm in diameter. These processed samples were placed in a drying oven at 105 °C for 24 h.
- (2)
- The dried samples were then weighed, and their NMR T2 spectra were measured using NMR equipment (The nuclear magnetic resonance analyzer of model MiniMR-VTP of Suzhou Nuomai Analytical Instrument Co., LTD).
- (3)
- The samples were immersed in a beaker filled with distilled water. After a specified period, each sample was removed, the surface water was wiped off, and the sample was weighed and its NMR T2 spectrum was measured.
- (4)
- These tests were repeated until the mass and T2 spectrum of each sample stabilized.
- (5)
- Finally, the samples were air-dried, the experimental data were processed, and the mass change and T2 spectrum curves were plotted.
As illustrated in Figure 11, the pore distribution in type A soft rock primarily consists of nano–medium pores and large pores. As the water absorption time increases, the peak value of the T2 spectrum rises, indicating a gradual increase in the water content, rich in hydrogen protons, within the sample. Over time, this signal increase gradually slows down. After the 7th minute, the signal rise becomes negligible, suggesting that the sample is approaching saturation.
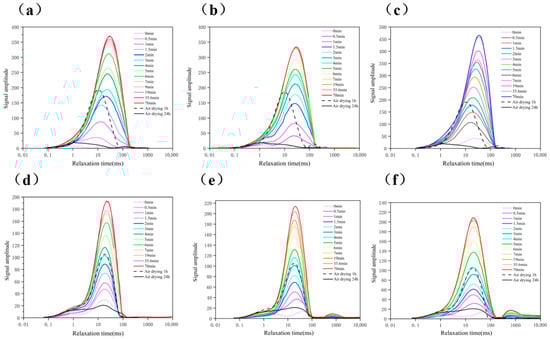
Figure 11.
Experimental results of NMR T2 spectrum analysis: (a) Sample A1. (b) Sample A2. (c) Sample A3. (d) Sample B2. (e) Sample B3. (f) Sample B4.
In contrast, the pore distribution in type B soft rock differs significantly from type A. In type B, the water is mainly distributed within nano-pores. The pore size of type B is larger, and its T2 signal at saturation is lower than that of type A, indicating that type B has a lower water absorption capacity. During the water absorption process, the peak value for type A shifts to the right, corresponding to the relaxation time. This shift indicates a change in the pore structure, with an increase in the size of the large pores.
As depicted in Figure 12, the sample mass increases rapidly during the initial stage of the water absorption process, with water absorption being proportional to the square root of time. After a certain period, the water absorption rate stabilizes, indicating that the sample is nearing a saturated state.
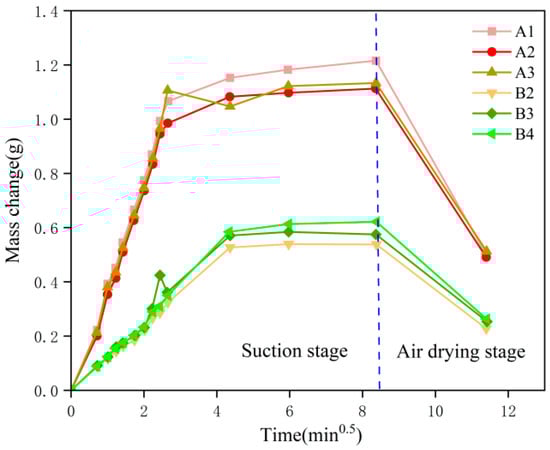
Figure 12.
Results of quality change.
Comparing the two types of soft rocks, A and B, it is evident that type A has a higher saturation water absorption and reaches saturation slightly faster than type B. This suggests that type A soft rocks have a greater capacity for water absorption and achieve saturation more quickly.
4.2. Analysis of Fracture Mechanism
Stress sensitivity is calculated as follows: The soft rock sample was processed into a small sample size of length × diameter of 5.0 cm × 2.5 cm, and the processed sample was put into a drying box for 24 h at a temperature of 60 °C for drying.
- (1)
- Take out the dried sample and put it into the gripper; connect the gripper, the nitrogen bottle, and quartz glass tube; check the air tightness of the device; and prepare to start the experiment;
- (2)
- Set the nitrogen pressure to 0.1 MPa and the initial confining pressure to 5 MPa; read and record the time required for the bubble to flow through the unit quartz glass tube; set the confining pressure gradient to 5 MPa and the maximum confining pressure to 25 MPa;
- (3)
- Record the time required for the confining pressure to rise from 5 MPa to 25 MPa and to drop from 25 MPa to 5 MPa, conduct a closed-loop test, process the experimental data, and calculate the stress sensitivity.
As shown in Figure 13, the permeability of all samples decreased with the increase in confining pressure. When the confining pressure is reduced from 25 MPa to 5 MPa, the permeability does not recover to the original level, indicating that the stress-sensitive damage caused by the increase in confining pressure is irreversible. The observed permeability decreases were 2.08%, 15.48%, 21.65%, 12.71%, 41.65%, and 24.01%, respectively. These data show that the stress sensitivity of soft rock is generally weak, and the stress sensitivity of all samples except B3 is below 25%. This means that even under high confining pressures, soft rocks maintain high strength and exhibit minimal permeability reductions. The possible outlier of the B3 sample may be due to its special mineral composition (high impurity and low dolomite), high softening grade, dense nano-pore structure, and concentrated closure of internal micro-cracks, resulting in high stress sensitivity. In addition, sanded dolomite is also stratified rock; its micro-scale mineral composition and mechanical properties of the bedding interfacial transition zone (BITZ) have a significant influence on the crack propagation mode, which further leads to changes in hydraulic fracturing efficiency [22,23].
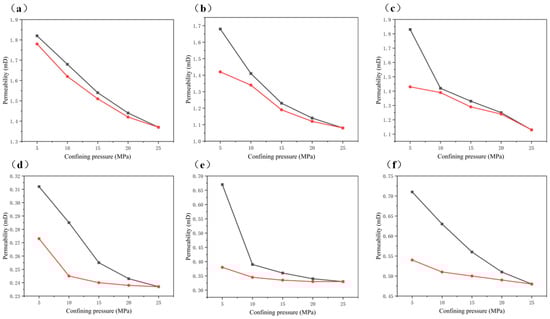
Figure 13.
Stress-sensitive test results: (a) Sample A1. (b) Sample A2. (c) Sample A3. (d) Sample B2. (e) Sample B3. (f) Sample B4.
Initially, the permeability of samples A1, A2, and A3 is significantly higher than that of B1, B2, and B3. Specifically, the permeability of the soft rock in block A at a confining pressure of 5 MPa is 2 to 5 times greater than that of block B. This discrepancy can be attributed to the presence of pores and micro-fractures in the soft rock, resulting in a marked difference in initial permeability between the two regions.
Moreover, the permeability of samples A3 and B3 decreases significantly during the pressure increase from 5 MPa to 10 MPa. This suggests the presence of internal cracks within these samples, which close rapidly as the confining pressure increases, leading to a sharp decline in permeability. This observation can be corroborated by the CT scan results of the samples.
The stress sensitivity process can be divided into two stages: the micro-crack closing stage and the actual stress sensitivity stage. At confining pressures of 5–10 MPa or 5–15 MPa, the true formation pressure cannot be simulated due to the low confining pressure. During this stage, micro-cracks and fractures remain in open or semi-closed states, resulting in an overestimation of the calculated stress sensitivity. Accurate permeability measurements are only obtained when the confining pressure approximates or equals the formation pressure.
4.3. Water–Rock Coupling Damage Analysis
Before conducting the water absorption experiment, it is essential to thoroughly dry the rock samples. This is achieved by baking the samples in an oven at 105 °C until their mass remains nearly constant, which typically takes about 24 h. At this point, the rock samples are considered to be in a dry state. The samples are then allowed to cool while maintaining their dryness, after which they are weighed and the water absorption experiments are initiated. To prevent changes in moisture content during transportation, the rock samples are wrapped in PE film to minimize water loss. Before performing the compression experiment, the moisture content of the samples is measured again to ensure an accurate assessment of their moisture state.
The soft rock samples in the fluid–structure coupling experiment can be divided into A and B in Figure 14. The surface of the A sample contains a large number of pores, while the surface of the B sample is uniform and dense. Water absorption experiments were carried out on samples A and B respectively, and the final water content was 0, 50%, and 100%. After the water absorption experiment, the uniaxial compression test was carried out to explore the strength damage of the samples after soaking.
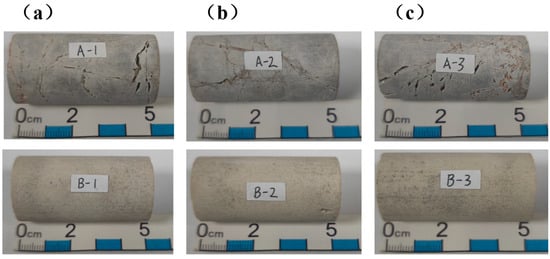
Figure 14.
Photos of samples A and B: (a) 0% water content. (b) 50% water content. (c) 100% water content.
In rock mechanics, the total stress–strain curve can be divided into four stages: the compaction stage, the linear elastic stage, the crack propagation stage, and the post-peak failure stage in Figure 15. Both Class A and Class B soft rocks exhibit a very distinct linear elastic stage. However, compared to Class A soft rocks, the radial strain of Class B soft rocks is significantly greater than the axial strain. This is because Class B soft rocks are more uniform and dense, resulting in a shorter compaction stage duration.
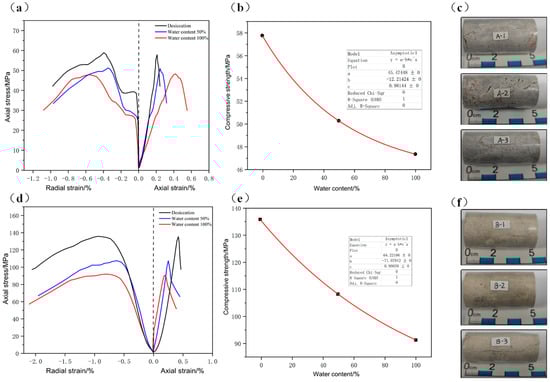
Figure 15.
Test results of samples A and B: (a) Stress–strain curve—A. (b) Strength damage curve—A. (c) Photos of samples A after destruction. (d) Stress–strain curve—B. (e) Strength damage curve—B. (f) Photos of sample B after destruction (“*” is “×”).
When the strength of Class A soft rock reaches 50%, a sudden change in strain occurs. This phenomenon is due to the development of cracks within the Class A samples. As the stress increases, breakthroughs between cracks occur, leading to a sudden change in strain. Additionally, as the water content increases, the strength of both Class A and Class B soft rocks decreases significantly. The strength reduction rate for saturated Class A soft rocks is 18%, while for saturated Class B soft rocks, it is 33%. This indicates that the soaking damage effect is significantly higher for Class B soft rocks compared to Class A. The reason for this difference is that although the surface of sample A contains a large number of pores, its internal pore connectivity may be poor, forming independent pores (Figure 3a,b). During water absorption, although water quickly enters the pores, the dissolution of cement is limited (the dolomite content is high), the pore distribution is dispersed, and the crack growth is limited, so the strength decline is slow. Although the surface of sample B is uniform and dense, there may be a micro-crack network inside it (Figure 7d). During water absorption, water permeates through micro-cracks to the mineral particle interface, causing the cement (such as clay minerals) to expand or dissolve (Figure 3d), and the interparticle forces to decrease sharply, eventually leading to more severe strength loss.
The sudden permeability change and sudden failure of B-type soft rock under water–rock coupling will pose a double threat for water inrush in tunnels: The micro-crack network developed in the B-type soft rock rapidly expands and penetrates after the saturation of water absorption, forming a highly permeable seepage channel, which makes the breakthrough speed of groundwater increase exponentially. At the same time, the rapid expansion or dissolution of cement (such as clay minerals) in the micro-crack will lead to the instantaneous loss of cementation force, and the strength drop effect of up to 33% in the superposition saturation state will lead to the sudden brittle collapse of the rock structure under the osmotic pressure–hydraulic coupling. This kind of failure combines the rapid penetration of the penetration path with strong sudden mechanical instability, which often causes a large-scale water inrush when the supporting system has not formed an effective bearing capacity, compressing the emergency response time window to the level of minutes and significantly aggravating the safety risks during tunnel construction and operation (Figure 16).
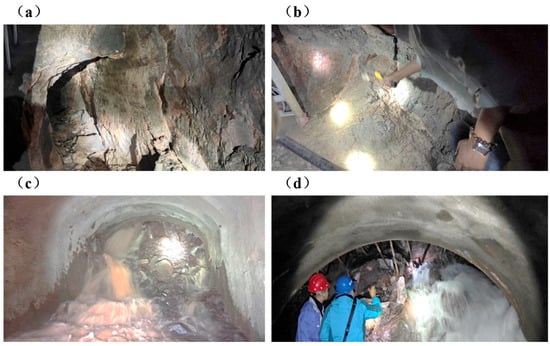
Figure 16.
Tunnel water inrush hazard: (a) The solution cavity formed by groundwater erosion in Xiaopu #2 construction branch tunnel. (b) Xiaopu #2 construction branch tunnel with intense sanded dolomite interlayer. (c) Xiaopu #2 construction branch tunnel with intense sand dolomite water burst and sand burst site. (d) Xiaopu #2 construction branch tunnel with intense sand dolomite water burst and sand burst site.
5. Conclusions
This study employs a “macro–meso–micro” multi-scale experimental methodology: uniaxial and triaxial compression tests are conducted to obtain complete stress-path mechanical responses, combined with scanning electron microscopy (SEM) and nuclear magnetic resonance (NMR) techniques to analyze microstructural alterations. This integrated approach systematically reveals the macro–meso damage evolution mechanisms of soft rock under coupled dissolution–seepage interactions, leading to the following key conclusions:
- (1)
- The Mineral composition analysis of soft rock reveals that a reduction in dolomite content leads to an increase in impurities, which in turn results in a higher degree of softening of the rock. SEM scanning electron microscopy, cast slice tests, and medical CT fracture characteristic tests indicate that soft rock progressively expands from micro-cracks to larger cracks, with a concomitant decrease in particle size, further contributing to the softening of the rock. As the softening grade increases, the degree of pore development also shows an increasing trend. Cracks, pores, and fracture networks in the soft rock develop and interconnect, demonstrating a tendency towards further fracturing.
- (2)
- Uniaxial compression tests indicate that the Poisson’s ratio of soft rock is significantly higher than that of normal rock, suggesting that soft rock undergoes considerable deformation when not constrained by confining pressure. Triaxial compression tests further demonstrate that confining pressure has a more pronounced effect on soft rock compared to other types of rock, particularly influencing its Poisson’s ratio.
- (3)
- Through a series of tests, including nuclear magnetic resonance water absorption, water absorption–air drying, stress sensitivity tests of the different samples, and fluid–structure coupling experiments of soft rocks at various temperatures, it has been observed that both type A and type B soft rocks exhibit very distinct linear elastic stages. Compared to type A soft rocks, the radial strain in type B soft rocks is significantly greater than the axial strain, due to their uniform and dense nature, resulting in a shorter compaction stage duration. When the strength of type A soft rock reaches 50%, a sudden change in strain occurs. This is attributed to the development of cracks in type A samples, and as the stress increases, breakthroughs between cracks cause abrupt changes in strain. Furthermore, with the increasing water content, the strength of both type A and type B soft rocks decreases significantly. The strength reduction rate for saturated type A soft rocks is 18%, while for saturated type B soft rocks, it is 33%, indicating that the soaking damage effect is significantly higher in type B soft rocks compared to type A.
Author Contributions
Software, Y.L.; Validation, W.Y.; Investigation, J.C.; Data curation, X.S.; Writing—original draft, Y.Z.; Supervision, Y.W. and L.Y.; Project administration, X.L. All authors have read and agreed to the published version of the manuscript.
Funding
This research received no external funding.
Data Availability Statement
The original contributions presented in this study are included in the article. Further inquiries can be directed to the corresponding author(s).
Conflicts of Interest
Authors Yuankai Zhang and Xiaoshan Li were employed by the company Xinjiang Oilfield Company. The remaining authors declare that the research was conducted in the absence of any commercial or financial relationships that could be construed as a potential conflict of interest.
References
- He, M.C.; Jing, H.H.; Sun, X.M. Research Progress of soft rock engineering geomechanics. Chin. J. Eng. Geol. 2000, 8, 46–62. [Google Scholar]
- Li, S.; Zhou, Z.; Li, L.; Shi, S.; Xu, Z. Risk assessment theory and method of water inrush in karst tunnel and its application in engineering. Chin. J. Rock Mech. Eng. 2013, 32, 1858–1867. [Google Scholar]
- Zhao, Y.X. Analysis and Prevention Technology of Karst Tunnel Water Inrush Disaster; Chongqing Jiaotong University: Chongqing, China, 2021. [Google Scholar]
- Bian, K.; Liu, J.; Liu, Z.; Liu, S.; Ai, F.; Zheng, X.; Ni, S.; Zhang, W. Mechanisms of large deformation in soft rock tunnels: A case study of Huangjiazhai Tunnel. Bull. Eng. Geol. Environ. 2019, 78, 431–444. [Google Scholar] [CrossRef]
- Li, S.C.; Wang, K.; Li, L.P.; Zhou, Z.Q.; Shi, S.S.; Liu, S. Formation mechanism and development trend of water inrush disaster in karst tunnel. Chin. J. Mech. 2017, 49, 22–30. [Google Scholar] [CrossRef]
- Guo, J.Q.; Chen, J.X.; Chen, F.; Luo, Y.B.; Liu, Q. Criterion of water inrush on the palm face of interrupted joint in karst tunnel and disaster process. China J. Highw. Transp. 2018, 31, 118–129. [Google Scholar]
- Xue, Y.G.; Li, X.; Li, G.; Qiu, D.; Gong, H.; Kong, F. An analytical model for assessing soft rock tunnel collapse risk and its engineering application. Geomech. Eng. 2020, 23, 441–454. [Google Scholar]
- Yuan, J.Q.; Chen, W.Z.; Huang, S.W.; Zhou, X.S.; Zhou, Z.H.; Liu, J.Q. Water inrush disaster mechanism and collaborative treatment technology of fully weathered granite tunnels. Chin. J. Rock Mech. Eng. 2016, 35 (Suppl. S2), 4164–4171. [Google Scholar]
- Sun, X.; Shi, F.; Luan, Z.; Yang, L.; Ding, J.; He, L.; Zhang, Y. Constitutive Model and Microscopic Mechanism for Sandstone Strength Softening Damage. Rock Mech. Rock Eng. 2023, 56, 797–813. [Google Scholar] [CrossRef]
- Zhang, S.; Yun, X.; Song, Y.; Liu, W.; Yang, L. Fluid-Structure Coupling Creep Characteristics of Red-Bed Soft Rock in South China. Water 2022, 14, 4088. [Google Scholar] [CrossRef]
- Zhao, Z.; Dong, Z.; Gao, X.; Liu, H. Splitting failure and deformation evolution of the red argillaceous siltstone disc in the high humidity environment. Front. Mater. 2023, 10, 1163919. [Google Scholar] [CrossRef]
- Chen, F.; Miao, C.; Jiang, M.; Sun, X. Experimental and Numerical Study of Water–Rock Coupling Creep under Uniaxial Compression. Sustainability 2023, 15, 14718. [Google Scholar] [CrossRef]
- Sun, X.; Shi, F.; Ding, J.; Tao, Z.; Zhang, Y.; Miao, C.; Cui, L. Study on Microscopic Mechanism and Failure Mode of Water–Rock Coupling in Fine Sandstone Under Uniaxial Compression. Rock Mech. Rock Eng. 2023, 56, 6823–6842. [Google Scholar] [CrossRef]
- Zhang, M.; Fan, X.; Zhang, Q.; Yang, B.; Zhao, P.; Yao, B.; Ran, J. Parametric sensitivity study of wellbore stability in transversely isotropic medium based on polyaxial strength criteria. J. Pet. Sci. Eng. 2021, 197, 108078. [Google Scholar] [CrossRef]
- Zhang, M.; Li, D.; Liu, J.; Zhang, D.; Zhang, Y.; Cui, K. The modification of Mohr-Coulomb criteria based on shape function and determination method of undetermined parameters. Mech. Mater. 2023, 185, 104772. [Google Scholar] [CrossRef]
- Yang, L.; Liu, Y.; Wang, W.; Li, M.; Wang, S.; Xu, B.; Shi, Y.; Chen, H. Pore-scale flow mechanism of immiscible gas-assisted gravity drainage in strongly heterogeneous glutenite reservoirs. Int. J. Coal Sci. Technol. 2025, 12, 12. [Google Scholar] [CrossRef]
- Mo, Y.; Hu, X.L.; Cui, D.S.; Xie, Z.Y.; Jin, X.F.; Xiong, Z.H. Research on Formation Mechanism and Engineering Characteristics of Sand. Dolomite in Wuhan Tianxingzhou Carbonate Rock Belt. Earth Sci. 2024. [Google Scholar]
- Hu, H.H.; Li, J.W.; Fan, W.T.; Lin, Y.; He, J.Q. Study on damage and degradation characteristics and constitutive model of red layer soft rock under water-rock action. Rock Soil Mech. 2025, 46, 685–694. [Google Scholar]
- Li, S. Study on Mechanical Parameters of Soft Rock Tunnels Under Different Confinement Pressures. Railw. Constr. Technol. 2023, 9, 114–118. [Google Scholar]
- Yang, L.; Wang, H.; Xu, H.; Guo, D.; Li, M. Experimental study on characteristics of water imbibition and ion diffusion in shale reservoirs. Geoenergy Sci. Eng. 2023, 229, 212167. [Google Scholar] [CrossRef]
- Yang, L.; Ge, H.; Shi, X.; Cheng, Y.; Zhang, K.; Chen, H.; Shen, Y.; Zhang, J.; Qu, X. The effect of microstructure and rock mineralogy on water imbibition characteristics in tight reservoirs. J. Nat. Gas Sci. Eng. 2016, 34, 1461–1471. [Google Scholar] [CrossRef]
- Yang, L.; Yang, D.; Zhang, M.; Meng, S.; Wang, S.; Su, Y.; Long, X. Application of nano-scratch technology to identify continental shale mineral composition and distribution length of bedding interfacial transition zone—A case study of Cretaceous Qingshankou formation in Gulong Depression, Songliao Basin, NE China. Geoenergy Sci. Eng. 2024, 234, 212674. [Google Scholar] [CrossRef]
- Yang, L.; Yang, D.; Li, Y.; Cai, J.; Jiang, X. Nanoindentation study on microscopic mineral mechanics and bedding characteristics of continental shales. Energy 2024, 312, 133614. [Google Scholar] [CrossRef]
Disclaimer/Publisher’s Note: The statements, opinions and data contained in all publications are solely those of the individual author(s) and contributor(s) and not of MDPI and/or the editor(s). MDPI and/or the editor(s) disclaim responsibility for any injury to people or property resulting from any ideas, methods, instructions or products referred to in the content. |
© 2025 by the authors. Licensee MDPI, Basel, Switzerland. This article is an open access article distributed under the terms and conditions of the Creative Commons Attribution (CC BY) license (https://creativecommons.org/licenses/by/4.0/).