
Evaluation of Regional Carbon Emission Reduction Capacity and Complex Collaborative Development: An Empirical Study of the Yangtze River Delta Region


Abstract
1. Introduction
1.1. Research on Influencing Factors of Carbon Emission and Related Case Studies
1.2. Research on Cooperative Degree Model of Composite System
1.3. Research on Cooperation and Coordination in Carbon Mitigation
2. Methodology
2.1. Carbon Emission Reduction Capacity Assessment Index System
2.2. Carbon Emission Calculation
2.3. Entropy Weight Method
2.4. Order Parameter of Regional Carbon Emission Reduction Capacity
2.5. Cooperation Degree Model of Regional Carbon Emission Reduction Complex System
2.5.1. Subsystem Order Degree Model
2.5.2. Cooperative Degree Model of the Composite System
3. Empirical Research
3.1. Overview of the Yangtze River Delta Region and Its Carbon Emission Challenges
3.2. Weight Calculation of Evaluation Index for Carbon Emission Reduction Capacity in the Yangtze River Delta Region
3.3. Calculation and Analysis of Sequence Parameters of the Regional Carbon Emission Reduction Subsystem in the Yangtze River Delta
3.3.1. Subsystem Order Parameter
3.3.2. Subsystem Order Degree
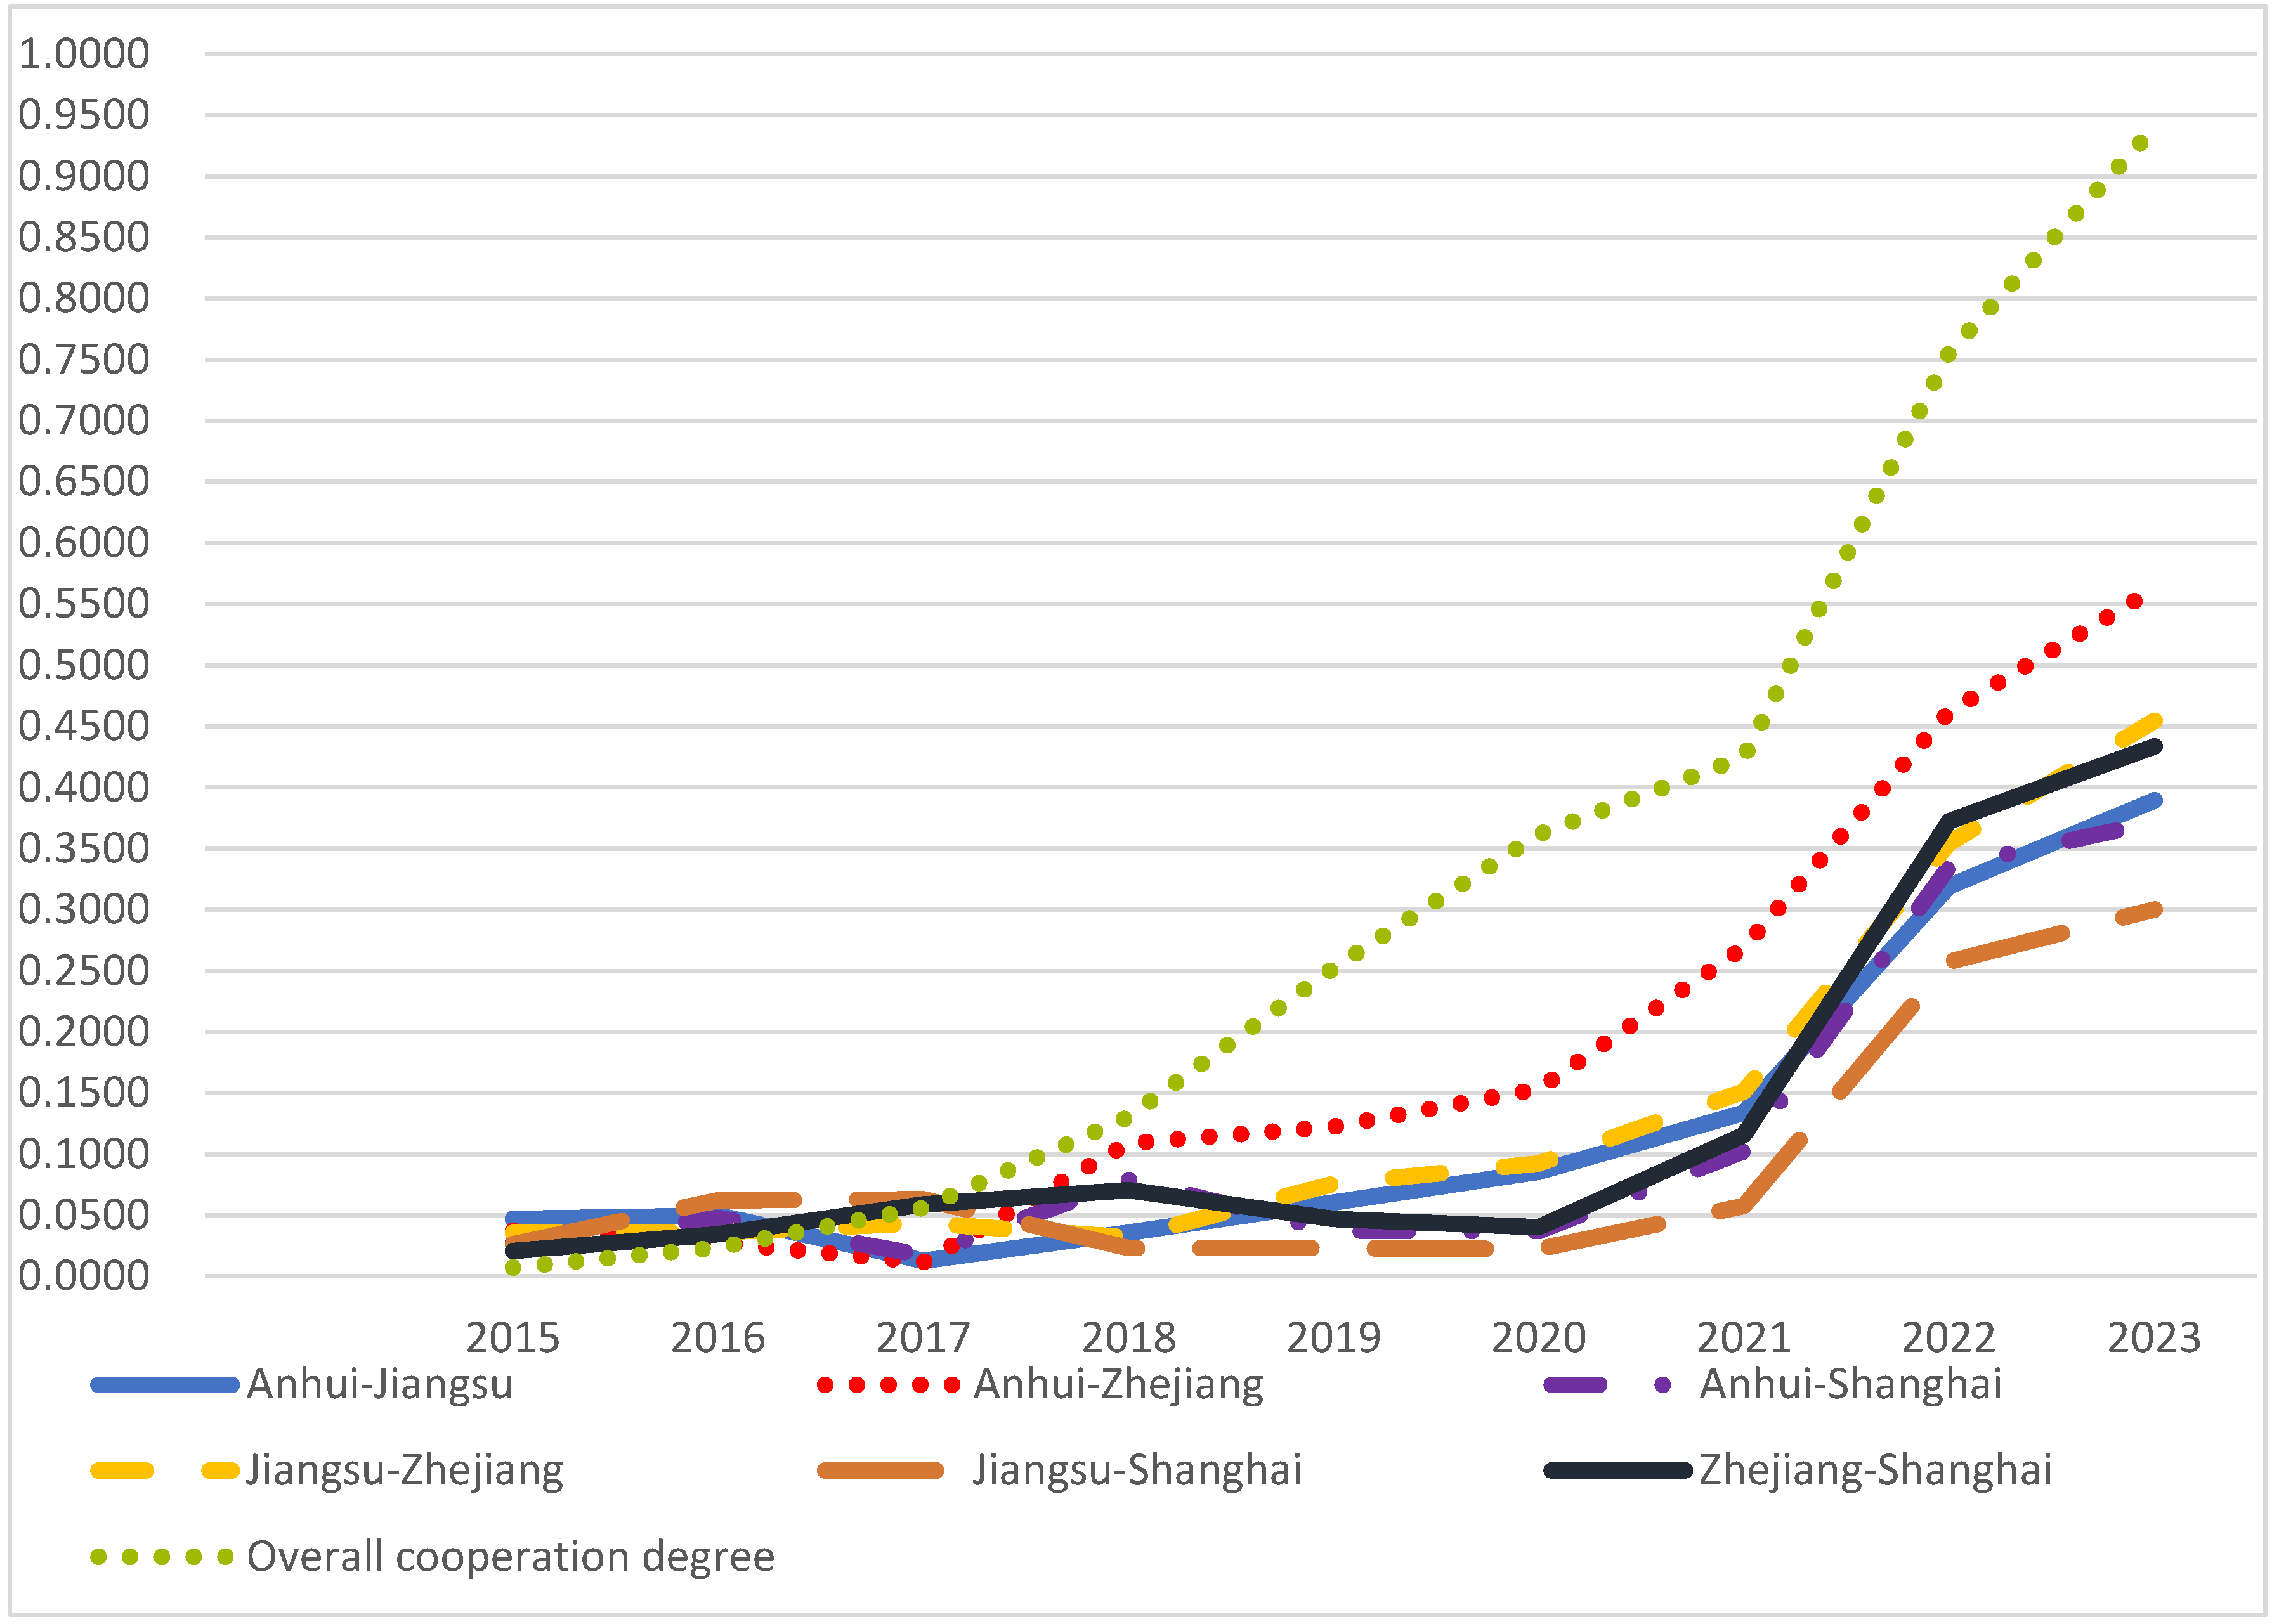
3.4. Cooperation Degree of Regional Carbon Reduction System in the Yangtze River Delta
4. Findings and Discussions
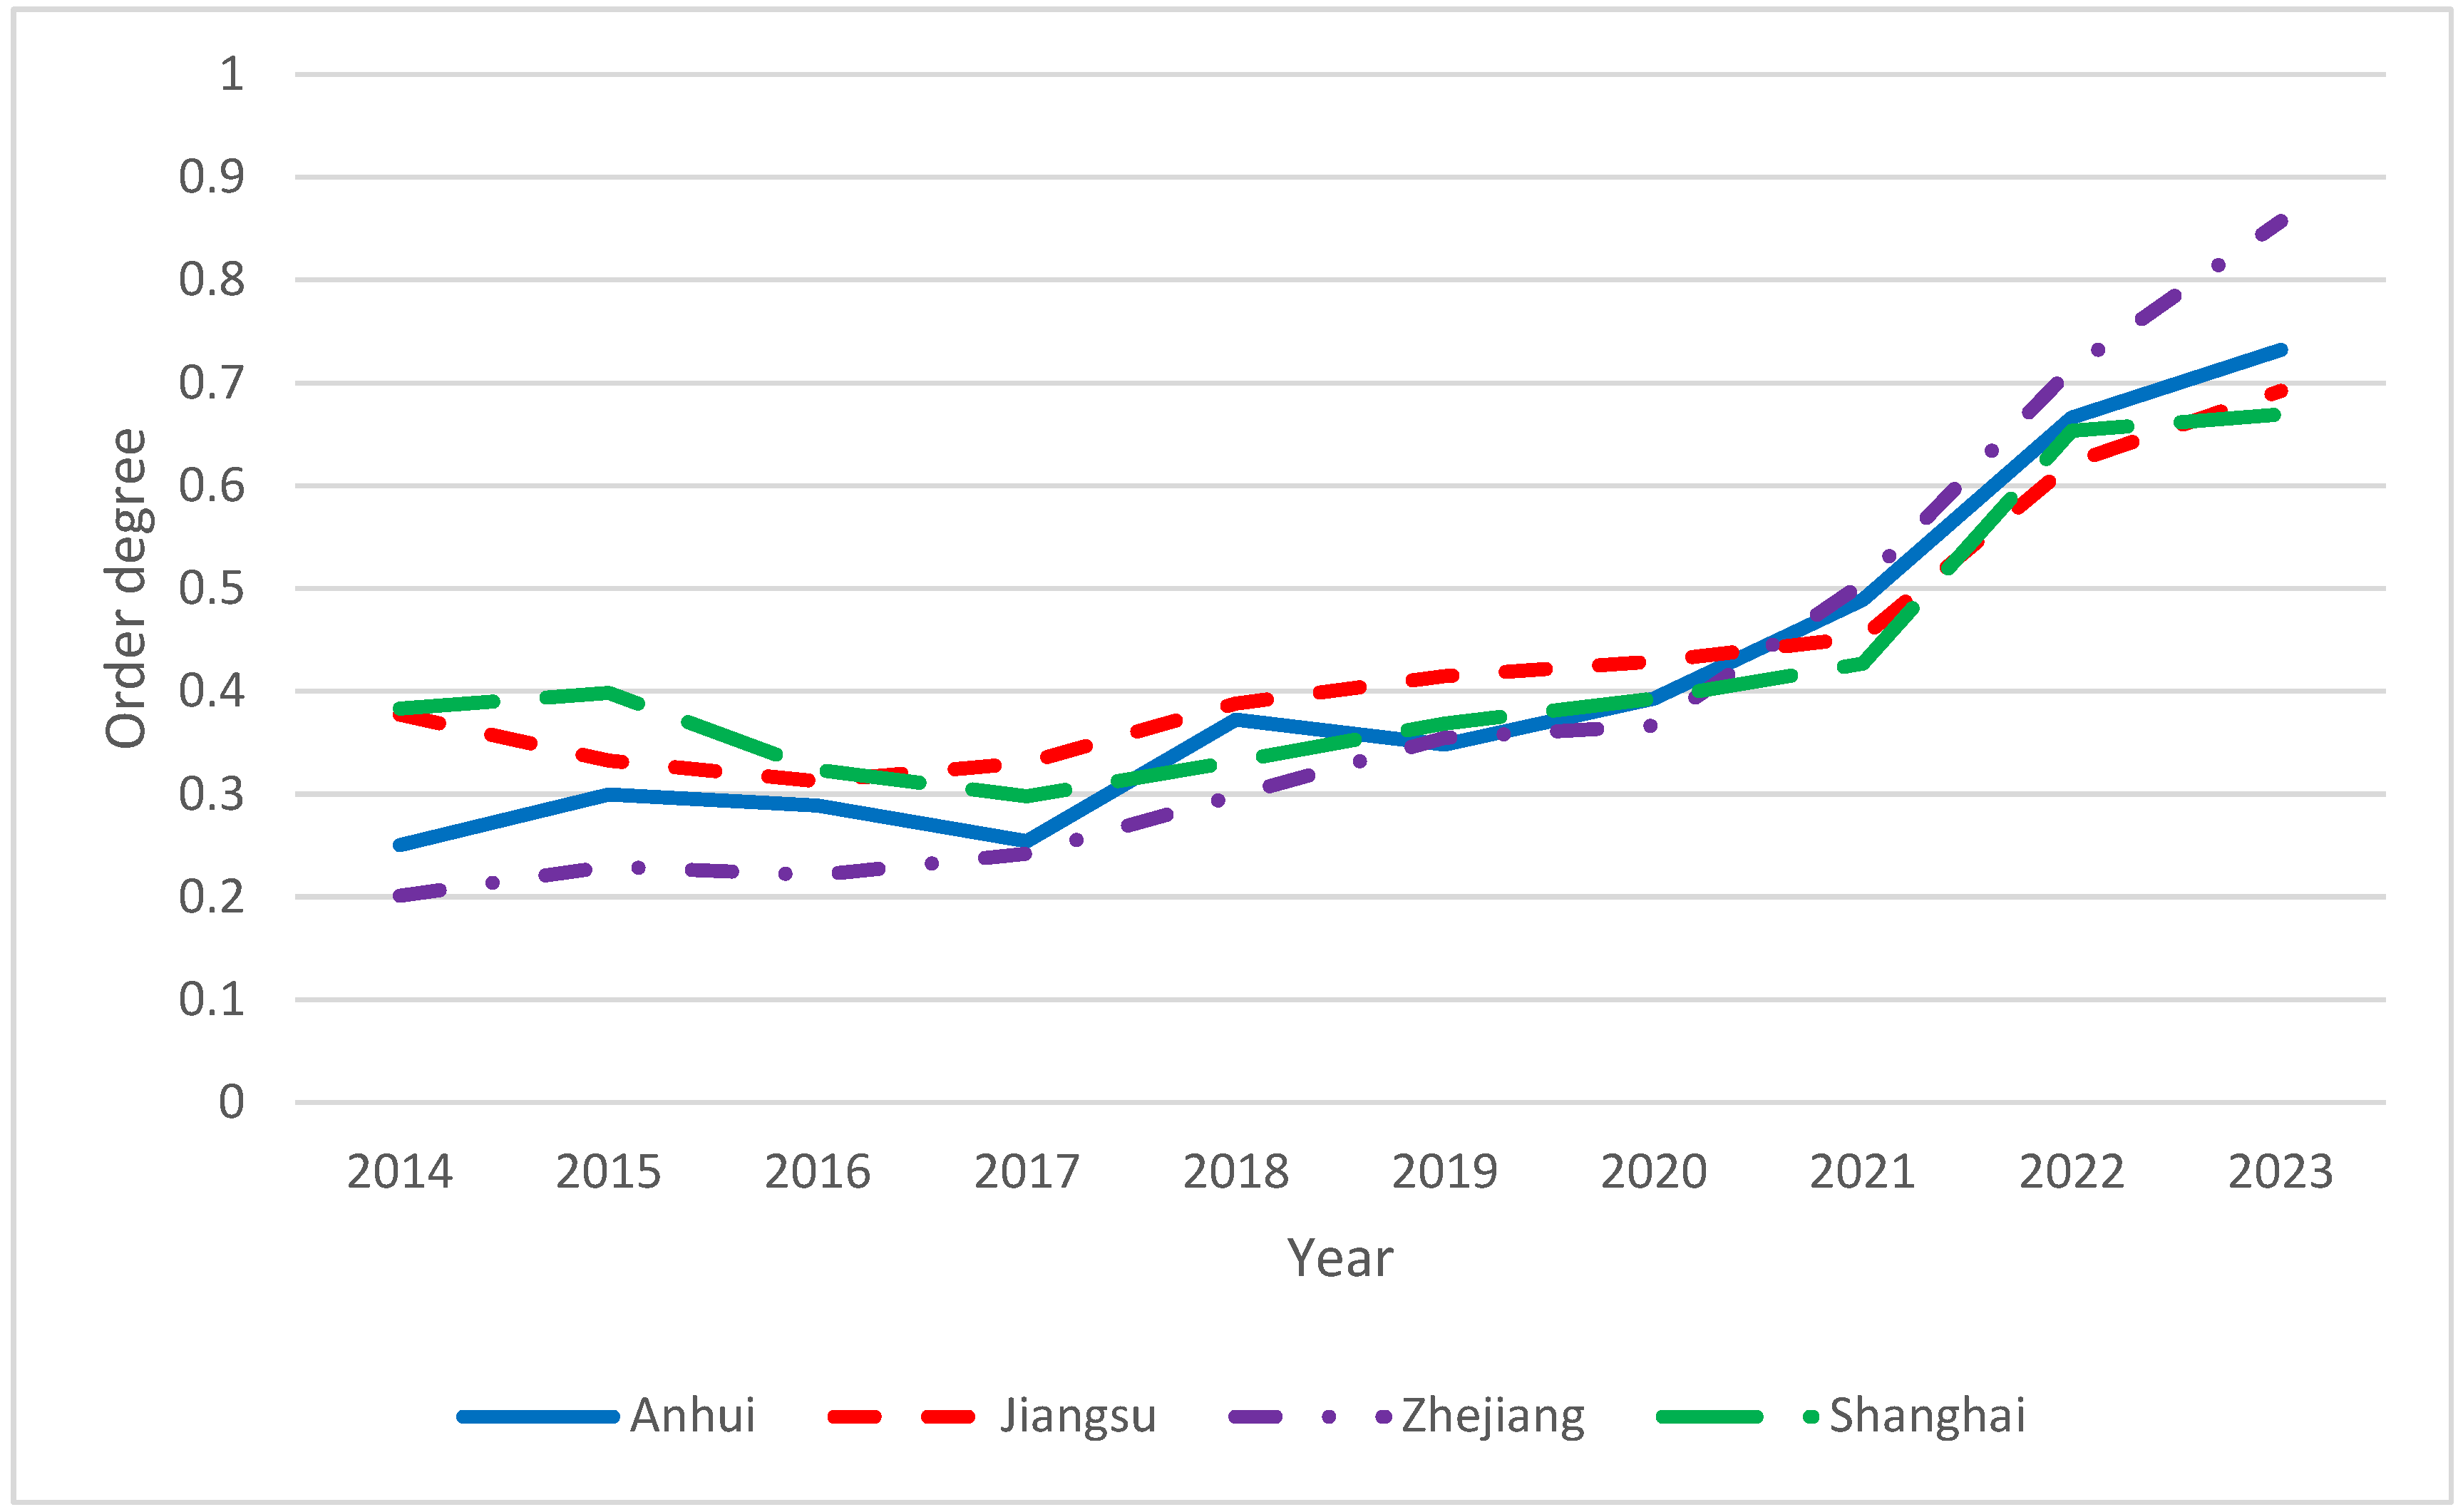
4.1. Overall Regional Carbon Emission Reduction Capacity Trend Is Good
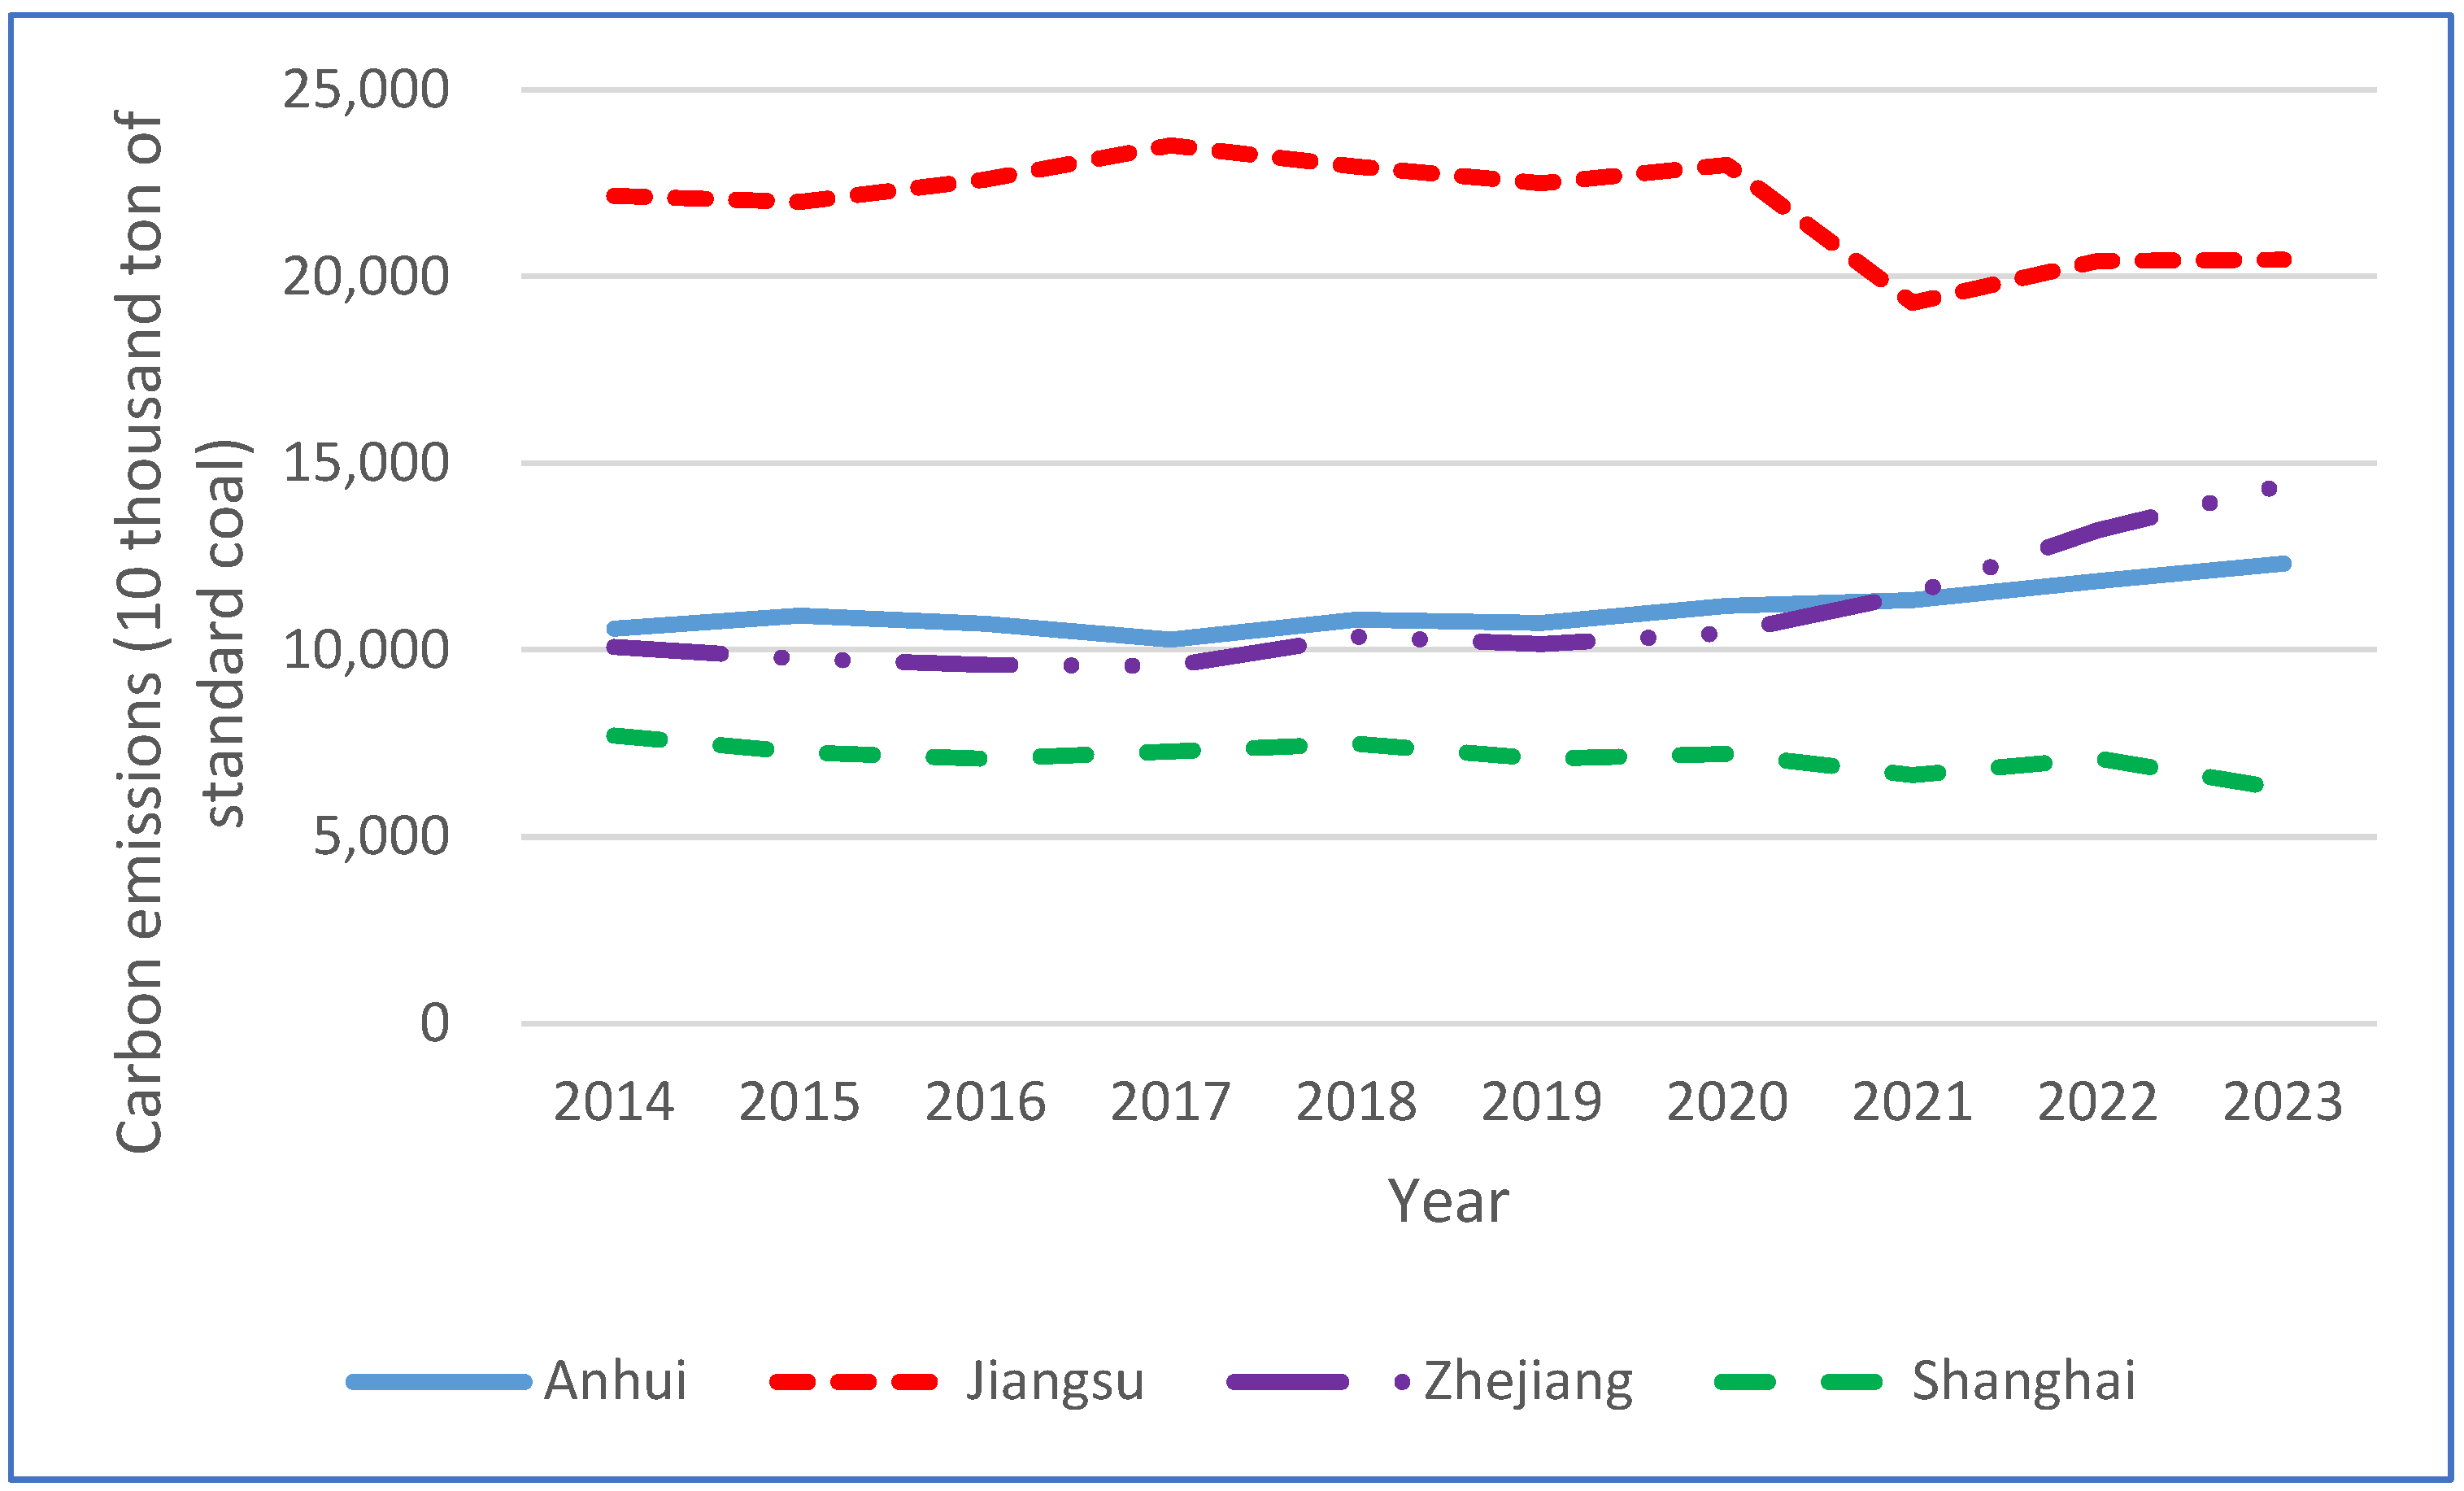
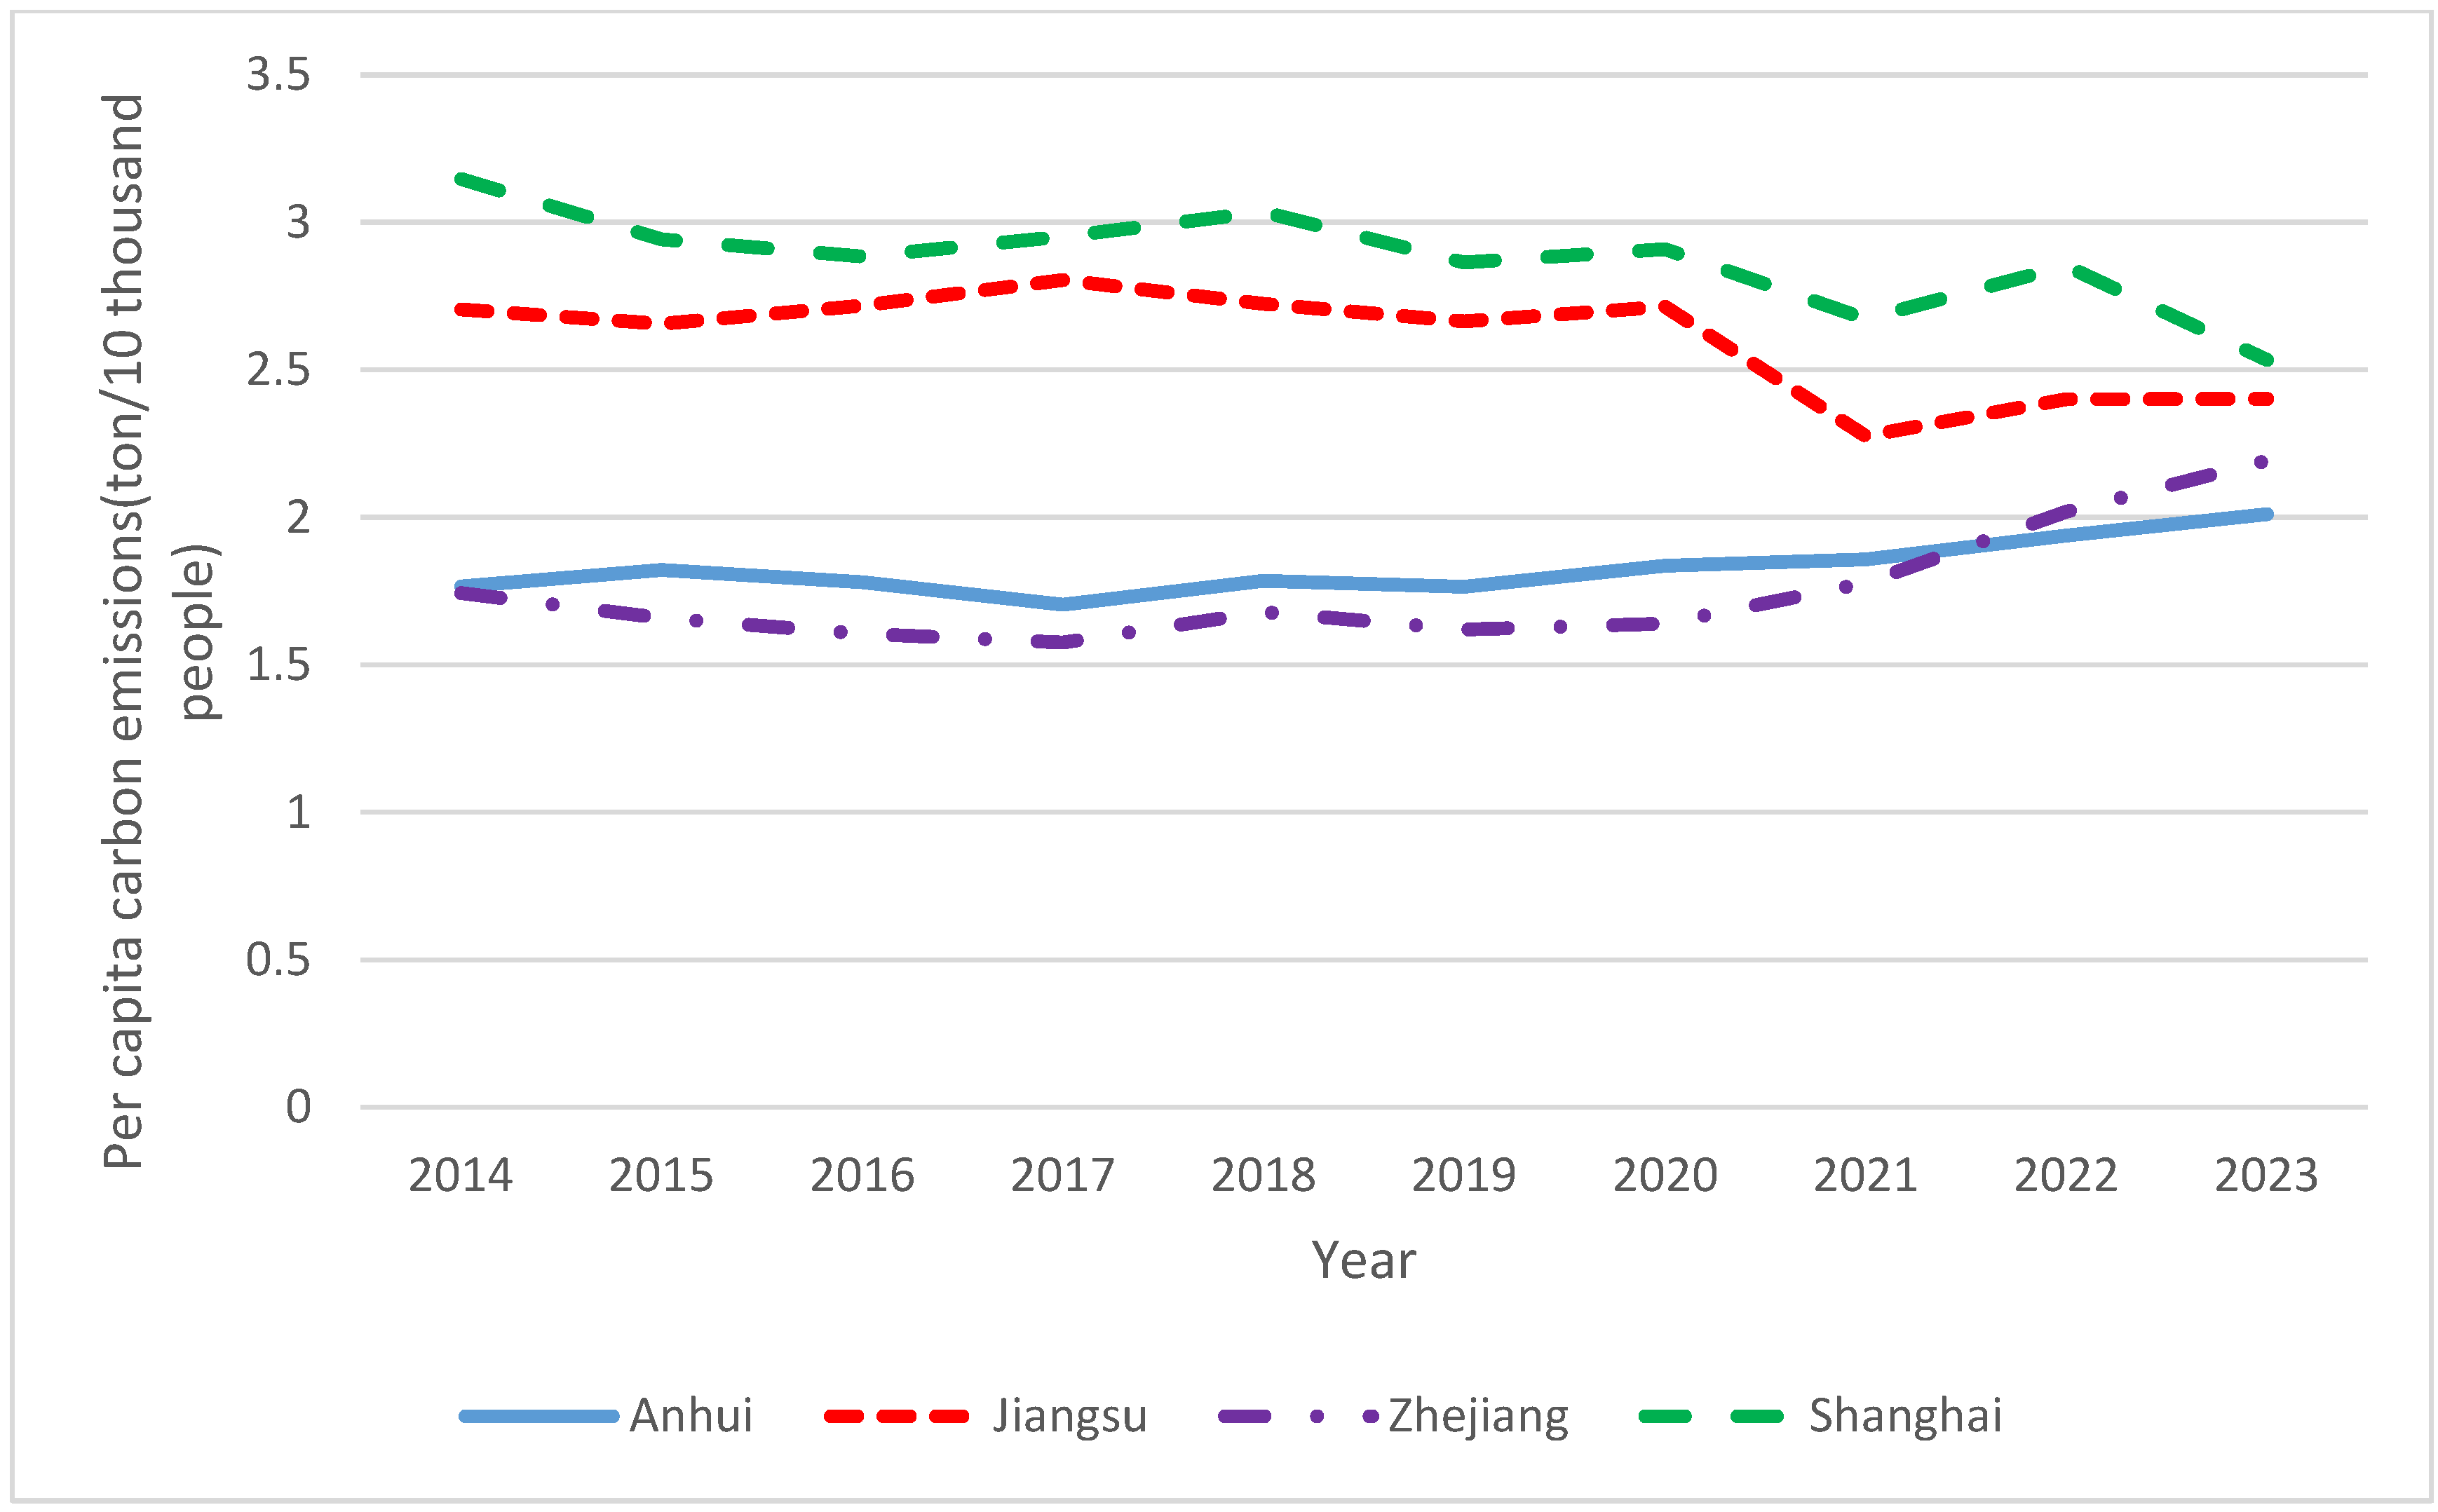
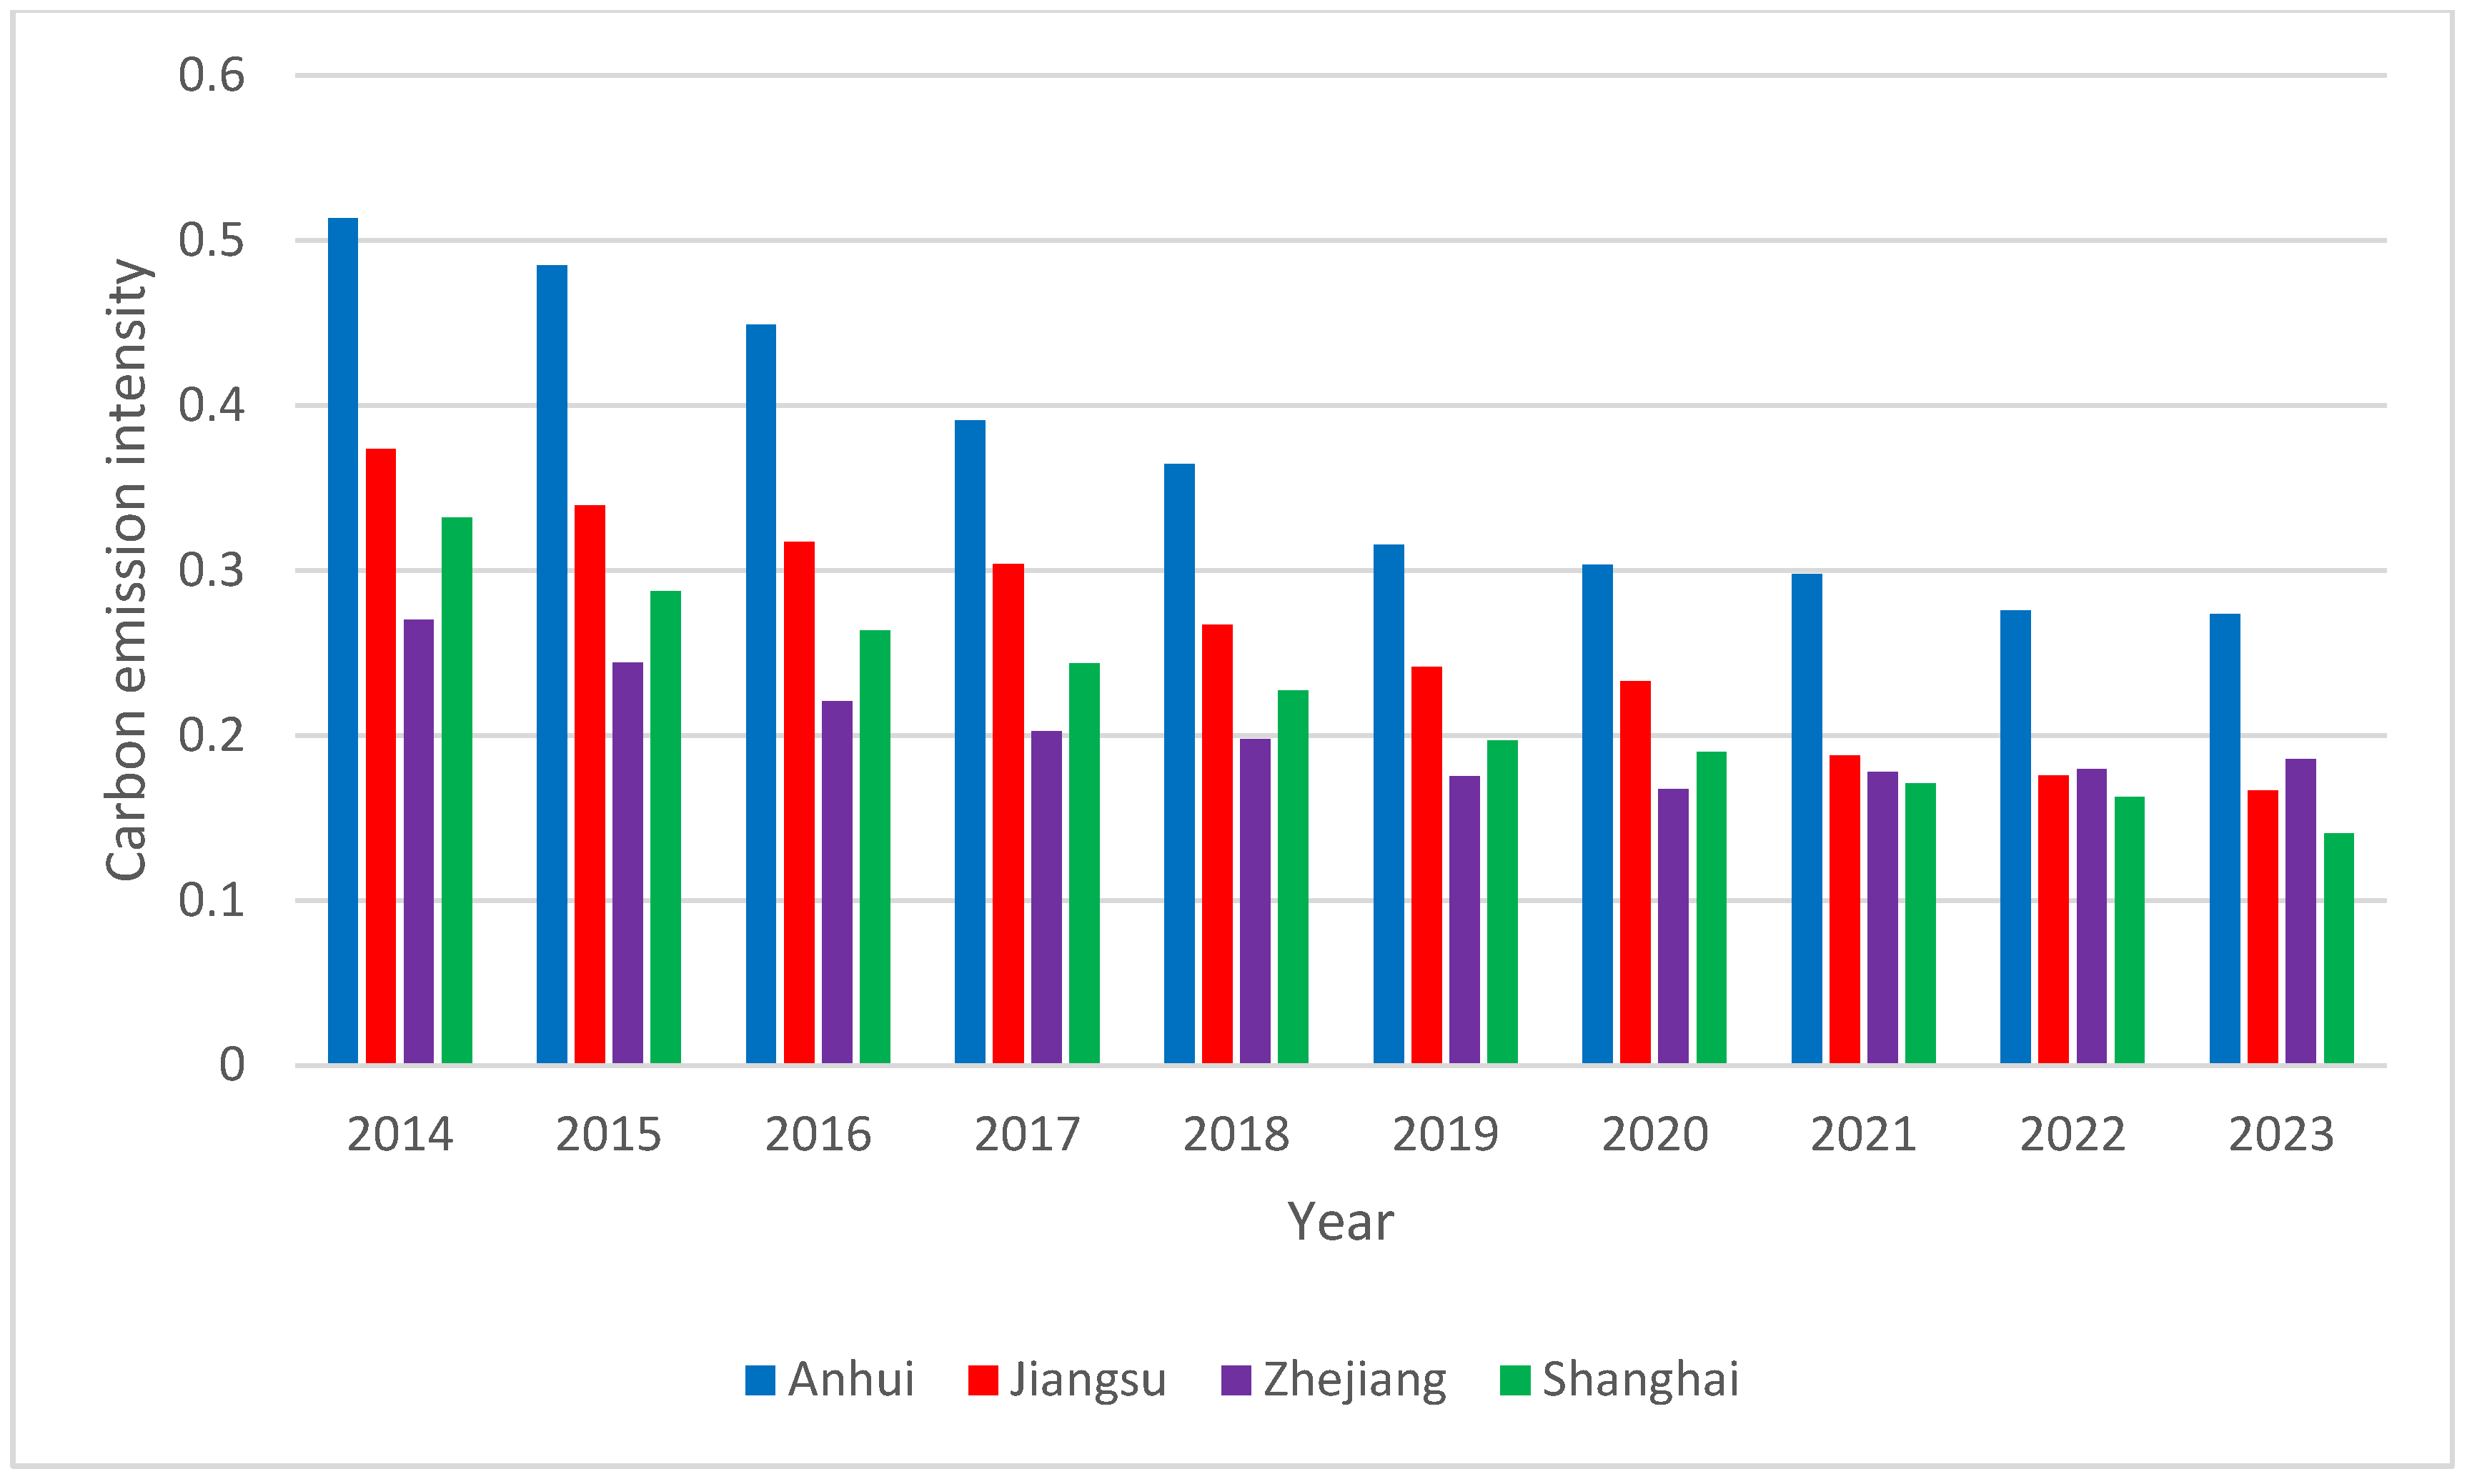
4.2. Economic Development Capacity Continuously Increased and Carbon Emission Capacity Continuously Decreased
4.3. Fluctuation in Carbon Transfer Capacity Decreased
4.4. Technology and Carbon Sequestration Capacity Continuously Improved
4.5. Industrial Development Ability Fluctuated or Declined
4.6. Degree of Interregional Cooperation on Carbon Emission Reduction Was Stable and Increasing
5. Conclusions
Author Contributions
Funding
Data Availability Statement
Conflicts of Interest
References
- Cheng, Z.; Li, L.; Liu, J.; Zhang, H. Total-factor carbon emission efficiency of China’s provincial industrial sector and its dynamic evolution. Renew. Sustain. Energy Rev. 2018, 94, 330–339. [Google Scholar] [CrossRef]
- Friedlingstein, P.; Jones, M.W.; O’Sullivan, M.; Andrew, R.M.; Bakker, D.C.; Hauck, J.; Le Quéré, C.; Peters, G.P.; Peters, W.; Pongratz, J.; et al. Global Carbon Budget 2023. Earth Syst. Sci. Data 2023, 15, 5301–5369. [Google Scholar] [CrossRef]
- Victor, D.G.; Lumkowsky, M.; Dannenberg, A. Determining the credibility of commitments in international climate policy. Nat. Clim. Change 2022, 12, 793–800. [Google Scholar] [CrossRef]
- IEA. CO2 Emissions in 2023; IEA: Paris, France, 2024; Available online: https://www.iea.org/reports/co2-emissions-in-2023 (accessed on 10 March 2025).
- WB. World Bank National Accounts Data, and OECD National Accounts Data Files; WB: Washington, DC, USA, 2024; Available online: https://data.worldbank.org/indicator/NY.GDP.MKTP.KD (accessed on 10 March 2025).
- WMO. State of the Global Climate; WMO: Geneva, Switzerland, 2023; Available online: https://wmo.int/publication-series/state-of-global-climate (accessed on 10 March 2025).
- Canadell, J.G.; Monteiro, P.M.S.; Costa, M.H.; da Cunha, L.C.; Cox, P.M.; Eliseev, A.V.; Henson, S.; Ishii, M.; Jaccard, S.; Koven, C.; et al. Global Carbon and other Biogeochemical Cycles and Feedbacks. In Climate Change 2021: The Physical Science Basis; Contribution of Working Group I to the Sixth Assessment Report of the Intergovernmental Panel on Climate Change; Masson-Delmotte, V., Zhai, P., Pirani, A., Connors, S.L., Péan, C., Berger, S., Caud, N., Chen, Y., Goldfarb, L., Gomis, M.I., et al., Eds.; Cambridge University Press: Cambridge, UK; New York, NY, USA, 2021; pp. 673–816. [Google Scholar] [CrossRef]
- Lochot, V.; Khalilpour, K.; Hoadley, F.A.; Sánchez, D.R. French economy and clean energy transition: A macroeconomic multi-objective extended input-output analysis. Sustain. Futures 2024, 8, 100285. [Google Scholar] [CrossRef]
- Wang, Q. Regional differences and dynamic evolution of carbon emission intensity of industrial energy consumption in Yangtze River Delta metropolitan area. People’s Forum Acad. Front. 2022, 22, 52–61. [Google Scholar] [CrossRef]
- Wang, Y.; Yang, W.U. Analysis and prediction of carbon emissions in Yangtze River Delta. J. Anhui Agri. Univ. 2023, 50, 1051–1058. [Google Scholar] [CrossRef]
- Yu, K.; Feng, J.; Shi, Y. Study on the impact of China-Asean interregional trade on China’s carbon emissions: Based on the framework of global value chain. Nankai Econ. Stud. 2023, 12, 122–143. [Google Scholar] [CrossRef]
- Sikder, M.; Wang, C.; Yeboah, K.F.; Wood, J. Driving factors of CO2 emission reduction in the logistics industry: An assessment of the RCEP and SAARC economies. Environ. Develop. Sustain. 2024, 26, 2557–2587. [Google Scholar] [CrossRef]
- Hu, J.; Mai, J. The industry-related effects and sources of differences of hidden carbon productivity in China: An empirical study based on industrial export trade. Stat. Decision 2024, 40, 96–101. [Google Scholar] [CrossRef]
- Chuanqing, W.; Mingliang, D. Study on the impact of digital economy development on industrial carbon productivity in China. China Soft Sci. 2023, 11, 189–200. [Google Scholar]
- Yanqiu, H.; Hongchun, W.; Yunqiang, L. Spatial effects of agricultural carbon emissions from the perspective of industrial agglomeration. Res. Sci. 2022, 44, 2428–2439. [Google Scholar]
- Meng, W.; Shi, K.; Li, J. The impact and mechanism of digital economy development on agricultural carbon emissions. Rural Fin. Res. 2024, 7, 16–27. [Google Scholar] [CrossRef]
- Zeng, J. The impact of digital trade development on carbon emission reduction in China’s circulation industry under the “dual carbon” goal. J. Comm. Econ. 2024, 16, 34–37. [Google Scholar]
- Zhilun, J.; Wenwen, L.; Binglian, L. Does the development of digital economy necessarily reduce industrial carbon emissions? New evidence from the logistics industry. Nankai Econ. Stud. 2024, 6, 110–128. [Google Scholar] [CrossRef]
- Shi, J.; Zhang, X.; Dai, X.; Yang, X. Study on coupling and coordination of carbon emission reduction and high-quality development in the upper Yangtze River Economic Belt. Stat. Dec. 2024, 40, 90–94. [Google Scholar] [CrossRef]
- Chen, S.H.; Xu, Y.D. Can the digital economy effectively improve provincial carbon productivity? Southeast Acad. Res. 2024, 05, 80–92+246. [Google Scholar] [CrossRef]
- Wang, S.; Xu, Z.; Deng, Y. Study on the influence of new quality productivity on carbon emission reduction. Enterprise Econ. 2024, 43, 36–47. [Google Scholar] [CrossRef]
- Hai, X.H.; Zhan, X.X.; Wang, X. Characteristics of provincial carbon emission spatial correlation network under the background of “dual carbon” target. Stat. Dec. 2024, 40, 85–89. [Google Scholar] [CrossRef]
- Meng, Q.S.; Han, W.X. Research on coordination degree model of complex system. J. Tianjin Univ. (Sci. Tech.) 2000, 33, 444–446. [Google Scholar]
- Zhao, W.T.; Zhao, G.C. A review on the application of cooperative degree model of composite system. Value Engin. 2019, 38, 191–193. [Google Scholar] [CrossRef]
- Huang, C.R.; Chen, L.Z. Research on the degree of synergy between independent innovation and FDI utilization in Yangtze River Delta region. Macroecon 2017, 9, 119–127+183. [Google Scholar] [CrossRef]
- Liu, X.Z.; Liu, N. Research on synergy between technological innovation and industrial structure optimization in the Yangtze River Economic Belt. Macroecon 2019, 10, 35–48. [Google Scholar] [CrossRef]
- Chen, Y.L.; Lu, L.; Zhao, J.L. Measurement of the level of regional innovation factors’ collaborative development and construction of collaborative mechanism: A case study of Beijing-Tianjin-Hebei region. J. Indust. Tech. Econ. 2021, 40, 129–133. [Google Scholar]
- Wu, C.X. Research on synergistic effect of low-carbon economic development in China. J. Manag. World 2021, 37, 105–117. [Google Scholar] [CrossRef]
- Ma, X. Evaluation of regional economic cooperation degree in Beijing-Tianjin-Hebei region based on composite system cooperation degree model. J. Indust. Tech. Econ. 2019, 38, 121–126. [Google Scholar]
- Wang, S.W.; Cui, W.T. Evaluation of coordinated economic development in the Beijing-Tianjin-Hebei region. J. Comm. Econ. 2022, 2, 162–166. [Google Scholar]
- Wang, C.X.; Zhang, X.J.; Lian, X.Y. Realizing green Coordinated development in the Yangtze River Economic Belt: A quantitative analysis based on the synergistic effect of regional pollution reduction and carbon reduction. Environ. Sci. 2024, 1–16. [Google Scholar] [CrossRef]
- Nordhaus, W. Climate Clubs: Overcoming Free-Riding in International Climate Policy. Am. Econ. Rev. 2015, 105, 1339–1370. [Google Scholar] [CrossRef]
- Yukun, C.; Zhanghao, Y.; Tingting, M. Cooperation models in automotive supply chain under low-carbon emission reduction policies. J. Comb. Optim. 2024, 47, 59. [Google Scholar]
- Sun, H.; Gao, G.K.; Li, Z.H. Differential Game Model of Government-Enterprise Cooperation on Emission Reduction under Carbon Emission Trading Policy. Pol. J. Environ. Stud. 2022, 31, 4859–4871. [Google Scholar] [CrossRef]
- Li, X.; Xing, H. Regional carbon emission pathways under central-local coordination: Objective constraints and collaborative incentives. Sustain. Prod. Consum. 2024, 47, 156–165. [Google Scholar] [CrossRef]
- Sun, X.; Zhang, H.; Wang, X.; Qiao, Z.; Li, J. Towards Sustainable Development: A Study of Cross-Regional Collaborative Carbon Emission Reduction in China. Sustainability 2022, 14, 9624. [Google Scholar] [CrossRef]
- Hermelin, B.; Gustafsson, S. A local governance initiative for climate mitigation: The place-leading role of local government. Reg. Stud. Reg. Sci. 2024, 11, 599–613. [Google Scholar] [CrossRef]
- Pu, S.R.; Li, J. Measurement and evaluation of carbon emission reduction capacity in the Beijing-Tianjin-Hebei region. Sci. Tech. Manag. Res. 2016, 36, 193–198. [Google Scholar]
- Wang, M.Y.; Liu, Y.; Li, M.M.; Liu, Y.W.; Shi, W.Q. Construction and application of regional carbon emission reduction capacity cooperation degree evaluation model. Syst. Engin.-Theory Prac. 2020, 40, 470–483. [Google Scholar]
- Tang, D.; Zhang, Y.; Wang, L.X. A Comprehensive evaluation of carbon emission reduction capacity in Yangtze River Economic Belt. Ecol. Econ. 2021, 37, 45–50. [Google Scholar]
- Zhang, C.; Zhang, Z. Agglomeration effect and radiation effect of Carbon emission intensity at Provincial level in China. J. Environ. Sci. 2017, 37, 1178–1184. [Google Scholar]
- Guo, Y.; Hu, F.; Xie, J.; Liu, C.; Yang, Y.; Ding, H.; Wu, X. Data-Driven Evaluation of the Synergetic Development of Regional Carbon Emissions in the Yangtze River Delta. Processes 2022, 10, 2236. [Google Scholar] [CrossRef]
- Zhang, J.T.; Wang, G.J.; Wu, J.; Zhang, Y.W.; Shi, Q.F. Research on evaluation of scientific and technological innovation ability of Jiangsu universities based on entropy weight -DEMATEL. Sci. Tech. Manag. Res. 2018, 38, 47–54. [Google Scholar]
- Du, R.Y.; Fan, Y.; Li, Y.C.; Li, M.H.; Qu, M.H. Study on the coupling and coordination of rural labor force transfer, agricultural land scale management and agro-ecological environment in Henan Province. J. Henan Agric. Univ. 2019, 53, 480–487. [Google Scholar] [CrossRef]
- Zhou, Y.X.; Li, X.M.; Qu, H.Z. Comprehensive vulnerability assessment of power network nodes based on inverse entropy and AHP quadratic programming combination weighting method. Elec. Power Autom. Equip. 2019, 39, 133–140. [Google Scholar] [CrossRef]
- Huang, G.L.; Xu, R.Y.; Wang, X.Z.; Li, M.B. Evaluation of regional innovation cooperation degree in Henan Province based on composite system cooperation degree model. J. Henan Agric. Univ. 2020, 54, 1059–1066. [Google Scholar] [CrossRef]
- Li, Z.; Zhang, Y. The evolution of Yangtze River Delta integration and its high-quality development logic. J. East China Norm. Univ. 2020, 52, 146–156+187–188. [Google Scholar] [CrossRef]
- Sun, Z.; Guan, H.; Zhao, A. Research on the Synergistic Effect of the Composite System for High-Quality Development of the Marine Economy in China. Systems 2023, 11, 282. [Google Scholar] [CrossRef]

| Primary Index | Secondary Index | Tertiary Index | Definition of the Indicator | Positive/Negative |
|---|---|---|---|---|
| Regional carbon reduction capacity | Economic development ability | Per capita GDP | Regional output creation capacity per capita (Yuan/person) | + |
| Share of regional GDP in the national total | Regional economic status in the country (%) | + | ||
| Per capita disposable income of urban residents | Disposable income of urban residents (Yuan/person) | + | ||
| Per capita disposable income of rural residents | Disposable income of rural residents (Yuan/person) | + | ||
| Carbon emission capacity | Energy intensity | Energy consumption per unit of GDP (tons of standard coal/10,000 yuan) | − | |
| Carbon emission intensity | Carbon emissions per unit of GDP (tons of standard coal/10,000 yuan) | − | ||
| Carbon footprint | Carbon emissions per capita (tons/person) | − | ||
| Share of fossil energy in total energy consumption | Fossil energy consumption capacity (%) | − | ||
| Carbon transfer capacity (cross-border transfer) | Share of FDI in GDP | Foreign investment capacity (%) | + | |
| Share of import and export trade in GDP | Carbon transfer capacity (%) | + | ||
| Export competitive advantage | Balance of import and export trade proportion of total import and export trade (%) | + | ||
| Technology and carbon sinks | Intensity of regional R&D expenditure | Share of R&D expenditure in GDP (%) | + | |
| Urban green coverage rate | Carbon sink capacity (%) | + | ||
| Urbanization rate | Sustainable capacity of carbon sink (%) | + | ||
| Industrial development ability | Share of secondary industry in GDP | Secondary industry development capacity (%) | − | |
| Share of tertiary industry in GDP | Tertiary industry development capacity (%) | + | ||
| Share of main revenue of high-tech industries in GDP | High-tech industry development capability (%) | + |
| Fossil Fuel | SCC | CEF |
|---|---|---|
| Coal | 0.7143 | 0.7559 |
| Coke | 0.9714 | 0.855 |
| Crude oil | 1.4286 | 0.5538 |
| Fuel oil | 1.4286 | 0.5857 |
| Gasoline | 1.4714 | 0.5921 |
| Kerosene | 1.4714 | 0.5714 |
| Diesel | 1.4571 | 0.6185 |
| Natural gas | 1.33 | 0.4483 |
| Index/Province | Anhui | Jiangsu | Zhejiang | Shanghai |
|---|---|---|---|---|
| Per capita GDP | 0.0563 | 0.0546 | 0.0532 | 0.0538 |
| Share of regional GDP in the national total | 0.0387 | 0.0512 | 0.0734 | 0.0703 |
| Per capita disposable income of urban residents | 0.0538 | 0.0568 | 0.0535 | 0.0461 |
| Per capita disposable income of rural residents | 0.0606 | 0.0530 | 0.0550 | 0.0472 |
| Energy intensity | 0.0653 | 0.0702 | 0.06147 | 0.0553 |
| Carbon emission intensity | 0.0627 | 0.0667 | 0.0653 | 0.0630 |
| Carbon footprint | 0.0390 | 0.0240 | 0.0693 | 0.0803 |
| Share of fossil energy in total energy consumption | 0.0563 | 0.0717 | 0.0588 | 0.0664 |
| Share of FDI in GDP | 0.1060 | 0.0995 | 0.0243 | 0.0434 |
| Share of import and export trade in GDP | 0.0528 | 0.0833 | 0.0730 | 0.0489 |
| Export competitive advantage | 0.0461 | 0.0537 | 0.0513 | 0.0651 |
| Intensity of regional R&D expenditure | 0.0528 | 0.0388 | 0.0412 | 0.0527 |
| Urban green coverage rate | 0.0396 | 0.0680 | 0.0479 | 0.0904 |
| Urbanization rate | 0.0543 | 0.0513 | 0.0582 | 0.0596 |
| Share of secondary industry in GDP | 0.0612 | 0.0678 | 0.0464 | 0.0573 |
| Share of tertiary industry in GDP | 0.0953 | 0.0544 | 0.0638 | 0.0471 |
| Share of main revenue of high-tech industries in GDP | 0.0592 | 0.0350 | 0.1039 | 0.0531 |
| Year | Economic Development Ability | Carbon Emission Capacity | Carbon Transfer Capacity | Technology and Carbon Sinks | Industrial Development Ability |
|---|---|---|---|---|---|
| 2014 | 0.1313 | 0.2691 | 0.2291 | 0.1246 | 0.2041 |
| 2015 | 0.1514 | 0.2493 | 0.2051 | 0.1275 | 0.1823 |
| 2016 | 0.1677 | 0.2398 | 0.2489 | 0.1352 | 0.2171 |
| 2017 | 0.1824 | 0.2360 | 0.2113 | 0.1432 | 0.2219 |
| 2018 | 0.2012 | 0.2287 | 0.2145 | 0.1472 | 0.2252 |
| 2019 | 0.2134 | 0.2219 | 0.2164 | 0.1510 | 0.2335 |
| 2020 | 0.2298 | 0.2096 | 0.1857 | 0.1531 | 0.2420 |
| 2021 | 0.2495 | 0.2008 | 0.1960 | 0.1574 | 0.2241 |
| 2022 | 0.2732 | 0.1923 | 0.1751 | 0.1603 | 0.2035 |
| 2023 | 0.2949 | 0.1854 | 0.16718 | 0.1663 | 0.2033 |
| Year | Economic Development Ability | Carbon Emission Capacity | Carbon Transfer Capacity | Technology and Carbon Sinks | Industrial Development Ability |
|---|---|---|---|---|---|
| 2014 | 0.1525 | 0.2766 | 0.3035 | 0.1495 | 0.1629 |
| 2015 | 0.1676 | 0.2729 | 0.2938 | 0.1490 | 0.1620 |
| 2016 | 0.1809 | 0.2603 | 0.2976 | 0.1534 | 0.1626 |
| 2017 | 0.1928 | 0.2481 | 0.2640 | 0.1562 | 0.1616 |
| 2018 | 0.2056 | 0.2338 | 0.2352 | 0.1579 | 0.1600 |
| 2019 | 0.2206 | 0.2254 | 0.2115 | 0.1591 | 0.1581 |
| 2020 | 0.2345 | 0.2209 | 0.1988 | 0.1616 | 0.1573 |
| 2021 | 0.2517 | 0.2047 | 0.1902 | 0.1628 | 0.1538 |
| 2022 | 0.2669 | 0.1932 | 0.1854 | 0.1644 | 0.1491 |
| 2023 | 0.2824 | 0.1900 | 0.1855 | 0.1677 | 0.1447 |
| Year | Economic Development Ability | Carbon Emission Capacity | Carbon Transfer Capacity | Technology and Carbon Sinks | Industrial Development Ability |
|---|---|---|---|---|---|
| 2014 | 0.1774 | 0.3122 | 0.1521 | 0.1330 | 0.2203 |
| 2015 | 0.1910 | 0.2991 | 0.1511 | 0.1360 | 0.2112 |
| 2016 | 0.2013 | 0.2804 | 0.1506 | 0.1418 | 0.2091 |
| 2017 | 0.2127 | 0.2684 | 0.1543 | 0.1446 | 0.2098 |
| 2018 | 0.2235 | 0.2549 | 0.1603 | 0.1474 | 0.2120 |
| 2019 | 0.2377 | 0.2465 | 0.1545 | 0.1490 | 0.2109 |
| 2020 | 0.2515 | 0.2344 | 0.1497 | 0.1518 | 0.2121 |
| 2021 | 0.2682 | 0.2299 | 0.1426 | 0.1524 | 0.2113 |
| 2022 | 0.2853 | 0.2141 | 0.1382 | 0.1565 | 0.2195 |
| 2023 | 0.3031 | 0.2092 | 0.1325 | 0.1602 | 0.2245 |
| Year | Economic Development Ability | Carbon Emission Capacity | Carbon Transfer Capacity | Technology and Carbon Sinks | Industrial Development Ability |
|---|---|---|---|---|---|
| 2014 | 0.1724 | 0.3266 | 0.1086 | 0.1977 | 0.1870 |
| 2015 | 0.1797 | 0.3126 | 0.1242 | 0.2037 | 0.1792 |
| 2016 | 0.1866 | 0.2966 | 0.1296 | 0.2047 | 0.1711 |
| 2017 | 0.1937 | 0.2916 | 0.1391 | 0.2052 | 0.1627 |
| 2018 | 0.2046 | 0.2593 | 0.1525 | 0.2062 | 0.1583 |
| 2019 | 0.2165 | 0.2514 | 0.1662 | 0.2047 | 0.1532 |
| 2020 | 0.2332 | 0.2392 | 0.1742 | 0.2017 | 0.1443 |
| 2021 | 0.2482 | 0.2329 | 0.1915 | 0.2022 | 0.1439 |
| 2022 | 0.2626 | 0.2201 | 0.1962 | 0.2001 | 0.1395 |
| 2023 | 0.2760 | 0.2202 | 0.1922 | 0.2012 | 0.1351 |
| Year/Province | Anhui | Jiangsu | Zhejiang | Shanghai |
|---|---|---|---|---|
| 2014 | 0.2505 | 0.3774 | 0.2012 | 0.3830 |
| 2015 | 0.2995 | 0.3326 | 0.2296 | 0.3982 |
| 2016 | 0.2886 | 0.3124 | 0.2211 | 0.3236 |
| 2017 | 0.2539 | 0.3306 | 0.2419 | 0.2981 |
| 2018 | 0.3722 | 0.3879 | 0.2985 | 0.3319 |
| 2019 | 0.3481 | 0.4148 | 0.3546 | 0.3687 |
| 2020 | 0.3927 | 0.4289 | 0.3664 | 0.3928 |
| 2021 | 0.4889 | 0.4526 | 0.5050 | 0.4270 |
| 2022 | 0.6663 | 0.6223 | 0.7140 | 0.6533 |
| 2023 | 0.7322 | 0.6923 | 0.8576 | 0.6696 |
| Year | Anhui–Jiangsu | Anhui– Zhejiang | Anhui– Shanghai | Jiangsu– Zhejiang | Jiangsu– Shanghai | Zhejiang– Shanghai | Overall Cooperation Degree |
|---|---|---|---|---|---|---|---|
| 2015 | 0.0469 | 0.0373 | 0.0273 | 0.0357 | 0.0261 | 0.0208 | 0.0074 |
| 2016 | 0.0498 | 0.0276 | 0.0476 | 0.0360 | 0.0622 | 0.0344 | 0.0235 |
| 2017 | 0.0128 | 0.0119 | 0.0172 | 0.0437 | 0.0630 | 0.0588 | 0.0560 |
| 2018 | 0.0357 | 0.1089 | 0.0789 | 0.0319 | 0.0232 | 0.0706 | 0.1305 |
| 2019 | 0.0604 | 0.1224 | 0.0374 | 0.0758 | 0.0232 | 0.0469 | 0.2521 |
| 2020 | 0.0856 | 0.1533 | 0.0372 | 0.0923 | 0.0224 | 0.0401 | 0.3618 |
| 2021 | 0.1340 | 0.2692 | 0.1024 | 0.1512 | 0.0575 | 0.1156 | 0.4247 |
| 2022 | 0.3191 | 0.4618 | 0.3352 | 0.3544 | 0.2573 | 0.3723 | 0.7557 |
| 2023 | 0.3895 | 0.5623 | 0.3716 | 0.4547 | 0.3004 | 0.4337 | 0.9402 |
Disclaimer/Publisher’s Note: The statements, opinions and data contained in all publications are solely those of the individual author(s) and contributor(s) and not of MDPI and/or the editor(s). MDPI and/or the editor(s) disclaim responsibility for any injury to people or property resulting from any ideas, methods, instructions or products referred to in the content. |
© 2025 by the authors. Licensee MDPI, Basel, Switzerland. This article is an open access article distributed under the terms and conditions of the Creative Commons Attribution (CC BY) license (https://creativecommons.org/licenses/by/4.0/).
Share and Cite
Hu, F.; Guo, Y.; Wang, K.; Xie, J.; Ding, H.; Chen, J. Evaluation of Regional Carbon Emission Reduction Capacity and Complex Collaborative Development: An Empirical Study of the Yangtze River Delta Region. Processes 2025, 13, 1397. https://doi.org/10.3390/pr13051397
Hu F, Guo Y, Wang K, Xie J, Ding H, Chen J. Evaluation of Regional Carbon Emission Reduction Capacity and Complex Collaborative Development: An Empirical Study of the Yangtze River Delta Region. Processes. 2025; 13(5):1397. https://doi.org/10.3390/pr13051397
Chicago/Turabian StyleHu, Fagang, Yuxia Guo, Kun Wang, Jun Xie, Heping Ding, and Jianqing Chen. 2025. "Evaluation of Regional Carbon Emission Reduction Capacity and Complex Collaborative Development: An Empirical Study of the Yangtze River Delta Region" Processes 13, no. 5: 1397. https://doi.org/10.3390/pr13051397
APA StyleHu, F., Guo, Y., Wang, K., Xie, J., Ding, H., & Chen, J. (2025). Evaluation of Regional Carbon Emission Reduction Capacity and Complex Collaborative Development: An Empirical Study of the Yangtze River Delta Region. Processes, 13(5), 1397. https://doi.org/10.3390/pr13051397