

Revision of the Screening Robust Estimation Method for the Retrospective Analysis of Normal Processes


Abstract
1. Introduction
2. Theoretical Background
2.1. Some General Features of Phase I Analysis
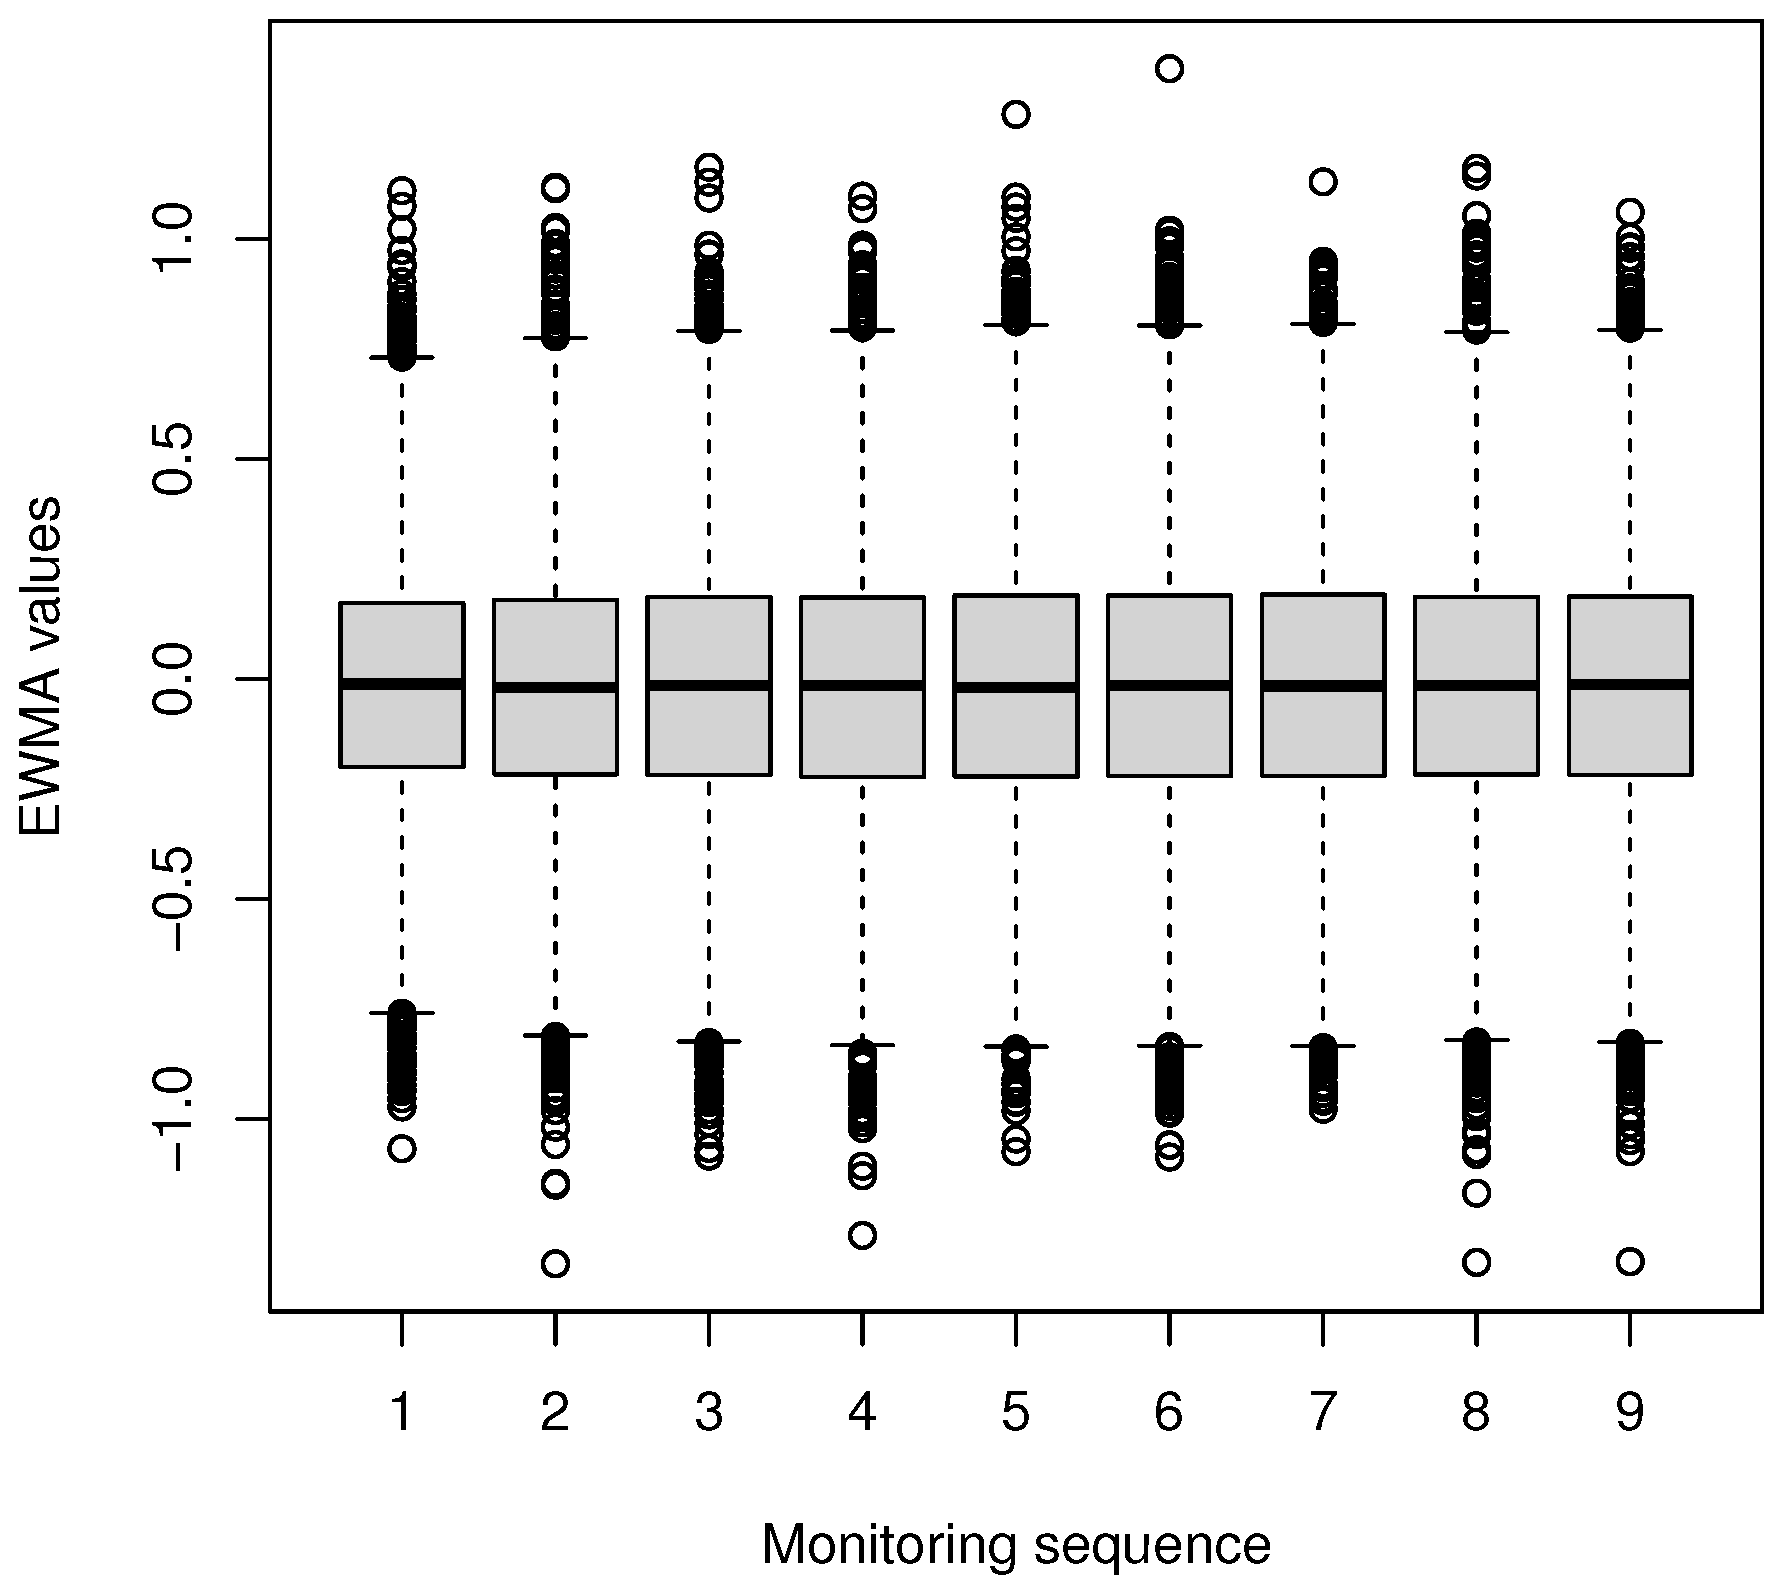
2.2. The EWMA-Based Screening Robust Estimation Method
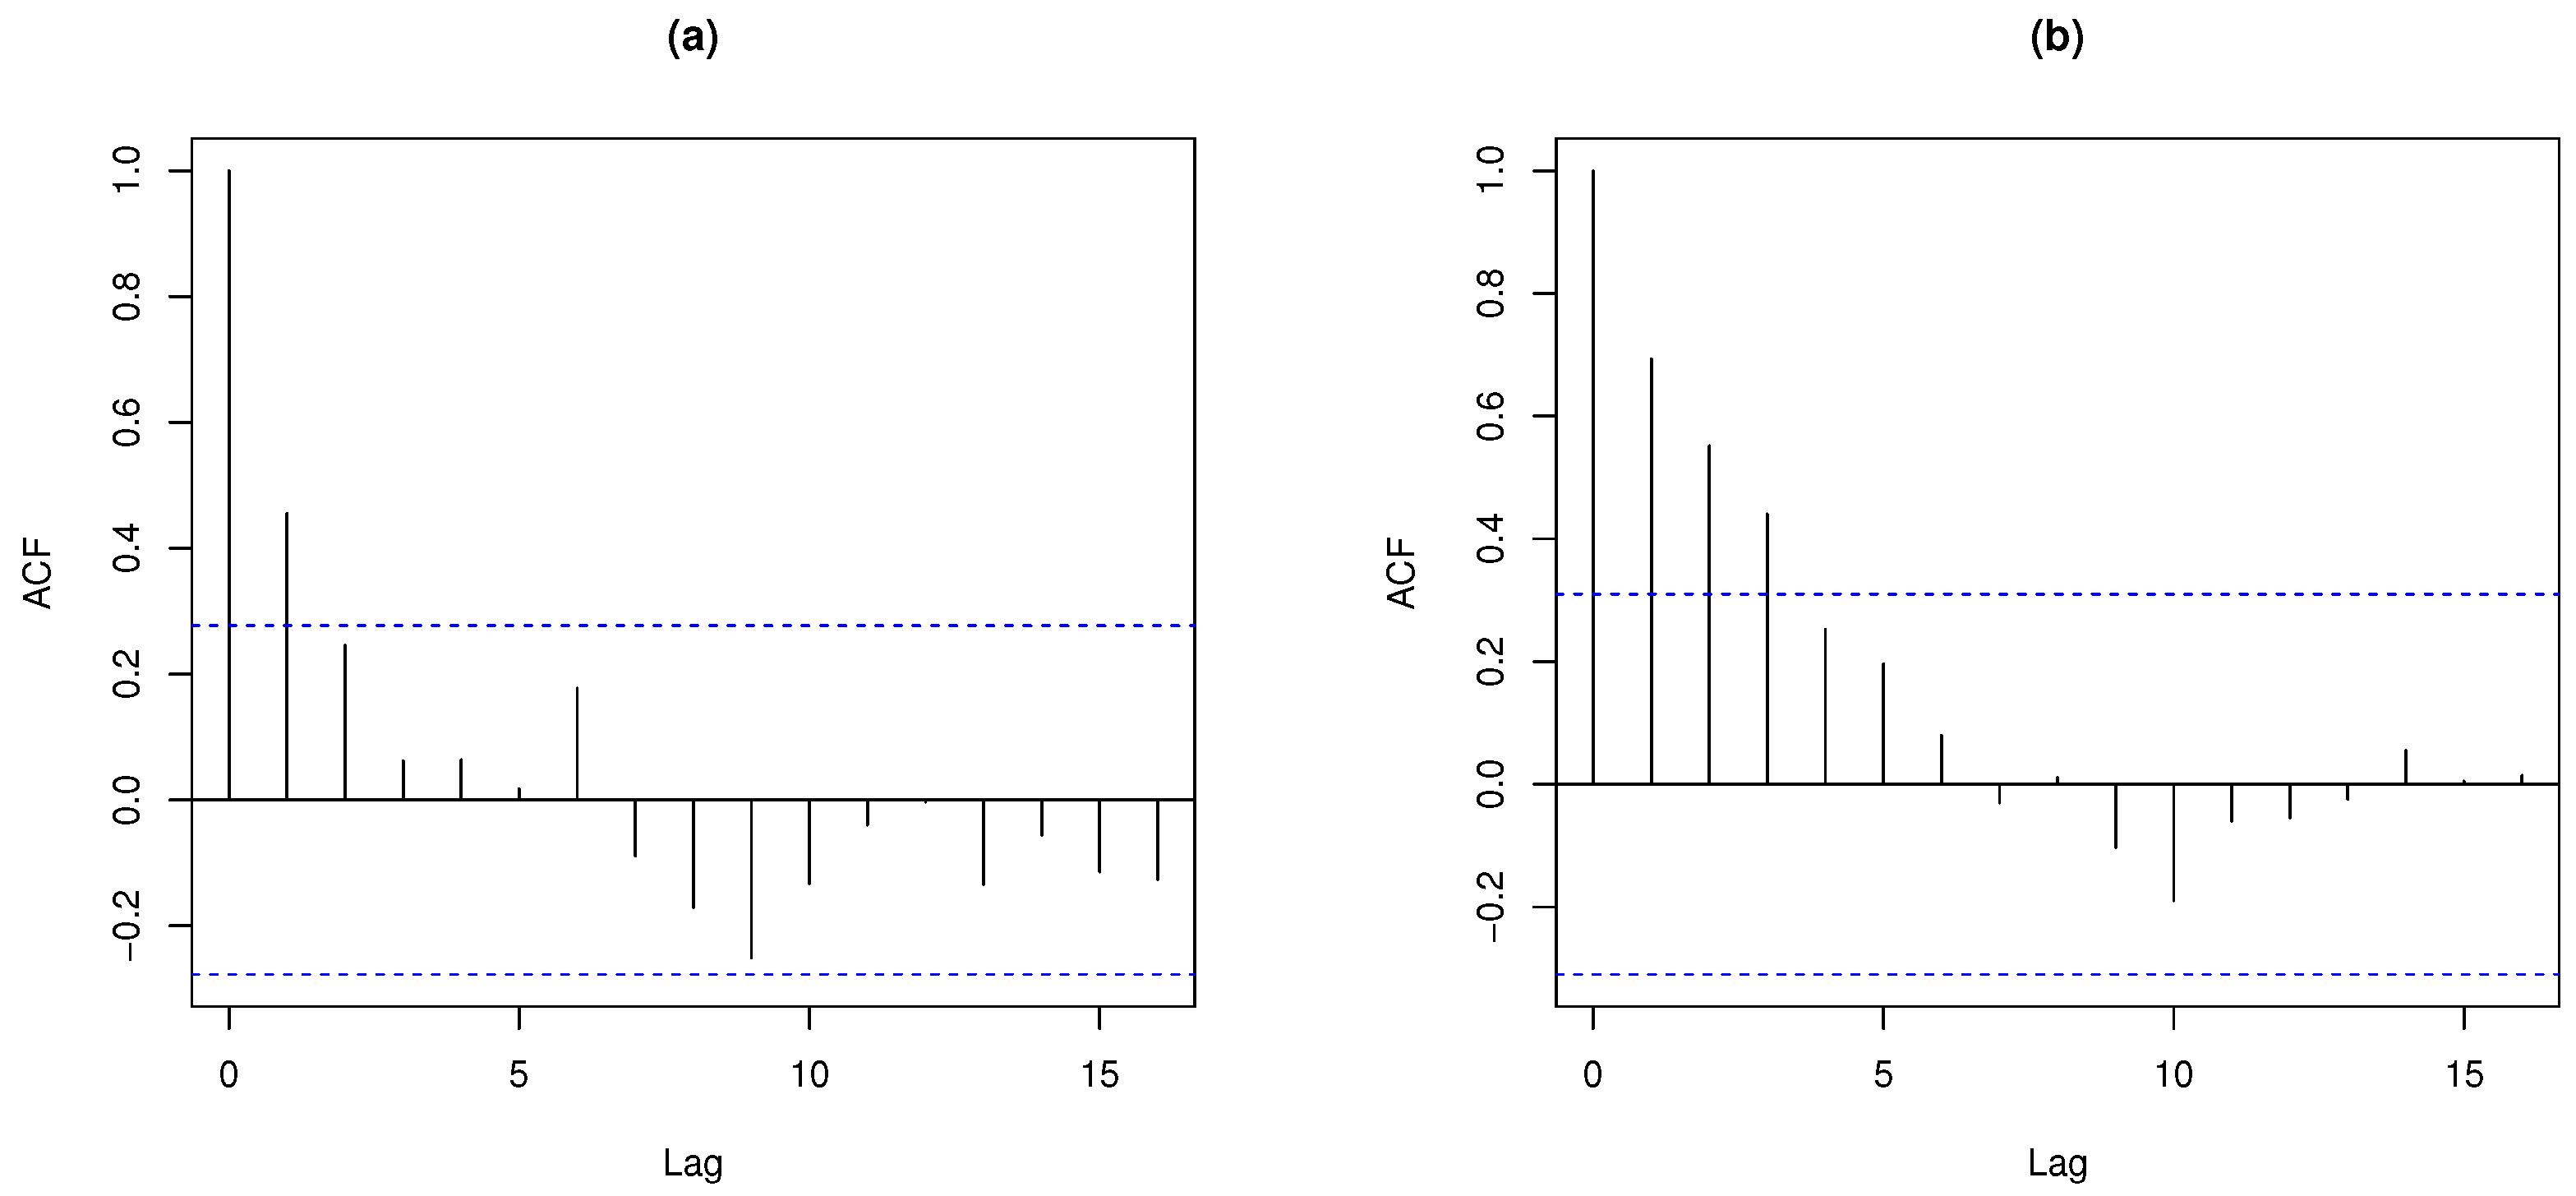
2.3. Critique of the SREM
2.4. The EWMA Chart with Probability Limits for Retrospective Analysis
- Step 1. Provided that, at a given tth monitoring instance, , if there is no out-of-control signal at moment , a large enough number M of “pseudo-EWMA” values are computed by generating random samples of size n from and using expression (3). The robust estimates and are those described in Section 2.1. Each of the values is based on a randomly chosen value from the in-control simulated marginal distribution of the EWMA statistic (3) obtained in the preceding monitoring instance . For , it is assumed that . Otherwise, is set as indicated in Step 4.
- Step 2. Estimate the upper and the lower control limits using the empirical quantiles and , respectively, of the M values of obtained in Step 1, where is the desired FAR level.
- Step 3. Find the actual current value of based on the observed data in instance t and compare it with the above estimated control limits. If , continue to the next monitoring instance. Otherwise, delete the sample corresponding to from the Phase I analysis.
- Step 4. If the decision is made to proceed with the monitoring, remove the values of from both the upper and lower tails of the in-control simulated distribution obtained at the preceding monitoring instance. Select, at random, one of the remaining values to serve as for and go to Step 1.
3. Methods
3.1. Simulation Settings
- Single-step shift. According to this pattern, the first samples of each set come from the in-control normal model, and the last five from the shifted model.
- Multiple-step shift. In this case, the five samples following some randomly generated monitoring instance come from the shifted model.
- Localized shift. In this shift pattern, all of the observations belonging to the same sample in a randomly generated monitoring instance are contaminated.
- Diffused shift. Finally, only some observations (not all of them) in a sample of a randomly generated instance are contaminated.
3.2. Performance Evaluation
4. Results and Discussion
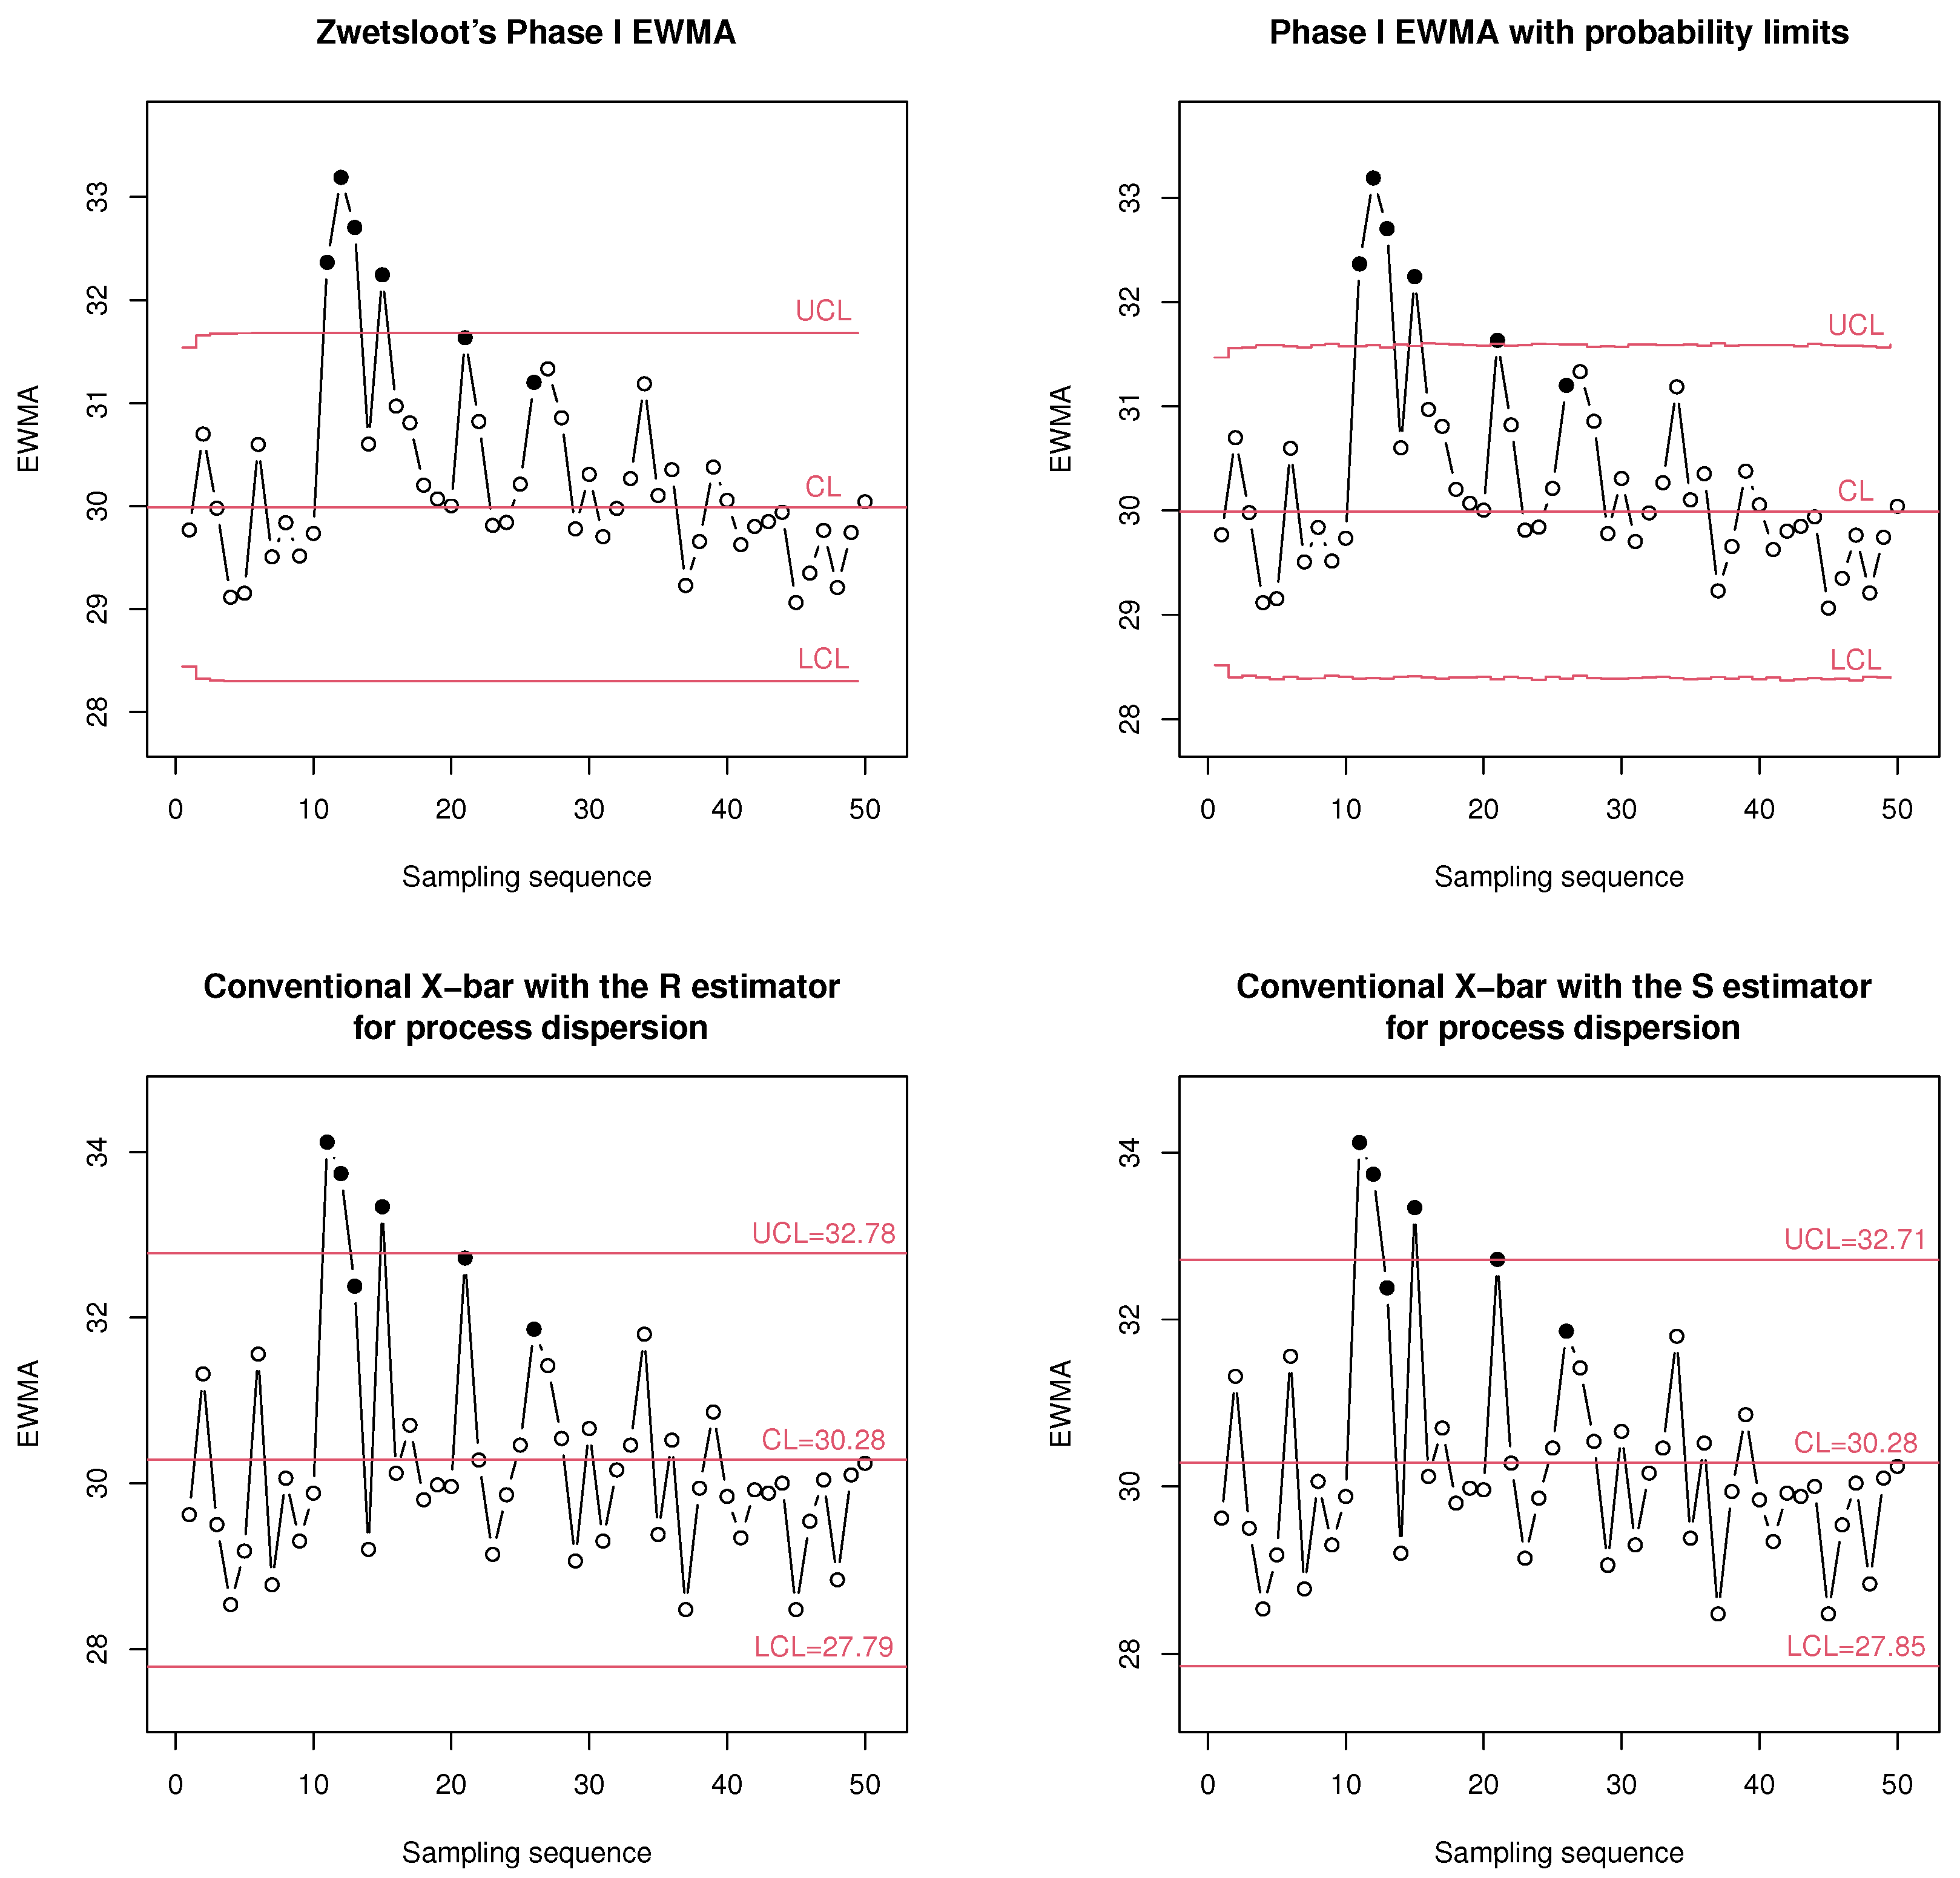
5. Simulated Example
6. Concluding Remarks and Recommendations
Author Contributions
Funding
Data Availability Statement
Acknowledgments
Conflicts of Interest
Abbreviations
| CUSUM | Cumulative sum |
| EWMA | Exponentially weighted moving average |
| FAP | False alarm percentage |
| FAPr | False alarm probability |
| FAR | False alarm rate |
| SQC | Statistical quality control |
| TAP | True alarm percentage |
References
- Jensen, W.A.; Jones-Farmer, L.A.; Champ, C.W.; Woodall, W.H. Effects of parameter estimation on control chart properties: A literature review. J. Qual. Technol. 2006, 38, 349–364. [Google Scholar] [CrossRef]
- Chakraborti, S.; Human, S.; Graham, M.A. Phase I statistical process control charts: An overview and some results. Qual. Eng. 2009, 21, 52–62. [Google Scholar] [CrossRef]
- Jones-Farmer, L.A.; Woodall, H.W.; Steiner, S.H.; Champ, C.W. An overview of Phase I analysis for process improvement and monitoring. J. Qual. Technol. 2014, 46, 265–280. [Google Scholar] [CrossRef]
- Zwetsloot, I.; Schoonhoven, S.; Does, R. A robust estimator for location in Phase I based on an EWMA chart. J. Qual. Technol. 2014, 46, 302–316. [Google Scholar] [CrossRef]
- Roberts, S.W. Control chart tests based on geometric moving averages. Technometrics 1959, 42, 239–260. [Google Scholar] [CrossRef]
- Shen, X.; Zou, C.; Jiang, W.; Tsung, F. Monitoring Poisson count data with probability control limits when sample sizes are time- varying. Nav. Res. Logist. 2013, 60, 625–636. [Google Scholar] [CrossRef]
- Montgomery, D.C. Introduction to Statistical Quality Control, 5th ed.; John Willey & Sons: New York, NY, USA, 2005. [Google Scholar]
- Hillier, F.S. and R chart control limits based on a small number of subgroups. J. Qual. Technol. 1969, 1, 17–26. [Google Scholar] [CrossRef]
- Yang, C.H.; Hillier, F.S. Mean and variance control chart limits based on a small number of subgroups. J. Qual. Technol. 1970, 2, 9–16. [Google Scholar] [CrossRef]
- King, E.P. Probability limits for the average chart when process standards are unspecified. Ind. Qual. Control 1954, 10, 62–64. [Google Scholar]
- Janacek, G.J.; Meikle, S.E. Control charts based on medians. Statistician 1997, 46, 19–31. [Google Scholar] [CrossRef]
- Tatum, L. Robust estimation of the process standard deviation for control charts. Technometrics 1997, 39, 127–141. [Google Scholar] [CrossRef]
- Schoonhoven, M.; Riaz, M.; Does, M. Design and analysis of control charts for standard deviation with estimated parameters. J. Qual. Technol. 2011, 43, 307–333. [Google Scholar] [CrossRef]
- Rocke, D.M. Robust control charts. Technometrics 1989, 31, 173–184. [Google Scholar] [CrossRef]
- Graham, M.A.; Human, S.W.; Chakraborti, S. A Phase I non-parametric Shewhart-type control chart based on the median. J. Appl. Stat. 2010, 37, 1795–1813. [Google Scholar] [CrossRef]
- Schoonhoven, M.; Nazir, H.Z.; Riaz, M.; Does, R.J.M.M. Robust location estimators for the control chart. J. Qual. Technol. 2011, 43, 363–379. [Google Scholar] [CrossRef]
- Schoonhoven, M.; Does, R.J.M.M. A robust standard deviation control chart. Technometrics 2012, 54, 73–82. [Google Scholar] [CrossRef]
- Schoonhoven, M.; Does, R.J.M.M. A robust control chart. Qual. Reliab. Eng. Int. 2013, 29, 951–970. [Google Scholar] [CrossRef]
- Nazir, H.Z.; Riaz, M.; Does, R.J.M.M.; Abbas, N. Robust CUSUM control charting. Qual. Eng. 2013, 25, 311–324. [Google Scholar] [CrossRef]
- Vargas, J.A. Robust estimation in multivariate control charts for individual observations. J. Qual. Technol. 2003, 35, 367–376. [Google Scholar] [CrossRef]
- Jensen, W.A.; Birch, J.B.; Woodall, W.H. High breakdown estimation for Phase I multivariate control charts. Qual. Reliab. Eng. Int. 2007, 23, 615–629. [Google Scholar] [CrossRef]
- Oyeyemi, G.M.; Ipinyomi, R.A. A robust method of estimating covariance matrix in multivariate data analysis. Afr. J. Math. Comput. Sci. Res. 2010, 3, 1–18. [Google Scholar]
- Yañez, S.; González, N.; Vargas, J.A. Hotelling’s T2 control charts based on robust estimators. Dyna 2010, 163, 239–247. [Google Scholar]
- Ahmadi, M.M.; Shahriari, H. Robust monitoring of simple linear profiles using M-estimators. Comput. Res. Prog. Appl. Sci. Eng. 2022, 8, 1–7. [Google Scholar] [CrossRef]
- Neto, E.D.A.L.; Rauber, C.; Borges, H.F.D.N.; Lima-Filho, L.M.A. Process monitoring using robust regression control charts. Qual. Reliab. Eng. Int. 2025. early view. [Google Scholar] [CrossRef]
- Champ, C.W.; Chou, S.P. Comparison of standard and individual limits Phase I Shewhart , R and S charts. Qual. Reliab. Eng. Int. 2003, 19, 161–170. [Google Scholar] [CrossRef]
- Champ, C.W.; Jones, L.A. Designing Phase I charts with small sample sizes. Qual. Reliab. Eng. Int. 2004, 20, 497–510. [Google Scholar] [CrossRef]
- Bataineh, A.A.M.F.; Saeed, N.; Obeidat, A.F.S.; Kamal, S.; Abu-Shawiesh, M.O.A. Robust point M-scale estimators for monitoring the mean of EWMA control chart under the normal process. Ain Shams Eng. J. 2022, 13, 101796. [Google Scholar] [CrossRef]
- Sanaullah, A.; Chaudhary, A.M.; Hanif, M.; Sharma, P. EWMA control charts based on robust estimators: A powerful tool for monitoring a process with a non-normal distribution. J. Comput. Appl. Math. 2024, 449, 115919. [Google Scholar] [CrossRef]

| Moment | Mean | SD | |||
|---|---|---|---|---|---|
| 1 | −0.24439 | −0.05764 | 0.13004 | −0.05775 | 0.27729 |
| 2 | −0.25912 | −0.05704 | 0.14350 | −0.05736 | 0.29828 |
| 3 | −0.26074 | −0.05856 | 0.14559 | −0.05728 | 0.30035 |
| 4 | −0.26113 | −0.05771 | 0.14667 | −0.05747 | 0.30091 |
| 5 | −0.26018 | −0.05694 | 0.14625 | −0.05669 | 0.29981 |
| 6 | −0.25975 | −0.05741 | 0.14547 | −0.05705 | 0.30027 |
| ⋮ | ⋮ | ⋮ | ⋮ | ⋮ | ⋮ |
| 50 | −0.26050 | −0.05731 | 0.14637 | −0.05788 | 0.30056 |
| Parameter | Probability Limits | Zwetsloot’s | |||
|---|---|---|---|---|---|
| Estimators | Phase I EWMA | Phase I EWMA | |||
| −0.01935 | 1.01798 | −0.79237 | 0.75248 | −0.79722 | 0.75852 |
| 0.05729 | 0.99620 | −0.69584 | 0.80936 | −0.70394 | 0.81852 |
| 0.01954 | 1.03771 | −0.76644 | 0.80600 | −0.77340 | 0.81248 |
| 0.03217 | 1.05359 | −0.76938 | 0.83031 | −0.77291 | 0.83725 |
| 0.02998 | 0.97172 | −0.70355 | 0.76304 | −0.71254 | 0.77250 |
| TAP | FAP | ||||||||||
|---|---|---|---|---|---|---|---|---|---|---|---|
| Approach | |||||||||||
| Localized shift pattern | |||||||||||
| Zwetsloot’s | 5 | 5.4 | 26.3 | 64.2 | 91.3 | 1.0 | 1.1 | 1.3 | 1.7 | 2.5 | |
| Phase I EWMA | 10 | 8.3 | 52.1 | 92.5 | 99.8 | 1.0 | 1.2 | 1.5 | 1.8 | 3.5 | |
| Shen’s | 5 | 6.1 | 28.1 | 64.7 | 97.4 | 1.1 | 1.2 | 1.6 | 2.1 | 7.1 | |
| Phase I EWMA | 10 | 12.4 | 60.8 | 95.6 | 99.8 | 1.1 | 1.3 | 1.7 | 2.3 | 5.0 | |
| Conventional | 5 | 5.8 | 28.7 | 66.5 | 92.3 | 1.0 | 1.0 | 1.2 | 1.5 | 2.0 | |
| 10 | 12.3 | 60.5 | 95.6 | 99.9 | 1.0 | 1.1 | 1.4 | 2.1 | 3.1 | ||
| Conventional | 5 | 5.9 | 28.2 | 66.5 | 92.2 | 1.0 | 1.1 | 1.2 | 1.5 | 1.9 | |
| 10 | 12.3 | 60.7 | 95.2 | 99.9 | 1.0 | 1.1 | 1.4 | 2.1 | 3.1 | ||
| Diffuse shift pattern | |||||||||||
| Zwetsloot’s | 5 | 1.1 | 1.2 | 1.5 | 2.0 | 1.0 | 1.0 | 1.0 | 0.8 | 0.6 | |
| Phase I EWMA | 10 | 1.0 | 1.0 | 1.1 | 1.2 | 1.0 | 1.0 | 1.0 | 1.0 | 1.0 | |
| Shen’s | 5 | 1.3 | 1.4 | 1.8 | 2.3 | 1.0 | 1.1 | 1.1 | 0.9 | 0.9 | |
| Phase I EWMA | 10 | 1.1 | 1.2 | 1.3 | 1.4 | 1.1 | 1.2 | 1.1 | 1.0 | 1.2 | |
| Conventional | 5 | 1.1 | 1.2 | 1.5 | 1.9 | 1.0 | 1.0 | 0.9 | 0.8 | 0.6 | |
| 10 | 1.0 | 1.0 | 1.0 | 1.0 | 1.0 | 1.0 | 0.9 | 0.9 | 0.8 | ||
| Conventional | 5 | 1.0 | 1.3 | 1.5 | 1.9 | 1.0 | 1.0 | 0.9 | 0.7 | 0.6 | |
| 10 | 1.0 | 1.0 | 1.0 | 1.1 | 1.0 | 1.0 | 0.9 | 0.9 | 0.8 | ||
| Single-step shift pattern | |||||||||||
| Zwetsloot’s | 5 | 11.4 | 56.1 | 88.9 | 97.7 | 1.0 | 1.1 | 1.2 | 1.2 | 1.2 | |
| Phase I EWMA | 10 | 26.7 | 85.8 | 98.8 | 99.9 | 1.0 | 1.0 | 1.2 | 1.2 | 1.2 | |
| Shen’s | 5 | 13.3 | 57.0 | 89.8 | 98.0 | 1.0 | 1.2 | 1.4 | 1.3 | 1.2 | |
| Phase I EWMA | 10 | 26.6 | 90.8 | 98.8 | 99.9 | 1.0 | 1.2 | 1.3 | 1.3 | 1.3 | |
| Conventional | 5 | 5.7 | 28.3 | 67.6 | 92.5 | 1.0 | 1.0 | 1.2 | 1.4 | 1.8 | |
| 10 | 12.5 | 60.4 | 95.7 | 99.9 | 1.0 | 1.1 | 1.3 | 1.8 | 2.6 | ||
| Conventional | 5 | 5.8 | 28.8 | 67.8 | 92.7 | 1.0 | 1.0 | 1.2 | 1.4 | 1.8 | |
| 10 | 12.3 | 60.4 | 95.5 | 99.9 | 1.0 | 1.0 | 1.3 | 1.8 | 2.6 | ||
| Multiple-step shift pattern | |||||||||||
| Zwetsloot’s | 5 | 9.8 | 50.1 | 86.1 | 91.0 | 1.0 | 1.6 | 3.8 | 5.9 | 6.9 | |
| Phase I EWMA | 10 | 23.3 | 83.1 | 98.1 | 99.9 | 1.0 | 2.3 | 5.8 | 7.4 | 8.4 | |
| Shen’s | 5 | 11.25 | 52.3 | 87.3 | 91.8 | 1.0 | 1.6 | 3.9 | 6.0 | 7.1 | |
| Phase I EWMA | 10 | 23.5 | 83.8 | 98.0 | 99.9 | 1.0 | 2.5 | 5.4 | 7.9 | 9.1 | |
| Conventional | 5 | 5.2 | 25.4 | 60.7 | 87.9 | 1.0 | 1.3 | 2.5 | 4.8 | 7.2 | |
| 10 | 10.8 | 54.8 | 91.7 | 99.4 | 1.0 | 1.6 | 4.3 | 7.7 | 11.0 | ||
| Conventional | 5 | 5.3 | 25.2 | 61.3 | 88.3 | 1.0 | 1.3 | 2.5 | 4.7 | 7.2 | |
| 10 | 11.0 | 54.8 | 91.8 | 99.4 | 1.0 | 1.6 | 4.3 | 7.7 | 10.7 | ||
Disclaimer/Publisher’s Note: The statements, opinions and data contained in all publications are solely those of the individual author(s) and contributor(s) and not of MDPI and/or the editor(s). MDPI and/or the editor(s) disclaim responsibility for any injury to people or property resulting from any ideas, methods, instructions or products referred to in the content. |
© 2025 by the authors. Licensee MDPI, Basel, Switzerland. This article is an open access article distributed under the terms and conditions of the Creative Commons Attribution (CC BY) license (https://creativecommons.org/licenses/by/4.0/).
Share and Cite
Morales, V.H.; Panza, C.A.; Herrera, R.J. Revision of the Screening Robust Estimation Method for the Retrospective Analysis of Normal Processes. Processes 2025, 13, 1381. https://doi.org/10.3390/pr13051381
Morales VH, Panza CA, Herrera RJ. Revision of the Screening Robust Estimation Method for the Retrospective Analysis of Normal Processes. Processes. 2025; 13(5):1381. https://doi.org/10.3390/pr13051381
Chicago/Turabian StyleMorales, Víctor H., Carlos A. Panza, and Roberto J. Herrera. 2025. "Revision of the Screening Robust Estimation Method for the Retrospective Analysis of Normal Processes" Processes 13, no. 5: 1381. https://doi.org/10.3390/pr13051381
APA StyleMorales, V. H., Panza, C. A., & Herrera, R. J. (2025). Revision of the Screening Robust Estimation Method for the Retrospective Analysis of Normal Processes. Processes, 13(5), 1381. https://doi.org/10.3390/pr13051381