Article

Research on Cooling and Dust Removal Technology of Circulating Airflow in Metal Mine Working Face

by
Dejun Miao
1,2,*,
Qian Feng
1,2 and
Wanbao Zeng
1,2
1
College of Safety and Environmental Engineering, Shandong University of Science and Technology, Qingdao 266590, China
2
State Key Laboratory of Intelligent Control and Green Mining of Mining and Rock Layers, Shandong University of Science and Technology, Qingdao 266590, China
*
Author to whom correspondence should be addressed.
Processes 2025, 13(5), 1374; https://doi.org/10.3390/pr13051374
Submission received: 8 April 2025 / Revised: 27 April 2025 / Accepted: 28 April 2025 / Published: 30 April 2025
(This article belongs to the Section Environmental and Green Processes)

Abstract

:
To address ventilation challenges in the working face of metal mine excavation, an equal-scale physical model was established with a mine section as the test site, combined with field-measured data and relevant parameters of spent air reuse equipment. Numerical simulations were carried out using Fluent 2020 R2 software to analyse the characteristics of the airflow field, temperature field, and dust distribution in the excavation roadway. The results show that when the cold air outlet temperature (T0) is 22 °C, the temperature within the cooling zone does not exceed 26.3 °C, thereby demonstrating effective cooling. The equipment parameters significantly impacted cooling and dust removal. When the distance from the cold air outlet to the heading face was set to Zm = 8 m, the air outlet temperature was T0 = 22 °C, and the ventilation circulation rate was F = 40%, the working area achieved better cooling and dust removal effects. On-site application showed that within 15 m of the working face, temperatures dropped by 3–3.5 °C, reaching a low of 25.1 °C. The relative humidity at a point 1 m away from the working face decreased from 90.6% to 70.2%, and the average dust removal efficiency was 44.9%, which significantly improved the comfort and safety of the working environment at the heading face.

1. Introduction

With the increasing depth of metal mining and the continuous expansion of the mining scale, traditional ventilation systems are facing unprecedented challenges. Difficulties in mine ventilation, dust control, and temperature management are gradually becoming apparent. Under difficult ventilation conditions, traditional ventilation equipment can hardly meet the demand, resulting in an unsatisfactory ventilation effect. Wind flow is difficult to distribute evenly to each working face, and the dust pollution that may occur in the mine is difficult to remove in time, which also leads to the problem of high temperature and heat damage at the operation site, which not only reduces the efficiency of mining but also affects the operation specification of the workers, thus increasing the probability of accidents [1]. Therefore, it is necessary to take cooling measures in the high-temperature areas of underground wells to ensure the normal exploitation of the operation and the safety of the operators [2].
Dust pollution and high-temperature heat damage caused by ventilation difficulties have become important factors affecting the operating environment and miners’ health in metal mines. An in-depth study of this topic not only helps to reveal the mechanism of interaction between dust pollution and high-temperature heat damage but also provides a scientific basis for the optimisation of mine ventilation systems, improvement of dust control technology, and prevention of high-temperature heat damage. At the same time, this research is of great significance in improving the safety of the operating environment of mines, reducing the incidence of occupational diseases, and promoting the construction of green mines. Existing mine ventilation system renovation usually starts with increasing the air volume, which includes two measures: replacing the existing ventilation facilities and establishing a low-resistance ventilation system [3], and the other is increasing the handling capacity of the main ventilator. The first method has the disadvantages of high cost and difficulty in upgrading the facilities, and the second method relies on the main ventilator that provides airflow from the ground, which has the disadvantages of low transmission efficiency and high energy consumption [4]. The use of both these conventional methods causes an increase in ventilation costs and makes it difficult to achieve a significant improvement in the underground environment.
Controlled circulation ventilation technology, an emerging solution for mine ventilation, aims to solve many problems in traditional ventilation methods by optimising the design of airflow in the mine and realising the recycling of airflow. If the toxic and hazardous gases generated during operation can be effectively purified, then ventilation in mine production can completely adopt circulation ventilation technology. However, some of the toxic and harmful gases produced in the process cannot be effectively purified; therefore, it is necessary to introduce fresh air to dilute these toxic and harmful gases [5]. From the perspective of reducing energy consumption, circulating air can utilise the low-temperature airflow of the return air and reduce the energy consumption used for cooling the new air, indicating that the use of circulating ventilation technology is beneficial for improving the thermal environment of high-temperature mines. Therefore, researchers around the world have conducted a lot of research on the prevention and control of thermal hazards in mines and controlled circulation ventilation.
In the 1960s, Leach and Slack proposed controlled circulation ventilation and applied it for the first time [6]. The main idea was to divert the old air from the return air shaft and re-enter the inlet air shaft. After the 1980s, controlled circulation ventilation was widely used in mines in Canada, South Africa, the USA, and the UK [7,8,9]. From small-scale localised systems to large-scale recirculation ventilation systems, cooling systems, and air velocity systems, this technology has solved many of the problems in traditional ventilation, and the results are evident [10]. Lei Yu [11] used numerical simulation software to analyse the effect of recirculation ventilation in coal mine working faces and concluded that recirculation ventilation has a larger ventilation capacity than press-in ventilation and can effectively remove gas and dust from the working face. Jiang Qingshan [12] applied controlled circulation ventilation in a lead-zinc mine so that the air volume in the circulation area increased by 26 m3/s. By calculating the power of each fan, it was found that the controlled circulation ventilation method saved 37.6% of energy compared with the traditional ventilation method. Nie Xingxin et al. [13] proposed a controlled circulation ventilation system based on airflow-integrated purification technology and applied it to a copper mine. The safety classification assessment of the recirculated air quality demonstrated that adopting controlled recirculation not only increases airflow volume but also provides cooling effects. Hu Yiming [14] calculated the main ventilation parameters and economic effects of the controlled circulating air system and concluded that the controlled circulating air could increase the effective air volume of the working face and save the ventilation cost. Pritchard C J et al. [15] investigated the application of controlled recirculation ventilation in underground mines. Their findings revealed that 19% air recirculation did not significantly alter the airflow distribution while maintaining acceptable dust concentration levels. This demonstrates that properly implemented controlled recirculation can provide valuable data for the optimisation of mine ventilation systems.
In targeting the management of high-temperature heat damage underground, scholars at home and abroad have conducted extensive research on mine cooling technology. Wang W et al. [16] established a reliable numerical simulation model through field measurements to investigate the effects of air duct outlet positions and road header heat dissipation on airflow velocity, relative humidity, and temperature in mine tunnels. Their simulation results identified the optimal configuration of the ventilation system layout. Wang J et al. [17] proposed the formation of a localised protective airflow around the miners to improve the thermal health status of the workers in the mines and determined the applicability of the scheme through experiments. Sasmito et al. [18] established a three-dimensional tunnel model to study the ventilation flow rate, the cold load, raw rock temperature, and mining machinery heat exhaust on the thermal environment of the roadway. Huang Chonghong et al. [19] to optimise the effect of heat dissipation and emission of refrigeration equipment in high-temperature roadway, numerical simulation analysis is carried out for two schemes of placing a blower in front of the equipment and at the rear, which provides a basis for the design of the roadway cooling scheme. Wang Tianyang et al. [20] calculated the heat dissipation of each heat source according to the actual profile of the mine, proposed an optimisation scheme combining distributed ventilation and a multi-stage cooling system, assessed the reasonableness of designing the scheme, and finally verified its performance and ventilation system through numerical simulation. Cong Zhang et al. [21] first used the wind tunnel test equipment on campus to determine the reasonable range of spray parameters and then arranged the spray cooling model on the working surface to simulate and analyse the cooling effect of the reasonable spray spacing, spray pressure, and other parameters, so as to determine the optimal spray cooling system. Zhang Zheng Kai et al. [22] use computational fluid dynamics to predict and analyse the change rule of wind temperature in the working face under different air inlet temperatures, according to the simulation results to determine the required cooling capacity of the working face, which lays the foundation of the next step of refrigeration cooling of the working face. Li Zijun et al. [23] used dynamic grid technology to simulate the dynamic process of tunnel excavation, verified the local thermal insulation characteristics of the movable thermal insulation layer, and provided ideas for tunnel insulation.
Beginning in the 1990s, the simulation of multiphase flow using computational fluid dynamics (CFD) has gradually become a common method for solving dust diffusion flow problems [24].Yixiong Huang et al. [25] used computational fluid dynamics to simulate the flow characteristics of air and dust contamination in a roadway and concluded that the dust emission from the operating surface was slow, and the mining dust was concentrated in the mining area and moved to the two ends of the roadway. After applying the ventilation and dust removal system, the dust removal effect of the roadway was 72.6%. Ma Donghua et al. [26] investigated dust removal efficiency in mine tunnels using CFD methodology, demonstrating that maintaining an air duct outlet-to-workface distance of 11–15 m effectively minimises dust concentration levels. Zijun Li et al. [27] established a physical model of the roadway of the excavation, used computational fluid dynamics to analyse the physical model of the roadway, and analysed the physical model of the roadway. The method of computational fluid dynamics was used to analyse the distribution of oxygen mass fraction and the effect of oxygen enhancement in the roadway when the oxygen supply pipe was 1, 3, and 5 m away from the digging surface and to determine the height and length of the optimal airflow pipe. Shen Q X [28] conducted numerical simulations on the coupled diffusion patterns of dust generated during cutting, rock-falling, and loading processes at excavation faces. The study revealed that most cutting-induced dust recirculates with the airflow on the exhaust side, while a minor portion combines with rock-falling dust and loading-generated dust to form composite diffusion, propagating backward along the tunnelling machine body. Numerous scholars have used simulation software to numerically simulate dust in different dust source locations, verify and improve various laws, and study the parts that field experiments and similar simulations cannot reproduce to combine and improve the dust movement system continuously. Owing to the low cost of numerical simulation, it provides many conditions that experiments for problems such as underground dust cannot accomplish. Although there may be limitations in the simulation results, numerical simulation helps people understand the complex motion process in the application and continuously promotes the deepening of the problem.
As seen from the above research, scholars have extensively studied artificial cooling, refrigeration, and dust removal technologies for mining faces and used various techniques to improve working conditions. However, existing technologies have certain shortcomings. After cooling the fresh airflow, the spent air remains cold but is not fully utilised, requiring a high cooling capacity and air supply, which leads to high energy consumption. Additionally, the lack of air in the heading face carries more dust, worsening the environment in the tunnel behind the face and affecting worker health and safety. There is a lack of research on the efficient utilisation of cold volume and supplementing of air volume at the heading face.
To address the issue of insufficient air volume at the heading face, locally controlled circulation ventilation technology is proposed. This method recycles spent air containing dust from the working surface. The air is then treated and returned to the head face of the tunnel. Thus, a controlled circulation of airflow is achieved in the local area. The system offers several advantages when applied to tunnelling roadways. This increases the air volume in the head face. It also reduces the need for extensive wind distribution infrastructure. After treatment, the air has lower temperature, humidity, and dust concentration. This helps improve the overall climatic conditions of the roadway.

2. Theoretical Analysis

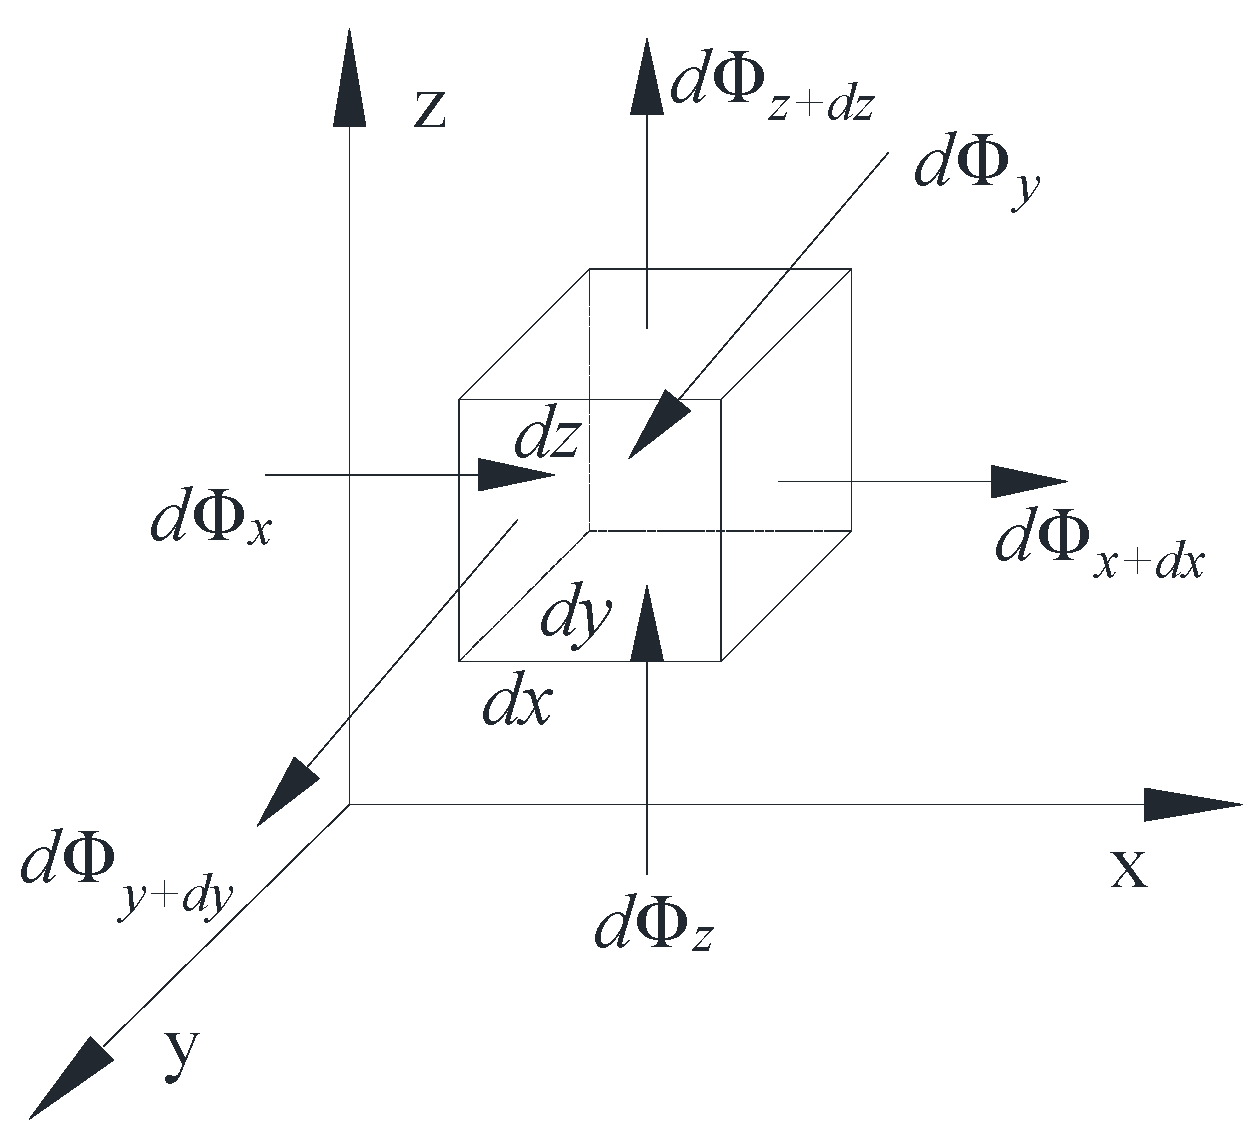
2.1. Differential Equations for Thermal Conductivity of the Surrounding Rock

Heat transfer between the surface of the surrounding rock and the wind flow is an unstable heat transfer process. The process of heat transfer from the surrounding rock to the working face can be divided into two parts: heat conduction to the surface through the deep part of the surrounding rock and convective heat exchange between the surface of the surrounding rock and wind flow [29]. According to Newton’s cooling law, the heat exchange between the surrounding rock and wind flow is calculated as
Q g u = K U L t r t l
where   Q g u is the heat transferred from the surrounding rock to the wind flow, KW; K is the non-steady state heat transfer coefficient, J / m 2 h ° C ; U is the circumference of the roadway, m; L is the length of the roadway, m;   t r is the average temperature of the surface of the surrounding rock, °C; and   t l is the average temperature of the wind flow in the roadway, °C.
A right-angle coordinate system is established inside the tunnel enclosure rock, as shown in Figure 1. A three-dimensional microelement inside the enclosing rock is selected as the object of study, and the side lengths are dx, dy, and dz. The heat flowing into the microelement along the coordinate axes x, y, and z in dt time can be denoted as d Φ x , d Φ y and d Φ z , and the heat flowing out of the microelement along the coordinate axes x, y, and z can be denoted as   d Φ x + d x ,   d Φ y + d y and   d Φ z + d z . By the law of conservation of energy, it can be seen that the net thermodynamic increment of the micromeres in dt time   d E is equal to the difference between the heat flowing into and out of the micromeres d Φ d and the sum of the heat generated inside the micromeres d Φ v .
d Φ d + d Φ v = d E
Let λ 1 , λ 2 and   λ 3 be, the coefficients of thermal conductivity of the heat conductor along the x, y, and z directions. According to Fourier’s law of heat conduction, the components of heat flux density along the three directions, q x , q y , and q z are as follows:
q x = λ 1 T x
q y = λ 2 T y
q z = λ 3 T z
The difference between the heat flowing into and out of the microelement   d Φ d is:
d Φ d = x λ 1 T x + y λ 2 T y + z λ 3 T z d x d y d z d t
Assuming that there is a uniformly distributed internal heat source inside the microelement body with a heat flow density of q v , the amount of heat it emits in   d t time is:
d Φ v = q v d x d y d z d t
The thermodynamic increment of the micro metabolite dt time   d E is:
d E = ρ c T t d x d y d z d t
The organising simplification leads to the following:
ρ c T t = x λ 1 T x + y λ 2 T y + z λ 3 T z + q v

2.2. Circulation Ventilation Wind Pressure Formula

For the heading face, the total air volume Q consists of two parts, i.e., the fresh air volume Q l and the circulating air volume Q r , in which the circulating air volume is processed by the cooling module. The principle of controllable circulating ventilation is shown in Figure 2, which increases the airflow at the working face through controllable local circulating ventilation, thus reducing energy consumption and improving the utilisation rate of cooling.
In theory, an indicator of the degree of wind circulation is the circulation rate F , which can be defined as the ratio of Q r to Q [30]:
F = Q r Q
The system airflow relationship equation can be expressed as:
Q = Q l + Q r
Assuming that the total wind resistance of the wind path outside the circulating area, the wind resistance of the circulating wind path, and the wind resistance of the wind path used for air are R o , R r and R , respectively, when the circulating wind is formed, according to the law of wind pressure equilibrium, the local fan working wind pressure h f can be written as:
h f = R Q 2 + R r Q r 2
then
h f = R + F 2 R r ( 1 F ) 2 Q l 2
It can be seen that the circulating air is formed in the system under the conditions   Q r > 0 , then   h f > R Q l 2 .
The air pressure h F of the main ventilator is:
h F = R o Q l 2 R r Q r 2
The air pressure of the main ventilator   h F is when using conventional ventilation for the same air volume:
h F = R o + R ( 1 F ) 2 Q l 2
The air pressure increment of the main ventilator before and after the use of circulation ventilation is:
Δ h F = h F h F = F F 2 R o F 2 R r R ( 1 F ) 2 Q l 2
Since the circulation rate is more significant than zero and less than 1, the air pressure increment of the main ventilator is always negative, i.e., the ventilation pressure of the main ventilator can be reduced by using circulation ventilation.

2.3. Temperature Calculation Formula Under Circulating Ventilation

Assuming that the air temperature of the fresh air flow is t l , the temperature of the tunnel surrounding rock is t r , the return air temperature under the conventional ventilation condition is t , the heat transfer coefficient of the tunnel surrounding rock is K , the perimeter of the tunnel is U , the length of the tunnel is L , the latent heat of vaporisation of the water vapour is γ , the density of the wet air is ρ l , the heat capacity of the damp air is c l , the heat dissipation by the local ventilator is Q 1 , and the heat dissipation by the cooling modules is Q 2 , The air temperature after being processed by the cooling module during the i-th use of the circulating air is t i , and the air temperature at the working face during the i-th use of the circulating air is t i .
When conventional ventilation is utilised, the operating point temperature can be written as:
t = t l + K U L t r t l c l ρ l Q l
When the circulating air is utilised for the i-th time, the operating point temperature can be written as:
t i = Q 1 + Q 2 + K U L t r t i + c l ρ l Q 1 F t l + F t i 1 γ Q Δ ρ w , i c l ρ l Q
t i = Q 1 + Q 2 + c l ρ l Q 1 F t l + F t i 1 γ Q Δ ρ w , i c l ρ l Q
If cyclic ventilation is used continuously at the work face, the number of cycles n is infinite such that A = 1 K U L c l ρ l Q , the air temperature at the workplace can be rewritten as:
t n = 1 1 F A 1 F A t l + 1 A t r + Q 1 + Q 2 c l ρ l Q A 1 F A γ ρ w , r ρ w , l c l ρ l
Therefore, if the heading face is ventilated by press-in controlled circulation, there exists a certain limit to the temperature at the operating point, which is influenced by the circulation rate, temperature of the tunnel surrounding rock and its thermophysical parameters, temperature of the fresh air flow, heat dissipated by the equipment, and humidity increment in the airflow caused by the refrigeration module.

2.4. Calculation of Air Supply in the Tunnelling Passage

Calculate the required airflow according to the number of people working at the same time at the working face
Fresh air volume Q d is calculated according to the number of people working at the same time in the working face, and the supply of fresh air volume shall not be less than 4 m3/min-people [31].
Q d = 4 × N
where N is the maximum number of people working simultaneously in the working face, according to the number of people in two shifts handover, take the maximum number of people working simultaneously in the heading face as 10 people. Calculation shows that Q d = 40 m3/min.
Calculate the required air volume according to the dust exhaust air velocity
Q d = S 0.772 + 4.1 n
where S is the section area of the digging tunnel, 19.36 m2; n is the jet restriction coefficient, take 0.004. Calculation shows that Q d = 24.6 m3/min.
Calculation of the air volume required for the working face according to the amount of explosives
Blasting heading face, in addition to considering the explosive consumption, also considers the relationship between the ventilation time and the process of dilution flow of gun smoke.
Q d = 7.8 t × A S L d 2 3
where t is the ventilation time, min; A is the explosive consumption of one blast k g ; L d is the distance from the working face to the gun smoke diluted to a safe concentration. Calculation shows that Q d = 211.3 m3/min.
After the above calculation, Q d = 211.3 m3/min is taken as the required airflow of the working face.
Calibration by wind speed
Q min = 9 × S
Q max = 240 × S
Substituting the data, Q m i n = 174.2 m3/min, Q m a x = 4646.4 m3/min. the air volume of the heading face should satisfy Q m i n < Q d < Q m a x ; therefore, the air volume of the heading face should be greater than 211.3 m3/min.

2.5. Theoretical Analysis of Spent Air Reuse Equipment Parameters

The spent air reuse equipment can solve the problem of insufficient air volume in the heading face and realise the reuse of the spent air cooling volume, and its structural principle is shown in Figure 3. The front side of the equipment is facing the working face, with the first air inlet and a cold air outlet, and the back side is equipped with the second air inlet and a hot air outlet. After starting the spent air reuse processing equipment for the working face, the spent air flowing back from the working face enters the first air inlet and the second air inlet.
The spent airflow entering the first air inlet flows into the solution regeneration box, where it comes into contact with the hot dilute solution on the regeneration wet curtain. This process allows the airflow to carry away the water vapour evaporated from the hot dilute solution. The dust in the spent airflow is adsorbed onto the regeneration wet curtain and washed down to the dust collection tray by the solution. Finally, the spent airflow is discharged through the hot air outlet.
The spent airflow from the second inlet enters the spent air treatment box and comes into contact with the low-temperature concentrated solution on the spent air treatment wet curtain. The water vapour in the spent airflow is transferred to the solution, while the dust in the spent airflow is adsorbed onto the spent air treatment wet curtain and washed down to the dust collection tray by the solution. Finally, the spent airflow is transported to the heading face through the cold air outlet.
The compressors, condensers, expansion valves, and evaporators are integrated into the refrigeration and heat transfer module of the equipment, enabling the cold and hot exchange of the solution. This equipment allows the absorption of spent air from the heading face to form a circulating airflow. At the same time, before the spent air is conveyed back to the heading face, the water vapour and dust in the spent airflow are removed and cooled, ensuring that dry, cold, and clean air is delivered to the heading face.
The equipment also facilitates the reuse of spent air-cooling capacity from the heading face. This reduces the burden on the existing refrigeration system in the windpipe of the digging tunnel. Even when the existing refrigeration equipment is used, it operates with lower energy consumption, and the local fan supporting the windpipe also works more efficiently, contributing to an overall reduction in the energy consumption of the ventilation and refrigeration system.
To evaluate the performance of the spent air reuse equipment in the heading face, a single headway is selected as a test lane. The spent air reuse equipment is positioned close to the heading face, as shown in Figure 4.
In this diagram, L represents the length of the tunnel, D represents the width of the tunnel, D a represents the length of the cooling area, Z m is the distance from the cold air outlet to the wall surface of the heading face, and T 0 is the air temperature at the cold air outlet.
The cold air discharged from the cooling air duct of the equipment has a long effective range, providing good ventilation. It effectively expels polluted air from the working face and dissipates heat. The air outlet position directly affects the cooling performance of the working face. Therefore, it is necessary to determine the cold air outlet position of the spent air reuse equipment to ensure that the cooling system achieves the desired cooling effect.
The spent air reuse equipment can also absorb the return airflow from the working face, remove dust and other harmful substances, and improve the overall air quality in the tunnel. At the same time, the returning airflow from the working face remains at a low temperature, reducing the cooling energy required to lower the air temperature from ambient conditions. The exhaust airflow collected from the tunnel is further cooled by the equipment before being sent back to the working face, forming a localised controllable circulation airflow, thereby improving the efficiency of the cooling energy utilisation.

3. Modelling

3.1. Numerical Simulation of Control Equations

3.1.1. Continuity and N-S Equations

This study investigates the airflow and fluid-solid heat transfer in tunnels. The Eulerian method is used to establish a mathematical model for airflow migration [32]. The airflow in the tunnel follows the mass conservation equation and the Navier-Stokes momentum equation:
ρ t + ρ U = 0
where ρ is the fluid density, kg / m 3 ; t is the time, s ; U is the viscosity vector of the fluid, Pa s .
Taking the air inlet of the tunnel as the coordinate origin, the tunnel width direction as the X-axis, the tunnel height direction as the Y-axis, and the advancing direction as the Z-axis, the component form of the Navier-Stokes equations in rectangular coordinates is shown as follows:
ρ u t + u u x + v u y + w u z = ρ f x p x + μ 2 u x 2 + 2 u y 2 + 2 u z 2 ρ v t + u v x + v v y + w v z = ρ f y p y + μ 2 v x 2 + 2 v y 2 + 2 v z 2 ρ w t + u w x + v w y + w w z = ρ f z p z + μ 2 w x 2 + 2 w y 2 + 2 w z 2
where ρ is the fluid density, k g / m 3 ; V is the velocity, m / s ; u , v , w is the velocity component of the fluid at the point x , y , z at the moment t ; P is the pressure, Pa ; f is the external force per unit volume of fluid; and μ is the dynamic viscosity, Pa s .

3.1.2. Heat Transfer Equation

The flow heat transfer to the heading surface is divided into heat transfer between the wind flow, heat conduction from the deep part of the rock to the surface, and convective heat transfer between the wind flow and the rock [33], and its heat transfer equations are shown below:
ρ C p T s t + ρ C p u T g = α p ( p A t + u p A ) ( q ) + τ : S + ( K g Δ T g ) + Q
ρ C p T s t + ρ C p u T s = ( K s Δ T s ) + ( q ) + Q
q c = h k ( T g T s ) + h c ( T g T s )
where C p is the specific heat capacity; J / ( k g ° C ) ; T s is the solid temperature, ° C ; K s is the solid thermal conductivity, W / ( m ° C ) ; Q is the heat source, W / m 3 ; α p is the thermal expansion coefficient, 1 / ° C ; T g is the air temperature, ° C ; p A is the relative pressure, P a ; τ is the viscous stress tensor, P a ; S is the strain rate tensor, 1 / s ; K g is the gas thermal conductivity, W / ( m ° C ) ; q c is the heat fluxes from conduction and convection, W / m 2 ; h k and h c are thermal conductivity and convective heat transfer coefficient respectively, W / ( m ° C ) .
Where the convective heat transfer coefficient at the surface can be calculated as
h c = N u K g L
h c = N u K g L
P r = μ C p K g
G r = g L 3 v 2 T s T g 1
then
h c = C g n L 3 n 1 v 2 n T s T g 1 n μ n C p n K g n 1
where N u , R a , G r , P r is the Nusselt, Rayleigh, Glashoff, and Planter numbers, respectively; L is the length of the convective heat transfer section m ; C and n are the dimensionless coefficients and exponents, respectively; g is the gravitational acceleration m 2 / s ; v is the kinematic viscosity m 2 / s ; T s is the surface temperature of the solid, ° C ; and T g is the temperature of the air, ° C .

3.1.3. DPM Model

In general, the dust content within the tunnel is less than 10%, indicating that the effect of dust particles on airflow and the interactions between dust particles can be considered negligible. In numerical simulations of dust dispersion, the discrete phase model (DPM) in the Fluent 2020 R2 software is typically employed. The force balance equation for the dust particles is as follows:
d u p d t = F d u u p + ρ p ρ ρ p g + F X
F d = 18 μ ρ p d p 2 C d Re p 24
Re p = ρ d p u p u μ
where u is the fluid velocity, m / s ; u p is the dust particle velocity, m / s ; μ is the dynamic viscosity, P a s ; ρ is the airflow density, k g / m 3 ; ρ p is the dust particle density, k g / m 3 ; F X is the additional force, N ; d p is the dust particle diameter, m ; Re p is the particle Reynolds number; and C d is the drag coefficient.
For spherical particles, the drag coefficient C d is expressed as:
C d = a 1 + a 2 Re p + a 3 Re p 2
where a 1 , a 2 , and a 3 are constants that depend on the particle Reynolds number Re p .

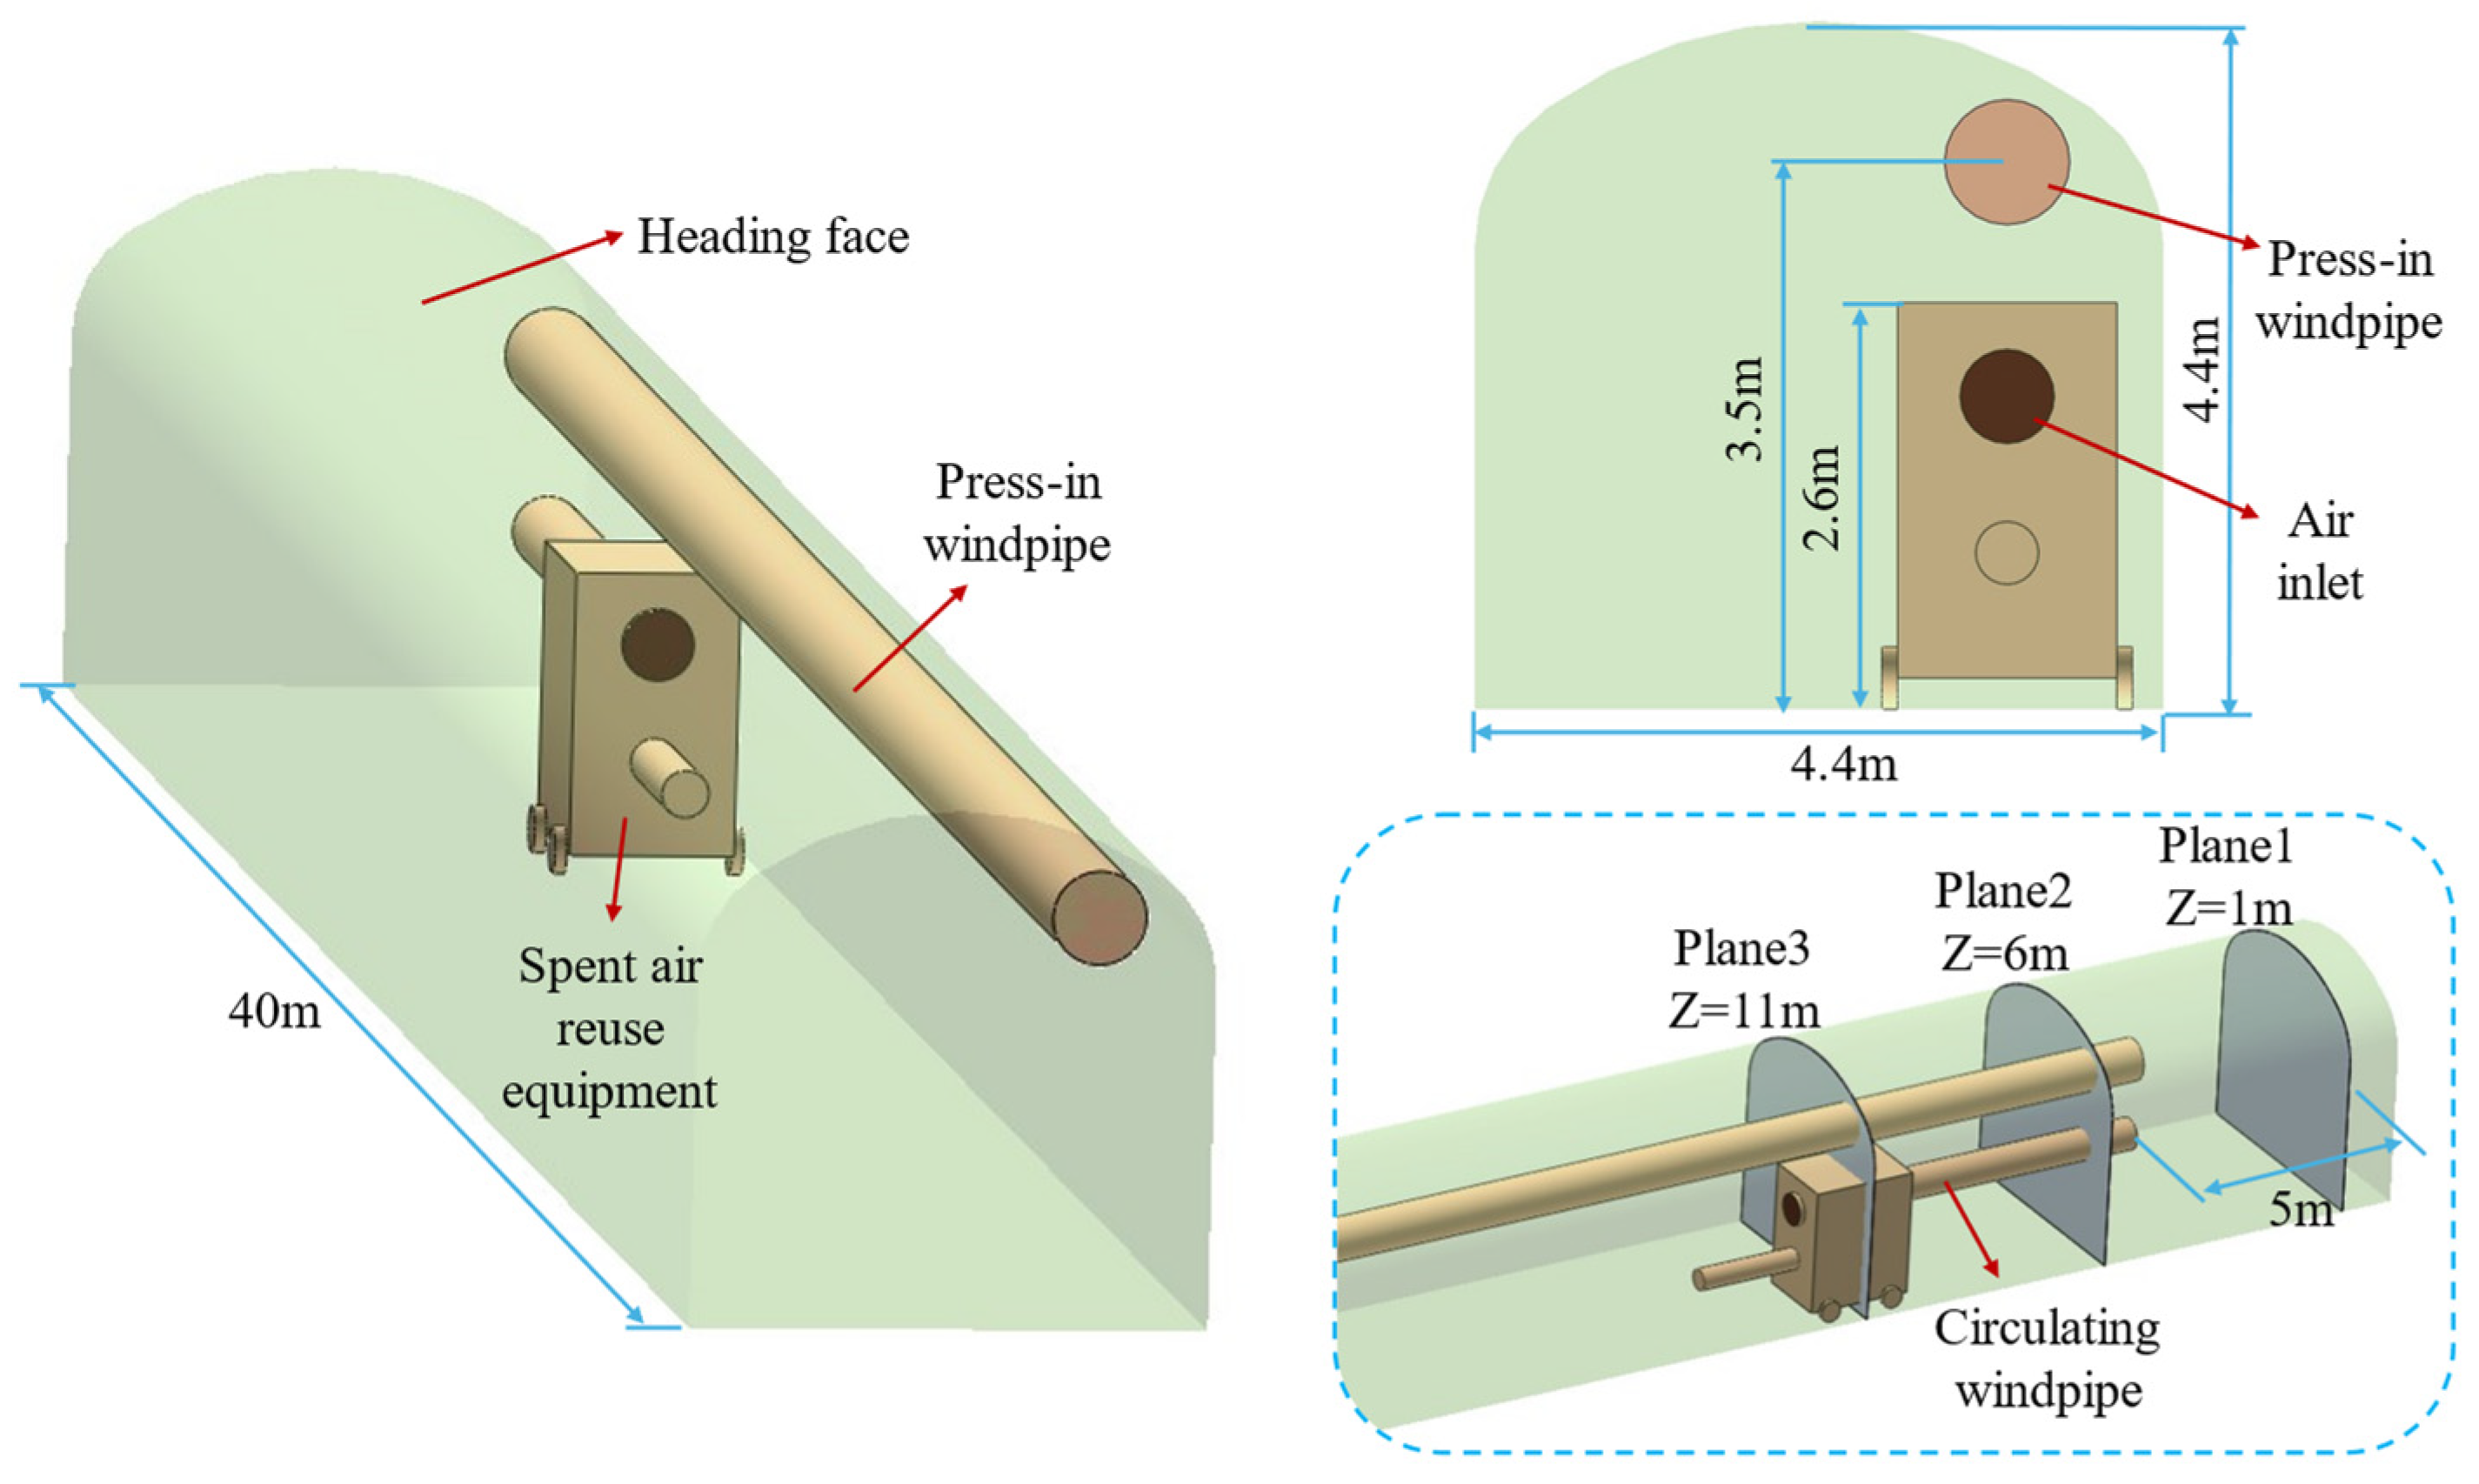
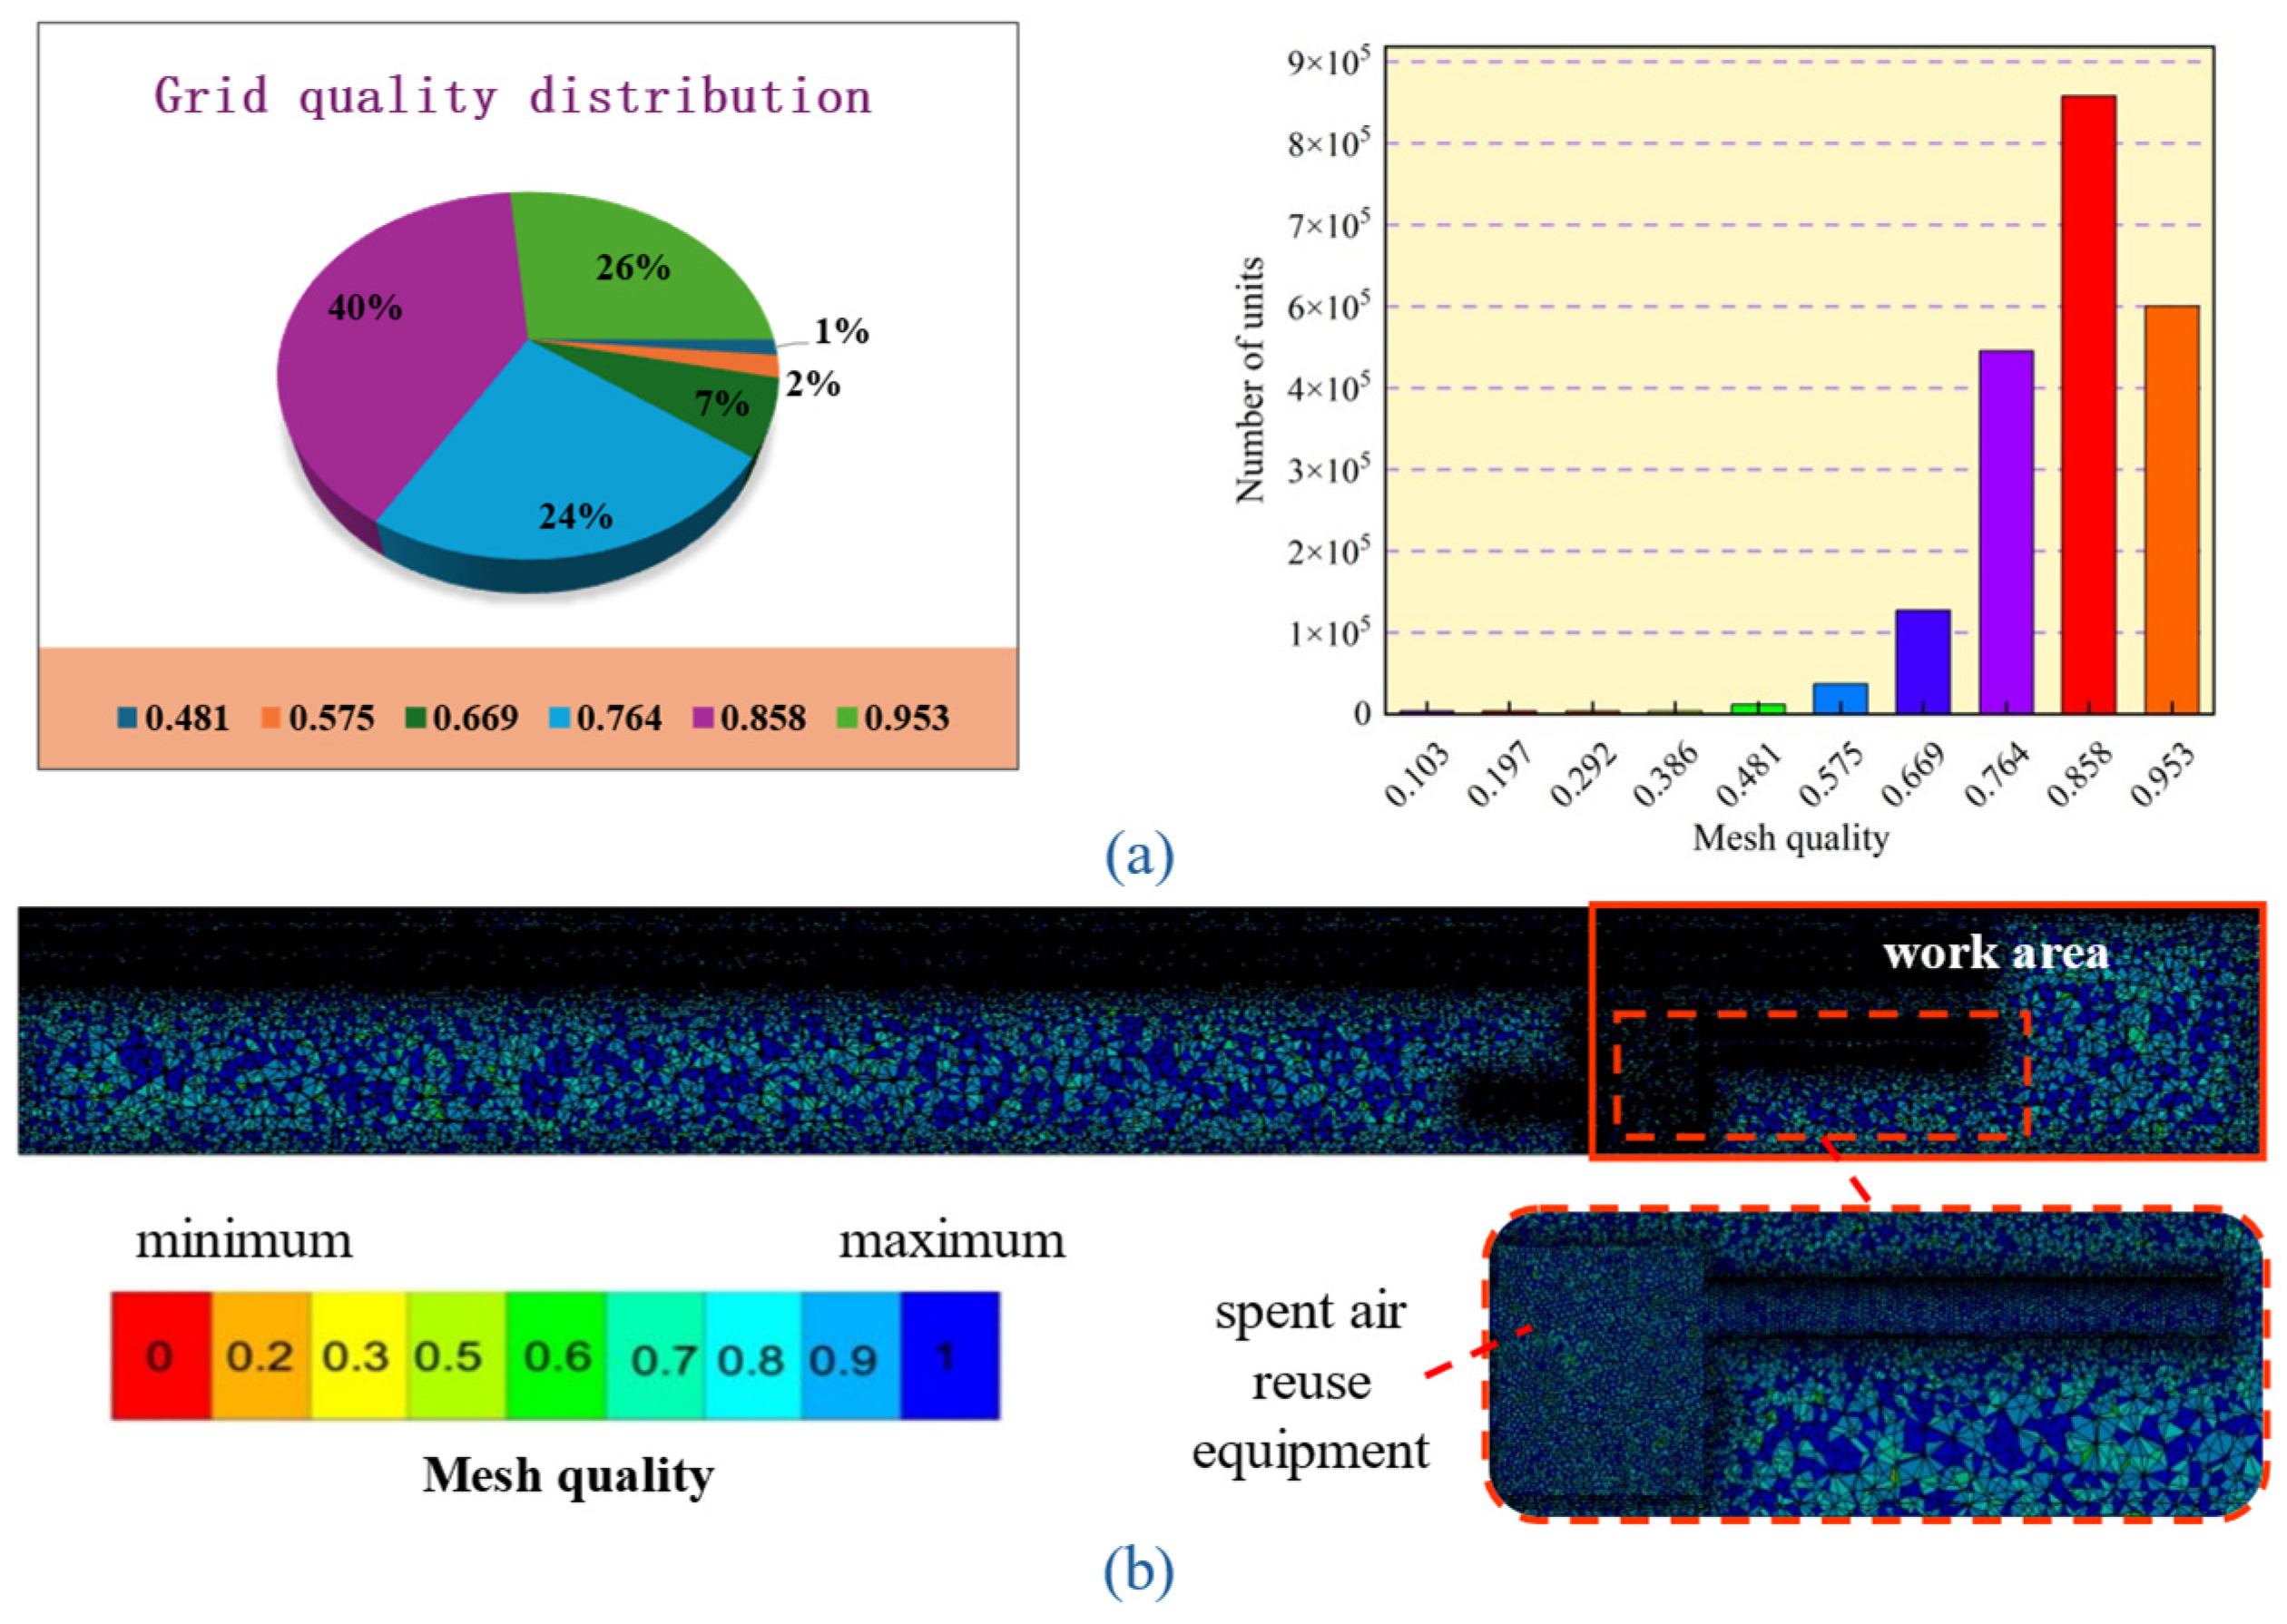
3.2. Modelling and Meshing

A physical model of the original size was established in combination with the production situation of the heading face of a non-coal mine. The model intercepts the 40-m roadway in front of the face for study, which is a rectangular roadway with a width of 4.4 m and a height of 4.4 m, which mainly includes a press-in windpipe and a spent air reuse equipment, with the diameter of the press-in windpipe of 0.8 m and the distance from the outlet of the press-in windpipe to the face of the workplace of 5 m, and there is a circulating windpipe on the spent air reuse equipment, which sends the processed low-temperature wind flow back to the work face through the circulating windpipe, with the diameter of the circulating windpipe of 0.6 m. In order to evaluate the cooling effect, three measurement points, No. 1, No. 2, and No. 3, are set at the positions of 1 m, 6 m, and 11 m, respectively, from the heading face, and the measurement points are located in the centre of the roadway section, where the model is established as shown in Figure 5.
The physical model of the heading face was input into the CFD-Mesh for meshing, and the mesh density and number of meshes were controlled by adjusting the size of the mesh. After comparing the quality of the meshes under different mesh quantities, the final meshing results of the model of the heading face are shown in Figure 6.
As shown in Figure 6, the model was established with 2.08 × 10⁶ meshes, of which 99.2% had a mesh mass greater than 0.5, the maximum mesh mass was 0.953, the minimum mesh mass was 0.103, and the average mesh mass was 0.843. An average mesh mass greater than 0.8 indicates that the mesh is of good quality [34], which can be selected for subsequent numerical calculations.

3.3. Verification of Temperature Simulation Results of Heading Face

To verify the reliability of the model, it is necessary to compare the simulation results of the roadway temperature with the measured data; therefore, the model is meshed and imported into Fluent 2020 R2, and the boundary conditions are set according to the actual situation of the heading face, and the inlet boundary of the pressure-entry ventilation is set as the velocity inlet. The exit boundary of the roadway is the pressure exit. The main heat sources of the roadway are the rock wall and the boring face, and the solution method and boundary condition parameters are listed in Table 1. Dust movement on roadways belongs to gas-solid two-phase flow, and the discrete phase model (DPM) is used to describe the flow of dust in airflow [35]. The unit step length of the simulation is set to be 5 s, and the maximum number of iterations is 20. A total of 30 steps, i.e., 150 s, are computed.
The simulation results were imported into CFD-Post for post-processing, and the temperature and dust concentration data at three measurement points were exported. These data were compared with the measured values, showing that the simulated temperatures at the measurement points 1, 6, and 11 m were 28.57, 28.66, and 29.0 °C, respectively, while the dust concentrations were 0.0419 g/m3, 0.0701 g/m3, and 0.1257 g/m3, respectively. A comparison of the simulated and measured values at the measurement points is presented in Figure 7. The results indicate that the simulated and measured temperatures are close to each other, with the errors at the measurement points being 0.8–2.3%, 0.8–2.6%, and 0.7–1.0%, respectively, all of which are less than 2.6% and fall within a reasonable range. At the same time, the error between the simulated and measured dust concentrations is within 15%. Therefore, it can be concluded that the three-dimensional model constructed in this study is realistic and effective, and the simulation results are applicable in the field.

4. Results and Discussion

4.1. Analysis of the Simulation Results of the Tunnel Wind Flow Field

The flow field distribution of the wind flow at the working face of the roadway is simulated without considering the wind flow in the windpipe for the time being. Ventilation simulation is carried out with the working face using local controllable circulation ventilation, and the velocity distribution of the roadway section at different locations from the working face in the roadway is analysed, and the velocity distribution cloud diagrams of the roadway section at different distances Z from the working face of the roadway are taken for comparison, as shown in Figure 8.
From Figure 8, it can be seen that the airflow at the heading face increases significantly after the use of the equipment, and the airflow near the equipment is sucked in by the suction port; therefore, the wind speed in the area near the equipment is lower, which can effectively reduce the spread of dust. With an increase in distance to the heading face (from Z = 1 m to Z = 11 m), the high-velocity area at the top and both sides of the wind flow is first enlarged and then slightly narrowed, and the distribution of the wind flow gradually becomes uniform from the divergent state. When 1 m from the heading face of the roadway, the wind flow at this distance is mainly concentrated at the top and both sides, forming an obvious high-speed wind flow area against the roadway wall, and the wind speed in the middle area is lower. When the distance from the end face of the roadway is more than 3 m, the wind flow returning from the end face is mainly concentrated in the return side of the roadway, and with the increase of distance to the end face of the roadway, the wind flow speed is gradually distributed uniformly, and the organisation of airflow is relatively stable.

4.2. Analysis of the Change Rule of Dust in the Alley and the Effect of Dust Removal

In order to explore the dust diffusion law of the working face of the excavation, the head of the excavation roadway is set as the dust surface. Dust is given a 60 s release time based on the wind flow field to further simulate the change rule of the dust particles in the time and space dimensions and to analyse the effect of the equipment on the dust of the working face. The simulation results are shown in Figure 9.
As shown in Figure 9a, the dust generated by the heading face enters the tunnel. At 60 s, dust accumulates significantly between the heading face and the equipment. Under the absorption effect of the equipment, the dust concentration is significantly reduced after passing through the equipment’s absorption zone. From 90 to 120 s, the dust concentration in the work area begins to decrease, and a circulating airflow is formed between the heading and the equipment. After the equipment absorbs and purifies a portion of the dust-laden airflow, it returns clean air to the work area, accelerating the reduction of dust concentration. At 150 s, dust further settles under the influence of gravity, while the equipment absorbs a large amount of dust, and the dust concentration in the work area is less than 10 mg/m3.
Figure 9b shows the airflow traces in the roadway. The airflow from the pressurised windpipe and the equipment’s cold air windpipe flows through the jet zone to reach the heading face. The airflow is influenced by the tunnel wall, flowing back along the wall to form a U-shaped airflow pattern. The dust generated at the working face is carried by the airflow and is returned to the airflow absorption area.
To study the dust removal effect of the equipment, Figure 9c shows the dust concentration distribution at a height of 1.5 m before and after the equipment is activated for 60 s. It can be seen that without the activation of the wind flow purification equipment, the dust at the working face is mainly distributed on the pedestrian side of the roadway due to the return airflow, and the distribution range is relatively wide. However, after activating the equipment, the change in the roadway airflow field significantly reduces the dust distribution on the pedestrian side, as the purification equipment absorbs the dust. As a result, the dust concentration on the return air side of the roadway is notably reduced.

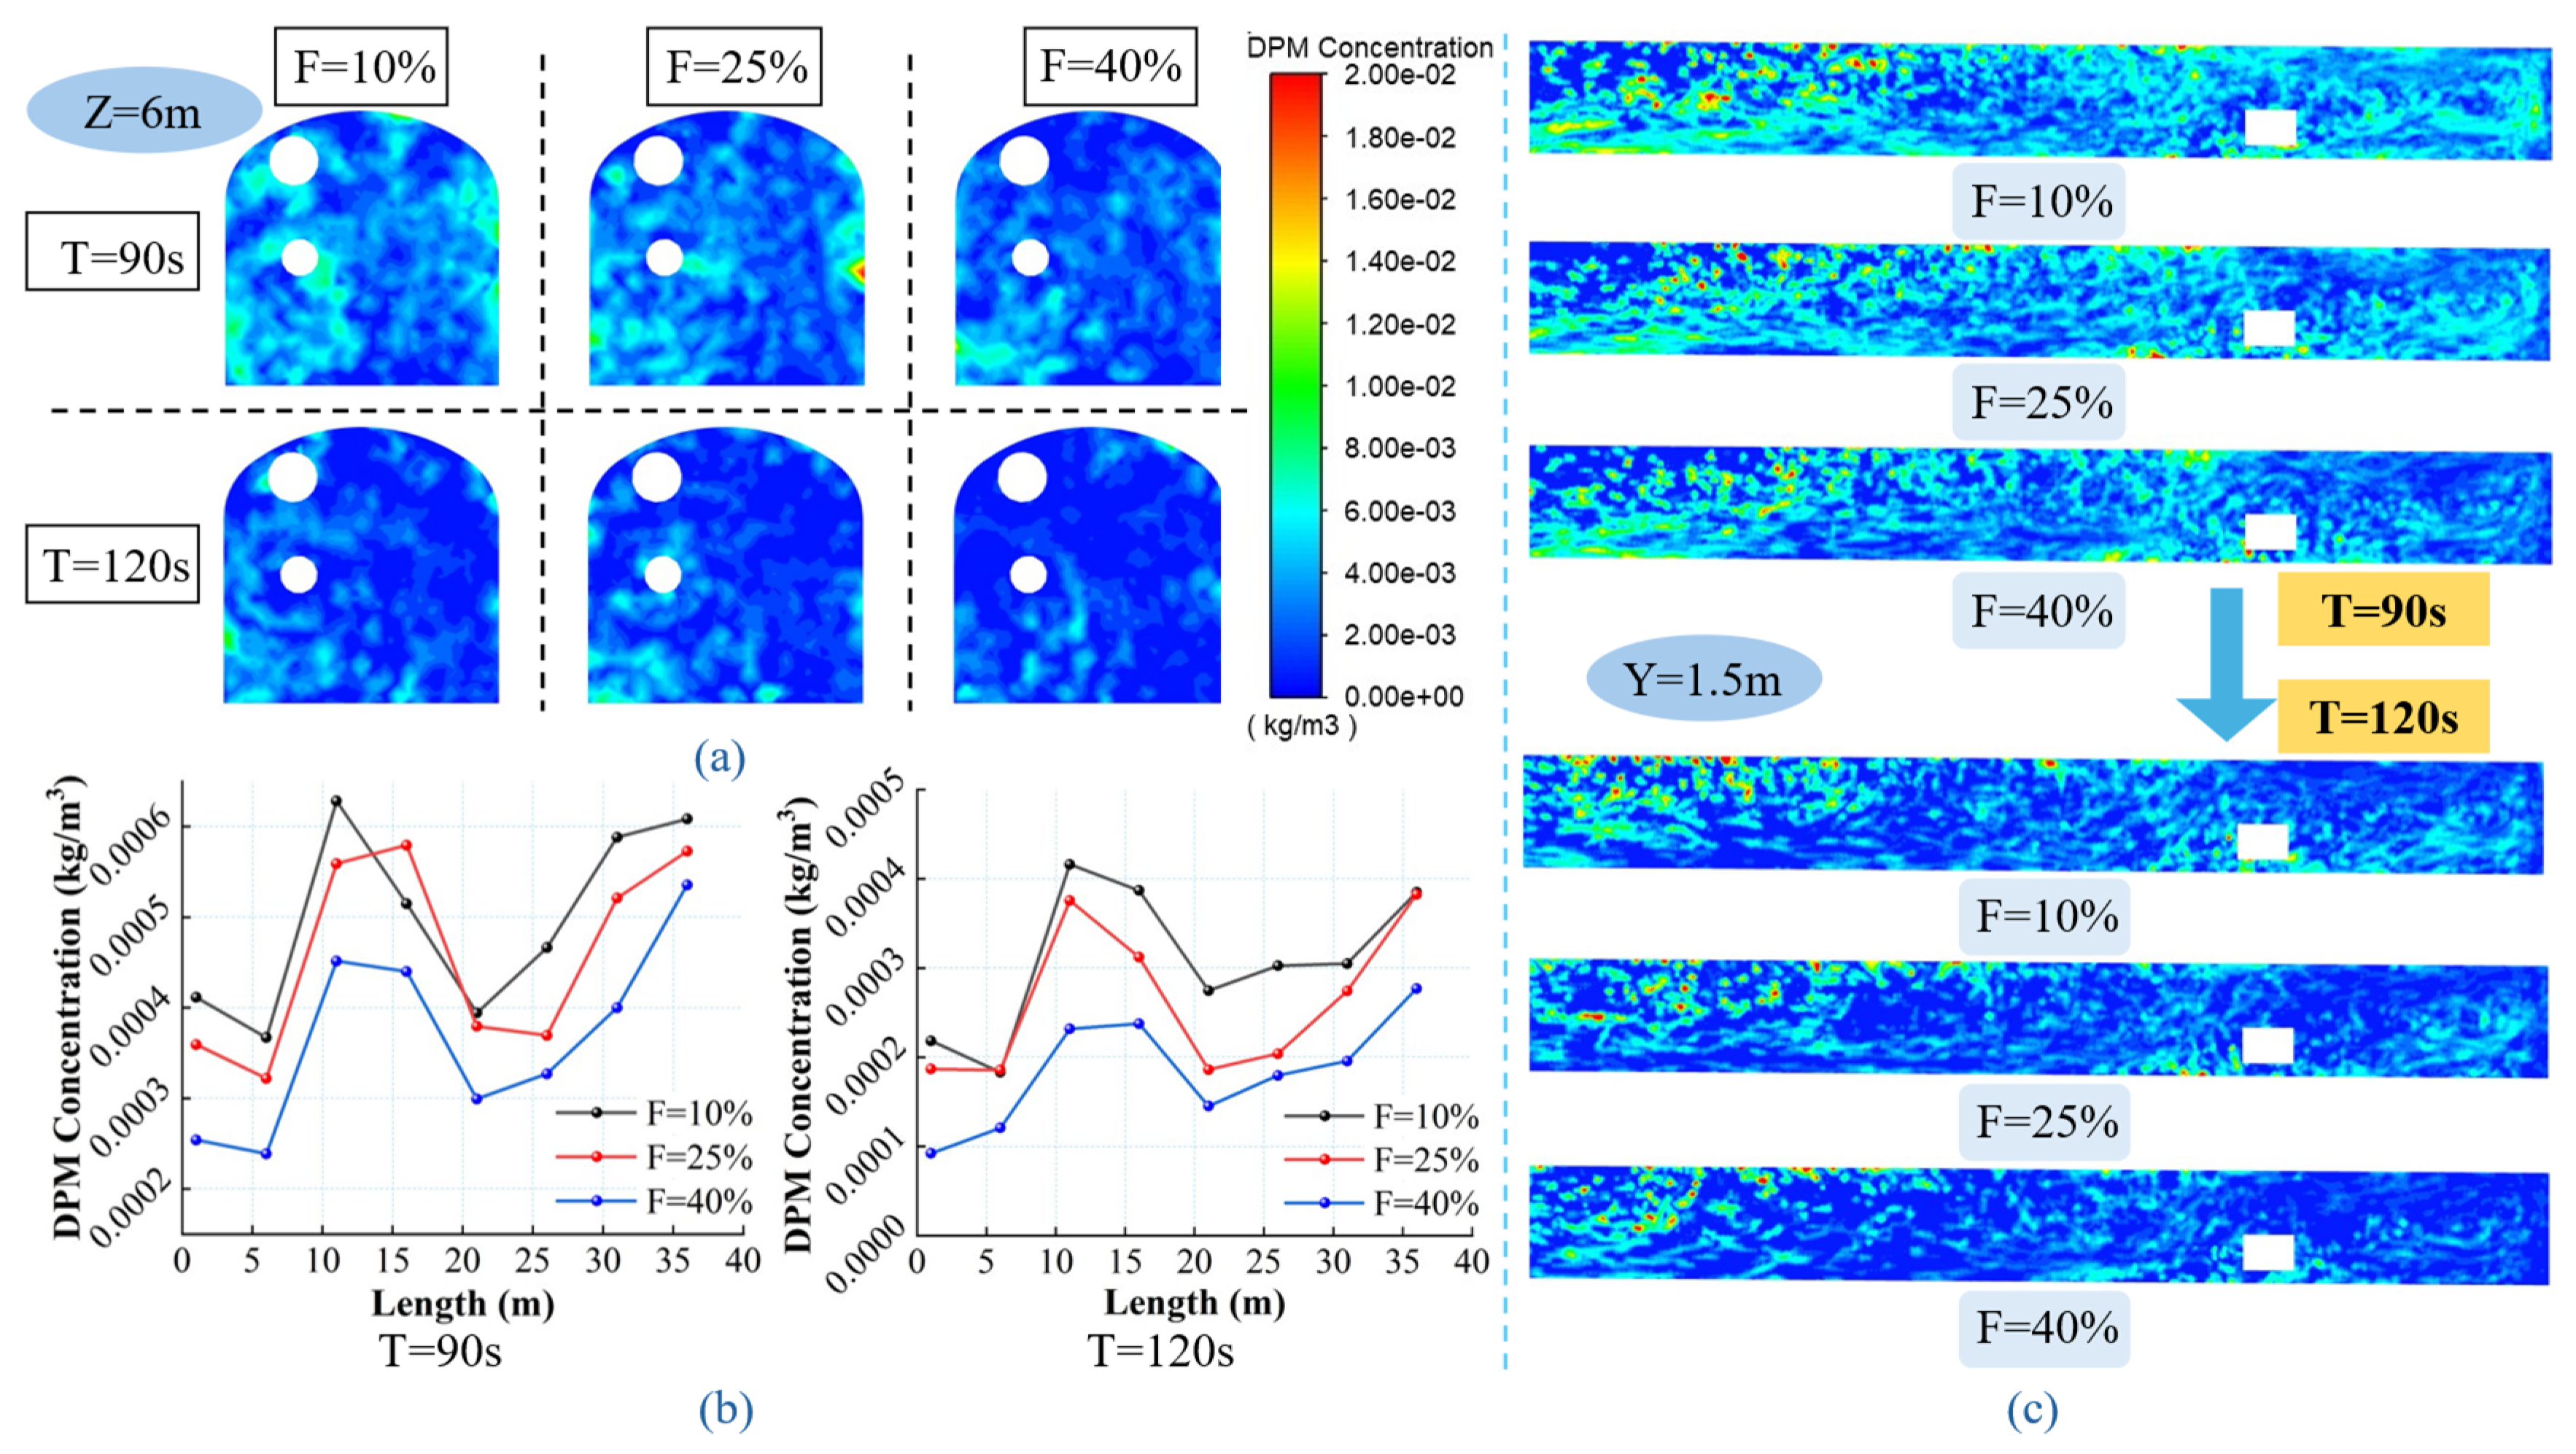
4.2.1. Influence of Circulation Rate on Dust Removal Effect

The circulating air volume of the spent air reuse equipment has a significant impact on the dust removal effect. When the circulating air volume at the operation site is within a reasonable range, it can effectively blow up and remove dust particles from the roadway. When the circulating air volume reaches a certain value, it can prevent dust from settling and accumulating and guide the dust into the dust removal equipment with the wind flow. If the circulating air volume is too low, dust will easily accumulate in the tunnel and reduce the air quality of the workplace. If the circulating airflow is too high, it will cause the settled dust to fly up again. In addition, excessively high wind speeds cause dust to spread faster, resulting in less purified dust being absorbed by the equipment. Considering the mining condition of the working face, the circulating air volume of 34 m3/min, 85 m3/min, and 135 m3/min, i.e., the circulating rate of 10%, 25%, and 40%, are taken as the objects of study to investigate the effect of different circulating rates on the distribution of dust in the roadway.
The cross-section with a distance of Z = 6 m from the end face of the roadway can reflect the dust distribution at the operation site, as shown in Figure 10a. Under the same ventilation time, the larger the ventilation circulation rate, the less dust in the roadway, and the dust in the roadway can be reduced faster due to the fact that the amount of air absorbed and purified by the spent air treatment equipment is also higher when the circulation rate is higher. When the ventilation time T is from 90 s to 120 s, the dust in the section of the roadway is significantly reduced under the effect of natural settlement and absorption by the equipment. Figure 10b shows the average dust concentration curve of the roadway cross-section from 1 m to 36 m from the working face. As shown in the figure, it can be seen that in the range of 1 m to 6 m from the working face, due to the large air volume, the dust is quickly removed from the working face under the action of the wind flow. Therefore, the dust concentration is lower in this range. When 10–16 m from the working face, the wind flow speed decreases, dust gathers in this area, and the average dust concentration increases rapidly. When the distance is 20 m away from the working face, the dust in the roadway is absorbed by the spent air treatment equipment, the average dust concentration decreases rapidly, and the unabsorbed dust is gradually discharged from the roadway with the return airflow. The average dust concentration at 11 m from the working face is the largest when the circulation rate F = 10%, and the average dust concentration at the ventilation time of 90 s and 120 s is 0.63 g/m3 and 0.42 g/m3, respectively, and the average dust concentration of the circulation rate F = 40% is lower than the average dust concentration of the circulation rate F = 10% and the circulation rate F = 25% in the range of 1–36 m. As shown in Figure 10c, at the height of the breathing zone Y = 1.5 m, the dust in the roadway decreases with an increase in the ventilation circulation rate, and the overall dust distribution in the roadway significantly decreases when the ventilation time T is from 90 s to 120 s, and the dust content in the roadway can be effectively reduced by continuous ventilation. Combining the dust removal effects of different ventilation circulation rates in the cross-section of the roadway and the height of the breathing zone, the circulation rate F of the controllable circulation ventilation can achieve a better dust removal effect when 40% is used.

4.2.2. Influence of Equipment Outlet Position Zm on the Effect of Dust Removal in the Roadway

When the distance from the cold air outlet to the heading face is different, the wind flow field of the roadway also changes significantly. Due to the roll suction effect of the jet, vortex formation in the wind flow is observed within the effective range of the jet. Due to the roll suction effect of the effective suction range, the wind flow converges here, and the wind flow sucked in by the equipment inlet collides with the pressurised wind flow, forming a violent turbulence; therefore, it is necessary to determine a reasonable position so that the dust in the working face can be efficiently absorption.
As shown in Figure 11a, there is a low wind speed area before and after the equipment suction outlet, which affects the dust absorption efficiency. When Zm = 8 m, the wind speed at the first suction outlet in front of the equipment is higher, making it easier for the dust in the return airflow to be absorbed by the equipment.
Figure 11b shows the dust distribution in the roadway cross-section at 1, 6, and 11 m from the heading face when the ventilation time was 90 s. It can be seen from the figure that the range of dust distribution at 11 m from the heading face was larger than that at 1 and 6 m. Additionally, the dust distribution at the section 1 m from the heading face is the smallest when Zm = 8 m.
Figure 11c presents the variation curves of the average dust concentration in different sections of the operating area when the ventilation times are T = 90 s and T = 120 s, along with a histogram of the average dust concentration in the roadway within the breathing zone at a horizontal height of Y = 1.5 m. It can be observed that as the ventilation time increases, the overall dust concentration in the roadway decreases. At T = 90 s, the highest dust concentration in the operating area occurs at the equipment outlet location Zm = 5 m, where the average dust concentration in the cross-section 11 m from the heading face reaches 0.59 g/m3, which is higher than the concentrations of 0.36 g/m3 at Zm = 8 m and 0.3 g/m3 at Zm = 11 m. At T = 120 s, the average dust concentration in the operating area at Zm = 8 m is the lowest at all cross-sections, whereas the dust concentration at Zm = 5 m remains the highest at all cross-sections.
The average dust concentration within the breathing zone (Y = 1.5 m) in the tunnel at the equipment outlet position Zm = 5 m is 0.39 g/m3, while the concentrations at Zm = 8 m and Zm = 11 m are 0.33 g/m3 and 0.37 g/m3, respectively. Therefore, a better dust removal effect can be achieved by positioning the equipment outlet at Zm = 8 m.

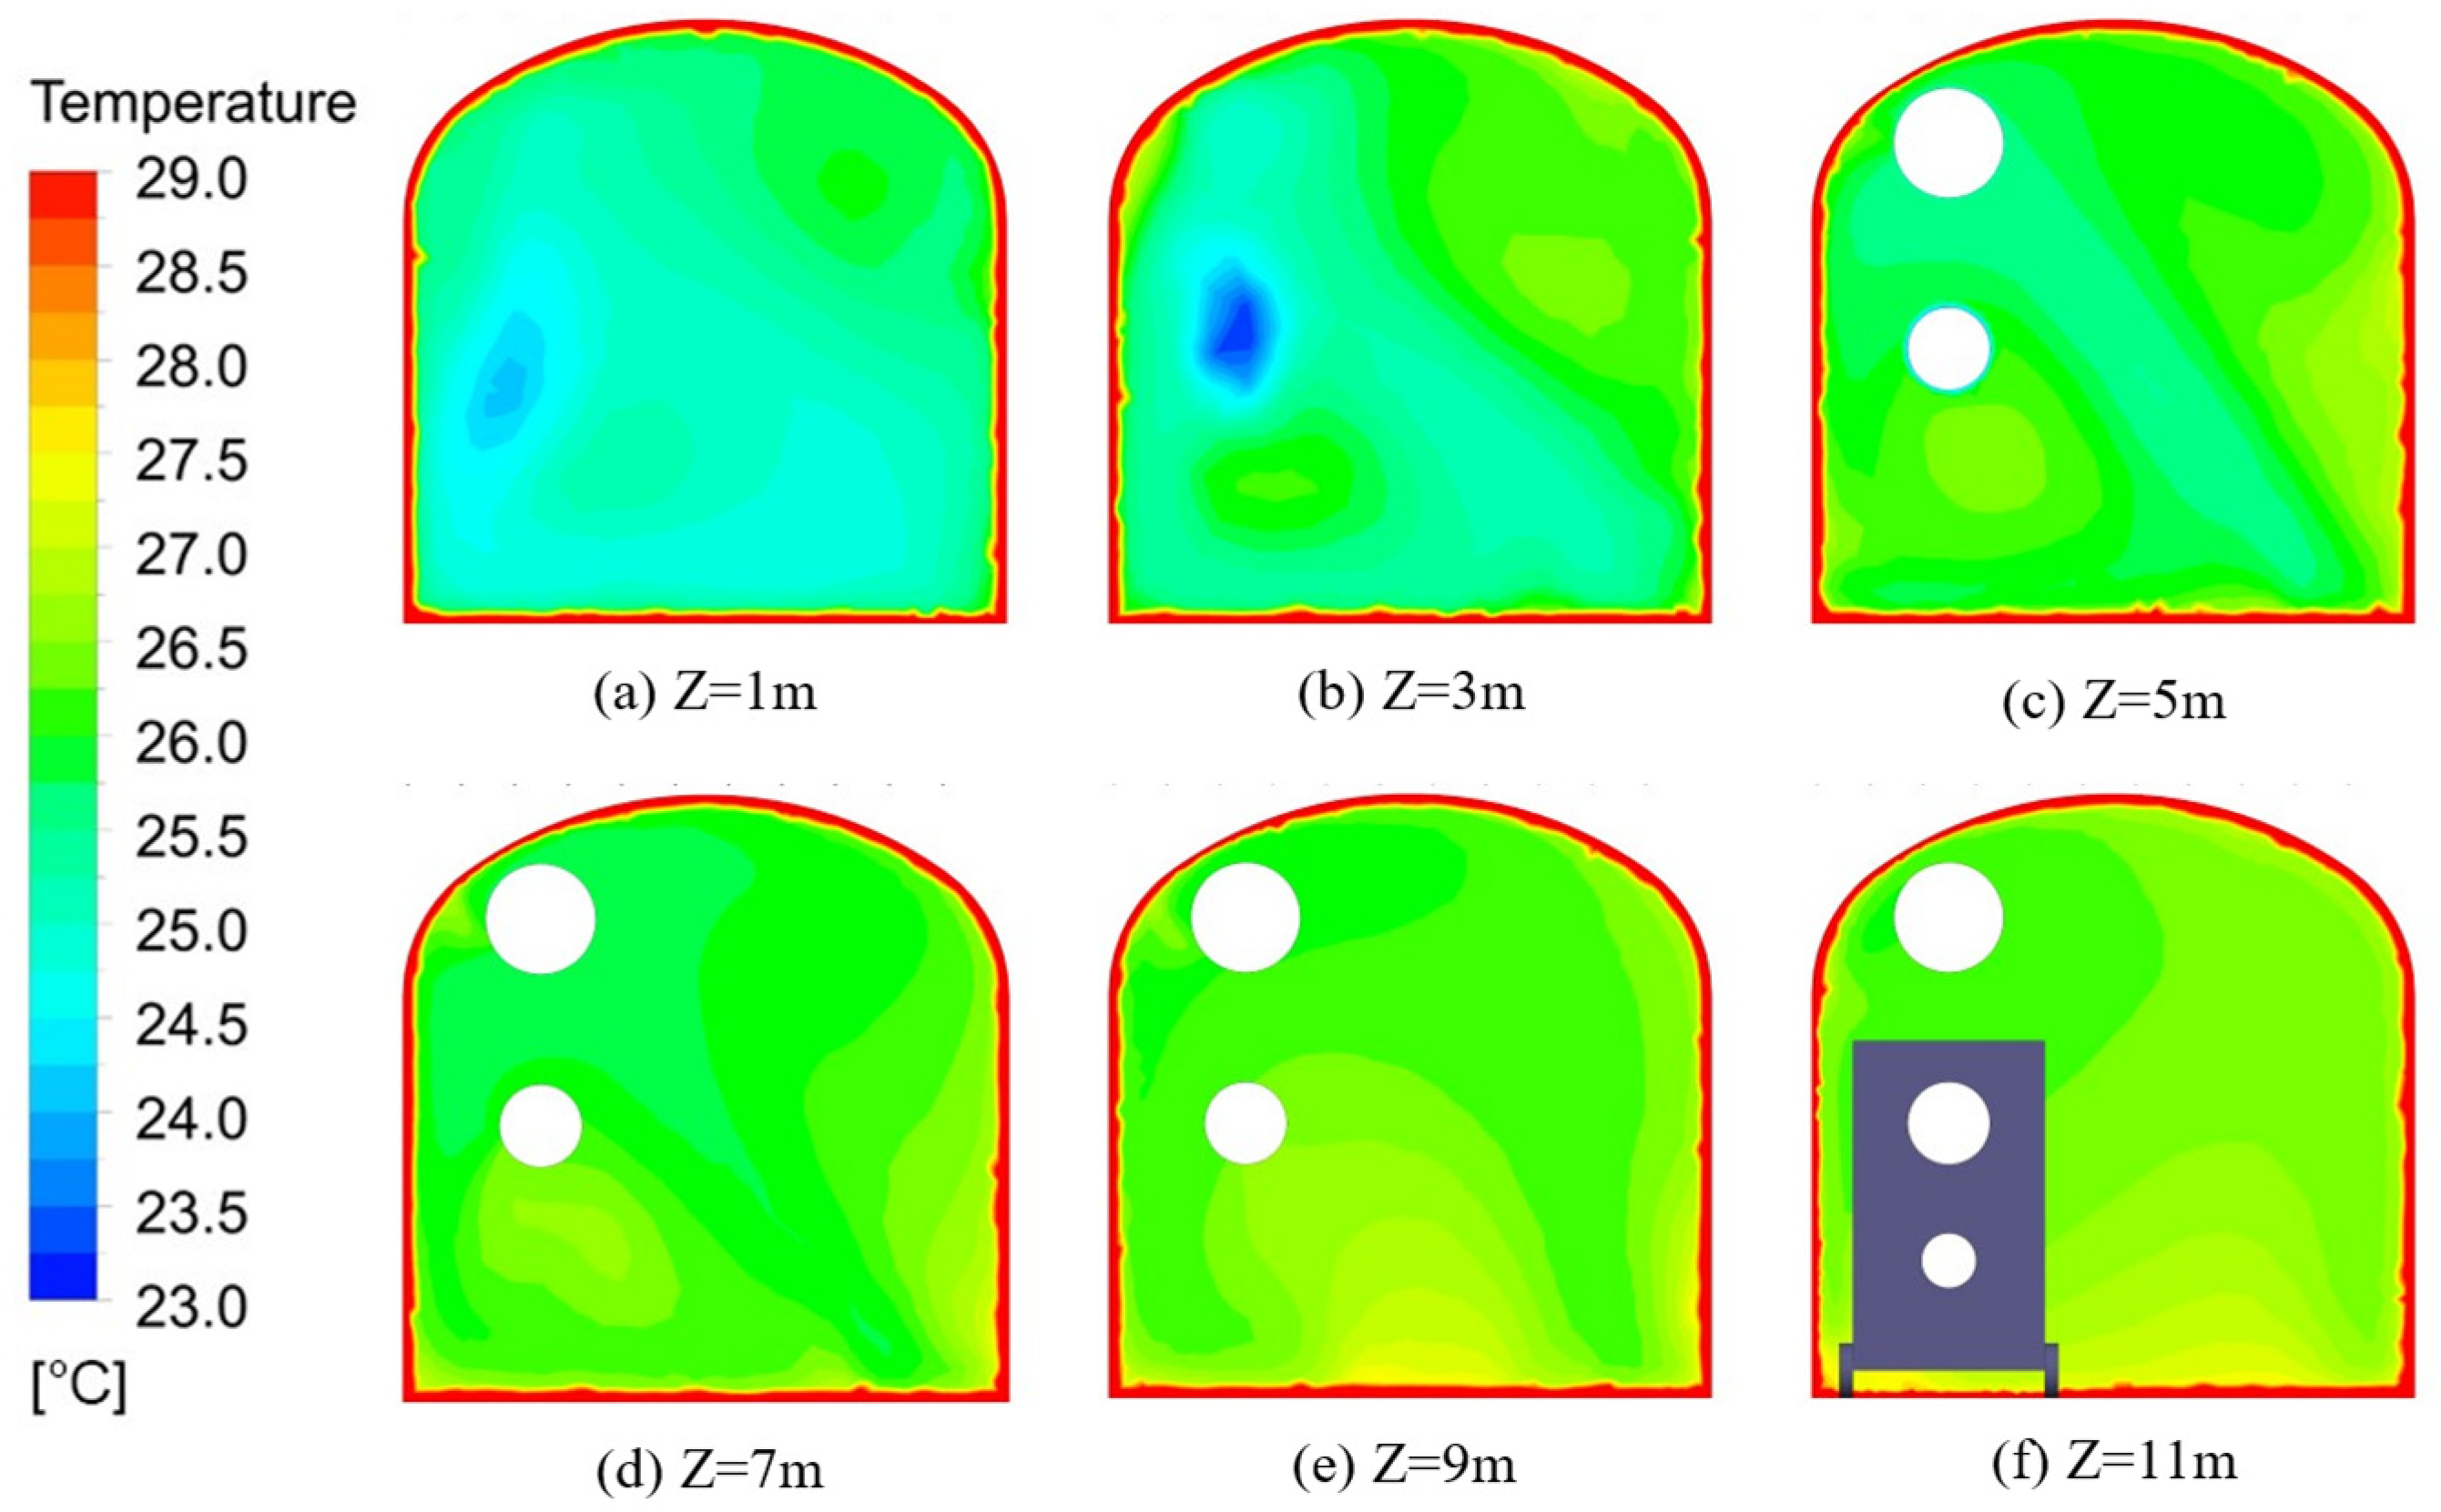
4.3. Characterisation of the Temperature Field Distribution in the Tunnel

In order to visually analyse the cooling effect of the spent air reuse equipment, the equipment is set to simulate the working face according to the actual parameters. The wind speed and temperature at the cold air outlet of the equipment are 5 m/s and 20 °C, while the wind speed and temperature at the hot air outlet are 5 m/s and 29 °C. The suction ports at the front and back of the equipment are set as velocity inlets with a wind speed of −5 m/s. The simulation is carried out based on the specified initialisation parameters, and the results of the temperature simulation in the direction of roadway advancement are shown in Figure 12.
Miners typically work close to the working face; therefore, the area within 13 m of the working face is considered the operational area. To assess personnel comfort, simulation maps at heights of 1.1, 1.4, and 1.7 m are used to investigate the distribution of the temperature field at different horizontal heights.
As shown in Figure 12, the temperature in the roadway from the working face to the return air lane gradually increases in front of the digging surface due to the combined effect of the air pressure from the windpipe and the refrigeration equipment. This helps maintain a low temperature near the working face, with the temperature remaining below 24.6 °C at all times. As the airflow passes through the digging surface, it gradually heats up due to heat dissipation from the surface and the surrounding rock. The temperature at the suction outlet of the equipment increases to 26.1 °C, but it still remains relatively low. At this point, part of the airflow is absorbed by the equipment, while the rest is discharged through the return air tunnel. After passing through the hot air outlet of the equipment, the temperature of the return airflow gradually increases to 28.2 °C.
At different horizontal heights in front of the working face, the distribution of the wind flow temperature field shows significant variation. Assuming the average height of the operators is 1.75 m, the simulation results indicate that within the range of the operator’s upper body, the wind flow temperature decreases with increasing height. The average temperatures in the work area at heights of 1.1, 1.4, and 1.7 m are 26.1 °C, 25.8 °C, and 25.5 °C, respectively. At a height of 1.7 m, due to being closer to the cold air outlet of the spent air reuse equipment, the distribution range of the cold air is wider, and the wind flow temperature in the work area is between 23.6 °C and 26.2 °C. At a height of 1.1 m, the airflow is affected by the suction inlet at the front of the equipment, and some of the cold air returning from the working face is absorbed. As a result, the cooling area is reduced, and the temperature in the work area ranges from 23.9 °C to 26.3 °C. Therefore, the air temperature in the height range of 1.1 m to 1.7 m is comfortable and meets the ventilation requirements. Furthermore, after applying the equipment, the airflow in the work area of the tunnel increased by 1.413 m3/s, effectively improving the thermal environment at the working face.
The temperature distribution of the roadway section at different locations was analysed, and the dry bulb temperature distribution cloud plots of the roadway section at different distances Z (1, 3, 5, 7, 9, and 11 m) from the roadway face were taken for comparison, as shown in Figure 13.
As shown in Figure 13, the overall temperature is lower at the location closer to the boring face, and the temperature at the centre of the working face is about 24.8 °C at Z = 1 m, and the cold air is distributed more uniformly in this cross-section. As the cold air flows out from the working face, the air in the roadway is subjected to the cooling effect of the surrounding rock, and the overall temperature gradually increases, and the centre temperature of the roadway increases to 26.4 °C at Z = 11 m. It can be observed that the cooling equipment has a good cooling effect at the end of the roadway. When Z = 3 m, the lowest temperature point is concentrated near the cold air supply windpipe, and the hot air is mainly concentrated near the suction outlet below the windpipe and the upper part of the roadway wall. At Z = 5 m, Z = 7 m, and Z = 9 m, the coverage of cold air in each cross-section decreases, and the air temperature in front of the air suction outlet of the cooling equipment increases. In the work area, the cooling effect of the air in the roadway using cooling equipment is better, and the thermal environment of the roadway is within a reasonable range.

4.4. Influence of Different Equipment Parameters on the Air Temperature of the Tunnel

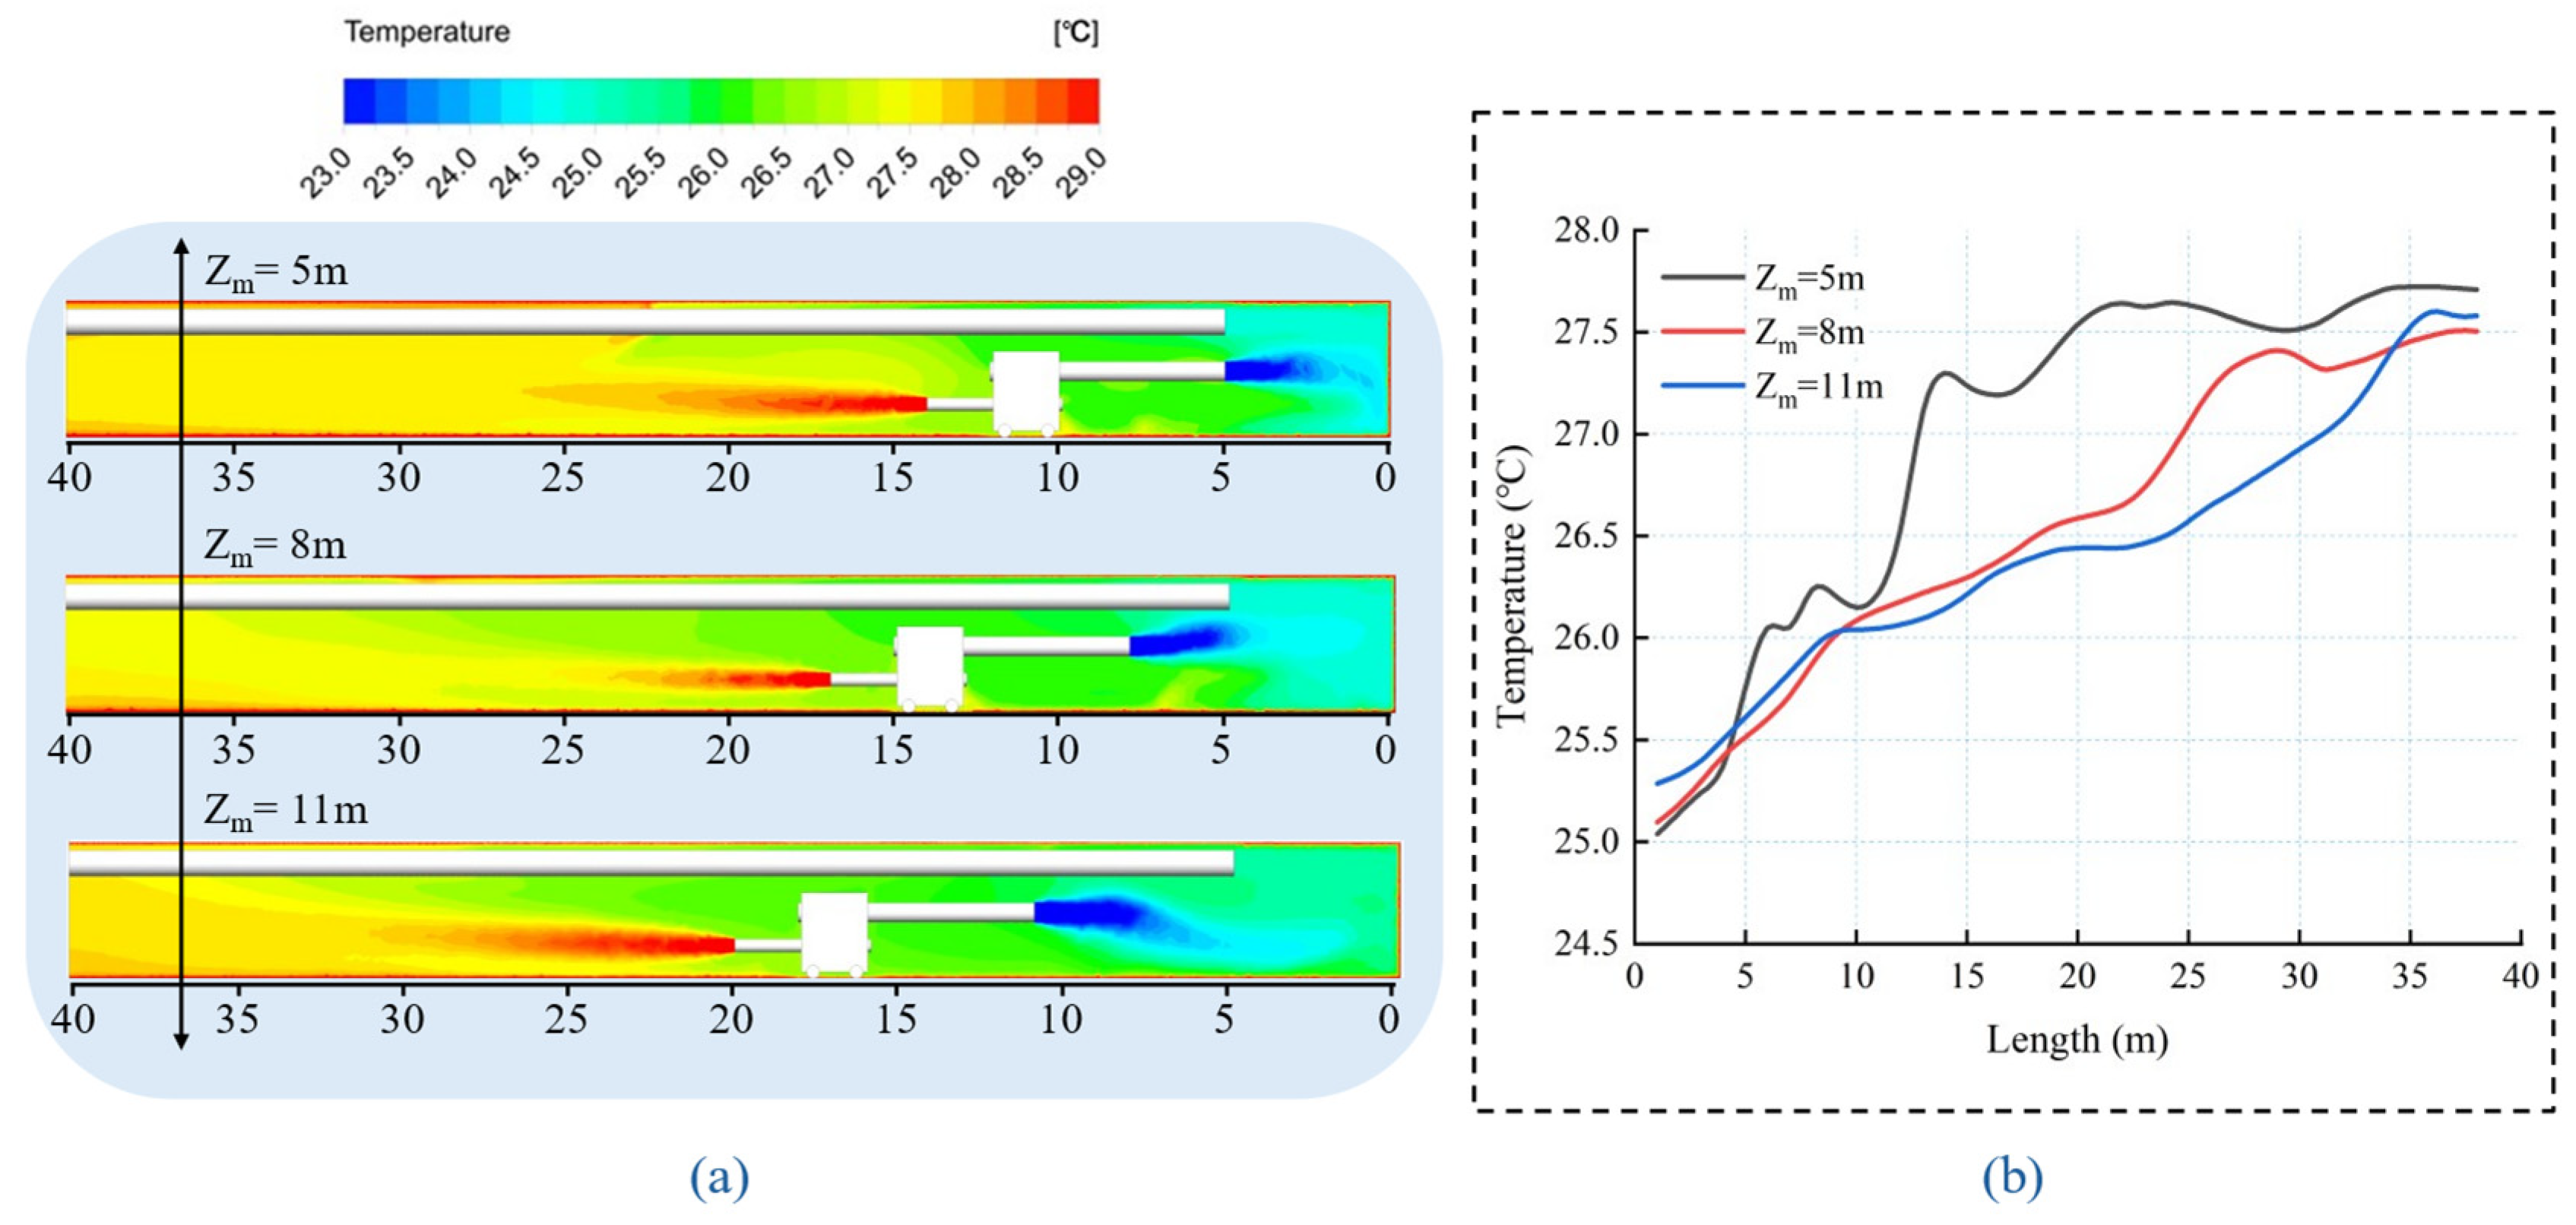
4.4.1. Influence of Equipment Outlet Location Zm on the Air Temperature of the Roadway

The location of the spent air reuse processing equipment directly affects the advantages and disadvantages of the ventilation effect in the mine, and the location of the cold air outlet mainly takes into account the cooling effect and the digging advancement speed of two factors [36]. As the length of the roadway changes with the dynamic process of mining, when the cold air outlet is far away from the working face, the temperature of the air increases through the exchange of heat and humidity, and the cooling effect is not achieved. When it is closer to the working face, most of the cooling airflow generated by the equipment flows into the return air area, resulting in the loss of cold volume [37]. Therefore, it is necessary to determine the location of the cold air outlet to ensure that the cooling system achieves a certain cooling effect at the same time, but also to facilitate the movement of the mining process to the cold air outlet temperature of 22 °C. Different windpipe outlets with distances Zm of 5, 8, and 11 m from the working face are set up for simulation. The changes in the temperature of the working face with different windpipe outlet distances are compared to determine the optimal windpipe outlet distance and equipment arrangement. The simulation results are shown in Figure 14.
The cloud diagram of the temperature field distribution of the roadway when the cooling equipment is in different positions is shown in Figure 14a. The results show that the location of the cold air outlet significantly affects the temperature distribution of the tunnelling roadway. When Zm is small, more cold air is sent into the operation area so that the temperature of the operation area at the front of the roadway is lower; therefore, the smaller Zm is, the better the cooling effect of the cooling equipment in the operation area. When Zm is larger, the temperature distribution of the roadway is more uniform, and the cooling range of the refrigeration equipment is wider.
Figure 14b shows the air temperature distribution curves at the centre of the roadway for different cold air outlet positions of the cooling equipment, namely Zm = 5 m, Zm = 8 m, and Zm = 11 m. As shown in the figure, for different values of Zm, the air temperature is the lowest 1 m from the working face, approximately 25.0 °C to 25.3 °C. As the airflow moves outward, it continuously absorbs heat from the surrounding rock, causing the air temperature to gradually rise from 27.5 °C to 27.7 °C. When Zm is 5 m, the temperature in the operational area within 4 m from the working face is lower than the temperatures at Zm = 8 m and Zm = 11 m. At 10 m from the working face, the airflow temperature at different equipment outlet positions (Zm) is close to 26 °C. However, at Zm = 5 m, the airflow at this point is affected by the equipment’s suction inlet, where the low-temperature air is sucked into the equipment, and a large amount of cooling capacity is recovered and utilised, causing the temperature in the rear section of the roadway to increase rapidly. Therefore, to maintain a lower temperature in the operational area within Z < 13 m, it is recommended to position the cold air outlet of the cooling equipment at Zm = 8 m from the working face. This achieves a better cooling effect in the operational area and allows the recovery of cooling capacity from the return airflow, thereby reducing the energy consumption of the refrigeration equipment.

4.4.2. Influence of Circulation Rate on Cooling Effect

A reasonable circulation rate can remove the heat from the tunnel in time. If the circulation rate is too low, the heat in the working face cannot be removed in time, which increases the temperature of the working place and affects the working environment and efficiency of the workers. Conversely, if the circulation rate is too high, although the heat is removed quickly, it may produce a wind-cooling effect, which makes workers feel uncomfortable and increases the energy consumption of the ventilation equipment and ventilation costs. Therefore, in order to form a reasonable ventilation and cooling airflow organisation, the effective cooling of the boring head must be realised. Considering the comprehensive mining conditions of the working face, the circulating airflow circulation rates are set as 10%, 25%, and 40%, and the temperature of the cold air outflow is 22 °C to simulate the change in the working face temperature, and determine the optimal circulation rate, and the simulation results are shown in Figure 15.
From the figure, it can be observed that the greater the circulation rate, the larger the temperature difference between the front and rear sections of the roadway and the lower the airflow temperature in the working area. A smaller circulation rate results in a smoother temperature variation between the ventilation equipment and the roadway end face. Specifically, when the circulation rate is 40%, the temperature at the measuring point 1 m from the roadway end face is 24.5 °C, while at a circulation rate of 10%, the temperature at the same point measures 25.4 °C. At different circulation rates, the temperature at the measuring point 12 m from the end face of the roadway remains consistent. Beyond 12 m from the end face, the higher the circulation rate, the faster the increase in roadway temperature. At 15 m from the end face, the rate of increase in the airflow temperature decreases, and the airflow temperature stabilises. Therefore, to minimise the temperature in the working area, a circulation rate of F = 40% should be selected to achieve the optimal cooling effect.

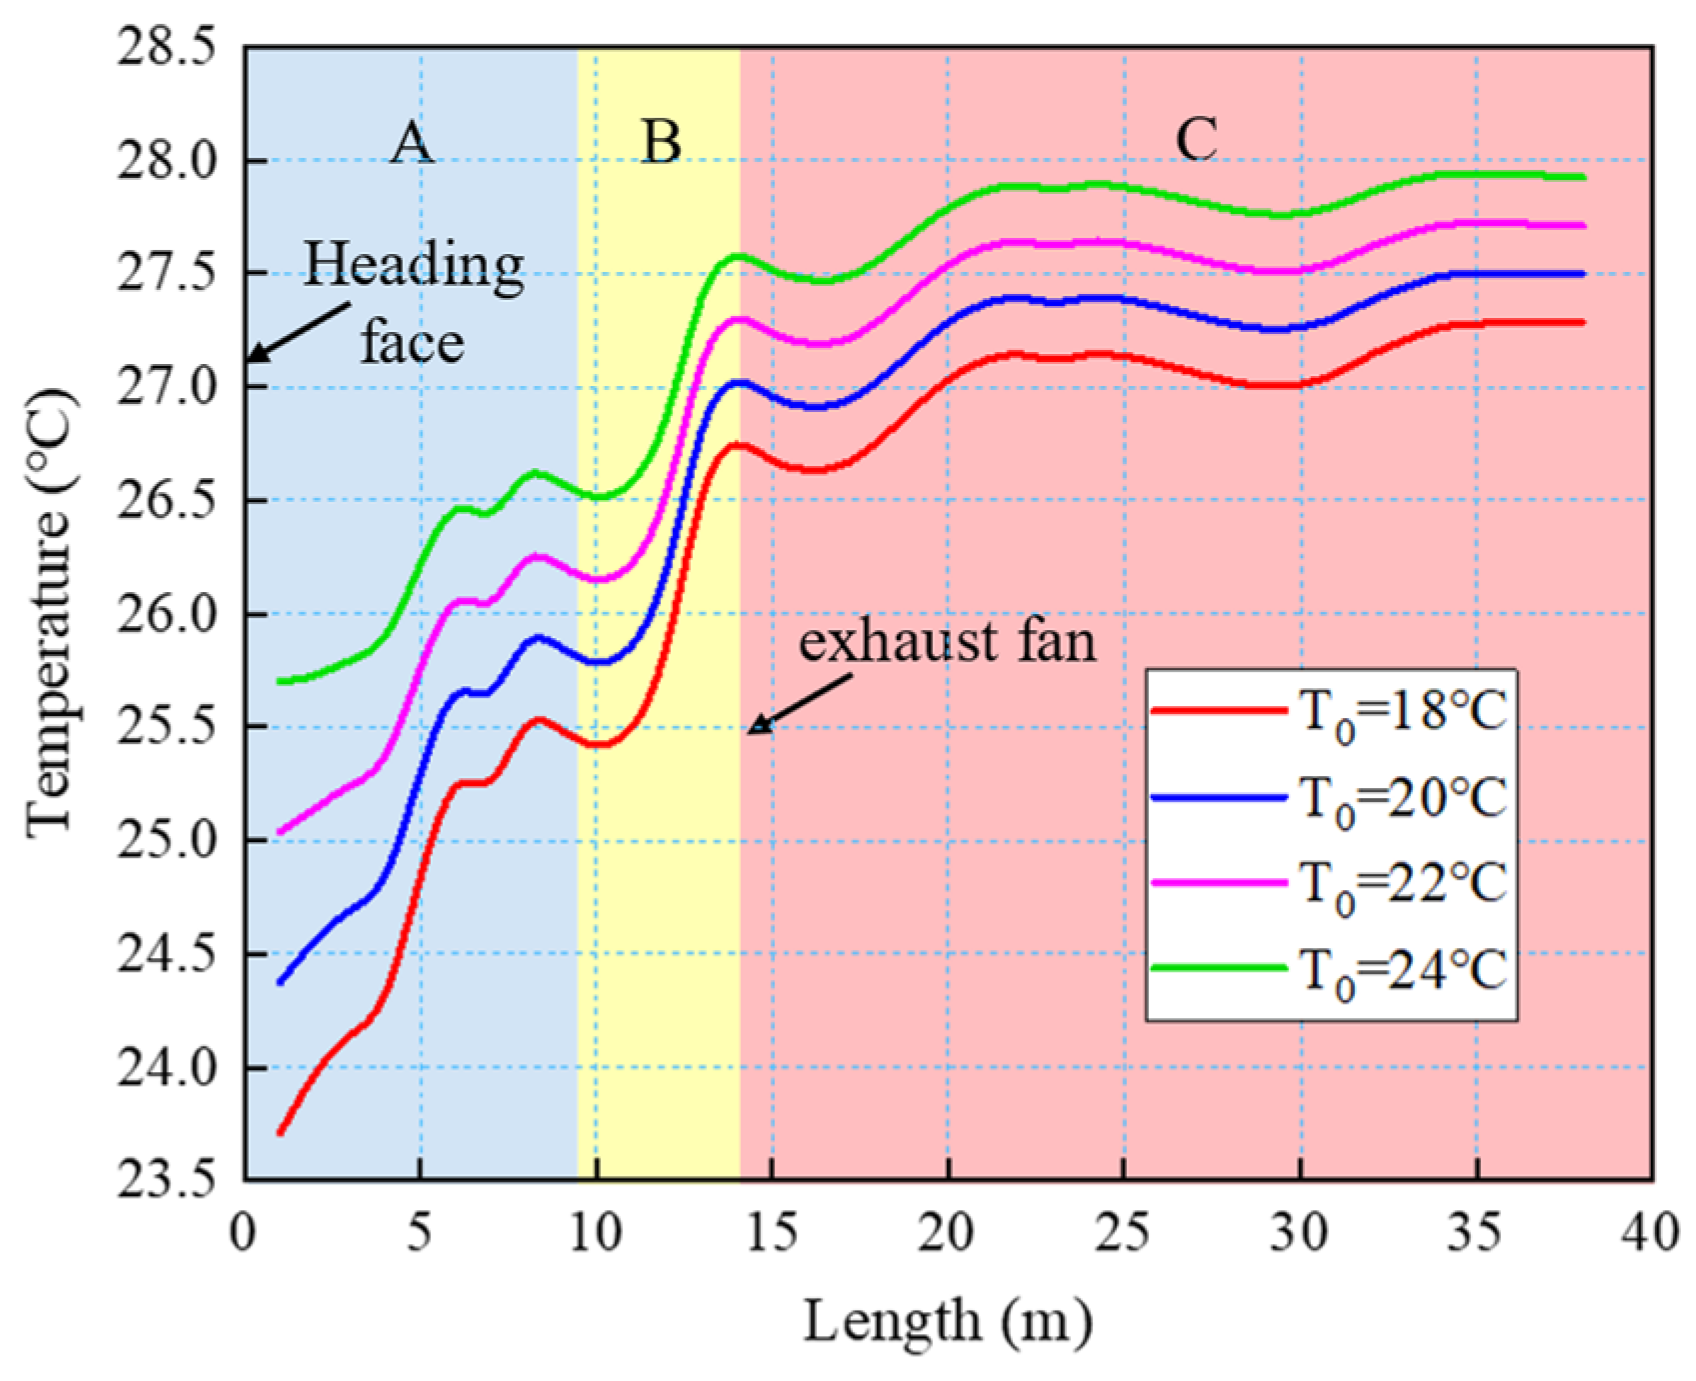
4.4.3. Influence of Equipment Outlet Air Temperature T0 on the Cooling of the Roadway

Alley hot air from the equipment inlet inhalation, and enter the equipment inside the low-temperature solution for heat exchange, low-temperature solution through the cloth liquid into the air treatment box after the spray to the cooling wet curtain, absorb the heat in the hot air, so that the hot air to be cooled, the dust in the air is also adsorbed, and then transported through the air blower to the need to reduce the temperature of the location, warming up the solution through the solution pumped to the refrigeration heat exchanger module to reduce temperature The heat exchange effect of the refrigeration heat exchanger module directly determines the cooling effect of the whole system, i.e., (equipment air temperature T0) T0 is controlled by the rated power of the refrigeration machine, and the minimum rated power determines the minimum value of T0, while the required cooling capacity of the face of the digging work determines the range of T0. According to the Technical Specification for Ventilation of Metallic and Nonmetallic Underground Mines, the temperature of the roadway of the excavation should not exceed 28 °C. With the cooling equipment cold air duct outlet to the working face distance Zm of 5 m, the rated power of the refrigerator and the required cooling capacity of the working face were used to determine T0 = (18 °C, 20 °C, 22 °C, and 24 °C) to discuss the changing law of the cooling capacity of the working face. The simulation results are shown in Figure 16.
According to the influencing factors of air temperature in different locations, Figure 16 is divided into three areas, A, B, and C, in which area A is the cooling space, and the cold air from the refrigeration equipment acts directly in this area, which reduces the temperature. Area B is the airflow absorption area, where the suction port of the spent air reuse equipment absorbs the return airflow and sends it to the working face after cooling. Area C extends from the outlet of the heat-exhausting air cylinder of the equipment to 40 m from the working face, and the temperature of the airflow in this area gradually increases due to the influence of heat exhaustion and heat dissipation from the surrounding rocks.
When the cold air blower of the cooling equipment adopts different air outlet temperatures, it significantly impacts the temperature in the cooling area. A lower air outlet temperature increases the temperature difference between the cold and hot air in the roadway. According to the principle of heat transfer, the larger the temperature difference, the faster the rate of heat exchange. As a result, the cold air absorbs heat from the roadway air more quickly, leading to a rapid decrease in the air temperature. When the air outlet temperature (T0) of the cooling equipment is reduced from 24 °C to 18 °C, the temperature at a measurement point 1 m away from the working face decreases from 25.7 °C to 23.7 °C. This shows that for every 2 °C reduction in the air outlet temperature, the temperature at the working face decreases by 0.6 °C.
Due to the cooling equipment’s suction inlet being 10 m from the working face, the temperature in the roadway increases sharply after this point. Under the influence of the hot air exhaust from the equipment, the roadway temperature reaches its highest point, 22 m from the working face. When the air outlet temperature (T0) is 18 °C, the overall temperature in the working area decreases significantly. However, when T0 is set to 24 °C, the cooling effect is less noticeable, and the maximum temperature in the cooling space reaches 26.6 °C.
Therefore, setting T0 ≤ 22 °C in the cooling system can achieve a better cooling effect, keeping the air temperature within the cooling space of the working face below 26.3 °C, which meets the cooling requirements of the working face.

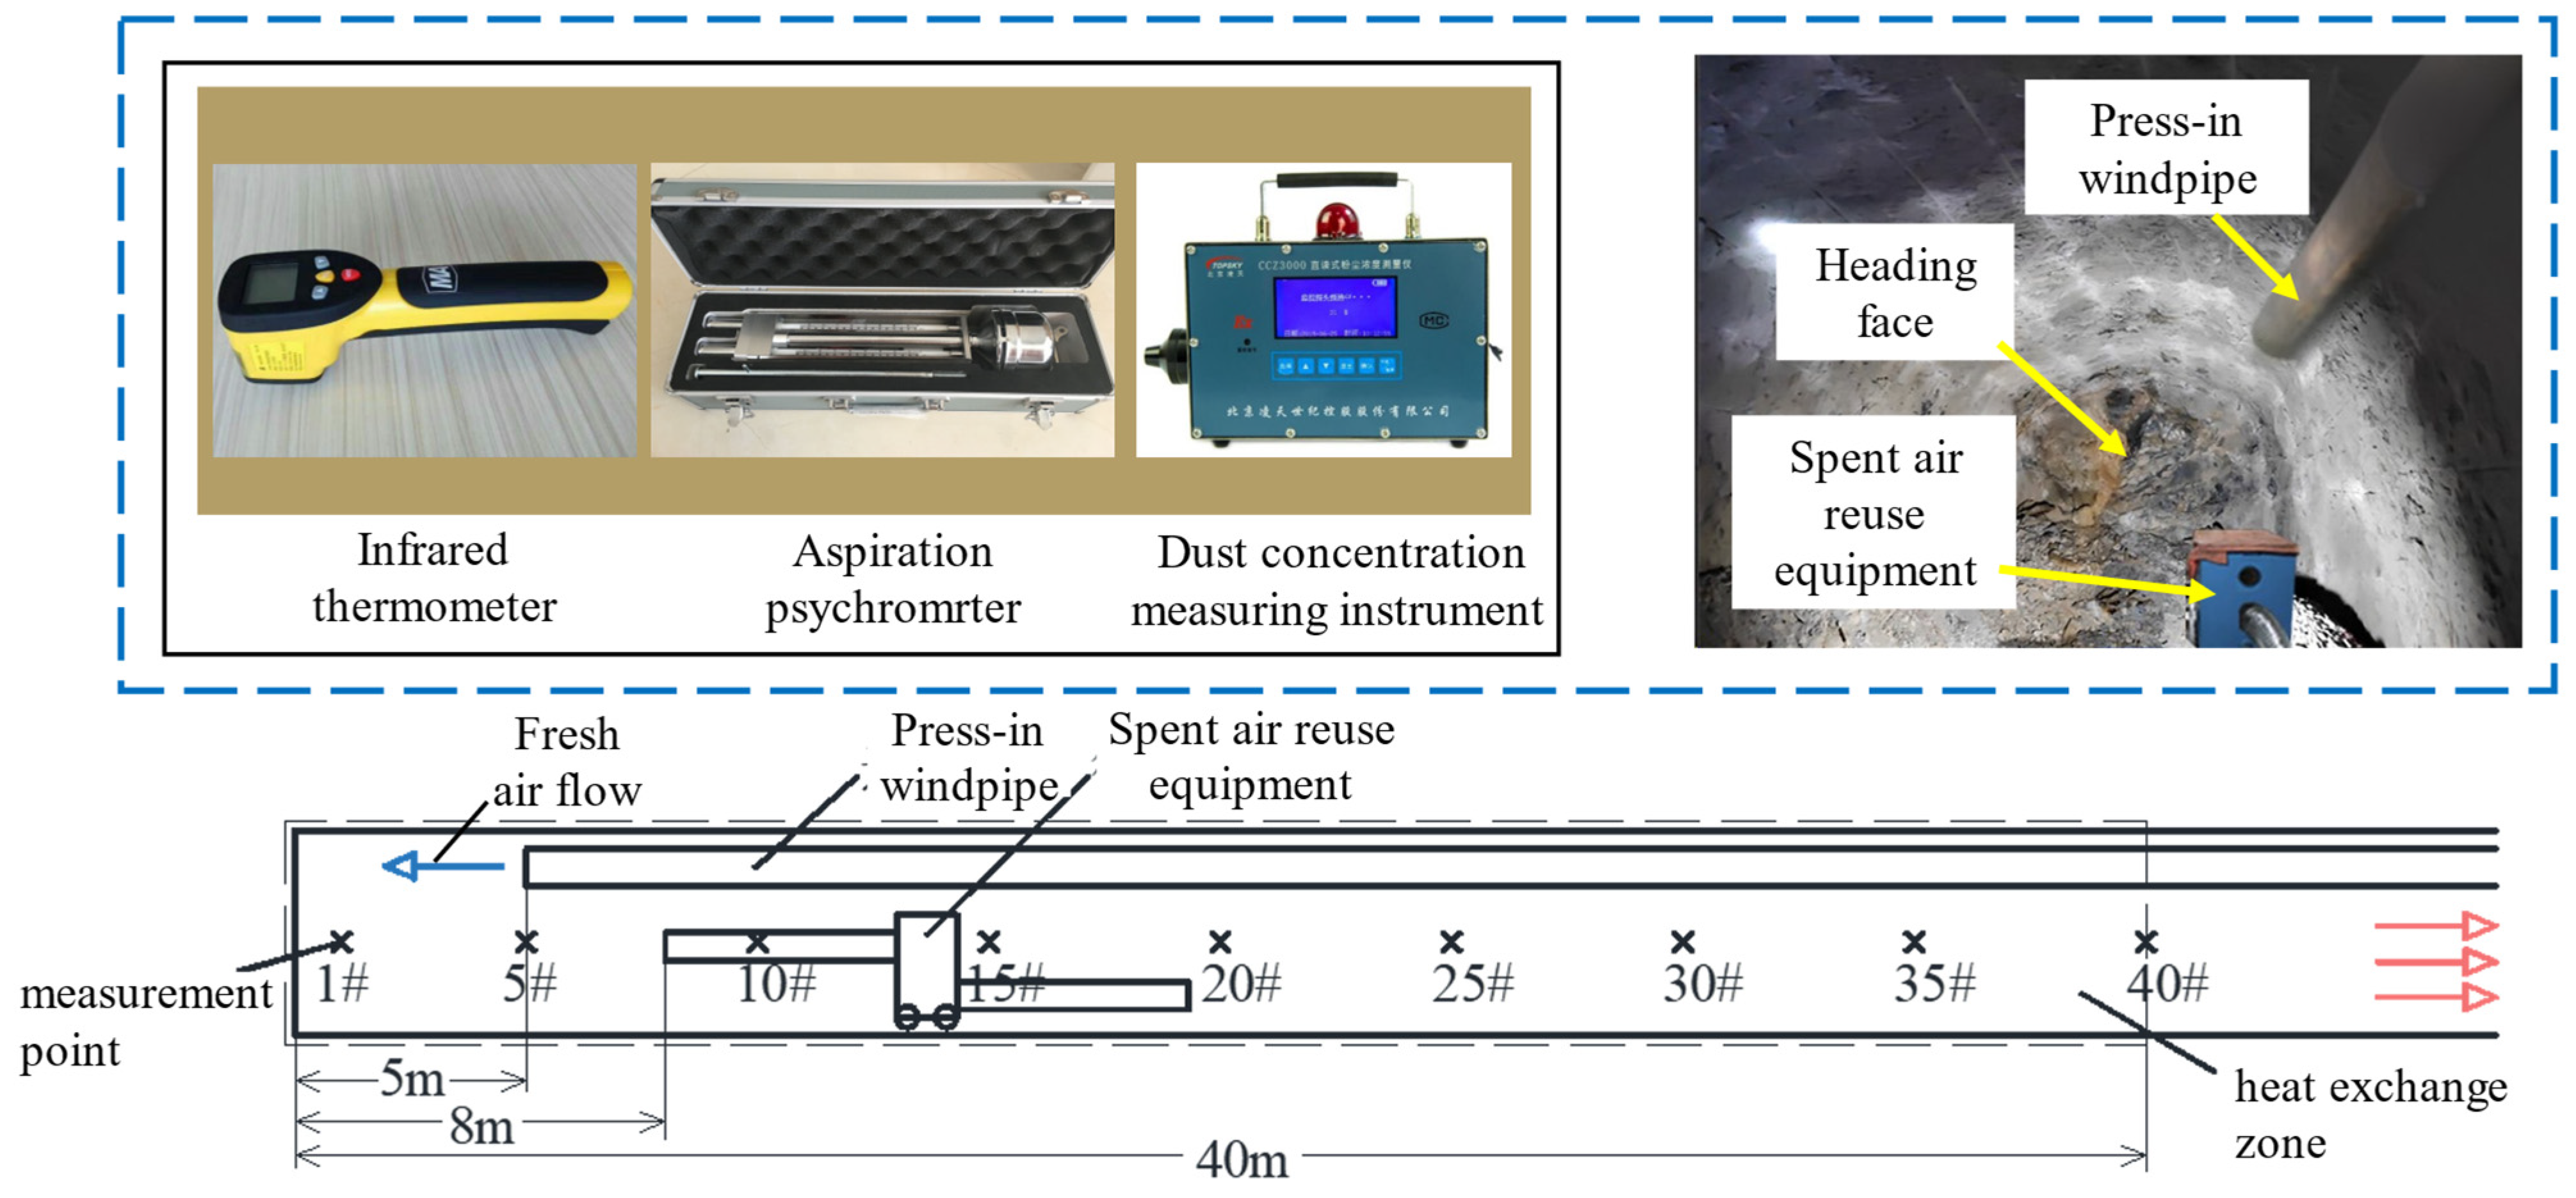
5. Engineering Applications

The optimum working conditions obtained from the above research are applied to engineering practice, and spent air reuse equipment is used to solve the problem of tunnel high-temperature thermal damage. The equipment consists of a ventilation fan, refrigeration unit, spent air treatment module, solution regeneration module, and related piping system. The ventilation fan absorbs the return air from the roadway, purifies and cools it down, and then sends it to the face of the tunnel, which can effectively dissipate the accumulated hot air. In the project application, the equipment is placed 13 m away from the face, the length of the cold air blower is 5 m, and the outlet of the cold air blower is 8 m away from the face so that the cold air is uniformly distributed over the entire face of the digging operation through a reasonable layout of the ventilation pipeline. In order to verify the cooling effect of the face, nine temperature measurement points are arranged at a height of 2 m in the centre axis of the roadway, and the measurement points are arranged at intervals of 5 m along the advancing direction of the roadway, and are named as 1#, 5#, 10#, 15#, 20#, 25#, 30#, 35#, and 40#, respectively, and the specific location of each measurement point is shown in Figure 17.
According to the measurement point layout plan for the field experiments, the ventilation dry and wet metre anemometer on the roadway of the nine measurement points are selected for thermodynamic determination. All the data obtained after several measurements were used to obtain the average effective value as the final data before and after the application of the equipment for the temperature-humidity measurement results of the measurement points, as shown in Table 2.
As shown in Table 2, when the spent air reuse equipment is used at the heading face, the temperature at each measuring point, especially at the point in front of the heading face, decreases significantly compared to the previous conditions. The temperature within 15 m of the working face drops by 3 °C to 3.5 °C, with the lowest recorded temperature being as low as 25.1 °C. However, the temperature of the airflow more than 20 m away from the working face gradually increases due to the combined effects of heat from the equipment and heat dissipation from the surrounding rock, and the temperature difference before and after the equipment is applied is not very large; therefore, the cooling effect is primarily concentrated in the working area in front of the heading face. Additionally, the dehumidifying effect is also quite evident after applying the equipment in the working area, with the relative humidity at the working face reduced from 90.6% to 70.2%. In the meantime, the results indicate that the dust removal performance of the spent air reuse equipment is significant, with an overall efficiency ranging from 34.6% to 51.9%. The average dust removal efficiency was calculated to be 44.9%. Consequently, the equipment is effective in mitigating and controlling the spread of dust pollution on roadways, which greatly improves the working environment, enhances the comfort and productivity of construction personnel, and ensures the normal operation of construction equipment by reducing equipment failure and loss due to high temperatures. This, in turn, greatly facilitates the smooth progress of the tunnelling operations.

6. Conclusions and Outlook

6.1. Conclusions

To solve the problem of difficult ventilation, poor cooling effect, and serious dust pollution in the roadway of metal mine tunnelling, this study investigates the application effect of spent air reuse equipment in the heading face of tunnelling through theoretical analysis, numerical simulation and other methods. The cold air outlet temperature, equipment layout, and circulation rate of the air were analysed, and the optimal parameters for the equipment were determined. The main conclusions are as follows:
(1)
The spent air reuse equipment significantly affects the cooling and dust removal of tunnel airflow. By establishing a physical model and using Fluent 2020 R2 software for simulation, the temperature in the tunnel working area was effectively controlled by the equipment. The dry bulb temperature within the refrigeration space does not exceed 26.3 °C, and the average temperature within the working area, at a height of 1.1 m to 1.7 m, ranges from 25.5 °C to 26.1 °C. The temperature distribution at different positions along the roadway cross-section shows that the cooling equipment has a positive effect on cooling the working area. After the equipment is activated, the airflow in the tunnel changes, and a circulating airflow is formed between the heading face and the equipment. After the equipment absorbs and purifies part of the dust-laden airflow, it returns clean air to the work area, accelerating the reduction of dust concentration. Due to the equipment’s absorption of a large amount of dust, the dust concentration on the return air side of the roadway is significantly reduced.
(2)
The parameters of the equipment have a significant impact on the cooling and dust removal effects. The lower the temperature of the air from the cooling equipment, the greater the temperature difference between the cold and hot air in the roadway. The faster the heat exchange rate, the better the cooling effect. When the air temperature is reduced from 24 °C to 18 °C, the temperature of the working face decreases significantly, with a reduction of approximately 0.6 °C for every 2 °C drop. After careful consideration, setting T0 = 22 °C better meets the cooling needs, balancing both the cooling effect and energy consumption. When using different outlet positions (Zm), the temperature in front of the working area is the lowest when Zm = 5 m, reaching 25 °C; however, the cooling range is small. When Zm = 11 m, the cooling range is larger, but the temperature of the working area is higher. Meanwhile, the average dust concentration at the heading face is lowest when Zm = 8 m. Therefore, setting Zm to 8 m from the working face achieves better cooling and dust removal effects. When the circulation rate (F) is 40%, the average dust concentration in the roadway section between 1 m and 36 m is lower than when the circulation rate is 10% or 20%. The best cooling effect is achieved when the circulation rate is 40%, with the temperature at the measurement point 1 m away from the roadway face reaching 24.5 °C, which was the lowest temperature in the working area. Considering both the cooling and dust removal effects, the optimal parameters for the equipment are as follows: air outlet temperature (T0) = 22 °C, outlet position (Zm) = 8 m, and circulation rate (F) = 40%.
(3)
When the spent air reuse equipment is adopted in the heading face, the temperature of the measuring point in front of the heading face is significantly reduced compared with the previous one, and the temperature within the range of 15 m from the working face has been reduced by 3–3.5 °C, with the lowest temperature as low as 25.1 °C, the relative humidity of the measurement point 1 m away from the working face has been reduced from 90.6% to 70.2%, and the average dust removal efficiency was calculated to be 44.9%, which significantly improves the working environment.

6.2. Outlook

This paper investigates the effectiveness of spent air reuse equipment in heading faces. However, the current study still has certain shortcomings and limitations, mainly including the following aspects:
(1)
The numerical simulation in this study simplifies the parameters of the underground environment, and in the future, we can explore the precise matching of the parameters of spent air reuse equipment under different working conditions to realise the more precise control of the temperature of the heading face.
(2)
This study analyzes the cooling and dust removal effects of spent air reuse equipment but does not consider the impact of tunnel humidity. In the future, we can further investigate the influence of high temperatures, high humidity, and other adverse factors on the environment of the heading face and improve the circulation ventilation and cooling technology so that it can not only effectively lower the temperature but also play a greater role in protecting the health and safety of the workers.

Author Contributions

Conceptualisation, D.M.; Data curation, Q.F., and W.Z.; Investigation, Q.F.; Methodology, D.M.; Project administration, D.M.; Supervision, D.M.; Validation, W.Z.; Visualisation, Q.F., and W.Z.; Writing—original draft, Q.F.; Writing—review & editing, D.M. All authors have read and agreed to the published version of the manuscript.

Funding

This study is supported by the Ministry of Education of the People’s Republic of China (No. 22YJC840038).

Data Availability Statement

The original contributions presented in this study are included in the article. Further inquiries can be directed to the corresponding author.

Conflicts of Interest

The authors declare no conflicts of interest.

Abbreviations

Z m The distance from the cold air outlet to the heading face
T 0 The cold air outlet temperature
ZThe distance to the heading face
FThe circulating airflow circulation rate
Q d The fresh air volume

References

  1. Xu, Y.; Li, Z.; Chen, Y.; Jia, M.; Zhang, M.; Li, R. Synergetic mining of geothermal energy in deep mines: An innovative method for heat hazard control. Appl. Therm. Eng. 2022, 210, 118398. [Google Scholar] [CrossRef]
  2. Sobolewski, A.; Młynarczyk, M.; Konarska, M.; Bugajska, J. The influence of air humidity on human heat stress in a hot environment. Int. J. Occup. Saf. Erg. 2021, 27, 226–236. [Google Scholar] [CrossRef] [PubMed]
  3. Dong, L. Research on the transformation technology of mine ventilation system. Inn. Mong. Coal Econ. 2022, 15, 44–46. [Google Scholar] [CrossRef]
  4. Nie, L.X.; Wang, F.Y. Application of controllable circulation ventilation system in low-gas mine. Coal Mine Saf. 2011, 42, 76–78. [Google Scholar] [CrossRef]
  5. Zhang, A.M.; Ye, Y.; Chen, Q.G. Thermal hazard control and cooling technology application in deep mines. China Min. Eng. 2024, 53, 72–78. [Google Scholar] [CrossRef]
  6. Saindon, J.P. Controlled Recirculation of Exhaust Ventilation in Canadian Mines; University of British Columbia: Vancouver, BC, Canada, 1987. [Google Scholar]
  7. Lee, R.D.; Longson, I. Controlled recirculation of mine air in working districts. Mine Vent. Soc. S. Afr. 1987, 40, 13–21. [Google Scholar]
  8. Longson, I.; Lee, R.D.; Lowndes, I.S. The Feasibility of Controlled Air Recirculation Around Operating Long Wall Coal Faces. In Proceedings of the 2nd U.S. Mine Ventilation Symposium, Reno, NV, USA, 23–25 September 1985; Mackay School of Mine University of Nevada: Reno, NV, USA, 1985. [Google Scholar]
  9. Baines, P. Auxiliary Ventilation Utilizing Recirculation. Colliery Guard. 1988, 1985, 236. [Google Scholar]
  10. Pickering, A.J.; Aldred, R. Controlled Recirculation of Ventilation a Means of Dust Control in Face Advance Headings. Min. Eng. 1977, 190, 329–345. [Google Scholar]
  11. Lei, Y. Numerical simulation of controlled recirculation ventilation technology in mine excavation faces. Coal Chem. Ind. 2021, 44, 94–96. [Google Scholar] [CrossRef]
  12. Jiang, Q.S.; Guo, J.N.; Li, Z.Y.; Peng, T. Applied research of controlled recirculation ventilation system in mine ore-pass systems. Hunan Nonferrous Met. 2024, 40, 77–80. [Google Scholar]
  13. Nie, X.X.; Zhao, H.R.; Fu, X.Y.; Gao, J.; Guo, J.P. Research on deep mine controlled recirculation ventilation system based on high airflow integrated purification technology. Met. Mine 2021, 2, 201–208. [Google Scholar] [CrossRef]
  14. Hu, Y.M. Effect analysis of controlled recirculation air application in low-gas mines. Energy Technol. Manag. 2019, 44, 17–18. [Google Scholar]
  15. Pritchard, C.J.; Scott, D.F.; Noll, J.D.; Voss, B.; Leonis, D. Investigation of induced recirculation during planned ventilation system maintenance. Min. Eng. 2014, 66, 43. [Google Scholar] [PubMed]
  16. Wang, W.; Zhang, C.; Yang, W.; Xu, H.; Li, S.; Li, C.; Ma, H.; Qi, G. In Situ Measurements and CFD Numerical Simulations of Thermal Environment in Blind Headings of Underground Mines. Processes 2019, 7, 313. [Google Scholar] [CrossRef]
  17. Wang, J.; Jiang, C.; Zhou, X.; Kang, J.; Yu, S.; Bai, G. Head-neck local ventilation mode for long-narrow mine working face. Sci. Rep. 2024, 14, 19663. [Google Scholar] [CrossRef] [PubMed]
  18. Sasmito, A.P.; Kurnia, J.C.; Birgersson, E.; Mujumdar, A.S. Computational evaluation of thermal management strategies in an underground mine. Appl. Therm. Eng. 2015, 90, 1144–1150. [Google Scholar] [CrossRef]
  19. Huang, C.H.; Li, Z.L.; Li, J.L.; Cheng, C.L. Heat dissipation effect analysis of mobile artificial cooling equipment in high-temperature blind headings. Min. Technol. 2022, 22, 135–138. [Google Scholar] [CrossRef]
  20. Wang, T.; Wei, Y.; Ou, S.; Jin, L.; Wang, S.; Liu, J.; Zhang, G.; Zhou, Y.; Lin, M. Multistage cooling system for temperature reduction of the working face in deep coal mines: A technical-economic evaluation. Case Stud. Therm. Eng. 2023, 45, 102908. [Google Scholar] [CrossRef]
  21. Zhang, C.; Yuan, S.; Zhang, N.; Li, C.; Li, H.; Yang, W. Dust-suppression and cooling effects of spray system installed between hydraulic supports in fully mechanized coal-mining face. Build. Environ. 2021, 204, 108106. [Google Scholar] [CrossRef]
  22. Zhang, Z.K. Simulation and application of air temperature in high temperature coal mining face. Sci. Technol. Innov. 2020, 12, 147–148. [Google Scholar]
  23. Li, Z.; Wang, J.; Xu, Y.; Li, G.; Yuan, T.; Zhang, M. Heat hazard control in excavation engineering: Numerical simulation of heat transfer characteristics of high temperature tunnel with movable thermal insulation layer. Therm. Sci. Eng. Prog. 2022, 34, 101393. [Google Scholar] [CrossRef]
  24. Toraño, J.; Torno, S.; Menéndez, M.; Gent, M. Auxiliary ventilation in mining roadways driven with roadheaders: Validated CFD modelling of dust behaviour. Tunn. Undergr. Space Technol. 2011, 26, 201–210. [Google Scholar] [CrossRef]
  25. Huang, Y.; Hu, H.; Li, B.; Zheng, X.; Long, Y.; Lv, C. Study on ore dust pollution diffusion and new dust removal system in drawing funnel operation of metal mine. Powder Technol. 2024, 448, 120242. [Google Scholar] [CrossRef]
  26. Ma, D.H.; Li, Z.M.; Zuo, C.; Tong, L.B.; Tang, Y.L. Numerical simulation and optimization study on dust-exhausting ventilation parameters in blind excavation tunnels. Min. Technol. 2023, 23, 217–221. [Google Scholar] [CrossRef]
  27. Li, Z.; Zhao, S.; Li, R.; Huang, Y.; Xu, Y.; Song, P. Increasing Oxygen Mass Fraction in Blind Headings of a Plateau Metal Mine by Oxygen Supply Duct Design: A CFD Modelling Approach. Math. Probl. Eng. 2020, 2020, 8541909. [Google Scholar] [CrossRef]
  28. Shen, Q.X. Numerical simulation of multi-dust-source excavation dust diffusion patterns based on Fluent. Min. Eng. 2024, 12, 765–772. [Google Scholar]
  29. Pu, H.; Xu, J.C.; Bian, Z.F.; Holger, S. Research status and progress of geothermal energy utilization in closed/abandoned mines. J. China Coal Soc. 2022, 47, 2243–2269. [Google Scholar] [CrossRef]
  30. Bai, Y.F.; Wang, A.Q.; Yang, Z.X. Research and application of mine controlled recirculation ventilation technology at Wangjiazhuang Mine. Shandong Coal Sci. Technol. 2005, 1, 60–61. [Google Scholar]
  31. GB 16423-2020; Safety Regulations for Metal and Non-Metal Mines. National Standard of China: Beijing, China, 2018; p. 44.
  32. Xiu, Z.; Nie, W.; Yan, J.; Chen, D.; Cai, P.; Liu, Q.; Du, T.; Yang, B. Numerical simulation study on dust pollution characteristics and optimal dust control air flow rates during coal mine production. J. Clean. Prod. 2020, 248, 119197. [Google Scholar] [CrossRef]
  33. Zhao, Z.; Xu, H.; Liu, G.; Liu, F.; Wang, G. A robust numerical method for modeling ventilation through long tunnels in high temperature regions based on 1D pipe model. Tunn. Undergr. Space Technol. 2021, 115, 104050. [Google Scholar] [CrossRef]
  34. Guo, C.Q.; Tao, W.G.; Zhang, Y.R.; Zhao, X.S.; Miao, D.J. Optimization study on air cooler position and airflow parameters in coal mining face. Saf. Coal Mines 2024, 55, 84–90. [Google Scholar] [CrossRef]
  35. Patankar, N.A.; Joseph, D.D. Modeling and numerical simulation of particulate flows by the Eulerian–Lagrangian approach. International journal of multiphase flow. Int. J. Multiph. Flow 2001, 27, 1659–1684. [Google Scholar] [CrossRef]
  36. Xin, S.; Zhang, L.; Zhang, Q.; Wang, B.Q.; Jian, J.C. Research on cooling technology for ultra-long coal mining face. Coal Technol. 2017, 36, 98–100. [Google Scholar] [CrossRef]
  37. Miao, D.; Chen, X.; Ji, J.; Lv, Y.; Zhang, Y.; Sui, X. New Technology for Preventing and Controlling Air Leakage in Goaf Based on the Theory of Wind Flow Boundary Layer. Processes 2022, 10, 954. [Google Scholar] [CrossRef]
Figure 1. Thermal conductivity model of a microelement in a rectangular coordinate system.
Processes 13 01374 g001
Figure 2. Controlled circulation ventilation schematic.
Processes 13 01374 g002
Figure 3. Schematic diagram of spent air reuse treatment equipment.
Processes 13 01374 g003
Figure 4. Controlled circulation ventilation arrangement.
Processes 13 01374 g004
Figure 5. Model diagram of the excavation face.
Processes 13 01374 g005
Figure 6. Mesh delineation results of the model (a) Model mesh quality analysis (b) Model meshing results.
Processes 13 01374 g006
Figure 7. Comparison of simulated and measured values for three measurement points.
Processes 13 01374 g007
Figure 8. Distribution of airflow at different distances from the end face under controlled circulation ventilation.
Processes 13 01374 g008
Figure 9. Spatial variation rule of dust in the roadway (a) Change of dust in 60–150 s; (b) Trace map of airflow in the tunnel; (c) Distribution of dust concentration before and after enabling equipment.
Processes 13 01374 g009
Figure 10. Effect of dust removal at different circulation rates (a) Dust distribution at Z = 6 m section location; (b) Average dust concentration at different sections; (c) Dust distribution along the roadway.
Processes 13 01374 g010
Figure 11. Dust removal effect when equipment outlet position Zm = 5 m, Zm = 8 m, Zm = 11 m (a) Distribution of tunnel wind flow field; (b) Distribution of dust in different cross-sections; (c) Average dust concentration in cross-section and height of respiratory zone in the operation area.
Processes 13 01374 g011
Figure 12. Circulating ventilation temperature simulation.
Processes 13 01374 g012
Figure 13. Temperature distribution across roadway cross-sections at different locations.
Processes 13 01374 g013
Figure 14. Distribution of tunnel temperature at cold air outlet position Zm = 5 m, Zm = 8 m, Zm = 11 m. (a) Contour map of temperature field distribution; (b) Air temperature distribution curve at roadway centerline.
Processes 13 01374 g014
Figure 15. Temperature distribution in the tunnel at different ventilation circulation rates. (a) Contour map of temperature field distribution; (b) Air temperature distribution curve at roadway centerline.
Processes 13 01374 g015
Figure 16. Temperature variation curves of the roadway at different outlet air temperatures T0.
Processes 13 01374 g016
Figure 17. Schematic layout of measuring points in the lane.
Processes 13 01374 g017
Table 1. Boundary condition parameter settings.
NameTypeParameter SettingsNameTypeParameter Settings
Energy equationOn/GravityY-axis direction−9.81
Turbulence equation k ε RealisableMaterialRocksDensity 2600 kg/m3.
Specific heat capacity 8.78 J/kg °C.
Thermal conductivity 2 W/m °C
Inlet boundaryEntrance typeVelocity inletWall-boundaryShear condition (physics)No Slip
Velocity10 m/sTemperature32 °C
Temperature25 °CDPMReflect
Outlet boundaryType of exportPressure outletSolution methodPressure-velocity couplingCoupled
Gauge pressure (Pa)0Turbulent kinetic energySecond-order windward
DPMEscapeTurbulent diffusivitySecond-order windward
Discrete phaseInjection typeSurfaceDust parametersTotal flow rate0.02 kg/s
MaterialRocksMinimum diameter/m8.5 × 10−7
Diameter distributionRosin-ramblerMaximum diameter /m2.185 × 10−5
Table 2. Temperature and humidity at each measurement point before and after applying the equipment.
Measurement PointPre-ApplicationPost-Application
Temperature (°C)Humidity
(%)
Dust Concentration
(g/m3)
Temperature (°C)Humidity
(%)
Dust Concentration
(g/m3)
1#28.690.60.262325.170.20.1007
5#28.690.80.215825.472.40.1295
10#2990.80.392625.974.30.1988
15#29.191.20.505326.176.10.2821
20#29.391.30.322426.477.430.1549
25#29.492.70.305027.084.30.1645
30#29.593.10.358927.285.80.2094
35#29.693.10.505227.287.40.3305
40#29.6930.439527.388.70.2874
Disclaimer/Publisher’s Note: The statements, opinions and data contained in all publications are solely those of the individual author(s) and contributor(s) and not of MDPI and/or the editor(s). MDPI and/or the editor(s) disclaim responsibility for any injury to people or property resulting from any ideas, methods, instructions or products referred to in the content.

