Article

Valorization of Residual Biomass from Sargassum filipendula for the Extraction of Phlorotannins and Pigments Using Eutectic Solvents

by
Pedro Afonso Vasconcelos Paes Mello
1,
Cristiane Nunes da Silva
2 and
Bernardo Dias Ribeiro
1,2,*
1
Department of Biochemical Engineering, School of Chemistry, Universidade Federal do Rio de Janeiro, Rio de Janeiro 21941-598, RJ, Brazil
2
Food Science Graduation Program, Institute of Chemistry, Universidade Federal do Rio de Janeiro, Rio de Janeiro 21941-598, RJ, Brazil
*
Author to whom correspondence should be addressed.
Processes 2025, 13(5), 1345; https://doi.org/10.3390/pr13051345
Submission received: 21 March 2025 / Revised: 14 April 2025 / Accepted: 23 April 2025 / Published: 28 April 2025
(This article belongs to the Special Issue Green Separation and Purification Processes)

Abstract

:
Sargassum filipendula is a marine macroalgae, also known as brown algae. These species contain significant amounts of polysaccharides, such as alginates, and phenolic compounds, including phlorotannins, with excellent biological properties. This study evaluated the extraction of bioactive compounds from the residual biomass of Sargassum filipendula using deep eutectic solvents based on alkanol amines combined with polyols. The residual biomass presented a content of 7.36% protein, 1.11% lipids, 20.51% ash, 14.88% moisture, 50.25% total fibers, and 5.89% alginate. Preliminary screening identified N, N-(dimethylamino)-ethanol: benzyl alcohol (1.30:1) and N, N-(dimethylamino)-ethanol:1,3-propanediol (1.83:1) as the most efficient solvents for the extraction of bioactive compounds. The optimization process showed that the temperature and solid–liquid ratio significantly influenced (p < 0.05) the extraction of total phenolic compounds, phlorotannins, and the content of photosynthetic pigments. Intermediate temperatures (74.4 °C for N, N-(dimethylamino)-ethanol: benzyl alcohol (1.30:1) and 68.4 °C for N, N-(dimethylamino)-ethanol:1,3-propanediol (1.83:1), and a lower solid-to-liquid ratio (0.03) were optimal conditions to extract the low-pigment phlorotannins selectively. In contrast, higher temperatures (120 °C) maximized the extraction of phlorotannins and photosynthetic pigments. N, N-(dimethylamino)-ethanol: benzyl alcohol (1.30) extracted 110.64 mg PGE/g phlorotannins and 78.15 mg GAE/g phenolics, while N, N-(dimethylamino)-ethanol:1,3-propanediol (1.83:1) produced 21.57 mg PGE/g and 72.89 mg GAE/g, respectively. The extraction of photosynthetic pigments reached a maximum yield at 120 °C, using N, N-(dimethylamino)-ethanol: benzyl alcohol (1.30:1), with a content of 21.61 µg/g of chlorophylls and 38.11 µg/g of pheophytins, while N, N-(dimethylamino)-ethanol: 1,3-propanediol (1.83:1) provided content of 17.76 µg/g and 36.32 µg/g, respectively. The extracts exhibited antioxidant activity with 0.69 mg TE/mL in scavenging DPPH radicals, 24.42 mg TE/mL in scavenging ABTS radicals, and 2.26 mg TE/mL of iron-reducing antioxidant power. These results demonstrate the potential of DESs for the sustainable recovery of bioactive compounds from Sargassum filipendula residual biomass.

1. Introduction

The growing interest in the marine ecosystem is due to the diversity of bioactive compounds in algae and essential organisms, representing 20% to 30% of global aquaculture production. Macroalgae are one of the main marine organisms, generally clustered on beaches due to the natural movement of the sea [1]. Worldwide, the production of marine macroalgae reached 36.5 million tons in 2022, resulting in an increase of 4.1% compared to 2020 [1,2]. However, 75% of this biomass is discarded after the hydrocolloid and polysaccharide extraction process, generating significant volumes of waste. Despite little exploration, this waste has the potential for valorization due to bioactive compounds, such as phlorotannins, pigments, and other phenolic compounds [3,4]. The valorization of seaweeds emerges as a sustainable alternative for entirely using this residual biomass, enabling its application in the pharmaceutical, cosmetic, food, bioenergy, and biofuel industries, as illustrated in Figure 1 [5].
There are three macroalgae types, distinguished by the different photosynthetic pigments in their cells and classified as green, red, and brown macroalgae. Among the brown macroalgae, the species belonging to the Sargassaceae family, such as Sargassum fusiform and Sargassum filipendula, are considered an excellent source of polysaccharides (fucoidans and alginates) and phenolic compounds, particularly phlorotannins [6,7]. These biomolecules have several biological properties, including antioxidant, antimicrobial, antiallergic, anti-inflammatory, and anticancer activities that have effects that promote human health [6]. The species Sargassum filipendula, also known as Caribbean Sargassum, is found along the coasts of Northeastern and Southeastern Brazil. An estimated 20 million tons of these brown algae were produced in the Great Atlantic Sargassum Belt, formed by Brazil, the Gulf of Mexico, the Caribbean, and Africa in 2018 [7]. The production is intended for obtaining biostimulants, biofertilizers, and composite materials. In addition, due to its high content of phlorotannins and other bioactive compounds, it can be applied in the food, cosmetic, and pharmaceutical industries, as an ingredient with potential antioxidant and antiaging activity [7,8]. However, the recovery of these compounds can be hampered by factors, such as physical barriers formed by cellulose and lignin in the algal cell wall, as well as interactions between metabolites, proteins, and lipids in the algal matrix, which can impede their release and stability [9].
Several extraction methods have been employed for the recovery of secondary metabolites, ranging from conventional approaches such as solid–liquid extraction (SLE), enzymatic hydrolysis, and fermentation to more advanced techniques, such as Microwave-Assisted Extraction (MAE), Ultrasound-Assisted Extraction (UAE), and supercritical fluid extraction (SFE) [10,11]. However, many of these methods have limitations, including toxic solvents, low selectivity, and challenges associated with releasing compounds trapped in the algal matrix due to interactions with proteins and lipids [9]. Deep eutectic solvents (DESs) have emerged as a sustainable alternative for extracting target metabolites. DESs combine two components: a hydrogen bond acceptor and a hydrogen bond donor. Their advantages, such as biodegradability, low toxicity, high stability, and a high solubilization power of polar and non-polar compounds, make them attractive for application in extraction processes [4,12]. The selection of hydrogen bond acceptors and donors with strongly alkaline and pH-stabilizing properties can increase extraction selectivity, promoting the solubilization of phlorotannins through the deprotonation of hydroxyl groups, forming water-soluble phenolate ions [13]. However, their application in residual biomass is still little explored, despite their potential to extract flavonoids and tannins from plant matrices [5,14].
This study aims to contribute to developing more selective and environmentally friendly methods for the sustainable use of Sargassum filipendula residual biomass, aligning with the principles of the circular economy and promoting the comprehensive use of its high-value secondary metabolites. Therefore, the objective of the present study is to extract total phenolic compounds, phlorotannins, and pigments using deep eutectic solvents based on alkanol amines combined with polyols. The two best-selected DESs were used to optimize the extraction conditions of temperature (T) and solid–liquid ratio (S/L) by Central Composite Design (CCD) and response surface methodology (RSM). The antioxidant activity of the extracts was evaluated by DPPH radical scavenging (DPPH), ABTS radical scavenging, and ferric-reducing antioxidant power (FRAP) assay.

2. Materials and Methods

2.1. Chemicals and Reagents

The reagents used to carry out the experiments included, N,N-(Dimethylamino)-ethanol (DMAE) (≥99.5%), 2-(Methylamino)-ethanol (MAE) (≥98%), benzyl alcohol (BzOH) (≥99%), Cinnamyl Alcohol (CA) (≥98%), 1,3-Propanediol (13PDO), Sorbitol (Sor) (≥98%), Diethanolamine (DEA) (≥98.5%), Folin–Ciocalteu Reagent (≥99%), 1,2-Propanediol (12PDO) (≥99%), 2-Amino-2-methyl-1-propanol (AMP) (≥95%), Sodium Carbonate 1M (Na2CO3), and Sodium Hydroxide Pellets (NaOH) (≥98%), and were acquired by Sigma Aldrich (Barueri, São Paulo, Brazil); Glycerol (GLY) (≥99.5%), Chloroform (CHCl3) (≥99.8%) were acquired by Isofar (Duque de Caxias, Rio de Janeiro, Brazil); Methanol (MeOH) (≥99.9%) was purchased from Vetec Fine Chemicals (Barueri, São Paulo, Brazil); Milli-Q Water (H2O), and Commercial Ethanol (≥95%). All reagents used were of analytical grade.

2.2. Raw Material

The residual biomass was collected on the beaches of Itapioca, Fortaleza—CE, Brazil, where it was used in a previous process focused on the alkaline extraction of alginate and other polysaccharides. The material was freeze-dried and ground to achieve a desired diameter of Mesh 35, then stored in a sealed container at room temperature. Moisture content was determined gravimetrically. Proteins were quantified using the Kjeldahl method with a nitrogen digester and distiller. Ash content was obtained by heating samples at 555 °C for 18 h in a muffle furnace. The lipids were extracted by the Soxhlet method, using petroleum ether as solvent (100 mL) at 80 °C (corresponding to the solvent’s boiling point) for 1 h and 40 min. Total fibers (soluble and insoluble) were determined using an enzymatic kit (α-amylase, protease and amyloglucosidase) for enzymatic digestion of the samples, with subsequent precipitation of the fiber components in aqueous ethanol. All these analyses were performed according to the methodology proposed by Horwitz and Latimer [15]. Alginate was extracted using 0.2 M Na2CO3 and quantified by the Dische method, employing carbazole and glucuronolactone as standards. The analyses were conducted following the methodology proposed by Dische [16,17].

2.3. Preparation of DES

Deep eutectic solvents (DESs) were prepared by combining hydrogen bond acceptors (HBA: DMAE, MAE, AMP, DEA) and hydrogen bond donors (HBD: BzOH, CinnOH, GLY, Sor, 12PDO, 13PDO) (Figure 2). The molar ratios were determined based on COSMO-RS modeling (Table 1). Precise amounts of each reagent were weighed and mixed in 2 mL Eppendorf tubes. Heating and stirring were performed at 80 °C and 900 rpm in a ThermoMixer® C (Eppendorf) for 2–3 hs until complete homogenization.

2.3.1. pH Analyzer

The pH measurement (Tecnal Tec-5) was performed on the modeled eutectic solvents to evaluate whether they exhibited alkaline characteristics, aiming to replicate pH conditions with basic properties.

2.3.2. Thermogravimetric Analysis (TGA)

The objective of the thermogravimetric analysis (TGA) was to evaluate the thermal decomposition of the produced solvents, aiming to identify the temperature ranges where extraction could occur without degradation and/or volatilization of the eutectic solvent or its components. The equipment used was the TGA-50 Plus (Shimadzu), operated in an inert atmosphere with a nitrogen (N2) flow rate of 60 mL/min. Samples weighing between 8 to 10 mg were placed in a platinum crucible, with the operating variables for the thermal analysis conducted up to a maximum temperature of 500 °C, at a constant heating rate of 10 °C/min.

2.3.3. DSC Analyzer

Thermal analyses were performed using a differential scanning calorimeter on the DSC-60 Plus Shimadzu equipment, with the aim of evaluating the melting temperatures of the eutectic solvents. The samples were conditioned in an aluminum crucible, with the temperature ranging from −100 to 60 °C, a heating rate of 5 °C/min, and a cooling rate of −10 °C/min, under a nitrogen atmosphere with a gas flow rate of 100 mL/min. The DSC results indicated a typical behavior of deep eutectic solvents, demon-strated by the absence of peaks during heating at the melting points of the individual reagents (DMAE = −70 °C, BzOH = −17 °C, and 13PDO = −27 °C). Since the DES did not solidify within the experimental thermal range of 60 °C to −100 °C, it was not possible to determine the melting point, which prevented the calculation of the ∆H of formation and the construction of the phase diagram. However, the analysis confirmed the formation of the eutectic, in accordance with the molar ratios predicted by COSMO-RS and suggested a plausible explanation for the low viscosity observed in the DES [18].

2.4. Extraction Method

Extraction was performed with 100 mg of residual biomass of Sargassum filipendula per solvent (1:10, m/m) at 60 °C for 2 h with stirring at 900 rpm. For comparison, conventional solvents (MeOH, CHCl3, H2O, EtOH: H2O (7:3)) and an alkaline solution (NaOH: CHCl3:H2O [0.01:0.5:0.5]) were used. Pure and water-containing DESs (30% water) were also tested, as adding 20–30% (m/m) water can optimize the extraction of polar and non-polar compounds without significantly altering solvent structure [14,18,19]. After extraction, the samples were centrifuged (10.000 rpm, 10 min, 25 °C), and ethanol was added to the supernatant (1/1, v/v), homogenized at 3000 rpm for 1 min, and centrifuged again. All the samples were analyzed concerning total phenolic and tannin compounds, as well as pigment concentration.

2.5. Total Phenolic Compounds (TPC)

Total phenolic content (TPC) was quantified using the Folin–Ciocalteu method [20]. In this method, 100 µL of Folin–Ciocalteu reagent (10%, v/v) was added to the sample and allowed to react for 3 min. Then, 200 µL of Na2CO3 (1.0 M) was added to alkalize the medium, promoting chromogen formation for spectrophotometric reading. Gallic Acid Equivalent (GAE) (1.0 mg/mL) was used as the standard.

2.6. Total Tannins Compounds (TTC)

Total phlorotannins were quantified using polyvinylpolypyrrolidone (PVPP), which adsorbs these compounds via hydrogen bonding with their hydroxyl groups. PVPP was added to the diluted sample at a 1:10 (m/m) ratio [21]. The alkaline medium was acidified with 37% HCl (0.1:1, v/v) to facilitate adsorption, maintaining pH < 7 [22,23]. The process occurred at 15 °C with stirring at 700 rpm for 20 min, followed by centrifugation. Quantification was performed using the Folin–Ciocalteu method, with Phloroglucinol (PGE) as the standard, although GAE is also mentioned in the literature [24].

2.7. Total Chlorophyll and Pheophytin

Total chlorophyll and pheophytin were quantified using Moran’s equations, chosen for their suitability for amine-based solvents like N,N-dimethylformamide (DMF). DMF was selected for its high polarity and ability to stabilize chlorophylls. These equations serve as a reference for evaluating their applicability to similar polar solvents, providing close results [25,26,27].

2.8. DPPH Free Radical Scavenging

The DPPH (2,2-diphenyl-1-picrylhydrazyl) assay evaluates antioxidant capacity based on the reduction of the DPPH radical (purple, absorbance at 515 nm) to a colorless form via electron or hydrogen donation by antioxidants. In the adapted method [28], 2.4 mg of DPPH was diluted in 100 mL of methanol. For the assay, 45 µL of the sample was mixed with 1800 µL of DPPH solution and incubated in the dark for 30 min. Absorbance was measured at 515 nm using a spectrophotometer. The original method, which used 150 µL of extract and 5850 µL of DPPH, was optimized to reduce volumes. Absorbance readings were taken every 5 min until three consecutive measurements stabilized, indicating reaction completion. The antioxidant activity of the extracts was expressed in mg Trolox equivalent per milliliter (mg TE/mL).

2.9. ABTS Free Radical Scavenging

The ABTS (2,2′-azino-bis(3-ethylbenzothiazoline-6-sulfonic acid)) assay measures antioxidant capacity by interaction with ABTS•+ radicals, which exhibit blue-green coloration and absorb at 734 nm. Antioxidants reduce the radical, decreasing absorbance. In the adapted method [29], a solution of 7 mM ABTS (192 mg in 50 mL water) and 140 mM potassium persulfate (378.4 mg in 10 mL water) was prepared and stored under refrigeration. To generate ABTS•+, 5 mL of ABTS was mixed with 88 µL of persulfate and left in the dark for 16 h. The solution was diluted in ethanol to achieve an absorbance of 0.75–0.65 at 764 nm. For analysis, 15 µL of the sample or Trolox standard was added to 1500 µL of ABTS solution, incubated for 6 min in the dark, and measured at 734 nm. The antioxidant activity of the extracts was expressed in mg Trolox equivalent per milliliter (mg TE/mL).

2.10. FRAP Antioxidant Activity Assay

The FRAP (Ferric Reducing Antioxidant Power) assay evaluates antioxidant capacity by reducing ferric ions (Fe3+) to ferrous ions (Fe2+), forming an intense blue complex. For the assay, a solution of ferrous sulfate (2 mM) was prepared by dissolving 27.8 mg in 50 mL water, a solution of ferric chloride (20 mM) with 5.4 g in 1 L water, and an acetate buffer (0.3 M, pH 3.6) with 3.1 g sodium acetate and 16 mL glacial acetic acid in 1 L water. The FRAP reagent was prepared by mixing 10 mL acetate buffer, 1.0 mL TPTZ 10 mM, and 1.0 mL ferric chloride 20 mM, and used immediately. For analysis, 15 µL of the sample was mixed with 285 µL FRAP reagent, homogenized, and left for 30 min. Absorbance was measured at 593 nm, using FRAP reagent as the blank [30,31]. The antioxidant activity of the extracts was expressed in mg Trolox equivalent per milliliter (mg TE/mL).

2.11. COSMO-RS Computational Details

Molar ratios between HBA and HBD were modeled using BIOVIA COSMOtherm 2024 (Dassault Systems, Paris, France) which simulated binary mixtures to estimate the molar composition corresponding to the minimum eutectic point temperature, using experimental data on melting temperatures and enthalpies of individual components [32]. The activity coefficient of solvents was calculated using COSMO-RS, which requires geometry optimization and charge density calculations via DFT. Each molecule was optimized in TmoleX 2024 (TURBOMOLE interface) using the COSMO-BP-TZVP model, with the def-TZVP basis set, DFT (B-P86 functional), and COSMO solvation model. COSMO-RS calculations were performed in COSMOtherm 2024 with the BP_TZVP_24.ctd parameterization. As COSMO-RS is unsuitable for ionic species, salts used as HBA were treated as ion pairs and optimized in TmoleX. DESs were modeled as binary mixtures of HBD and HBA in fixed stoichiometric ratios. The solubility of compounds in a solvent is inversely proportional to their activity coefficient in the system. Thus, COSMO-RS was used to predict the activity coefficient of secondary metabolites, such as chlorophyll, pheophytin, and phlorotannins, in 24 DESs at 30, 45, and 60 °C, considering infinite dilution [33,34].

2.12. Experimental Design

To optimize extractions with DESs, a Central Composite Design (CCD) was employed, a response surface methodology was used to evaluate the impact of independent variables on measurable responses. CCD reduces the number of experiments compared to full factorial designs without compromising the identification of linear, interaction, and quadratic effects. The experiment was structured with four factorial points, four axial points, and a center point replicated three times, totaling nine experimental conditions. The center point was performed in triplicate to estimate experimental error and assess reproducibility. Axial points were positioned at (±α, 0) and (0, ±α), using α = 1.414 to ensure model rotatability [35].
Y ^ = β 0 + i n β i x i + i n β i i x i 2 + i = 1 n 1 j = i + 1 n β i j x i x j
In this study, two independent variables were analyzed: temperature (T) and solid-to-liquid ratio (S/L). Temperature ranged from 49.64 °C to 120.36 °C, corresponding to levels −α and +α, respectively, with intermediate values fixed at 60 °C (−1), 85 °C (0), and 110 °C (+1). Similarly, the S/L ratio was adjusted between 0.029 (−α) and 0.171 (+α), with intermediate levels of 0.05 (−1), 0.1 (0), and 0.15 (+1). Phlorotannin responses were modeled using StatSoft Statistica V.12.

2.13. Statistical Test

Each measurement was performed in triplicate, and results are presented as mean values with standard deviations. Analysis of variance (ANOVA) was performed using StatSoft Statistica V.12 to evaluate the significance of differences between means (p < 0.05).
For detailed figures and tables pertaining to the Methods section, please refer to the Appendix A.

3. Results and Discussion

3.1. Biomass

Previously, Sargassum filipendula residual biomass was obtained through the alkaline aqueous extraction of polysaccharides, followed by filtration. In this work, the wet biomass was freeze-dried, ground, and sieved for further characterization. Alkaline extraction is a widely used method to obtain alginate, a structural polysaccharide present in brown algae, which is soluble in alkaline media due to the conversion of the carboxylic groups of alginic acid into their soluble salts [36,37]. The evaluation of the alginate contents in this extraction residual biomass confirmed a significant reduction in relation to the values reported in the literature. Previous studies indicate that the initial alginate content in species of the genus Sargassum varies between 15% and 30%. For example, Rhein-Knudsen et al. [38] reported alginate contents of 22% in Sargassum vulgare and 30% in Sargassum natans. Lee [39] also observed high alginate contents, with 27% in the species Sargassum muticum. Bertagnolli et al. [7] and García-Ríos et al. [40] reported alginate contents in Sargassum filipendula ranging from 15% to 17%. In contrast, in this study, the residual biomass presented an average sodium alginate content of 5.65%. This reduction suggests that the extraction process was efficient in removing alginate, although there is still room for optimization.
The other polysaccharides present in the Sargassum genus include fucoidans and laminarins, which can be considered soluble fibers, and cellulose, which is an insoluble fiber. In the original algal matrix, fucoidan contents vary between 3% and 10% [41], while laminarins represent 5% to 15% [42], and cellulose can correspond to 25–35% [43,44]. In the characterization carried out in this work, the remaining contents of soluble (14.02%) and insoluble (20.58%) fibers indicate that a significant fraction of the soluble fibers and cellulose was extracted, showing that the alkaline extraction process can still be optimized to increase its efficiency. The alkaline extraction of alginate from the residual biomass of the genus Sargassum is mainly influenced by pH, temperature, and extraction time, with pH being the most impactful factor on yield, with high alkaline values (pH 10–12) favoring the conversion of insoluble alginic acid into soluble alginate [45]. However, the combination of high pH with high temperatures or prolonged times can lead to the molecular degradation of alginate by alkaline and thermal hydrolysis, reducing its average molecular viscosity (Mv) and compromising its quality [46,47].
Studies show divergent effects of temperature on alginate extraction: Fawzy et al. [48] found that moderate temperatures (45 °C) and short durations (2.89 h) maximize yield (40%), whereas Mohammed et al. [49] noted that higher temperatures (65 °C) may degrade alginate. However, Mohammed et al. [50] reported that even higher temperatures (80 °C) enhance alkaline penetration into cell walls, increasing solubility. While extraction time has less impact on yield, it may reduce alginate quality when combined with high pH and temperature. Thus, to optimize extraction, a highly alkaline pH is recommended, avoiding extreme temperatures (45–65 °C) and prolonged times (2–3 hs), considering Sargassum species and growth conditions. The Sargassum filipendula residual biomass contains, on average, proteins 7.36% ± 0.0031, lipids 1.11% ± 0.0011, ash 20.51% ± 0.0049, moisture 13.59% ± 0.0081, insoluble fiber 27.21% ± 0.0184, total soluble fiber 23.04% ± 0.0191, and alginate 5.89% ± 0.0035.
Most algae contain all essential amino acids, especially aspartic and glutamic acid, although some limiting amino acids (e.g., threonine, lysine, tryptophan, cysteine, methionine, and histidine) are present in higher levels than in terrestrial plants [51]. In this study, protein content was 7.36%, lower than values reported by Diniz [52] (8.7%) and Tagliapietra [53] (15.31%), likely due to the alkaline hydrolysis used for alginate extraction and natural variation in algae. In Sargassum, proteins, such as globulins and albumins, contribute to structural and metabolic functions [54,55] and contain bioactive peptides with antioxidant, antimicrobial, and antihypertensive properties [56,57]. However, not all nitrogenous compounds are proteins, as free amino acids, pigments, and nucleotides may interfere with conventional protein quantification [58,59,60]. Lipids were found at low levels (1.11%), below those reported by Tagliapietra et al. [53] (3.26%) and Laeliocattleya et al. [61] (2.9%), reflecting environmental influence.
Algae lipids typically consist of PUFAs (polyunsaturated fatty acids), sterols, and pigments, like fucoxanthin and chlorophyll [54,55], while phenolic compounds, like phlorotannins, offer antioxidant and antimicrobial effects [57], though not included in centesimal composition. Moisture content was 14.88%, comparable to Laeliocattleya et al. [61] (15.03%) and within the 10–20% range reported by Hardouin et al. [62]. Ash content was 20.51%, within the 14–44% range [62], and includes minerals, such as Na, Ca, Mg, K, and Si, often linked to sand residues [58,59]. Sargassum also accumulates heavy metals (e.g., Cd, Pb, As), useful for phytoremediation but require caution for food/pharmaceutical use [63].

3.2. DESs Characterization

Of the 24 eutectics produced, only eutectic 5 showed stability issues at room temperature, solidifying. Although this eutectic returns to a liquid state when subjected to higher temperatures, this instability makes it unsuitable for the study. In contrast, the other eutectics exhibited distinct characteristics, particularly regarding viscosity. The eutectics based on DEA (diethanolamine) and AMP (2-amino-2-methyl-1-propanol) combined with polyols, such as glycerol or sorbitol, showed a tendency for high viscosities, a behavior aligned with previous studies highlighting the influence of polyols on the viscosity increase in eutectic solvents. For example, Adeyemi et al. [64] reported viscosities over 200 mPa·s in alkanolamine (such as DEA) systems with choline chloride and glycerol, attributing this effect to intense hydrogen bonding interactions and the branched molecular structure of polyols.
On the other hand, solvents formulated with propanediol, benzyl alcohol, or cinnamic alcohol exhibited significantly lower viscosity, likely due to their lower polarity and the presence of aromatic groups or linear chains that reduce the formation of intermolecular networks. This pattern is supported by Ishaq et al. [65], who observed viscosities between 20 and 50 mPa·s in eutectics containing alcohols as HBD (hydrogen bond donors), emphasizing the relationship between the molecular architecture of the component and the fluidity of the system. Although specific data for the eutectics in this study are not yet available, the comparison with analogous systems suggests that the observed differences are intrinsically linked to the chemical nature of the components, as evidenced in the literature.

3.2.1. pH

The analysis of pH values among the eutectic solvents revealed statistically significant differences (p < 0.05), indicating considerable variations in pH values depending on the alkanolamines used. As illustrated in Table 1, the DMAE-based solvents exhibited the lowest pH values, with an average, while the DEA and MAE-based eutectics showed the highest pH values, and the AMP-based solvents displayed intermediate pH values. Tukey’s analysis comparing the pH values of solvents from each alkanolamine showed no significant difference between DMAE and AMP, nor between DEA and MAE. However, significant differences were observed between DMAE and DEA, DMAE and MAE, and AMP and MAE. After adding 30% H2O to the system, a decrease in pH was observed compared to the eutectics without water addition. However, this change was not enough to alter the high alkalinity condition of the eutectics, keeping the system still in a highly alkaline state (Table 1).

3.2.2. Thermogravimetric Analysis (TGA)

The data in Table 1 show that the thermal stability of the eutectics solvents varies significantly depending on the alkanolamine used. Eutectics solvents with DMAE (boiling point: 135 °C) show initial degradation between 80 °C (DMAE/CinnOH) and 135 °C (DMAE/BzOH), with an average of 105 °C (e.g., DMAE/12PDO: 92.74 °C; DMAE/Sorb: 82.49 °C), reflecting its low thermal resistance associated with high vapor pressure (6.12 mmHg) and volatility. Eutectics solvents with MAE (boiling point: 156 °C) exhibit degradation between 107.33 °C (MAE/CinnOH) and 166.00 °C (MAE/13PDO), with an average close to 130 °C (e.g., MAE/Gly: 114.84 °C; MAE/Sorb: 109.92 °C), indicating intermediate stability. Eutectics solvents with AMP (boiling point: 159 °C) degrade between 102.15 °C (AMP/Sorb) and 150.22 °C (AMP/13PDO), with an average of 118 °C (e.g., AMP/BzOH: 121.85 °C; AMP/Gly: 119.59 °C), a behavior influenced by its moderate viscosity (95.27 cP). In contrast, eutectics solvents with DEA (boiling point: 268.8 °C) stand out for their superior resistance, with degradation starting between 150.2 °C (DEA/12PDO) and 224.61 °C (DEA/Gly), with an average > 170 °C (e.g., DEA/Sorb: 200.99 °C; DEA/CinnOH: 196.99 °C). This stability is attributed to the very low vapor pressure of DEA (<0.01 mmHg) and robust supramolecular interactions with polar HBDs, such as sorbitol (second degradation stage at 327.20 °C) and glycerol (T50% = 208.71 °C), which form dense hydrogen-bonded networks. The choice of HBD is also critical: aromatic alcohols (e.g., benzyl alcohol, boiling point: 205.3 °C) accelerate degradation, while polyols (e.g., sorbitol, boiling point: 296 °C) increase stability, proving that the combination of a high-resistance HBA (DEA) with non-volatile HBDs maximizes thermal performance in demanding applications.

3.3. Extraction

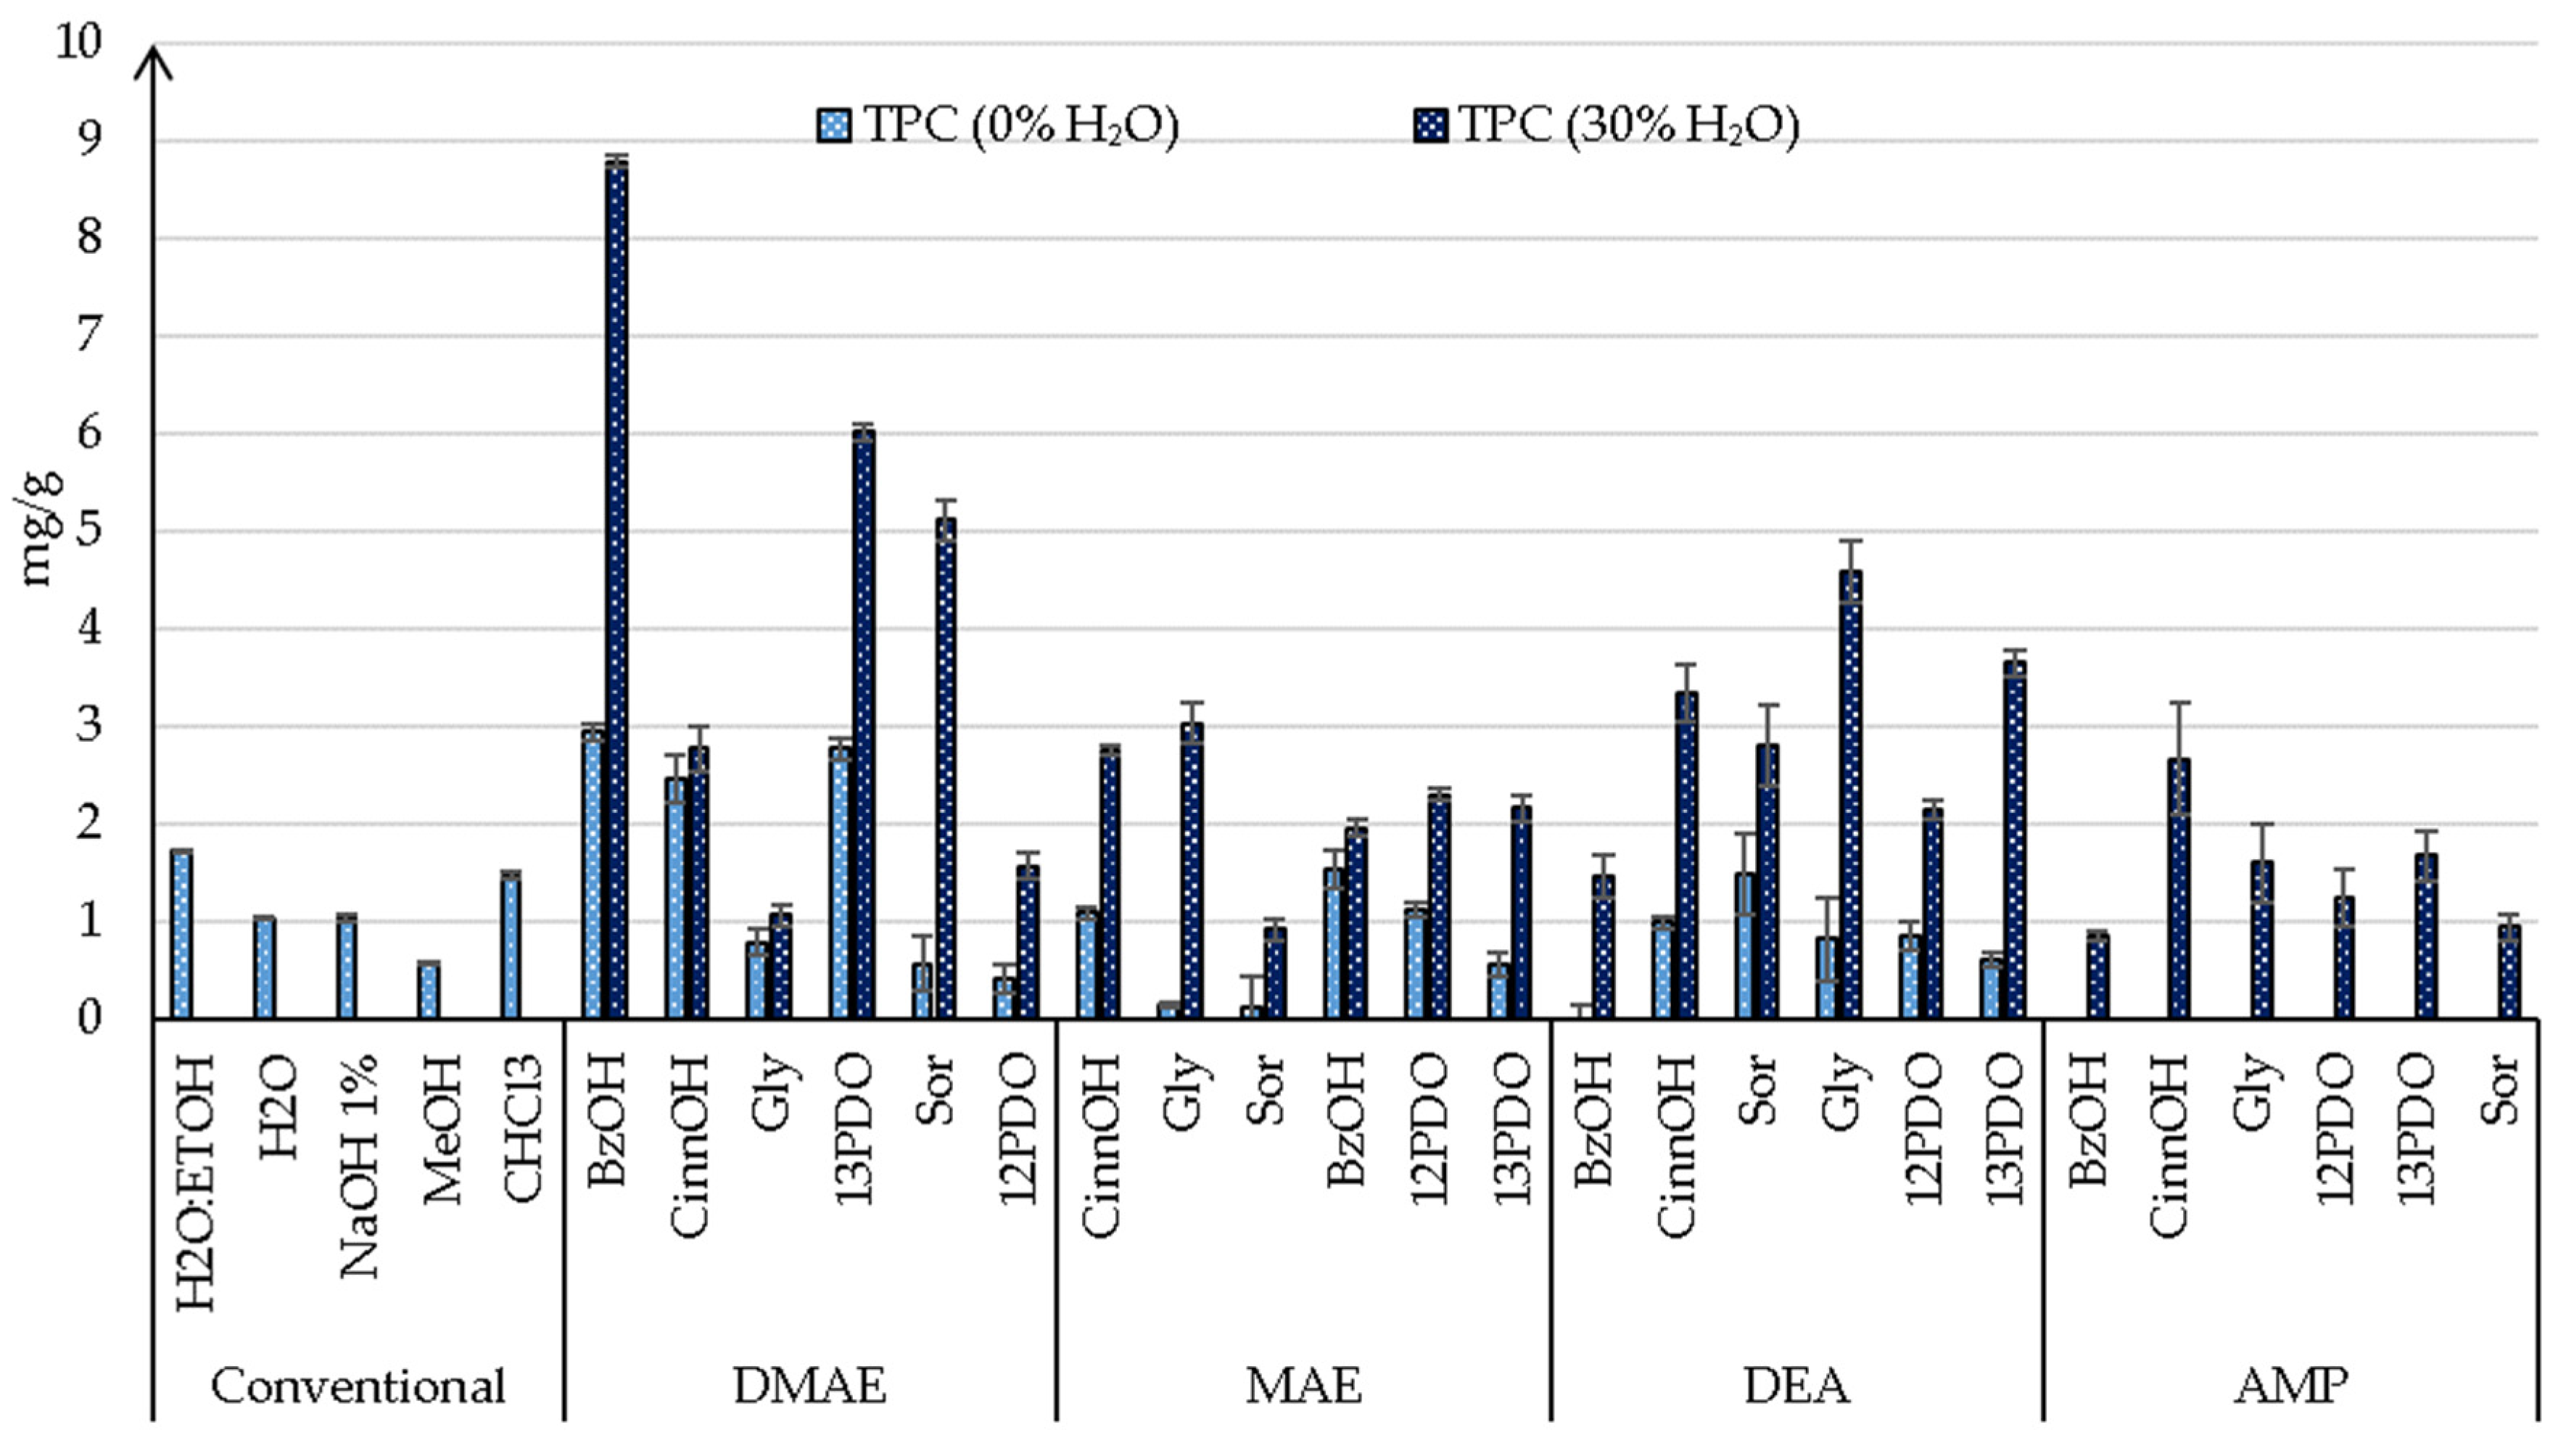
3.3.1. Phenolics Compounds
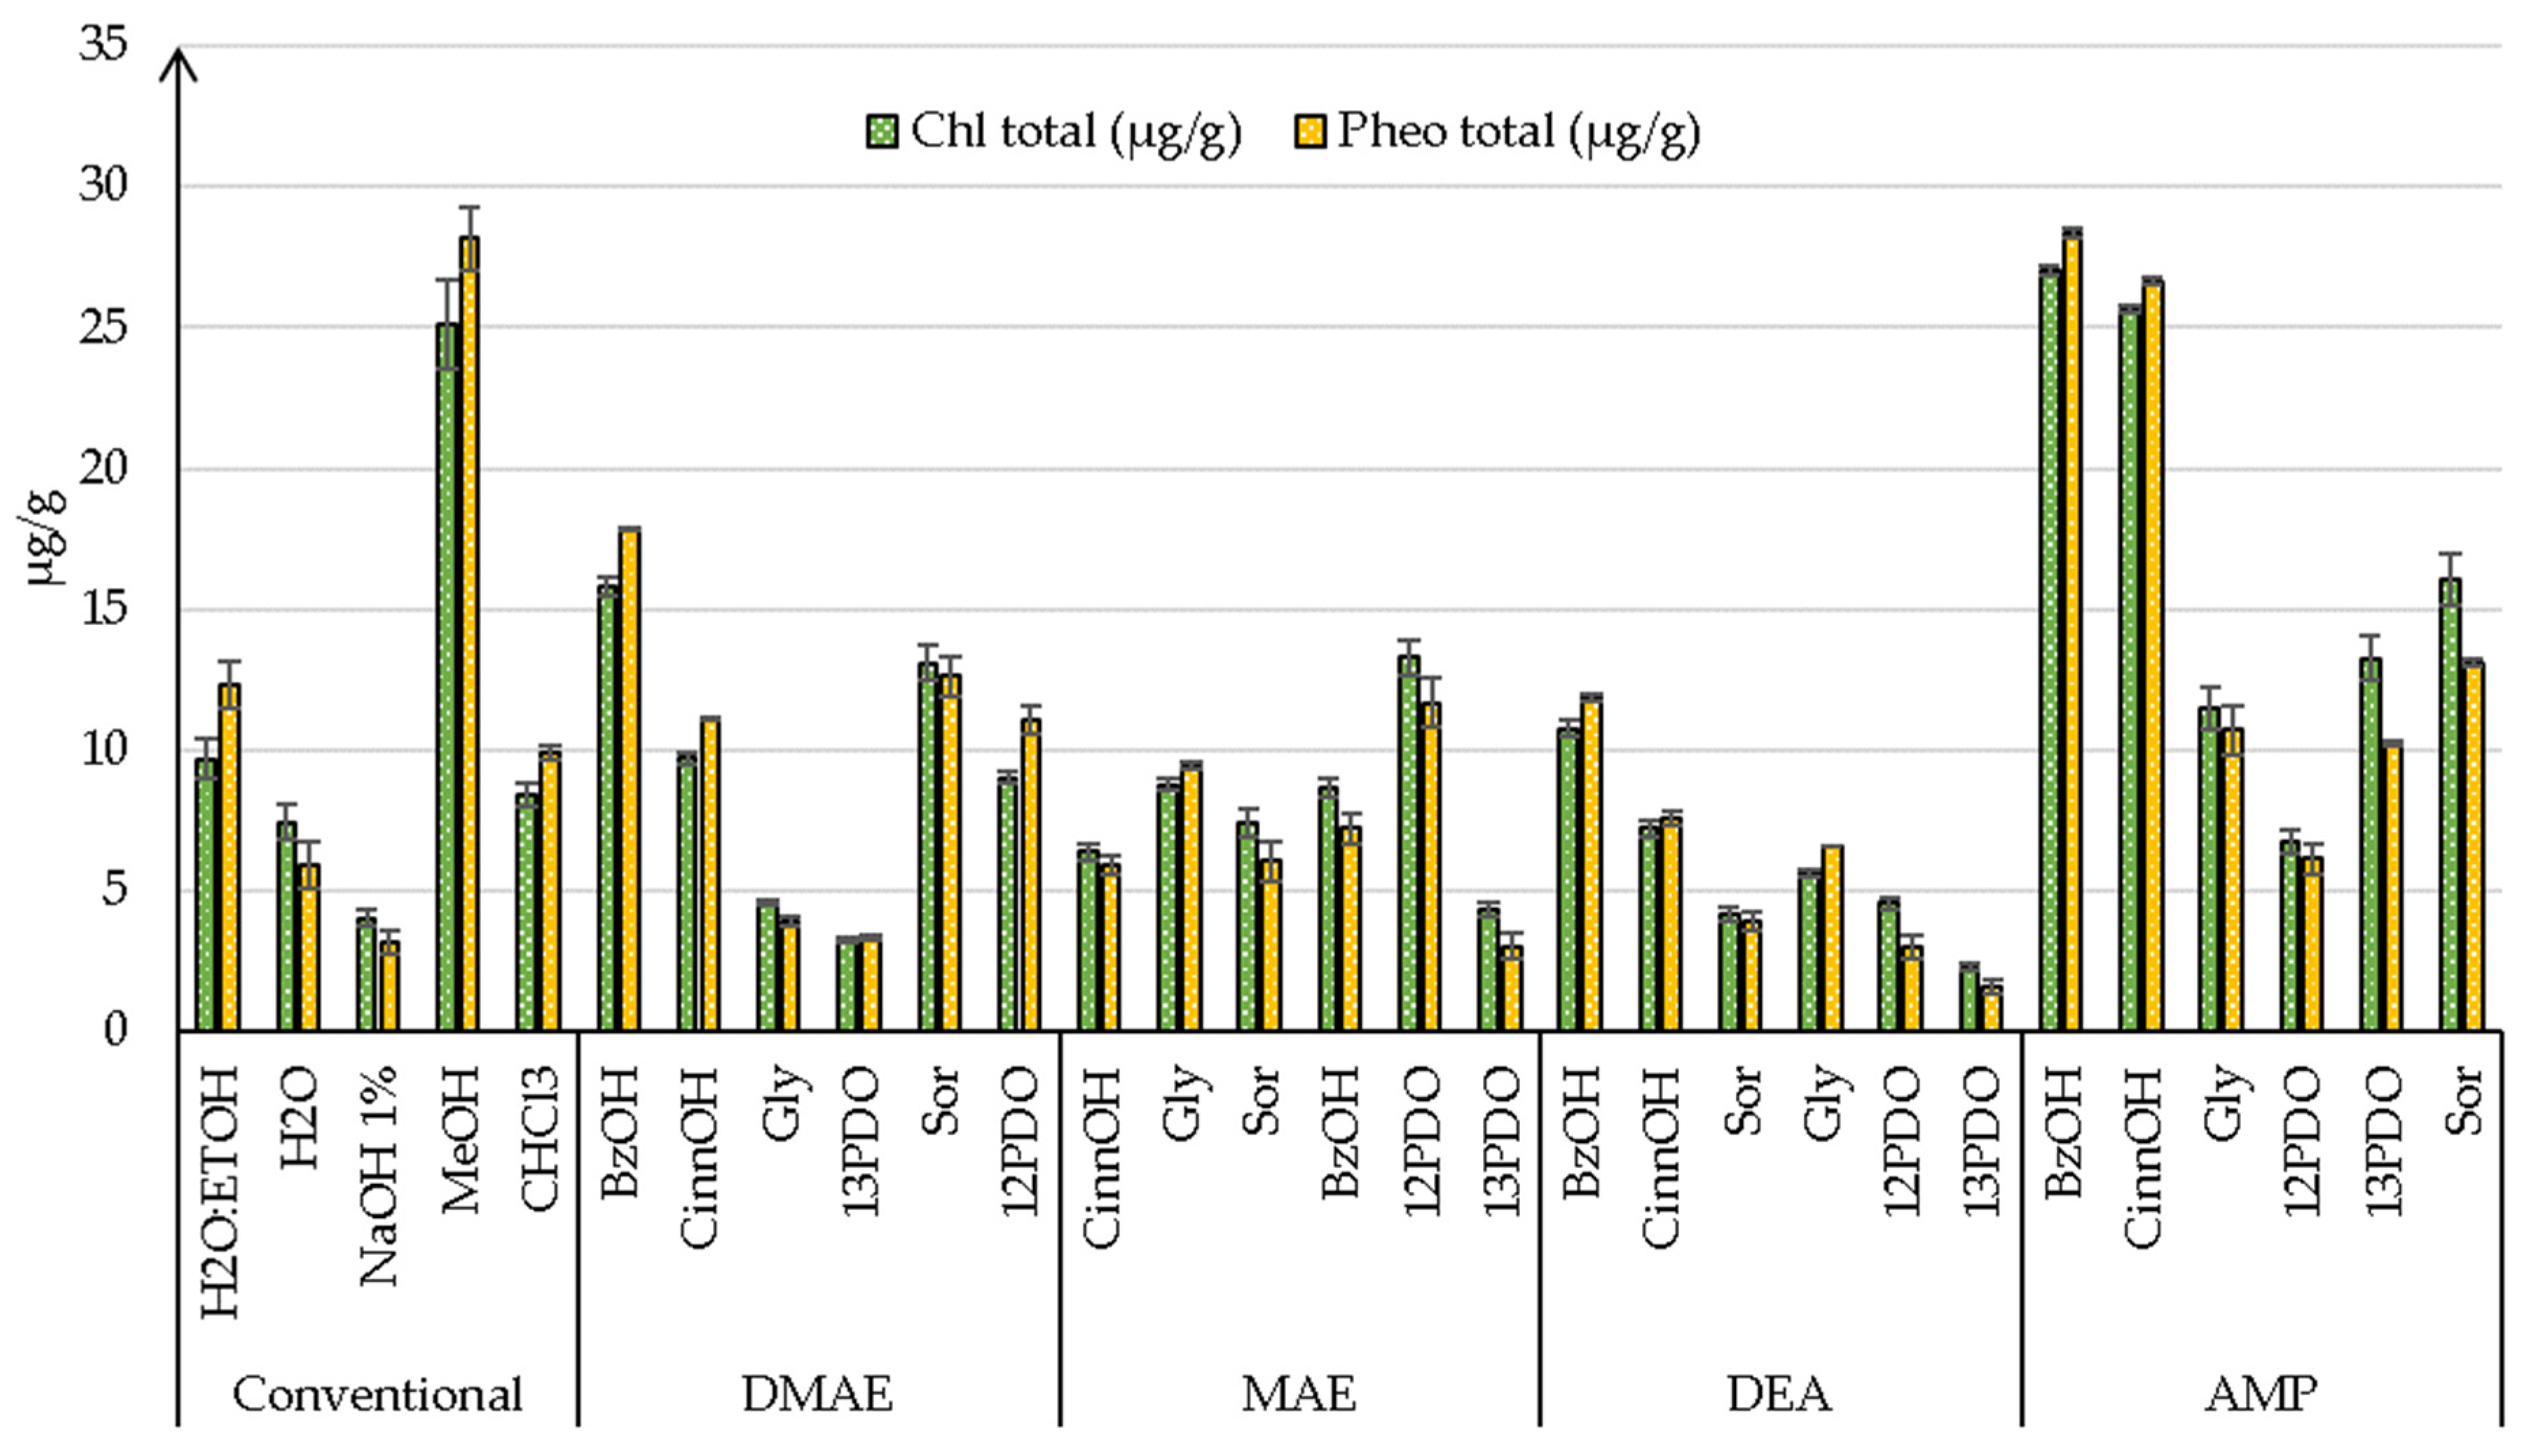
The effectiveness of deep eutectic solvents (DESs) in extracting phenolic compounds and phlorotannins was evaluated (Table A1). The DMAE-BzOH system stood out, producing 8.79 mg GAE/g (TPC) and 9.24 mg PGE/g (TTC), while DMAE-1,3-PDO produced 6.20 mg GAE/g (TPC) and 11.34 mg PGE/g (TTC). UV–Vis analysis (Figure A1) revealed characteristic peaks for phlorotannins (280–320 nm) and other phenolic compounds (300–380 nm).
Figure 3 compares the influence of adding 0% and 30% water on the extraction yield of TPC by DESs. It can be observed from the results obtained that the addition of 30% water provided a higher extraction yield of TPC compared to the system (solute and solvent) without water addition. This can be attributed to the fact that the controlled addition of water (up to 30% by mass) modulates the viscosity of DESs by weakening the intermolecular interactions between HBA and HBD, improving mass transfer and extraction yield. However, excessive amounts of water (>41%) can destabilize the system, promoting the loss of intermolecular interactions [14,66,67]. Based on these results, the extraction of the other bioactive compounds (phlorotannins and pigments) was performed using a system with the addition of 30% water.
Figure 4 shows the results regarding the content of phenolic compounds and phlorotannins with the addition of 30% water to the DES system (solute and solvent). The effectiveness of deep eutectic solvents (DESs) in the extraction of phenolic compounds and phlorotannins is related to the characteristics of their components: alkanolamines (hydrogen bond acceptors, HBA), and alcohols (hydrogen bond donors, HBD).
Polyphenols and phlorotannins, with pKa values of ~10 and 8.5, respectively, are ionized in an alkaline medium (pH 10–12), increasing their solubility. Alkanolamines deprotonate phenols, while alcohols stabilize phenolate ions through hydrogen bonding [13]. DMAE, with moderately alkaline pH (10–11), facilitates biomass penetration but forms weaker hydrogen bonds. DEA, with high viscosity (380 cP), requires water addition to improve mobility. With a high pH (11.5–12.5), MAE is efficient but may destabilize sensitive structures. AMP, with a basicity similar to DEA, has a higher extraction capacity, but its interaction with polyols may limit phenol availability [68,69]. Polyols act as hydrogen bond donors, stabilizing phenolate ions. Aromatic polyols, such as BzOH and CinnOH, promote π-π interactions with hydrophobic phenols [70]. Aliphatic polyols, such as glycerol, sorbitol, 1,2-PDO, and 1,3-PDO, favor polar interactions, with spatial conformation influencing efficiency [71].
UV–Vis analysis confirmed the efficacy of DESs, with characteristic peaks for phlorotannins (280–320 nm) and other phenolic compounds (300–380 nm) [72,73]. The presence of water was crucial, reducing viscosity and stabilizing phenolate ions [74]. Additionally, UV–Vis analysis of the extracts (200–750 nm) (Figure A1) revealed that these eutectic solvents are effective in extracting phytochemicals, as evidenced by absorption peaks between 280 and 320 nm [72], characteristic of phlorotannins, and between 300 and 380 nm, associated with potential phenolic acids and flavonoids [74].

3.3.2. Pigments

The yields in Figure 5 indicate that alkanolamines and polyols interact with chlorophyll and pheophytin through hydrogen bonds and polar interactions, which are essential for extracting and stabilizing pigments (Table A1). Additionally, UV–Vis analysis of the extracts (200–750 nm) (Figure A1) confirmed the presence of photosynthetic pigments, with peaks at 400, 500, and 660 nm, associated with chlorophyll and pheophytin [75].
The yields in Figure 6 indicate that alkanolamines and polyols interact with chlorophyll and pheophytin through hydrogen bonds and polar interactions, which are essential for extracting and stabilizing pigments. However, unlike some studies, pigments are unstable in alkaline pH (6–13). Under alkaline conditions, excess OH deprotonates phenolic groups, forming anions and degrading the conjugated structure of pigments, especially chlorophyll and pheophytin, which have sensitive porphyrin rings [76]. Alkaline treatment partially degrades chlorophylls a and b into water-soluble derivatives, maintaining the green color. Depending on the conditions (volume, temperature, presence of oxygen), reactions, such as dephytylation by chlorophyllase occur, forming chlorophyllides, or oxidation of the isocyclic ring, generating phytyl-chlorin or phytyl-rhodin [76,77]. Chlorophyll c, lacking a phytol chain, undergoes pheophytinization in an alkaline medium, losing Mg2+ and forming pheophytin c, which is less stable [78]. On the other hand, carotenoids, such as β-carotene and lutein, are stable in alkaline pH, maintaining their structures intact, as they lack functional groups sensitive to deprotonation or hydrolysis [79,80].
DMAE, with its tertiary amino group and hydroxyl group, forms low-viscosity solvent networks, facilitating access to pigments. DEA, containing two hydroxyl groups and a secondary amino group, stabilizes ions and strongly interacts with carbonyls and esters of chlorophyll. With its hydroxyl group and primary amino group, MAE allows intense interactions with carbonyls and esters, while its methyl group favors moderate interactions with porphyrin rings. Due to its branched structure, AMP maintains stability in alkaline pH and preserves porphyrin rings. Aliphatic polyols stabilize pigments through hydrogen bonds, though less efficiently than aromatic polyols, which favor π-π interactions (Table 2) [71,79,80].
Deep eutectic solvents (DESs) based on alkanolamines and polyols have shown high efficiency in extracting phenolic compounds (0.94 to 8.79 mg GAE/g) and florotanins (0.77 to 11.38 mg PGE/g), outperforming conventional solvents, such as ethanol (3.20 mg GAE/g) [82] and ionic liquids (2.10 mg PGE/g) [84]. This superior performance is attributed to the high alkalinity of DESs, which favors the ionization of phenols into phenolate ions [13], and their ability to form hydrogen bonds, provided by the hydroxyl groups of polyols and the amines in alkanolamines [69,74,88]. Compared to solvents like ethanol, methanol, and water, DESs present a higher density of interaction sites and selectivity, which results in greater chemical affinity for the target compounds, making the extraction more efficient [11,89]. Additionally, the lower viscosity observed in some DESs, especially when combined with polyols, such as propanediols and aromatic compounds, along with the addition of water, may have facilitated solvent diffusion into the cellular matrix of algae, improving the final extraction yield [89,90]. Although they do not achieve the high yields of more intensive techniques, like Ultrasound-Assisted Extraction (UAE), Microwave-Assisted Extraction (MAE), or High Pressure-Assisted Extraction (HPAE), which can reach up to 141.92 mg GAE/g [81], DESs stand out for their operational simplicity, lower environmental impact, and good efficiency, offering a sustainable alternative to traditional extraction methods.

3.4. Experimental Optimization

The optimization of the extraction process for phlorotannins from the residual biomass of Sargassum filipendula is essential to maximize the yield and quality of the extracted compounds. Among the solvents investigated, eutectic systems based on DMAE demonstrated the highest yields in phlorotannin extraction. Although its toxicity is more mitigated compared to other tested alkanolamines, DMAE is widely used in the cosmetic industry, present in formulations, such as creams, facial lotions, and gels, due to its properties that help combat wrinkles and signs of skin aging. Patents and studies indicate that DMAE is used in concentrations of 0.5% to 5% in the final composition of cosmetic products, without altering their properties or causing adverse health effects [91,92]. For future studies, considering that phenolate ions tend to precipitate in acidic medium due to the protonation of these ions [93], it may be interesting to further investigate the purification of phlorotannins through the addition of acid, which could also reinforce the idea of a pH-switchable solvent [94,95].

3.4.1. Experimental Design

Pareto diagrams (Figure 6; Figure A2) indicated that the solid-to-liquid ratio (S/L) was the predominant factor for DMAE:BzOH (1.30), with lower values resulting in higher phlorotannin yields (p < 0.05). For DMAE:13PDO (1.83), increasing temperature and reducing the S/L ratio favored phlorotannin extraction (p < 0.05). The regression models for DMAE:BzOH showed an R2 of 0.82 (TPC), adjusted R2 of 0.70 (TPC), R2 of 0.72 (chlorophyll), adjusted R2 of 0.54 (chlorophyll), and R2 and adjusted R2 of 0.99 (pheophytin). For DMAE:13PDO, the values were R2 of 0.98 (TPC), adjusted R2 of 0.97 (TPC), R2 of 0.95 (phlorotannins), adjusted R2 of 0.91 (phlorotannins), R2 of 0.94 (chlorophyll), and adjusted R2 of 0.91 (chlorophyll). These results demonstrate the high predictive capacity of the models.
Figure 6. Pareto diagrams for the optimization of phlorotannin (TTC) extraction with DAME:BzOH (1.30) (a) and DMAE:PDO (1.83) (b). The red line is used to indicate that the effects are statistically significant.
Processes 13 01345 g006

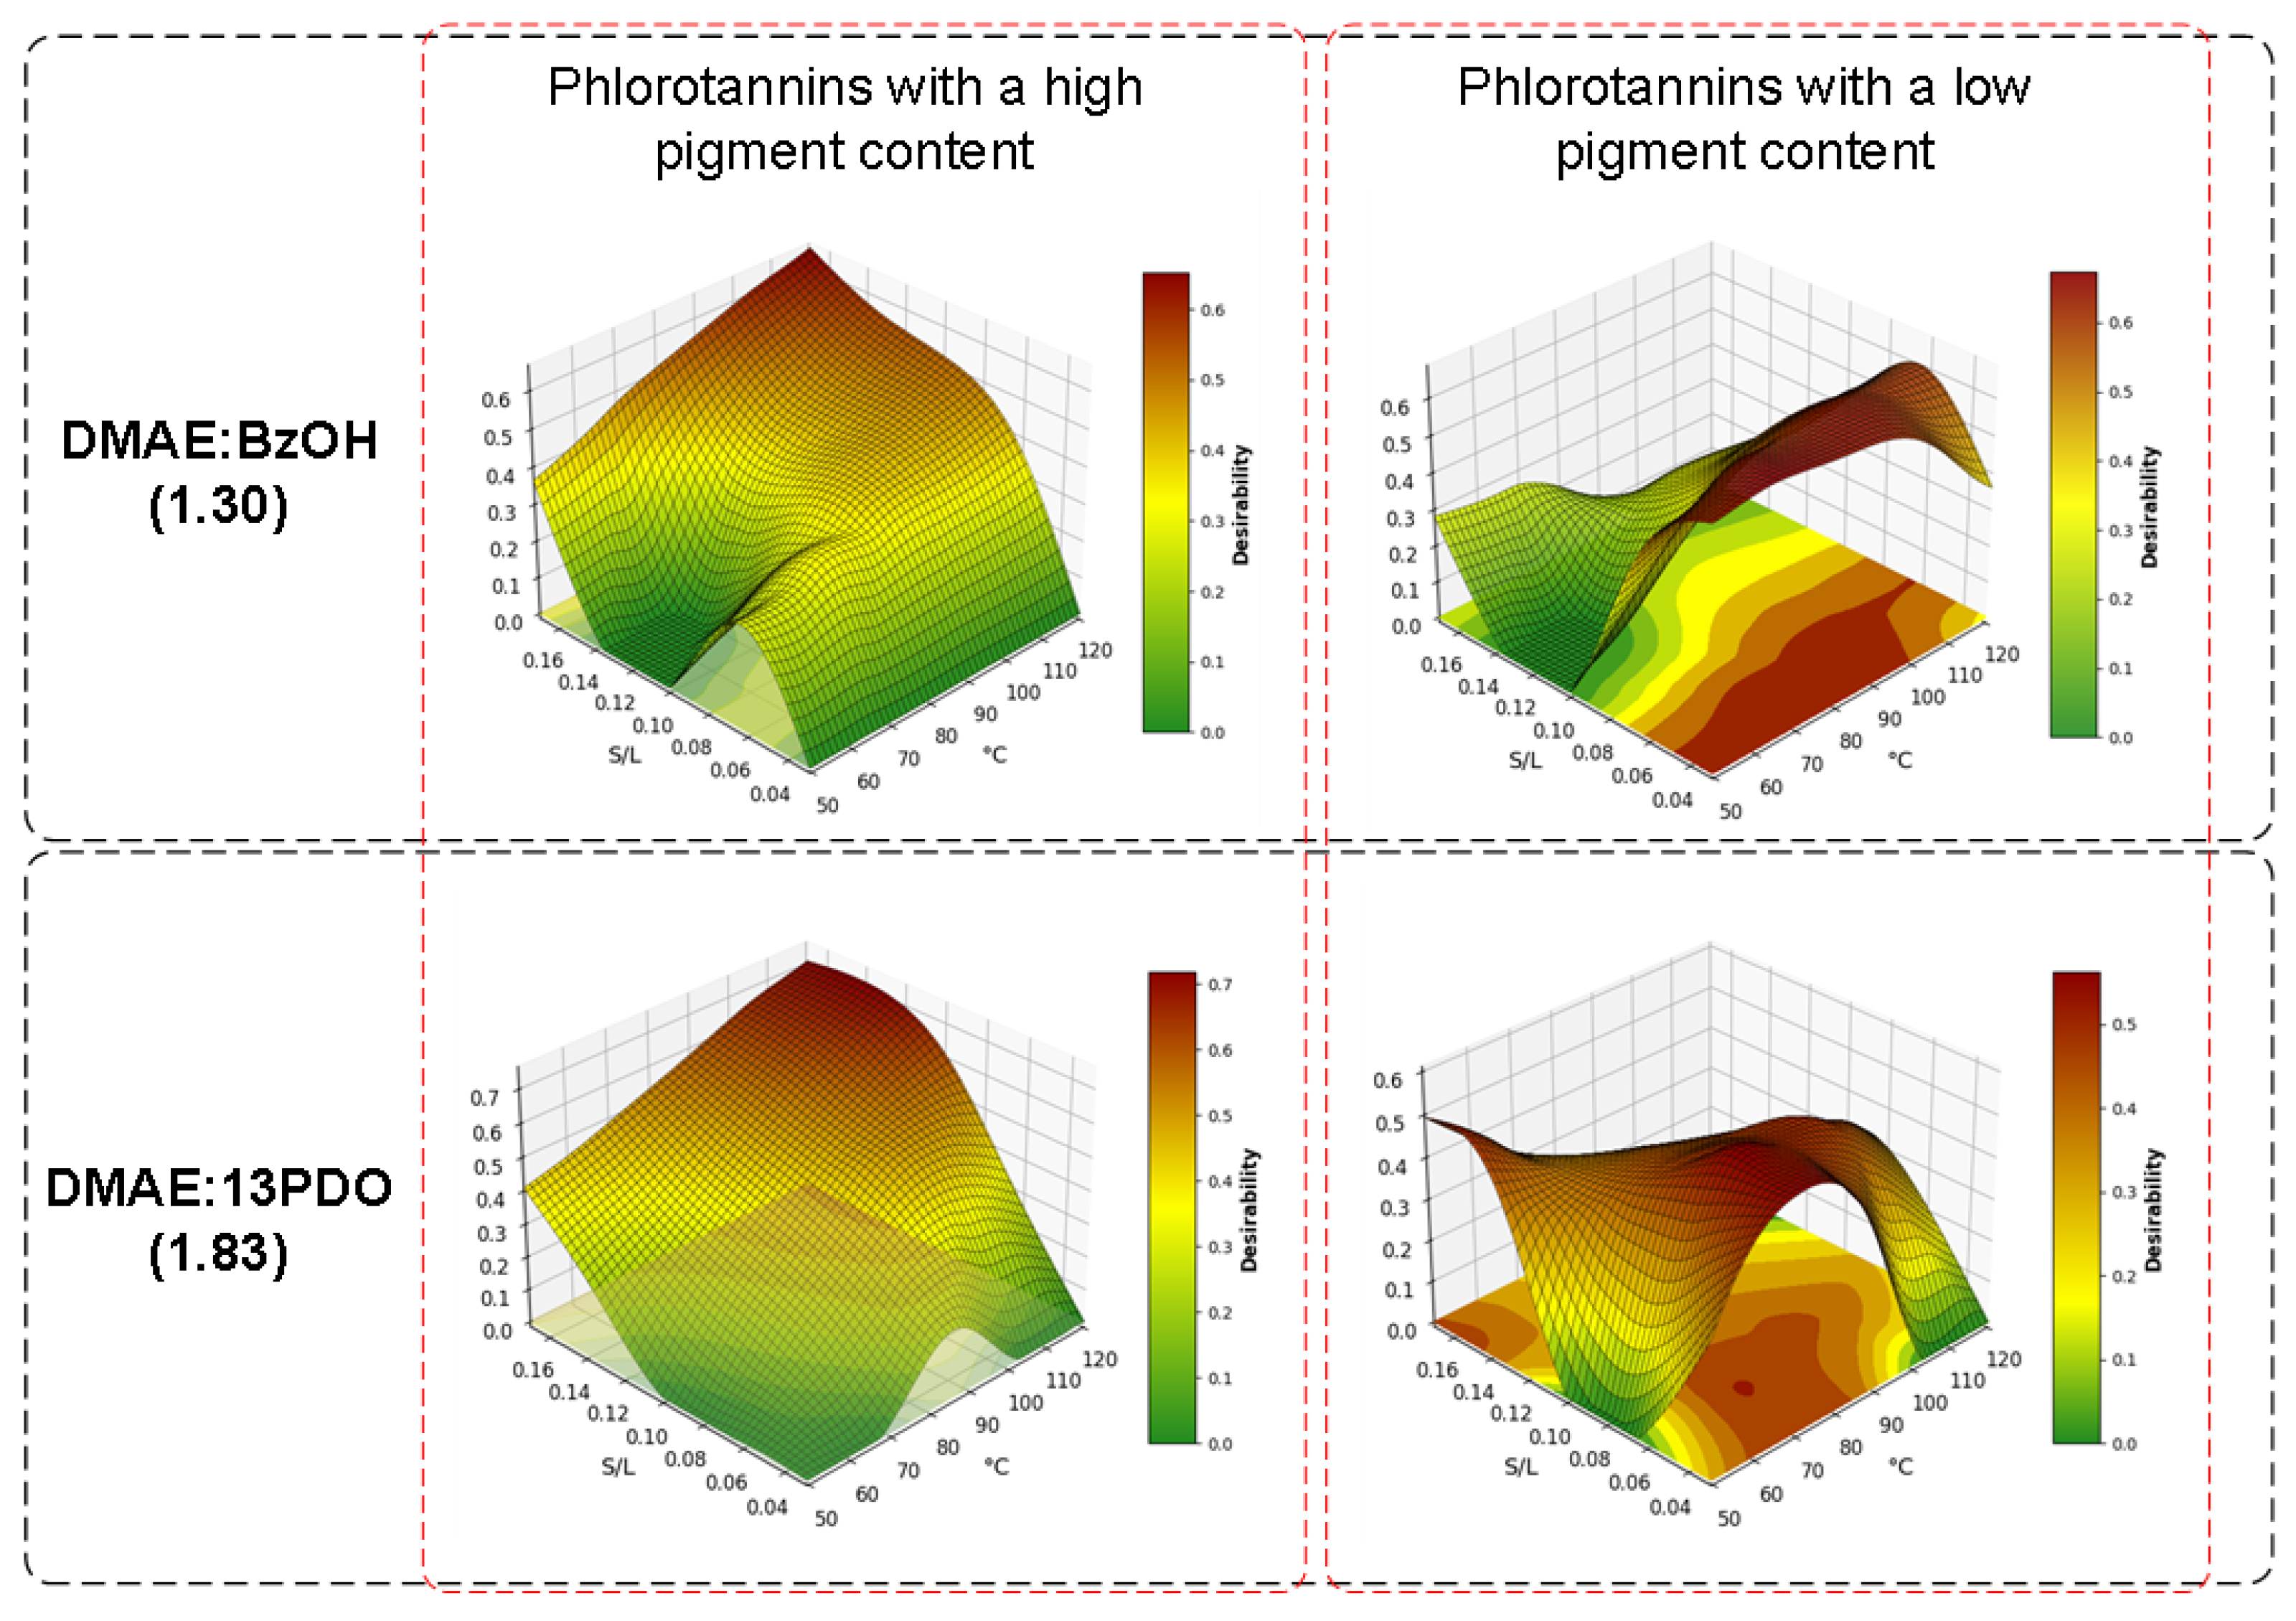
3.4.2. Optimization of Extraction

The temperature of 74.39 °C and a solid-to-liquid ratio (S/L) of 0.03 were the optimal conditions for maximizing the selectivity of phlorotannins in the eutectic solvent DMAE:BzOH (1.30) while maintaining low levels of pigments. For DMAE:13PDO (1.83), a temperature of 69.44 °C and an S/L ratio of 0.03 were the most suitable for phlorotannin selectivity. However, the conditions that provided the highest volumetric concentration of phlorotannins varied: for DMAE:BzOH, a temperature of 120.36 °C and an S/L ratio of 0.17 were the most effective, while for DMAE:13PDO, a temperature of 120.36 °C and an S/L ratio of 0.14 were the most appropriate (Figure 7).
Despite the use of DMAE in both DESs, BzOH and 13PDO differently influence the extraction of phlorotannins and pigments. The aromatic structure of BzOH interacts with aromatic compounds through π-π interactions, where the delocalized electrons of the aromatic rings of BzOH align with those of phlorotannins, facilitating their extraction [71]. Additionally, the DMAE:BzOH combination facilitates the degradation of photosynthetic pigments in an alkaline medium as high pH destabilizes the chlorophyll structure, leading to the loss of the magnesium ion (Mg2+) and the formation of pheophytin [76]. On the other hand, 13PDO, an aliphatic alcohol, primarily interacts through hydrogen bonds with the phenolate ions of phlorotannins. Its higher polarity compared to BzOH explains the lower extraction of pigments, which are less soluble in polar solvents [96]. Solvents, such as acetone, ethanol, and methanol are widely used for extracting pigments and phytochemicals due to their ability to solubilize polar compounds, such as chlorophylls, carotenoids, and phenolics [97].
Temperature plays a crucial role in the extraction of phlorotannins and pigments. Temperatures between 60 °C and 80 °C increase extraction efficiency by reducing solvent viscosity, facilitating mass transfer and the diffusion of compounds into the liquid medium. Additionally, heat helps break intramolecular and intermolecular interactions that retain compounds within cellular matrices [98]. However, temperatures above 80 °C can lead to the thermal degradation of compounds, especially photosynthetic pigments, which are heat-sensitive. Alternative methods, such as SFE, MWAE, and UAE, operate at higher temperatures (above 150 °C) and are effective for increasing phenolic yields but may compromise pigment integrity [97,99,100,101]. Studies indicate that temperatures below 60 °C are ideal for chlorophyll extraction, ensuring the preservation of their structure and functionality [102,103], while carotenoids, although more stable, also undergo progressive degradation above 100 °C [104].
A higher S/L ratio results in more concentrated extracts since a smaller amount of solvent relative to the mass of the plant material saturates more quickly with the target compounds [105]. However, excessively high ratios may limit the total mass yield since more significant volumes of solvent allow the extraction of a more substantial fraction of the compounds in the plant matrix. The literature suggests that ratios of 1:5 to 1:20 (m/v) are ideal for balancing concentration and yield based on studies that validate this range for extracting phytochemicals and pigments [14,106].
Although this study did not perform the recycling of DES, one of the main advantages of these solvents is their recovery and reuse in new extraction processes. DESs can be recovered by adding an antisolvent (water and ethanol), using macroporous resins, supercritical fluid extraction, and crystallization [107]. Some studies have shown that these methods allow the separation of bioactive compounds and a recovery of up to 90% of the solvent, which can be used again in the extraction processes [108,109,110].

3.5. Antioxidant Activity

In the present study, three methods were used to evaluate the antioxidant activity of extracts from the residual biomass of Sargassum filipendula, namely, the DPPH radical scavenging assay, ABTS radical scavenging, and Ferric Reducing Antioxidant Power (FRAP). The highest antioxidant activity was observed for extract 1 for both DESs studied (DMAE:BzOH—120.4 °C and 0.17 S/L; DMAE:13PDO—120.4 °C and 0.14 S/L), with values of 0.69 and 0.87 mg TE/mL for DPPH, 24.42 and 24.22 mg TE/mL for ABTS, and 2.26 and 2.24 mg TE/mL for FRAP. These results were higher than those obtained for the control (DES—(DMAE-BzOH and DMAE-13PDO), and, therefore, the order of the most significant antioxidant activity of the extracts was extracted 1 > extract 2 > control. The highest results for antioxidant activity in extract one may be related to a higher content of phenolic compounds, phlorotannins, and pigments (chlorophylls and pheophytin) extracted by DES (Table 3).
Phlorotannins and other phenolics exhibit high antioxidant capacity due to the presence of aromatic rings and hydroxyl groups (-OH), which allow the neutralization of free radicals, such as DPPH, ABTS•+, and Fe3+, through electron or hydrogen donation. The stabilization of the formed radicals prevents chain oxidation reactions, while the chelating capacity of phenolics reduces the formation of reactive species catalyzed by metal ions, forming stable complexes with Fe3+ [111]. Pigments, such as chlorophylls and carotenoids, also contribute to antioxidant activity through distinct mechanisms. Chlorophyll, with its porphyrin ring and Mg2+ ion, facilitates electron donation to neutralize free radicals, while pheophytin retains this capacity even without Mg2+. Carotenoids, such as β-carotene and lutein, have long conjugated chains that allow electron delocalization, neutralizing reactive oxygen species and inhibiting lipid peroxidation [112]. In DPPH assays, pigments enhance the antioxidant activity of extracts [105]. The synergy between phlorotannins, phenolics, and pigments potentiates antioxidant capacity, as evidenced by the high inhibition percentages in DPPH and ABTS assays and the significant reduction of Fe3+ in FRAP. While phenolics neutralize free radicals and chelate metals, pigments protect cell membranes and inhibit reactive oxygen species, promoting greater oxidative stability and protection against oxidative stress in complex systems [106].
The values obtained in the DPPH assays ranged from 2.43 mg TE/g to 7.09 mg TE/g, within the expected range for Sargassum species, such as Sargassum muticum, Sargassum japonica, and Sargassum sp., with values ranging from ~0.3 mg TE/g to 32.9 mg TE/g [82,84,113]. In the ABTS assay, the actual values of the extracts (after subtracting the control) ranged from 9.0 mg TE/g to 18.34 mg TE/g, lower than those reported in the literature for other Sargassum species. For example, Sargassum sp. showed values between 21.5 mg TE/g and 23.4 mg TE/g [82], while Sargassum muticum exhibited values between 3 mg TE/g and 574.9 mg TE/g [83,114]. The FRAP assay’s experimental values were consistent with those reported in the literature, ranging from 0.45 mg TE/g to 30.4 mg TE/g for other Sargassum species [82,84]. This difference may be attributed to the efficiency of the solvent used, which favored the extraction of compounds with high reducing power, such as phlorotannins and phenolics compounds.

4. Conclusions

The extraction of bioactive compounds from the residual biomass of Sargassum filipendula, derived from the alkaline extraction of polysaccharides, was successfully achieved using alkanolamine-based eutectic solvents, promoting a sustainable approach aligned with the biorefinery concept. This process enabled the efficient recovery of phlorotannins and photosynthetic pigments, avoiding the waste of residual metabolites and maximizing biomass utilization. Before this study, there was limited evidence on the efficacy of eutectic solvents in the selective extraction of these compounds from residual biomass. This work also highlights the crucial role of parameter optimization, such as temperature and solid-to-liquid ratio, in enhancing extraction efficiency, with statistical analyses (ANOVA and CCD) confirming the importance of these variables. The optimized extracts demonstrated superior antioxidant capacities in DPPH, ABTS, and FRAP assays compared to the control, and the results were consistent with the literature, opening promising avenues for applications in the pharmaceutical and cosmetic industries. The results of this study indicate that alkanolamine-based eutectic solvents, particularly DMAE:BzOH (1.30) and DMAE:13PDO (1.83), offer a sustainable and efficient approach for extracting phytochemicals and pigments from the residual biomass of Sargassum filipendula. Although the focus was not on polysaccharide extraction, the results pave the way for future investigations, including the combined extraction of phytochemicals, pigments, and polysaccharides, as well as the exploration of solvent reuse, distillation methods, and the precipitation of these phytochemicals in acidic medium. Future research should prioritize long-term toxicological evaluation of these solvents and the development of new eutectic combinations to expand the extraction of diverse bioactive compounds.

Author Contributions

Conceptualization, P.A.V.P.M. and B.D.R.; methodology, P.A.V.P.M. and C.N.d.S.; validation, P.A.V.P.M. and B.D.R.; formal analysis, P.A.V.P.M. and C.N.d.S.; investigation, P.A.V.P.M.; resources, B.D.R.; data curation, P.A.V.P.M.; writing—original draft preparation, P.A.V.P.M.; writing—review and editing, P.A.V.P.M. and B.D.R.; visualization, P.A.V.P.M.; supervision, B.D.R.; funding acquisition, B.D.R. All authors have read and agreed to the published version of the manuscript.

Funding

There was no funding during the execution of this research.

Data Availability Statement

The data presented in this study are part of the author’s master’s thesis, which has not yet been published. The data will be made publicly available upon the publication of the thesis and can be accessed in the institutional repository of the Federal University of Rio de Janeiro (UFRJ) School of Chemistry. Until then, the data are available upon reasonable request from the corresponding author.

Acknowledgments

The authors would like to thank the following Brazilian funding agencies: CAPES (Brazilian Federal Agency for Support and Evaluation of Graduate Education), CNPq (National Council for Scientific and Technological Development), and FAPERJ (Carlos Chagas Filho Foundation for Research Support of the State of Rio de Janeiro).

Conflicts of Interest

The authors declare no conflicts of interest. The funders had no role in the design of the study; in the collection, analyses, or interpretation of the data; in the writing of the manuscript; or in the decision to publish the results.

Abbreviations

DESDeep Eutectic Solvent
DMAEN,N-Dimethylaminoethanol
MAE2-Methylaminoethanol
DEADiethanolamine
AMP2-Amino-2-methyl-1-propanol
BzOHBenzyl alcohol
CinnOHCinnamyl Alcohol
GLYGlycerol
SORBSorbitol
12PDO1,2-Propanediol
13PDO1,3-Propanediol
TPCTotal phenolic content
TTCTotal Tannin Content
GAEGallic Acid Equivalent
PGEPhloroglucinol Equivalent
DPPH2,2-Diphenyl-1-picrylhydrazyl
ABTS2,2′-Azino-bis(3-ethylbenzothiazoline-6-sulfonic acid)
FRAPFerric Reducing Antioxidant Power
TETrolox equivalent
COSMO-RSConductor-like Screening Model for Real Solvents
DFTDensity Functional Theory
CCDCentral Composite Design
ANOVAAnalysis of variance
S/LSolid-to-liquid ratio
PVPPPolyvinylpolypyrrolidone
LD50Lethal Dose 50%
FDAFood and Drug Administration
ECHAEuropean Chemicals Agency
CIRCosmetic Ingredient Review
OSHAOccupational Safety and Health Administration
MWAEMicrowave-Assisted Extraction
UAEUltrasound-Assisted Extraction
SFESupercritical fluid extraction
DMFN,N-Dimethylformamide
TPTZ2,4,6-Tripyridyl-s-triazine
Na2CO3Sodium Carbonate
NaOHSodium Hydroxide
HClHydrochloric Acid
CHCl3Chloroform
MeOHMethanol
H2OWater
HBAHydrogen bond acceptor
HBDHydrogen bond donor
UV–VisUltraviolet–Visible Spectroscopy
R2Coefficient of Determination
pKaAcid Dissociation Constant
pHPotential of Hydrogen
ppmParts Per Million

Appendix A

Figure A1. UV–Vis profiles of the eutectic solvents with the best yields of phytochemicals.
Processes 13 01345 g0a1
Figure A2. Pareto diagram of the optimization for the extraction of total phenolics, chlorophyll, and pheophytin with DMAE:BzOH (1.30) and DMAE:13PDO (1.83). The red line is used to indicate that the effects are statistically significant.
Processes 13 01345 g0a2
Table A1. Results of the yields of phenolic compounds, phlorotannins, chlorophyll and pheophytin extracted by deep eutectic solvents.
SolventsTPCTPCTTC
(mg GAE/g)
TTC
(mg PGE/g)
Chl Total (µg/g)Pheo Total (µg/g)
(0% H2O)
(mg GAE/g)
(30% H2O)
(mg GAE/g)
H2O:EtOH1.72 ± 0.01 b-1.37 ± 0.03 d2.77 ± 0.03 d9.69 ± 0.69 d12.33 ± 0.8 c
H2O1.03 ± 0.01 d-0.57 ± 0.01 e1.15 ± 0.01 e7.43 ± 0.62 e5.92 ± 0.84 e
NaOH 1%1.04 ± 0.04 d-0.84 ± 0.02 e1.7 ± 0.02 e4.05 ± 0.33 f3.18 ± 0.45 f
MeOH0.57 ± 0.01 d-0.45 ± 0.02 f0.91 ± 0.02 f25.12 ± 1.57 a28.18 ± 1.13 a
CHCl31.47 ± 0.04 d-1.18 ± 0.03 d2.39 ± 0.03 d8.4 ± 0.44 d9.89 ± 0.23 d
DMAE:BzOH2.94 ± 0.6 a8.79 ± 0.09 a4.57 ± 0.06 a9.24 ± 0.06 a15.82 ± 0.31 b17.86 ± 0.02 b
DMAE:CinnOH2.47 ± 0.24 b2.47 ± 0.24 d1.05 ± 0.23 d2.12 ± 0.23 d9.71 ± 0.22 d11.17 ± 0.01 c
DMAE:Gly0.79 ± 0.14 c0.79 ± 0.14 e0.33 ± 0.1 f0.67 ± 0.1 f4.58 ± 0.08 f3.96 ± 0.17 f
DMAE:13PDO2.77 ± 0.6 a6.02 ± 0.1 b5.63 ± 0.09 a11.38 ± 0.09 a3.24 ± 0.1 g3.32 ± 0.09 f
DMAE:Sor0.57 ± 0.09 d5.12 ± 0.29 b3.85 ± 0.21 b7.78 ± 0.21 b13.1 ± 0.64 c12.62 ± 0.7 c
DMAE:12PDO0.41 ± 0.06 d2.21 ± 0.14 e1.57 ± 0.17 d3.17 ± 0.14 d9.02 ± 0.22 d11.05 ± 0.51 c
MAE:CinnOH1.09 ± 0.12 c2.75 ± 0.06 d1.52 ± 0.05 d3.07 ± 0.05 d6.39 ± 0.3 e5.93 ± 0.36 e
MAE:Gly0.15 ± 0.05 d3.03 ± 0.02 c2.57 ± 0.21 c5.2 ± 0.21 c8.77 ± 0.22 d9.43 ± 0.12 d
MAE:Sor0.12 ± 0.06 d0.92 ± 0.32 e0.66 ± 0.11 e1.33 ± 0.11 e7.39 ± 0.49 e6.05 ± 0.68 e
MAE:BzOH1.53 ± 0.08 b1.96 ± 0.19 c1.41 ± 0.09 d2.85 ± 0.09 d8.66 ± 0.34 d7.24 ± 0.54 e
MAE:12PDO1.12 ± 0.16 c2.3 ± 0.07 d2.22 ± 0.06 c4.49 ± 0.06 c13.31 ± 0.63 c11.69 ± 0.86 c
MAE:13PDO0.55 ± 0.18 c2.16 ± 0.12 c0.93 ± 0.13 e1.88 ± 0.13 e4.36 ± 0.24 f3.04 ± 0.43 f
DEA:BzOH-1.47 ± 0.14 d1.06 ± 0.22 d2.14 ± 0.22 d10.78 ± 0.31 d11.88 ± 0.15 c
DEA:CinnOH0.99 ± 0.07 c3.34 ± 0.06 c2.34 ± 0.3 c4.73 ± 0.3 c7.21 ± 0.3 e7.59 ± 0.25 e
DEA:Sor1.49 ± 0.28 b2.81 ± 0.42 c2.53 ± 0.42 c5.11 ± 0.42 c4.18 ± 0.27 f3.92 ± 0.31 f
DEA:Gly0.82 ± 0.19 c4.59 ± 0.42 c3.49 ± 0.31 b7.06 ± 0.31 b5.64 ± 0.13 f6.57 ± 0 e
DEA:12PDO0.85 ± 0.31 c2.15 ± 0.14 d0.93 ± 0.1 e1.88 ± 0.1 e4.58 ± 0.21 f3.02 ± 0.43 f
DEA:13PDO0.61 ± 0.22 c3.65 ± 0.07 c2.2 ± 0.13 c4.45 ± 0.13 c2,29 ± 0.13 g1.61 ± 0.23 g
AMP:BzOH-0.85 ± 0.33 e0.38 ± 0.05 f0.77 ± 0.05 f27.05 ± 0.16 a28.37 ± 0.14 a
AMP:CinnOH-2.67 ± 0.33 d1.37 ± 0.57 d2.77 ± 0.57 d25.63 ± 0.13 a26.64 ± 0.11 a
AMP:Gly-1.6 ± 0.16 e1.27 ± 0.41 d2.57 ± 0.41 d11.5 ± 0.75 d10.72 ± 0.86 d
AMP:12PDO-1.67 ± 0.61 d0.9 ± 0.3 e1.82 ± 0.3 e6.75 ± 0.42 e6.13 ± 0.51 e
AMP:13PDO-0.94 ± 0.29 e0.63 ± 0.26 e1.27 ± 0.26 e13.27 ± 0.81 c10.24 ± 0.12 d
AMP:Sor-1.64 ± 0.13 e1.24 ± 0.13 d2.51 ± 0.13 d16.06 ± 0.9 b13.08 ± 0.13 c
Means within the same column with lowercase letters are significantly different (Tukey test, p ≤ 0.05).
Table A2. Results of antioxidant yields (mg TE/g) of optimized DESs: DMAE:BzOH (1.30); DMAE:13PDO (1.83).
Extract − ControlExtract + Control
Solvents°CS/LDPPH (mg TE/g)ABTS (mg TE/g)FRAP (mg TE/g)DPPH (mg TE/g)ABTS (mg TE/g)FRAP (mg TE/g)
DMAE:BzOH (1.30)74.390.033.5418.463.0813.42786.4766.68
120.360.172.328.102.104.06143.6313.32
DMAE:13PDO (1.83)69.440.032.7210.254.8424.33781.4168.53
120.360.141.597.782.356.22173.0316.00
Table A3. Results of the cost analysis of optimized DESs: DMAE:BzOH (1.30) and DMAE:13PDO (1.83). The cost reduction values are compared based on the results of the DES in the experimental screening, considering its composition under optimized conditions.
SolventsR$/kg°CS/L$/g PGE% Cost Reduction
DMAE:BzOH
(1.30)
60.000.10 $ 48.21 -
R$ 267.25 67.320.03 $ 12.36 −74.4%
120.360.17 $ 5.41 −88.8%
DMAE:13PDO
(1.83)
60.000.10 $ 187.21 -
R$ 1.278.28 67.320.03 $ 329.19 75.8%
120.360.14 $ 36.03 −80.8%
H2O:EtOHR$ 17.41 60.000.10 $ 10.48 -
H2OR$ 10.00 60.000.10 $ 25.23 -
NaOH 1%R$ 175.41 60.000.10 $ 17.07 -
MeOHR$ 137.81 60.000.10 $ 31.89 -
CHCl3R$ 160.00 60.000.10 $ 12.14 -

References

  1. FAO. The State of World Fisheries and Aquaculture 2024–Blue Transformation in Action; Food and Agriculture Organization of the United Nations: Rome, Italy, 2024. [Google Scholar]
  2. FAO. Towards Blue Transformation; Food and Agriculture Organization of the United Nations: Rome, Italy, 2022. [Google Scholar]
  3. Baghel, R.S.; Suthar, P.; Gajaria, T.K.; Bhattacharya, S.; Anil, A.; Reddy, C.R. Seaweed biorefinery: A sustainable process for valorizing the biomass of brown seaweed. J. Clean. Prod. 2020, 263, 121359. [Google Scholar] [CrossRef]
  4. Yun, J.-H.; Archer, S.D.; Price, N.N. Valorization of waste materials from seaweed industry: An industry survey-based biorefinery approach. J. Clean. Prod. 2020, 263, 121359. [Google Scholar] [CrossRef]
  5. Narayanan, M. Promising biorefinery products from marine macro and microalgal biomass: A review. Renew. Sustain. Energy Rev. 2024, 190 Pt B, 114081. [Google Scholar] [CrossRef]
  6. Kumar, L.R.G.; Paul, P.T.; Anas, K.K.; Tejpal, C.S.; Chatterjee, N.S.; Anupama, T.K.; Mathew, S.; Ravishankar, C.N. Phlorotannins–bioactivity and extraction perspectives. J. Appl. Phycol. 2022, 34, 2173–2185. [Google Scholar] [CrossRef]
  7. Bertagnolli, C.; Espíndola, A.; Kleinübing, S.; Tasić, L.; Silva, M. Sargassum filipendula alginate from Brazil: Seasonal influence and characteristics. Carbohydr. Polym. 2014, 111, 619–623. [Google Scholar] [CrossRef]
  8. National Confederation of Family Farmers and Rural Family Entrepreneurs (CONAFER – BR). Agriculture in the Amazon ‘Feeds’ the Formation of a Gigantic Patch of Brown Algae. 2018. Available online: https://conafer.org.br/en/Agriculture-in-the-Amazon-fuels-the-formation-of-a-giant-patch-of-brown-algae (accessed on 10 April 2025).
  9. Pérez, Y.; López, S.G.; Tejada, E.L.; Giraldo, J.C.; Mejía, M.Á. Sargassum filipendula, a source of bioactive compounds with antioxidant and matrix metalloproteinase inhibition activities in vitro with potential dermocosmetic application. Antioxidants 2023, 12, 876. [Google Scholar] [CrossRef]
  10. Michalak, I.; Chojnacka, K. Algae as production systems of bioactive compounds. Eng. Life Sci. 2015, 15, 160–176. [Google Scholar] [CrossRef]
  11. Cotas, J.; Leandro, A.; Monteiro, P.; Pacheco, D.; Figueirinha, A.; Gonçalves, A.M.; Pereira, L. Seaweed phenolics: From extraction to applications. Mar. Drugs 2020, 18, 384. [Google Scholar] [CrossRef]
  12. Conde, E.; Moure, A.; Domínguez, H. Supercritical CO2 extraction of fatty acids, phenolics, and fucoxanthin from freeze-dried Sargassum muticum. J. Appl. Phycol. 2014, 27, 957–964. [Google Scholar] [CrossRef]
  13. Cui, X.; Liao, J.; Liu, H.; Tang, W.; Tie, C.; Tian, S.; Li, Y. Adsorption of phenols from aqueous solution with a pH-sensitive surfactant-modified bentonite. Separations 2023, 10, 523. [Google Scholar] [CrossRef]
  14. Jesus, B.C.; Sáenz de Miera, B.; Santiago, R.; Martins, A.; Pedrosa, R.; González-Miquel, M.; Marrucho, I.M. Valorisation of Sargassum muticum through the extraction of phenolic compounds using eutectic solvents and intensification techniques. RSC Sustain. 2023, 1, 14. [Google Scholar] [CrossRef]
  15. Horwitz, W.; Latimer, G.W. Official Methods of Analysis of AOAC International, 22nd ed.; Association of Official Analytical Chemistry International: New York, NY, USA, 2005. [Google Scholar]
  16. Dische, Z. A new specific color reaction of hexuronic acids. J. Biol. Chem. 2021, 167, 189–198. [Google Scholar] [CrossRef]
  17. Alhadid, A.; Mokrushina, L.; Minceva, M. Formation of glassy phases and polymorphism in deep eutectic solvents. J. Mol. Liq. 2020, 314, 113667. [Google Scholar] [CrossRef]
  18. Wojeicchowski, J.P.; Marques, C.; Igarashi-Mafra, L.; Coutinho, J.A.; Mafra, M.R. Extraction of phenolic compounds from rosemary using choline chloride–based Deep Eutectic Solvents. Sep. Purif. Technol. 2020, 247, 117975. [Google Scholar] [CrossRef]
  19. El Kantar, S.; Rajha, H.N.; Boussetta, N.; Vorobiev, E.; Maroun, R.G.; Louka, N. Green extraction of polyphenols from grapefruit peels using high voltage electrical discharges, deep eutectic solvents, and aqueous glycerol. Food Chem. 2019, 295, 165–171. [Google Scholar] [CrossRef]
  20. Malta, L.; Liu, R. Analyses of Total Phenolics, Total Flavonoids, and Total Antioxidant Activities in Foods and Dietary Supplements. Encyclopedia of Agriculture and Food Systems; Elsevier: Amsterdam, The Netherlands, 2014; pp. 305–314. [Google Scholar] [CrossRef]
  21. Ribeiro, B.D.; Coelho, M.A.Z.; Barreto, D.W. Obtaining caffeine-rich guarana extracts by enzymatic process and tannin adsorption. Braz. J. Food Technol. 2012, 15, 261–270. [Google Scholar] [CrossRef]
  22. Toth, G.B.; Pavia, H. Removal of dissolved brown algal phlorotannins using insoluble polyvinylpolypyrrolidone (PVPP). J. Chem. Ecol. 2001, 27, 1899–1910. [Google Scholar] [CrossRef]
  23. Targett, N.M.; Arnold, T.M. Minireview—Predicting the effects of brown algal phlorotannins on marine herbivores in tropical and temperate oceans. J. Phycol. 1998, 34, 195–205. [Google Scholar] [CrossRef]
  24. Ford, L.; Theodoridou, K.; Sheldrake, G.N.; Walsh, P.J. A critical review of analytical methods used for the chemical characterisation and quantification of phlorotannin compounds in brown seaweeds. Phytochem. Anal. 2019, 30, 587–599. [Google Scholar] [CrossRef]
  25. Vernon, L.P. Spectrophotometric determination of chlorophylls and pheophytins in plant extracts. Anal. Chem. 1960, 32, 1144–1150. [Google Scholar] [CrossRef]
  26. Hill, R. Chlorophyll. In Comprehensive Biochemistry; Florkin, M., Stotz, H., Eds.; Elsevier: Amsterdam, The Netherlands, 1963; Volume 9, p. 73. [Google Scholar]
  27. Moran, R. Formulae for determination of chlorophyllous pigments extracted with N,N-dimethylformamide. Plant Physiol. 1982, 69, 1376–1381. [Google Scholar] [CrossRef] [PubMed]
  28. Silveira, A.C.; Kassuia, Y.S.; Domahovski, R.C.; Lazzarotto, M. Método de DPPH Adaptado: Uma Ferramenta para Analisar Atividade Antioxidante de Polpa de Frutos da Erva-Mate de Forma Rápida e Reprodutível; Embrapa Florestas. Comunicado técnico, 421; Embrapa Florestas: Colombo, Brazil, 2018; Available online: https://www.embrapa.br/busca-de-publicacoes/-/publicacao/1101294/metodo-de-dpph-adaptado-uma-ferramenta-para-analisar-atividade-antioxidante-de-polpa-de-frutos-da-erva-mate-de-forma-rapida-e-reprodutivel (accessed on 22 March 2025).
  29. Re, R.; Pellegrini, N.; Proteggente, A.; Pannala, A.; Yang, M.; Rice-Evans, C. Antioxidant activity applying an improved ABTS radical cation decolorization assay. Free Radic. Biol. Med. 1999, 26, 1231–1237. [Google Scholar] [CrossRef] [PubMed]
  30. Rufino, M.S.M.; Alves, R.E.; Brito, E.S.; Morais, S.M.; Sampaio, C.G.; Jimenes-Perez, J.; Saura-Calixto, F.D. Metodologia Científica: Determinação da Atividade Antioxidante Total em Frutas pelo Método de Redução do Ferro (FRAP); Comunicado Técnico; Embrapa Agroindústria Tropical: Fortaleza, Brazil, 2006; Available online: https://www.embrapa.br/busca-de-publicacoes/-/publicacao/664098/metodologia-cientifica-determinacao-da-atividade-antioxidante-total-em-frutas-pelo-metodo-de-reducao-do-ferro-frap (accessed on 15 March 2025).
  31. Benzie, I.F.F.; Strain, J.J. The ferric reducing ability of plasma (FRAP) as a measure of “antioxidant power”: The FRAP assay. Anal. Biochem. 1996, 239, 70–76. [Google Scholar] [CrossRef]
  32. Palomar, J.; Torrecilla, J.S.; Lemus, J.; Ferro, V.R.; Rodríguez, F. A COSMO-RS based guide to analyze/quantify the polarity of ionic liquids and their mixtures with organic cosolvents. Phys. Chem. Chem. Phys. 2010, 12, 1863–1870. [Google Scholar] [CrossRef]
  33. Zhou, L.; Liu, Y.; Zhang, J.; Li, Q.; Yuan, M.; Kang, Z. Ionic liquid screening for lignocellulosic biomass fractionation: COSMO–RS prediction and experimental verification. J. Mol. Liq. 2024, 407, 125214. [Google Scholar] [CrossRef]
  34. Bhattacharya, S. Central Composite Design for Response Surface Methodology and Its Application in Pharmacy. Response Surface Methodology in Engineering Science; IntechOpen: London, UK, 2021; pp. 1–19. [Google Scholar] [CrossRef]
  35. Myers, R.H.; Montgomery, D.C.; Anderson-Cook, C.M. Response Surface Methodology: Process and Product Optimization Using Designed Experiments, 4th ed.; John Wiley & Sons: Hoboken, NJ, USA, 2016. [Google Scholar]
  36. Hernández-Carmona, G.; McHugh, D.J.; Arvizu-Higuera, D.L. Pilot plant scale extraction of alginates from Macrocystis pyrifera. J. Appl. Phycol. 1999, 11, 493–502. [Google Scholar] [CrossRef]
  37. Torres, M.R.; Sousa, A.P.A.; Silva Filho, E.A.T.; Melo, D.F.; Feitosa, J.P.A.; de Paula, R.C.M.; Lima, M.G.S. Extraction and physicochemical characterization of Sargassum vulgare alginate from Brazil. Carbohydr. Res. 2007, 342, 2067–2074. [Google Scholar] [CrossRef]
  38. Rhein-Knudsen, N.; Ale, M.T.; Ajalloueian, F.; Meyer, A.S. Characterization of alginates from Ghanaian brown seaweeds: Sargassum spp. and Padina spp. Food Hydrocoll. 2017, 71, 236–244. [Google Scholar] [CrossRef]
  39. Lee, J.-E.; Xu, X.; Jeong, S.-M.; Kang, W.-S.; Ryu, S.-H.; Kim, H.-H.; Kim, S.-R.; Lee, G.-H.; Kim, M.-J.; Ahn, D.-H. Properties and anti-inflammatory effects of Sargassum muticum enzymatic extracts decomposed using crude enzyme from Shewanella oneidensis. Food Sci. Biotechnol. 2022, 31, 1299–1307. [Google Scholar] [CrossRef]
  40. Garcia-Ríos, V.; Ríos-Leal, E.; Robledo, D.; Freile-Pelegrin, Y. Polysaccharides composition from tropical brown seaweeds. Phycol. Res. 2012, 60, 305–315. [Google Scholar] [CrossRef]
  41. Dia Filippo-Herrera, D.A.; Hernández-Carmona, G.; Muñoz-Ochoa, M.; Arvizu-Higuera, D.L.; Rodríguez-Montesinos, Y.E. Monthly variation in the chemical composition and biological activity of Sargassum horridum. Bot. Mar. 2018, 61, 1–12. [Google Scholar] [CrossRef]
  42. Sari, R.I.; Suryati, I.R.A.; Taslihan, A. Laminarin crude extract characterization of Sargassum sp. originated from Jepara-Indonesia with the laminarin acid extraction method using an acetic acid solvent. J. Kim. Dan Pendidik. Kim. (JKPK) 2023, 8, 60–74. [Google Scholar] [CrossRef]
  43. Paredes-Camacho, R.M.; González-Morales, S.; González-Fuentes, J.A.; Rodríguez-Jasso, R.M.; Benavides-Mendoza, A.; Charles-Rodríguez, A.V.; Robledo-Olivo, A. Characterization of Sargassum spp. from the Mexican Caribbean and its valorization through fermentation process. Processes 2023, 11, 685. [Google Scholar] [CrossRef]
  44. Wardani, A.K.; Herrani, R. Bioethanol from Sargassum sp. using acid hydrolysis and fermentation method using microbial association. J. Phys. Conf. Ser. 2019, 1241, 012008. [Google Scholar] [CrossRef]
  45. Youssouf, L.; Lallemand, L.; Giraud, P.; Soulé, F.; Bhaw-Luximon, A.; Meilhac, O.; D’Hellencourt, C.L.; Jhurry, D.; Couprie, J. Ultrasound-assisted extraction and structural characterization by NMR of alginates and carrageenans from seaweeds. Carbohydr. Polym. 2017, 166, 55–63. [Google Scholar] [CrossRef]
  46. Holme, H.K.; Lindmo, K.; Kristiansen, A.; Smidsrød, O. Thermal depolymerization of alginate in the solid state. Carbohydr. Polym. 2003, 54, 431–438. [Google Scholar] [CrossRef]
  47. Vauchel, P.; Arhaliass, A.; Legrand, J.; Kaas, R.; Baron, R. Decrease in dynamic viscosity and average molecular weight of alginate from Laminaria digitata during alkaline extraction. J. Phycol. 2008, 44, 515–517. [Google Scholar] [CrossRef]
  48. Fawzy, M.A.; Gomaa, M.; Hifney, A.F.; Abdel-Gawad, K.M. Optimization of alginate alkaline extraction technology from Sargassum latifolium and its potential antioxidant and emulsifying properties. Carbohydr. Polym. 2017, 157, 1903–1912. [Google Scholar] [CrossRef]
  49. Mohammed, A.; Bissoon, R.; Bajnath, E.; Mohammed, K.; Lee, T.; Bissram, M.; John, N.; Jalsa, N.K.; Lee, K.-Y.; Ward, K. Multistage extraction and purification of waste Sargassum natans to produce sodium alginate: An optimization approach. Carbohydr. Polym. 2018, 198, 109–118. [Google Scholar] [CrossRef]
  50. Mohammed, A.; Rivers, A.; Stuckey, D.C.; Ward, K. Alginate extraction from Sargassum seaweed in the Caribbean region: Optimization using response surface methodology. Carbohydr. Polym. 2020, 245, 116419. [Google Scholar] [CrossRef]
  51. Thiviya, P.; Gamage, A.; Gama-Arachchige, N.S.; Merah, O.; Madhujith, T. Seaweeds as a Source of Functional Proteins. Phycology 2022, 2, 216–243. [Google Scholar] [CrossRef]
  52. Diniz, G.S.; Barbarino, E.; Oiano-Neto, J.; Pacheco, S.; Lourenço, S.O. Gross Chemical Profile and Calculation of Nitrogen-to-Protein Conversion Factors for Five Tropical Seaweeds. Am. J. Plant Sci. 2011, 2, 287–296. [Google Scholar] [CrossRef]
  53. Tagliapietra, B.L.; Salvador-Reyes, R.; Pinto, C.C.; Souza, S.M.; Pallone, J.A.L.; Bezerra, J.A.; Mar, J.M.; Sanches, E.A.; Clerici, M.T.P.S. Nutritional and techno-functional properties of the brown seaweed Sargassum filipendula. Food Res. Int. 2024, 191, 114728. [Google Scholar] [CrossRef]
  54. Holdt, S.L.; Kraan, S. Bioactive compounds in seaweed: Functional food applications and legislation. J. Appl. Phycol. 2011, 23, 543–597. [Google Scholar] [CrossRef]
  55. Pereira, L. Edible Seaweeds of the World; CRC Press: Boca Raton, FL, USA, 2016. [Google Scholar]
  56. Cian, R.E.; Martínez-Augustin, O.; Drago, S.R. Bioactive properties of peptides obtained by enzymatic hydrolysis from protein byproducts of Porphyra columbina. Food Res. Int. 2015, 73, 204–212. [Google Scholar] [CrossRef]
  57. Gómez-Ordóñez, E.; Jiménez-Escrig, A.; Rupérez, P. Bioactivity of sulfated polysaccharides from the edible red seaweed Mastocarpus stellatus. Bioact. Carbohydr. Diet. Fibre 2014, 3, 29–40. [Google Scholar] [CrossRef]
  58. Fleurence, J. Seaweed proteins: Biochemical, nutritional aspects and potential uses. Trends Food Sci. Technol. 1999, 10, 25–28. [Google Scholar] [CrossRef]
  59. Mišurcová, L.; Ambrožová, J.V.; Samek, D. Seaweed lipids as nutraceuticals. Adv. Food Nutr. Res. 2012, 64, 339–355. [Google Scholar] [CrossRef]
  60. Barbarino, E.; Lourenço, S.O. An evaluation of methods for extraction and quantification of protein from marine macro- and microalgae. J. Appl. Phycol. 2005, 17, 447–460. [Google Scholar] [CrossRef]
  61. Laeliocattleya, R.A.; Yunianta, Y. Fucoidan content from brown seaweed (Sargassum filipendula) and its potential as radical scavenger. J. Phys. Conf. Ser. 2020, 1430, 012023. [Google Scholar] [CrossRef]
  62. Hardouin, K.; Burllot, A.-S.; Umami, A.; Tanniou, A.; Stiger-Pouvreau, V.; Widowati, I.; Bedoux, G.; Bourgougnon, N. Biochemical and antiviral activities of enzymatic hydrolysates from different invasive French seaweeds. Int. J. Mol. Sci. 2021, 22, 3263. [Google Scholar] [CrossRef]
  63. Davis, T.; Volesky, B.; Vieira, R. Sargassum seaweed as biosorbent for heavy metals. Water Res. 2000, 34, 4270–4278. [Google Scholar] [CrossRef]
  64. Adeyemi, I.; Abu-Zahra, M.R.M.; Alnashef, I.M. Physicochemical properties of alkanolamine-choline chloride deep eutectic solvents: Measurements, group contribution and artificial intelligence prediction techniques. J. Mol. Liq. 2018, 256, 581–590. [Google Scholar] [CrossRef]
  65. Ishaq, M.; Gilani, M.A.; Bilad, M.R.; Faizan, A.; Raja, A.A.; Afzal, Z.M.; Khan, A.L. Exploring the potential of highly selective alkanolamine containing deep eutectic solvents based supported liquid membranes for CO2 capture. J. Mol. Liq. 2021, 341, 117274. [Google Scholar] [CrossRef]
  66. Obluchinskaya, E.D.; Pozharitskaya, O.N.; Shevyrin, V.A.; Kovaleva, E.G.; Flisyuk, E.V.; Shikov, A.N. Optimization of Extraction of Phlorotannins from the Arctic Fucus vesiculosus Using Natural Deep Eutectic Solvents and Their HPLC Profiling with Tandem High-Resolution Mass Spectrometry. Mar. Drugs 2023, 21, 263. [Google Scholar] [CrossRef]
  67. Sushil, S.; Sakpal, S.H. Transition of a deep eutectic solution to aqueous solution: A dynamical perspective of the dissolved solute. J. Phys. Chem. Lett. 2021, 12, 8784–8789. [Google Scholar] [CrossRef]
  68. Fang, Y.; Liu, L.; Feng, Y.; Li, X.-S.; Guo, Q.-X. Effects of hydrogen bonding to amines on the phenol/phenoxyl radical oxidation. J. Phys. Chem. A 2002, 106, 4669–4678. [Google Scholar] [CrossRef]
  69. Xiong, D.; Zhang, Q.; Ma, W.; Wang, Y.; Wan, W.; Shi, Y.; Wang, J. Temperature-switchable deep eutectic solvents for selective separation of aromatic amino acids in water. Sep. Purif. Technol. 2021, 264, 118479. [Google Scholar] [CrossRef]
  70. Thakuria, R.; Nath, N.K.; Saha, B.K. The nature and applications of π–π interactions: A perspective. Cryst. Growth Des. 2019, 19, 791–805. [Google Scholar] [CrossRef]
  71. Yao, X.-H.; Zhang, D.-Y.; Duan, M.-H.; Cui, Q.; Xu, W.-J.; Luo, M.; Li, C.-Y.; Zu, Y.-G.; Fu, Y.-J. Preparation and determination of phenolic compounds from Pyrola incarnata Fisch. with a green polyols-based deep eutectic solvent. Sep. Purif. Technol. 2015, 149, 116–123. [Google Scholar] [CrossRef]
  72. Sardari, R.R.R.; Prothmann, J.; Gregersen, O.; Turner, C.; Karlsson, E.N. Identification of phlorotannins in the brown algae, Saccharina latissima and Ascophyllum nodosum by ultra-high-performance liquid chromatography coupled to high-resolution tandem mass spectrometry. Molecules 2021, 26, 43. [Google Scholar] [CrossRef]
  73. Taniguchi, M.; LaRocca, C.A.; Bernat, J.D.; Lindsey, J.S. Digital database of absorption spectra of diverse flavonoids enables structural comparisons and quantitative evaluations. J. Nat. Prod. 2023, 86, 1087–1119. [Google Scholar] [CrossRef]
  74. Ishiyama, T.; Tahara, T.; Morita, A. Why the photochemical reaction of phenol becomes ultrafast at the air–water interface: The effect of surface hydration. J. Am. Chem. Soc. 2022, 144, 6321–6325. [Google Scholar] [CrossRef]
  75. Costa, J.I. Síntese de Compostos Multiporfirínicos Covalentes. Tese de doutorado em Química. Departamento de Química, Universidade de Aveiro, Aveiro, Portugal. 2015. Available online: http://hdl.handle.net/10773/16049 (accessed on 26 March 2025).
  76. Berlanga-Del Pozo, M.; Gallardo-Guerrero, L.; Gandul-Rojas, B. Influence of alkaline treatment on structural modifications of chlorophyll pigments in NaOH—Treated table olives preserved without fermentation. Foods 2020, 9, 701. [Google Scholar] [CrossRef]
  77. Gandul-Rojas, B.; Roca, M.; Gallardo-Guerrero, L. Chlorophylls and carotenoids in food products from olive tree. In Olive and Olive Oil Bioactive Constituents; InTech Open Limited: London, UK, 2016. [Google Scholar] [CrossRef]
  78. Kang, Y.-R.; Park, J.; Jung, S.K.; Chang, Y.H. Synthesis, characterization, and functional properties of chlorophylls, pheophytins, and Zn-pheophytins. Food Chem. 2018, 245, 943–950. [Google Scholar] [CrossRef]
  79. Britton, G.; Liaaen-Jensen, S.; Pfander, H. Carotenoids, volume 1A, isolation and analysis; volume 1B, spectroscopy: Edited by G. Britton, S. Liaaen-Jensen and H. Pfander, Birkhauser-Verlag, Basel, 1995. 1st Vol, 328 pp. 2nd Vol, 360 pp. £74.00 ISBN 3-7643-2908-4 & 3-7643-2909-2. Phytochemistry 1995, 45, 1095. [Google Scholar] [CrossRef]
  80. Horta, A.; Duarte, A.M.; Barroso, S.; Pinto, F.R.; Mendes, S.; Lima, V.; Saraiva, J.A.; Gil, M.M. Extraction of antioxidants from brown macroalgae Fucus spiralis. Molecules 2024, 29, 2271. [Google Scholar] [CrossRef]
  81. Subbiah, V.; Ebrahimi, F.; Agar, O.T.; Dunshea, F.R.; Barrow, C.J.; Suleria, H.A.R. Comparative study on the effect of phenolics and their antioxidant potential of freeze-dried Australian beach-cast seaweed species upon different extraction methodologies. Pharmaceuticals 2023, 16, 773. [Google Scholar] [CrossRef]
  82. García-Vaquero, M.; Ravindran, R.; Walsh, O.; O’Doherty, J. Evaluation of ultrasound, microwave, ultrasound–microwave, hydrothermal and high pressure assisted extraction technologies for the recovery of phytochemicals and antioxidants from brown macroalgae. Mar. Drugs 2021, 19, 309. [Google Scholar] [CrossRef]
  83. Dinh, T.V.; Saravana, P.S.; Woo, H.C.; Chun, B.S. Ionic liquid-assisted subcritical water enhances the extraction of phenolics from brown seaweed and its antioxidant activity. Sep. Purif. Technol. 2018, 196, 287–299. [Google Scholar] [CrossRef]
  84. Toan, T.Q.; Phong, T.D.; Tien, D.D.; Linh, N.M.; Anh, N.T.M.; Minh, P.T.H.; Duy, L.X.; Nghi, D.H.; Thi, H.H.P.; Nhut, P.T.; et al. Optimization of Microwave-Assisted Extraction of Phlorotannin From Sargassum swartzii (Turn.) C. Ag. With Ethanol/Water. Nat. Prod. Commun. 2021, 16, 1–11. [Google Scholar] [CrossRef]
  85. Lourenço-Lopes, C.; Fraga-Corral, M.; Garcia-Perez, P.; Carreira-Casais, A.; Silva, A.; Simal-Gandara, J.; Prieto, M. A HPLC-DAD method for identifying and estimating the content of fucoxanthin, β-carotene and chlorophyll a in brown algal extracts. Food Chem. Adv. 2022, 1, 100095. [Google Scholar] [CrossRef]
  86. Sanger, G.; Wonggo, D.; Montolalu, L.A.D.Y.; Dotulong, V. Pigments constituents, phenolic content and antioxidant activity of brown seaweed Sargassum sp. IOP Conf. Ser. Earth Environ. Sci. 2022, 1033, 012057. [Google Scholar] [CrossRef]
  87. Usman, H.; Farouq, A.; Baki, A.; Abdulkadir, N.; Gani, M. Production and characterization of orange pigment produced by Halophilic bacterium Salinococcus roseus isolated from Abattoir soil. J. Microbiol. Exp. 2018, 6, 6. [Google Scholar] [CrossRef]
  88. Smith, E.L.; Abbott, A.P.; Ryder, K.S. Deep eutectic solvents (DESs) and their applications. Chem. Rev. 2014, 114, 11060–11082. [Google Scholar] [CrossRef]
  89. EU. Implementing Regulation (EU) No 371/2011 Regarding the Maximum Limit of Dimethylaminoethanol (DMAE); European Union: Brussels, Belgium, 2018; Available online: https://eur-lex.europa.eu/legal-content/pt/TXT/?uri=CELEX%3A32018R1936 (accessed on 30 March 2025).
  90. ECHA. Search for Chemicals. 2-Dimethylaminoethanol (CAS 108-01-0); European Chemicals Agency: Helsinki, Finland, 2024; Available online: https://echa.europa.eu/substance-information/-/substanceinfo/100.003.221 (accessed on 30 March 2025).
  91. Lethesh, K.C.; Parmentier, D.; Dehaen, W.; Binnemans, K. Phenolate platform for anion exchange in ionic liquids. RSC Adv. 2012, 2, 11936–11943. [Google Scholar] [CrossRef]
  92. Zhang, J.; Zhang, Z.; Yao, L.; Qian, M.; Li, Z.; Han, Y.; Bai, S.; Lee, M. pH-responsive switchable deep eutectic solvents to mediate pretreatment method for trace analysis of triazole fungicides in peel wastes. Food Chem. 2023, 417, 135486. [Google Scholar] [CrossRef]
  93. Yu, X.; Li, M.; Yagoub, A.E.A.; Chen, L.; Zhou, C.; Yan, D. Switchable (pH driven) aqueous two-phase systems formed by deep eutectic solvents as integrated platforms for production-separation 5-HMF. J. Mol. Liq. 2020, 310, 115158. [Google Scholar] [CrossRef]
  94. Chemat, F.; Vian, M.A.; Cravotto, G. Green extraction of natural products: Concept and principles. Int. J. Mol. Sci. 2012, 13, 8615–8627. [Google Scholar] [CrossRef] [PubMed]
  95. Dong, X.; Bai, Y.; Xu, Z.; Shi, Y.; Sun, Y. Phlorotannins from Undaria pinnatifida sporophyll: Extraction, antioxidant, and anti-inflammatory activities. Mar. Drugs 2019, 17, 434. [Google Scholar] [CrossRef]
  96. Cacace, J.E.; Mazza, G. Mass transfer process during extraction of phenolic compounds from milled berries. J. Food Eng. 2003, 59, 379–389. [Google Scholar] [CrossRef]
  97. Antony, A.; Farid, M. Effect of temperatures on polyphenols during extraction. Appl. Sci. 2022, 12, 2107. [Google Scholar] [CrossRef]
  98. Park, Y.-S.; Roy, V.C.; Park, J.-S.; Zhang, W.; Chun, B.-S. Optimization of subcritical water extraction parameters of phlorotannins from brown alga (Ecklonia stolonifera): Bipotentialities and possible applications. J. Supercrit. Fluids 2025, 218, 106502. [Google Scholar] [CrossRef]
  99. Amarante, S.J.; Catarino, M.D.; Marçal, C.; Silva, A.M.S.; Ferreira, R.; Cardoso, S.M. Microwave-assisted extraction of phlorotannins from Fucus vesiculosus. Mar. Drugs 2020, 18, 559. [Google Scholar] [CrossRef] [PubMed]
  100. Erge, H.S.; Karadeniz, F.; Koca, N.; Soyer, Y. Effect of heat treatment on chlorophyll degradation and color loss in green peas. GIDA 2008, 33, 225–233. [Google Scholar]
  101. Sukumaran, S.T.; Sugathan, S.; Abdulhameed, S. (Eds.) Plant Metabolites: Methods, Applications and Prospects: Springer Nature: Berlin/Heidelberg, Germany, 2020. [CrossRef]
  102. Kardile, N.B.; Nanda, V.; Thakre, S. Thermal degradation kinetics of total carotenoid and colour of mixed juice. Agric. Res. 2019, 8, 1–10. [Google Scholar] [CrossRef]
  103. Predescu, N.C.; Papuc, C.; Nicorescu, V.; Gajaila, I.; Goran, G.V.; Petcu, C.D.; Stefan, G. The influence of solid-to-solvent ratio and extraction method on total phenolic content, flavonoid content and antioxidant properties of some ethanolic plant extracts. Rev. Chim. 2016, 67, 1921–1926. [Google Scholar]
  104. Boi, V.N.; Cuong, D.X.; Vinh, P.T.K. Effects of extraction conditions over the phlorotannin content and antioxidant activity of extract from brown algae Sargassum serratum. Free. Radic. Antioxid. 2001, 7, 1. [Google Scholar] [CrossRef]
  105. Isci, A.; Kaltschmitt, M. Recovery and recycling of deep eutectic solvents in biomass conversions: A review. Biomass Convers. Biorefinery 2022, 12, 197–226. [Google Scholar] [CrossRef]
  106. Zhang, Y.; Wang, H.; Yuan, F.; Li, Y.; Yu, D.; Liang, X. Quantitative recovery and regeneration of basic deep eutectic solvent for biomass treatment with industrialized membrane-based strategy. Ind. Crops Prod. 2024, 221, 119419. [Google Scholar] [CrossRef]
  107. Della, S.P.; Gallo, V.; Gentili, A.; Fanali, C. Strategies for the recovery of bioactive molecules from deep eutectic solvents extracts. TrAC Trends Anal. Chem. 2022, 157, 116798. [Google Scholar] [CrossRef]
  108. Silva, C.N.; Silva, R.M.; Lemes, A.C.; Ribeiro, B.D. Recovery of phenolic compounds by deep eutectic solvents in orange by-products and spent coffee grounds. Sustainability 2024, 16, 7403. [Google Scholar] [CrossRef]
  109. Shahidi, F.; Ambigaipalan, P. Phenolics and polyphenolics in foods, beverages and spices: Antioxidant activity and health effects–A review. J. Funct. Foods 2015, 18 Pt B, 820–897. [Google Scholar] [CrossRef]
  110. Young, A.J.; Lowe, G.M. Antioxidant and prooxidant properties of carotenoids. Arch. Biochem. Biophys. 2001, 385, 20–27. [Google Scholar] [CrossRef] [PubMed]
  111. Lanfer-Marquez, U.M.; Barros, R.M.C.; Sinnecker, P. Antioxidant activity of chlorophylls and their derivatives. Food Res. Int. 2005, 38, 885–891. [Google Scholar] [CrossRef]
  112. Fernández-García, E.; Carvajal-Lérida, I.; Pérez-Gálvez, A. In vitro bioaccessibility assessment as a prediction tool of nutritional efficiency. Nutr. Res. 2009, 29, 751–760. [Google Scholar] [CrossRef]
  113. Barbosa, M.; Fernandes, F.; Carlos, M.J.; Valentão, P.; Andrade, P.B. Adding value to marine invaders by exploring the potential of Sargassum muticum (Yendo) Fensholt phlorotannin extract on targets underlying metabolic changes in diabetes. Algal Res. 2021, 59, 102455. [Google Scholar] [CrossRef]
  114. Farvin, K.H.S.; Jacobsen, C. Phenolic compounds and antioxidant activities of selected species of seaweeds from Danish coast. Food Chem. 2013, 138, 1670–1681. [Google Scholar] [CrossRef]
Figure 1. Potential applications of residual biomass utilization.
Processes 13 01345 g001
Figure 2. Molecular structures of compounds used to form the eutectic solvent mixture, divided into HBA and HBD.
Processes 13 01345 g002
Figure 3. Comparison of yields of phenolic compounds (TPC—mg GAE/g) extracted with eutectic solvents with (30%) and without the addition of water (0%). Statistical analyses are presented in Table A1.
Processes 13 01345 g003
Figure 4. Yields of total polyphenols (TPC) and phlorotannins (TTC) from conventional and extracted with deep eutectic solvents. Statistical analyses are presented in Table A1.
Processes 13 01345 g004
Figure 5. Yields of total pigments and standard deviation of the extractions. Statistical analyses are presented in Table A1.
Processes 13 01345 g005
Figure 7. Representation of Desirability Surface Contours using the Spline Adjustment Method for the eutectic solvents DMAE:BzOH (1.30) and DMAE:13PDO (1.83).
Processes 13 01345 g007
Table 1. Eutectic solvents used in this work with their respective ratios and properties.
HBAHBDHBA/
HBD
AbbreviationpH (0–30% H2O)Stage 1 DegradationStage 2 Degradation−50% wt
DMAEBzOH1.30DMAE:BzOH (1.30)11.18–10.63102.57135.33105.14
CinnOH3.25DMAE:CinnOH (3.25)10.32–10.0579.02161.2278.14
GLY2.57DMAE:GLY (2.57)11.40–10.9181.78209.2786.65
13PDO1.83DMAE:13PDO (1.83)11.47–10.7894.98159.21105.27
Sor5.36DMAE:Sor (5.36)11.50–10.9182.49326.3475.85
12PDO0.86DMAE:12PDO (0.86)11.45–10.9092.74129.4496.83
MAECinnOH1.832-MAE:CinnOH (1.83)12.49–11.86107.33166.00112.07
GLY1.442-MAE:GLY (1.44)12.50–12.06114.84216.19132.11
Sor4.22-MAE:Sor (4.2)12.90–12.25109.92317.10106.03
BzOH0.822-MAE:BzOH (0.82)12.52–11.65146.66-126.86
12PDO0.442-MAE:12PDO (0.44)12.22–11.66147.22-129.70
13PDO0.632-MAE:13PDO (0.63)12.59–11.93155.53-135.03
DEABzOH0.37DEA:BzOH (0.37)11.47–11.93155.61193.94152.20
CinnOH0.90DEA:CinnOH (0.9)11.40–10.77196.99-186.09
Sor2.32DEA:Sor (2.32)11.60–10.96200.99327.20202.63
GLY0.65DEA:GLY (0.65)11.60–10.84224.61-208.71
12PDO0.15DEA:12PDO (0.15)11.85–10.63150.20-133.26
13PDO0.19DEA:13PDO (0.19)12.00–10.77179.12-167.59
AMPBzOH0.85AMP:BzOH (0.85)11.03–10.65121.85-118.26
CinnOH1.67AMP:CinnOH (1.67)11.60–10.02110.54163.03118.69
GLY1.35AMP:GLY (1.35)11.66–11.13119.59203.72130.42
12PDO0.53AMP:12PDO (0.53)11.52–10.97129.14-125.16
13PDO0.63AMP:13PDO (0.63)11.70–11.21150.22-140.19
Sor3.97AMP:Sor (3.97)12.12–11.67102.15310.33107.05
Table 2. Extraction methods of bioactive compounds, including polyphenols, phlorotannins, and chlorophyll.
ProductsSpeciesOperational CondictionsContentReference
PolyphenolsFucus vesiculosusUAE; ChCl:LA 1:3 + 30% H2O; 22.80 min137.30 mg GAE/g[66]
Fucus spiralisHPAE; 300 s; 50 g/100 mL; 25% EtOH; 600 Mpa141.92 mg GAE/g[81]
Sargassum muticumMAE; 1:10; 100 °C; 3 min; Pro:1,2-But (1:4)24.00 mg GAE/g[14]
SLE; 1:20 (w/v); 16 h; 10 °C; 120 rpm; EtOH 96%3.20 mg GAE/g[82]
PhlorotanninsPelvetia canaliculateMAE; 1:10 (w/v); 250 W; 10 min; EtOH 50%40.85 mg PGE/g[83]
Sargassum japonicaSLE; 1:32 (w/v); 24 h; RT; 500 rpm; 0.5 M [C4C1im][BF4]2.10 mg PGE/g[84]
Sargassum swartziiMAE:H2O:EtOH (70:30); (35 v/m); 60 min; 560 W5.28 mg PGE/g[85]
ChlorophyllUlva PinnatifidaUAE; 500 W; 55 min; EtOH (30 g/L)/Centrifugation (8400 rpm, 7 min)/filtration (0.22 μm nylon)0.30 mg/g dw[86]
Saccharina latissimi0.07 mg/g dw
Sargassum sp. SLE; EtOH (1:10 m/v); 50 °C; 3 days0.62 mg/g dw[87]
Table 3. Results of the yields of optimized DESs: DMAE:BzOH (1.30); DMAE:13PDO (1.83).
SolventSampleTemperature (°C)Solid-Liquid
S/L
DPPH
(mg TE/mL)
ABTS
(mg TE/mL)
FRAP
(mg TE/mL)
DMAE:BzOH (1.30)Control --0.30 c23.04 c1.91 c
Extract 1120.40.170.69 a24.42 a2.26 a
Extract 274.40.030.40 b23.59 b2.00 b
DMAE:13PDO (1.83)Control--0.65 b23.13 c1.91 b
Extract 1120.40.140.87 a24.22 a2.24 a
Extract 268.40.030.73 b23.44 b2.06 b
Means within the same column followed by different lowercase letters are significantly different (Tukey’s test, p ≤ 0.05). Control: DES (DMAE:BzOH and DMAE:13PDO).
Disclaimer/Publisher’s Note: The statements, opinions and data contained in all publications are solely those of the individual author(s) and contributor(s) and not of MDPI and/or the editor(s). MDPI and/or the editor(s) disclaim responsibility for any injury to people or property resulting from any ideas, methods, instructions or products referred to in the content.

