Abstract
Urea level determination in biological fluids provides nutritional information regarding the body metabolism and/or the renal condition. In order to propose a rapid determination of this biomarker at low levels in biological fluid samples, the present work developed an electrochemical sensor based on a simple arrangement of a nickel-nanoparticle-modified glassy carbon electrode (GCE/NiNPs). Under optimal conditions for selective urea detection, a linear response was obtained in the range of 0.085 to 3.10 mmol L−1 (R = 0.9993), with a limit of detection of 60.0 µmol L−1 and limit of quantification of 198.0 µmol L−1. The GCE/NiNPs sensor showed recovery rates from samples from 105 ± 0.2% (hemodialysis wastewater) to 111 ± 0.3% (dialysate) for urea determination in biological fluid samples. The results obtained showed that the proposed method is relatively easy to operate and has a good degree of reliability and the satisfactory sensitivity required for monitoring urea, as well as exhibiting excellent detection capacity in the presence of possible interferents in both samples.
1. Introduction
Urea is a substance produced by the human body in the liver through biochemical processes which involve the conversion of protein nitrogen from food. Once formed, urea is removed from the body through the kidneys and excreted as residue in urine [1,2,3]. A total of approximately 80 to 90% of all consumed nitrogen is excreted in the form of urea [3]; it should be noted however that the body’s failure to excrete nitrogen, often caused by renal failure, can pose serious health risks to humans, including the occurrence of azotemia or uremic syndrome [3].
Renal failure is a medical condition in which an individual’s kidneys stop working properly and fail to perform their excretory and regulatory functions satisfactorily [4]. When there is a decrease or paralysis in the functioning of the kidneys, the excretory functions are the most affected, and toxic substances ingested, absorbed or metabolized by the body are not properly eliminated; this causes several damages to the individual’s health and may even lead to death in more serious cases [5]. According to the National Kidney Foundation, approximately 10% of the entire world population is affected by chronic kidney disease, making it the 18th leading cause of death in the world, with an annual mortality rate of 16.3 people per 100,000 population [6].
Patients with levels of urea concentration greater than 30.0 mmol L−1 need dialysis and/or hemodialysis treatments; these treatments are meant to artificially filter and remove toxins from the blood [6,7]. Typically, patients undergoing hemodialysis treatment are subjected to several treatment sessions per week. The number of sessions depends on the biomedical quality of the treatment and on the evaluation and monitoring of various biological and physical–chemical parameters of the patient’s blood and urine [5,7,8]; this monitoring is performed mainly through the analysis of the creatinine and urea levels in the blood and urine, which are broad-spectrum markers of toxic solutes accumulated in the body of a sick individual [7,9].
The determination of urea levels provides nutritional information about the body, and an increase in one’s urea levels is an indication of malnutrition which may stem from changes in the rates of protein metabolism or renal failure [7,9]. The ideal clearance rates for urea in blood and in hemodialysis wastewater are between 3.0 and 6.7 mmol L−1, and 3.0 and 16.0 mmol L−1, respectively; these rates vary according to the age, weight and sex of the individual [3,9,10]. Taking the above considerations into account, it is clear that the rapid determination of urea at low concentration levels is of utmost importance, as it can help in the early diagnosis of chronic or acute renal failure [7].
A number of studies published in the literature have reported the use of a wide range of analytical methods for urea determination in different matrices; most of the methods employed have generally included the following: fluorometry [3], spectrophotometry [11,12], chromatography [13,14], infrared spectroscopy [15] and electrochemical techniques [6,7,8,9,10,16,17,18,19,20,21,22,23,24,25,26,27,28]. Remarkably though, most of the aforementioned methods employed for urea determination make use of substances, such as reagents and solvents, of non-negligible toxicity; moreover, these methods mostly involve chemical reactions with different compounds, either to generate products for colorimetric analysis or for derivatization in chromatographic analyses. Also, the aforementioned analytical methods largely require expensive sample preparation, and this leads to a considerable increase in costs and time of analysis. Regarding electroanalytical methods, most of the methods employed for urea determination are based on the dosage of ammonia, which is produced through the hydrolysis of urea catalyzed by the urease enzyme. Thus, the development of a simple, fast and direct analytical method for urea detection using electrochemical sensors with high sensitivity and free of interferences is undoubtedly a matter of public health concern.
Bearing that in mind, the present work sought to develop a simple electrochemical sensor for the direct determination of urea in blood and urine samples which is devoid of any creatinine interference. The sensor was constructed by modifying the surface of a glassy carbon electrode with nickel nanoparticles (which were electrodeposited on the electrode surface). The arrangement involving the incorporation of this nanometric design based on nickel nanoparticles leads to the development of a sensor with greater surface area, large pore size and uniform pore structure, and which is highly capable of pre-concentrating urea, as previously confirmed for other analytes with complex electrochemical behavior [29,30,31,32,33,34,35,36,37,38,39,40]. As observed previously for other analytes, nickel nanoparticles (NiNPs) have the ability to catalyze the oxidation of urea, which is oxidized at very high potential on unmodified electrodes [21,22,23,24,25,26].
To date, several studies reported in the literature have employed electrodes modified by nickel nanoparticles (NiNPs) for the electrochemical detection and quantification of amino acids, carbohydrates, synthetic dyes, hydrogen peroxide and organic acids [33,35,36,37,38,39,40]; nonetheless, none of these studies have employed these NiNPs-modified electrodes for urea determination. When it comes to the use of NiNPs as carbon electrode modifiers, other works reported in the literature have shown that electrodes modified with these nanoparticles are quick and easy to manipulate, are of low cost, and have wide linear concentration range, low detection limits, high sensitivity and good reproducibility [33,35,36,37,38,39,40].
Thus, the present study sought to develop an electrochemical sensor based on a non-enzymatic process for the detection and determination of urea in bovine serum albumin (BSA; simulating human blood plasma), artificial urine, dialysate and hemodialysis wastewater samples (simulating human urine) using a glassy carbon electrode modified with nickel nanoparticles (GCE/NiNPs).
2. Materials and Methods
2.1. Reagents and Equipment
All reagents used in the development of the study were of analytical grade. The reagents nickel sulphate hexahydrate (NiSO4·6H2O, 99.0%), sodium hydroxide (NaOH, 98.0%), uric acid (C5H4N4O3, 99.0%), glycine (C2H5NO2, 99.0%), bovine albumin (BSA, 96.0–99.0%), cysteine (C3H7NO2S, 97.0%), calcium chloride (CaCl2.H2O, 99.0%) and sodium chloride (NaCl, 99.8%) were obtained from Sigma-Aldrich (St. Louis, MO, EUA). Anhydrous sodium sulphate (Na2SO4, 99.0%), anhydrous monobasic potassium phosphate (KH2PO4, 99.0%) and urea (C4N2O, 99.0%) were acquired from Synth (Diadema, SP, Brazil). Anhydrous sodium sulphate (Na2SO4, 99.0%), anhydrous monobasic potassium phosphate (KH2PO4, 99.0%) and urea (C4N2O, 99.0%) were acquired from Synth (Diadema, SP, Brazil). Potassium chloride (KCl, 99.0–105.0%) and ammonium chloride (NH4Cl, 99.5%) were purchased from NEON (Suzano, SP Brazil). Potassium chloride (KCl, 99.0–105.0%) and ammonium chloride (NH4Cl, 99.5%) were purchased from NEON (Suzano, SP, Brazil). Potassium ferricyanide (K3Fe(CN)6, 99.0%) and potassium ferrocyanide (K4Fe(CN)6, 99.0%) were obtained from Qhemis (Jundiaí, SP Brazil). Potassium ferricyanide (K3Fe(CN)6, 99.0%) and potassium ferrocyanide (K4Fe(CN)6, 99.0%) were obtained from Qhemis (Jundiaí, SP, Brazil). All the aqueous solutions were prepared using ultrapure water from Milli-Q System, Millipore (Burlington, MA, EUA).
The electrochemical experiments were performed using an Metrohm Autolab PGSTAT-204 potentiostat/galvanostat (Herisau, Switzerland) and the NOVA 2.10 software. The measurements were carried out using a conventional electrochemical cell of 25 mL with a three-electrode system. A platinum wire, Ag/AgCl (KCl 3.0 mol L−1) and glassy carbon electrode (GCE, geometric area: 0.031 cm2) modified with NiNPs were used as counter, reference and working electrode, respectively, in all the electrochemical studies.
The measurements of pH were performed using a pH meter from Bel Engineering (Milan, Italy), model W38, with Ag/AgCl(sat) glass electrode (3.0 mol L−1 KCl).
2.2. Modification of GCE Electrode with NiNPs (GCE-NiNPs)
Initially, the GCE was cleaned by cyclic voltammetry (CV) using five successive sweep cycles in the potential range of −1.5 to 1.0 V, with scan rate (υ) of 50 mV s−1, in a nitric acid solution at 20.0% (v/v) in order to remove all impurities from the electrode surface; the electrode was then washed abundantly with ultrapure water.
After washing, the NiNPs were electrodeposited on the GCE surface by chronoamperometry, using 200.0 mmol L−1 Na2SO4 in the presence of 25.0 mmol L−1 NiSO4 solution. The chronoamperometry parameters employed were as follows: charge of 8.0 mC, potential of −0.85 V and electrodeposition time of 100 s.
After modifying the GCE with NiNPs, the electrode was washed with ultrapure water and electroactivated. The electroactivation of the sensor was performed using 30 successive cycles of CV in 10 mL of 100.0 mmol L−1 NaOH solution and a potential range of 0.10 to 0.80 V, with a scan rate of 100.0 mV s−1 to oxidize the NiNPs on the electrode surface.
2.3. Morphological and Electrochemical Characterization of the GCE/NINPs
For the characterization of the surface of the GCE/NINPs, scanning electron microscopy (SEM) measurements were performed using a field effect electron emission gun scanning electron microscope (SEM-FEG) Jeol, model JSM-7500F (Tokyo, Japan). Energy dispersive X-ray (EDX) spectra were also obtained in order to analyze the chemical species present on the electrode.
The electrochemical characterization of the GCE/NINPs was performed by electrochemical impedance spectroscopy (EIS); this analysis was conducted using the following: a solution of KCl 0.1 mol L−1 containing 10.0 mmol L−1 K3[Fe(CN)6]/K4[Fe(CN)6], which was used as a redox probe, frequency range of 0.10 Hz to 100 kHz, amplitude of 5.0 mV and applied potential of 0.22 V.
2.4. Study of the Electrochemical Behavior of Urea on Bare GCE and GCE/NiNPs
To develop the GCE/NiNPs sensor, some preliminary studies were carried out in order to find the best experimental conditions suitable for the modification of the GCE surface with NiNPs and for urea to exhibit a satisfactory electrochemical signal. First, three different solutions were evaluated; this was done in order to choose the best supporting electrolyte for the electrooxidation of the urea. The solutions evaluated as supporting electrolyte included the following: 100.0 mmol L−1 Na2SO4, 100.0 mmol L−1 NaOH and 100.0 mmol L−1 phosphate buffer (PB) at pH 7.0. The electrochemical sensor was prepared as described in Section 2.2, using the following initial conditions: electrodeposition potential of −1.3 V and charge of 5.0 mC.
After choosing the supporting electrolyte, the electrochemical behavior of urea was evaluated by cyclic voltammetry (CV) at a potential scan rate of 100.0 mV s−1.
2.5. Electroanalysis of Urea in Synthetic Biological Fluid Samples
Urea was quantified in bovine serum albumin (BSA) at 0.5% (v/v) and in artificial urine samples through standard addition and recovery experiments. The synthetic urine sample was prepared based on the procedure described by Hudari et al. [33]; this procedure involved mixing the following reagents in 100.0 mL ultrapure water: 0.29 g NaCl, 0.16 g KCl, 0.16 g CaCl2⋅6H2O, 0.32 g Na2SO4⋅10H2O, 0.14 g KH2PO4 and 0.10 g NH4Cl.
For the electrochemical analysis, samples of the BSA or/and the artificial urine sample were diluted to 20% (v/v) in 100.0 mmol L−1 NaOH and fortified with urea concentration of 1.0 mmol L−1; this was done without any previous treatment and under constant stirring through the application of chronoamperometry for a period of 60 s at a constant potential. Under these conditions, analyses were performed in triplicate using the standard addition method, where the standard was successively added to the sample in the concentration range of 0.25 to 1.0 mmol L−1.
Dialysate and hemodialysis wastewater samples were obtained from the Araraquara Regional Hemodialysis Reference Center (Araraquara, São Paulo State, Brazil). The samples were filtered using filters with porosity of 0.47 µm from Millipore. Samples were diluted 40 times in NaOH 100.0 mmol L−1 and used forurea detection. The urea quantification (n = 3) in the samples was performed by the standard addition method (same procedure applied to synthetic samples).
3. Results and Discussion
3.1. Electrochemical Behavior of Urea on the GCE/NiNPs Sensor
3.1.1. Analysis of the Supporting Electrolyte for the Electrooxidation of Urea and Surface Activation of the GCE/NiNPs
To develop the GCE/NiNPs sensor, some preliminary studies were carried out in order to find the best experimental conditions suitable for the modification of the GCE surface with NiNPs and for urea to exhibit a satisfactory electrochemical signal. First, three different solutions were investigated in order to choose the best supporting electrolyte for the electrooxidation of urea. The solutions investigated as supporting electrolytes included the following: 100.0 mmol L−1 Na2SO4, 100.0 mmol L−1 NaOH and 100.0 mmol L−1 PB at pH 7.0. The electrochemical sensor was prepared as described in Section 2.2, with the application of the following initial experimental conditions: electrodeposition potential of −1.3 V and charge of 5.0 mC. Figure S1 (Supplementary Material) shows the cyclic voltammetric behavior of the GCE/NiNPs in the presence (red curve) and absence of 3.0 mmol L−1 of urea (blue curve), based on the application of different supporting electrolytes.
Figure S1A (Supplementary Material) shows the results of a comparative analysis conducted using the cyclic voltammograms (CVs) obtained from the application of only 100.0 mmol L−1 NaOH as supporting electrolyte (Figure S1A, curve a) and in the presence of 3.0 mmol L−1 of urea (Figure S1A, curve b) on the GCE/NiNPs. The CVs obtained for the supporting electrolyte and urea exhibited an anodic peak potential (Eap) at 0.47 V, followed, in the reverse scan, by the cathodic reduction peak (Ecp) at 0.39 V which was associated with the redox behavior of NiNPs (this behavior was previously discussed in Section 3.3) [41]. By contrast, the voltammogram obtained in the presence of 3.0 mmol L−1 of urea (Figure S1A, curve b) did not show an increase in current in the Eap and Ecp observed in the same region containing only NaOH (curve a). However, a new anodic peak observed with an Eap at 0.55 V and peak anode current (Iap) of 22.9 µA that was associated with the presence of urea in the medium was observed (Figure S1A, curve b).
Figure S1B (Supplementary Material) compares the CVs obtained from the application of 100.0 mmol L−1 Na2SO4 as supporting electrolyte (Figure S1B, curve a) and 3.0 mmol L−1 of urea (Figure S1B, curve b) on the GCE/NiNPs. The CVs obtained for the supporting electrolyte exhibited an Eap at 0.47 V, followed, in the reverse scan, by Eap at 0.40 V. By contrast, the voltammogram obtained for the medium in the presence of 3.0 mmol L−1 of urea (Figure S1B, curve b) exhibited an Eap at 0.50 V, followed, in the reverse scan, by Eap at 0.41 V. In addition, regarding the voltammogram obtained for the medium containing 3.0 mmol L−1 of urea (Figure S1B, curve b), an increase of approximately 0.87 µA was observed in the Iap due to the presence of urea in the medium, and no significant difference was observed in terms of the cathodic peak current in comparison to the voltammogram obtained from the application of 100.0 mmol L−1 Na2SO4 as supporting electrolyte (Figure S1B, curve a).
Finally, Figure S1C (Supplementary Material) shows the results obtained from a comparative analysis of the CVs based on the application of 100.0 mmol L−1 PB as supporting electrolyte at pH 7.0 (curve a) and for the medium containing 3.0 mmol L−1 of urea (Figure S1C, curve b) on the GCE/NiNPs. The CVs obtained for both the supporting electrolyte (Figure S1C, curve a) and urea (Figure S1C, curve b) did not exhibit Eap and Ecp; this outcome indicates that the supporting electrolyte is not suitable for urea electrooxidation.
Thus, the results obtained in these comparative analyses clearly showed that hydroxide solution was the best electrolyte solution when it comes to stimulating the electrocatalysis of urea oxidation on the electrode of GCE/NiNPs. In view of that, the solution of 100.0 mmol L−1 NaOH was chosen as the supporting electrolyte for the conduct of further experiments.
3.1.2. Study of the Electrodeposition Charge of NiNPs on the GCE Surface
After selecting the best supporting electrolyte for urea electrooxidation and the best solution for the electroactivation of the surface of the GCE/NiNPs, studies were carried out in order to determine the best electrodeposition charge for the electrodeposition of NiNPs on the GCE surface. Electrodeposition charges ranging from 2.0 to 10.0 mC were evaluated through the application of a constant potential of −1.3 V. Electrochemical measurements of the analytical signal were performed by chronoamperometry, using constant potential of 0.50 V in 10.0 mL of 100.0 mmol L−1 NaOH solution in the presence of 1.0 mmol L−1 urea, after a period of 100 s targeted at the stabilization of the current. Figure 1 shows the chronoamperometric responses obtained from the application of 1.0 mmol L−1 urea on the GCE/NiNPs for the different charges evaluated (Figure 1A); in this same figure, one can see the amperogram of the analytical signal obtained after the addition of the urea aliquot to the electrode prepared using an electrodeposition charge of 8.0 mC (Figure 1B).
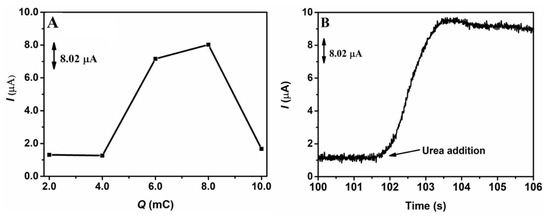
Figure 1.
Effects of electrodeposition charges on the chronoamperometric responses based on the application of 1.0 mmol L−1 of urea in 100.0 mmol L−1 of NaOH on the GCE/NiNPs electrode (A), and the respective amperogram obtained before and after the addition of 1.0 mmol L−1 of urea on the GCE-NiNPs electrode at the applied charge of 8.0 mC (B). Conditions: 0.50 V detection potential.
Looking at Figure 1A, based on the responses obtained from the GCE/NiNPs electrode for the different charges evaluated, we observed that the increase in electrodeposited charges from 4.0 mC to 8.0 mC led to a significant increase in the current signal, while charges above 8.0 mC resulted in a dramatic drop in the current signal. This result may be attributed to the loss of some properties of the nanoparticles, which consequently led to the formation of a film of nickel oxide/hydroxide species [42]. Thus, the best current was obtained from the application of the electrodeposition charge of 8.0 mC; this yielded an average current value of 8.02 µA for 1.0 mmol L−1 of urea.
Looking at Figure 1B, one will observe that there was a significant increase in current after the addition of 1.0 mmol L−1 of urea; this shows that urea was easily oxidized on the GCE/NiNPs and that NiNPs exhibited electrocatalytic activity for urea oxidation—this result essentially shows that the proposed electrode responds to the presence of urea concentrations.
3.1.3. Study of the Electrodeposition Potential of NiNPs on the GCE Surface
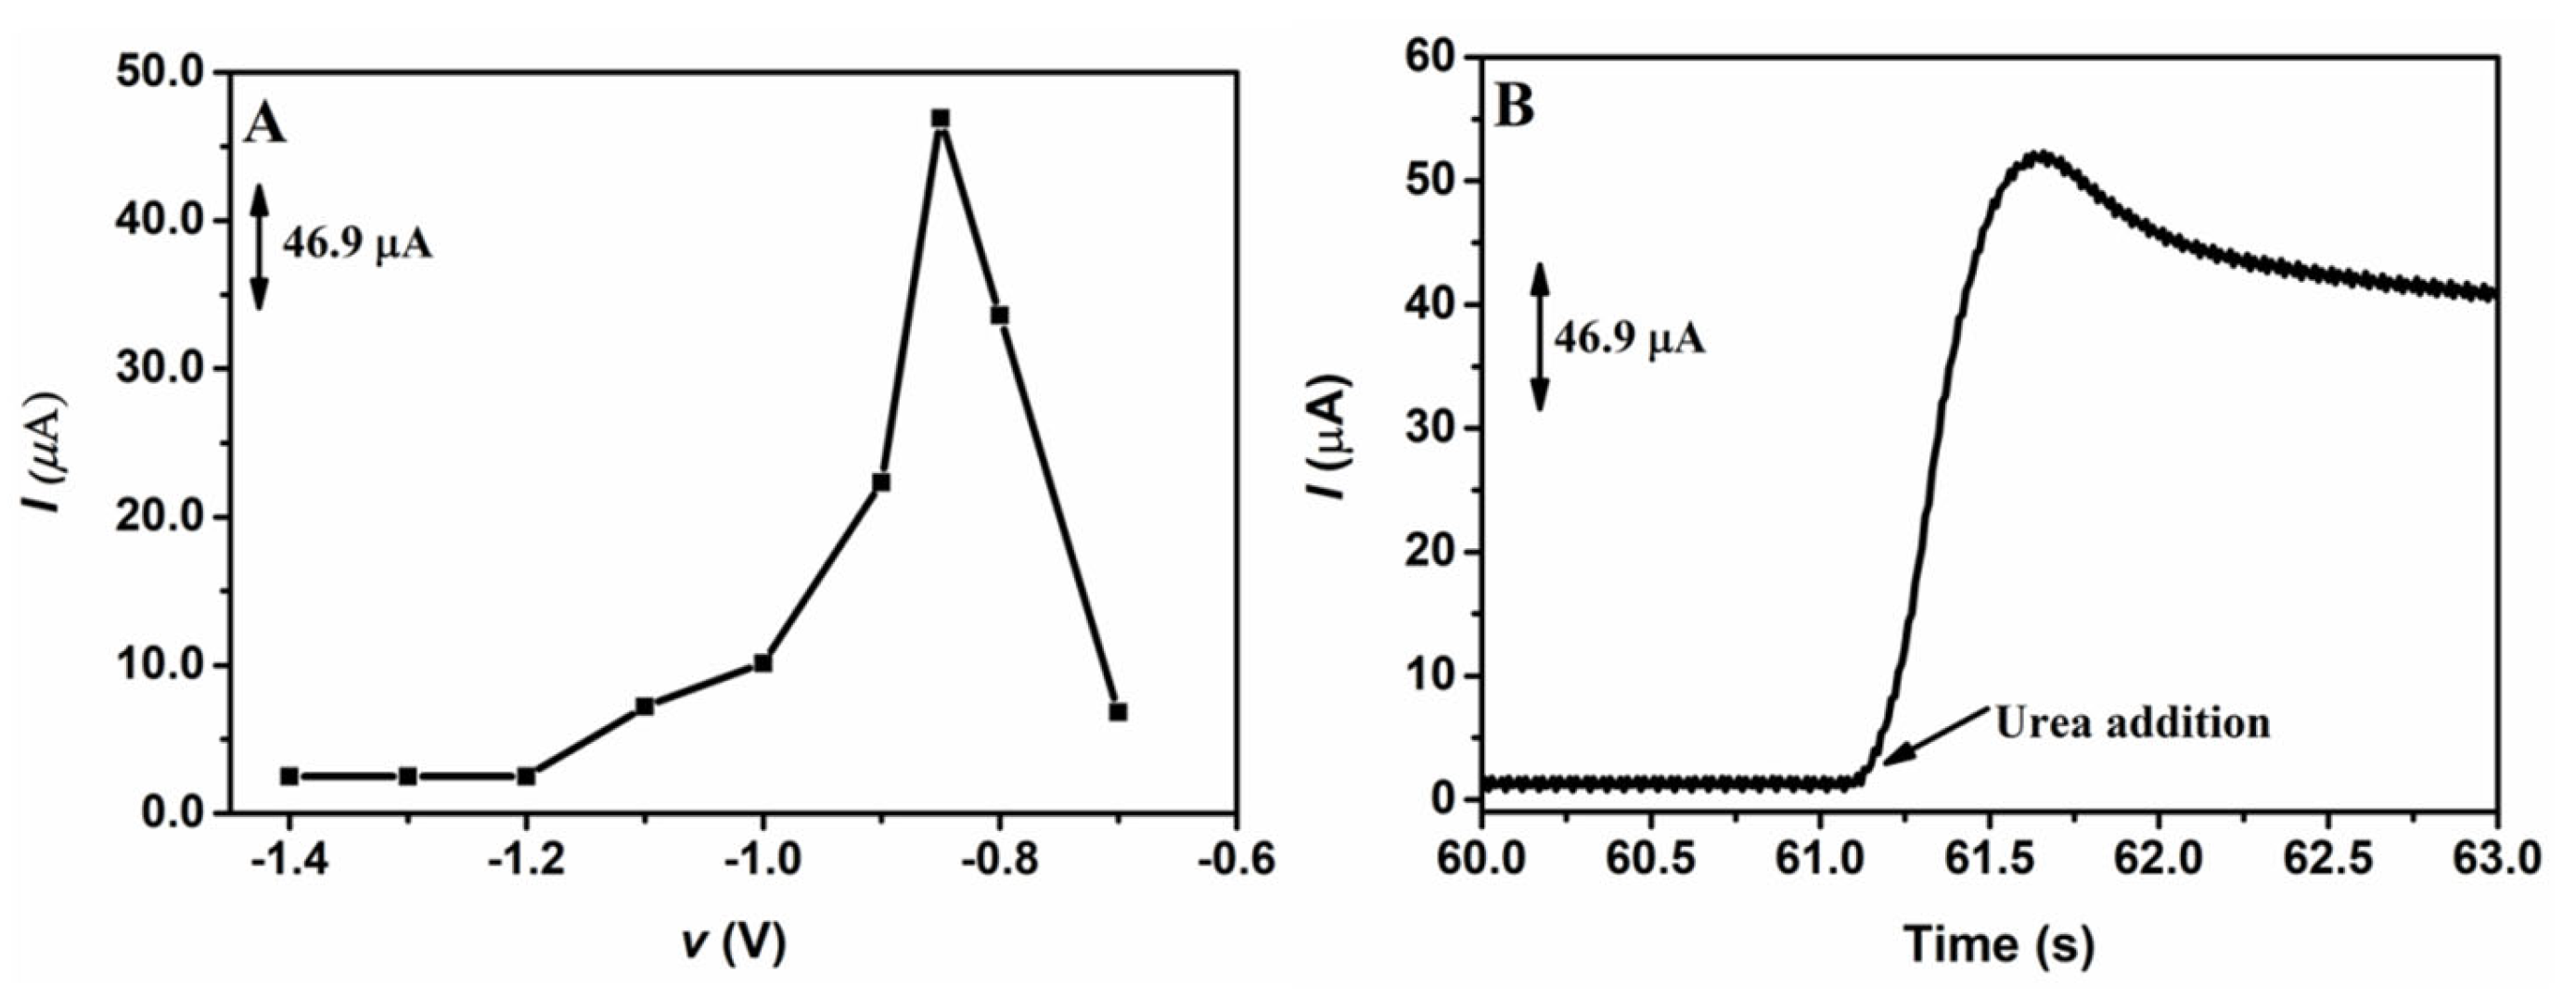
After optimizing the electrodeposition charge, a study was carried out in order to determine the best electrodeposition potential of NiNPs on the GCE. Similar to the study performed to determine the best electrodeposition charge, different potentials were applied in the electrodeposition of NiNPs on the GCE surface; the potentials applied varied from −1.4 to −0.70 V, while the electrodeposition charge was kept constant at 8.0 mC. Figure 2 shows the chronoamperometric responses obtained from the application of 1.00 mmol L−1 of urea on the GCE/NiNPs for the different electrodeposition potentials evaluated (Figure 2A) and the amperogram of the analytical signal obtained after the addition of the urea aliquot to the electrode prepared at the electrodeposition charge of 8.0 mC (Figure 2B).
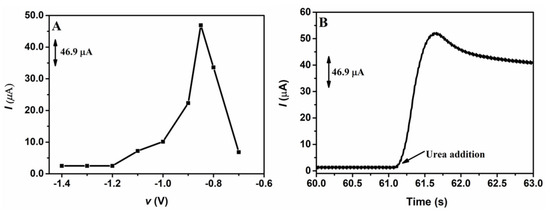
Figure 2.
Chronoamperometric responses for the application of 1.0 mmol L−1 urea in 100.0 mmol L−1 NaOH on the GCE/NiNPs using different electrodeposition potentials (A); amperogram obtained from the addition of urea on the GCE/NiNPs at the electrodeposition charge of 8.0 mC (B). Conditions applied: 0.50 V detection potential.
Looking at Figure 2A, based on the responses obtained from the application of the GCE/NiNPs at different electrodeposition potentials, one will observe that an increase in electrodeposition potential from −1.2 V to −0.85 V led to a significant increase in the current signal, while the application of potentials above −0.85 V resulted in a dramatic decrease in the current signal. This result may be attributed to the loss of relevant properties of the nanoparticles, which, consequently, resulted in the formation of a film of nickel oxide/hydroxide species [42]. Thus, the best current was obtained at the potential of −0.85 V, where an average current value of 44.0 µA was recorded for 1.0 mmol L−1 of urea.
In Figure 2B, one will observe a significant increase in current after the addition of 1.0 mmol L−1 urea; this shows that urea was easily oxidized on the GCE/NiNPs and that NiNPs exhibited electrocatalytic activity for urea oxidation—this result essentially shows that the proposed electrode continues to respond in the presence of urea concentrations.
3.2. Morphological and Electrochemical Characterization of the GCE/NINPs
In order to obtain further information regarding the performance of the GCE/NiNPs, SEM-FEG, EDX and EIS analyses were carried out; see the results in Figure 3. The SEM-FEG images obtained for the bare GCE and GCE/NiNPs (curves A and B, respectively) show that the latter exhibited clear spots which pointed to the homogenous dispersion of NiNPs on the GCE surface. The EDX spectrum of the GCE/NiNPs surface (Figure 3C) confirms the presence of carbon at 0.25 keV, oxygen at 0.51 keV and nickel at 0.91 and 7.51 keV. In addition, electrosynthesized NiNPs on the electrode surface were counted using the free ImageJ software (Version 1.54). The histogram of the GCE/NiNPs surface (Figure 3D) showed that the size of the nanoparticles varied from 1 to 90 nm (250 nanoparticles counted), with an average diameter of 39 ± 17 nm. Thus, based on these results and the electrochemical behavior observed previously, one can conclude that the homogenous distribution of NiNPs on the GCE increases the structure, uniformity and pore size of the device, and this contributes significantly toward the analyte pre-concentration on the electrode surface.
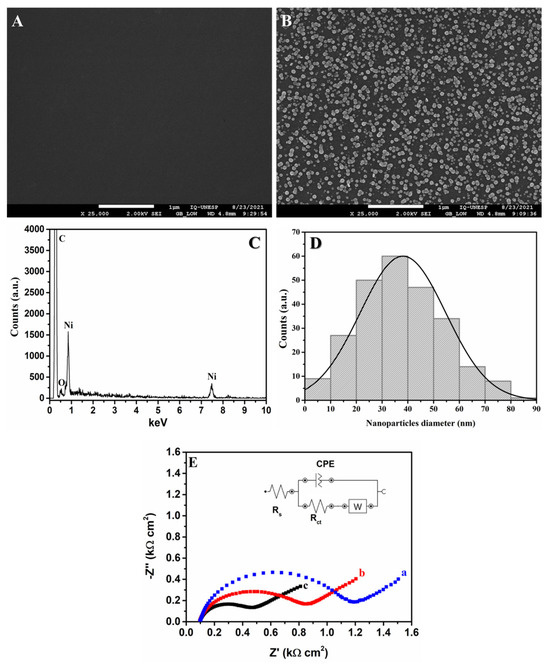
Figure 3.
SEM-FEG images obtained for the bare GCE surface (A) and the GCE/NiNPs surface (B); EDX spectrum of the GCE-NiNPs surface (C); histogram of the diameter of NiNPs on the GCE surface (D); and complex plane impedance spectrum of the bare GCE (a), the unelectroactivated GCE/NiNPs (b), and the electroactivated GCE/NiNPs (c) obtained from the application of 0.1 mol L−1 KCl as supporting electrolyte in the presence of 10.0 mmol L−1 K3[Fe(CN)6] (E).
The EIS measurements (Figure 3E) were performed in order to compare the plane impedance spectrum of the bare GCE (Figure 3E, curve a) with that of the unelectroactivated GCE/NiNPs (Figure 3E, curve b) and the electroactivated GCE/NiNPs (Figure 3E, curve c) using KCl 0.1 mol L−1 containing 10.0 mmol L−1 K3[Fe(CN)6]/K4[Fe(CN)6] as electrochemical probe; this analysis was carried out in order to obtain information regarding the electron transfer between the electrolyte and the electrode surface. The EIS spectrum and the changes in the diameters of the semicircles in the Nyquist plots are shown using a Randles-type electrical equivalent circuit and are related to the charge transfer resistance (Rct) [43]. The results obtained showed a semicircle in the high-frequency region related to the charge transfer reaction; the line observed at low frequencies corresponded to the oxidation process, where diffusion was limited. The unelectroactivated GCE/NiNPs (Figure 3E, curve b) exhibited relatively smaller diameter (Rct = 698 Ω) compared to the bare GCE (Rct = 1.02 KΩ); this implies that the addition of NiNPs improves the electron transfer from the redox probe to the GCE surface. The electroactivated GCE/NiNPs also exhibited relatively smaller semicircle diameter (Figure 3E, curve c) compared to the bare GCE and the unelectroactivated GCE/NiNPs; this consequently yielded a relatively lower Rct value for the electroactivated GCE/NiNPs (385 Ω). This behavior clearly points to the importance of prior electroactivation of GCE/NiNPs, as this helps boost the formation of nickel species (NiOOH); furthermore, this outcome shows that the electrocatalytic effect is directly connected to the modification of the GCE [36].
3.3. Electrochemical Behavior of Urea on Bare GCE and GCE/NiNPs
After choosing NaOH as the best supporting electrolyte and the electroactivation solution for the GCE/NiNPs sensor (results described in Section 3.1.1), a study was carried out in order to investigate the electrochemical behavior of urea. The electrochemical behavior of 3.0 mmol L−1 urea in 100.0 mmol L−1 NaOH was investigated on the proposed GCE/NiNPs by CV after electrodeposition and electroactivation—performed as described in Section 2.4. Figure S2 (Supplementary Material) shows the behavior of the cyclic voltammograms in the presence and absence of 3.0 mmol L−1 urea in 100.0 mmol L−1 NaOH solution on the proposed GCE/NiNPs.
Figure S2 (Supplementary Material) shows a comparative analysis of the CVs obtained from the application of 100.0 mmol L−1 NaOH as supporting electrolyte (Figure S2, curve a) and the medium containing 3.0 mmol L−1 of urea (Figure S2, curve b) on the GCE/NiNPs. The CVs obtained for both the supporting electrolyte and urea exhibited an Eap of 0.50 V, followed, in the reverse scan, by Ecp of 0.43 V. This redox pair is typically characteristic of the electrochemical oxidation of Ni2+ to Ni3+, in which nickel oxide/hydroxide is formed in alkaline medium, as shown in Equations (1)–(4) [42,43].
The voltammogram obtained from the application of the supporting electrolyte in the presence of 3.0 mmol L−1 of urea (Figure S2, curve b) exhibited an Eap at 0.54 V, which was attributed to the presence of urea in the medium; this shows that the electrooxidation of urea is promoted through electrocatalysis by NiO(OH) present on the GCE/NiNPs surface. NiO(OH) is considered one of the most active electrocatalysts for the oxidation of organic compounds, including urea—urea is oxidized at the anode (Equation (5)) and this leads to the formation of N2 simultaneously with the oxidation–reduction of nickel (Equation (6)); the oxidation of urea at the cathode results in the reduction of water (Equation (7)) and this leads to the formation of H2 [44]. As a result of these phenomena, it can be observed that the anodic peak at 0.50 V (Figure S2, curve a), which corresponds to the redox reaction of Ni2+ and Ni3+, is approximately the same potential at which urea oxidation occurs under alkaline conditions (Figure S2, curve b); this shows that Ni3+ is the active species that promotes the oxidation of urea [45]. It is worth noting, however, that no change was observed in the Icp, and this probably demonstrates an irreversible reaction of urea under these conditions.
A study was also carried out in order to evaluate the effect of the scan rate of CVs when applied between 10 and 300 mV s−1 in 100.0 mmol L−1 NaOH for the oxidation and reduction of 3.0 mmol L−1 urea. The results obtained showed that, as the scan rates increased, urea oxidation and reduction peak currents were shifted to more positive potentials for the anodic peaks and to more negative potentials for the cathodic peaks, respectively. As can be observed, the Iap and Icp are found to be linearly proportional to the square root of the scan rate (υ1/2)—increasing for Iap (2.2 × 10⁻³ υ1/2 − 5.5 × 10⁻⁵) and decreasing for the cathodic peak currents (−1.8 × 10⁻³ υ1/2 + 6.9 × 10⁻⁵), with linear correlation coefficients (R) of 0.9998 and 0.9995, respectively. This result essentially shows that urea exhibits a diffusion-limited electrochemical behavior [30,46].
3.4. Analytical Performance
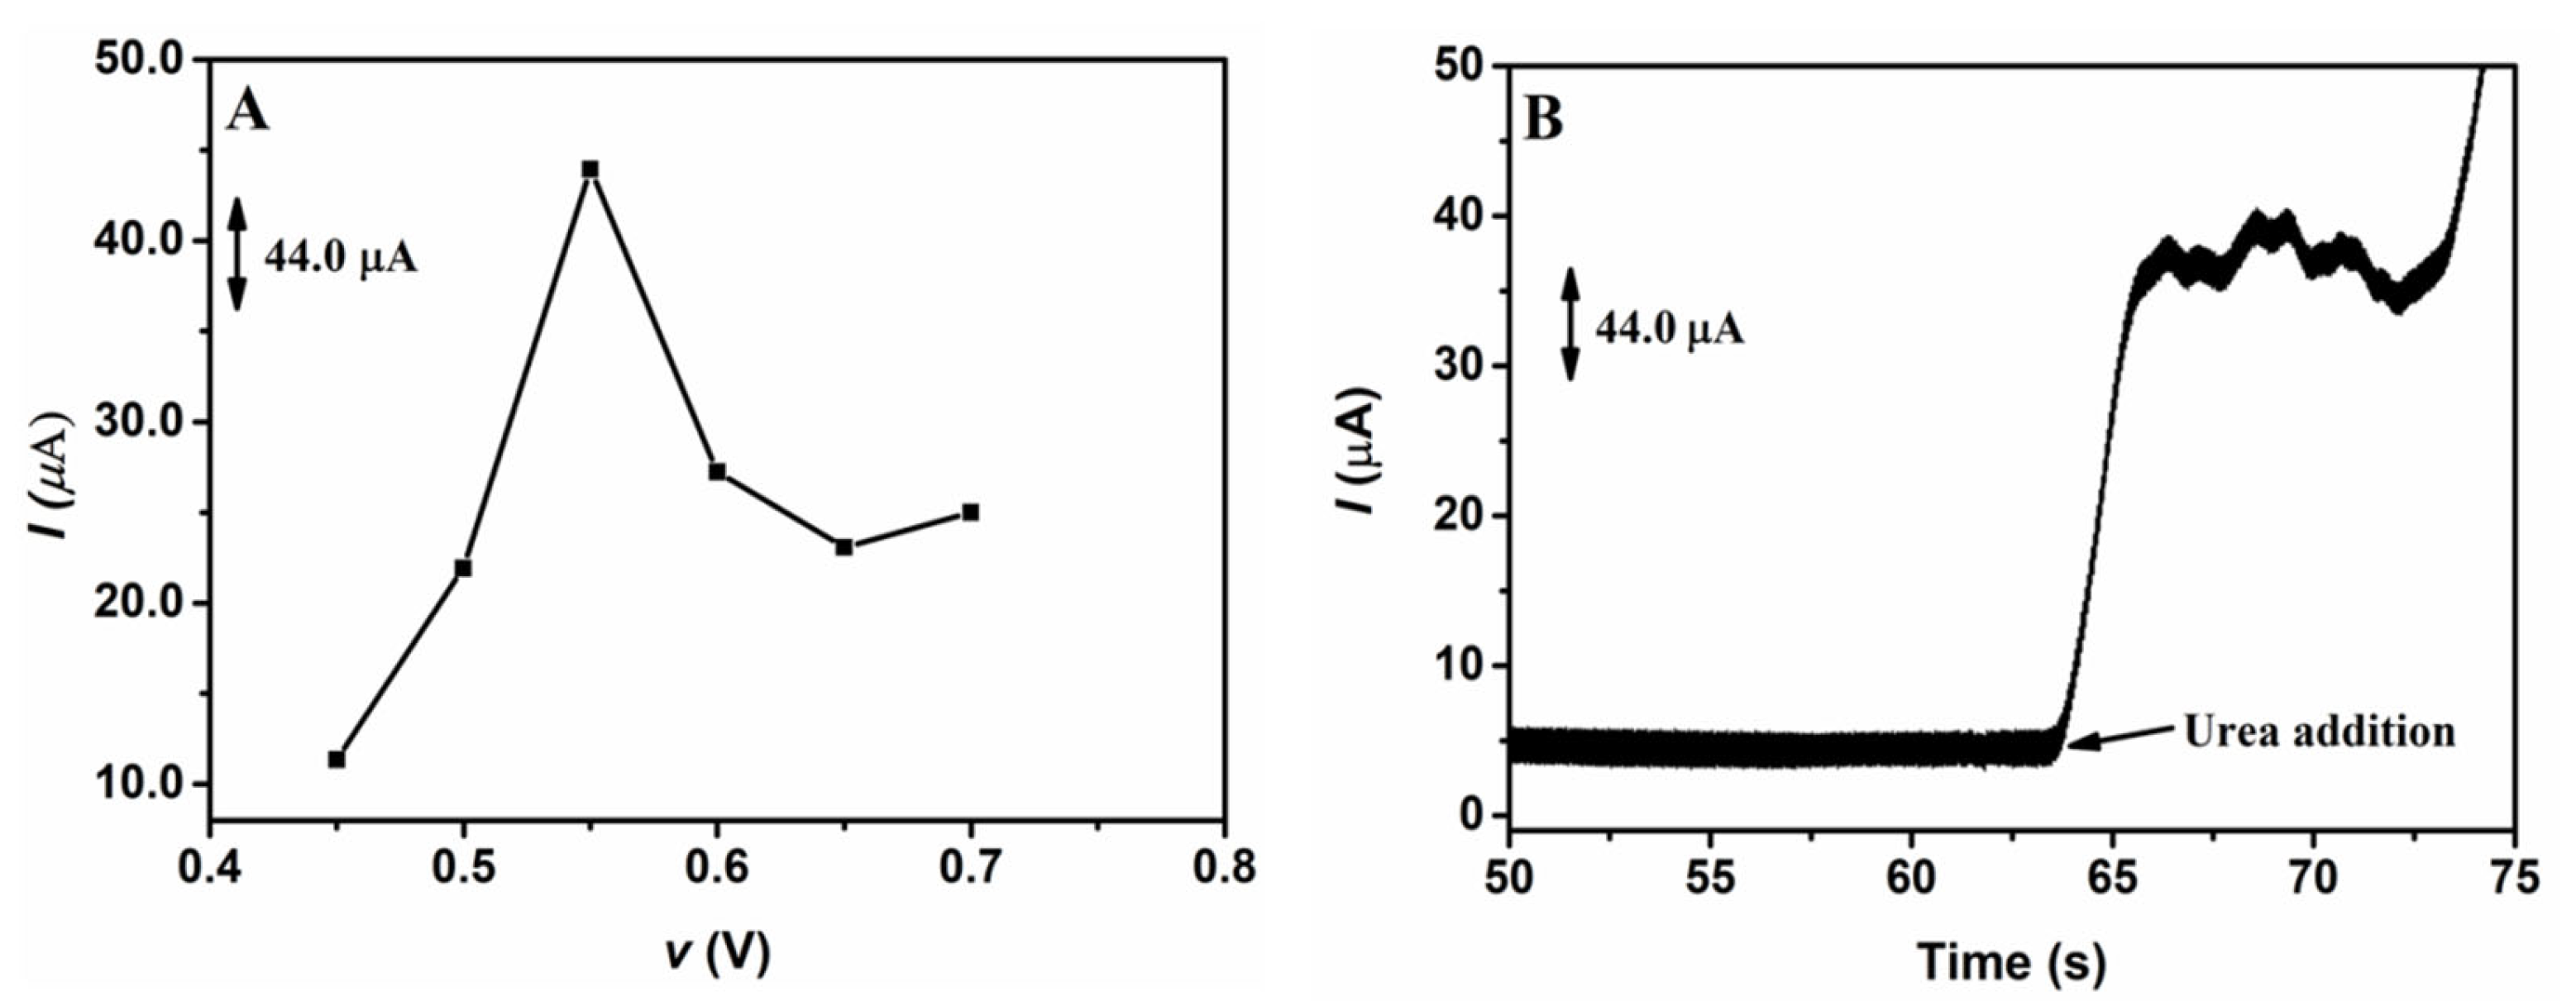
The analysis of the best potential was conducted using potentials ranging from 0.45 to 0.70 V through the chronoamperometric detection of urea on the GCE/NiNPs, with the application of 10.0 mL of supporting electrolyte (100.0 mmol L−1 NaOH) in the presence of 1.0 mmol L−1 urea, after 60 s of current signal stabilization. Figure 4 shows a typical chronoamperometric response (Figure 4A) and the effect of applied potential used for urea detection (Figure 4B).

Figure 4.
Chronoamperometric responses from the application of 100.0 mmol L−1 NaOH as supporting electrolyte in the presence of 1.0 mmol L−1 urea on the GCE/NiNPs sensor using different detection potentials (A); amperogram obtained from the addition of urea on the GCE/NiNPs using electrodeposition charge of 8.0 mC (B).
As demonstrated previously, a significant increase in current was observed after 60 s of stabilization and the addition of 1.0 mmol L−1 urea; this shows that urea was easily oxidized on the GCE/NiNPs. Figure 4A shows that although the detection current increases from 0.45 to 0.55 V, it however decreases after 0.60 V, due to the loss of signal stabilization. As observed in the electrocatalytic process, applying an optimum potential exerts a strong influence over the yielding process; thus, 0.55 V was selected for urea detection—this value is close to the urea oxidation potential on the GCE/NiNPs.
The optimized electrochemical sensor was applied for urea detection (Figure S3, Supplementary Material). An analytical curve was constructed by measuring the Iap obtained from the application of different concentrations of standard urea in 100.0 mmol L−1 NaOH employed as supporting electrolyte (Figure S3A, Supplementary Materials). The result obtained showed that Iap varied linearly with urea concentration from 0.085 to 3.1 mmol L−1 (Iap (µA) = 0.039 [Urea] − 7.183 × 10⁻⁷), with a correlation coefficient of 0.9993 (Figure S3B, Supplementary Material).
The limit of detection (LOD) obtained for the method was 60.0 µmol L−1; this was obtained from the following formula: signal-to-noise ratio equal to 3 (S/N = 3). The limit of quantification (LOQ) obtained for the method was 198.0 µmol L−1; this was calculated as 3.3 multiplied by the LOD (LOQ = 3.3 × LOQ) [47]. The analysis of intra- and inter-day repeatability of the GCE-NiNPs was conducted based on the application of 21 successive measurements in 100.0 mmol L−1 NaOH in the presence of 1.0 mmol L−1 urea, under constant stirring. The current signal obtained from the GCE/NiNPs did not show significant variations. The results obtained showed intra- and inter-day relative standard deviations (RSD%) of approximately 2.45% and 3.92%, respectively, between the consecutive measurements; this outcome clearly points to an excellent repeatability of the GCE/NiNPs.
The GCE/NiNPs was subjected to chronoamperometry analysis for a period of 3000 s using 100.0 mmol L−1 NaOH as supporting electrolyte, under constant stirring, where 4.00 mmol L−1 of urea was added after 40 s in order to evaluate the stability of the GCE/NiNPs. The analytical signal was collected every 40 s up to 200 s; after this period, the analytical signal was collected every 200 s up to the end of the analysis. The results obtained showed that there was a decrease in the analytical current signal over time after the addition of the analyte in 40 s. The results obtained showed a relative standard deviation (RSD%) of about 23.2% between the signals; this outcome shows that the GCE/NiNPs exhibits a good relative stability after 3000 s.
The analytical performance of the GCE/NiNPs sensor was evaluated in comparison with various analytical methods previously reported for urea determination. As summarized in Table 1, a broad range of techniques—including spectroscopic, chromatographic and electrochemical approaches—were employed, each presenting specific advantages and limitations regarding sensitivity, complexity and cost. The GCE/NiNPs sensor demonstrates an effective balance between analytical sensitivity, ease of fabrication and low operational cost. In contrast to enzymatic systems, it avoids issues such as enzyme instability and the requirement for toxic reagents or complex instrumentation. Although its limit of detection is not as low as that of sensors based on molecular imprinting or quantum dots, the proposed platform offers clinically relevant sensitivity, excellent reproducibility, high selectivity and reliable performance in real sample analysis. These characteristics position the GCE/NiNPs sensor as a promising, cost-effective and robust alternative for the direct, non-enzymatic determination of urea in biological and dialysis-related fluids.

Table 1.
Analytical characteristics of different urea detection methods.
3.5. Interference Study
Some endogenous compounds usually excreted by the human body were selected as possible interferents in the determination of urea through the application of the proposed method; these compounds were chosen due to their similarity to the target compound. The selected compounds, namely, uric acid, cysteine, creatinine and glycine, were tested by amperometric analysis through the application of 0.1 mmol L−1 of the interferent and 0.1 mmol L−1 urea in 100.0 mmol L−1 NaOH (employed as supporting electrolyte), at the detection potential of 0.55 V and under constant stirring. Figure 5 shows a comparative analysis of the interference level obtained for each of the compounds investigated. At the concentration investigated, no significant interference effect was observed: uric acid (8.9% of interference), cysteine (11.7% of interference), creatinine (14.1% of interference) and glycine (4.2% of interference). This shows that urea can be effectively detected in the presence of these compounds.
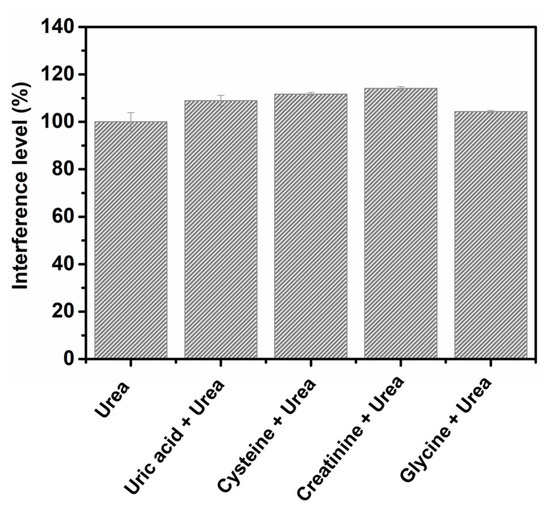
Figure 5.
Results obtained from the interference studies conducted using uric acid, cysteine, creatinine and glycine in the presence of urea.
3.6. Application of the GCE/NiNPs Sensor for Urea Detection in Synthetic Biological Fluid Samples
To test the applicability and validity of the GCE/NiNPs sensor, it was evaluated using BSA (simulating human blood plasma), artificial urine samples (simulating human urine), dialysate and hemodialysis wastewater prepared as described in Section 2.5. The results obtained from the analysis involving urea determination for the samples are shown in Table 2.
Table 2.
Urea detection in BSA, artificial urine, dialysate and hemodialysis wastewater samples based on the application of the GCE/NiNPS sensor (n = 3).
The concentrations of urea found in the fortified BSA and artificial urine samples were 1.06 ± 0.07 and 1.03 ± 0.03 mmol L−1, respectively. The amount of urea quantified in the dialysate and hemodialysis wastewater was 6.03 ± 0.06 and 10.4 ± 0.03 mmol L−1, respectively. The amounts of urea found in the dialysate and hemodialysis wastewater samples are in accordance with the expected concentrations for this type of sample, which should be between 3.0 and 6.7 mmol L−1, and 3.0 and 16.0 mmol L−1, respectively [3,9,10].
To evaluate the accuracy of the method developed using the modified sensor, the recovery was obtained utilizing the standard addition method and present in Table 2. The average recoveries for urea were between 103 ± 0.2% (artificial urine) and 106 ± 0.1% (BSA), and between 105 ± 0.2% (hemodialysis wastewater) and 111 ± 0.3% (dialysate). These results point to the outstanding efficiency of the sensing device in terms of the recovery of the analyte of interest.
Thus, based on these results, one can conclude that the proposed GCE/NiNPs sensor exhibits the required suitable characteristics and satisfactory application potential for use in urea determination.
4. Conclusions
The present study reported the development and application of a low-cost, sensitive and reliable sensor, which is easy to build and handle, for the direct determination of urea in BSA (simulating human blood), artificial urine (simulating human urine samples), dialysate and hemodialysis wastewater; the sensor was constructed using a GCE modified with NiNPs. The modification of the GCE with NiNPs contributed to a considerable decrease in charge transfer resistance and a significant increase in the signal response of the analyte compared to the unmodified electrode. The application of the proposed chronoamperometry technique allowed the direct determination of urea in complex samples, unlike most electroanalytical methods reported in the literature, which are based on the dosage of ammonia, produced by the hydrolysis of urea catalyzed by the urease enzyme. The method proposed in this study exhibited a good linear range, with low detection and quantification limits, and outstanding efficiency when applied for the determination of urea in the matrices investigated.
Supplementary Materials
The following supporting information can be downloaded at: https://www.mdpi.com/article/10.3390/pr13051306/s1, Figure S1: Cyclic voltammograms obtained for the GCE/NiNPs in the absence (a) and presence (b) of 3.0 mmol L−1 of urea based on the application of the following supporting electrolytes: (A) 100.0 mmol L−1 NaOH, (B) 100.0 mmol L−1 Na2SO4 and (C) 100.0 mmol L−1 PB at pH 7.0. Scan rate (υ) = 100 mV s−1; Figure S2: Cyclic voltammograms obtained on the GCE/NiNPs in the absence (a) and presence (b) of 3.0 mmol L−1 urea in 100.0 mmol L−1 NaOH. Scan rate (υ) = 100 mV s−1; Figure S3: Amperograms obtained from the application of urea concentrations ranging from 0.085 to 3.10 mmol L−1 in 100.0 mmol L−1 NaOH on the GCE/NiNPs (A) and the respective analytical curve (B). Detection potential applied: 0.55 V; stabilization time: 60 s.
Author Contributions
Conceptualization, G.F.d.O., J.L.d.S. and M.V.B.Z.; methodology, G.F.d.O., J.L.d.S. and J.C.d.S.; validation, G.F.d.O.; formal analysis, G.F.d.O.; investigation, G.F.d.O., J.L.d.S. and J.C.d.S.; resources, M.V.B.Z.; writing—original draft preparation, G.F.d.O., J.L.d.S. and J.C.d.S.; writing—review and editing, J.L.d.S. and M.V.B.Z.; supervision, J.L.d.S. and M.V.B.Z.; project administration, J.L.d.S.; funding acquisition, G.F.d.O. and M.V.B.Z. All authors have read and agreed to the published version of the manuscript.
Funding
This work is supported by the National Council of Technological and Scientific Development (CNPq: 465571/2014-0 and 164070/2020-6), the Coordination for the Improvement of Higher Education Personnel (CAPES: 88887136426/2017/00 and 88887.368610/2019-00) and the São Paulo Research Foundation (FAPESP 2014/50945-4, 2018/12998-1 and 2021/12866-9).
Data Availability Statement
The original contributions of this study are available in the article and Supplementary Materials. For any further inquiries, please contact the corresponding author.
Acknowledgments
The authors are grateful to the Institute of Chemistry and Bioenergy Research Institute of the São Paulo State University and the National Institute of Alternative Technologies for Detection, Toxicological Evaluation and Removal of Micropollutants and Radioactive Substances (INCT-DATREM).
Conflicts of Interest
The authors declare no conflicts of interest.
References
- Gao, Y.; Jin, B.; Shen, W.; Sinko, P.J.; Xie, X.; Zhang, H.; Jia, L. China and the United States-global partners, competitors and collaborators in nanotechnology development. Nanomedicine 2016, 12, 13–19. [Google Scholar] [CrossRef] [PubMed]
- Tan, A.; Chawla, R.; Natasha, G.; Mahdibeiraghdar, S.; Jeyaraj, R.; Rajadas, J.; Hamblin, M.R.; Seifalian, A.M. Nanotechnology and regenerative therapeutics in plastic surgery: The next frontier. J. Plast. Reconstr. Aesthet. Surg. 2016, 69, 1–13. [Google Scholar] [CrossRef] [PubMed]
- Ismail, M.; Xiangke, W.; Cazzato, G.; Anwar Saleemi, H.; Khan, A.; Ismail, A.; Zahid, M.; Farooq Khan, M. Role of silver nanoparticles in fluorimetric determination of urea in urine samples. Spectrochim. Acta A Mol. Biomol. Spectrosc. 2022, 271, 120889. [Google Scholar] [CrossRef]
- Pandya, D.; Nagrajappa, A.K.; Ravi, K.S. Assessment and correlation of urea and creatinine levels in saliva and serum of patients with chronic kidney disease, diabetes and hypertension—A research study. J. Clin. Diagn. Res. 2016, 10, ZC58–ZC62. [Google Scholar] [CrossRef]
- Costa, J.A.C.; Vieira-Neto, O.M.; Neto, M.M. Acute renal failure. Medicina 2003, 36, 307–324. [Google Scholar]
- Pundir, C.S.; Jakhar, S.; Narwal, V. Determination of urea with special emphasis on biosensors: A review. Biosens. Bioelectron. 2019, 123, 36–50. [Google Scholar] [CrossRef]
- Radomska, A.; Koncki, R.; Pyrzyńska, K.; Gła̧b, S. Bioanalytical system for control of hemodialysis treatment based on potentiometric biosensors for urea and creatinine. Anal. Chim. Acta 2004, 523, 193–200. [Google Scholar] [CrossRef]
- Koncki, R.; Radomska, A.; Glab, S.X. Potentiometric determination of dialysate urea nitrogen. Talanta 2000, 52, 13–17. [Google Scholar] [CrossRef]
- Gutiérrez, M.; Alegret, S.; del Valle, M. Bioelectronic tongue for the simultaneous determination of urea, creatinine and alkaline ions in clinical samples. Biosens. Bioelectron. 2008, 23, 795–802. [Google Scholar] [CrossRef]
- Marchenko, S.V.; Kucherenko, I.S.; Soldatkin, O.O.; Soldatkin, A.P. Potentiometric biosensor system based on recombinant urease and creatinine deiminase for urea and creatinine determination in blood dialysate and serum. Electroanalysis 2015, 27, 1699–1706. [Google Scholar] [CrossRef]
- Coulombe, J.J.; Favreau, L. A new simple semimicro method for colorimetric determination of urea. Clin. Chem. 1963, 9, 102–108. [Google Scholar] [CrossRef] [PubMed]
- Ali, N.; Ismail, M.; Khan, A.; Khan, H.; Haider, S.; Kamal, T. Spectrophotometric methods for the determination of urea in real samples using silver nanoparticles by standard addition and 2nd order derivative methods. Spectrochim. Acta A Mol. Biomol. Spectrosc. 2018, 189, 110–115. [Google Scholar] [CrossRef] [PubMed]
- Koebel, M.; Elsener, M. Determination of urea and its thermal decomposition products by High-Performance Liquid Chromatography. J. Chromatogr. A 1995, 689, 164–169. [Google Scholar] [CrossRef]
- Clark, S.; Francis, P.S.; Conlan, X.A.; Barnett, N.W. Determination of urea using High-Performance Liquid Chromatography with fluorescence detection after automated derivatisation with xanthydrol. J. Chromatogr. A 2007, 1161, 207–213. [Google Scholar] [CrossRef]
- Jensen, P.S.; Bak, J.; Ladefoged, S.; Andersson-Engels, S. Determination of urea, glucose, and phosphate in dialysate with Fourier Transform Infrared Spectroscopy. Spectrochim. Acta A Mol. Biomol. Spectrosc. 2004, 60, 899–905. [Google Scholar] [CrossRef]
- Boubriak, O.A.; Soldatkin, A.P.; Starodub, N.F.; Sandrovsky, A.K.; El’skaya, A.K. Determination of urea in blood serum by a urease biosensor based on an ion-sensitive field-effect transistor. Sens. Actuators B Chem. 1995, 26, 429–431. [Google Scholar] [CrossRef]
- Alizadeh, T.; Ganjali, M.R.; Rafiei, F. Trace level and highly selective determination of urea in various real samples based upon voltammetric analysis of diacetylmonoxime-urea reaction product on the carbon nanotube/carbon paste electrode. Anal. Chim. Acta 2017, 974, 54–62. [Google Scholar] [CrossRef]
- Lian, H.; Liu, B.; Chen, Y.; Sun, X. A urea electrochemical sensor based on molecularly imprinted chitosan film doping with CdS quantum dots. Anal. Biochem. 2012, 426, 40–46. [Google Scholar] [CrossRef]
- Marchenko, S.V.; Kucherenko, I.S.; Hereshko, A.N.; Panasiuk, I.V.; Soldatkin, O.O.; El’skaya, A.V.; Soldatkin, A.P. Application of potentiometric biosensor based on recombinant urease for urea determination in blood serum and hemodialyzate. Sens. Actuators B Chem. 2015, 207, 981–986. [Google Scholar] [CrossRef]
- Zhybak, M.; Beni, V.; Vagin, M.Y.; Dempsey, E.; Turner, A.P.F.; Korpan, Y. Creatinine and urea biosensors based on a novel ammonium ion-selective copper-polyaniline nano-composite. Biosens. Bioelectron. 2016, 77, 505–511. [Google Scholar] [CrossRef]
- Shalileh, F.; Sabahi, H.; Dadmehr, M.; Hosseini, M. Sensing approaches toward detection of urea adulteration in milk. Microchem. J. 2023, 193, 108990. [Google Scholar] [CrossRef]
- Singh, S.; Sharma, M.; Singh, G. Recent advancementsin urea biosensors for biomedical applications. IET Nanobiotechnol. 2021, 15, 358–379. [Google Scholar] [CrossRef] [PubMed]
- Botewad, S.N.; Gaikwad, D.K.; Girhe, N.B.; Thorat, H.N.; Pawar, P.P. Urea biosensors: A comprehensive review. Biotechnol. Appl. Biochem. 2023, 70, 485–501. [Google Scholar] [CrossRef] [PubMed]
- Güngör, S.; Taşaltın, C.; Gürol, İ.; Baytemir, G.; Karakuş, S.; Taşaltın, N. Copper phthalocyanine-borophene nanocomposite-based non-enzymatic electrochemical urea biosensor. Appl. Phys. A Mater. Sci. Process. 2022, 128, 89. [Google Scholar] [CrossRef]
- Salarizadeh, N.; Habibi-Rezaei, M.; Zargar, S.J. NiO–MoO3 nanocomposite: A sensitive non-enzymatic sensor for glucose and urea monitoring. Mater. Chem. Phys. 2022, 281, 125870. [Google Scholar] [CrossRef]
- Dhinasekaran, D.; Soundharraj, P.; Jagannathan, M.; Rajendran, A.R.; Rajendran, S. Hybrid ZnO nanostructures modified graphite electrode as an efficient urea sensor for environmental pollution monitoring. Chemosphere 2022, 296, 133918. [Google Scholar] [CrossRef]
- Sanko, V.; Şenocak, A.; Tümay, S.O.; Demirbas, E. A novel comparative study for electrochemical urea biosensor design: Effect of different ferrite nanoparticles (MFe2O4, M: Cu, Co, Ni, Zn) in urease immobilized composite system. Bioelectrochemistry 2023, 149, 108324. [Google Scholar] [CrossRef]
- Ibáñez-Redín, G.; Rosso Cagnani, G.; Gomes, N.O.; Raymundo-Pereira, P.A.; Sergio, S.A.; Gutierrez, M.A.; Krieger, J.E.; Oliveira, O.N. Wearable potentiometric biosensor for analysis of urea in sweat. Biosens. Bioelectron. 2023, 223, 114994. [Google Scholar] [CrossRef]
- Pereira, A.C.; Santos, A.D.S.; Kubota, L.T. Trends in amperometric electrodes modification for electroanalytical applications. Quim. Nova 2002, 25, 1012–1021. [Google Scholar]
- Bard, A.J.; Faulkner, L.R. Electrochemical Methods: Fundamentals and Applications, 2nd ed.; John Wiley & Sons: New York, NY, USA, 2001. [Google Scholar]
- Welch, C.M.; Compton, R.G. The use of nanoparticles in electroanalysis: A review. Anal. Bioanal. Chem. 2006, 384, 601–619. [Google Scholar] [CrossRef]
- Campbell, F.W.; Compton, R.G. The use of nanoparticles in electroanalysis: An updated review. Anal. Bioanal. Chem. 2010, 396, 241–259. [Google Scholar] [CrossRef] [PubMed]
- Lim, W.Q.; Gao, Z. Metal oxide nanoparticles in electroanalysis. Electroanalysis 2015, 27, 2074–2090. [Google Scholar] [CrossRef]
- Karimi-maleh, H.; Karimi, F.; Fallahshojaei, A.; Tabatabaeian, K.; Arshadi, M.; Rezapour, M. Metal-based nanoparticles as conductive mediators in electrochemical sensors: A mini review. Curr. Anal. Chem. 2019, 15, 136–142. [Google Scholar] [CrossRef]
- Salimi, A.; Sharifi, E.; Noorbakhsh, A.; Soltanian, S. Immobilization of glucose oxidase on electrodeposited nickel oxide nanoparticles: Direct electron transfer and electrocatalytic activity. Biosens. Bioelectron. 2007, 22, 3146–3153. [Google Scholar] [CrossRef]
- Erdem, C.; Zeybek, D.K.; Aydoǧdu, G.; Zeybek, B.; Pekyardimci, Ş.; Kiliç, E. Electrochemical glucose biosensor based on nickel oxide nanoparticle-modified carbon paste electrode. Artif. Cells Nanomed. Biotechnol. 2014, 42, 237–244. [Google Scholar] [CrossRef]
- Park, S.; Cho, K.; Kim, S. Enzyme-free glucose sensors with channels composed of necked zno nanoparticles on plastic. Microelectron. Eng. 2011, 88, 2611–2613. [Google Scholar] [CrossRef]
- Salimi, A.; Sharifi, E.; Noorbakhsh, A.; Soltanian, S. Direct voltammetry and electrocatalytic properties of hemoglobin immobilized on a glassy carbon electrode modified with nickel oxide nanoparticles. Electrochem. Commun. 2006, 8, 1499–1508. [Google Scholar] [CrossRef]
- Lata, S.; Batra, B.; Karwasra, N.; Pundir, C.S. An amperometric H2O2 biosensor based on cytochrome c immobilized onto nickel oxide nanoparticles/carboxylated multiwalled carbon nanotubes/polyaniline modified gold electrode. Process. Biochem. 2012, 47, 992–998. [Google Scholar] [CrossRef]
- Zhang, S.; Zhao, W.; Liu, C.; Zeng, J.; He, Z.; Wang, C.; Yuan, W.; Wang, Q. Flower-like CoO nanowire-decorated ni foam: A non-invasive electrochemical biosensor for glucose detection in human saliva. Appl. Mater. Today 2024, 36, 102083. [Google Scholar] [CrossRef]
- Sedenho, G.; da Silva, J.L.; Azevedo Beluomini, M.; de Sá, A.; Stradiotto, N. Determination of electroactive organic acids in sugarcane vinasse by high performance anion-exchange chromatography with pulsed amperometric detection using a nickel nanoparticle modified boron-doped diamond. Energy Fuels 2017, 31, 2865–2870. [Google Scholar] [CrossRef]
- Sá, A.C.; Cristina Sedenho, G.; Paim, L.L.; Ramos Stradiotto, N. New method for carbohydrates determination in sugarcane bagasse by HPAEC-RPAD using glassy carbon electrode modified with carbon nanotubes and nickel nanoparticles. Electroanalysis 2018, 30, 128–136. [Google Scholar]
- da Silva, J.L.; Beluomini, M.A.; Sedenho, G.C.; Stradiotto, N.R. Determination of amino acids in sugarcane vinasse by ion chromatographic using nickel nanoparticles on reduced graphene oxide modified electrode. Microchem. J. 2017, 134, 374–382. [Google Scholar] [CrossRef]
- King, R.L.; Botte, G.G. Hydrogen production via urea electrolysis using a gel electrolyte. J. Power Sources 2011, 196, 2773–2778. [Google Scholar] [CrossRef]
- Yan, W.; Wang, D.; Botte, G.G. Electrochimica acta nickel and cobalt bimetallic hydroxide catalysts for urea electro-oxidation. Electrochim. Acta 2012, 61, 25–30. [Google Scholar] [CrossRef]
- De Souza, J.C.; Zanoni, M.V.B.; Oliveira-Brett, A.M. Genotoxic permanent hair dye precursors p-aminophenol and p-toluenediamine electrochemical oxidation mechanisms and evaluation in biological fluids. J. Electroanal. Chem. 2020, 857, 113509, reprinted in J. Electroanal. Chem. 2020, 857, 114529. [Google Scholar] [CrossRef]
- De Souza, J.C.; Irikura, K.; Mantilla, H.D.R.; Zanoni, M.V.B.; Salazar, R. Using 3D printed magnetic platform as support for screen printed electrode applied for p-toluenediamine detection in biological fluid and water samples. Anal. Chim. Acta 2023, 1240, 340745. [Google Scholar] [CrossRef]


Disclaimer/Publisher’s Note: The statements, opinions and data contained in all publications are solely those of the individual author(s) and contributor(s) and not of MDPI and/or the editor(s). MDPI and/or the editor(s) disclaim responsibility for any injury to people or property resulting from any ideas, methods, instructions or products referred to in the content. |
© 2025 by the authors. Licensee MDPI, Basel, Switzerland. This article is an open access article distributed under the terms and conditions of the Creative Commons Attribution (CC BY) license (https://creativecommons.org/licenses/by/4.0/).