Abstract
The alumina doped epoxy resin composites have been widely used to prepare the basin-type insulators in gas-insulated switchgear (GIS). In recent years, the air cavity defects in the basin-type insulators became one of the most common factors to induce GIS faults. Therefore, the development of novel detection techniques for air cavities in epoxy resin composites is of great importance. In this study, multiple epoxy resin samples containing various submillimeter air cavities were prepared. Long pulse thermography (LPT) was employed to detect defects in the epoxy resin composite, and multiple data processing methods were applied to extract the characteristics of the air cavity defects. Quantitative analysis was also used to characterize the detection effectiveness in different thermograms. Experimental results show that derivative thermograms are capable of detecting air cavity defects with a diameter of 0.2 mm at a depth of 1.2 mm. The derivative thermograms can reduce noise and sharpen the defect recognition, exhibiting a high signal-to-noise ratio (SNR). This study also analyzes the impact of the aspect ratio on the detection result, which indicates that the defect with a small aspect ratio is difficult to detect. Based on the infrared thermography technology, this work provides a promising route for defects detection in basin-type insulators.
1. Introduction
Gas-insulated switchgear (GIS) is increasingly used in power systems [1,2]. However, since GIS is a highly integrated and enclosed switching device, any internal faults can lead to prolonged maintenance time, high repair costs, and difficulties in restoring power [3,4,5]. The basin-type insulator made of alumina-doped epoxy resin composite is a key insulating component in GIS, which provides mechanical support, electrical insulation, and physical isolation [6,7]. However, defects such as air cavities and cracks are inevitably produced inside the alumina-doped epoxy resin composites during the production, transportation, and installation of the basin-type insulator [8]. To reduce GIS failure caused by internal defects in the epoxy resin composite, defects detection technologies are widely applied in the basin-type insulators to eliminate the unqualified products before their delivery.
Currently, the main defect detection technologies for epoxy resin composites include ultrasonic testing, X-ray inspection, and partial discharge testing [9,10]. However, these detection methods show some limitations. For example, partial discharge testing shows a significant shortcoming in defect visualization and is easily affected by electromagnetic interference, making it difficult for defect locating. Ultrasonic testing requires maintaining close contact between the probe and the sample, which also places high demands on the professional skills and appears hard to operate. X-ray inspection exhibits a low detection accuracy for subsurface defects such as scratches and cracks [11]. Therefore, there is an urgent need to develop a new defect detection technology for basin-type insulators to reduce the failure rate of GIS.
Infrared thermal wave testing (ITWT) is a non-contact, high-precision, and reliable nondestructive defect detection technology, which was widely applied in the fields of aerospace and material science but was barely put into use in power equipment [12,13,14]. This technique employs a thermal excitation source to heat the surface of the sample through the thermal radiation. Meanwhile, infrared imaging equipment is used to record the temperature variation on the sample surface, identifying the inhomogeneous temperature distribution caused by defects [15,16]. With the development and widespread application of ITWT, S.M. Shepard from Thermal Wave Imaging Inc. (Madison Heights, MI, USA) proposed double logarithmic fitting on infrared thermal imaging data and generated differential images, significantly enhancing the test capability of the infrared thermography technology [17]. X. Maldague improved the efficiency and precision of ITWT by integrating phase-locking infrared technology during the practical application [18]. Recently, L. Wang introduced the ITWT to detect crack defects in post-porcelain insulators [19]. L. Liu and H. Mei tested the internal defects of composite silicone rubber insulator via the ITWT and analyzed the infrared images using the signal reconstruction, frequency domain analysis, and principal component analysis [20]. In 2022, C. Guo applied the ITWT to quantitatively analyze the coating thickness on the silicone rubber insulators [21].
At present, ITWT is only used for porcelain insulators and composite insulators in electrical engineering, with less attention given to subsurface defect detection in epoxy insulators and other insulating materials. This work mainly investigates the dynamic thermal process of subsurface air cavities in alumina-doped epoxy resin composites under infrared thermal wave excitation. The defect characteristics in the samples are extracted and discussed.
2. Materials and Methods
2.1. Material Description and Test Details
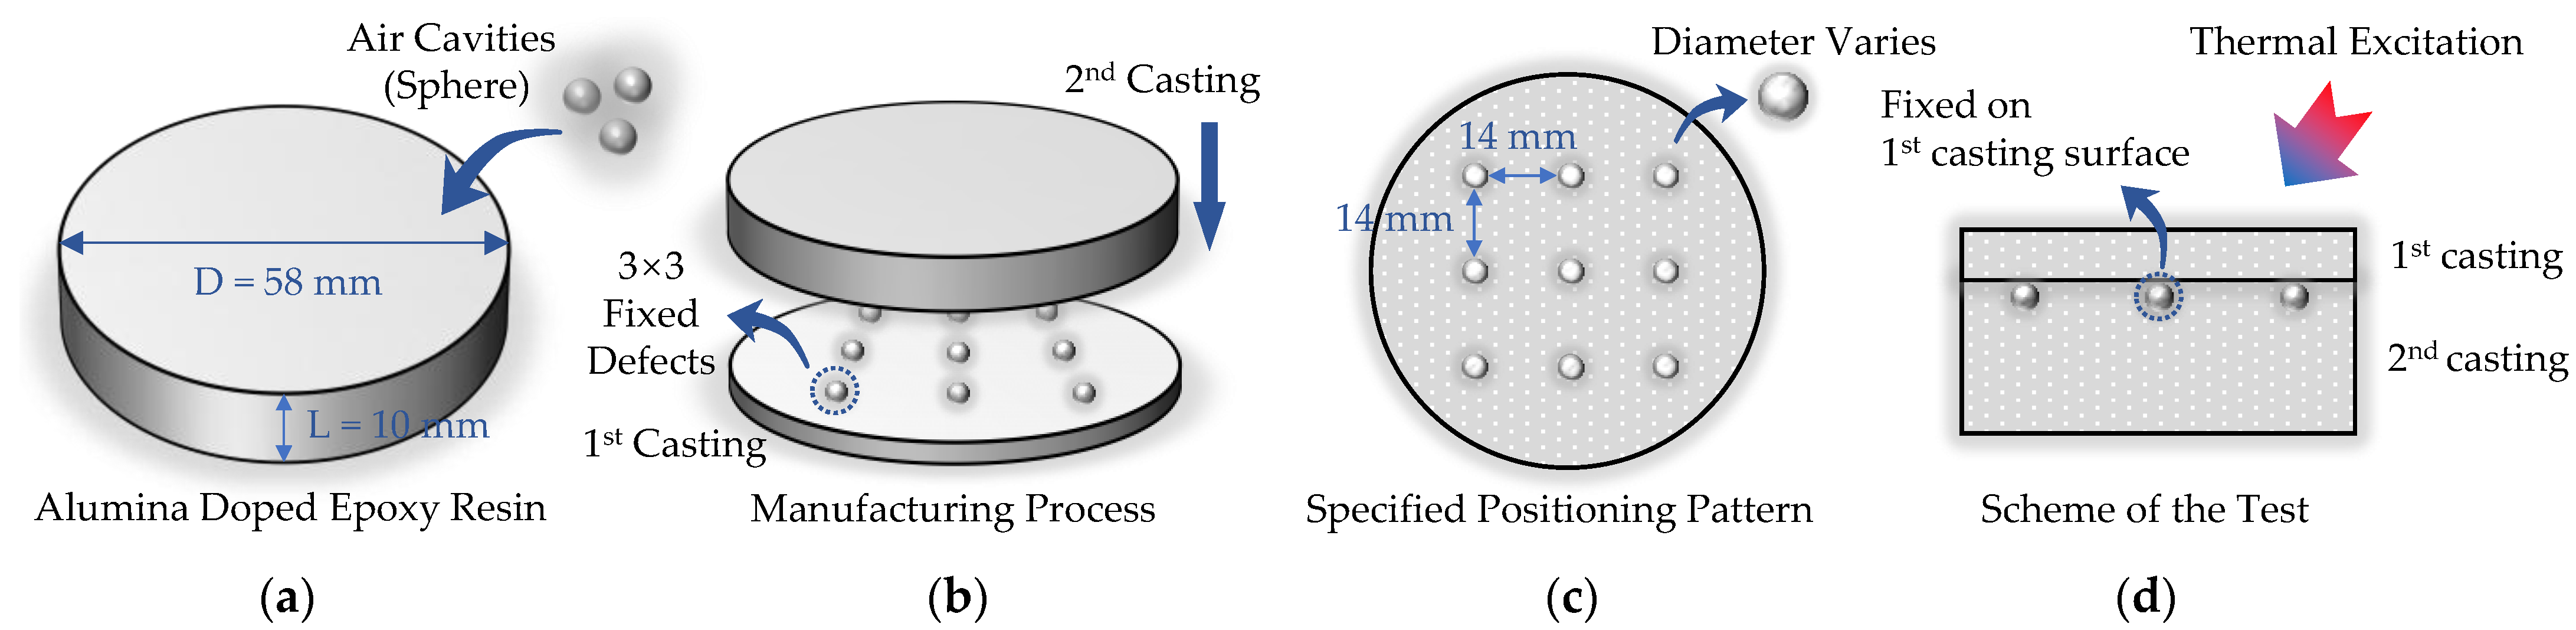
The basin-type insulators are made by vacuum casting epoxy resin doped with alumina. To simulate subsurface air cavities in basin-type insulators, we used the same epoxy resin composite to prepare the solid cylinder samples with the diameter of 58 mm and the height of 10 mm, as shown in Figure 1a. The samples are polished in order to minimize the effect of casting marks on the surface during the experiment.
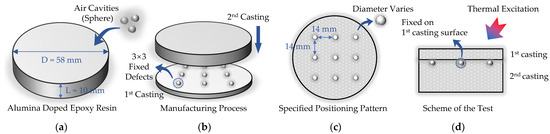
Figure 1.
The layout of the defects in the samples, (a) the dimension of the samples, (b) manufacturing process, (c) the specified positioning pattern of the defects, and (d) the scheme of the test.
The sample manufacturing details are described in Figure 1. Figure 1a shows that the epoxy resin samples doped with alumina (70 wt%, commercial recipe) were prepared through the first casting process. In Figure 1b, the defects made of thin-walled hollow alumina spheres with various dimensions are placed on the surface of the first casted sample, which serve as air cavities within the sample. Afterwards, the second casting was carried out on the first casted sample to introduce the defects into the epoxy resin composites. Thus, the subsurface air cavities are embedded under the surface and arranged in 3 × 3 arrays, as shown in Figure 1c. During the ITWT, the thermal excitation is applied to the first casted sample surface, as shown in Figure 1d.
As shown in Figure 1, all air cavities with different diameters in a single sample are located at the same depth beneath the surface. Three samples with different depths from 0.6 mm to 1.2 mm and different diameters from 0.2 mm to 3.0 mm were prepared, and the specific information of the samples is listed in Table 1. In order to distinguish the defects in the samples, we named the defects according to their position in the 3 × 3 array. For example, the defect in Sample 1 with a diameter of 0.7 mm is located in Row 2 Column 2 in Table 1 and is named R2C2.

Table 1.
Details of the samples including their names, depths, and diameters.
2.2. Experimental Details of Long Pulse Thermography
Figure 2 demonstrates the schematic diagram of the ITWT method. In the experiments, two quartz halogen lamps (2.5 kW) triggered by a 3 s pulse were used to heat the sample during the test. A 640 × 520 pixel array FPA infrared camera (ThermIR C500, Novelteq Ltd., Nanjing, China) was used to record the long pulse thermogram (LPT) sequences of air cavities. The camera was placed at an appropriate distance from the sample in order to cover its whole surface. Two lamps were about 20 cm away from the sample to create a 45° angle between the light and the sample surface.
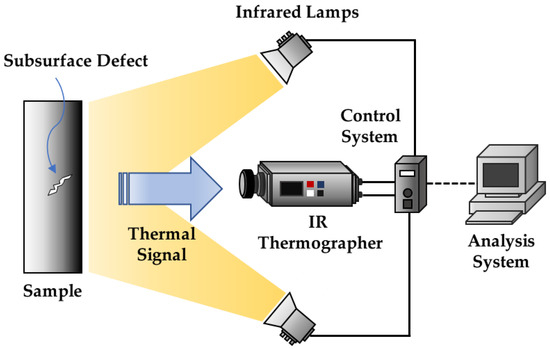
Figure 2.
The schematic diagram of the ITWT technique.
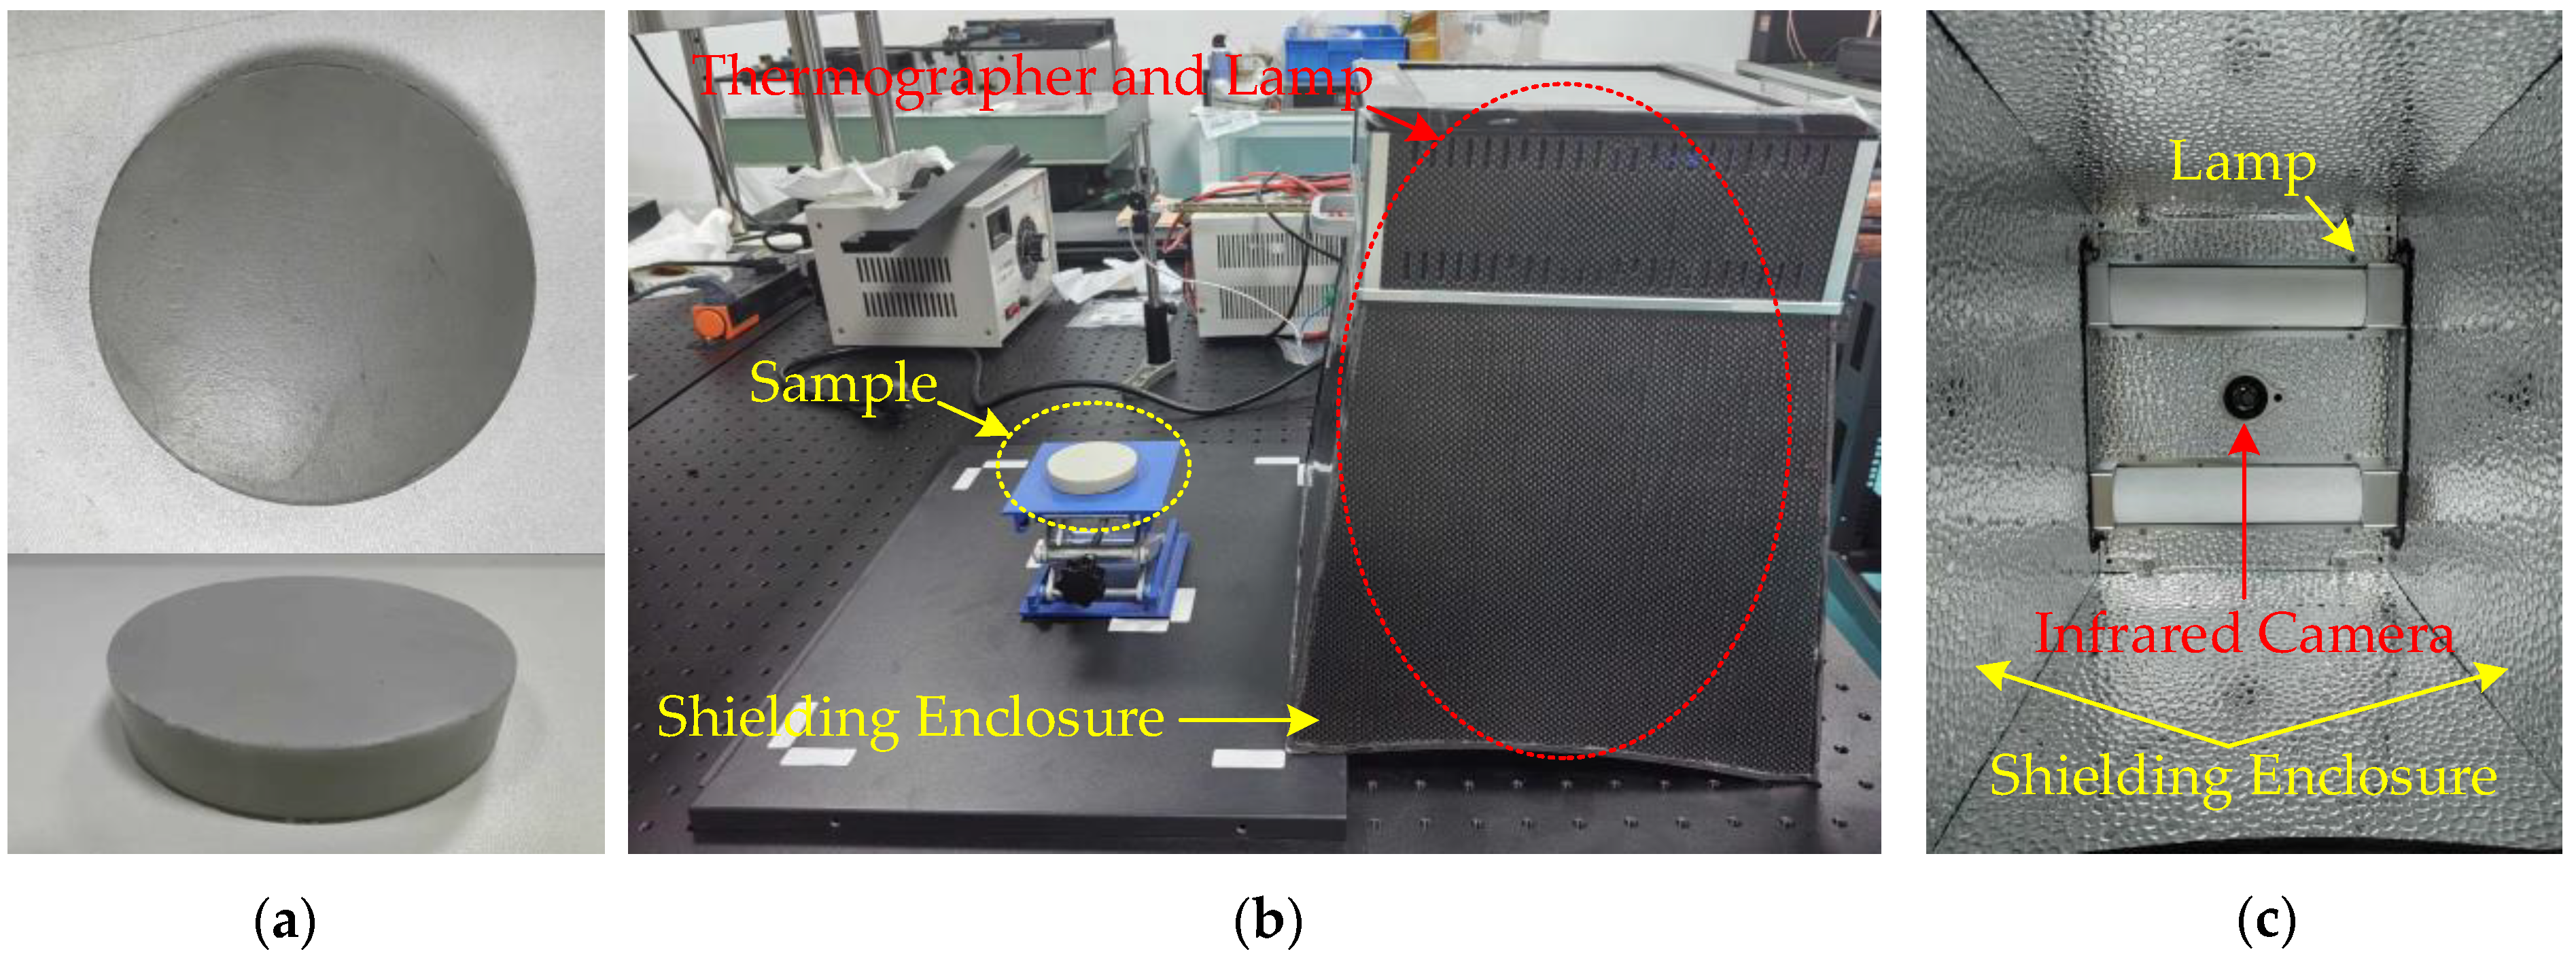
The appearance of the alumina-doped epoxy resin sample is displayed in Figure 3a. Due to the opacity of the sample, subsurface air cavities cannot be observed from the surface of the sample, and the infrared camera cannot capture these defects without thermal excitation applied on the sample. Figure 3b shows the layout of the samples and the integrated thermographer, while Figure 3c displays the internal components of the thermographer, including two halogen lamps and the infrared camera. During the experiment, the sample was totally covered with the thermographer to complete the defect detection.
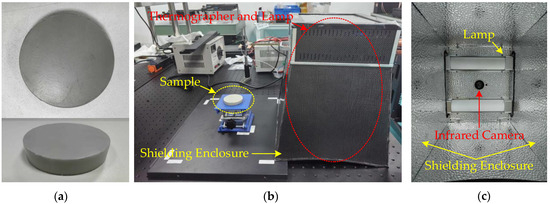
Figure 3.
Experimental platform, (a) alumina-doped epoxy resin samples, (b) scheme of the experiment; and (c) integrated thermographer with two halogen lamps and an infrared camera.
After the thermal excitation was applied on the surface of the sample for 3 s, the infrared camera begins to capture the thermograms with a resolution of 640 × 512 pixels, collecting 50 frames per second over a collection time of 30 s. Each experiment generates 1500 thermograms, which will be processed subsequently for further defect analysis.
It is worth noting that environmental and operational variabilities (EOV) pose substantial challenges to the repeatability and robustness of the results [22]. During the ITWT, several EOVs are considered, including solar radiation, indoor lighting, and uneven heating. To mitigate these EOVs, a shielding enclosure was designed to enclose the thermal camera, infrared halogen lamp, and sample, as shown in Figure 3b,c. This approach effectively minimizes external interference and enhances the repeatability of the experiments. Additionally, we also took measures to exclude the interference caused by operational variabilities. During the test, the sample, equipment, and shielding enclosure were consistently fixed at the same locations, which ensures that the relative distance among them remains constant.
2.3. Data Processing Techniques
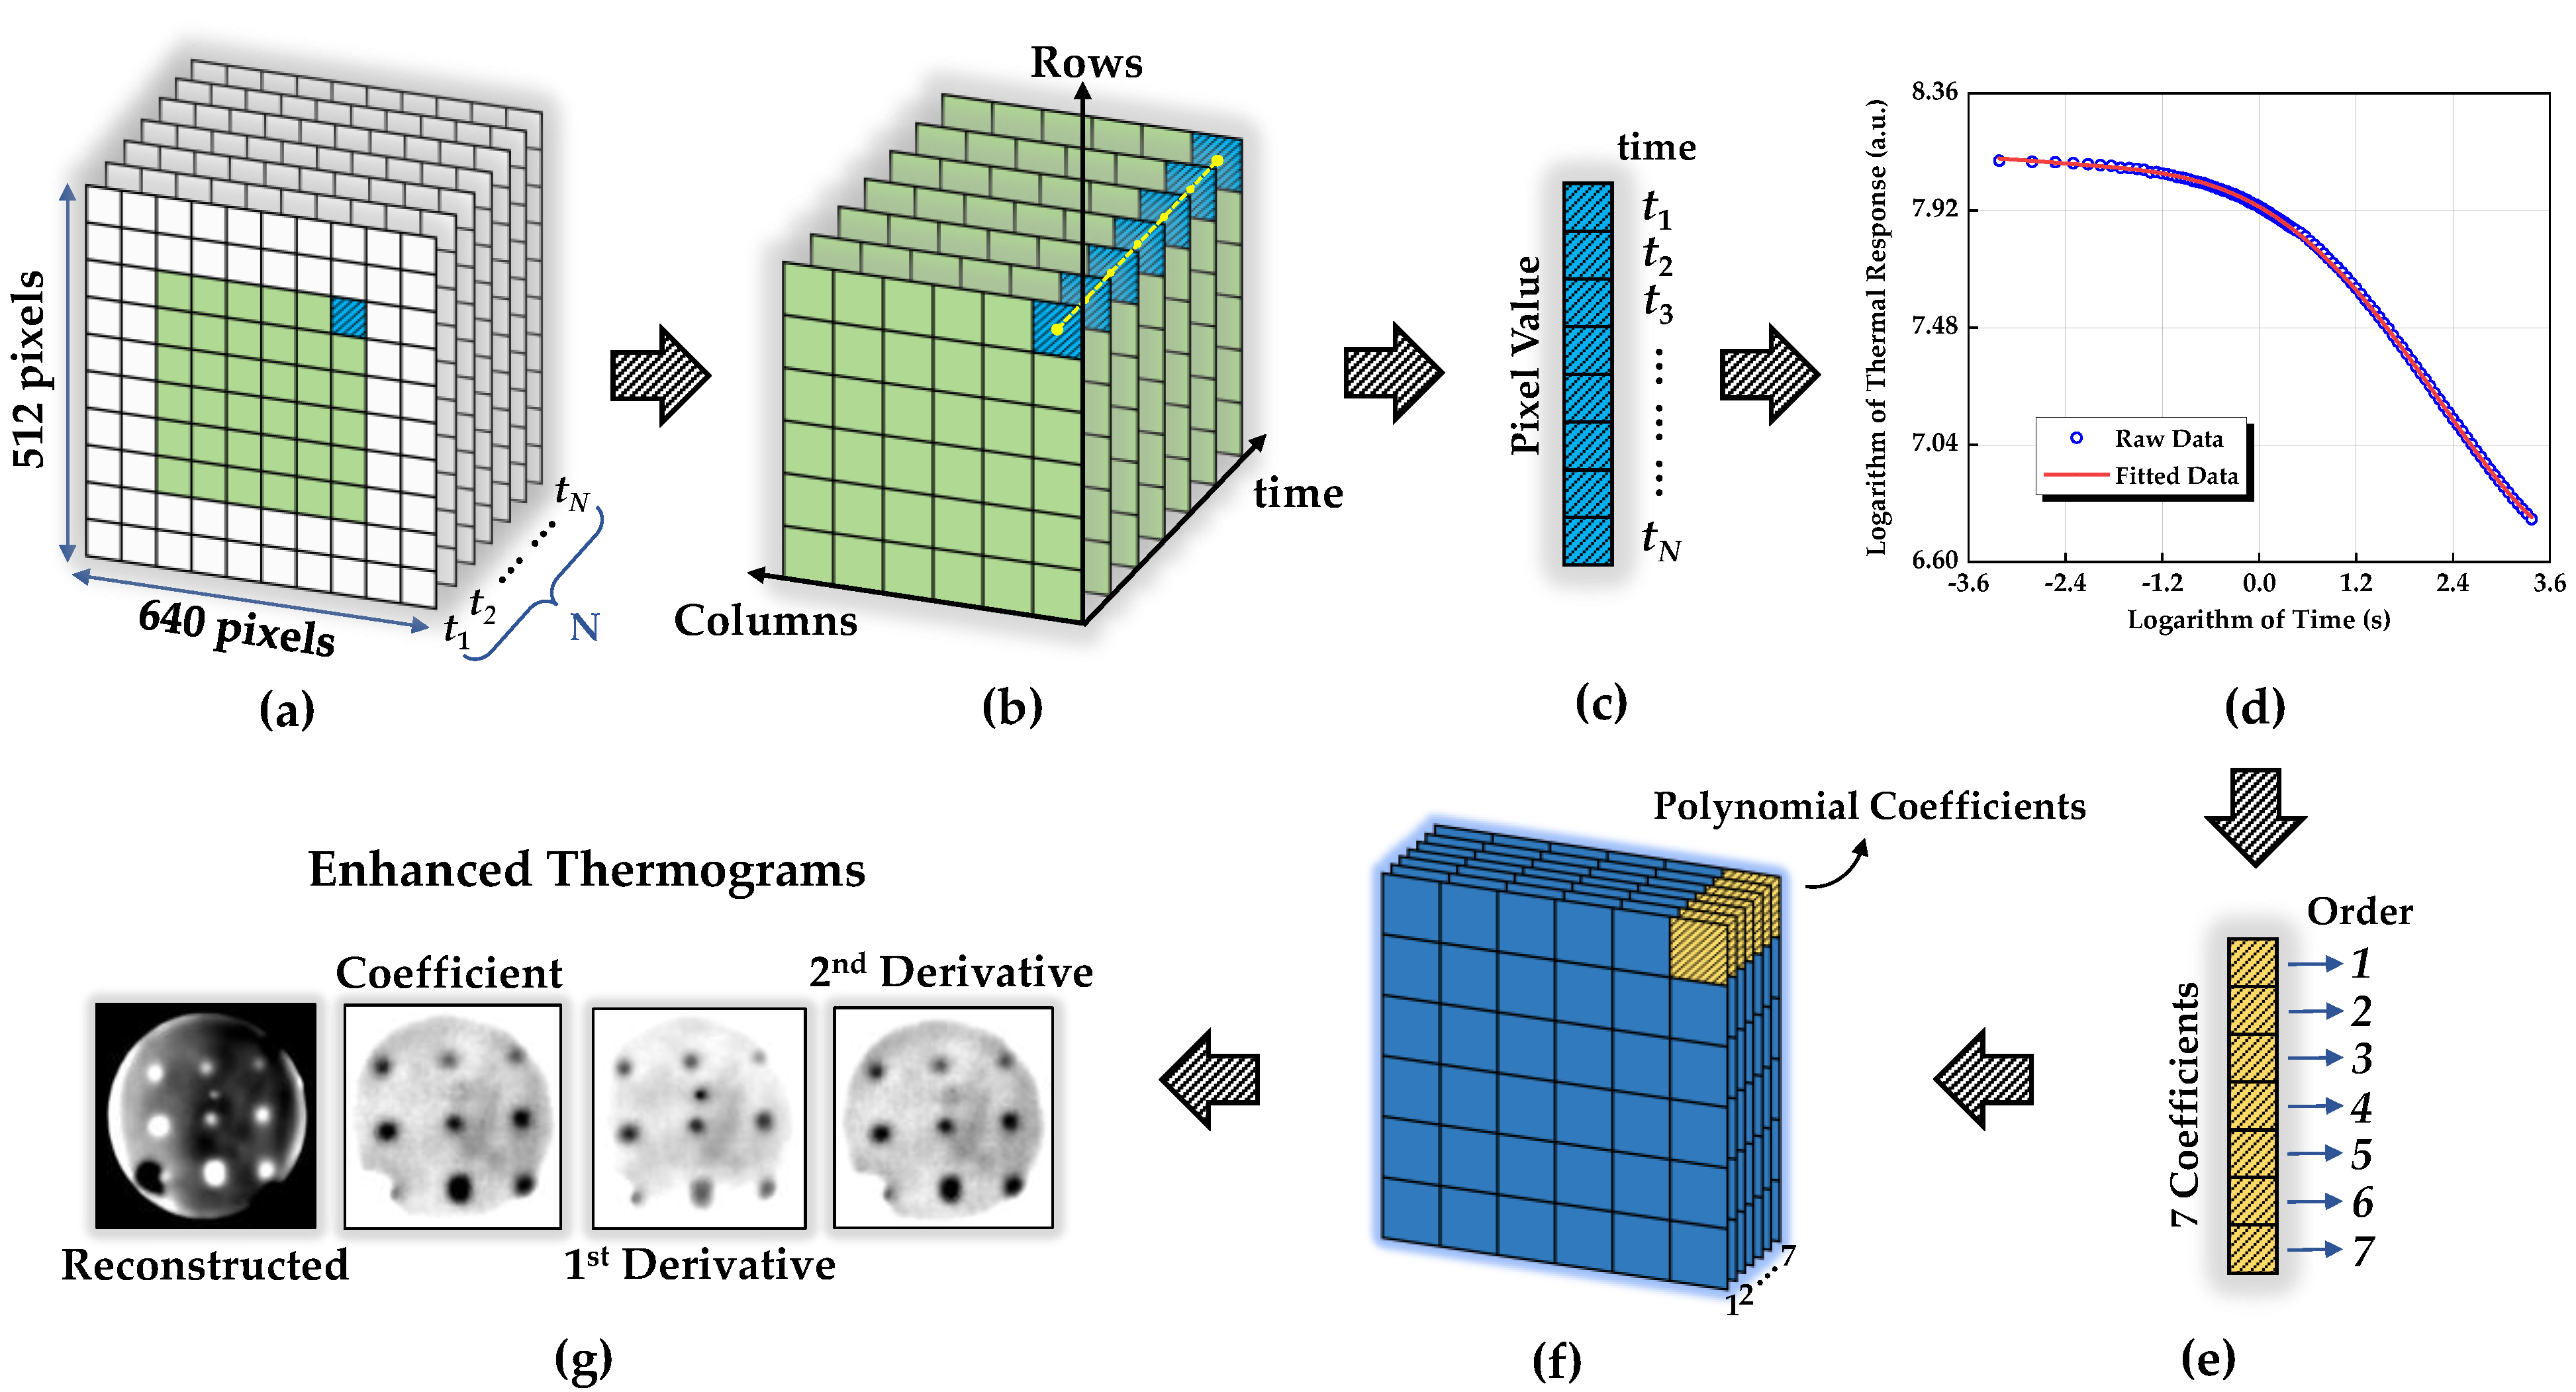
During the ITWT on the surface of the sample, thermal imaging data were obtained with the thermographer and analyzed using various image processing methods, as illustrated in Figure 4. The raw data obtained directly from the experiments (as shown in Figure 4a) consist of N two-dimensional arrays collected between time t1 and tN. Each two-dimensional array contains 512 rows and 640 columns, where each element value represents the instantaneous thermal response. These two-dimensional arrays can be conceptualized as N frames of thermal images, with each frame having a resolution of 640 × 512 pixels. The acquisition frequency is calculated using N/tN. In this research, data were acquired at a rate of 50 frames per second over an acquisition period (tN) of 30 s, resulting in N = 1500 frames per experiment.
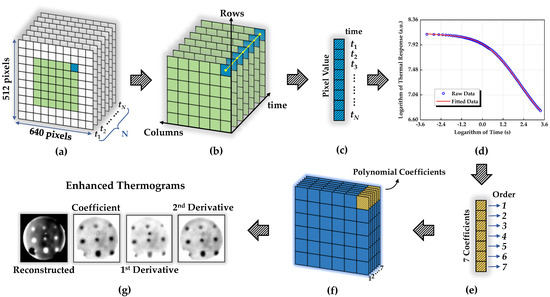
Figure 4.
The overall data processing workflow of the thermogram images, (a) raw thermograms gathered during the LPT test, (b) specific thermograms after removing the invalid defect information, (c) surface temperature evolution of a specific pixel with time, (d) six-order multinomial fitting process of specific pixel data with time, (e) the fitting coefficient of a specific pixel, (f) a three-dimensional array of fitting coefficients for all pixels, replacing the raw data, and (g) a reconstruction of the temperature evolution and the thermogram improvement with first and second derivative.
To reduce data processing time and improve the signal-to-noise ratio, only the regions containing defects are retained, while the background areas surrounding the sample are removed, as shown in the green area in Figure 4b. By extracting the instantaneous thermal responses of a single pixel (such as the blue pixel in Figure 4b) across N frames collected between time t1 and tN, we can rearrange the thermal response variation over the period t1 − tN, as depicted in Figure 4c. Polynomial fitting is then applied to the discrete data of the single pixel in Figure 4d, yielding a continuous, smooth, and differentiable fitting curve. For the O order of the polynomial function, the fitting curve can be characterized with O + 1 coefficients in Figure 4e, which enables calculation of the pixel value at any given time point. This fitting process is applied to all pixels in Figure 4b, and the fitting coefficients for all pixels are organized according to their row and column coordinates, resulting in O + 1 coefficient matrices as shown in Figure 4f. These coefficient matrices facilitate rapid retrieval of the fitting curve for any desired pixel. This methodology enables the generation of reconstructed images as shown in Figure 4g, along with coefficient images and differential images derived from the fitting curves.
Based on the Equations (1)–(4), the data obtained from a single pixel in Figure 4c can be used to reconstruct the entire thermogram sequence as shown in Figure 4g. Assuming that the structure of samples without defects is homogeneous and isotropic, the thermal response of the defect-free area of the sample can be described as in Equation (1) [23,24]:
where TS is the thermal response of the defect-free area after thermal excitation (K), T0 is the ambient temperature, q0 is the energy of the pulse thermal wave (J), λ is the thermal conductivity of the material (W/(m∙°C)), ρ is the density of the materials (kg/m3), and c is the specific heat (J/(kg∙°C)).
As the thermal wave propagates from the surface of the sample into its interior, part of the thermal wave energy will be reflected when it encounters defects that show a different thermal conductivity from that of the sample itself. Thus, a thermal response difference between the defect area and the defect-free area will occur, which can be recorded by the infrared camera. Equation (1) can be rewritten as
where ΔT = TS − T0 is the thermal response difference of the same pixel before and after the thermal excitation, and C = ln(q0) − ln(πρcλ)/2 is a constant related to the thermal properties of the material. Moreover, the multinomial Equation (3) with seven fitting parameters (a0, a1, …, and a6) can be used to fit the relationship between the thermal response and time:
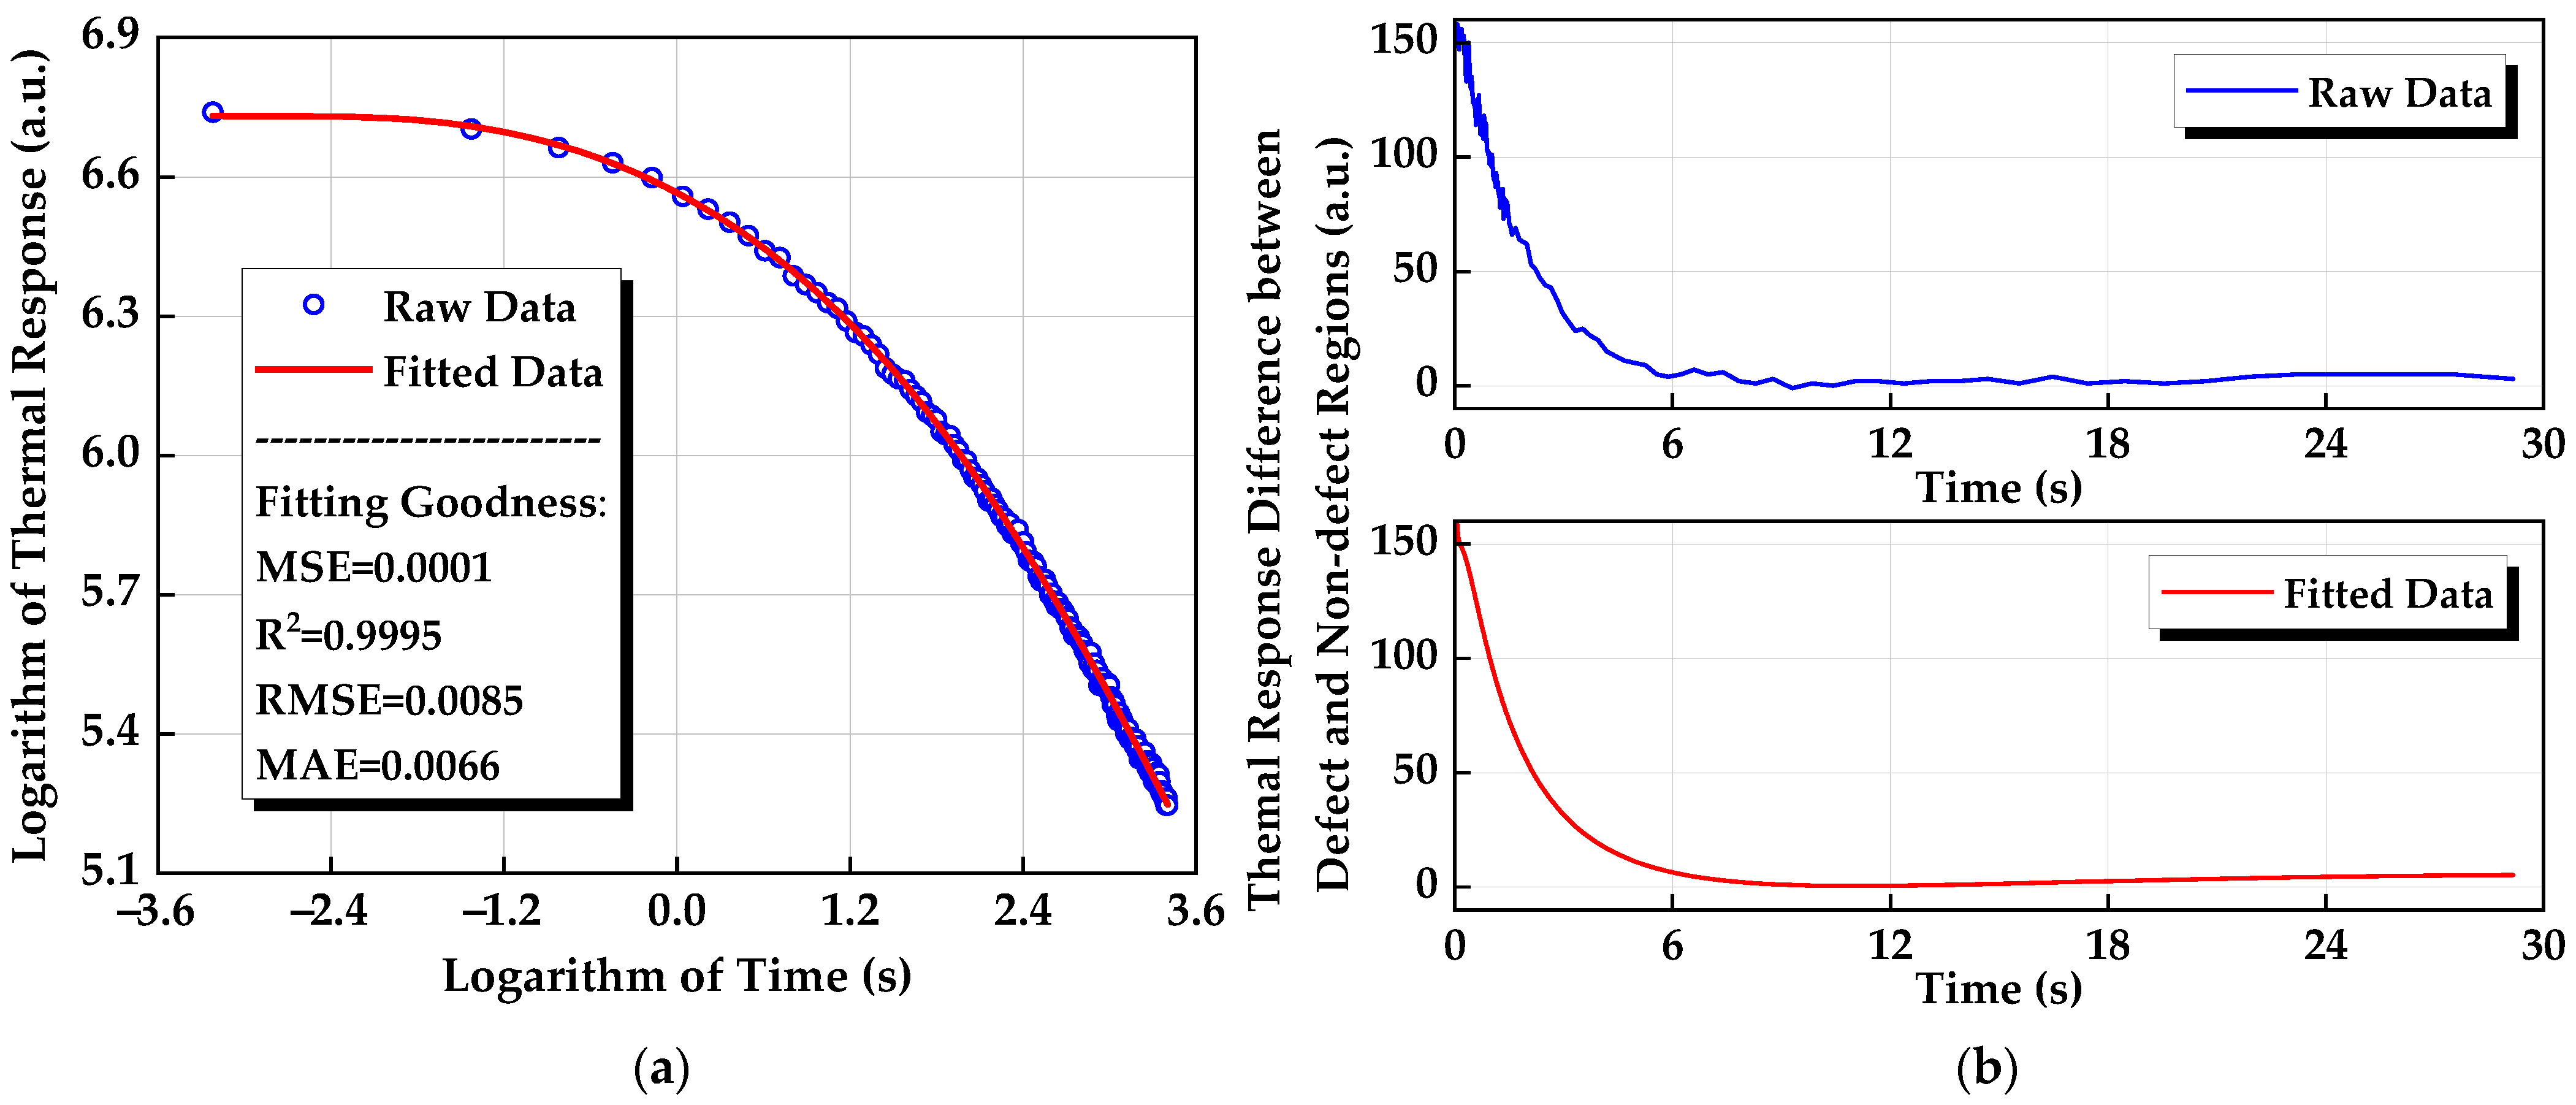
The selection of the polynomial order in Equation (3) needs to maintain a balance between computational speed and fitting accuracy [17,23,24]. From the fitting result in Figure 5a, the original discrete pixel values are converted into smooth and continuous curves, significantly reducing the effect of environmental noise on the data, and Figure 5b shows the surface radiation deviation between the raw data and fitting result. A sixth-order logarithmic polynomial already achieved the excellent goodness of fit, with MSE = 0.0001, R2 = 0.9995, and RMSE = 0.0085. Meanwhile, since only 7 fitting parameters are introduced in the sixth-order logarithmic polynomial, the computing process of a single sample can be completed in 60 s.
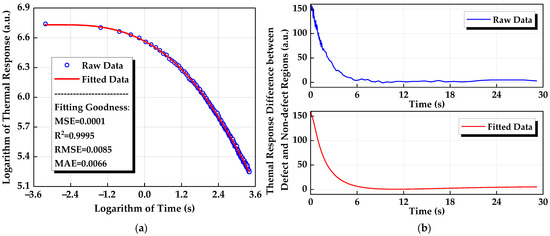
Figure 5.
The sixth-order polynomial fitting result of a specific pixel, (a) sixth-order multinomial fitting process of specific pixel data with time, and (b) a comparison between the deviation of the defective region and non-defective region.
In Figure 4e, the fitting parameters (a0, a1, …, and a6) were obtained from the sixth-order multinomial Equation (3), which can be used to reconstruct the thermal response of the sample surface as shown in Figure 4d. In other words, giving a specific time ts, the thermal response TS at that time can be calculated using the fitting parameters (a0, a1, …, and a6), as shown in Equation (4), instead of storing pixel data tested from thousands of sampling times.
After reconstructing the thermal response for each pixel using Equation (4), the original raw data can be replaced by the smoothed reconstructed data. The first and second derivatives [25,26] can be calculated with the reconstructed data to provide a higher signal-to-noise (SNR) ratio and enhance defect detectability, as shown in Figure 4f,g.
3. Results
Based on the test results and the aforementioned data processing techniques, thermograms for sample 1, 2, and 3 were obtained. These thermograms enable the evaluation of the effectiveness of the LPT test in detecting subsurface air cavities within the samples. Additionally, the SNRs of different defects in the thermal images were calculated.
3.1. Thermal Images and Processed Results
Figure 6a–d presents the reconstructed thermogram, coefficient thermogram, first-order derivative thermogram, and second-order derivative thermogram based on the experimental data from Sample 1. In the reconstructed thermogram shown in Figure 6a, all defects except for R3C1 are detectable. In the coefficient thermogram depicted in Figure 6b, the defect R3C1 remains challenging to be identified. However, the coefficient thermogram effectively eliminates the noise signal that appears in defects R1C2 and R2C2 in Figure 6a,c,d. Moreover, the second-order derivative thermogram successfully identifies defect R3C1, which is not discernible in the other three types of thermograms.
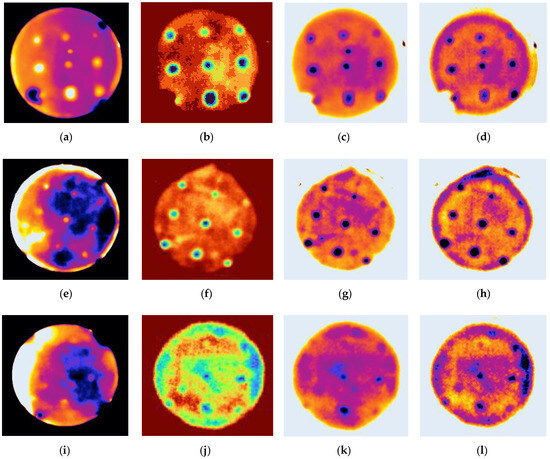
Figure 6.
Enhanced thermograms of Sample 1, 2, and 3. (a) Reconstructed thermogram, (b) coefficient thermogram, (c) first derivative thermogram, and (d) second derivative thermogram of Sample 1; (e) reconstructed thermogram, (f) coefficient thermogram, (g) first derivative thermogram, and (h) second derivative thermogram of Sample 2; and (i) reconstructed thermogram, (j) coefficient thermogram, (k) first derivative thermogram, and (l) second derivative thermogram of Sample 3.
In Figure 6e, the reconstructed thermogram exhibits blurry defect images as the depth of air cavities reaches 0.8 mm. Defects such as R3C1, R2C1, and R3C2, are difficult to distinguish, while almost all defects become visible except the smallest defect R1C3 in the coefficient thermogram, as shown in Figure 6f. Furthermore, the defects become more clear in the derivative thermograms as shown in Figure 6g,h. Specifically, the smallest defect R1C3 can be obviously observed in the second-order derivative thermogram. When the defect depth increases to 1.2 mm in Sample 3, the reconstructed thermogram in Figure 6i almost fails to identify any defects. In the coefficient thermogram of Figure 6j, several defects, such as R2C2, R2C3, and R3C2, are visible but very blurry, making them easily confused with noise signals around the defects. In the first-order derivative thermogram (Figure 6k), the defects R2C2, R2C3, and R3C2 become clear, while in the second-order derivative thermogram (Figure 6l), other several defects of R1C3, R3C1, and R3C3 are also discernable. It is worth noting that a random defect (air cavity) was also observed between defects R1C2 and R2C2, which shows a similar result to the defect R1C1, but was not specifically discussed in this work.
Therefore, it is evident that the defect identification in reconstructed thermograms is poor when the depth of a defect is higher than 1.2 mm. However, it does not mean that air cavities deeper than 1.2 mm in alumina-doped epoxy material cannot be detected. Actually, the detectable depth of the air cavities is also dependent on other factors, such as the size and aspect ratio of the defect. For air cavities with larger diameters and a higher aspect ratio, the maximum detectable depth will also be greater. Coefficient thermograms, first-order derivative thermograms, and second-order derivative thermograms can be used to improve the defect identification. Typically, the second-order derivative thermogram presents its advantage in extracting defect information and lowering the impact of artifact noise on the image quality.
3.2. Defect Detection
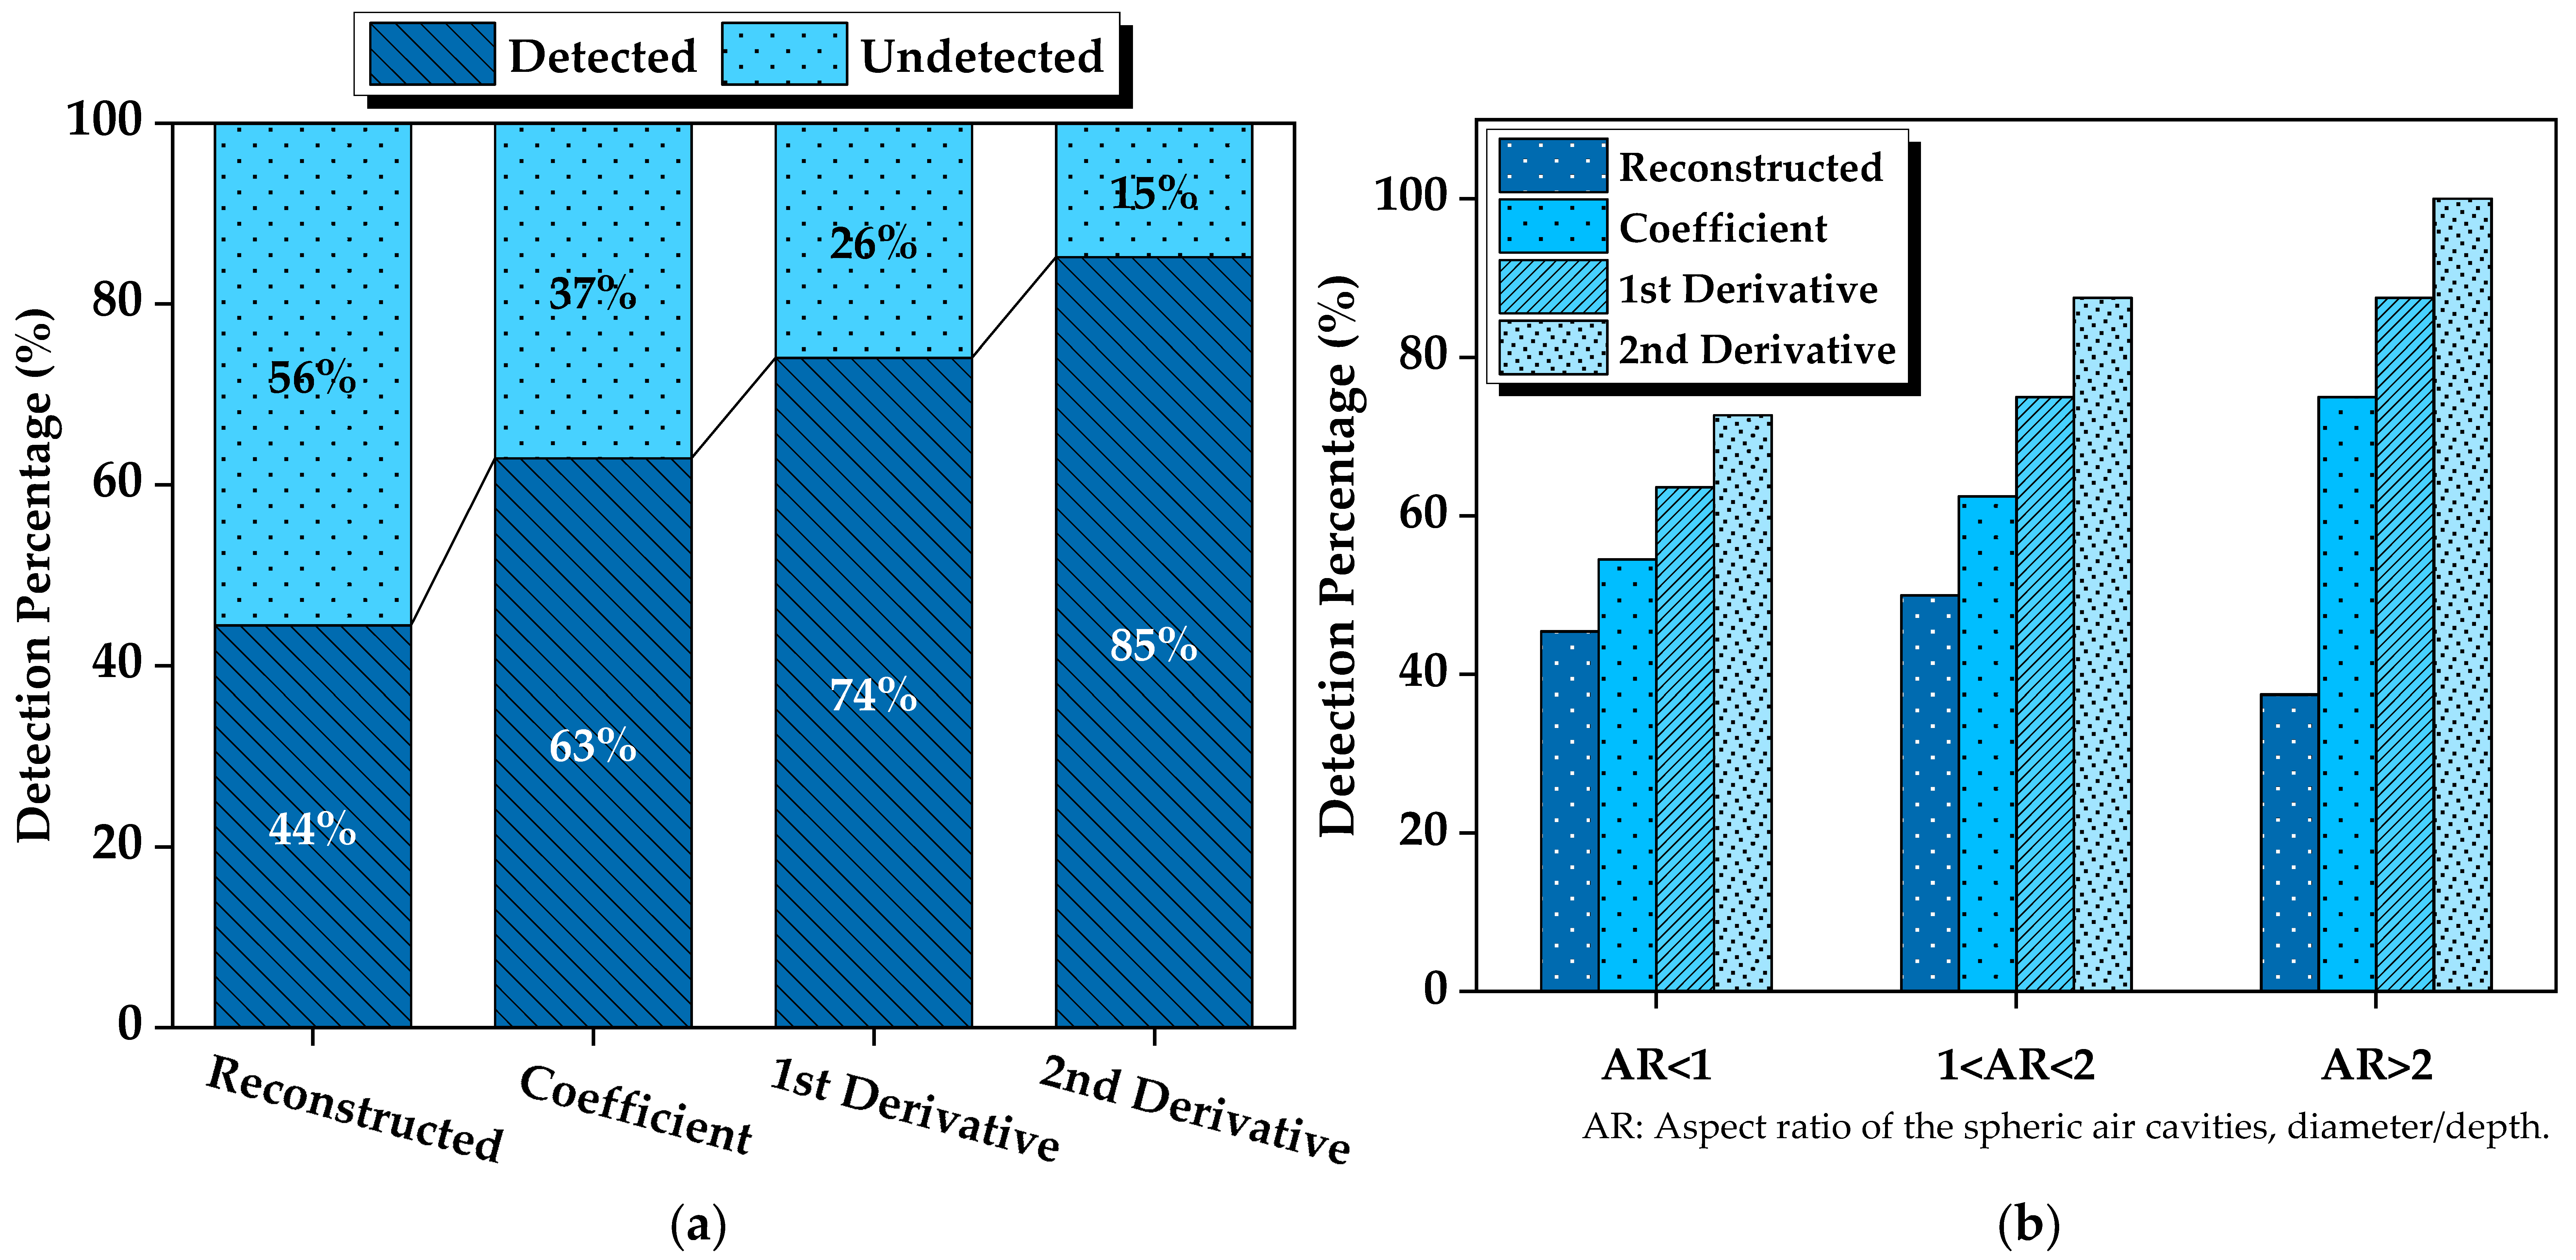
Based on the 27 defects across the three samples, the detection performance of the four types of thermograms was statistically evaluated, and the defect detection success rate was calculated in Figure 7a. It was found that the reconstructed thermogram achieved a defect detection rate of only 44% due to its susceptibility to noise and limited ability in detecting small defects. However, the success rate of defect detection can be enhanced to 63%, 74%, and 85% when employing the coefficient thermogram, the first-order derivative thermogram, and the second-order derivative thermogram, respectively. The results show that the defects with large depth and small size are difficult to detect.
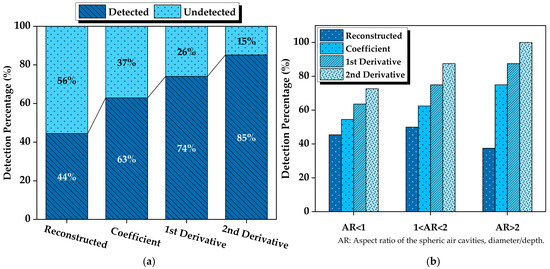
Figure 7.
The defect detection rates for all air cavity defects, (a) overall defect detection rate, and (b) detection rate under different defect aspect ratios.
In practice, the defect size and depth are two key parameters significantly influencing the defect detection. The aspect ratio, defined as the ratio of diameter to depth, was used to evaluate the defect detection effect. As shown in Figure 7b, the aspect ratios of all defects were divided into three ranges, and the success rate of defect detection for the four thermogram methods was calculated. It can be found that the high aspect ratio is beneficial to defect detection. Notably, the second-order derivative thermogram achieved a 100% recognition rate for defects with an aspect ratio greater than 2.
3.3. Quantitative Analysis
To quantitatively study the visualization effectiveness of different thermograms for various defects, the SNR is calculated as Equation (5):
where ND and NS represent the number of pixels in the defect and non-defect regions, respectively, while ID and IS denote the pixel values related to the defect regions and non-defect regions.
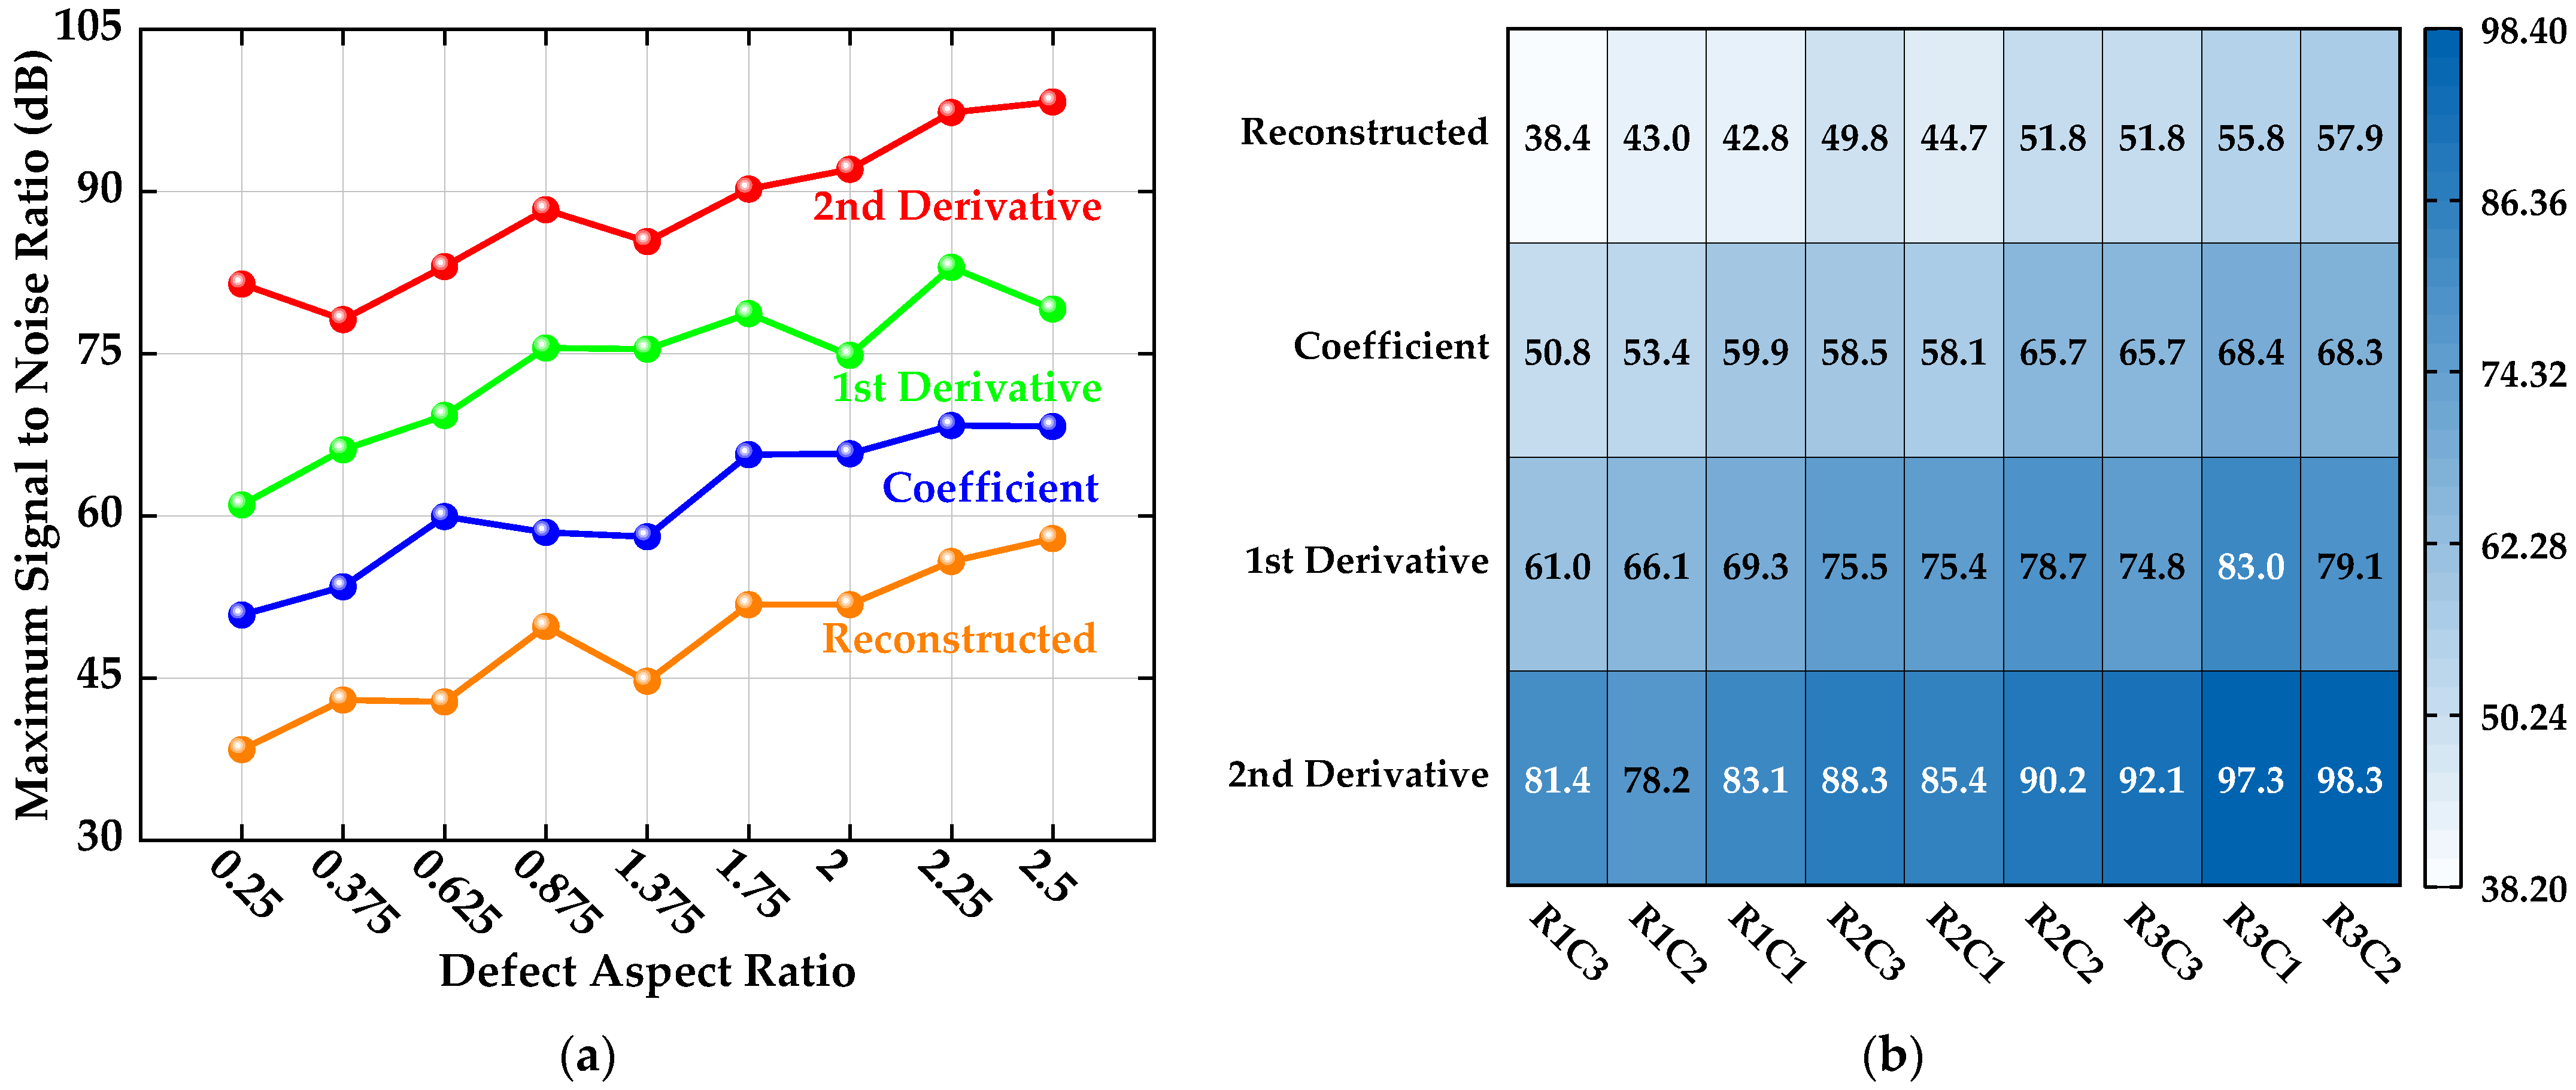
By combining SNR with the aspect ratio, the influence of defect size and depth on the defect visualization in different thermograms can be studied. Figure 8a illustrates the SNR variation of defects with different aspect ratios in Sample 2 across the four types of thermograms. It can be found that as the aspect ratio increases, the SNR of defects in all four thermograms shows an upward trend, which indicates that a larger aspect ratio generates a stronger defect signal, making the defect easier to detect. Figure 8b presents a heatmap of the SNR data for the defects in Sample 2. From the heatmap, it is evident that the color becomes deeper toward the bottom and right, indicating that larger defects exhibit relatively better visualization. The combination in the bottom-right corner of the heatmap produces an SNR as high as 98.3 dB in the second-order derivative thermogram for the defect R3C2 in Sample 2, demonstrating the excellent visualization performance.
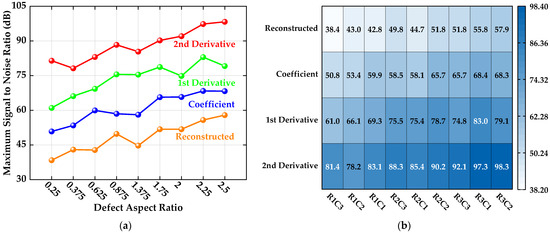
Figure 8.
The SNR results of the defects in Sample 2, (a) SNR variation of the defects with different defect aspect ratios, and (b) heatmap of different defects in four enhanced thermograms.
4. Conclusions
This study investigated the defect detection of subsurface air cavities in alumina-doped epoxy resin based on the long pulse thermography. Four data processing techniques were applied to detect the defects with various diameters and depths. It is found that the reconstructed images are not ideal for defect detection in alumina-doped epoxy resin, while the combined use of coefficient and derivative images effectively eliminates interference, enhances defect contrast, and improves defect SNR. It was found that the reconstructed thermogram achieved a defect detection rate of only 44% due to its susceptibility to noise, while the defect detection rate can be enhanced to 85% using the second-order derivative thermogram. The aspect ratio was proposed to evaluate the defect detection effect. It can be found that the high aspect ratio leads to a high defect detection rate. Notably, the second-order derivative thermogram realized a 100% detection rate for defects with an aspect ratio greater than 2. Moreover, the influence of defect size and depth on the defect visualization of different thermograms can be analyzed through combining SNR with the aspect ratio. The SNR of defect R3C2 in Sample 2 reaches 98.3 dB in the second-order derivative thermogram, demonstrating an excellent visualization performance.
Author Contributions
Data curation, writing—original draft preparation, B.L. and L.W.; visualization, L.F. and W.Y.; methodology, J.B. and Y.Y.; writing—review and editing, R.Z.; investigation, R.Z. and Z.G.; project administration, funding acquisition, writing—review and editing, X.Z. All authors have read and agreed to the published version of the manuscript.
Funding
This work was financially supported by the Science and Technology Project of China Southern Power Grid, grant Number GZKJXM20222388.
Data Availability Statement
The original contributions presented in the study are included in the article, further inquiries can be directed to the corresponding author.
Conflicts of Interest
Authors Bo Li, Lei Fan Jie Bai and Zhengwei Guo were employed by the company Electric Power Research Institute of Guizhou Power Grid Co., Ltd. The remaining authors declare that the research was conducted in the absence of any commercial or financial relationships that could be construed as a potential conflict of interest.
References
- Tayseer, M.; Talaat, M.; Farahat, M.A. Optimum design of spacer material of gas-insulated switchgear by utilizing the technology of functionally graded material using different artificial optimization techniques. Surf. Coat Tech. 2024, 479, 130530. [Google Scholar] [CrossRef]
- Sarthak, S.; Ashok, M.; Shardul, J. Structural and modal analysis of gas insulated switchgear structure made up of glass-epoxy and carbon-epoxy composite materials for seismic application. Mater. Today Proc. 2023, 78, 501–507. [Google Scholar] [CrossRef]
- Han, X.; Zhang, X.; Guo, R.; Wang, H.; Li, J.; Li, Y. Partial discharge detection in Gas-Insulated Switchgears using sensors integrated with UHF and optical sensing methods. IEEE Trans. Dielectr. Electr. Insul. 2022, 29, 2026–2033. [Google Scholar] [CrossRef]
- Wang, Y.; Yan, J.; Yang, Z.; Qi, Z.; Wang, J.; Geng, Y. Gas-Insulated Switchgear insulation defect diagnosis via a novel domain adaptive graph convolutional network. IEEE Trans. Instrum. Meas. 2022, 71, 3508910. [Google Scholar] [CrossRef]
- Liu, Z.; Cui, Y.; Zhang, B.; He, J. Measurement of multipath transients in secondary cables near a 500 kV Gas-Insulated Switchgear during operations. IEEE Trans. Power Deliv. 2022, 38, 917–925. [Google Scholar] [CrossRef]
- Hao, Y.; Zheng, Y.; He, W.; Liang, X.; Zhang, Z.; Liu, L. A measurement method of ultrasonic critical refraction longitudinal wave for thermal stress in GIS basin-type insulators. IEEE Trans. Instrum. Meas. 2021, 71, 6001009. [Google Scholar] [CrossRef]
- Wang, Z.; Wang, Y.; Ding, H.; Jia, B.; Zhou, W.; Lu, W. Modeling of surface trapping effect on charge accumulation pattern at gas–solid interface in DC GIL. IEEE Trans. Dielectr. Electr. Insul. 2023, 31, 466–476. [Google Scholar] [CrossRef]
- Xing, Y.; Wang, Z.; Liu, L. Defects and failure types of solid insulation in gas-insulated switchgear: In situ study and case analysis. High Volt. 2022, 7, 158–164. [Google Scholar] [CrossRef]
- Hao, Y.; Zhang, Y.; Shen, Z.; Liu, L.; Yao, C.; Huang, S. Ultrasonic longitudinal wave reflection propagation model and defect detection method for the cone of 126-kV three-phase basin insulators. IEEE Trans. Dielectr. Electr. Insul. 2024, 73, 9004608. [Google Scholar] [CrossRef]
- Zhou, W.; Zheng, Y.; Yang, S.; Li, H.; Wang, B.; Qiao, S. Detection of intense partial discharge of epoxy insulation in sf6 insulated equipment using carbonyl sulfide. IEEE Trans. Dielectr. Electr. Insul. 2016, 23, 2942–2948. [Google Scholar] [CrossRef]
- Zhang, G.; Yang, W.; Zhao, H. Defect detection on operating insulation spacer of GIS based on 3D X⁃ray digital imaging technology. High Volt. Appar. 2022, 58, 230–236. [Google Scholar] [CrossRef]
- Muhammet, E.T.; Argyrios, Z.; Nicolas, P.A.; Muflih, A.; Clemente, I.; Maldague, X.P. A complementary fusion-based multimodal non-destructive testing and evaluation using phased-array ultrasonic and pulsed thermography on a composite structure. Materials 2024, 17, 3435. [Google Scholar] [CrossRef] [PubMed]
- Pan, P.; Zhang, R.; Yi Zhang, Y.; Li, H. Detecting internal defects in FRP-reinforced concrete structures through the integration of infrared thermography and deep learning. Materials 2024, 17, 3350. [Google Scholar] [CrossRef] [PubMed]
- Malgorzata, C.; Adam, S.; Marek, B.; Marcin, A. Evaluation and defect detection in L-Shaped GFRP laminates by infrared thermography. Materials 2024, 17, 2830. [Google Scholar] [CrossRef]
- Xiaoli Li, X.; Zhi Zeng, Z.; Shen, J.; Zhang, C.; Zhao, Y. Rectification of depth measurement using pulsed thermography with logarithmic peak second derivative method. Infrared Phys. Tech. 2018, 89, 1–7. [Google Scholar] [CrossRef]
- Zou, X.; Li, M.; Xu, H.; Lu, X. Array infrared thermography for visualization of defects in bonded fiber reinforced polymer joints. Compos. Sci. Technol. 2024, 259, 110930. [Google Scholar] [CrossRef]
- Shepard, S.M. Reconstruction and enhancement of active thermographic image sequences. Opt. Eng. 2003, 42, 1337–1342. [Google Scholar] [CrossRef]
- Maldague, X.; Marinetti, S. Pulse Phase Thermography. J. Appl. Phys. 1996, 79, 2694–2698. [Google Scholar] [CrossRef]
- Liu, L.; Wang, L.; Guo, C.; Mei, H.; Zhao, C. Detecting defects in porcelain post insulator coated with room temperature vulcanized silicone rubber by pulsed thermography. IEEE Trans. Instrum. Meas. 2019, 68, 225–233. [Google Scholar] [CrossRef]
- Liu, L.; Mei, H.; Guo, C.; Tu, Y.; Wang, L.; Liu, J. Remote optical thermography detection method and system for silicone polymer insulating materials used in power industry. IEEE Trans. Instrum. Meas. 2020, 69, 5782–5790. [Google Scholar] [CrossRef]
- Guo, C.; Liu, L.; Mei, H.; Tu, Y.; Wang, L. Nondestructive Evaluation of Composite Bonding Structure Used in Electrical Insulation Based on Active Infrared Thermography. Polymers 2022, 14, 3373. [Google Scholar] [CrossRef] [PubMed]
- Rezazadeh, N.; Annaz, F.; Jabbar, W.A.; Vieira Filho, J.; De Oliveira, M. A transfer learning approach for mitigating temperature effects on wind turbine blades damage diagnosis. Struct. Health Monit. 2025. [Google Scholar] [CrossRef]
- Vavilov, V.; Burleigh, D. Infrared Thermography and Thermal Nondestructive Testing; Springer: Cham, Switzerland, 2020. [Google Scholar] [CrossRef]
- Lopez, F.; Ibarra-Castanedo, C.; Maldague, X.; de Paulo Nicolau, V. Analysis of signal processing techniques in pulsed thermography. In Proceedings of the Thermosense: Thermal Infrared Applications XXXV, Baltimore, MA, USA, 29 April–3 May 2013; Volume 8705. [Google Scholar] [CrossRef]
- Vavilov, P.V.; Burleigh, D.D. Review of pulsed thermal NDT: Physical principles, theory and data processing. NDT E Int. 2015, 73, 28–52. [Google Scholar] [CrossRef]
- Wang, Z.; Tian, G.; Meo, M.; Ciampa, F. Image processing based quantitative damage evaluation in composites with long pulse thermography. NDT E Int. 2018, 99, 93–104. [Google Scholar] [CrossRef]


Disclaimer/Publisher’s Note: The statements, opinions and data contained in all publications are solely those of the individual author(s) and contributor(s) and not of MDPI and/or the editor(s). MDPI and/or the editor(s) disclaim responsibility for any injury to people or property resulting from any ideas, methods, instructions or products referred to in the content. |
© 2025 by the authors. Licensee MDPI, Basel, Switzerland. This article is an open access article distributed under the terms and conditions of the Creative Commons Attribution (CC BY) license (https://creativecommons.org/licenses/by/4.0/).