Abstract
Spontaneous counter-current imbibition is a crucial recovery mechanism in water-wet fractured reservoirs, especially in unconventional formations like tight and shale reservoirs. The geometric characteristics of microscale fractures require further clarification regarding their impact on imbibition. In this paper, the numerical simulation method is used to study the influence of fracture aperture, length, density, and relative position between fracture and imbibition open face on the counter-current imbibition process of a matrix block. For fractures perpendicular to the imbibition surface and in contact with water, the embedded discrete fracture model is utilized to simulate the impact of varying fracture apertures on counter-current imbibition. For fractures parallel to the imbibition surface, considering the impact of fracture on the capillary discontinuity of the matrix, the effects of varying fracture lengths and densities on counter-current imbibition are simulated. The results show that when fractures are perpendicular to the imbibition surface and in contact with water, the imbibition rate can be increased, and as the fracture aperture decreases, the imbibition rate first increases and then decreases. On the other hand, fractures parallel to the imbibition surface inhibit the imbibition process, with the imbibition rate decreasing as fracture length or density increases. This paper proposes an empirical shape factor considering the geometric characteristics of fractures, which can effectively characterize the influence of microfractures on matrix block imbibition, thus improving the dual-medium numerical simulation model.
1. Introduction
Spontaneous counter-current imbibition is a common phenomenon and an important mechanism in the development of fractured reservoirs [1,2,3]. Fractures divide the matrix into discontinuous rock blocks, and the permeability of the matrix is typically low, making it difficult to form an effective displacement pressure difference. Oil and gas can be recovered from the matrix under the action of capillary pressure difference between water or fracturing fluid in fracture and hydrocarbon in matrix [4]. Extensive research has been conducted on spontaneous imbibition issues [5,6,7]. However, fracture systems related to imbibition problems typically refer to hydraulic fractures or natural fractures with larger apertures. In fact, there are many microfractures in low-permeability fractured reservoirs. These microfractures are much smaller in scale than the macroscopic fractures of the reservoir, with aperture sizes typically in the micron range and lengths from a few micrometers to several centimeters, but they usually have a high fracture density [8,9]. The development of microfracture networks exhibits strong depth dependence. Geological studies reveal that fracture intensity increases with burial depth through enhanced microfracture density and homogenized spatial distribution, which, in turn, can significantly alter fluid flow pathways and capillary pressures [10]. Therefore, it is essential to clarify the impact of microfractures on spontaneous counter-current imbibition.
In the study of spontaneous imbibition in fractured reservoirs, for fractures with larger apertures, the capillary pressure is much lower than that of the matrix, so the capillary pressure curve of large-scale fractures is typically treated as zero [11]. Additionally, for water-injected fractures that saturate quickly, changes in fracture aperture (450–1250 μm) have little impact on imbibition rate and ultimate recovery, with aperture mainly affecting the dynamics of early-stage imbibition [12]. However, when the aperture of fractures becomes sufficiently small, the impact of capillary pressure becomes non-negligible; otherwise, it may lead to discrepancies between predicted and actual recovery rates [13]. Furthermore, in the absence of water drive, fractures with small apertures exhibit a higher imbibition front advance speed compared to the matrix [14,15,16].
Currently, different studies using various techniques or research methods have confirmed the significant impact of unsaturated water in fractures on spontaneous imbibition. In the study of the relationship between spontaneous imbibition rate and pore structure in coal reservoirs, microfractures in anthracite and bituminous coal exhibit a higher spontaneous imbibition rate than medium/large pores and micropores [17]. Neutron imaging technology has been used to record the dynamic imbibition process of water in fractures in real-time, providing data on the change of wetting front height over time. The results indicate that fracture wettability is significantly controlled by fracture aperture and surface roughness [18]. Pore-scale simulation results show that microfractures in the matrix filled with two-dimensional grains can significantly improve oil recovery [19]. Through spontaneous imbibition experiments with quantitatively controlled fracture apertures and embedded discrete fracture models, it was found that small-aperture fractures in contact with the imbibition face can significantly increase the imbibition rate [20].
Current research primarily focuses on the impact of individual fractures on spontaneous imbibition in the matrix, without fully addressing the influence of discrete, microscale fractures on imbibition. Moreover, there is a lack of dual-porosity models capable of describing the imbibition in matrix blocks with developed microfractures. In this study, a numerical simulation method for spontaneous imbibition is used to quantitatively analyze the imbibition behavior under various conditions, including different fracture apertures, densities, lengths, and relative positions of fractures to the imbibition face. Based on numerical simulation results, an imbibition shape factor for matrix blocks with developed microfractures is presented for different boundary conditions.
2. Numerical Simulation of Microfracture Imbibition
2.1. Microfracture Perpendicular to the Imbibition Open Face
The previous work [20] has analyzed this situation, and here we further extend the research on the fracture aperture range in order to gain a clearer understanding of the influence of fracture aperture on imbibition. To investigate aperture-dependent imbibition dynamics, the counter-current spontaneous imbibition process within a microfracture was simulated via the embedded discrete fracture model (EDFM), leveraging the UNCONG software platform (v.2020.1; Energy Innovation Software Co., Ltd., Beijing, China). While the software automates numerical implementations, we briefly introduce the core EDFM theory to establish foundational concepts for later comparison with dual-porosity approaches. Key equations governing multiphase flow and fracture–matrix coupling are summarized below. For phase α (gas/water), mass conservation in the matrix and fractures is calculated as follows:
where j represents the matrix or the fracture, v is the flow velocity, q is mass exchange between matrix and fractures, ϕ is the porosity, and S is the saturation.
Phase velocity follows the generalized Darcy’s law as follows:
where k is the absolute permeability, kr is the relative permeability, μ is the viscosity, p is the pressure, ρ is the density, g is gravitational acceleration, and D is depth.
The constraints on saturation are as follows:
where pc is the capillary pressure. The matrix–fracture mass transfer is proportional to the pressure difference as follows:
where the matrix–fracture transmissibility Tmf is as follows:
where A is the fracture area within the matrix cell, and d is the effective distance between the matrix cell center and the fracture.
The size of the matrix block is 5 cm × 5 cm × 5 cm, and the number of grid blocks is 25 × 25 × 26. The bottom layer in the Z-direction is set as a hydraulic fracture filled with water, and its capillary pressure is negligible. To simplify the model, the porosity of hydraulic fractures was set to 1000 to ensure sufficient water imbibition into the matrix and microfractures. The hydraulic fracture acts as a constant-pressure water source, driving spontaneous imbibition without explicitly defining injection/production rate. Vertical microfractures, which consider capillary pressure, are placed in the central position of the matrix block and extend throughout the block (Figure 1). The embedded discrete fracture model (EDFM) was exclusively applied to microfractures to resolve their discrete geometry and capillary-driven flow dynamics. Microfracture apertures are modeled as ideal parallel-plate fractures with values spanning 5 μm, 10 μm, 20 μm, 30 μm, 40 μm, 50 μm, 160 μm, 240 μm, 320 μm, and 950 μm. The permeability of each microfracture is calculated using the parallel-plate model, where permeability is proportional to the square of the aperture. The upper range of apertures (e.g., 950 μm) exceeds conventional definitions of microfractures (typically <100 μm). However, for simplicity in comparative analysis, we categorize all fractures in this study as ‘microfractures’ regardless of aperture size. The numerical simulation parameters are shown in Table 1. It is assumed that the relative permeability curves for gas–water in fractures are represented by two straight lines. The gas–water relative permeability curve for the matrix is the same as that in the literature [20]. The relative permeability curves of matrix and fractures (including hydraulic fracture and microfracture) are shown in Figure 2.
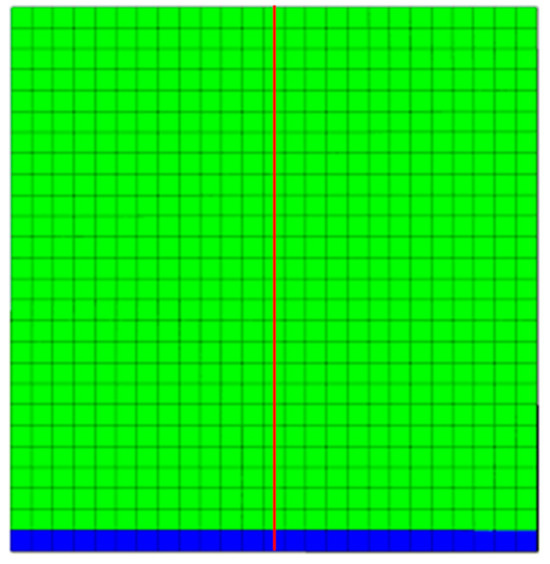
Figure 1.
Schematic diagram of the vertical microfracture model (the green area represents the matrix, the blue area represents the hydraulic fracture, and the red line represents microfracture).

Table 1.
Parameters used for simulations.
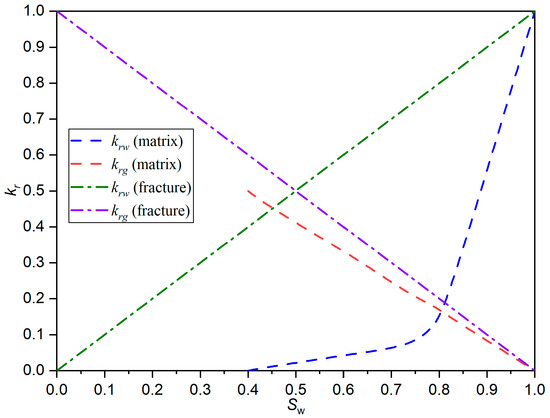
Figure 2.
Relative permeability curves for matrix and fractures (including hydraulic fracture and microfracture).
Based on experimental findings [20], the effect of fractures with varying apertures on spontaneous imbibition in the matrix is not uniform. This variation is closely tied to the capillary pressure within the fractures. However, obtaining capillary pressure curves for simulation in laboratory conditions is challenging. Wilson and Rodríguez used a microfracture network model to explore the imbibition behavior of microfractures, calculating distinct capillary pressure and relative permeability curves during displacement and imbibition processes [21]. They pointed out that capillary pressure exhibits hysteresis only under conditions of varying fracture apertures. The model in this study refers to the fracture capillary pressure curve characteristics obtained by Wilson and Rodríguez, and the maximum value of the fracture capillary pressure is calculated using Equation (6), where the wetting angle is set at 60°. Based on this, capillary pressure curves for fractures with different apertures are established. Figure 3 shows the capillary pressure curves for the matrix and fractures with different apertures. The maximum value of the fracture capillary pressure is calculated as follows:
where pc is the capillary pressure, σ is the surface tension, θ is the wetting angle, and w is the fracture aperture.
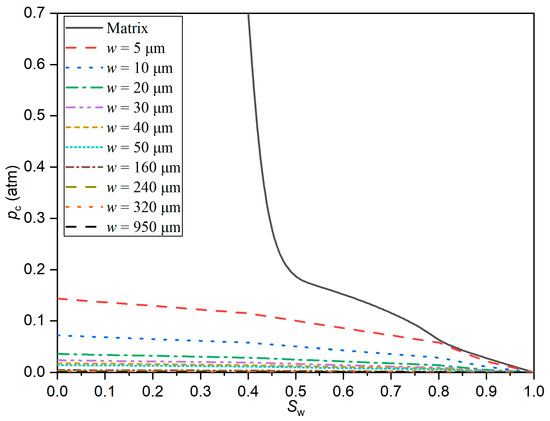
Figure 3.
Capillary pressure curves for matrix and microfractures.
2.2. Microfracture Parallel to the Imbibition Open Face
Fractures cause discontinuities in the matrix capillaries, leading to different imbibition speeds in the directions perpendicular and parallel to the fractures, which results in anisotropy in the imbibition process. To clarify this effect, a reasonable numerical simulation model is established to analyze the influence of fracture length and density on the imbibition process. The model size is 5 cm × 5 cm × 5 cm, with a grid of 102 × 102 × 102, and the boundary condition is a one-dimensional one face open (1D–1F). The basic parameters of the numerical simulation model are shown in Table 2, with some values adapted from Reference [22]. In this case, model C-1 serves as the control group, where the microfractures are perpendicular to the imbibition surface and do not contact the water phase. In other models, microfractures in the matrix are evenly distributed in the direction parallel to the imbibition open face.
Table 2.
Numerical simulation model parameters.
The development of small-scale fractures within the matrix slows down the imbibition rate, mainly due to the slow process of liquid bridge formation in the fractures and the imbibition through the liquid bridges [23,24,25]. If the fracture aperture is large, it may be unable to establish capillary continuity. The imbibition front in the matrix can pass around the fracture face and spread to the area behind the fracture through diffusion, a process that occurs much faster than the imbibition through the fracture itself. Therefore, in the numerical simulation of matrix rock with small-scale fractures, fractures within the matrix that do not connect to the imbibition open face can be assigned a conductivity of zero in the direction perpendicular to the fracture face. The fracture parameters for the model are shown in Table 3. An illustration of the fracture distribution for model C-2 is shown in Figure 4.
Table 3.
Fracture parameters of the models.
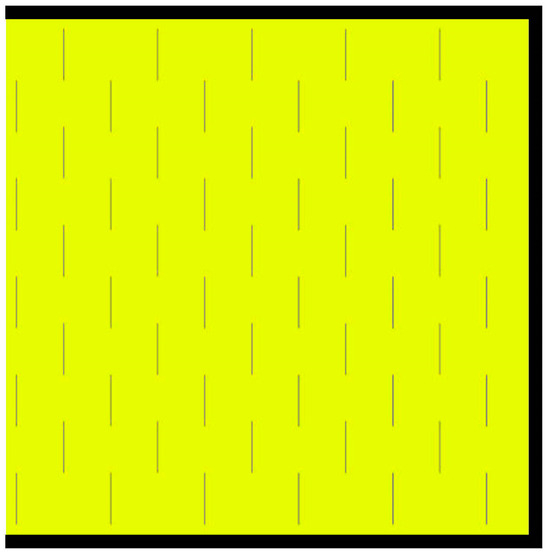
Figure 4.
Schematic diagram of fracture distribution of the model C-2 (the black area represents the closed boundary).
3. Results and Discussion
3.1. Microfracture Perpendicular to the Imbibition Open Face
Figure 5 shows the normalized imbibition recovery curves for different fracture aperture models. The normalized imbibition recovery can be calculated by the following:
where R is recovery by imbibition, Rmax is ultimate recovery by imbibition, is the average water saturation, Snr is the residual saturation of the nonaqueous phase, and Swi is the initial water saturation.

Figure 5.
Normalized imbibition recovery curves of different fracture aperture models.
It can be observed that the numerical simulation results are consistent with the experimental trends reported in the literature [20]. Specifically, within the aperture range of 50 to 950 μm, as the fracture aperture decreases, the imbibition recovery curve gradually shifts to the left, indicating an increase in the imbibition rate. Further numerical simulations reveal the imbibition characteristics for fractures with apertures below 50 μm. When the fracture aperture is in the range of 20 to 50 μm, the normalized imbibition recovery curves are very similar, suggesting that the imbibition rate is near its peak. When the fracture aperture is reduced to 10 μm, the imbibition rate is actually lower than that for the 160 μm fracture aperture model. Moreover, at an aperture of 5 μm, the imbibition rate further decreases. To better compare the imbibition rate differences between different aperture models, the imbibition duration for each model was calculated, as shown in Figure 6. The imbibition duration is defined as the time required from the onset of imbibition until the matrix grid block reaches its maximum water saturation. In this model, the imbibition process is considered complete when all matrix grids reach Sw = 1. It is evident that as the fracture aperture decreases, the imbibition duration initially decreases and then increases, with a fracture aperture threshold that results in a maximum imbibition rate. In conclusion, when fractures are perpendicular to the open face of the matrix block and in contact with the water phase, they enhance the imbibition process. Additionally, as the fracture aperture decreases, the imbibition rate first increases and then decreases. The non-monotonic trend arises because while smaller microfracture apertures increase capillary pressure, they simultaneously reduce fracture permeability. At extremely small apertures, microfractures behave like matrix pores, losing their ability to enhance imbibition. Thus, imbibition time does not decrease continuously with aperture reduction.
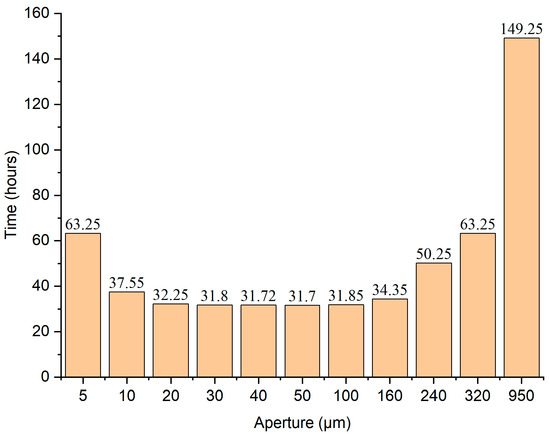
Figure 6.
Imbibition duration for different fracture aperture models.
3.2. Microfracture Parallel to the Imbibition Open Face
Figure 7 shows the normalized imbibition recovery curves for different fracture lengths. With the same volumetric fracture density, longer fractures within the matrix cause more significant hindrance to imbibition, as demonstrated by the fact that imbibition rate is lower when the fracture surface is parallel to the open face compared to when it is perpendicular to the open face. The presence of fractures makes it difficult for fluids to continue imbibing through the fracture, as the process of forming capillary continuity through liquid bridges within the fracture is very slow. Additionally, when the fracture aperture is larger, capillary continuity may not even be established. Therefore, before capillary continuity is established at both ends of the fracture, the fluid already bypasses the fracture and continues to move into the matrix through diffusion, which increases the movement distance of the imbibition front and thus reduces the overall imbibition rate of the rock block.
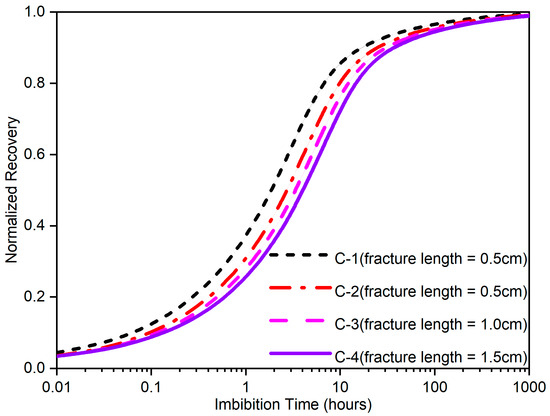
Figure 7.
Normalized imbibition recovery curves of different fracture lengths.
Figure 8 shows the normalized imbibition recovery curves for different fracture densities. Under the same fracture length conditions, higher fracture densities lead to lower imbibition rate. This is primarily because a higher fracture density results in more severe discontinuities in the matrix’s capillaries, which increases the hindrance to the imbibition process.
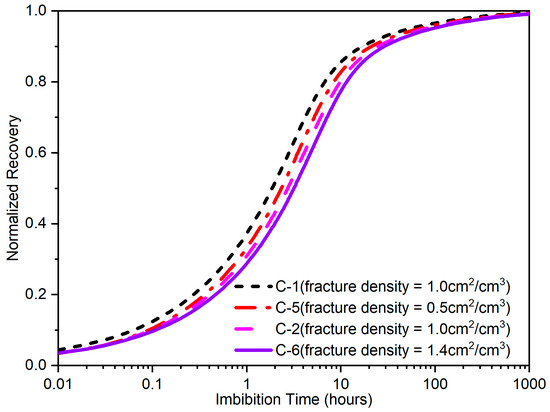
Figure 8.
Normalized imbibition recovery curve with different fracture densities.
Figure 9 and Figure 10 show the water saturation distribution and flow field maps for models with uniformly distributed fractures of 0.5 cm (Model C-2) and 1.0 cm (Model C-3) lengths. From the figures, it can be observed that although both models have the same fracture density, the model with longer fractures exhibits a longer diffusion distance of the imbibition front bypassing the fractures towards the rear. This effectively increases the characteristic length of the model. Therefore, under the same fracture volume density, longer fractures within the rock block cause a more significant hindrance to the imbibition process.
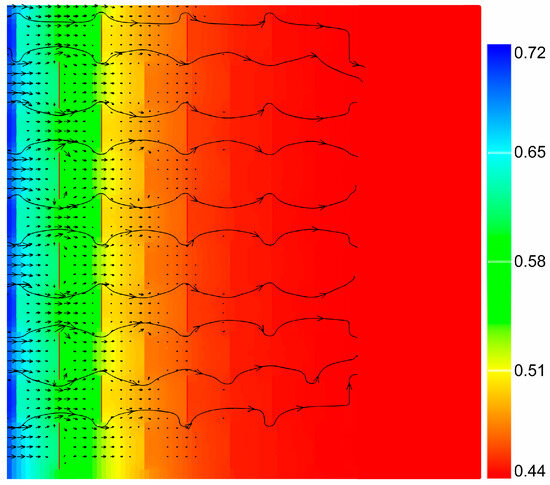
Figure 9.
Water saturation distribution and flow field characteristics when 0.5-cm-long fractures are uniformly distributed in the matrix (at 15 min).
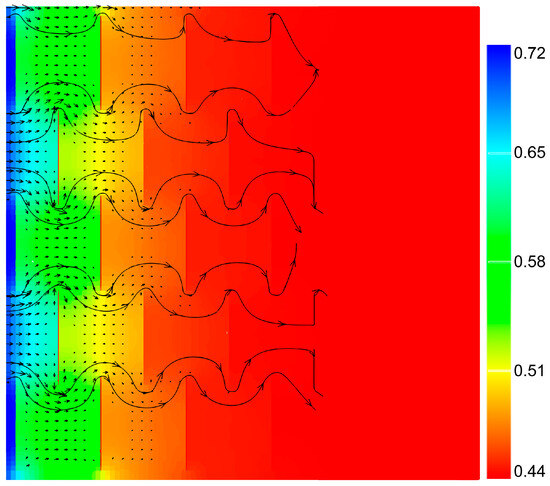
Figure 10.
Water saturation distribution and flow field characteristics when 1.0-cm-long fractures are uniformly distributed in the matrix (at 15 min).
3.3. Scaling of Imbibition in Matrix Blocks with Microfractures
3.3.1. Shape Factor
When the microfractures are well developed in a reservoir, they significantly affect the imbibition process of the matrix blocks and should be considered in reservoir numerical simulations. However, due to their small aperture and high density, it is difficult to accurately represent these fractures in geological models. Additionally, when studying actual reservoirs, there is no need to determine the flow characteristics of each individual micro-fracture. Therefore, these fractures are unsuitable for simulation using discrete fracture models. Instead, the impact of these fractures on the imbibition process can be characterized through a shape factor and simulated using a dual-porosity model.
Currently, numerous studies have focused on spontaneous imbibition shape factors, leading to many classical formulations. For example, the shape factor proposed by Kazemi et al. [11] is widely applied in commercial numerical simulation software, and Ma et al. [26] further developed imbibition-specific shape factors based on this work. However, shape factors that account for the influence of microfractures on spontaneous imbibition still require more attention.
The coupled flow process between microfractures and matrix during imbibition is complex, making it difficult to derive a shape factor through theoretical analysis. From the previous analysis, it is evident that the imbibition rate of fractures is closely related to the development degree of the fractures (including aperture, length, and density) as well as the spatial relationship between the fractures and the imbibition boundary. Generally, these factors can be summarized into two aspects: on the one hand, fractures intersecting with the imbibition boundary increase the imbibition area, thereby enhancing the imbibition rate of the matrix; on the other hand, fractures developed within the matrix increase the imbibition distance, reducing the matrix’s imbibition rate. Since both the imbibition area and imbibition distance are related to the shape factor, it can be used to quantitatively represent these effects. Based on the imbibition behavior of fractures, the existing time-dependent imbibition shape factor has been improved [22], and an empirical relationship for the shape factor under the influence of microfractures during imbibition is given as follows:
where Vb is the bulk volume of the matrix, Aδ is the area open to imbibition with respect to the δ-th direction, lAδ is the distance that the imbibition front travels from the imbibition face to the no-flow boundary, R is recovery by imbibition, and Rmax is ultimate recovery by imbibition.
In the Equation (8), ω is a constant related to the imbibition intensity of both the fractures and the matrix. If the fractures enhance the imbibition process in the matrix block, then ω > 1; if the fractures impede imbibition, then ω < 1; if the fractures have a negligible effect on imbibition, then ω = 1, and the shape factor represents the imbibition shape factor of the matrix block alone. In practical applications, the value of ω can be obtained through laboratory experiments or treated as a fitting parameter in numerical simulations. In the dual-porosity model, the matrix–fracture mass transfer terms are as follows:
Substituting Equation (7) into Equation (8) yields the following:
Equation (10) expresses the newly improved shape factor as a function of the average water saturation in the matrix block. Since the average water saturation of an individual grid block corresponds to the water saturation within that grid, the shape factor can be calculated at any time. By combining Equations (1)–(3), (9) and (10) with other auxiliary equations, the microfracture-considered novel shape factor is successfully incorporated into the dual-porosity numerical simulation model.
3.3.2. Validation
Figure 11 shows the numerical simulation results considering the vertical fracture imbibition effect under different boundary conditions. Due to the imbibition effect of fractures, the imbibition rate of the 1D–1F boundary condition model with fractures is significantly higher. The enhancement effect of fractures on imbibition rates for other boundary conditions needs further analysis after scaling the imbibition curves.
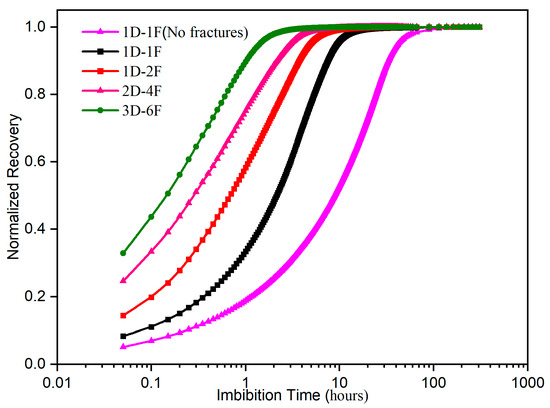
Figure 11.
Numerical results of microfracture imbibition under different boundary conditions.
Figure 12 presents the fitting scaling results for different boundary conditions with fracture imbibition. It can be seen that using the modified shape factor allows for good scaling of the imbibition results from different boundary conditions onto a single curve. The fitted values for the 1D–1F, 1D–2F, 2D–4F, and 3D–6F boundary conditions are 4.0, 2.7, 2.2, and 2.2, respectively, indicating that under the same conditions, fractures have a greater effect on imbibition in the one-dimensional single-face opening model, while also enhancing imbibition rate to varying degrees for other boundary conditions.
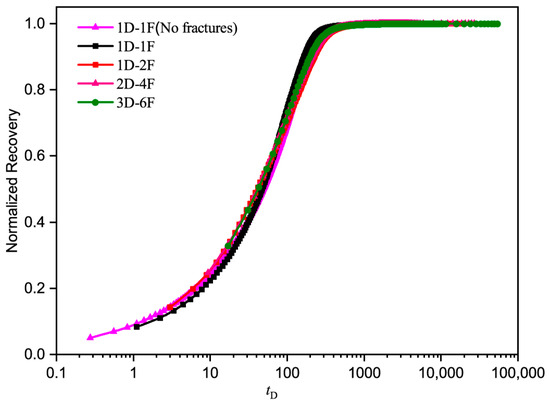
Figure 12.
Fitting results considering fracture imbibition under different boundary conditions.
Figure 13 shows the fitting scaling results for imbibition models with fractures of different lengths. It can be observed that using the modified shape factor allows for good scaling of the imbibition results for different fracture lengths onto a single curve. Among them, model C-1, where the microfractures within the matrix are vertical to the imbibition open face, has no impact on the imbibition process, with a fitting value of 1.00. For models C-2, C-3, and C-4, with fracture lengths of 0.5 cm, 1.0 cm, and 1.5 cm, the fitting values for the imbibition models are 0.70, 0.55, and 0.45, respectively. This indicates that under the same fracture density and distribution model conditions, longer fractures result in a greater hindrance to imbibition in the one-dimensional single-face opening model.
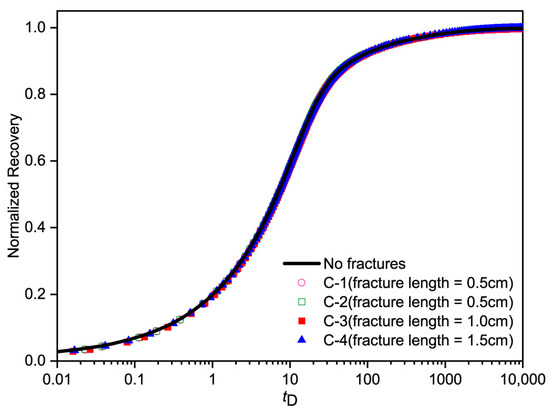
Figure 13.
Fit scaling results for imbibition models of fractures with different lengths.
4. Conclusions
Through numerical simulations of different fracture apertures, lengths, densities, and the relative positions of microfractures to the imbibition face, the imbibition behavior in the matrix with microscale fractures was clarified. The following conclusions and insights were drawn:
- (1)
- Microfractures can cause the spontaneous counter-current imbibition process to exhibit the following anisotropic characteristics: on the one hand, microfractures on the surface of the rock block that are in contact with water in the imbibition open face increase the imbibition rate of the matrix; on the other hand, microfractures parallel to the imbibition open face hinder the imbibition process.
- (2)
- The imbibition characteristics differ depending on the spatial relationship between the microfractures and the imbibition open face. When fractures are vertical to the rock block open face and in contact with water, they promote imbibition, and as the fracture aperture decreases, the imbibition rate initially increases and then decreases. When microfractures are parallel to the imbibition surface, they inhibit the imbibition process. Under the same volumetric fracture density, the longer the fracture length, the lower the imbibition rate. Similarly, under the same fracture length, a higher volumetric fracture density leads to a lower imbibition rate.
- (3)
- By multiplying the matrix rock imbibition shape factor by a coefficient considering the anisotropic imbibition of microfractures, an empirical shape factor representing the anisotropic imbibition effect of fractures can be obtained. This shape factor can be incorporated into the dual-porosity model to account for the influence of microfractures on spontaneous imbibition.
Building on this study, future work will focus on two key directions: (1) Advanced microfracture modeling: Incorporating geologically realistic, spatially complex microfracture distributions to validate and refine the shape factor for countercurrent imbibition in heterogeneous formations. (2) Experimental validation: Conducting controlled laboratory imbibition experiments to rigorously analyze how microfracture networks govern spontaneous imbibition dynamics across matrix blocks of varying scales. These efforts aim to bridge theoretical models with field applications for fractured reservoir management.
Author Contributions
Conceptualization, G.L. and Y.L.; methodology, G.L.; validation, G.L.; formal analysis, Y.B. and G.L.; investigation, M.F. and G.L.; resources, G.L., Y.B. and Y.L.; data curation, G.L.; writing—original draft preparation, G.L.; writing—review and editing, M.F., Y.B. and Y.L.; visualization, G.L.; supervision, Y.B.; project administration, Y.L. All authors have read and agreed to the published version of the manuscript.
Funding
This research received no external funding.
Data Availability Statement
The data are not publicly available due to the privacy restrictions of the company.
Conflicts of Interest
Authors Guanlin Li, Yuhu Bai and Maojun Fang were employed by the company CNOOC Research Institute Co., Ltd. The remaining author declares that the research was conducted in the absence of any commercial or financial relationships that could be construed as a potential conflict of interest.
References
- Morrow, N.R.; Mason, G. Recovery of oil by spontaneous imbibition. Curr. Opin. Colloid Interface Sci. 2001, 6, 321–337. [Google Scholar] [CrossRef]
- Mason, G.; Fischer, H.; Morrow, N.R.; Ruth, D.W. Correlation for the effect of fluid viscosities on counter-current spontaneous imbibition. J. Pet. Sci. Eng. 2010, 72, 195–205. [Google Scholar] [CrossRef]
- Standnes, D.C.; Andersen, P.Ø.; Papatzacos, P.; Skjæveland, S.M. Interpretation of 1-D Counter-Current Spontaneous Imbibition Processes Using Microscopic Diffusion Theory and a Modified Buckley–Leverett Approach. Energy Fuels 2020, 34, 5868–5883. [Google Scholar] [CrossRef]
- Standnes, D.C.; Andersen, P.Ø. Analysis of the impact of fluid viscosities on the rate of countercurrent spontaneous imbibition. Energy Fuels 2017, 31, 6928–6940. [Google Scholar] [CrossRef]
- Mason, G.; Morrow, N.R. Developments in spontaneous imbibition and possibilities for future work. J. Pet. Sci. Eng. 2013, 110, 268–293. [Google Scholar]
- Meng, Q.; Cai, J. Recent advances in spontaneous imbibition with different boundary conditions. Capillarity 2018, 1, 19–26. [Google Scholar] [CrossRef]
- Tian, W.; Wu, K.; Gao, Y.; Chen, Z.; Gao, Y.; Li, J. A critical review of enhanced oil recovery by imbibition: Theory and practice. Energy Fuels 2021, 35, 5643–5670. [Google Scholar] [CrossRef]
- Chun, L.; Qingxin, G.; Ronghu, Z.; Huiliang, Z. Characteristics and origin of microfracture in lower Cretaceous tight sandstone from Kuqa foreland basin, NW China. In Proceedings of the International Petroleum Technology Conference, Beijing, China, 26–28 March 2013. [Google Scholar]
- Anders, M.H.; Laubach, S.E.; Scholz, C.H. Microfractures: A review. J. Struct. Geol. 2014, 69, 377–394. [Google Scholar]
- Hooker, J.N.; Katz, R.F.; Laubach, S.E.; Cartwright, J.; Eichhubl, P.; Ukar, E.; Bloomfield, D.; Engelder, T. Fracture-pattern growth in the deep, chemically reactive subsurface. J. Struct. Geol. 2023, 173, 104915. [Google Scholar] [CrossRef]
- Kazemi, H.; Gilman, J.R.; Elsharkawy, A.M. Analytical and numerical solution of oil recovery from fractured reservoirs with empirical transfer functions. SPE Reserv. Eng. 1992, 7, 219–227. [Google Scholar] [CrossRef]
- Jafari, I.; Masihi, M.; Nasiri Zarandi, M. Numerical simulation of counter-current spontaneous imbibition in water-wet fractured porous media: Influences of water injection velocity, fracture aperture, and grains geometry. Phys. Fluids 2017, 29, 113305. [Google Scholar]
- Sedaghat, M.; Azizmohammadi, S.; Matthai, S.K. How fracture capillary pressure affects ensemble relative permeability of naturally fractured reservoirs. In Proceedings of the ECMOR XV-15th European Conference on the Mathematics of Oil Recovery, Amsterdam, The Netherlands, 29 August–1 September 2016. [Google Scholar]
- Cheng, C.L.; Perfect, E.; Donnelly, B.; Bilheux, H.Z.; Tremsin, A.S.; McKay, L.D.; Santodonato, L.J. Rapid imbibition of water in fractures within unsaturated sedimentary rock. Adv. Water Resour. 2015, 77, 82–89. [Google Scholar]
- Perfect, E.; Brabazon, J.W.; Gates, C.H. Forward prediction of early-time spontaneous imbibition of water in unsaturated rock fractures. Vadose Zone J. 2020, 19, e20056. [Google Scholar]
- Horodecky, B.B.; Perfect, E.; Bilheux, H.Z.; Brabazon, J.W.; Gates, C.H. Onset dynamics of air-water menisci on rock fracture surfaces. Adv. Water Resour. 2020, 146, 103754. [Google Scholar]
- Yuan, X.; Yao, Y.; Liu, D.; Pan, Z. Spontaneous imbibition in coal: Experimental and model analysis. J. Nat. Gas Sci. Eng. 2019, 67, 108–121. [Google Scholar]
- Brabazon, J.W.; Perfect, E.; Gates, C.H.; Bilheux, H.Z.; Tyner, J.S.; McKay, L.D.; Horodecky, B.B. Rock fracture sorptivity as related to aperture width and surface roughness. Vadose Zone J. 2019, 18, 1–10. [Google Scholar] [CrossRef]
- Liu, Y.; Cai, J.; Sahimi, M.; Qin, C. A study of the role of microfractures in counter-current spontaneous imbibition by lattice Boltzmann simulation. Transp. Porous Media 2020, 133, 313–332. [Google Scholar] [CrossRef]
- Li, G.; Liu, Y.; Cheng, Z.; Xue, L.; Kong, X. The Effect of Fracture Aperture on Fracturing Fluid Imbibition into Gas-Saturated Rocks. In Proceedings of the ARMA US Rock Mechanics/Geomechanics Symposium, Santa Fe, NM, USA, 26–29 June 2022. [Google Scholar]
- Wilson, R.; Rodríguez, F. Network modeling of drainage and imbibition in microfractured porous media. In Proceedings of the SPE Annual Technical Conference and Exhibition, Dallas, TX, USA, 9–12 October 2005. [Google Scholar]
- Li, G.; Liu, Y.; Mi, L.; Song, L.; Cheng, Z.; Qian, Q.; Pei, X. Time-dependent shape factor for scaling of multi-dimensional counter-current imbibition with different boundary conditions. J. Pet. Sci. Eng. 2022, 217, 110880. [Google Scholar]
- Dejam, M.; Hassanzadeh, H.; Chen, Z. Reinfiltration through liquid bridges formed between two matrix blocks in fractured rocks. J. Hydrol. 2014, 519, 3520–3530. [Google Scholar]
- Miri, R.; Shadizadeh, S.R.; Kharrat, R. Fracture capillary pressure based on the liquid bridge dynamic stability study. Energy Sources Part A-Recovery Util. Environ. Eff. 2014, 36, 2536–2545. [Google Scholar]
- Harimi, B.; Masihi, M.; Ghazanfari, M.H. An insight into the formation of liquid bridge and its role on fracture capillary pressure during gravity drainage in fractured porous media. Can. J. Chem. Eng. 2021, 99, S212–S231. [Google Scholar]
- Ma, S.; Morrow, N.R.; Zhang, X. Generalized scaling of spontaneous imbibition data for strongly water-wet systems. J. Pet. Sci. Eng. 1997, 18, 165–178. [Google Scholar]
Disclaimer/Publisher’s Note: The statements, opinions and data contained in all publications are solely those of the individual author(s) and contributor(s) and not of MDPI and/or the editor(s). MDPI and/or the editor(s) disclaim responsibility for any injury to people or property resulting from any ideas, methods, instructions or products referred to in the content. |
© 2025 by the authors. Licensee MDPI, Basel, Switzerland. This article is an open access article distributed under the terms and conditions of the Creative Commons Attribution (CC BY) license (https://creativecommons.org/licenses/by/4.0/).