
Comprehensive Assessment of Paleogene Hydrocarbon Source Rocks in the Hydrocarbon-Rich Sub-Sag of the Zhu-1 Depression

Abstract
1. Introduction
2. Geological Background
3. Samples and Methods
3.1. Rock–Eval Pyrolysis
3.2. Analysis of Major and Trace Elements
3.3. Al Normalization
3.4. Infrared Spectrum and Microscopic Components
4. Results
4.1. Geochemical Characteristics of Source Rocks
4.2. Major Elements
4.3. Trace Elements
4.4. Infrared Spectrum
4.5. Microcomponents
5. Discussion
5.1. Paleoenvironment
5.1.1. Paleoclimate
5.1.2. Paleo-Salinity
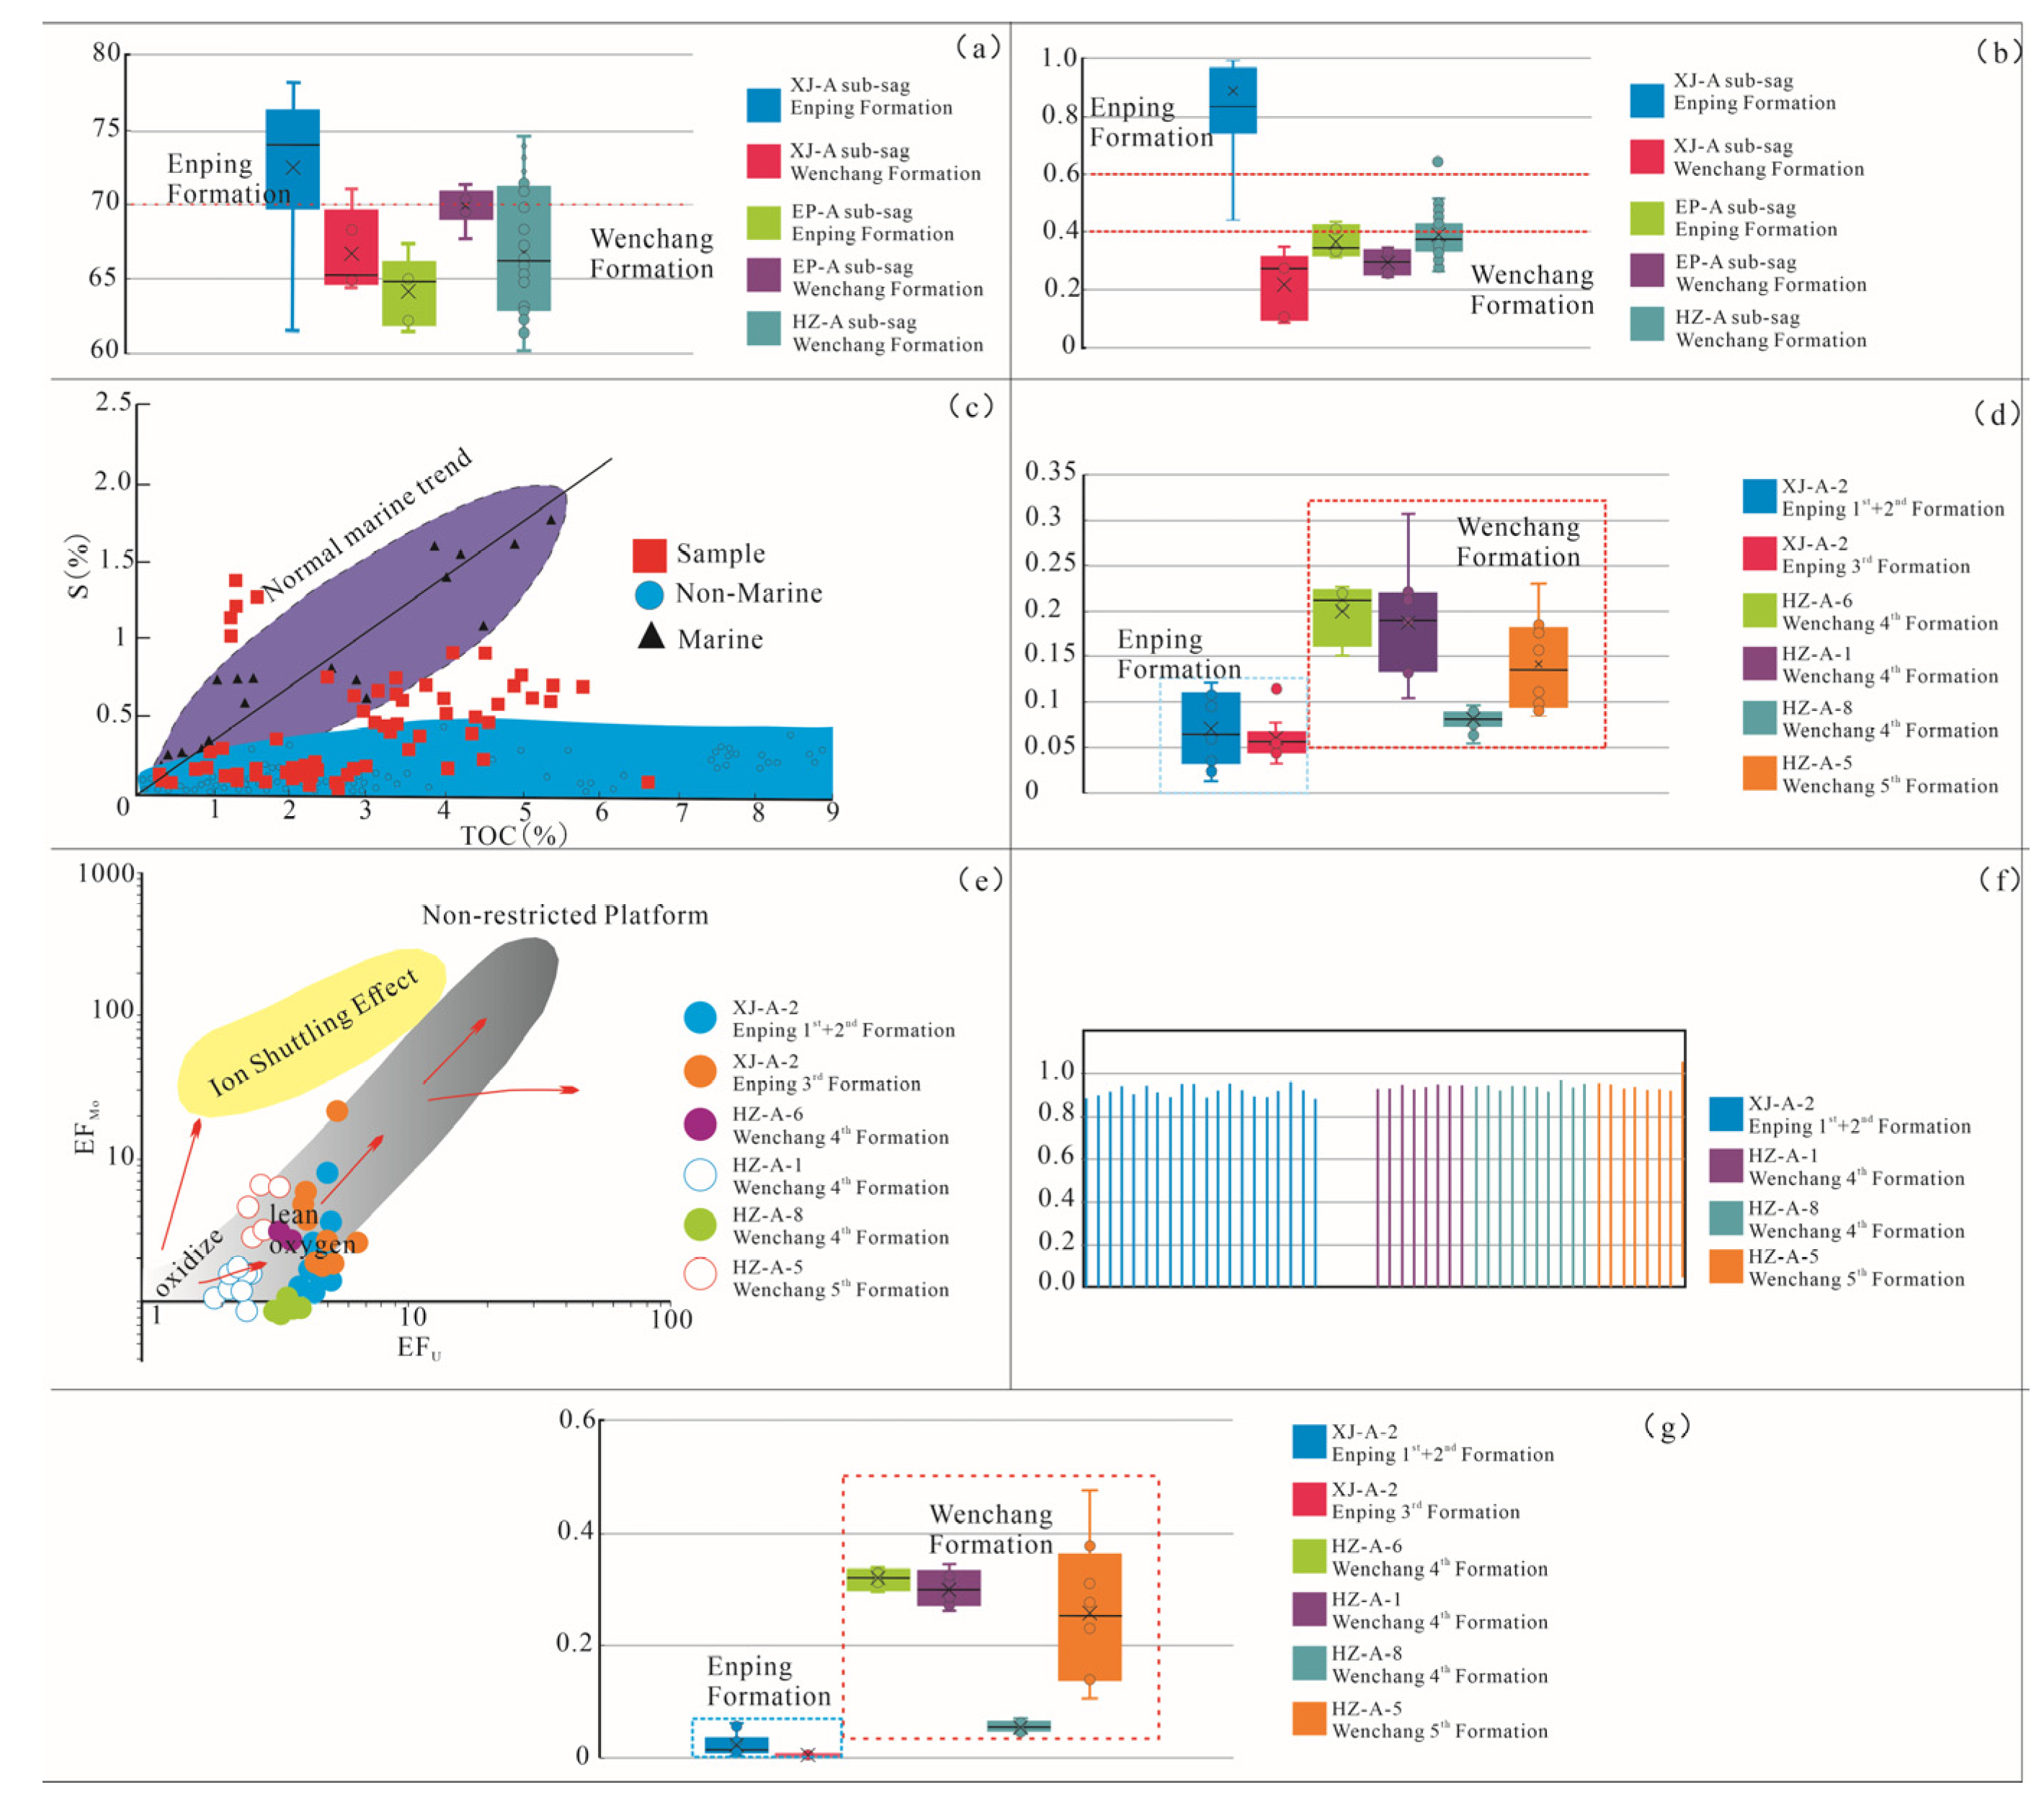
5.1.3. Paleo-Redox
5.1.4. Paleo-Productivity
5.2. Organic Matter Enrichment Conditions
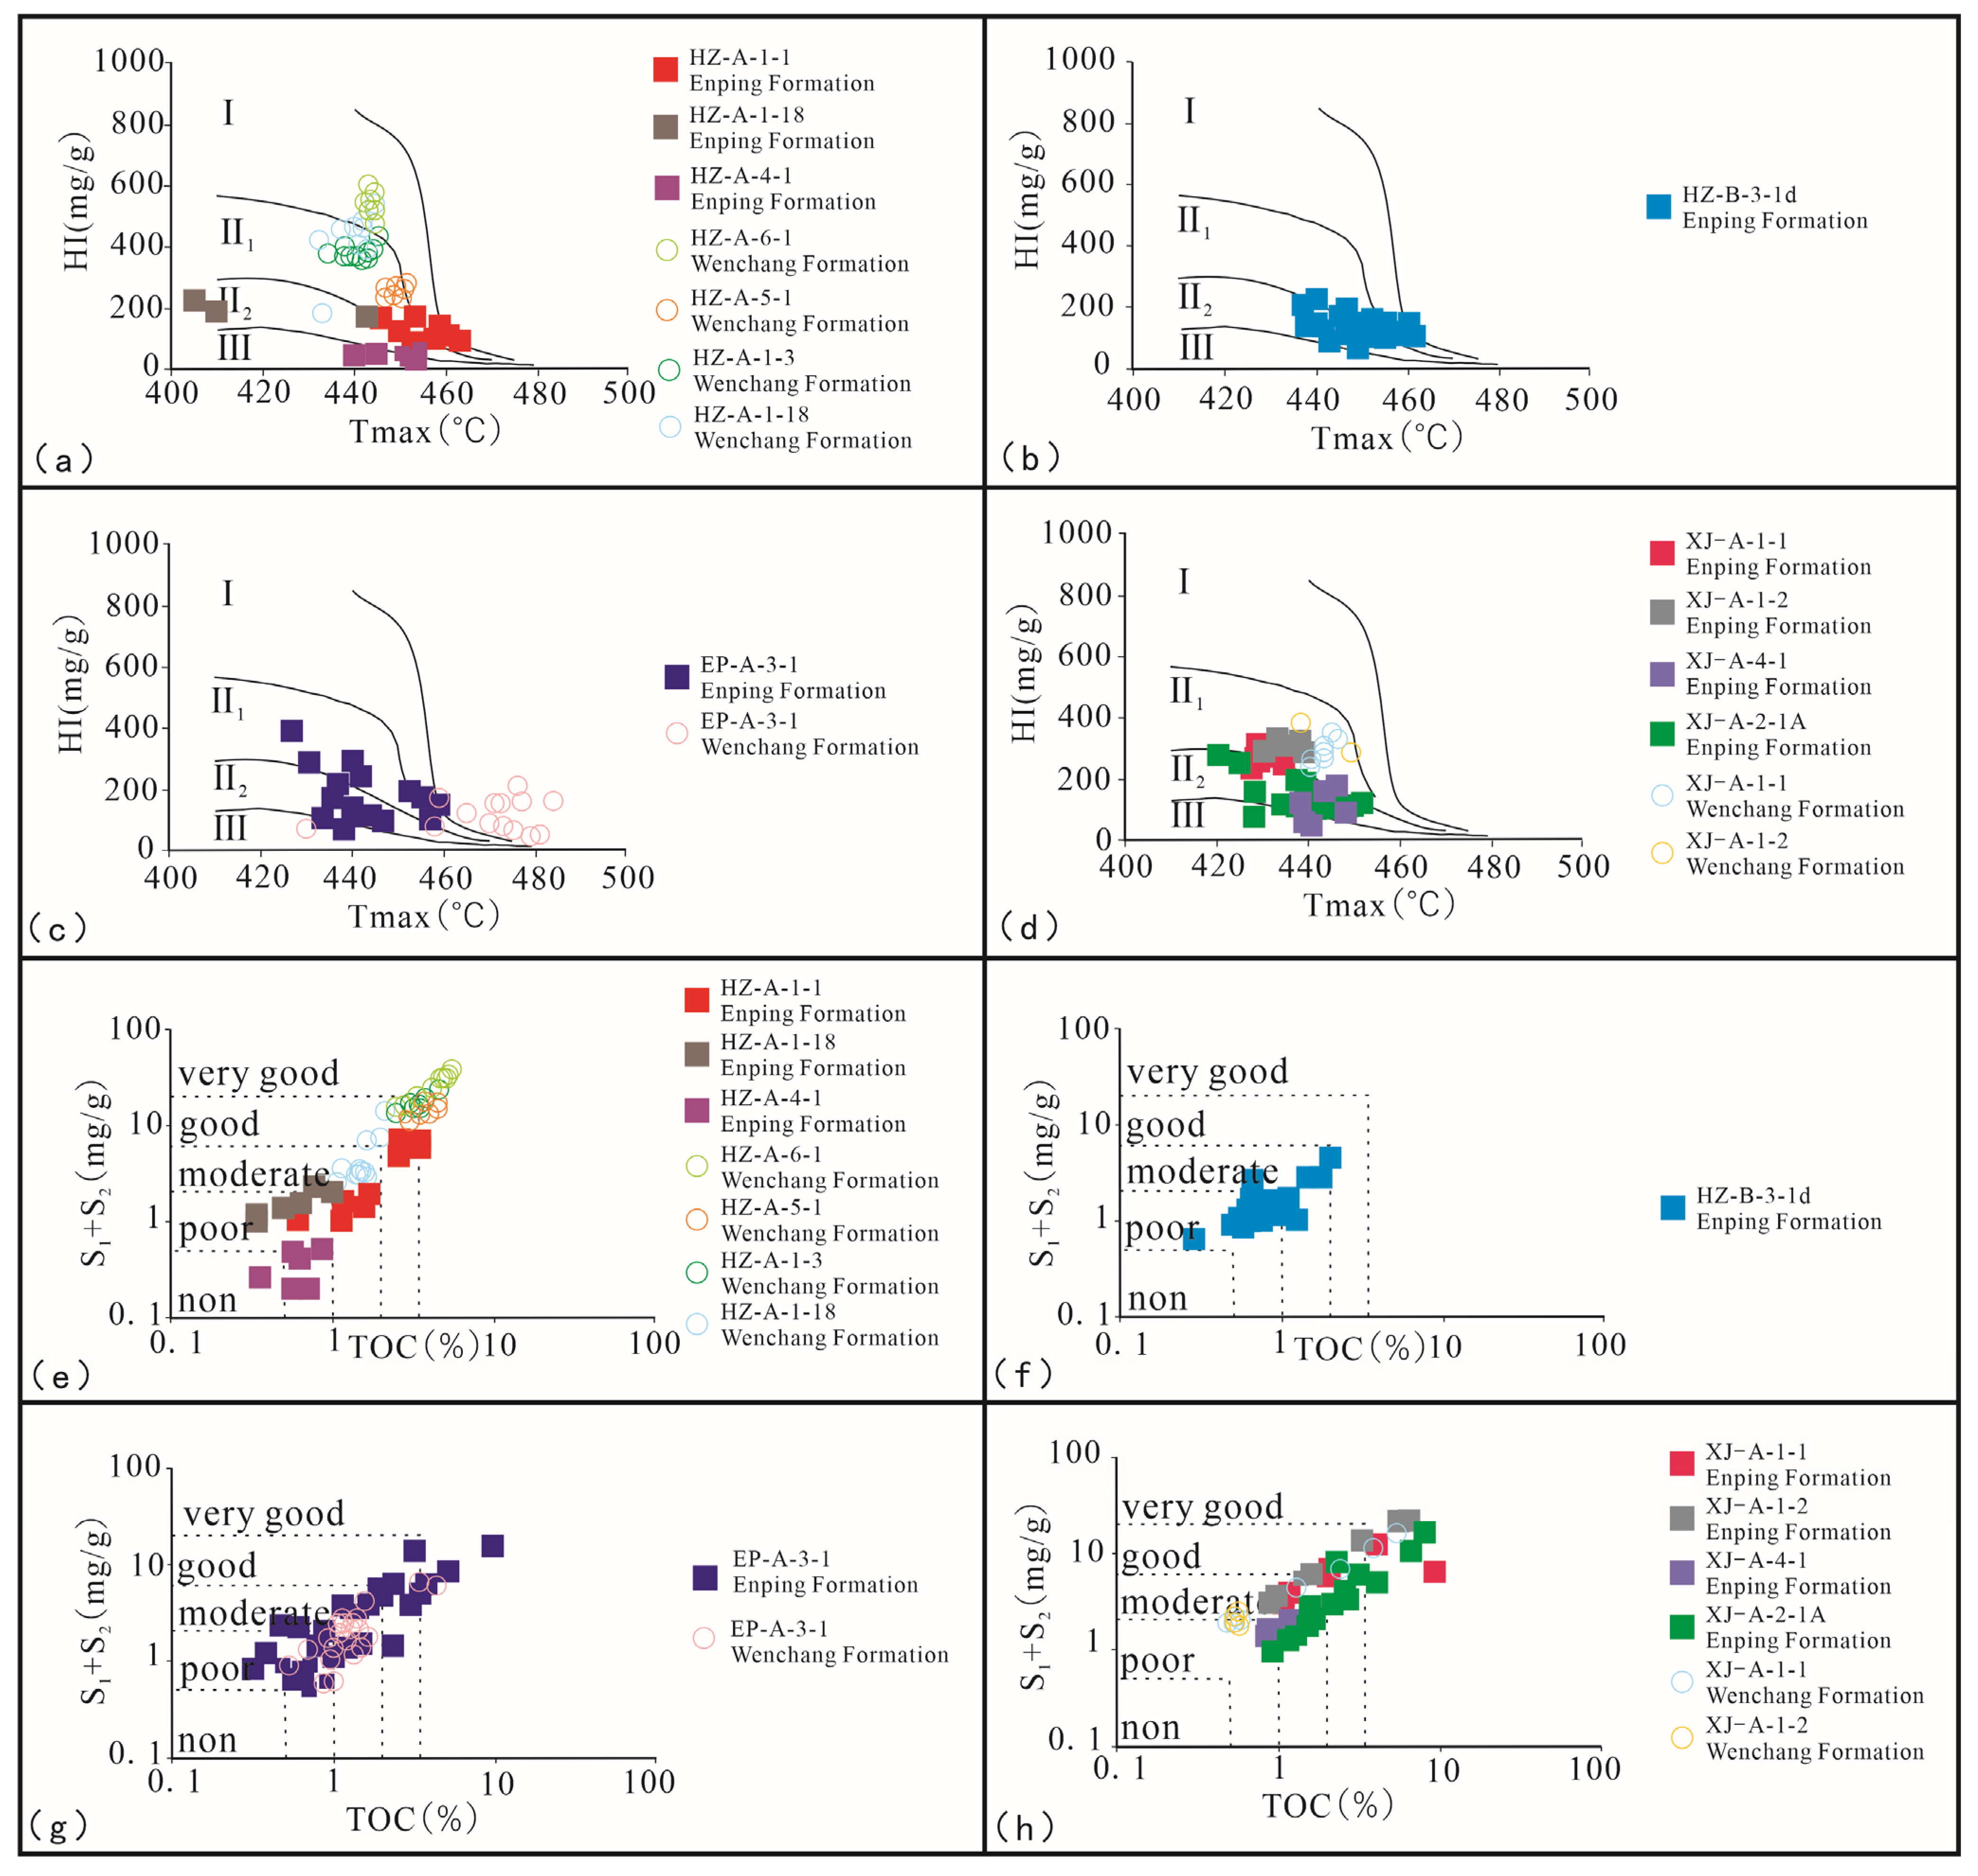
5.3. Composition of Kerogen
5.4. Summary
6. Conclusions
- (1)
- The Wenchang Formation’s hydrocarbon source rocks, characterized by semi-deep lacustrine facies, boast a high abundance of organic matter, predominantly type II1, with excellent to very good quality. These rocks constitute the primary hydrocarbon source for the early oil and late gas phases in the lacustrine facies of the Zhu-1 Depression. Conversely, the hydrocarbon source rocks of the Enping Formation, characterized by limnetic facies, predominantly consist of type II2-III organic matter with varying qualities ranging from poor to medium. Nevertheless, they remain significant contributors to both oil and gas reserves in the region.
- (2)
- Over the transition from the Wenchang to the Enping period, the climate shifted from warm and arid to cool and humid. The prevailing climate trended towards a freshwater environment with weakly oxidizing to weakly reducing conditions, resulting in a gradual decrease in paleo-productivity.
- (3)
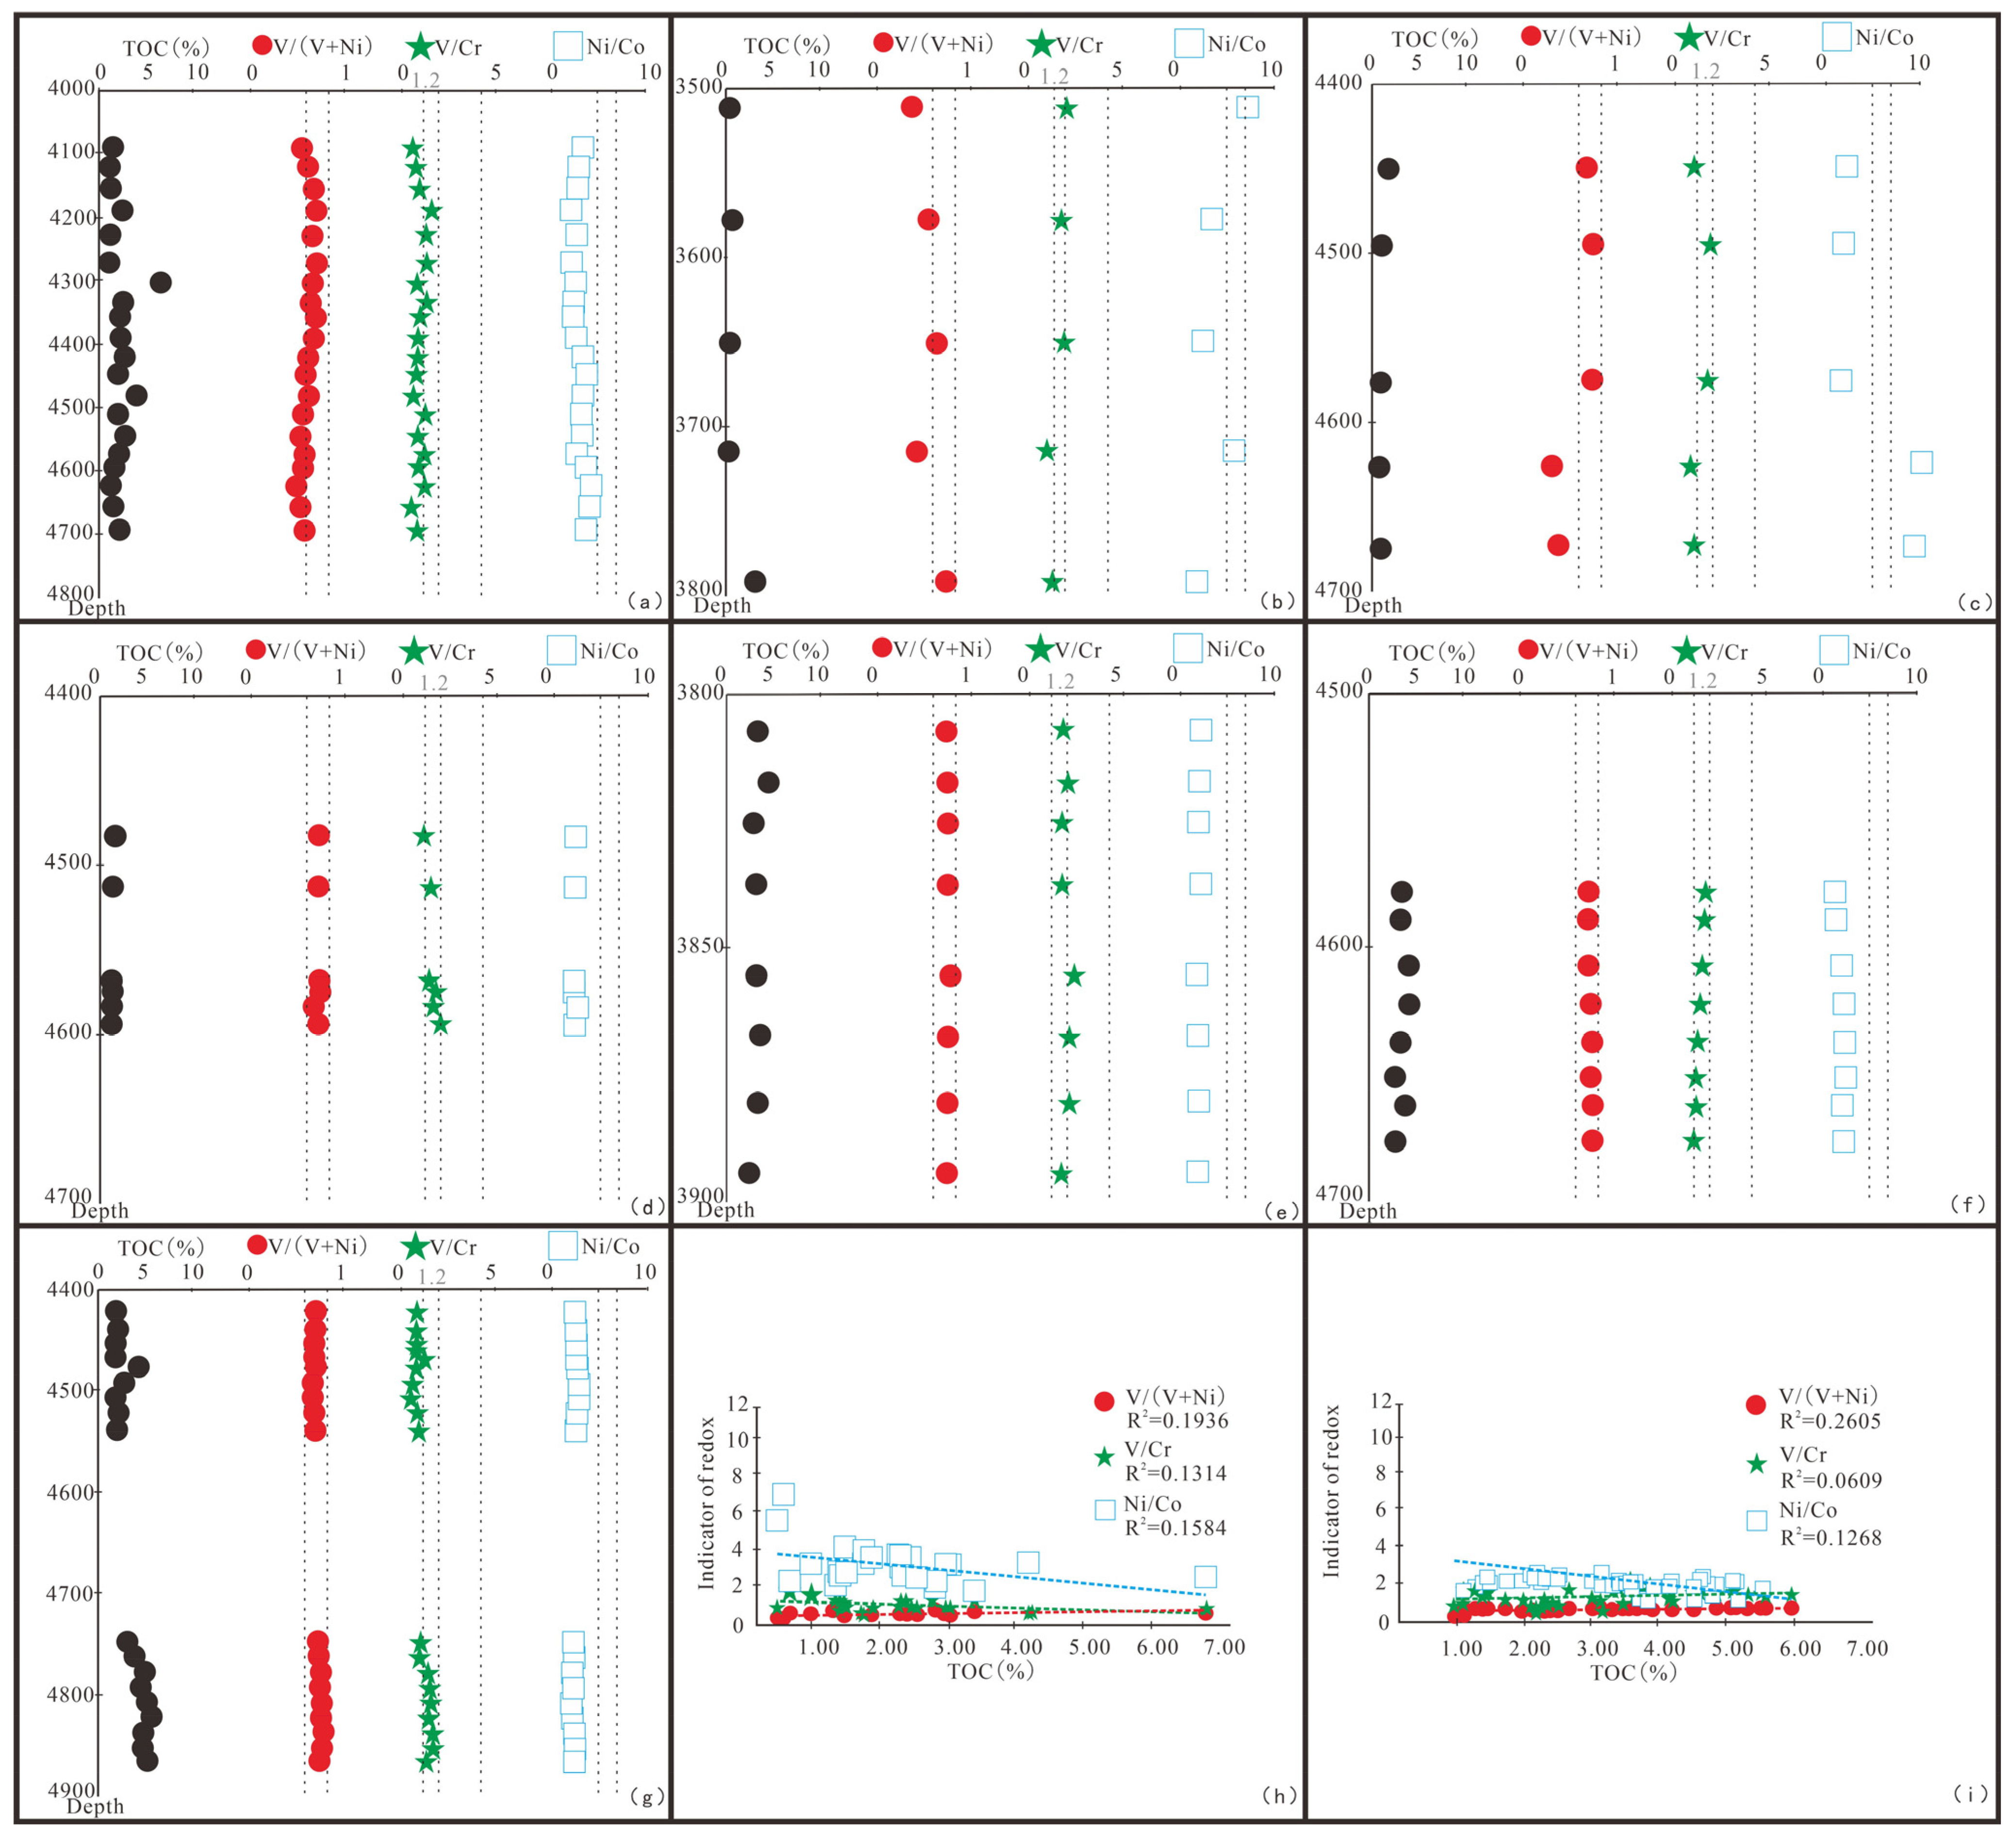
- The enrichment of organic matter in the hydrocarbon source rocks of the Enping and Wenchang Formations within the Zhu-1 Depression was largely controlled by paleo-oxygenation facies. The ratio of V/(V + Ni) to V/Cr serves as a reliable indicator of the water’s redox environment, exhibiting a strong correlation with Total Organic Carbon (TOC) levels.
- (4)
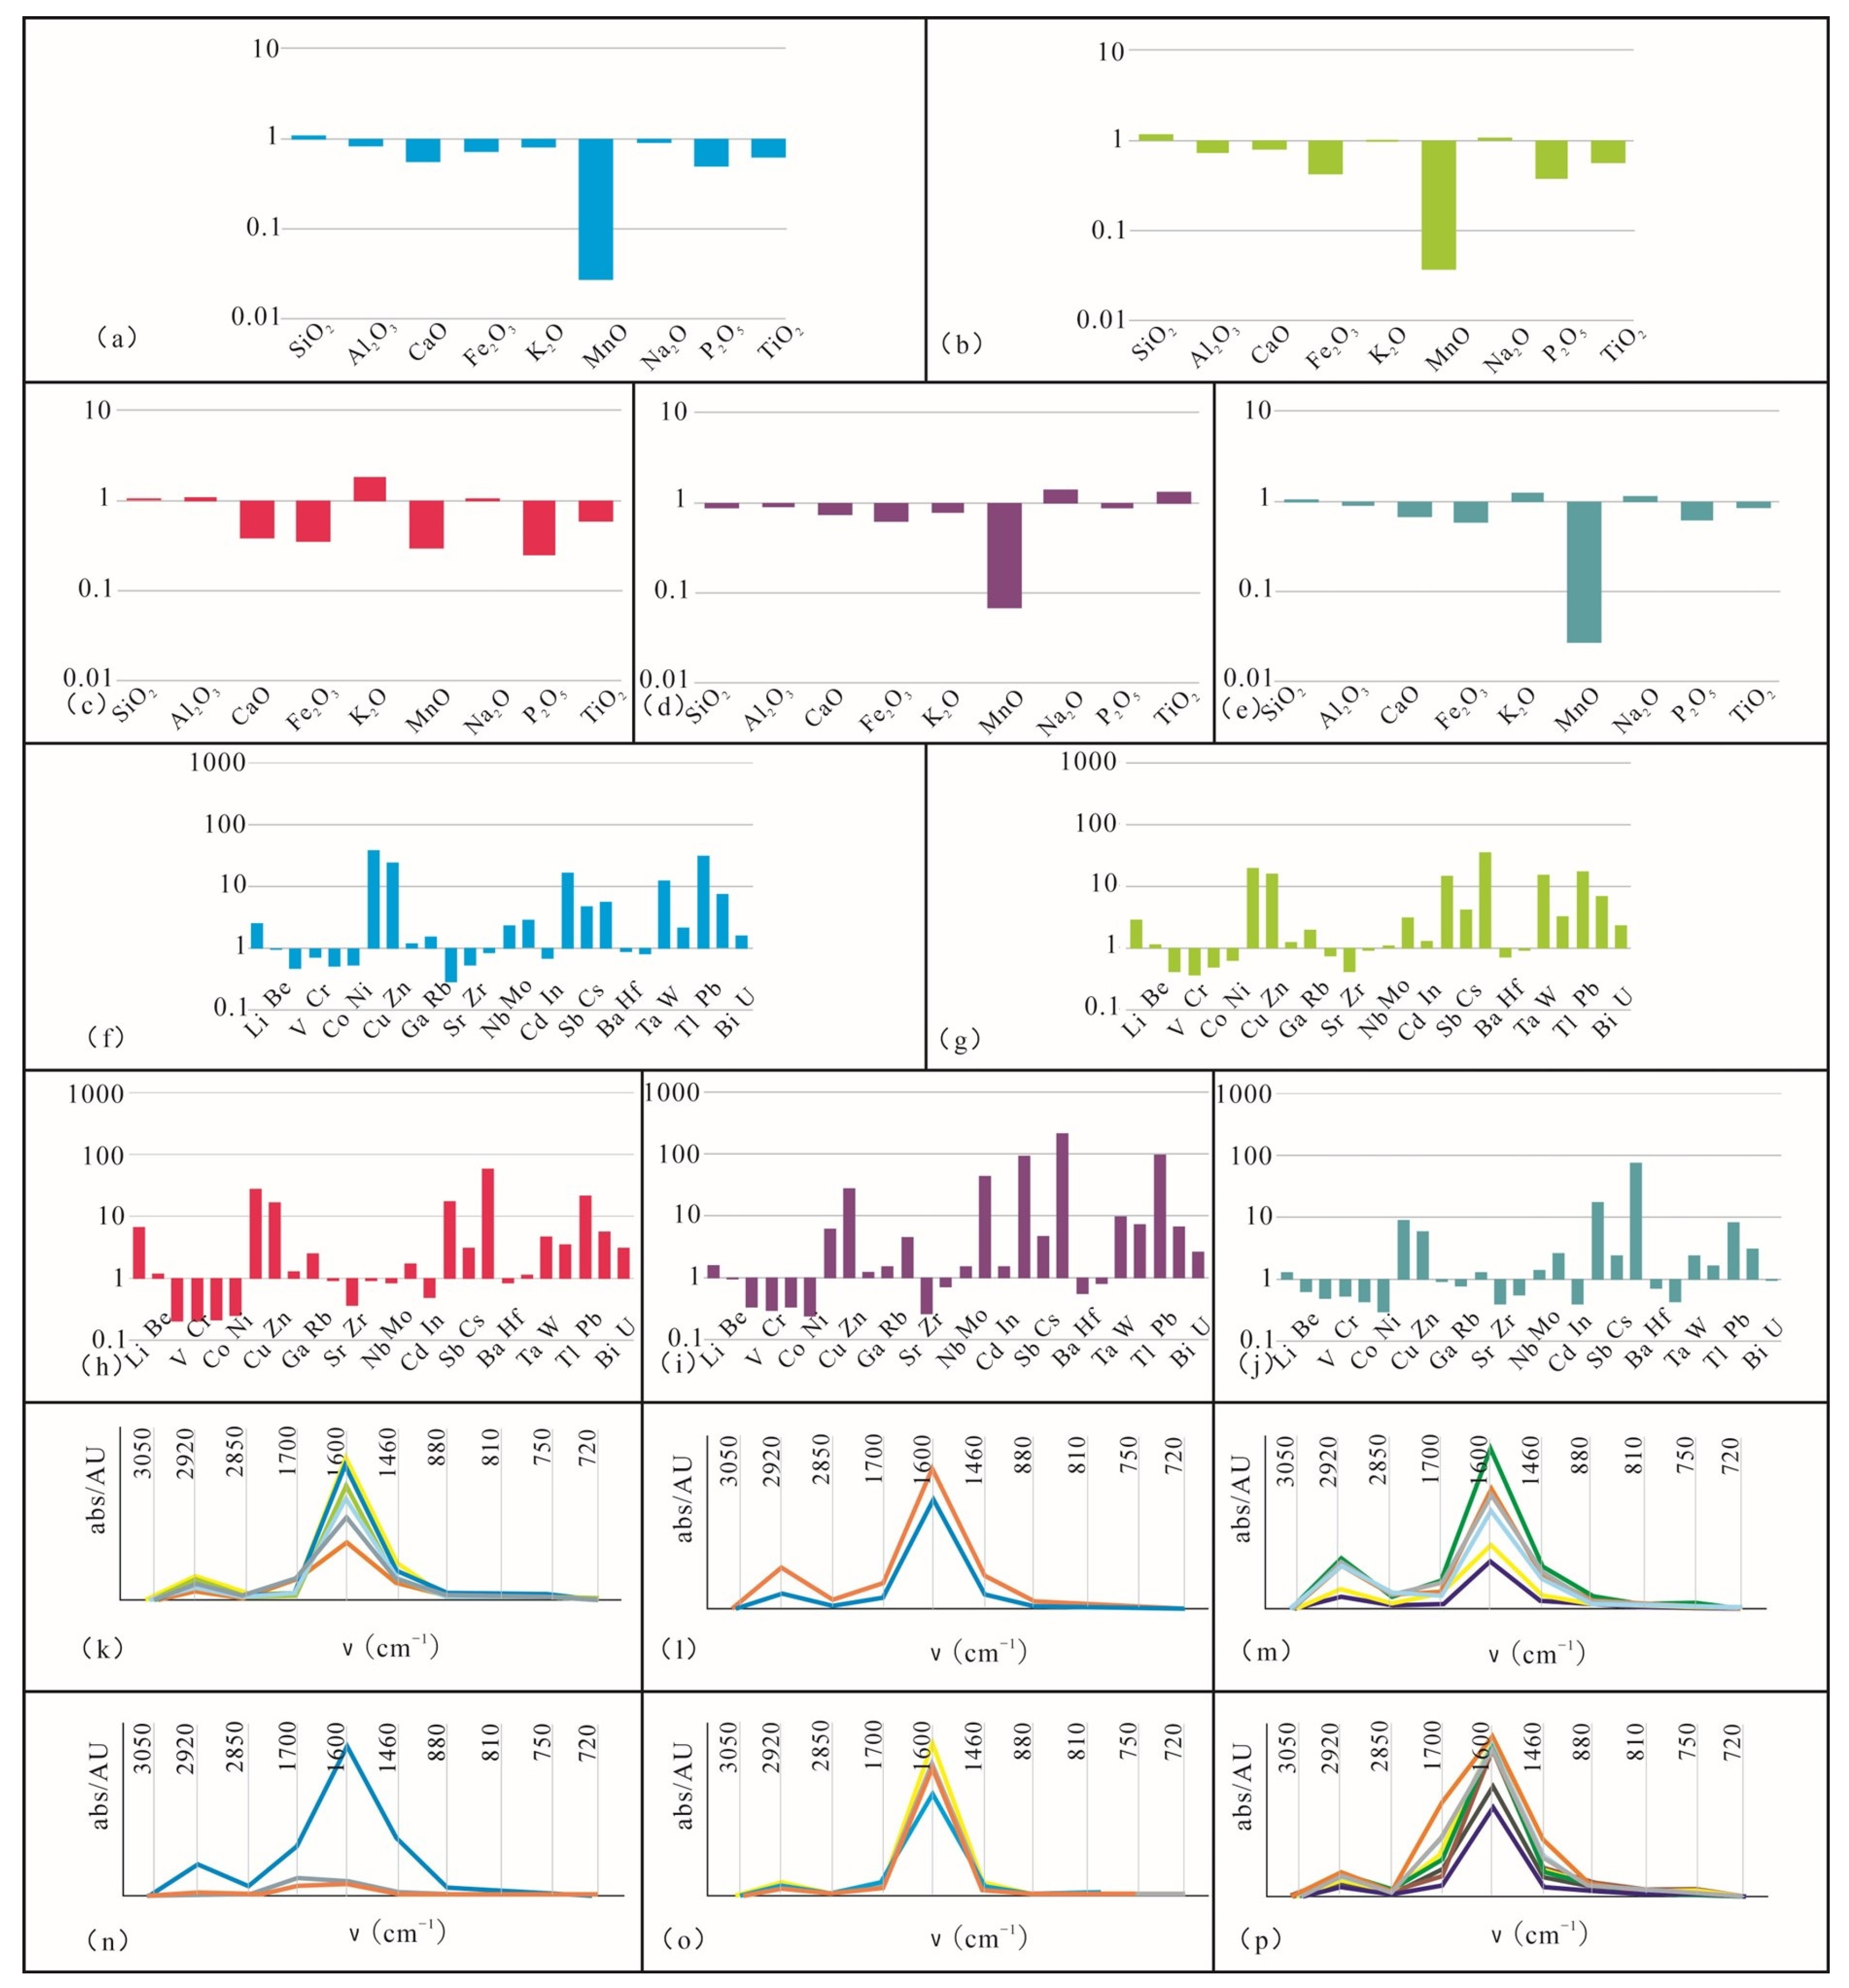
- In comparison to the hydrocarbon source rocks of the limnetic facies found in the Enping Formation, those from the semi-deep lacustrine facies in the Wenchang Formation exhibit a higher hydrocarbon-yielding aliphatic structure. Conversely, the aromatic hydrocarbon structure, with lower hydrocarbon potential, is less prominent in the Wenchang Formation compared to the Enping Formation.
- (5)
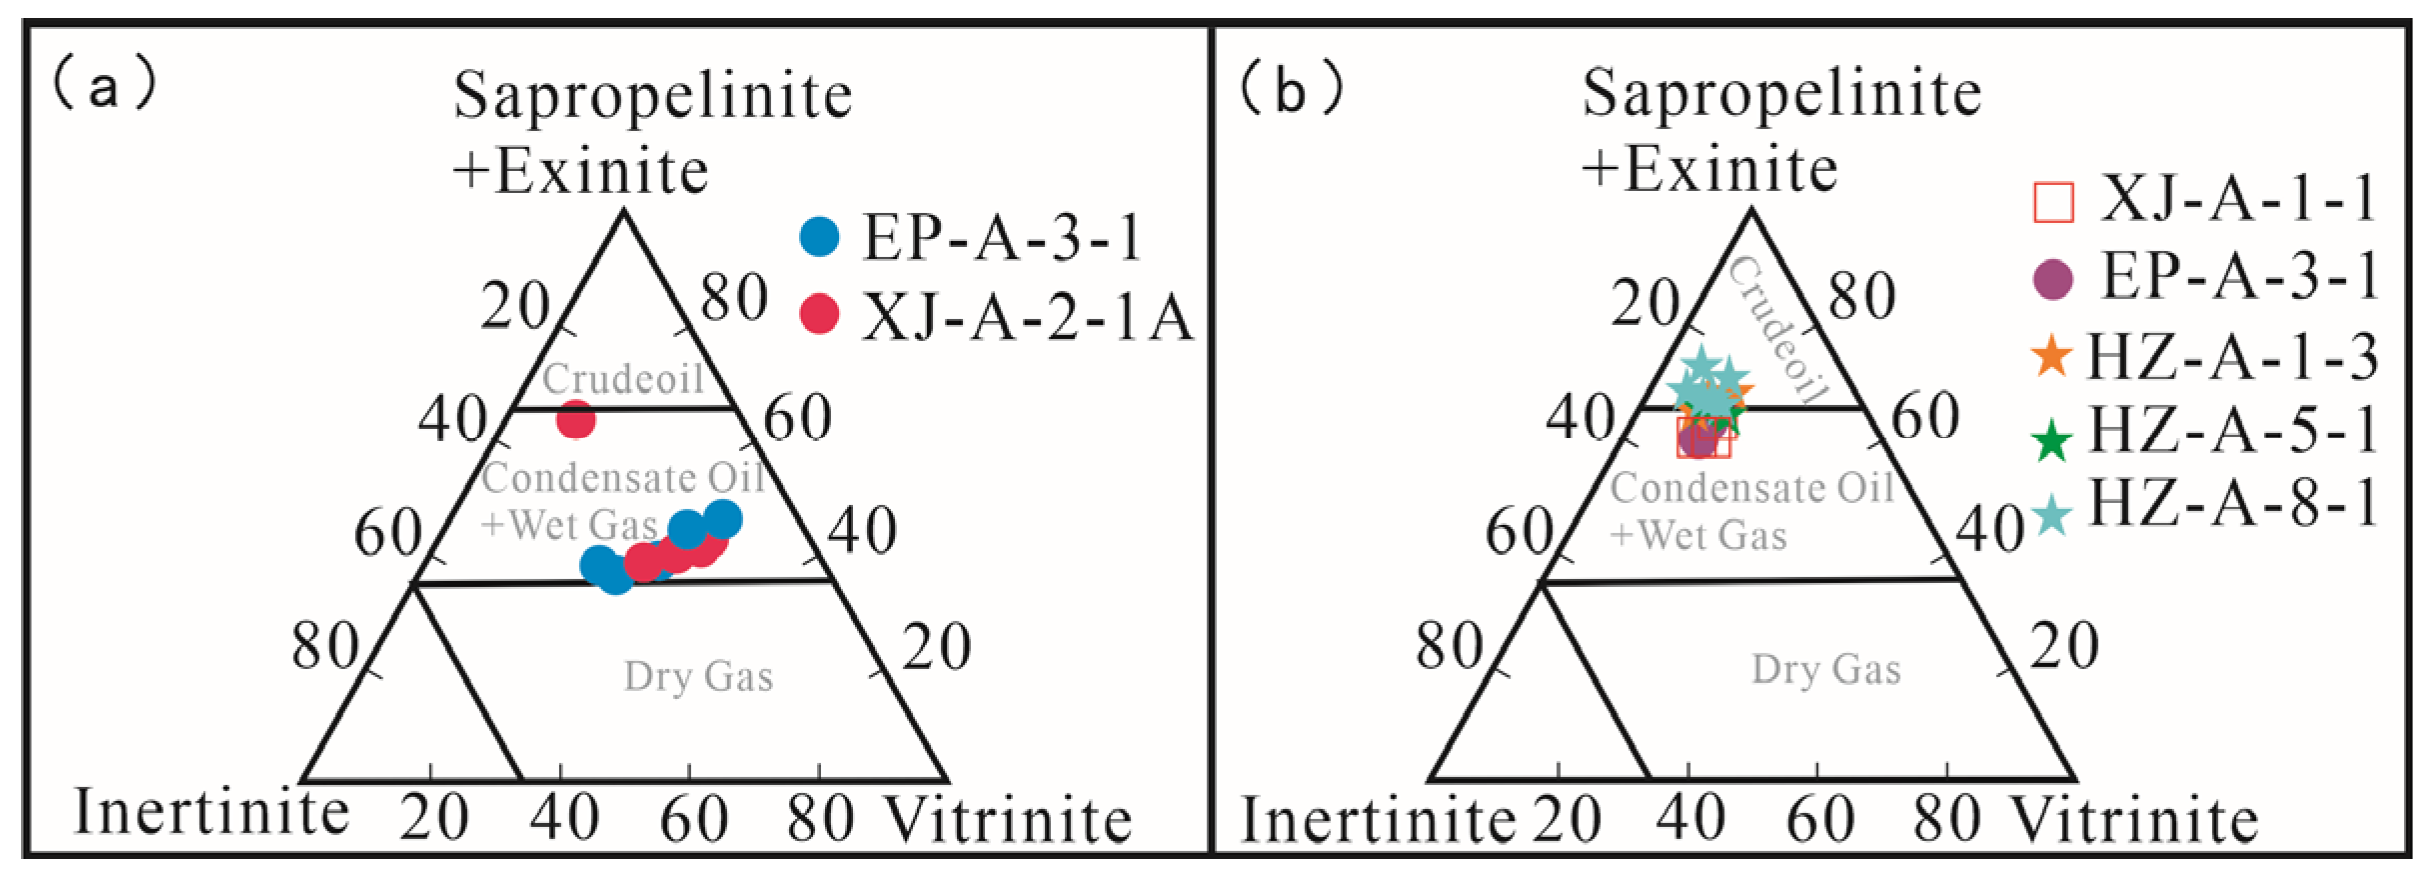
- Source rocks from the Wenchang Formation’s semi-deep lacustrine facies display a higher content of sapropel group + exinite group, indicating superior hydrocarbon generation potential. Conversely, the source rocks of the limnetic facies within the Enping Formation demonstrate a lower content of sapropelite + exinite with considerable variation, suggesting an average oil and gas generation potential.
Author Contributions
Funding
Data Availability Statement
Conflicts of Interest
References
- Kelts, K. Environments of Deposition of Lacustrine Petroleum Source Rocks: An Introduction. Geol. Soc. Lond. Spec. Publ. 1988, 40, 3–26. [Google Scholar] [CrossRef]
- Wei, H.; Chen, D.; Wang, J.; Yu, H.; Tucker, M.E. Organic accumulation in the lower Chihsia Formation (Middle Permian) of South China: Constraints from pyrite morphology and multiple geochemical proxies. Palaeogeogr. Palaeoclimatol. Palaeoecol. 2012, 353–355, 73–86. [Google Scholar] [CrossRef]
- Rimmer, S.M.; Thompson, J.A.; Goodnight, S.A.; Robl, T.L. Multiple controls on the preservation of organic matter in Devonian-Mississippian marine black shales: Geochemical and petrographic evidence. Palaeogeogr. Palaeoclimatol. Palaeoecol. 2004, 215, 125–154. [Google Scholar] [CrossRef]
- Ingall, E.D.; Cappellen, P.V. Relation between sedimentation rate and burial of organic phosphorus and organic carbon in marine sediments. Geochim. Cosmochim. Acta 1990, 54, 373–386. [Google Scholar] [CrossRef]
- Huang, B.; Xiao, X.; Zhang, M. Geochemistry, grouping and origins of crude oils in the Western Pearl River Mouth Basin, offshore South China Sea. Org. Geochem. 2003, 34, 993–1008. [Google Scholar] [CrossRef]
- Ye, Q. The Late Mesozoic Structure Systems in the Northern South China Sea Margin: Geodynamics and Their Influence on the Cenozoic Structures in the Pearl River Mouth Basin. Ph.D. Thesis, China University of Geosciences, Wuhan, China, 2019. [Google Scholar]
- Liu, H. Rift Style Controlled by Basement Attribute and Regional Stress in Zhu I Depression, Pearl River Mouth Basin. Ph.D. Thesis, China University of Geosciences, Wuhan, China, 2018. [Google Scholar]
- Liu, P.; Zhang, X.; Du, J.; Chen, W.; Tao, W.; Tao, Y. Techonic-Thermal Evolution Process and the Petroleum Geological Significance of Relatively Low Geothermal Gradient in a Rift Basin: An Example from Xijiang Main Sag in Pearl River Mouth Basin. Geol. Sci. Technol. Inf. 2018, 37, 149–156. [Google Scholar] [CrossRef]
- Mi, L.; Zhang, X.; Pang, X.; Zheng, J.; Zhang, L. Formation mechanism and petroleum geology of Pearl River Mouth basin. Acta Pet. Sin. 2019, 40 (Suppl. S1), 1–10. [Google Scholar] [CrossRef]
- Deng, P. The Nature and Tectonic Transition of the Multiphase Rifting in the Northern Margin of the South China Sea: Based on the Study of the Zhu I Depression in Pearl River Mouth Basin. Ph.D. Thesis, China University of Geosciences, Wuhan, China, 2018. [Google Scholar]
- Wu, J. Enrichment Regularity of Zhu I Depression, Pearl River Mouth Basin. Ph.D. Thesis, China University of Geosciences, Wuhan, China, 2013. [Google Scholar]
- Bao, J.; Chen, C.; Zhu, C. Novel C15 sesquiterpanes and their origin in different crude oils from the Pearl River Mouth Basin of China. Sci. China Earth Sci. 2016, 59, 1622–1632. [Google Scholar] [CrossRef]
- Fu, N.; Zhu, L. Research on Mixed Oil in Western Huizhou Sag of Zhu I Depression. China Pet. Explor. 2007, 2, 20–26+83. [Google Scholar]
- Zhu, Y.; Xie, J.; Sun, L.; Hao, F.; Zhu, J. Identification and geochemical significances of novel bicyclic and tetracyclic terpanes in crude oils from the Pearl River Mouth Basin. Geochimica 2015, 44, 313–322. [Google Scholar] [CrossRef]
- Zhu, J.; Shi, H.; Yu, S.; Du, J.; Luo, J. Heating and Pressing simulation Experiments of Typical source rocks of Zhu I Depression--Discussion of modes of Hydrocarbon Generation and Expellation and TOC Recovery Coefficients. Nat. Gas Geosci. 2006, 4, 573–578. [Google Scholar]
- Shi, H.; Zhu, J.; Jiang, Z.; Yu, S.; Xie, T.; Wu, J. Hydrocarbon resources reassessment in Zhu I Depression, Pearl River Mouth Basin. China Offshore Oil Gas 2009, 21, 9–14. [Google Scholar]
- GB/T 19145-2003; Determination of Total Organic Carbon in Sedimentary Rock. Standards Press of China: Beijing, China, 2003.
- GB/T 18602-2012; Rock Pyrolysis Analysis. Standards Press of China: Beijing, China, 2012.
- GB/T 14506.14-2010; Methods for Chemical Analysis of Silicate Rocks—Part 14: Determination of Ferrous Oxide Content. Standards Press of China: Beijing, China, 2010.
- GB/T 14506.30-2010; Methods for Chemical Analysis of Silicate Rocks—Part 30: Determination of 44 Elements. Standards Press of China: Beijing, China, 2010.
- Arthur, M.A.; Jenkyns, H.C.; Brumsack, H.J.; Schlanger, S.O. Stratigraphy, geochemistry, and paleoceanography of organic-carbon rich Cretaceous sequences. In Cretaceous Research, Events and Rhythms; Ginsburg, R.N., Beaudoin, B., Eds.; Kluwer Academic: Norwell, MA, USA, 1990; pp. 75–119. [Google Scholar] [CrossRef]
- Morford, J.L.; Russell, A.D.; Emerson, S. Trace metal evidence for changes in the redox environment associated with the transition from terrigenous clay to diatomaceous sediment, Saanich Inlet, BC. Mar. Geol. 2001, 174, 355–369. [Google Scholar] [CrossRef]
- Algeo, T.J.; Maynard, J. Trace-element behavior and redox facies in core shales of Upper Pennsylvanian Kansas-type cyclothems. Chem. Geol. 2003, 206, 289–318. [Google Scholar] [CrossRef]
- Taylor, S.R.; McLennan, S.M. The Continental Crust: Its Composition and Evolution; Blackwell Scientific Publication: Oxford, UK, 1985. [Google Scholar]
- Algeo, T.J.; Tribovillard, N. Environmental analysis of paleoceanographic systems based on molybdenum-uranium covariation. Chem. Geol. 2009, 268, 211–225. [Google Scholar] [CrossRef]
- Peters, K.E. Guidelines for evaluating petroleum source rock using programmed pyrolysis. AAPG 1986, 70, 318–329. [Google Scholar] [CrossRef]
- Zhu, M.; Zhang, X.; Huang, Y.; Zhu, J.; Long, Z.; Shi, Y.; Shi, C.; Zhang, X. Source rock characteristics and resource potential in Pearl River Mouth Basin. Acta Pet. Sin. 2019, 40, 53–68. [Google Scholar] [CrossRef]
- Tissot, B.P.; Welte, D.H. Petroleum Formation and Occurrence, 2nd ed.; Springer: Berlin/Heidelberg, Germany; New York, NY, USA; Tokyo, Japan, 1984. [Google Scholar]
- Qin, J. Hydrocarbon Source Rocks in China; Science Press: Beijing, China, 2005. [Google Scholar]
- Ruan, J.; Bai, W. Analysis and Application of Infra-rad Spectra for Kerogen. Exp. Pet. Geol. 1988, 1, 80–86. [Google Scholar]
- Teichmüller, M. Organic petrology of source rocks, history and state of the art. Org. Geochem. 1986, 10, 581–599. [Google Scholar] [CrossRef]
- Fedo, C.M.; Nesbitt, H.W.; Young, G.M. Unraveling the effects of potassium metasomatism in sedimentary rocks and paleosols, with implications for paleoweathering conditions and provenance. Geology 1995, 23, 921–924. [Google Scholar] [CrossRef]
- Xie, Y.; Wu, F.; Fang, X. A major environmental shift by the middle Eocene in southern China: Evidence from palynological records. Rev. Palaeobot. Palynol. 2020, 278, 104226. [Google Scholar] [CrossRef]
- Zheng, R.; Liu, M. Study on Palaeosalinity of Chang-6 Oil Reservoir set in Ordos Basin. Oil Gas Geol. 1999, 1, 22–27. [Google Scholar]
- Berner, R.A.; Raiswell, R. C/S method for distinguishing freshwater from marine sedimentary rocks. Geology 1984, 12, 365–368. [Google Scholar] [CrossRef]
- Chen, J.; Zhao, L.; Algeo, T.J.; Zhou, L.; Zhang, L.; Qiu, H. Evaluation of paleomarine redox conditions using Mo-isotope data in low-[Mo] sediments: A case study from the lower Triassic of South China. Palaeogeogr. Palaeoclimatol. Palaeoecol. 2019, 519, 178–193. [Google Scholar] [CrossRef]
- Zhai, L.; Wu, C.; Ye, Y.; Zhang, S.; An, Z. Marine redox variations during the Ediacaran–Cambrian transition on the Yangtze Platform, South China. Geol. J. 2018, 53, 58–79. [Google Scholar] [CrossRef]
- Bertine, K.K.; Turekian, K.K. Molybdenum in marine deposits. Geochim. Cosmochim. Acta 1973, 37, 1415–1434. [Google Scholar] [CrossRef]
- Kashiwabara, T.; Takahashi, Y.; Tanimizu, M. A XAFS study on the mechanism of isotopic fractionation of molybdenum during its adsorption on ferromanganese oxides. Geochem. J. 2011, 43, 31–36. [Google Scholar] [CrossRef]
- Zheng, Y.; Anderson, R.F.; Geen, A.V.; Fleisher, M.Q. Remobilization of authigenic uranium in marine sediments by bioturbation. Geochim. Cosmochim. Acta 2002, 66, 1759–1772. [Google Scholar] [CrossRef]
- Helz, G.R.; Miller, C.V.; Charnock, J.M.; Mosselmans, J.F.W.; Pattrick, R.A.D.; Garner, C.D.; Vaughan, D.J. Mechanism of molybdenum removal from the sea and its concentration in black shales: EXAFS evidence. Geochim. Cosmochim. Acta 1996, 60, 3631–3642. [Google Scholar] [CrossRef]
- Tribovillard, N.; Averbuch, O.; Devleeschouwer, X.; Racki, G.; Riboulleau, A. Deep-water anoxia over the frasnian–famennian boundary (la serre, france): A tectonically induced oceanic anoxic event? Terra Nova 2004, 16, 288–295. [Google Scholar] [CrossRef]
- Wu, M.; Ouyang, Z. Cerium anomaly: A chemical tracer for tracing changes in redox conditions in ancient oceans. Chin. Sci. Bull. 1992, 3, 242–244. [Google Scholar]
- Department of Marine Geology, Tongji University. Introduction to Ancient Oceanography; Tongji University Publishing House: Shanghai, China, 1989; pp. 1–20. [Google Scholar]
- Wei, H. Productivity and redox proxies of palaeo-oceans: An overview of elementary geochemistry. Sediment. Geol. Tethyan Geol. 2012, 32, 76–88. [Google Scholar]
- Myrbo, A.; Shapley, M.D. Seasonal water-colum dynamics of dissolved inorganic carbon stable isotopic composition in small hard water lakes in Minnesota and Montana. Geochim. Cosmochim. Acta 2006, 70, 2699–2714. [Google Scholar] [CrossRef]
- Muller, P.J.; Suess, E. Productivity, sedimentation rate and sedimentary organic matter in the oceans—I. Organic carbon preservation. Deep Sea Res. 1979, 26, 1347–1362. [Google Scholar] [CrossRef]
- Mix, A.C. Pleistocene paleoproductivity evidence from organic carbon and foraminiferal species. In Productivity of the Ocean: Present and Past; Berger, W.H., Ed.; John Wiley Sons Press: New York, NY, USA, 1989; pp. 313–340. [Google Scholar]
- He, J.; Ding, W.; Jiang, Z.; Jiu, K.; Li, A.; Sun, Y. Mineralogical and chemical distribution of the Es3L oil shale in the Jiyang Depression, Bohai Bay Basin (E China): Implications for paleoenvironmental reconstruction and organic matter accumulation. Mar. Pet. Geol. 2017, 81, 196–219. [Google Scholar] [CrossRef]
- Li, L.; Liu, Z.J.; George, S.C.; Sun, P.C.; Xu, Y.B.; Meng, Q.T.; Wang, K.B.; Wang, J.X. Lake evolution and its influence on the formation of oil shales in the Middle Jurassic Shimengou Formation in the Tuanyushan area, Qaidam Basin, NW China. Geochemistry 2019, 79, 162–177. [Google Scholar] [CrossRef]
- Kuss, J.; Kremling, K. Particulate trace element fluxes in the deep northeast Atlantic Ocean. Deep-Sea Res. Part I 1999, 46, 149–169. [Google Scholar] [CrossRef]
- Pohl, C.; Loffler, A.; Hennings, U. A sediment trap flux study for trace metals under seasonal aspects in the stratified Baltic Sea (Gotland Basin: 57° 19.20′ N; 20° 03.00′ E). Mar. Chem. 2004, 84, 143–160. [Google Scholar] [CrossRef]
- Riboulleau, A.; Baudin, F.; Deconinck, J.F.; Derenne, S.; Largeau, C.; Tribovillard, N. Depositional conditions and organic matter preservation pathways in an epicontinental environment: The Upper Jurassic Kashpir Oil Shales (Volga Basin, Russia). Palaeogeogr. Palaeoclimatol. Palaeoecol. 2003, 197, 171–197. [Google Scholar] [CrossRef]
- Cao, T. Element Geochemistry Evaluation of Marine Source Rock with High Maturity: A Case Study of Lower Cambrian in Yangba Section of Nanjiang County, Sichuan. Master’s Thesis, China University of Geosciences, Wuhan, China, 2011. [Google Scholar]
- Dymond, J.; Suess, E.; Lyle, M. Barium in Deep-Sea Sediment: A Geochemical Proxy for Paleoproductivity. Paleoceanography 1992, 7, 163–181. [Google Scholar] [CrossRef]
- Nürnberg, C.C.; Bohrmann, G.; Schlüter, M.; Frank, M. Barium accumulation in the Atlantic sector of the Southern Ocean: Results From 190,000-year records. Paleoceanography 1997, 12, 594–603. [Google Scholar] [CrossRef]
- Murphy, A.E.; Sageman, B.B.; Hollander, D.J.; Lyons, T.W. Black shale deposition and faunal overturn in the Devonian Appalachian Basin: Clastic starvation, seasonal water-column mixing, and efficient biolimiting nutrient recycling. Paleoceanography 2000, 15, 280–291. [Google Scholar] [CrossRef]
- Zhang, L. The Progress On The Study Of Lacustrine Source Rocks. Pet. Geol. Exp. 2008, 30, 591–595. [Google Scholar]
- Li, Y.; Shao, D.; Lv, H.; Zhang, Y.; Zhang, X.; Zhang, T. A relationship between elemental geochemical characteristics and organic matter enrichment in marine shale of Wufeng Formation-Longmaxi Formation, Sichuan Basin. Acta Pet. Sin. 2015, 36, 1470–1483. [Google Scholar] [CrossRef]
- Jones, B.; Manning, D. Comparison of geochemical indices used for the interpretation of palaeoredox conditions in ancient mudstones. Chem. Geol. 1994, 111, 111–129. [Google Scholar] [CrossRef]
- Hatch, J.R.; Leventhal, J.S. Relationship between inferred redox potential of the depositional environment and geochemistry of the Upper Pennsylvanian (Missourian) Stark Shale Member of the Dennis Limestone, Wabaunsee County, Kansas, U.S.A. Chem. Geol. 1992, 99, 65–82. [Google Scholar] [CrossRef]
- Bruland, K.W. Trace elements in sea-water. In Chemical Oceanography; Riley, J.P., Chester, R., Eds.; Academic Press: London, UK, 1983; pp. 157–220. [Google Scholar]
- Klinkhammer, G.P.; Palmer, M.R. Uranium in the oceans: Where it goes and why. Geochim. Cosmochim. Acta 1991, 55, 1799–1806. [Google Scholar] [CrossRef]
- Francois, R. A study of the regulation of the concentration of some trace metals (Rb, Sr, Zn, Pb, Cu, V, Cr, Ni, Mn, Mo) in Sannich Inlet sediments, British Columbia, Canada. Mar. Geol. 1988, 83, 285–308. [Google Scholar] [CrossRef]
- Anderson, R.F.; Fleisher, M.Q.; LeHuray, A.P. Concentration, oxidation state, and particulate flux of uranium in the black sea. Geochim. Cosmochim. Acta 1989, 53, 2215–2224. [Google Scholar] [CrossRef]
- Crusius, J.; Calvert, S.; Pedersen, T.; Sage, D. Rehenium and molybdenum enrichments in sediments as indicators of oxic, suboxic, and sulfidic conditions of deposition. Earth Planet. Sci. Lett. 1996, 145, 65–78. [Google Scholar] [CrossRef]
- Calvert, S.E.; Pedersen, T.F. Geochemistry of recent oxic and anoxic marine sediments: Implications for the geological record. Mar. Geol. 1993, 113, 67–88. [Google Scholar] [CrossRef]
- Hild, E.; Brumsack, H.J. Major and minor element geochemistry of Lower Aptian sediments from the NW German Basin (core Hoheneggelsen KB 40). Cretac. Res. 1998, 19, 615–633. [Google Scholar] [CrossRef]
- Hastings, D.W.; Emerson, S.R.; Mix, A.C. Vanadium in foraminiferal calcite as a tracer for changes in the areal extent of reducing sediments. Paleoceanography 1996, 11, 665–678. [Google Scholar] [CrossRef]
- Calvert, S.E.; Piper, D.Z. Geochemistry of ferromanganese nodules from domes site a, northern equatorial pacific: Multiple diagenetic metal sources in the deep sea. Geochim. Cosmochim. Acta 1984, 48, 1913–1928. [Google Scholar] [CrossRef]
- Whitfield, M. Interactions between phytoplankton and trace metals in the ocean. Adv. Mar. Biol. 2001, 41, 1–128. [Google Scholar]
- Piper, D.Z.; Perkins, R.B. A modern vs. Permian black shale—The hydrography primary productivity and water-column chemistry of deposition. Chem. Geol. 2004, 206, 177–197. [Google Scholar] [CrossRef]
- Tribovillard, N.; Algeo, T.J.; Lyons, T.; Riboulleau, A. Trace metals as paleoredox and paleoproductivity proxies: An update. Chem. Geol. 2006, 232, 12–32. [Google Scholar] [CrossRef]
- Nameroff, T.J.; Calvert, S.E.; Murray, J.W. Glacial-interglacial variability in the eastern tropical north pacific oxygen minimum zone recorded by redox-sensitive trace metals. Paleoceanography 2004, 19, PA1010. [Google Scholar] [CrossRef]
- Chang, H.; Chu, X.; Feng, L.; Huang, J.; Zhang, Q. Redox sensive Trace Elements as Plaleoenviroments Proxies. Geol. Rev. 2009, 55, 91–99. [Google Scholar] [CrossRef]
- Zhang, X.; Yan, X.; Li, P.; Miao, D.; Hu, W.; Liu, Q. The Method of Determination of Aliphatic Content in Kerogen by Quantitative FT-IR and Its Petroleum Geology Significance. Acta Sedimentol. Sin. 2004, 4, 711–717. [Google Scholar] [CrossRef]
- Ma, X.; Ran, Y. Simulation and characterization of thermal evolution of kerogen in Maoming oil shale. Geochimica 2013, 42, 373–378. [Google Scholar] [CrossRef]
- Wang, Q.; Xu, X.; Chi, M.; Zhang, H.; Cui, D.; Bai, J. FT-IR study on composition of oil shake kerogen and its pyrolysis oil generation characteristics. J. Fuel Chem. Technol. 2015, 43, 1158–1166. [Google Scholar]
- Lu, L.; Cai, J.; Liu, W.; Teng, G.; Hu, W. Infra-red emission spectroscopy study of thermal evolution of organic matter bound by clay minerals in muddy hydrocarbon source rocks. Pet. Geol. Exp. 2012, 34, 215–222. [Google Scholar]


| Rock–Eval Pyrolysis | Major and Trace Elements | Infrared Spectrum | Microscopic Components | |
|---|---|---|---|---|
| HZ-A | 62 | 35 | 15 | 15 |
| HZ-B | 49 | / | / | / |
| EP-A | 31 | 11 | 6 | 6 |
| XJ-A | 54 | 25 | 9 | 9 |
| Sub-Sag | Well Number | Strata | Depth | TOC | Tmax | HI | S1 | S2 | S3 | S1 + S2 |
|---|---|---|---|---|---|---|---|---|---|---|
| m | % | °C | mg/g·TOC | mg/g | mg/g | mg/g | mg/g | |||
| HZ-A | HZ-A-1-1 | Enping formation | 3672.50 | 1.20 | 450.00 | 121.67 | 0.17 | 1.46 | 1.83 | 1.63 |
| 3707.50 | 3.40 | 445.00 | 170.59 | 0.74 | 5.80 | 1.25 | 6.54 | |||
| 3847.50 | 2.60 | 453.00 | 170.38 | 0.55 | 4.43 | 1.01 | 4.98 | |||
| 3922.50 | 2.60 | 450.00 | 238.85 | 0.99 | 6.21 | 1.23 | 7.20 | |||
| 4002.50 | 1.50 | 453.00 | 85.33 | 0.29 | 1.28 | 2.30 | 1.57 | |||
| 4081.50 | 1.80 | 461.00 | 107.22 | 0.26 | 1.93 | 2.76 | 2.19 | |||
| 4097.50 | 3.40 | 458.00 | 145.59 | 0.63 | 4.95 | 1.25 | 5.58 | |||
| 4111.50 | 1.80 | 461.00 | 105.56 | 0.31 | 1.90 | 2.76 | 2.21 | |||
| 4126.50 | 1.40 | 458.00 | 99.29 | 0.24 | 1.39 | 2.14 | 1.63 | |||
| 4142.50 | 1.30 | 463.00 | 93.85 | 0.19 | 1.22 | 1.99 | 1.41 | |||
| 4156.50 | 1.70 | 459.00 | 102.94 | 0.29 | 1.75 | 2.61 | 2.04 | |||
| Wenchang formation | 4191.00 | 1.57 | 374.00 | 155.00 | 0.69 | 2.44 | 1.41 | 3.13 | ||
| 4206.00 | 1.46 | 366.00 | 181.00 | 0.84 | 2.64 | 1.24 | 3.48 | |||
| 4224.00 | 1.06 | 378.00 | 168.00 | 0.80 | 1.78 | 1.61 | 2.58 | |||
| 4236.00 | 1.40 | 369.00 | 158.00 | 0.83 | 2.21 | 0.14 | 3.04 | |||
| 4254.00 | 1.50 | 379.00 | 145.00 | 0.97 | 2.18 | 2.30 | 3.15 | |||
| 4284.00 | 1.40 | 379.00 | 165.00 | 0.85 | 2.31 | 2.14 | 3.16 | |||
| 4302.00 | 1.14 | 381.00 | 172.00 | 1.57 | 1.96 | 1.74 | 3.53 | |||
| HZ-A-1-18 | Enping formation | 3768.00 | 0.77 | 405.00 | 226.00 | 0.57 | 1.74 | 1.16 | 2.31 | |
| 3849.00 | 1.04 | 443.00 | 168.00 | 0.40 | 1.75 | 1.58 | 2.15 | |||
| 3876.00 | 0.34 | 368.00 | 279.00 | 0.22 | 0.95 | 0.49 | 1.17 | |||
| 3939.00 | 0.62 | 410.00 | 197.00 | 0.27 | 1.22 | 0.93 | 1.49 | |||
| 4115.50 | 0.49 | 360.00 | 231.00 | 0.25 | 1.13 | 0.73 | 1.38 | |||
| 4155.00 | 0.34 | 368.00 | 262.00 | 0.16 | 0.89 | 0.49 | 1.05 | |||
| Wenchang formation | 4191.00 | 1.57 | 374.00 | 155.00 | 0.69 | 2.44 | 2.41 | 3.13 | ||
| 4206.00 | 1.46 | 366.00 | 181.00 | 0.84 | 2.64 | 2.24 | 3.48 | |||
| 4224.00 | 1.06 | 378.00 | 168.00 | 0.80 | 1.78 | 1.61 | 2.58 | |||
| 4236.00 | 1.40 | 369.00 | 158.00 | 0.83 | 2.21 | 2.14 | 3.04 | |||
| 4254.00 | 1.50 | 379.00 | 145.00 | 0.97 | 2.18 | 2.30 | 3.15 | |||
| 4284.00 | 1.40 | 379.00 | 165.00 | 0.85 | 2.31 | 2.14 | 3.16 | |||
| 4302.00 | 1.14 | 381.00 | 172.00 | 1.57 | 1.96 | 1.74 | 3.53 | |||
| HZ-A-4-1 | Enping formation | 3637.50 | 0.58 | 451.00 | 24.28 | 0.06 | 0.14 | 0.87 | 0.20 | |
| 3661.50 | 0.36 | 440.00 | 44.25 | 0.10 | 0.16 | 0.52 | 0.26 | |||
| 3670.50 | 0.71 | 454.00 | 22.61 | 0.04 | 0.16 | 1.07 | 0.20 | |||
| 3685.50 | 0.57 | 454.00 | 66.36 | 0.11 | 0.38 | 0.85 | 0.49 | |||
| 3688.50 | 0.62 | 445.00 | 51.46 | 0.10 | 0.32 | 0.93 | 0.42 | |||
| 3715.50 | 0.86 | 450.00 | 45.38 | 0.12 | 0.39 | 1.30 | 0.51 | |||
| HZ-A-6-1 | Wenchang formation | 3457.50 | 3.33 | 440.00 | 465.81 | 3.82 | 15.49 | 1.01 | 19.31 | |
| 3460.50 | 4.13 | 444.00 | 467.83 | 4.46 | 19.30 | 0.84 | 23.76 | |||
| 3463.50 | 4.52 | 442.00 | 483.35 | 4.89 | 21.87 | 0.88 | 26.76 | |||
| 3548.50 | 3.15 | 441.00 | 401.76 | 3.60 | 12.67 | 1.37 | 16.27 | |||
| HZ-A-5-1 | Wenchang formation | 4578.50 | 3.67 | 451.00 | 282.28 | 7.64 | 10.37 | 8.07 | 18.01 | |
| 4589.50 | 3.55 | 449.00 | 269.83 | 5.40 | 9.57 | 7.01 | 14.97 | |||
| 4607.50 | 4.37 | 450.00 | 234.82 | 4.96 | 10.27 | 5.75 | 15.23 | |||
| 4622.50 | 4.44 | 450.00 | 255.28 | 6.13 | 11.33 | 6.39 | 17.46 | |||
| 4637.50 | 3.48 | 447.00 | 239.33 | 5.01 | 8.32 | 5.94 | 13.33 | |||
| 4651.50 | 2.85 | 447.00 | 262.44 | 4.46 | 7.49 | 6.52 | 11.95 | |||
| 4662.50 | 3.99 | 450.00 | 243.46 | 4.42 | 9.72 | 5.89 | 14.14 | |||
| 4676.50 | 2.97 | 448.00 | 247.96 | 3.73 | 7.37 | 6.30 | 11.10 | |||
| HZ-A-1-3 | Wenchang formation | 3807.50 | 3.38 | 444.00 | 389.37 | 2.53 | 13.17 | 0.96 | 15.70 | |
| 3817.50 | 4.56 | 445.00 | 431.42 | 3.78 | 19.66 | 1.01 | 23.44 | |||
| 3825.50 | 3.15 | 438.00 | 401.42 | 3.84 | 12.63 | 1.43 | 16.47 | |||
| 3837.50 | 3.25 | 443.00 | 378.15 | 3.03 | 12.29 | 1.09 | 15.32 | |||
| 3855.50 | 3.42 | 441.00 | 366.75 | 3.54 | 12.54 | 1.32 | 16.08 | |||
| 3867.50 | 3.73 | 439.00 | 374.53 | 4.68 | 13.98 | 1.26 | 18.66 | |||
| 3880.50 | 3.39 | 438.00 | 370.50 | 4.30 | 12.55 | 1.49 | 16.85 | |||
| 3894.50 | 2.50 | 434.00 | 380.85 | 3.09 | 9.54 | 1.55 | 12.63 | |||
| HZ-B | HZ-B-3-1d | Enping formation | 4683.50 | 1.40 | 444.90 | 177.22 | 0.56 | 2.49 | 1.17 | 3.05 |
| 4687.00 | 1.47 | 448.80 | 161.76 | 0.56 | 2.38 | 0.28 | 2.94 | |||
| 4690.50 | 0.69 | 448.40 | 329.39 | 0.49 | 2.28 | 0.97 | 2.77 | |||
| 4692.50 | 1.21 | 448.90 | 64.00 | 0.23 | 0.78 | 1.85 | 1.01 | |||
| 4697.00 | 0.89 | 450.80 | 160.32 | 0.47 | 1.42 | 1.30 | 1.89 | |||
| 4702.50 | 0.80 | 452.60 | 144.11 | 0.38 | 1.15 | 1.14 | 1.53 | |||
| 4706.50 | 0.80 | 451.90 | 157.28 | 0.48 | 1.26 | 1.15 | 1.73 | |||
| 4709.00 | 1.66 | 439.90 | 149.07 | 0.55 | 2.47 | 2.59 | 3.01 | |||
| 4712.50 | 2.01 | 446.70 | 197.14 | 0.92 | 3.96 | 1.18 | 4.88 | |||
| 4717.50 | 0.78 | 449.30 | 150.08 | 0.37 | 1.17 | 1.11 | 1.54 | |||
| 4723.00 | 0.54 | 455.20 | 148.72 | 0.30 | 0.81 | 0.72 | 1.11 | |||
| 4737.00 | 0.68 | 456.60 | 137.25 | 0.35 | 0.93 | 0.95 | 1.28 | |||
| 4742.00 | 0.29 | 459.60 | 152.60 | 0.19 | 0.44 | 0.29 | 0.63 | |||
| 4751.00 | 0.91 | 457.50 | 106.86 | 0.21 | 0.97 | 1.34 | 1.18 | |||
| 4765.50 | 0.76 | 451.20 | 137.82 | 0.36 | 1.05 | 1.08 | 1.41 | |||
| 4772.50 | 0.67 | 448.30 | 145.39 | 0.35 | 0.98 | 0.93 | 1.33 | |||
| 4777.50 | 0.82 | 454.60 | 102.22 | 0.36 | 0.84 | 1.18 | 1.20 | |||
| 4785.50 | 0.56 | 447.10 | 136.27 | 0.31 | 0.76 | 0.75 | 1.07 | |||
| 4793.00 | 0.63 | 461.20 | 99.28 | 0.26 | 0.62 | 0.86 | 0.89 | |||
| 4797.00 | 0.55 | 453.00 | 115.46 | 0.25 | 0.64 | 0.74 | 0.89 | |||
| 4807.50 | 0.76 | 445.90 | 137.61 | 0.34 | 1.04 | 1.08 | 1.38 | |||
| 4812.50 | 0.54 | 447.20 | 139.46 | 0.29 | 0.75 | 0.71 | 1.04 | |||
| 4815.50 | 0.71 | 449.00 | 131.16 | 0.32 | 0.93 | 1.00 | 1.25 | |||
| 4819.50 | 0.50 | 447.20 | 147.06 | 0.27 | 0.74 | 0.65 | 1.01 | |||
| 4825.50 | 0.58 | 450.00 | 123.85 | 0.27 | 0.72 | 0.78 | 0.99 | |||
| 4832.00 | 0.63 | 458.40 | 109.76 | 0.27 | 0.70 | 0.87 | 0.96 | |||
| 4836.50 | 0.63 | 452.30 | 105.15 | 0.27 | 0.67 | 0.87 | 0.93 | |||
| 4839.50 | 0.56 | 440.60 | 135.54 | 0.32 | 0.76 | 0.75 | 1.08 | |||
| 4853.50 | 0.59 | 454.80 | 136.92 | 0.29 | 0.81 | 0.79 | 1.09 | |||
| 4858.00 | 0.69 | 443.50 | 101.92 | 0.27 | 0.70 | 0.96 | 0.97 | |||
| 4870.50 | 0.50 | 443.30 | 127.37 | 0.28 | 0.64 | 0.64 | 0.91 | |||
| 4874.50 | 0.58 | 438.00 | 137.21 | 0.34 | 0.79 | 0.78 | 1.14 | |||
| 4883.50 | 0.55 | 440.40 | 156.62 | 0.32 | 0.86 | 0.73 | 1.18 | |||
| 4887.50 | 0.71 | 445.20 | 97.28 | 0.33 | 0.69 | 0.99 | 1.02 | |||
| 4892.50 | 0.77 | 441.90 | 131.12 | 0.40 | 1.01 | 1.11 | 1.41 | |||
| 4897.50 | 0.65 | 444.80 | 115.66 | 0.34 | 0.75 | 0.89 | 1.09 | |||
| 4910.00 | 0.55 | 439.20 | 151.40 | 0.31 | 0.83 | 0.73 | 1.14 | |||
| 4915.50 | 0.49 | 447.90 | 128.83 | 0.26 | 0.63 | 0.62 | 0.88 | |||
| 4932.00 | 0.54 | 446.00 | 129.35 | 0.27 | 0.70 | 0.71 | 0.97 | |||
| 4936.00 | 1.05 | 442.50 | 79.29 | 0.34 | 0.83 | 1.57 | 1.17 | |||
| 4944.00 | 0.65 | 450.40 | 104.38 | 0.30 | 0.68 | 0.90 | 0.98 | |||
| 4948.00 | 0.91 | 446.70 | 130.27 | 0.44 | 1.19 | 1.34 | 1.63 | |||
| 4955.50 | 0.58 | 450.70 | 149.75 | 0.33 | 0.87 | 0.78 | 1.20 | |||
| 4959.00 | 1.04 | 446.30 | 133.26 | 0.49 | 1.39 | 1.55 | 1.88 | |||
| 4965.50 | 0.76 | 447.60 | 141.28 | 0.47 | 1.07 | 1.08 | 1.54 | |||
| 4970.50 | 0.92 | 446.50 | 132.30 | 0.45 | 1.22 | 1.35 | 1.67 | |||
| 4977.00 | 0.65 | 439.90 | 225.23 | 0.46 | 1.46 | 0.89 | 1.92 | |||
| 4986.50 | 0.67 | 437.00 | 209.82 | 0.40 | 1.41 | 0.97 | 1.80 | |||
| 4999.00 | 0.57 | 438.10 | 213.56 | 0.36 | 1.23 | 0.77 | 1.58 | |||
| EP-A | EP-A-3-1 | Enping formation | 3425.00 | 0.90 | 438.00 | 66.00 | 0.07 | 0.59 | 0.54 | 0.66 |
| 3432.60 | 1.46 | 443.00 | 95.00 | 0.18 | 1.39 | 0.97 | 1.57 | |||
| 3445.00 | 1.00 | 440.00 | 96.00 | 0.17 | 0.96 | 0.74 | 1.13 | |||
| 3465.00 | 1.22 | 441.00 | 98.00 | 0.19 | 1.19 | 0.87 | 1.38 | |||
| 3535.00 | 2.36 | 436.00 | 172.00 | 2.20 | 4.07 | 2.41 | 6.27 | |||
| 3570.00 | 3.39 | 440.00 | 132.00 | 0.62 | 4.48 | 2.63 | 5.10 | |||
| 3595.00 | 0.71 | 444.00 | 120.00 | 0.11 | 0.85 | 0.68 | 0.96 | |||
| 3687.50 | 1.16 | 440.00 | 289.00 | 0.46 | 3.35 | 2.02 | 3.81 | |||
| 3687.50 | 1.16 | 440.00 | 289.00 | 0.46 | 3.35 | 2.02 | 3.81 | |||
| 3715.00 | 0.77 | 445.00 | 90.00 | 0.15 | 0.69 | 0.60 | 0.84 | |||
| 3850.00 | 0.55 | 433.00 | 105.00 | 0.15 | 0.58 | 0.54 | 0.73 | |||
| 3910.00 | 0.55 | 447.00 | 89.00 | 0.12 | 0.49 | 0.49 | 0.61 | |||
| 4220.00 | 0.62 | 446.00 | 113.00 | 0.11 | 0.70 | 0.60 | 0.81 | |||
| 4292.50 | 1.58 | 453.00 | 207.00 | 0.87 | 3.27 | 1.98 | 4.14 | |||
| 4337.50 | 1.47 | 455.00 | 178.00 | 0.69 | 2.61 | 1.63 | 3.30 | |||
| 4335.00 | 1.40 | 457.00 | 101.00 | 0.31 | 1.42 | 0.99 | 1.73 | |||
| 4350.00 | 3.64 | 457.00 | 158.00 | 1.11 | 5.75 | 3.31 | 6.86 | |||
| 4387.50 | 1.21 | 452.00 | 197.00 | 0.86 | 2.38 | 1.50 | 3.24 | |||
| 4462.50 | 9.61 | 459.00 | 142.00 | 1.86 | 13.65 | 7.54 | 15.51 | |||
| Wenchang formation | 4487.50 | 3.44 | 459.00 | 158.00 | 1.04 | 5.43 | 3.14 | 6.47 | ||
| 4480.00 | 4.20 | 465.00 | 120.00 | 1.07 | 5.05 | 2.93 | 6.12 | |||
| 4585.00 | 1.25 | 470.00 | 90.00 | 0.47 | 1.13 | 0.83 | 1.60 | |||
| 4595.00 | 1.25 | 470.00 | 88.00 | 0.47 | 1.10 | 0.82 | 1.57 | |||
| 4637.50 | 1.25 | 459.00 | 116.00 | 0.48 | 1.45 | 1.00 | 1.93 | |||
| 4625.00 | 1.30 | 475.00 | 67.00 | 0.40 | 0.87 | 0.69 | 1.27 | |||
| 4640.00 | 0.95 | 458.00 | 75.00 | 0.29 | 0.71 | 0.61 | 1.00 | |||
| 4645.00 | 1.02 | 458.00 | 86.00 | 0.38 | 0.88 | 0.70 | 1.26 | |||
| 4687.50 | 1.61 | 473.00 | 80.00 | 0.61 | 1.28 | 0.91 | 1.89 | |||
| 4755.00 | 0.88 | 481.00 | 50.00 | 0.15 | 0.44 | 0.46 | 0.59 | |||
| 4765.00 | 1.45 | 430.00 | 73.00 | 0.36 | 1.06 | 0.80 | 1.42 | |||
| 4780.00 | 0.93 | 479.00 | 46.00 | 0.17 | 0.43 | 0.46 | 0.60 | |||
| XJ-A | XJ-A-1-1 | Enping formation | 3952.50 | 1.00 | 433.00 | 325.00 | 0.54 | 3.25 | 1.22 | 3.79 |
| 3975.00 | 1.26 | 432.00 | 259.00 | 0.54 | 3.26 | 1.21 | 3.80 | |||
| 4006.50 | 1.83 | 428.00 | 281.00 | 0.65 | 5.15 | 1.49 | 5.80 | |||
| 4033.50 | 2.03 | 430.00 | 262.00 | 0.77 | 5.31 | 1.77 | 6.08 | |||
| 4087.50 | 1.20 | 435.00 | 281.00 | 0.64 | 3.37 | 1.46 | 4.01 | |||
| 4114.50 | 2.12 | 431.00 | 283.00 | 1.05 | 6.00 | 2.44 | 7.05 | |||
| 4132.50 | 1.17 | 435.00 | 255.00 | 0.39 | 2.98 | 0.86 | 3.37 | |||
| 4170.00 | 1.03 | 427.00 | 240.00 | 0.29 | 2.47 | 0.62 | 2.76 | |||
| 4252.50 | 1.79 | 437.00 | 288.00 | 0.75 | 5.15 | 1.73 | 5.90 | |||
| 4302.00 | 1.03 | 437.00 | 268.00 | 0.55 | 2.76 | 1.25 | 3.31 | |||
| 4363.50 | 2.05 | 440.00 | 242.00 | 0.93 | 4.97 | 2.16 | 5.90 | |||
| 4399.50 | 4.03 | 438.00 | 264.00 | 1.70 | 10.64 | 4.00 | 12.34 | |||
| Wenchang formation | 4432.50 | 3.95 | 440.00 | 242.00 | 1.92 | 9.55 | 4.53 | 11.47 | ||
| 4435.00 | 5.48 | 441.00 | 269.00 | 1.54 | 14.76 | 3.62 | 16.30 | |||
| 4453.50 | 2.32 | 443.00 | 271.00 | 0.95 | 6.28 | 2.20 | 7.23 | |||
| 4471.50 | 1.30 | 443.00 | 308.00 | 0.47 | 4.00 | 1.05 | 4.47 | |||
| 4507.50 | 0.50 | 446.00 | 334.00 | 0.27 | 1.66 | 0.57 | 1.93 | |||
| 4537.50 | 0.56 | 443.00 | 294.00 | 0.27 | 1.65 | 0.37 | 1.92 | |||
| 4608.00 | 0.54 | 445.00 | 351.00 | 0.24 | 1.88 | 0.50 | 2.12 | |||
| 4692.00 | 0.62 | 443.00 | 313.00 | 0.31 | 1.94 | 0.67 | 2.25 | |||
| XJ-A-1-2 | Enping formation | 3924.00 | 0.89 | 430.00 | 292.00 | 0.48 | 2.60 | 1.08 | 3.08 | |
| 4101.00 | 3.43 | 433.00 | 332.00 | 1.95 | 11.39 | 4.60 | 13.34 | |||
| 4125.00 | 1.37 | 434.00 | 308.00 | 1.03 | 4.22 | 2.40 | 5.25 | |||
| 4203.00 | 0.99 | 433.00 | 313.00 | 0.70 | 3.10 | 1.61 | 3.80 | |||
| 4383.00 | 1.62 | 435.00 | 286.00 | 1.29 | 4.64 | 3.02 | 5.93 | |||
| 4407.00 | 6.38 | 439.00 | 293.00 | 2.96 | 18.72 | 7.02 | 21.68 | |||
| 4428.00 | 5.62 | 438.00 | 324.00 | 3.00 | 18.22 | 7.12 | 21.22 | |||
| Wenchang formation | 4554.00 | 0.56 | 449.00 | 289.00 | 0.24 | 1.62 | 0.50 | 1.86 | ||
| 4617.00 | 0.56 | 438.00 | 382.00 | 0.36 | 2.14 | 0.79 | 2.50 | |||
| XJ-A-2-1A | Enping formation | 4089.50 | 1.57 | 428.00 | 157.96 | 0.25 | 2.48 | 2.20 | 2.73 | |
| 4120.50 | 1.23 | 434.00 | 111.81 | 0.22 | 1.38 | 1.14 | 1.60 | |||
| 4153.50 | 1.32 | 428.00 | 77.30 | 0.25 | 1.02 | 1.25 | 1.27 | |||
| 4188.50 | 2.62 | 439.00 | 108.41 | 0.38 | 2.84 | 0.98 | 3.22 | |||
| 4227.50 | 1.25 | 438.00 | 98.05 | 0.17 | 1.23 | 0.64 | 1.40 | |||
| 4271.50 | 1.16 | 436.00 | 98.80 | 0.15 | 1.15 | 0.66 | 1.30 | |||
| 4302.50 | 6.63 | 440.00 | 154.22 | 0.84 | 10.23 | 0.95 | 11.07 | |||
| 4333.50 | 2.61 | 440.00 | 146.29 | 0.30 | 3.82 | 0.39 | 4.12 | |||
| 4356.50 | 2.28 | 420.00 | 277.33 | 2.80 | 6.33 | 1.75 | 9.13 | |||
| 4389.50 | 2.36 | 425.00 | 252.82 | 2.03 | 5.96 | 2.36 | 7.99 | |||
| 4419.50 | 2.79 | 441.00 | 100.17 | 0.32 | 2.79 | 0.28 | 3.11 | |||
| 4446.50 | 2.12 | 443.00 | 126.23 | 0.38 | 2.67 | 0.58 | 3.05 | |||
| 4480.50 | 4.05 | 443.00 | 108.53 | 0.65 | 4.40 | 1.48 | 5.05 | |||
| 4509.50 | 2.11 | 449.00 | 111.21 | 0.29 | 2.35 | 0.41 | 2.64 | |||
| 4544.50 | 2.86 | 445.00 | 114.79 | 0.35 | 3.28 | 0.50 | 3.63 | |||
| 4572.50 | 2.16 | 444.00 | 128.98 | 0.30 | 2.79 | 0.41 | 3.09 | |||
| 4593.50 | 1.69 | 448.00 | 97.40 | 0.31 | 1.65 | 0.37 | 1.96 | |||
| 4622.50 | 1.30 | 449.00 | 93.79 | 0.18 | 1.22 | 0.23 | 1.40 | |||
| 4655.50 | 1.58 | 449.00 | 100.04 | 0.24 | 1.58 | 0.29 | 1.82 | |||
| 4691.50 | 2.26 | 451.00 | 121.12 | 0.35 | 2.74 | 0.31 | 3.09 | |||
| XJ-A-4-1 | Enping formation | 3554 | 1.18 | 443.00 | 163.00 | 0.13 | 1.92 | 0.24 | 2.05 | |
| 3483 | 1.30 | 441.00 | 135.00 | 0.31 | 1.75 | 0.67 | 2.06 | |||
| 3586.5 | 0.86 | 439.00 | 58.00 | 0.22 | 1.15 | 0.45 | 1.37 | |||
| 3658.5 | 0.90 | 440.00 | 47.00 | 0.29 | 1.27 | 0.62 | 1.56 | |||
| 3693 | 0.85 | 446.00 | 181.00 | 0.19 | 1.54 | 0.38 | 1.73 |
| Sub-Sag | Well Number | Strata | Depth | SiO2 | Al2O3 | MgO | Na2O | K2O | P2O5 | TiO2 | CaO | Fe2O3 | MnO | Loss on Ignition | BaO | NiO | Cr2O3 | CuO | ZrO2 | SrO |
|---|---|---|---|---|---|---|---|---|---|---|---|---|---|---|---|---|---|---|---|---|
| m | % | % | % | % | % | % | % | % | % | % | % | μg/g | μg/g | μg/g | μg/g | μg/g | μg/g | |||
| XJ-A | XJ-A-2-1A | 1st + 2nd Enping formation | 4089.5 | 62.00 | 14.93 | 1.86 | 1.92 | 2.81 | 0.07 | 0.59 | 1.92 | 6.79 | 0.10 | 6.54 | 1991.66 | 76.14 | 157.71 | 329.95 | 277.11 | 114.15 |
| 4120.5 | 69.81 | 14.39 | 1.17 | 1.59 | 2.72 | 0.07 | 0.67 | 0.95 | 5.81 | 0.11 | 2.64 | 1576.48 | 56.86 | 104.62 | 55.53 | 433.32 | 97.38 | |||
| 4153.5 | 66.18 | 16.02 | 1.25 | 1.99 | 2.86 | 0.08 | 0.66 | 1.08 | 5.25 | 0.10 | 4.50 | 1557.38 | 49.97 | 90.88 | 37.61 | 371.65 | 113.11 | |||
| 4188.5 | 68.69 | 16.05 | 0.90 | 1.29 | 2.75 | 0.08 | 0.63 | 0.42 | 4.68 | 0.03 | 4.44 | 1202.35 | 51.58 | 84.84 | 27.71 | 329.48 | 145.99 | |||
| 4227.5 | 72.83 | 14.37 | 0.90 | 1.32 | 2.55 | 0.07 | 0.61 | 0.45 | 4.70 | 0.05 | 2.14 | 778.95 | 51.50 | 98.22 | 25.34 | 469.55 | 94.98 | |||
| 4271.5 | 65.71 | 16.55 | 0.86 | 1.58 | 2.62 | 0.07 | 0.67 | 0.40 | 4.44 | 0.04 | 7.01 | 1528.99 | 50.17 | 88.91 | 30.75 | 336.22 | 119.48 | |||
| 4302.5 | 65.29 | 16.83 | 0.95 | 1.33 | 2.85 | 0.07 | 0.63 | 0.41 | 4.18 | 0.03 | 7.42 | 979.86 | 49.22 | 86.06 | 28.75 | 310.72 | 126.73 | |||
| 4333.5 | 73.17 | 12.99 | 0.76 | 0.94 | 2.47 | 0.06 | 0.55 | 0.60 | 3.97 | 0.01 | 4.47 | 457.15 | 50.82 | 72.77 | 19.50 | 512.56 | 93.07 | |||
| 4356.5 | 67.45 | 17.38 | 1.11 | 1.51 | 5.00 | 0.09 | 0.71 | 0.88 | 4.12 | 0.05 | 1.47 | 5135.73 | 45.88 | 70.02 | 28.81 | 339.29 | 172.45 | |||
| 4389.5 | 66.00 | 17.31 | 1.05 | 1.26 | 4.17 | 0.10 | 0.73 | 0.75 | 4.89 | 0.05 | 3.60 | 3851.51 | 52.94 | 76.63 | 29.29 | 346.12 | 153.28 | |||
| 3rd Enping formation | 4419.5 | 67.49 | 15.11 | 0.91 | 0.66 | 2.69 | 0.08 | 0.60 | 0.45 | 4.74 | 0.05 | 7.20 | 488.68 | 52.40 | 87.82 | 26.59 | 383.90 | 111.89 | ||
| 4446.5 | 66.96 | 16.16 | 0.97 | 0.63 | 2.68 | 0.08 | 0.64 | 0.43 | 4.77 | 0.06 | 6.63 | 434.43 | 43.59 | 80.76 | 24.14 | 407.04 | 140.13 | |||
| 4480.5 | 60.52 | 14.57 | 1.41 | 0.69 | 2.63 | 0.08 | 0.63 | 0.81 | 11.58 | 0.19 | 6.87 | 872.83 | 63.72 | 158.07 | 76.63 | 319.02 | 134.73 | |||
| 4509.5 | 66.82 | 15.46 | 1.06 | 0.70 | 2.71 | 0.08 | 0.64 | 0.52 | 4.84 | 0.05 | 7.11 | 501.44 | 52.42 | 89.86 | 36.04 | 403.12 | 120.69 | |||
| 4544.5 | 67.41 | 16.41 | 1.01 | 0.76 | 2.83 | 0.07 | 0.64 | 0.51 | 4.88 | 0.04 | 5.42 | 459.41 | 56.85 | 96.77 | 104.63 | 375.03 | 112.84 | |||
| 4572.5 | 67.37 | 15.75 | 1.05 | 0.68 | 2.76 | 0.08 | 0.64 | 0.43 | 5.30 | 0.05 | 5.87 | 459.09 | 61.36 | 95.83 | 59.25 | 374.79 | 111.95 | |||
| 4593.5 | 66.25 | 16.85 | 0.93 | 0.89 | 3.08 | 0.08 | 0.62 | 0.44 | 4.33 | 0.04 | 6.39 | 718.80 | 58.13 | 71.38 | 43.98 | 329.18 | 99.67 | |||
| 4622.5 | 69.48 | 13.35 | 1.08 | 0.70 | 2.62 | 0.07 | 0.53 | 1.34 | 4.59 | 0.04 | 6.15 | 466.07 | 55.68 | 62.42 | 25.86 | 350.77 | 105.49 | |||
| 4655.5 | 71.15 | 14.62 | 0.92 | 0.69 | 2.69 | 0.07 | 0.62 | 0.95 | 4.58 | 0.03 | 3.66 | 520.35 | 55.87 | 79.20 | 22.99 | 403.89 | 106.82 | |||
| 4691.5 | 67.57 | 18.46 | 0.93 | 0.75 | 3.10 | 0.06 | 0.61 | 0.63 | 3.98 | 0.02 | 3.83 | 579.64 | 49.47 | 76.26 | 34.46 | 316.14 | 101.39 | |||
| XJ-A-1-1 | 2nd Wenchang formation | 4450.5 | 63.14 | 17.76 | 0.96 | 1.43 | 5.37 | 0.06 | 0.76 | 0.98 | 4.00 | 0.04 | 4.86 | 9423.29 | 28.64 | 44.94 | 29.16 | 420.98 | 211.34 | |
| 4495.5 | 61.77 | 23.22 | 0.81 | 1.36 | 6.02 | 0.05 | 0.76 | 0.46 | 3.35 | 0.01 | 1.39 | 11,016.19 | 27.48 | 34.61 | 24.73 | 360.66 | 234.70 | |||
| 4576.5 | 62.62 | 21.07 | 0.81 | 1.42 | 7.24 | 0.04 | 0.70 | 0.64 | 3.34 | / | 1.43 | 8855.60 | 37.74 | 45.42 | 18.24 | 585.05 | 200.98 | |||
| 4626.5 | 64.41 | 19.82 | 0.26 | 1.00 | 6.72 | 0.03 | 0.35 | 0.20 | 0.89 | / | 5.54 | 7675.66 | 47.40 | 13.67 | 11.43 | 280.49 | 144.34 | |||
| 4674.5 | 63.74 | 19.97 | 0.43 | 1.16 | 7.86 | 0.03 | 0.40 | 0.23 | 1.27 | / | 4.15 | 9114.94 | 47.29 | 13.43 | 13.20 | 237.15 | 171.15 | |||
| EP-A | EP-A-3-1 | Enping formation | 3511.75 | 77.77 | 12.13 | 0.68 | 1.20 | 3.55 | 0.05 | 0.42 | 0.92 | 2.56 | / | 0.53 | 3860.29 | 101.62 | 31.07 | 10.00 | 201.13 | 131.96 |
| 3577.75 | 70.45 | 14.00 | 0.86 | 1.12 | 3.68 | 0.06 | 0.54 | 1.36 | 3.26 | / | 4.56 | 2827.52 | 74.80 | 52.37 | 22.58 | 322.41 | 133.68 | |||
| 3650.5 | 73.34 | 14.45 | 0.66 | 1.35 | 3.85 | 0.05 | 0.46 | 0.83 | 2.44 | / | 2.41 | 3202.31 | 70.81 | 35.91 | 21.11 | 237.55 | 132.70 | |||
| 3715 | 72.34 | 13.23 | 0.81 | 1.34 | 3.72 | 0.05 | 0.50 | 1.20 | 2.64 | / | 3.75 | 6174.24 | 105.53 | 43.17 | 16.05 | 237.19 | 191.67 | |||
| 3791.5 | 64.47 | 15.26 | 0.83 | 1.28 | 3.67 | 0.08 | 0.89 | 0.82 | 4.22 | 0.08 | 7.32 | 15,482.16 | 33.89 | 58.91 | 53.20 | 168.73 | 288.02 | |||
| Wenchang formation | 4755.5 | 57.27 | 16.33 | 0.87 | 1.41 | 3.28 | 0.13 | 1.18 | 0.84 | 4.48 | 0.15 | 11.60 | 29,576.42 | 37.22 | 47.78 | 73.20 | 184.74 | 686.63 | ||
| 4775.5 | 55.31 | 16.32 | 0.89 | 1.52 | 2.87 | 0.12 | 1.47 | 0.85 | 3.78 | 0.10 | 13.38 | 41,049.23 | 49.56 | 48.98 | 73.78 | 213.02 | 999.17 | |||
| 4812.5 | 52.14 | 17.11 | 0.94 | 1.64 | 2.68 | 0.15 | 1.44 | 1.25 | 4.37 | 0.14 | 14.85 | 39,937.69 | 42.48 | 45.23 | 91.65 | 202.94 | 1003.59 | |||
| 4816.5 | 55.59 | 18.27 | 0.93 | 1.74 | 2.91 | 0.14 | 1.24 | 1.03 | 4.66 | 0.16 | 10.68 | 31,531.66 | 39.50 | 52.22 | 74.70 | 197.67 | 734.83 | |||
| 4822.5 | 52.62 | 16.92 | 0.93 | 2.06 | 2.80 | 0.15 | 1.38 | 1.11 | 4.78 | 0.16 | 13.92 | 38,433.94 | 44.72 | 43.52 | 85.08 | 196.25 | 981.13 | |||
| 4829.5 | 54.52 | 17.70 | 0.94 | 1.80 | 2.94 | 0.13 | 1.23 | 0.69 | 4.98 | 0.17 | 12.23 | 31,758.01 | 45.24 | 42.65 | 67.14 | 210.47 | 782.46 | |||
| HZ-A | HZ-A-1-3 | Wenchang formation | 3807.5 | 58.63 | 20.06 | 1.06 | 1.48 | 4.26 | 0.08 | 1.11 | 0.61 | 3.82 | 0.05 | 7.46 | 19,672.06 | 31.41 | 51.30 | 37.59 | 310.64 | 377.57 |
| 3817.5 | 62.55 | 19.34 | 0.98 | 1.18 | 3.56 | 0.08 | 1.01 | 0.67 | 4.06 | 0.07 | 5.44 | 15,784.89 | 32.06 | 55.01 | 39.80 | 238.42 | 346.71 | |||
| 3825.5 | 70.85 | 14.91 | 0.79 | 0.87 | 3.31 | 0.08 | 0.89 | 0.67 | 4.14 | 0.06 | 2.22 | 16,965.91 | 29.47 | 41.86 | 38.64 | 157.28 | 341.89 | |||
| 3837.5 | 72.35 | 14.30 | 0.70 | 0.85 | 3.32 | 0.06 | 0.87 | 0.73 | 3.52 | 0.06 | 2.02 | 17,054.23 | 25.89 | 39.21 | 36.43 | 164.10 | 330.72 | |||
| 3855.5 | 67.97 | 16.24 | 0.91 | 0.82 | 3.82 | 0.07 | 0.93 | 1.29 | 4.00 | 0.06 | 2.53 | 18,749.29 | 26.49 | 43.48 | 41.41 | 145.75 | 375.11 | |||
| 3867.5 | 68.62 | 15.89 | 0.82 | 0.86 | 2.42 | 0.09 | 0.85 | 0.97 | 4.85 | 0.08 | 3.73 | 12,739.22 | 26.28 | 46.49 | 38.61 | 155.82 | 285.76 | |||
| 3880.5 | 63.63 | 19.16 | 1.14 | 0.99 | 3.78 | 0.09 | 1.05 | 1.05 | 4.39 | 0.07 | 3.33 | 18,763.45 | 31.59 | 52.13 | 43.01 | 198.85 | 374.78 | |||
| 3894.5 | 63.25 | 17.93 | 1.07 | 1.06 | 3.42 | 0.12 | 1.00 | 1.34 | 4.18 | 0.05 | 5.37 | 17,613.24 | 34.50 | 49.96 | 43.24 | 193.16 | 342.79 | |||
| HZ-A-5-1 | 5th Wenchang formation | 4578.5 | 54.81 | 18.31 | 1.22 | 1.71 | 6.42 | 0.07 | 1.00 | 0.80 | 3.26 | 0.08 | 11.12 | 17,295.56 | 46.56 | 64.22 | 67.13 | 225.25 | 350.53 | |
| 4589.5 | 56.55 | 19.50 | 1.17 | 1.70 | 5.47 | 0.08 | 0.95 | 0.78 | 3.99 | 0.10 | 8.90 | 12,910.39 | 46.64 | 69.00 | 63.96 | 226.32 | 305.07 | |||
| 4607.5 | 56.07 | 18.61 | 1.09 | 1.51 | 4.20 | 0.11 | 0.98 | 0.97 | 4.82 | 0.11 | 10.71 | 13,500.94 | 45.60 | 74.20 | 56.71 | 208.48 | 345.06 | |||
| 4622.5 | 59.32 | 17.44 | 1.02 | 1.35 | 4.76 | 0.08 | 0.99 | 0.71 | 4.17 | 0.06 | 8.85 | 17,866.36 | 38.07 | 69.42 | 55.06 | 182.77 | 343.85 | |||
| 4637.5 | 67.63 | 12.89 | 0.69 | 1.16 | 3.59 | 0.06 | 0.82 | 0.65 | 4.04 | 0.05 | 7.31 | 15,575.17 | 33.11 | 52.57 | 44.70 | 135.61 | 273.49 | |||
| 4651.5 | 70.13 | 11.45 | 0.63 | 1.13 | 4.55 | 0.05 | 0.81 | 0.83 | 3.45 | 0.04 | 5.51 | 19,258.10 | 29.95 | 45.07 | 43.15 | 107.94 | 266.14 | |||
| 4662.5 | 63.13 | 14.61 | 1.06 | 1.12 | 6.53 | 0.12 | 0.86 | 1.39 | 4.37 | 0.08 | 5.38 | 18,873.32 | 30.19 | 49.91 | 74.03 | 141.37 | 257.01 | |||
| 4676.5 | 64.01 | 16.07 | 0.96 | 1.17 | 4.24 | 0.09 | 0.91 | 0.95 | 4.76 | 0.06 | 5.71 | 15,645.44 | 32.82 | 60.05 | 49.33 | 166.60 | 227.88 | |||
| HZ-A-8-1 | 4th Wenchang formation | 4422.5 | 67.63 | 16.74 | 1.08 | 1.29 | 6.03 | 0.11 | 0.72 | 0.67 | 3.96 | 0.02 | 1.53 | 5752.65 | 55.58 | 68.74 | 29.48 | 326.41 | 179.94 | |
| 4440.5 | 66.85 | 16.90 | 1.08 | 1.28 | 6.33 | 0.11 | 0.75 | 0.71 | 3.63 | 0.03 | 1.42 | 9010.32 | 47.28 | 69.34 | 37.49 | 287.87 | 231.19 | |||
| 4454.5 | 69.88 | 16.65 | 1.00 | 1.65 | 4.86 | 0.11 | 0.78 | 0.72 | 3.80 | 0.02 | 0.08 | 7925.21 | 44.43 | 69.98 | 37.44 | 303.20 | 207.86 | |||
| 4460.5 | 68.11 | 16.69 | 1.04 | 1.53 | 5.72 | 0.10 | 0.72 | 1.62 | 3.57 | 0.04 | 0.51 | 6442.71 | 40.69 | 64.48 | 30.74 | 325.15 | 191.15 | |||
| 4468.5 | 66.65 | 17.28 | 1.09 | 1.70 | 5.29 | 0.11 | 0.72 | 1.43 | 3.88 | 0.03 | 1.48 | 6414.27 | 46.93 | 68.20 | 36.60 | 300.90 | 196.07 | |||
| 4477.5 | 65.75 | 17.76 | 1.20 | 1.56 | 6.82 | 0.10 | 0.76 | 0.57 | 3.72 | 0.03 | 1.25 | 8129.92 | 43.73 | 72.97 | 34.81 | 272.99 | 216.81 | |||
| 4493.5 | 67.49 | 16.99 | 1.07 | 1.31 | 6.61 | 0.10 | 0.71 | 0.62 | 3.56 | 0.03 | 0.92 | 7273.90 | 45.72 | 68.34 | 30.28 | 302.38 | 199.30 | |||
| 4507.5 | 66.79 | 17.03 | 1.07 | 1.59 | 5.14 | 0.10 | 0.73 | 1.24 | 3.94 | 0.04 | 2.09 | 5419.08 | 44.92 | 73.34 | 28.56 | 314.95 | 179.76 | |||
| 4522.5 | 65.65 | 17.90 | 1.10 | 1.71 | 4.50 | 0.13 | 0.78 | 1.19 | 4.31 | 0.03 | 2.41 | 6220.20 | 52.87 | 77.68 | 35.63 | 302.27 | 197.06 | |||
| 4539.5 | 64.10 | 18.64 | 1.17 | 1.94 | 4.58 | 0.12 | 0.77 | 0.95 | 4.33 | 0.04 | 3.02 | 6737.89 | 46.19 | 76.92 | 40.78 | 286.06 | 203.44 | |||
| 5th Wenchang formation | 4747.5 | 58.07 | 21.44 | 1.54 | 2.03 | 5.87 | 0.16 | 0.87 | 0.93 | 4.48 | 0.08 | 3.67 | 13,309.36 | 44.45 | 59.92 | 62.23 | 168.35 | 339.27 | ||
| 4762.5 | 64.62 | 18.78 | 0.94 | 1.51 | 3.81 | 0.10 | 0.80 | 0.63 | 3.99 | 0.06 | 4.09 | 10,693.17 | 39.57 | 65.05 | 50.33 | 148.75 | 263.11 | |||
| 4777.5 | 67.67 | 18.23 | 0.84 | 1.39 | 4.50 | 0.08 | 0.81 | 0.81 | 3.66 | 0.04 | 1.05 | 13,290.33 | 33.78 | 51.58 | 47.40 | 129.24 | 304.96 | |||
| 4792.5 | 65.63 | 19.23 | 0.85 | 1.39 | 3.61 | 0.10 | 0.79 | 0.60 | 4.00 | 0.08 | 3.08 | 10,488.85 | 38.42 | 59.62 | 47.48 | 135.58 | 254.68 | |||
| 4807.5 | 55.91 | 21.19 | 1.10 | 1.80 | 4.00 | 0.18 | 0.83 | 0.63 | 6.85 | 0.27 | 6.63 | 11,557.92 | 38.39 | 61.24 | 86.90 | 135.94 | 300.17 | |||
| 4822.5 | 62.16 | 18.29 | 1.07 | 1.58 | 4.67 | 0.22 | 0.83 | 0.65 | 5.58 | 0.11 | 3.94 | 14,284.71 | 35.02 | 55.61 | 58.03 | 130.60 | 331.53 | |||
| 4837.5 | 71.72 | 13.08 | 0.72 | 1.25 | 3.45 | 0.07 | 0.71 | 0.54 | 4.71 | 0.04 | 2.74 | 13,486.80 | 32.12 | 45.45 | 54.71 | 107.82 | 273.76 | |||
| 4852.5 | 71.31 | 14.45 | 0.66 | 1.25 | 3.38 | 0.09 | 0.69 | 1.17 | 4.53 | 0.08 | 1.68 | 10,879.56 | 31.97 | 47.46 | 42.98 | 114.96 | 251.44 | |||
| 4865.5 | 67.59 | 15.45 | 0.98 | 1.45 | 4.23 | 0.12 | 0.77 | 1.26 | 4.42 | 0.05 | 2.78 | 13,215.40 | 34.49 | 49.06 | 45.91 | 137.61 | 286.58 |
| Sub-Sag | Well Number | Strata | Depth | 7Li | 9Be | 47Ti | 51V | 52Cr | 59Co | 60Ni | 63Cu | 66Zn | 71Ga | 85Rb | 88Sr | 90Zr | 93Nb | 95Mo | 114Cd | 115In | 121Sb | 133Cs | 137Ba | 178Hf | 181Ta | 184W | 185Re | 205Tl | 208Pb | 209Bi | 238U |
|---|---|---|---|---|---|---|---|---|---|---|---|---|---|---|---|---|---|---|---|---|---|---|---|---|---|---|---|---|---|---|---|
| m | μg/g | μg/g | μg/g | μg/g | μg/g | μg/g | μg/g | μg/g | μg/g | μg/g | μg/g | μg/g | μg/g | μg/g | μg/g | μg/g | μg/g | μg/g | μg/g | μg/g | μg/g | μg/g | μg/g | μg/g | μg/g | μg/g | μg/g | μg/g | |||
| XJ-A | XJ-A-2-1A | 1st + 2nd Enping formation | 4089.5 | 59.52 | 3.27 | 4191.13 | 83.17 | 134.64 | 20.50 | 69.35 | 2488.00 | 3216.25 | 19.22 | 154.78 | 136.22 | 105.76 | 19.01 | 7.17 | 0.82 | 0.12 | 10.26 | 17.34 | 4512.57 | 3.24 | 1.96 | 113.47 | 0.01 | 1.03 | 3545.21 | 3.05 | 4.26 |
| 4120.5 | 44.60 | 2.72 | 3807.66 | 69.14 | 89.94 | 14.67 | 43.01 | 1125.17 | 1007.35 | 17.77 | 142.99 | 103.09 | 116.22 | 18.82 | 3.21 | 0.36 | 0.08 | 3.11 | 14.63 | 2890.14 | 3.18 | 1.80 | 28.37 | 0.00 | 0.98 | 453.28 | 1.28 | 4.24 | |||
| 4153.5 | 56.75 | 3.78 | 3482.86 | 70.88 | 72.54 | 11.52 | 33.26 | 732.27 | 653.06 | 18.35 | 149.09 | 103.07 | 90.92 | 17.51 | 1.71 | 0.28 | 0.09 | 2.19 | 17.55 | 2177.12 | 2.92 | 1.54 | 12.04 | 0.00 | 1.08 | 176.18 | 1.16 | 3.98 | |||
| 4188.5 | 51.54 | 2.03 | 3163.95 | 60.59 | 37.43 | 11.74 | 25.01 | 62.67 | 174.66 | 17.11 | 135.60 | 147.58 | 82.14 | 16.94 | 1.14 | 0.35 | 0.06 | 1.89 | 16.17 | 2676.87 | 2.60 | 1.42 | 10.63 | 0.00 | 0.88 | 83.05 | 0.83 | 4.10 | |||
| 4227.5 | 36.87 | 1.99 | 3104.91 | 54.42 | 41.20 | 10.43 | 28.25 | 1032.76 | 817.30 | 15.99 | 129.49 | 88.95 | 100.30 | 16.94 | 2.24 | 0.35 | 0.05 | 2.00 | 12.78 | 1532.69 | 2.93 | 1.51 | 12.03 | 0.00 | 0.86 | 134.59 | 0.85 | 3.70 | |||
| 4271.5 | 48.49 | 2.53 | 3413.45 | 62.57 | 45.99 | 11.33 | 24.91 | 46.18 | 190.61 | 17.52 | 136.24 | 97.24 | 90.86 | 17.54 | 1.43 | 0.41 | 0.07 | 1.78 | 16.15 | 2566.34 | 2.93 | 1.57 | 10.62 | 0.00 | 0.76 | 81.48 | 0.82 | 4.44 | |||
| 4302.5 | 58.14 | 3.74 | 3350.27 | 68.60 | 76.39 | 12.74 | 33.62 | 1250.94 | 1004.75 | 18.46 | 142.97 | 110.95 | 88.03 | 17.17 | 2.30 | 0.53 | 0.07 | 2.73 | 16.25 | 2128.30 | 2.93 | 1.59 | 13.01 | 0.00 | 0.94 | 154.35 | 1.03 | 4.78 | |||
| 4333.5 | 35.01 | 2.40 | 3140.96 | 50.60 | 37.04 | 11.34 | 27.38 | 1240.92 | 1035.99 | 15.78 | 122.55 | 74.26 | 102.17 | 16.11 | 1.14 | 0.34 | 0.05 | 1.95 | 10.67 | 573.35 | 3.08 | 1.40 | 10.96 | 0.00 | 0.85 | 117.96 | 0.78 | 3.84 | |||
| 4356.5 | 39.87 | 2.53 | 2957.58 | 55.71 | 57.84 | 10.20 | 23.88 | 786.93 | 648.13 | 15.61 | 120.90 | 208.68 | 65.33 | 16.24 | 1.35 | 0.45 | 0.04 | 2.70 | 12.18 | 9826.69 | 2.13 | 1.44 | 13.03 | 0.00 | 0.82 | 105.44 | 0.76 | 3.85 | |||
| 4389.5 | 44.44 | 2.55 | 3161.80 | 60.50 | 67.67 | 10.49 | 28.07 | 895.43 | 743.26 | 16.98 | 138.30 | 217.57 | 64.35 | 17.32 | 2.42 | 0.46 | 0.05 | 2.99 | 13.43 | 10,671.40 | 2.15 | 1.56 | 7.12 | 0.00 | 0.95 | 177.96 | 0.88 | 4.48 | |||
| 3rd Enping formation | 4419.5 | 54.58 | 3.20 | 3623.07 | 69.01 | 77.61 | 12.49 | 42.05 | 2796.82 | 2061.21 | 18.74 | 146.89 | 91.39 | 94.69 | 18.44 | 2.42 | 0.68 | 0.08 | 3.45 | 14.77 | 735.07 | 3.01 | 1.67 | 8.15 | 0.00 | 1.20 | 202.56 | 1.20 | 4.29 | ||
| 4446.5 | 57.07 | 2.60 | 3504.05 | 60.50 | 69.41 | 11.01 | 42.05 | 3221.16 | 2307.90 | 17.26 | 134.28 | 98.40 | 90.44 | 17.53 | 1.75 | 0.74 | 0.08 | 3.23 | 13.56 | 781.09 | 3.00 | 1.57 | 6.50 | 0.00 | 0.91 | 203.45 | 1.81 | 4.36 | |||
| 4480.5 | 56.75 | 2.60 | 3087.44 | 92.51 | 143.19 | 15.50 | 53.11 | 1859.66 | 1582.40 | 17.38 | 127.50 | 122.52 | 87.29 | 16.39 | 19.25 | 0.63 | 0.08 | 4.95 | 15.23 | 1583.75 | 2.66 | 1.53 | 25.00 | 0.00 | 1.19 | 393.10 | 1.43 | 4.53 | |||
| 4509.5 | 47.65 | 2.53 | 3247.81 | 60.68 | 49.83 | 13.94 | 45.31 | 2361.61 | 1737.75 | 17.02 | 130.44 | 78.92 | 84.64 | 16.03 | 3.45 | 0.52 | 0.07 | 2.88 | 13.99 | 645.74 | 2.69 | 1.49 | 13.65 | 0.00 | 0.99 | 170.22 | 1.10 | 3.72 | |||
| 4544.5 | 47.71 | 2.98 | 3168.64 | 60.77 | 69.85 | 15.87 | 52.76 | 2863.18 | 2046.10 | 16.96 | 133.39 | 79.37 | 78.95 | 16.22 | 5.82 | 0.71 | 0.09 | 3.41 | 13.81 | 517.57 | 2.53 | 1.52 | 19.04 | 0.00 | 0.93 | 229.14 | 1.28 | 3.85 | |||
| 4572.5 | 51.96 | 2.32 | 3249.38 | 61.99 | 48.06 | 16.43 | 44.39 | 2477.43 | 2138.68 | 17.37 | 134.05 | 81.98 | 79.60 | 16.17 | 4.56 | 0.54 | 0.06 | 3.01 | 14.56 | 705.93 | 2.34 | 1.47 | 20.53 | 0.00 | 0.91 | 260.96 | 1.16 | 3.66 | |||
| 4593.5 | 61.33 | 2.82 | 3467.80 | 63.57 | 70.88 | 13.17 | 49.09 | 3648.56 | 3357.59 | 20.21 | 159.95 | 84.63 | 74.51 | 19.00 | 2.69 | 0.83 | 0.10 | 3.43 | 16.15 | 1362.26 | 2.36 | 1.83 | 11.49 | 0.00 | 1.15 | 328.62 | 1.62 | 6.16 | |||
| 4622.5 | 45.88 | 2.20 | 2815.37 | 49.77 | 40.04 | 12.03 | 51.67 | 5118.51 | 3685.70 | 15.29 | 122.09 | 80.21 | 74.96 | 14.48 | 1.55 | 0.83 | 0.08 | 3.84 | 11.11 | 595.70 | 2.24 | 1.57 | 18.38 | 0.00 | 0.97 | 343.02 | 1.58 | 3.43 | |||
| 4655.5 | 47.41 | 2.83 | 3292.75 | 58.19 | 106.82 | 12.09 | 49.66 | 3769.30 | 2860.17 | 16.94 | 130.74 | 75.21 | 86.03 | 16.23 | 1.77 | 0.72 | 0.07 | 3.27 | 13.06 | 554.17 | 2.38 | 1.57 | 9.67 | 0.00 | 0.95 | 271.11 | 1.39 | 3.60 | |||
| 4691.5 | 68.45 | 4.16 | 3565.26 | 66.73 | 81.28 | 12.97 | 48.35 | 3897.75 | 2756.81 | 20.19 | 153.62 | 77.58 | 75.95 | 18.87 | 2.06 | 0.75 | 0.06 | 3.43 | 14.18 | 518.15 | 2.46 | 1.82 | 9.17 | 0.00 | 1.12 | 275.10 | 1.46 | 5.59 | |||
| XJ-A-1-1 | 2nd Wenchang formation | 4450.5 | 55.56 | 3.67 | 2475.74 | 40.88 | 36.92 | 8.32 | 18.44 | 1135.08 | 884.34 | 17.76 | 198.28 | 394.96 | 58.35 | 16.87 | 1.44 | 0.38 | 0.05 | 3.08 | 9.61 | 28,029.23 | 2.31 | 1.71 | 5.16 | 0.00 | 1.73 | 265.39 | 0.88 | 6.60 | |
| 4495.5 | 70.10 | 2.95 | 2133.90 | 34.47 | 18.57 | 6.02 | 11.63 | 565.08 | 475.21 | 18.93 | 203.09 | 508.47 | 44.54 | 17.09 | 0.97 | 0.19 | 0.05 | 3.84 | 6.63 | 35,189.47 | 1.75 | 1.96 | 5.83 | 0.00 | 1.37 | 262.27 | 0.88 | 7.62 | |||
| 4576.5 | 79.43 | 3.49 | 2525.32 | 33.52 | 18.59 | 6.44 | 10.76 | 479.49 | 403.18 | 22.26 | 214.91 | 302.32 | 80.47 | 21.39 | 1.18 | 0.32 | 0.05 | 2.87 | 10.28 | 19,324.62 | 2.96 | 1.84 | 6.84 | 0.00 | 1.35 | 179.05 | 0.44 | 6.37 | |||
| 4626.5 | 191.41 | 2.63 | 1002.99 | 12.24 | 13.70 | 2.53 | 27.42 | 3377.58 | 2469.61 | 17.31 | 225.10 | 279.88 | 62.21 | 17.13 | 1.75 | 0.53 | 0.05 | 3.93 | 8.86 | 19,538.10 | 2.88 | 2.83 | 9.13 | 0.00 | 1.51 | 358.74 | 1.34 | 10.06 | |||
| 4674.5 | 261.70 | 3.51 | 1136.16 | 14.67 | 14.61 | 2.66 | 25.28 | 1963.77 | 1459.35 | 18.80 | 307.44 | 342.32 | 54.32 | 18.57 | 1.12 | 0.35 | 0.05 | 3.35 | 11.23 | 24,226.91 | 2.56 | 3.17 | 9.09 | 0.00 | 2.00 | 294.68 | 1.28 | 11.95 | |||
| EP-A | EP-A-3-1 | Enping formation | 3511.75 | 66.94 | 3.46 | 2955.94 | 47.86 | 23.73 | 11.08 | 79.98 | 3290.23 | 2654.33 | 20.02 | 211.25 | 242.17 | 60.76 | 20.66 | 1.55 | 0.88 | 0.13 | 3.95 | 12.47 | 10,544.04 | 1.99 | 2.26 | 34.34 | 0.00 | 1.58 | 389.22 | 1.68 | 8.26 |
| 3577.75 | 55.88 | 2.85 | 2922.10 | 51.52 | 29.71 | 11.56 | 39.09 | 1379.15 | 1142.04 | 18.17 | 188.74 | 150.79 | 74.17 | 17.96 | 1.29 | 0.46 | 0.18 | 2.37 | 16.58 | 4951.43 | 2.37 | 1.74 | 25.19 | 0.00 | 1.52 | 201.80 | 1.20 | 5.55 | |||
| 3650.5 | 70.04 | 4.03 | 3071.86 | 50.41 | 26.93 | 11.83 | 28.84 | 39.32 | 614.59 | 20.75 | 225.67 | 197.03 | 67.47 | 21.26 | 0.82 | 0.38 | 0.14 | 1.91 | 16.36 | 7721.85 | 2.02 | 2.20 | 20.41 | 0.00 | 1.60 | 132.24 | 1.26 | 7.77 | |||
| 3715 | 61.77 | 3.02 | 2922.17 | 47.63 | 46.21 | 11.11 | 63.93 | 26.31 | 389.99 | 19.55 | 210.78 | 287.11 | 56.20 | 21.93 | 0.92 | 0.43 | 0.12 | 2.76 | 12.16 | 13,090.99 | 2.07 | 2.24 | 31.84 | 0.00 | 1.59 | 180.61 | 1.15 | 7.44 | |||
| 3791.5 | 27.50 | 2.16 | 2856.94 | 78.13 | 55.67 | 14.95 | 26.96 | 702.08 | 827.69 | 15.80 | 61.88 | 502.24 | 82.20 | 10.30 | 3.22 | 0.93 | 0.07 | 3.72 | 4.54 | 38,039.30 | 2.18 | 0.78 | 4.91 | 0.00 | 0.90 | 192.71 | 0.55 | 2.80 | |||
| Wenchang formation | 4755.5 | 34.30 | 2.86 | 2266.34 | 52.02 | 43.98 | 8.97 | 20.07 | 543.28 | 3342.73 | 17.74 | 134.12 | 1472.17 | 50.07 | 13.83 | 2.80 | 8.27 | 0.16 | 16.81 | 14.71 | 97,633.39 | 2.02 | 1.53 | 12.28 | 0.00 | 3.05 | 1262.23 | 1.10 | 6.58 | ||
| 4775.5 | 36.65 | 2.52 | 2189.02 | 45.55 | 31.86 | 8.46 | 18.61 | 45.89 | 1324.88 | 18.41 | 152.44 | 1425.83 | 62.84 | 14.56 | 2.00 | 6.80 | 0.13 | 16.03 | 16.09 | 92,450.57 | 2.02 | 1.65 | 16.04 | 0.00 | 3.20 | 1075.36 | 1.13 | 7.74 | |||
| 4812.5 | 30.63 | 3.04 | 2090.39 | 43.26 | 30.09 | 7.89 | 16.22 | 42.31 | 1206.70 | 18.52 | 138.30 | 1758.21 | 50.49 | 14.62 | 2.14 | 7.94 | 0.13 | 19.82 | 14.63 | 112,973.93 | 1.99 | 1.63 | 13.40 | 0.00 | 3.64 | 1292.12 | 1.10 | 7.39 | |||
| 4816.5 | 31.59 | 2.94 | 2024.22 | 43.16 | 24.94 | 7.83 | 16.44 | 270.13 | 1794.51 | 18.03 | 131.02 | 1675.56 | 31.47 | 14.62 | 2.35 | 9.25 | 0.17 | 18.28 | 13.60 | 72,285.23 | 1.38 | 1.59 | 12.98 | 0.00 | 3.32 | 1223.51 | 1.10 | 6.28 | |||
| 4822.5 | 26.03 | 2.40 | 1902.42 | 39.79 | 26.00 | 8.12 | 20.11 | 520.30 | 1665.80 | 18.20 | 132.40 | 1932.37 | 29.77 | 13.90 | 2.28 | 10.58 | 0.12 | 20.16 | 11.82 | 89,662.88 | 1.27 | 1.53 | 14.36 | 0.00 | 3.27 | 1300.61 | 1.08 | 6.82 | |||
| 4829.5 | 31.16 | 2.31 | 2269.42 | 44.56 | 23.07 | 8.32 | 17.71 | 589.11 | 2158.58 | 20.04 | 144.52 | 1800.01 | 36.80 | 15.28 | 2.01 | 9.04 | 0.18 | 19.40 | 12.44 | 89,297.23 | 1.37 | 1.61 | 18.38 | 0.00 | 3.15 | 1217.90 | 1.18 | 7.18 | |||
| HZ-A | HZ-A-1-3 | Wenchang formation | 3807.5 | 19.49 | 1.24 | 2895.91 | 58.67 | 32.06 | 9.09 | 20.35 | 782.35 | 705.32 | 17.29 | 83.62 | 673.38 | 85.16 | 12.71 | 1.05 | 0.77 | 0.05 | 4.22 | 6.83 | 52,709.55 | 2.76 | 1.00 | 3.70 | 0.00 | 0.87 | 204.21 | 0.43 | 2.83 |
| 3817.5 | 17.92 | 0.67 | 2327.78 | 56.07 | 26.56 | 8.67 | 18.31 | 464.17 | 410.74 | 13.84 | 62.45 | 849.74 | 84.46 | 9.22 | 1.42 | 1.30 | 0.04 | 3.80 | 5.90 | 55,885.54 | 2.43 | 0.70 | 3.61 | 0.00 | 0.93 | 151.91 | 0.44 | 2.65 | |||
| 3825.5 | 17.01 | 1.29 | 2161.99 | 56.32 | 33.34 | 8.95 | 17.66 | 480.31 | 411.15 | 12.75 | 52.93 | 675.40 | 65.81 | 8.01 | 1.48 | 0.53 | 0.03 | 3.63 | 5.41 | 48,515.07 | 2.17 | 0.60 | 4.29 | 0.00 | 0.89 | 143.36 | 0.37 | 2.20 | |||
| 3837.5 | 16.86 | 1.43 | 1892.05 | 51.19 | 29.60 | 7.32 | 16.05 | 552.91 | 454.20 | 11.81 | 54.59 | 686.40 | 53.38 | 7.18 | 1.52 | 0.43 | 0.03 | 3.41 | 4.20 | 49,513.43 | 1.67 | 0.55 | 3.44 | 0.00 | 0.91 | 145.91 | 0.31 | 1.88 | |||
| 3855.5 | 19.63 | 0.89 | 2172.80 | 64.16 | 27.94 | 9.54 | 17.15 | 475.80 | 411.76 | 13.51 | 53.59 | 764.24 | 59.59 | 7.32 | 1.71 | 0.64 | 0.04 | 3.75 | 5.38 | 54,322.38 | 2.03 | 0.55 | 3.81 | 0.00 | 1.02 | 154.81 | 0.38 | 2.09 | |||
| 3867.5 | 25.22 | 1.06 | 2553.16 | 63.60 | 30.19 | 10.40 | 19.92 | 738.90 | 587.94 | 15.00 | 57.26 | 672.67 | 73.40 | 8.62 | 1.50 | 0.50 | 0.04 | 4.08 | 6.09 | 45,295.40 | 2.34 | 0.64 | 3.76 | 0.00 | 0.70 | 143.59 | 0.45 | 2.20 | |||
| 3880.5 | 22.52 | 1.61 | 2713.66 | 64.21 | 30.40 | 10.85 | 20.61 | 543.76 | 467.17 | 16.31 | 61.08 | 797.19 | 80.90 | 9.25 | 1.41 | 0.50 | 0.04 | 4.14 | 7.05 | 51,396.29 | 2.64 | 0.69 | 4.07 | 0.00 | 0.75 | 143.20 | 0.97 | 2.34 | |||
| 3894.5 | 20.04 | 0.90 | 2235.80 | 53.64 | 30.05 | 9.66 | 18.28 | 363.92 | 340.56 | 13.05 | 54.01 | 844.33 | 72.21 | 7.74 | 1.15 | 0.64 | 0.05 | 4.27 | 6.16 | 55,914.59 | 2.31 | 0.58 | 3.67 | 0.00 | 0.87 | 149.19 | 0.34 | 1.95 | |||
| HZ-A-5-1 | 5th Wenchang formation | 4578.5 | 19.97 | 1.55 | 3183.77 | 70.24 | 38.92 | 22.70 | 26.13 | 500.21 | 419.11 | 16.27 | 52.65 | 391.47 | 81.20 | 9.49 | 1.47 | 0.41 | 0.04 | 2.71 | 3.18 | 25,823.46 | 2.41 | 0.62 | 2.39 | 0.00 | 0.98 | 101.75 | 0.39 | 2.24 | |
| 4589.5 | 24.19 | 1.26 | 3800.38 | 84.33 | 48.52 | 24.00 | 30.27 | 602.51 | 483.98 | 19.96 | 58.88 | 361.14 | 98.62 | 11.04 | 1.64 | 0.44 | 0.05 | 2.43 | 3.90 | 20,432.92 | 2.83 | 0.71 | 2.54 | 0.00 | 0.74 | 99.97 | 0.44 | 2.64 | |||
| 4607.5 | 29.24 | 1.45 | 3858.87 | 93.27 | 57.36 | 17.56 | 33.10 | 883.52 | 719.05 | 19.89 | 61.83 | 458.61 | 84.27 | 12.28 | 3.15 | 0.45 | 0.06 | 3.05 | 4.61 | 25,751.29 | 2.56 | 0.81 | 3.11 | 0.00 | 0.78 | 119.46 | 0.51 | 2.76 | |||
| 4622.5 | 24.36 | 2.41 | 2910.75 | 82.82 | 53.62 | 12.14 | 27.05 | 583.26 | 461.00 | 16.93 | 58.22 | 533.91 | 80.86 | 10.70 | 3.48 | 0.35 | 0.04 | 3.96 | 5.09 | 40,233.46 | 2.62 | 0.74 | 3.53 | 0.00 | 0.87 | 113.05 | 0.45 | 3.19 | |||
| 4637.5 | 17.52 | 1.06 | 2155.80 | 75.13 | 53.84 | 9.93 | 21.97 | 436.48 | 368.24 | 12.58 | 47.62 | 564.51 | 59.59 | 7.95 | 4.93 | 0.33 | 0.04 | 4.19 | 3.64 | 48,646.01 | 1.93 | 0.52 | 3.93 | 0.00 | 0.84 | 106.41 | 0.34 | 2.41 | |||
| 4651.5 | 17.01 | 1.62 | 1774.47 | 65.36 | 50.98 | 9.22 | 20.94 | 632.58 | 496.89 | 10.99 | 42.31 | 598.80 | 48.34 | 7.47 | 4.54 | 0.41 | 0.04 | 4.82 | 2.99 | 54,757.42 | 1.54 | 0.46 | 3.26 | 0.00 | 0.74 | 130.64 | 0.36 | 1.85 | |||
| 4662.5 | 19.63 | 1.55 | 2237.33 | 73.80 | 55.09 | 10.52 | 20.58 | 525.18 | 419.75 | 12.02 | 45.23 | 458.35 | 71.50 | 7.49 | 4.16 | 0.33 | 0.03 | 4.26 | 3.80 | 40,364.07 | 2.23 | 0.52 | 3.44 | 0.00 | 0.69 | 101.68 | 0.33 | 2.11 | |||
| 4676.5 | 17.57 | 0.87 | 2391.17 | 79.19 | 66.92 | 11.36 | 23.38 | 394.07 | 351.15 | 13.77 | 55.44 | 542.26 | 88.64 | 9.03 | 3.12 | 0.38 | 0.05 | 4.36 | 6.22 | 49,995.83 | 2.82 | 0.63 | 4.08 | 0.00 | 0.71 | 102.64 | 0.38 | 2.69 | |||
| HZ-A-8-1 | 4th Wenchang formation | 4422.5 | 33.73 | 2.37 | 2848.50 | 54.47 | 64.70 | 9.81 | 21.90 | 332.12 | 303.31 | 14.35 | 108.93 | 211.23 | 62.00 | 16.20 | 1.02 | 0.66 | 0.04 | 2.71 | 13.63 | 9044.49 | 2.16 | 1.32 | 4.08 | 0.00 | 0.79 | 66.46 | 0.77 | 3.42 | |
| 4440.5 | 35.15 | 1.97 | 2916.41 | 52.49 | 64.63 | 9.20 | 21.81 | 407.95 | 342.70 | 13.26 | 100.50 | 260.62 | 65.98 | 14.81 | 0.99 | 0.41 | 0.05 | 2.98 | 11.93 | 11,894.21 | 2.13 | 1.25 | 4.18 | 0.00 | 0.71 | 70.33 | 0.71 | 3.19 | |||
| 4454.5 | 28.83 | 2.72 | 2610.37 | 47.82 | 59.42 | 8.40 | 20.18 | 430.18 | 357.29 | 12.35 | 94.52 | 251.85 | 54.87 | 13.59 | 0.88 | 0.39 | 0.05 | 2.69 | 11.08 | 11,299.31 | 2.20 | 1.26 | 3.65 | 0.00 | 0.68 | 68.79 | 0.64 | 3.00 | |||
| 4460.5 | 33.21 | 1.63 | 2908.65 | 52.07 | 66.25 | 9.03 | 23.44 | 720.16 | 546.81 | 13.73 | 100.44 | 187.99 | 55.42 | 14.95 | 0.88 | 0.48 | 0.04 | 2.66 | 12.22 | 7543.72 | 1.92 | 1.29 | 3.69 | 0.00 | 0.71 | 82.41 | 0.69 | 3.19 | |||
| 4468.5 | 32.58 | 2.21 | 2816.59 | 52.28 | 43.18 | 9.17 | 21.87 | 577.54 | 464.46 | 13.45 | 98.04 | 203.77 | 59.47 | 14.17 | 0.86 | 0.48 | 0.03 | 2.58 | 11.87 | 8387.12 | 2.00 | 1.20 | 3.62 | 0.00 | 0.70 | 75.72 | 0.65 | 3.18 | |||
| 4477.5 | 40.45 | 3.51 | 3190.43 | 61.28 | 78.68 | 10.04 | 24.82 | 557.20 | 452.57 | 15.30 | 114.00 | 232.95 | 64.94 | 16.60 | 1.13 | 0.51 | 0.05 | 3.00 | 14.80 | 9745.63 | 2.15 | 1.38 | 4.31 | 0.00 | 0.80 | 83.68 | 0.80 | 3.56 | |||
| 4493.5 | 32.53 | 1.93 | 2935.91 | 54.62 | 92.22 | 9.08 | 24.75 | 541.80 | 430.17 | 14.41 | 108.84 | 209.38 | 78.13 | 15.59 | 0.96 | 0.53 | 0.03 | 2.91 | 13.29 | 8473.07 | 2.38 | 1.37 | 4.08 | 0.00 | 0.76 | 77.96 | 0.76 | 3.86 | |||
| 4507.5 | 38.32 | 2.22 | 3302.68 | 60.05 | 121.29 | 10.18 | 27.73 | 464.30 | 391.84 | 15.06 | 111.62 | 200.80 | 71.24 | 16.58 | 0.95 | 0.47 | 0.05 | 2.62 | 13.60 | 8085.52 | 2.05 | 1.43 | 4.11 | 0.00 | 0.77 | 69.31 | 0.69 | 3.58 | |||
| 4522.5 | 39.67 | 2.15 | 3167.64 | 61.71 | 73.14 | 10.33 | 26.82 | 617.13 | 503.66 | 15.46 | 111.26 | 253.24 | 61.86 | 15.95 | 0.99 | 0.63 | 0.05 | 2.88 | 13.92 | 11,212.26 | 1.99 | 1.36 | 4.05 | 0.00 | 0.79 | 80.90 | 0.99 | 3.45 | |||
| 4539.5 | 36.93 | 2.47 | 2813.45 | 58.14 | 63.19 | 10.17 | 24.12 | 358.58 | 317.97 | 14.48 | 101.74 | 237.82 | 63.07 | 13.50 | 0.96 | 0.52 | 0.04 | 2.57 | 12.94 | 10,268.86 | 1.82 | 1.11 | 3.55 | 0.00 | 0.73 | 65.82 | 0.69 | 3.57 | |||
| 5th Wenchang formation | 4747.5 | 31.68 | 2.09 | 2601.98 | 62.53 | 60.95 | 10.98 | 22.88 | 57.29 | 117.83 | 15.48 | 63.74 | 629.60 | 60.74 | 10.97 | 1.41 | 0.74 | 0.04 | 3.10 | 6.24 | 34,130.03 | 2.06 | 0.77 | 3.16 | 0.00 | 0.49 | 63.38 | 0.50 | 3.09 | ||
| 4762.5 | 23.60 | 1.73 | 2553.79 | 69.13 | 67.71 | 10.64 | 24.09 | 302.88 | 302.35 | 15.67 | 57.22 | 572.55 | 66.42 | 10.99 | 2.21 | 0.47 | 0.05 | 3.13 | 5.16 | 30,616.58 | 2.05 | 0.76 | 2.93 | 0.00 | 0.50 | 73.84 | 0.52 | 3.46 | |||
| 4777.5 | 23.67 | 2.08 | 2396.35 | 67.62 | 47.34 | 9.78 | 19.52 | 258.93 | 257.87 | 13.85 | 51.64 | 579.20 | 48.62 | 10.28 | 2.11 | 0.66 | 0.04 | 3.32 | 4.75 | 32,725.92 | 1.74 | 0.69 | 2.95 | 0.00 | 0.50 | 71.18 | 0.50 | 2.75 | |||
| 4792.5 | 22.99 | 1.94 | 2502.50 | 73.05 | 47.50 | 11.58 | 23.88 | 429.84 | 366.22 | 14.79 | 54.26 | 430.33 | 46.84 | 11.04 | 2.93 | 0.42 | 0.05 | 2.90 | 4.67 | 30,250.47 | 1.68 | 0.71 | 3.16 | 0.00 | 0.56 | 80.55 | 0.58 | 1.99 | |||
| 4807.5 | 22.80 | 2.94 | 2645.83 | 76.54 | 47.95 | 12.67 | 23.58 | 370.65 | 333.28 | 15.83 | 61.52 | 531.24 | 53.68 | 12.62 | 3.03 | 0.48 | 0.05 | 3.42 | 5.04 | 35,097.94 | 1.69 | 0.83 | 3.46 | 0.00 | 0.64 | 83.58 | 0.55 | 2.41 | |||
| 4822.5 | 22.22 | 2.16 | 2428.93 | 79.68 | 53.51 | 11.57 | 22.90 | 331.43 | 316.23 | 15.30 | 60.32 | 654.78 | 58.54 | 11.11 | 3.15 | 0.57 | 0.04 | 3.64 | 5.77 | 35,611.29 | 2.17 | 0.76 | 4.18 | 0.00 | 0.63 | 86.92 | 0.45 | 3.05 | |||
| 4837.5 | 20.87 | 1.69 | 1900.00 | 68.80 | 40.54 | 8.39 | 18.67 | 339.91 | 285.55 | 10.99 | 52.87 | 575.41 | 37.10 | 9.78 | 5.20 | 0.50 | 0.03 | 3.96 | 4.72 | 34,867.84 | 1.33 | 0.57 | 4.11 | 0.00 | 0.78 | 87.06 | 0.34 | 1.69 | |||
| 4852.5 | 25.13 | 1.33 | 2445.76 | 74.56 | 43.01 | 9.46 | 21.39 | 586.03 | 445.05 | 12.85 | 50.52 | 493.50 | 48.90 | 10.38 | 3.66 | 0.38 | 0.04 | 3.60 | 5.11 | 29,281.12 | 1.63 | 0.64 | 3.96 | 0.00 | 0.53 | 86.28 | 0.44 | 1.75 | |||
| 4865.5 | 17.08 | 0.74 | 2015.21 | 58.79 | 43.30 | 8.82 | 19.42 | 395.07 | 355.56 | 12.07 | 51.76 | 591.42 | 56.74 | 8.89 | 3.37 | 0.33 | 0.03 | 5.30 | 6.73 | 32,999.14 | 1.91 | 0.60 | 3.57 | 0.00 | 0.52 | 76.77 | 0.32 | 2.10 |
| Sub-Sag | Well Number | Strata | Depth | Abs/AU | |||||||||
|---|---|---|---|---|---|---|---|---|---|---|---|---|---|
| m | 3050 | 2920 | 2850 | 1700 | 1600 | 1460 | 880 | 810 | 750 | 720 | |||
| XJ-A | XJ-A-2-1A | 1st + 2nd Enping formation | 4188.50 | 0 | 7.541 | 1.44 | 3.135 | 59.48 | 10.36 | 1.11 | 1.8 | 0.83 | 0 |
| 4356.50 | 0 | 4.866 | 0.858 | 11.28 | 33.53 | 9.427 | 1.98 | 1.06 | 1.11 | 0 | |||
| 4389.50 | 0 | 8.64 | 1.067 | 11.93 | 48.49 | 12.25 | 2.48 | 1.44 | 1.37 | 0 | |||
| 3rd Enping formation | 4572.50 | 0 | 13.83 | 3.891 | 3.308 | 82.2 | 21.22 | 1.96 | 2.23 | 1.19 | 0 | ||
| 4593.50 | 0 | 8.465 | 2.075 | 3.997 | 79.73 | 16.55 | 3.19 | 2.73 | 2.24 | 0 | |||
| 4655.50 | 0 | 12.4 | 1.665 | 2.771 | 66.84 | 11.9 | 2.14 | 2.17 | 1.67 | 0 | |||
| XJ-A-1-1 | 2nd Wenchang formation | 4450.50 | 0 | 10.92 | 3.363 | 17.83 | 53.82 | 19.83 | 3.01 | 1.77 | 1.16 | 0 | |
| 4626.50 | 0 | 0.85 | 0.196 | 3.584 | 4.422 | 0.955 | 0 | 0 | 0 | 0 | |||
| 4674.50 | 0 | 0.867 | 0.196 | 6.125 | 5.166 | 1.493 | 0 | 0 | 0 | 0 | |||
| EP-A | EP-A-3-1 | 1st + 2nd Enping formation | 3577.75 | 0 | 0.833 | 0.165 | 0.611 | 6.335 | 0.832 | 0.11 | 0.18 | 0.05 | 0 |
| 3791.50 | 0 | 2.338 | 0.51 | 1.488 | 8.017 | 1.836 | 0.4 | 0.33 | 0.21 | 0 | |||
| 3rd Enping formation | 4755.50 | 0 | 0.643 | 0.139 | 0.575 | 4.806 | 0.563 | 0.1 | 0.14 | 0.05 | 0 | ||
| 4775.50 | 0 | 0.378 | 0.053 | 0.47 | 6.145 | 0.317 | 0.08 | 0.08 | 0.04 | 0 | |||
| 4812.50 | 0 | 0.375 | 0.059 | 0.504 | 6.302 | 0.465 | 0.07 | 0.11 | 0.03 | 0 | |||
| 4822.50 | 0 | 0.677 | 0.106 | 0.555 | 7.212 | 0.606 | 0.03 | 0.1 | 0.04 | 0 | |||
| HZ-A | HZ-A-1-3 | 4th Wenchang formation | 3825.50 | 0 | 5.825 | 1.632 | 1.656 | 11.5 | 3.484 | 0.53 | 0.26 | 0.11 | 0 |
| 3880.50 | 0 | 5.014 | 1.465 | 2.044 | 14.06 | 4.123 | 0.86 | 0.35 | 0.15 | 0 | |||
| 3894.50 | 0 | 5.655 | 1.52 | 3.068 | 13.29 | 4.308 | 0.63 | 0.33 | 0.28 | 0 | |||
| HZ-A-5-1 | 5th Wenchang formation | 4578.50 | 0 | 2.235 | 0.515 | 1.751 | 7.471 | 1.612 | 0.47 | 0.18 | 0.13 | 0 | |
| 4607.50 | 0 | 1.47 | 0.39 | 0.646 | 6.067 | 0.965 | 0.41 | 0.19 | 0.17 | 0 | |||
| 4637.50 | 0 | 5.928 | 1.368 | 3.229 | 18.63 | 4.982 | 1.5 | 0.65 | 0.76 | 0 | |||
| HZ-A-8-1 | 4th Wenchang formation | 4422.50 | 0 | 1.416 | 0.208 | 4.043 | 11.23 | 2.915 | 0.69 | 0.2 | 0.22 | 0 | |
| 4440.50 | 0 | 1.586 | 0.26 | 6.767 | 11.38 | 3.956 | 0.63 | 0.16 | 0.42 | 0 | |||
| 4493.50 | 0 | 1.046 | 0.212 | 4.331 | 9.566 | 2.715 | 0.54 | 0.15 | 0.32 | 0 | |||
| 4507.50 | 0 | 1.04 | 0.207 | 3.113 | 11.01 | 1.844 | 0.52 | 0.18 | 0.4 | 0 | |||
| 4522.50 | 0 | 0.886 | 0.169 | 2.639 | 9.702 | 1.672 | 0.41 | 0.14 | 0.13 | 0 | |||
| 5th Wenchang formation | 4762.50 | 0 | 1.495 | 0.341 | 2.6 | 10.72 | 1.795 | 0.83 | 0.37 | 0.4 | 0 | ||
| 4792.50 | 0 | 0.664 | 0.15 | 0.82 | 6.413 | 0.636 | 0.33 | 0.2 | 0.15 | 0 | |||
| 4822.50 | 0 | 1.428 | 0.233 | 1.454 | 10.53 | 1.982 | 0.95 | 0.46 | 0.48 | 0 | |||
| 4852.50 | 0 | 0.922 | 0.164 | 1.866 | 7.925 | 1.252 | 0.59 | 0.32 | 0.37 | 0 | |||
| Sub-Sag | Well Number | Strata | Depth | Sapropelinite | Exinite | Vitrinite | Inertinite |
|---|---|---|---|---|---|---|---|
| m | |||||||
| XJ-A | XJ-A-2-1A | 1st + 2nd Enping formation | 4188.50 | 93 | 66 | 159 | 86 |
| 4356.50 | 116 | 85 | 201 | 70 | |||
| 4389.50 | 121 | 81 | 26 | 72 | |||
| 3rd Enping formation | 4572.50 | 133 | 66 | 199 | 71 | ||
| 4593.50 | 126 | 76 | 202 | 70 | |||
| 4655.50 | 130 | 66 | 196 | 78 | |||
| XJ-A-1-1 | 2nd Wenchang formation | 4450.50 | 92 | 78 | 55 | 75 | |
| 4626.50 | 139 | 65 | 204 | 56 | |||
| 4674.50 | 125 | 74 | 199 | 65 | |||
| EP-A | EP-A-3-1 | 1st + 2nd Enping formation | 3577.75 | 70 | 37 | 93 | 100 |
| 3791.50 | 80 | 70 | 150 | 100 | |||
| 3rd Enping formation | 4755.50 | 135 | 53 | 37 | 75 | ||
| 4775.50 | 130 | 74 | 204 | 66 | |||
| 4812.50 | 132 | 74 | 206 | 77 | |||
| 4822.50 | 122 | 79 | 201 | 72 | |||
| HZ-A | HZ-A-1-3 | 4th Wenchang formation | 3825.50 | 110 | 81 | 30 | 79 |
| 3880.50 | 130 | 54 | 184 | 80 | |||
| 3894.50 | 126 | 66 | 192 | 76 | |||
| HZ-A-5-1 | 5th Wenchang formation | 4578.50 | 120 | 60 | 180 | 90 | |
| 4607.50 | 106 | 74 | 35 | 85 | |||
| 4637.50 | 95 | 70 | 45 | 90 | |||
| HZ-A-8-1 | 4th Wenchang formation | 4422.50 | 107 | 63 | 170 | 80 | |
| 4440.50 | 113 | 83 | 196 | 66 | |||
| 4493.50 | 110 | 70 | 40 | 80 | |||
| 4507.50 | 102 | 71 | 51 | 76 | |||
| 4522.50 | 110 | 64 | 56 | 70 | |||
| 5th Wenchang formation | 4762.50 | 127 | 64 | 38 | 71 | ||
| 4792.50 | 125 | 71 | 196 | 75 | |||
| 4822.50 | 120 | 70 | 190 | 80 | |||
| 4852.50 | 130 | 60 | 190 | 78 |
| Sub-Sag | Well Number | Strata | Depth | 45Sc | 89Y | 139La | 140Ce | 141Pr | 146Nd | 147Sm | 153Eu | 157Gd | 159Tb | 163Dy | 165Ho | 166Er | 169Tm | 172Yb | 175Lu | 232Th |
|---|---|---|---|---|---|---|---|---|---|---|---|---|---|---|---|---|---|---|---|---|
| m | μg/g | μg/g | μg/g | μg/g | μg/g | μg/g | μg/g | μg/g | μg/g | μg/g | μg/g | μg/g | μg/g | μg/g | μg/g | μg/g | μg/g | |||
| XJ-A | XJ-A-2-1A | 1st + 2nd Enping formation | 4089.5 | 10.93 | 23.48 | 45.73 | 85.50 | 10.30 | 36.77 | 6.88 | 1.83 | 6.11 | 0.97 | 4.84 | 0.93 | 2.54 | 0.41 | 2.29 | 0.37 | 22.78 |
| 4120.5 | 10.07 | 26.35 | 46.07 | 86.46 | 10.36 | 36.82 | 6.81 | 1.57 | 6.16 | 0.96 | 5.12 | 0.90 | 2.60 | 0.41 | 2.92 | 0.38 | 22.97 | |||
| 4153.5 | 11.25 | 25.79 | 44.81 | 86.80 | 10.21 | 36.18 | 6.81 | 1.52 | 6.10 | 0.95 | 4.77 | 0.97 | 2.63 | 0.42 | 2.55 | 0.38 | 22.43 | |||
| 4188.5 | 9.66 | 23.03 | 41.67 | 82.85 | 9.39 | 33.76 | 6.31 | 1.47 | 6.31 | 1.16 | 4.81 | 0.87 | 2.96 | 0.51 | 2.21 | 0.35 | 19.63 | |||
| 4227.5 | 9.12 | 21.94 | 45.07 | 86.19 | 10.40 | 36.27 | 6.65 | 1.28 | 5.85 | 0.90 | 4.55 | 0.87 | 2.38 | 0.42 | 2.34 | 0.34 | 21.07 | |||
| 4271.5 | 10.56 | 22.11 | 44.52 | 87.63 | 9.96 | 35.24 | 6.46 | 1.49 | 5.91 | 0.95 | 4.59 | 0.91 | 2.53 | 0.39 | 2.47 | 0.38 | 21.84 | |||
| 4302.5 | 10.58 | 24.71 | 48.76 | 93.34 | 11.01 | 39.02 | 7.20 | 1.50 | 6.48 | 1.01 | 5.59 | 1.13 | 2.83 | 0.43 | 3.12 | 0.38 | 23.18 | |||
| 4333.5 | 8.19 | 21.88 | 50.27 | 93.44 | 11.38 | 41.06 | 7.20 | 1.15 | 6.32 | 0.97 | 4.62 | 0.86 | 2.29 | 0.38 | 2.23 | 0.33 | 24.08 | |||
| 4356.5 | 8.54 | 18.49 | 37.82 | 76.13 | 8.69 | 31.25 | 5.92 | 2.40 | 5.25 | 0.83 | 3.94 | 0.80 | 2.40 | 0.33 | 1.86 | 0.29 | 18.37 | |||
| 4389.5 | 9.60 | 25.85 | 40.77 | 81.56 | 9.18 | 32.56 | 6.51 | 2.68 | 5.84 | 0.90 | 4.25 | 0.82 | 2.20 | 0.34 | 2.02 | 0.31 | 20.36 | |||
| 3rd Enping formation | 4419.5 | 10.78 | 25.57 | 53.35 | 100.07 | 12.30 | 43.38 | 7.97 | 1.36 | 7.25 | 1.10 | 5.14 | 0.98 | 2.69 | 0.44 | 2.36 | 0.36 | 24.05 | ||
| 4446.5 | 10.06 | 23.39 | 48.09 | 93.21 | 10.89 | 39.33 | 7.37 | 1.31 | 6.57 | 1.02 | 6.12 | 1.01 | 2.43 | 0.39 | 2.17 | 0.34 | 21.27 | |||
| 4480.5 | 9.92 | 21.80 | 44.36 | 89.01 | 10.08 | 36.11 | 6.60 | 1.32 | 6.00 | 0.97 | 4.43 | 0.86 | 3.11 | 0.38 | 2.82 | 0.34 | 20.37 | |||
| 4509.5 | 9.59 | 23.76 | 45.94 | 88.48 | 10.29 | 36.23 | 6.59 | 1.20 | 5.93 | 0.94 | 4.50 | 0.87 | 2.34 | 0.37 | 2.24 | 0.33 | 19.94 | |||
| 4544.5 | 9.48 | 25.91 | 48.89 | 91.94 | 11.15 | 39.42 | 7.26 | 1.22 | 6.59 | 1.02 | 5.56 | 0.88 | 2.89 | 0.40 | 2.24 | 0.35 | 21.98 | |||
| 4572.5 | 9.89 | 22.53 | 45.89 | 85.64 | 10.28 | 36.46 | 6.81 | 1.21 | 5.97 | 1.07 | 4.34 | 0.83 | 3.35 | 0.36 | 2.10 | 0.34 | 20.23 | |||
| 4593.5 | 10.70 | 38.37 | 58.32 | 112.69 | 13.12 | 46.12 | 8.58 | 1.46 | 7.91 | 1.23 | 6.05 | 1.16 | 3.17 | 0.50 | 2.79 | 0.44 | 25.80 | |||
| 4622.5 | 8.44 | 22.22 | 42.93 | 86.80 | 9.85 | 35.14 | 6.63 | 1.17 | 6.02 | 1.12 | 5.28 | 1.04 | 2.28 | 0.37 | 2.11 | 0.30 | 18.43 | |||
| 4655.5 | 9.67 | 22.57 | 45.50 | 88.17 | 10.34 | 36.49 | 6.65 | 1.13 | 5.94 | 0.97 | 4.31 | 0.82 | 2.21 | 0.39 | 2.85 | 0.31 | 19.22 | |||
| 4691.5 | 10.92 | 26.47 | 51.94 | 97.20 | 12.08 | 41.07 | 7.78 | 1.26 | 6.93 | 1.10 | 5.99 | 0.97 | 2.63 | 0.54 | 2.40 | 0.36 | 23.52 | |||
| XJ-A-1-1 | 2nd Wenchang formation | 4450.5 | 7.98 | 24.08 | 43.34 | 83.24 | 9.83 | 34.67 | 6.69 | 4.81 | 6.12 | 1.24 | 4.78 | 0.96 | 2.62 | 0.41 | 2.44 | 0.37 | 29.45 | |
| 4495.5 | 7.33 | 20.35 | 48.05 | 89.38 | 10.40 | 35.45 | 6.69 | 5.96 | 6.06 | 0.97 | 5.31 | 0.91 | 2.56 | 0.40 | 3.60 | 0.36 | 29.86 | |||
| 4576.5 | 7.90 | 23.68 | 65.47 | 123.23 | 14.52 | 48.91 | 8.64 | 3.95 | 7.75 | 1.19 | 5.58 | 1.06 | 2.81 | 0.45 | 2.60 | 0.40 | 30.47 | |||
| 4626.5 | 3.39 | 23.69 | 32.22 | 64.03 | 7.23 | 24.65 | 4.94 | 3.28 | 5.07 | 1.06 | 4.04 | 0.85 | 2.51 | 0.44 | 2.55 | 0.41 | 37.74 | |||
| 4674.5 | 3.71 | 17.19 | 30.40 | 59.40 | 6.98 | 23.35 | 4.87 | 4.00 | 4.53 | 0.99 | 3.61 | 0.91 | 2.90 | 0.38 | 2.37 | 0.34 | 39.87 | |||
| EP-A | EP-A-3-1 | Enping formation | 3511.75 | 8.69 | 22.38 | 49.76 | 91.39 | 10.88 | 37.40 | 6.96 | 2.62 | 6.32 | 1.05 | 5.32 | 0.94 | 2.57 | 0.40 | 2.51 | 0.37 | 28.58 |
| 3577.75 | 8.84 | 23.55 | 46.91 | 88.07 | 10.31 | 35.24 | 6.81 | 1.79 | 6.05 | 0.97 | 7.97 | 0.86 | 2.35 | 0.37 | 2.76 | 0.33 | 24.20 | |||
| 3650.5 | 9.59 | 23.77 | 47.47 | 89.04 | 10.41 | 35.27 | 6.95 | 2.16 | 6.20 | 0.99 | 4.77 | 0.94 | 2.68 | 0.40 | 2.59 | 0.37 | 31.62 | |||
| 3715 | 9.14 | 22.92 | 44.41 | 86.41 | 9.70 | 33.49 | 8.07 | 2.94 | 5.92 | 0.95 | 4.53 | 0.88 | 2.48 | 0.39 | 2.17 | 0.34 | 27.93 | |||
| 3791.5 | 10.23 | 16.98 | 32.41 | 67.60 | 7.40 | 26.82 | 5.29 | 6.57 | 4.97 | 0.76 | 3.67 | 0.72 | 2.21 | 0.33 | 1.89 | 0.29 | 10.73 | |||
| Wenchang formation | 4755.5 | 8.87 | 21.16 | 46.26 | 92.04 | 10.44 | 36.94 | 7.86 | 16.06 | 7.49 | 1.08 | 6.14 | 0.97 | 2.65 | 0.42 | 2.46 | 0.69 | 22.43 | ||
| 4775.5 | 8.33 | 23.07 | 50.27 | 97.70 | 11.00 | 38.62 | 8.32 | 15.56 | 7.58 | 1.08 | 5.30 | 1.04 | 2.62 | 0.42 | 3.71 | 0.42 | 24.40 | |||
| 4812.5 | 8.06 | 26.73 | 52.93 | 97.99 | 11.83 | 41.48 | 8.68 | 18.58 | 8.19 | 1.14 | 6.66 | 1.06 | 2.89 | 0.47 | 2.78 | 0.46 | 25.93 | |||
| 4816.5 | 7.79 | 20.03 | 46.52 | 88.35 | 10.44 | 36.39 | 8.07 | 12.57 | 7.28 | 1.02 | 4.54 | 0.89 | 2.48 | 0.38 | 2.17 | 0.34 | 23.82 | |||
| 4822.5 | 7.56 | 22.40 | 48.54 | 88.76 | 10.62 | 37.17 | 7.76 | 14.23 | 7.07 | 1.02 | 4.79 | 0.88 | 2.50 | 0.39 | 2.31 | 0.35 | 23.99 | |||
| 4829.5 | 8.33 | 23.50 | 52.41 | 94.61 | 11.49 | 40.37 | 8.50 | 14.37 | 7.80 | 1.33 | 5.26 | 1.02 | 2.70 | 0.42 | 2.49 | 0.37 | 27.35 | |||
| HZ-A | HZ-A-1-3 | Wenchang formation | 3807.5 | 10.55 | 19.95 | 42.02 | 80.57 | 9.15 | 32.23 | 6.30 | 8.83 | 5.69 | 0.92 | 4.35 | 0.87 | 2.39 | 0.37 | 2.29 | 0.36 | 12.94 |
| 3817.5 | 8.80 | 16.59 | 31.60 | 61.23 | 6.94 | 24.61 | 4.93 | 9.18 | 4.57 | 0.71 | 3.56 | 0.72 | 2.04 | 0.32 | 2.01 | 0.31 | 9.72 | |||
| 3825.5 | 9.37 | 16.41 | 27.83 | 55.48 | 6.31 | 22.39 | 4.59 | 7.99 | 4.37 | 0.67 | 3.36 | 0.70 | 1.95 | 0.31 | 1.93 | 0.31 | 8.54 | |||
| 3837.5 | 7.70 | 12.80 | 24.98 | 47.85 | 5.41 | 19.15 | 3.86 | 7.84 | 3.53 | 0.54 | 2.67 | 0.53 | 1.51 | 0.24 | 1.52 | 0.24 | 7.63 | |||
| 3855.5 | 10.83 | 16.70 | 27.08 | 53.10 | 6.14 | 22.18 | 4.57 | 8.91 | 4.36 | 0.68 | 3.50 | 0.71 | 2.03 | 0.54 | 1.92 | 0.31 | 8.45 | |||
| 3867.5 | 12.02 | 18.83 | 30.78 | 61.45 | 7.03 | 25.60 | 5.16 | 7.89 | 5.02 | 0.78 | 4.04 | 1.07 | 2.27 | 0.37 | 2.19 | 0.35 | 9.72 | |||
| 3880.5 | 11.96 | 19.58 | 33.45 | 66.72 | 7.57 | 27.19 | 5.46 | 8.85 | 5.15 | 0.82 | 4.18 | 0.84 | 2.37 | 0.37 | 2.35 | 0.36 | 10.42 | |||
| 3894.5 | 9.69 | 17.80 | 28.92 | 59.38 | 6.73 | 24.35 | 5.07 | 9.64 | 4.96 | 0.76 | 3.86 | 0.79 | 2.19 | 0.35 | 2.15 | 0.33 | 9.09 | |||
| HZ-A-5-1 | 5th Wenchang formation | 4578.5 | 10.83 | 18.09 | 37.55 | 75.90 | 8.66 | 31.11 | 5.91 | 5.11 | 5.32 | 0.83 | 3.99 | 0.78 | 2.23 | 0.33 | 2.09 | 0.32 | 8.56 | |
| 4589.5 | 12.27 | 22.40 | 42.00 | 84.31 | 9.66 | 34.70 | 6.20 | 4.30 | 5.63 | 0.89 | 4.59 | 0.94 | 2.54 | 0.41 | 2.49 | 0.38 | 9.91 | |||
| 4607.5 | 13.16 | 21.14 | 39.02 | 76.98 | 9.01 | 32.57 | 6.04 | 4.93 | 5.38 | 0.87 | 4.43 | 0.90 | 2.56 | 0.40 | 2.30 | 0.37 | 10.66 | |||
| 4622.5 | 11.29 | 18.35 | 32.13 | 62.96 | 7.24 | 26.11 | 5.26 | 6.81 | 4.90 | 0.77 | 4.03 | 0.79 | 2.26 | 0.36 | 2.19 | 0.34 | 10.54 | |||
| 4637.5 | 8.65 | 14.26 | 23.52 | 45.54 | 5.24 | 18.72 | 3.86 | 7.56 | 3.56 | 0.55 | 2.96 | 0.60 | 1.82 | 0.29 | 1.70 | 0.27 | 7.56 | |||
| 4651.5 | 7.12 | 11.96 | 19.16 | 36.99 | 4.20 | 15.14 | 3.25 | 8.39 | 3.10 | 0.46 | 2.46 | 0.49 | 1.41 | 0.22 | 1.39 | 0.23 | 6.63 | |||
| 4662.5 | 9.58 | 18.47 | 21.97 | 42.40 | 4.89 | 17.79 | 3.65 | 6.48 | 3.69 | 0.59 | 2.98 | 0.61 | 1.85 | 0.28 | 1.84 | 0.27 | 7.22 | |||
| 4676.5 | 10.91 | 19.21 | 28.05 | 59.45 | 6.39 | 23.71 | 4.96 | 8.06 | 4.72 | 0.77 | 4.01 | 0.81 | 2.28 | 0.36 | 2.31 | 0.34 | 9.48 | |||
| HZ-A-8-1 | 4th Wenchang formation | 4422.5 | 8.77 | 18.85 | 36.59 | 72.96 | 8.40 | 29.63 | 5.99 | 2.33 | 5.11 | 0.81 | 3.87 | 0.75 | 2.04 | 0.35 | 2.18 | 0.29 | 16.44 | |
| 4440.5 | 9.00 | 17.20 | 35.23 | 70.48 | 8.03 | 27.92 | 5.52 | 2.67 | 4.84 | 0.75 | 4.17 | 0.70 | 1.93 | 0.30 | 2.97 | 0.28 | 15.66 | |||
| 4454.5 | 7.71 | 16.62 | 32.75 | 64.05 | 7.51 | 26.69 | 5.31 | 2.61 | 4.41 | 0.78 | 3.55 | 0.67 | 2.53 | 0.30 | 1.93 | 0.27 | 15.00 | |||
| 4460.5 | 9.42 | 18.64 | 35.17 | 69.80 | 7.95 | 28.11 | 5.29 | 2.04 | 4.67 | 0.76 | 3.54 | 1.18 | 1.91 | 0.30 | 2.83 | 0.29 | 15.24 | |||
| 4468.5 | 8.63 | 16.65 | 34.37 | 68.59 | 7.93 | 28.03 | 5.33 | 2.19 | 4.56 | 0.73 | 3.46 | 0.81 | 2.35 | 0.32 | 1.90 | 0.28 | 13.77 | |||
| 4477.5 | 10.33 | 19.62 | 37.85 | 74.96 | 8.56 | 30.50 | 5.93 | 2.43 | 5.07 | 0.81 | 3.74 | 0.76 | 2.14 | 0.33 | 2.11 | 0.31 | 15.76 | |||
| 4493.5 | 9.29 | 18.80 | 35.42 | 70.37 | 8.51 | 28.80 | 5.96 | 2.25 | 5.15 | 0.79 | 3.90 | 0.76 | 2.09 | 0.63 | 2.30 | 0.29 | 16.13 | |||
| 4507.5 | 9.89 | 18.55 | 36.82 | 74.30 | 8.23 | 29.27 | 5.57 | 2.08 | 4.82 | 0.76 | 4.19 | 0.69 | 1.94 | 0.34 | 2.10 | 0.28 | 16.11 | |||
| 4522.5 | 9.90 | 18.12 | 34.82 | 68.79 | 7.86 | 27.55 | 5.52 | 2.44 | 4.77 | 0.74 | 3.50 | 0.69 | 1.93 | 0.32 | 1.98 | 0.30 | 15.72 | |||
| 4539.5 | 9.59 | 17.35 | 32.72 | 66.19 | 7.56 | 26.86 | 5.32 | 2.34 | 4.58 | 0.74 | 3.48 | 0.68 | 1.94 | 0.31 | 2.88 | 0.29 | 14.40 | |||
| 5th Wenchang formation | 4747.5 | 10.59 | 20.78 | 35.43 | 71.99 | 8.01 | 28.44 | 5.71 | 6.14 | 5.28 | 0.83 | 4.05 | 0.84 | 2.27 | 0.37 | 2.45 | 0.37 | 12.39 | ||
| 4762.5 | 10.54 | 22.64 | 36.73 | 73.90 | 8.17 | 28.75 | 5.85 | 5.66 | 5.28 | 0.84 | 4.23 | 0.85 | 2.41 | 0.42 | 2.66 | 0.38 | 13.26 | |||
| 4777.5 | 8.47 | 17.26 | 28.38 | 56.40 | 6.34 | 22.46 | 4.64 | 5.77 | 4.17 | 0.67 | 3.43 | 0.66 | 1.97 | 0.31 | 2.07 | 0.30 | 9.56 | |||
| 4792.5 | 4.79 | 15.72 | 22.93 | 46.03 | 5.03 | 17.83 | 3.81 | 5.15 | 3.46 | 0.57 | 2.91 | 0.58 | 2.37 | 0.27 | 1.78 | 0.30 | 6.67 | |||
| 4807.5 | 4.45 | 18.08 | 26.75 | 51.13 | 5.61 | 19.94 | 4.18 | 5.85 | 4.02 | 0.66 | 3.38 | 0.68 | 1.87 | 0.31 | 2.05 | 0.32 | 7.75 | |||
| 4822.5 | 10.93 | 23.31 | 36.16 | 70.74 | 8.02 | 28.79 | 5.79 | 6.42 | 5.37 | 0.86 | 6.19 | 0.91 | 2.56 | 0.43 | 2.81 | 0.41 | 11.23 | |||
| 4837.5 | 4.95 | 10.47 | 17.52 | 33.22 | 3.76 | 13.40 | 2.75 | 5.61 | 2.48 | 0.40 | 1.92 | 0.40 | 1.11 | 0.19 | 1.27 | 0.19 | 5.19 | |||
| 4852.5 | 6.36 | 14.19 | 19.62 | 38.56 | 4.40 | 15.89 | 3.42 | 4.92 | 3.15 | 0.51 | 2.66 | 0.53 | 1.49 | 0.25 | 1.66 | 0.25 | 6.35 | |||
| 4865.5 | 8.50 | 17.17 | 24.95 | 49.38 | 5.66 | 20.65 | 4.28 | 5.58 | 3.89 | 0.65 | 3.35 | 0.67 | 1.89 | 0.31 | 1.95 | 0.30 | 7.95 |
Disclaimer/Publisher’s Note: The statements, opinions and data contained in all publications are solely those of the individual author(s) and contributor(s) and not of MDPI and/or the editor(s). MDPI and/or the editor(s) disclaim responsibility for any injury to people or property resulting from any ideas, methods, instructions or products referred to in the content. |
© 2025 by the authors. Licensee MDPI, Basel, Switzerland. This article is an open access article distributed under the terms and conditions of the Creative Commons Attribution (CC BY) license (https://creativecommons.org/licenses/by/4.0/).
Share and Cite
Zhan, J.; Xu, G.; Shi, Y.; Xiong, W.; Niu, S. Comprehensive Assessment of Paleogene Hydrocarbon Source Rocks in the Hydrocarbon-Rich Sub-Sag of the Zhu-1 Depression. Processes 2025, 13, 914. https://doi.org/10.3390/pr13030914
Zhan J, Xu G, Shi Y, Xiong W, Niu S. Comprehensive Assessment of Paleogene Hydrocarbon Source Rocks in the Hydrocarbon-Rich Sub-Sag of the Zhu-1 Depression. Processes. 2025; 13(3):914. https://doi.org/10.3390/pr13030914
Chicago/Turabian StyleZhan, Junyan, Guosheng Xu, Yuling Shi, Wanlin Xiong, and Shengli Niu. 2025. "Comprehensive Assessment of Paleogene Hydrocarbon Source Rocks in the Hydrocarbon-Rich Sub-Sag of the Zhu-1 Depression" Processes 13, no. 3: 914. https://doi.org/10.3390/pr13030914
APA StyleZhan, J., Xu, G., Shi, Y., Xiong, W., & Niu, S. (2025). Comprehensive Assessment of Paleogene Hydrocarbon Source Rocks in the Hydrocarbon-Rich Sub-Sag of the Zhu-1 Depression. Processes, 13(3), 914. https://doi.org/10.3390/pr13030914