1. Introduction
The development of wearable electronic devices and smart textiles has driven significant technological advancements in the textile industry, with conductive fabrics emerging as a key material in this evolution [
1,
2,
3]. Conductive textiles must maintain the inherent properties of conventional fabrics, such as flexibility, softness, and breathability, while simultaneously ensuring uniform and stable electrical conductivity [
4,
5,
6,
7]. Therefore, technologies that enable the conversion of insulating fabrics into conductive textiles are essential [
8,
9]. Among various techniques for imparting conductivity to fabrics, the dip-coating process is widely utilized due to its simplicity, scalability, and resemblance to conventional dyeing methods [
10,
11,
12,
13]. In particular, dip-coating with Single-Walled Carbon Nanotube (SWCNT) offers both high electrical conductivity and mechanical flexibility, making it suitable for fabrics with complex structures and shapes [
14,
15,
16]. This method enables the transformation of textiles into highly conductive fabrics with a sheet resistance as low as 1 Ω/sq. Moreover, the resistance of SWCNT-coated fabrics decreases with an increasing number of coating cycles, allowing for customized fabrication tailored to specific application requirements.
The performance and reliability of electronic devices are closely linked to their electrical properties, particularly resistance, which serves as a key parameter in evaluating efficiency and stability [
17,
18,
19]. In the fields of wearable electronics and smart textiles, maintaining uniform electrical properties is crucial, and accurate resistance measurement plays a critical role in ensuring consistency and detecting potential defects at an early stage. Traditionally, the resistance of conductive textiles has been measured using contact-based methods [
20,
21]. However, these methods suffer from inherent limitations, including inconsistencies in measurement accuracy and repeatability, as well as the risk of fabric damage. The measured resistance values can vary depending on the applied force and pressure, while repeated contact may lead to surface deformation or degradation, compromising the fabric’s original properties [
22,
23]. These challenges present significant obstacles, particularly in applications where flexibility and durability are essential, such as wearable devices and smart textiles.
To overcome these limitations, non-contact resistance measurement technology presents a promising alternative. Existing non-contact resistance measurement techniques, such as terahertz spectroscopy and impedance spectroscopy, can achieve high accuracy in laboratory environments. However, their high equipment costs and complex setup requirements pose challenges for real-time analysis in production processes. In contrast, artificial intelligence (AI)-based approaches enable rapid and consistent data analysis using relatively simple equipment, offering advantages for automation in manufacturing processes and real-time quality monitoring systems. AI is a powerful tool capable of analyzing large datasets and learning patterns to enable accurate predictions, particularly excelling in processing image data [
24,
25,
26,
27]. Among AI-based models, Convolutional Neural Networks (CNNs) are particularly well-suited for non-contact resistance measurement, as they can effectively learn features such as brightness, texture, and structural patterns from images [
28,
29,
30,
31]. Building on this foundation, our previous research focused on evaluating resistance variations and uniformity in conductive fabrics produced through an SWCNT-based dip-coating process, specifically using white fabrics. The CNN model employed in that study was trained on a dataset limited to white fabrics, which exhibited relatively simple grayscale patterns and low data variability. However, in practical applications, conductive fabrics can be manufactured using substrates of various colors. The color of a fabric is determined by its surface reflectance, which selectively reflects specific wavelengths of light, thereby contributing to its perceived color. This variation in color adds complexity to the fabric’s reflectance properties and grayscale patterns, leading to increased data variability. To address the complexities of real-world applications, this study extends the previous approach, which was confined to white fabrics, to include a broader range of fabric colors (white, red, green, and blue). This allows for a more in-depth analysis of how color-induced variations in grayscale patterns affect resistance prediction. By incorporating a more diverse dataset, this study aims to develop a model with improved generalizability, making it more applicable to real-world manufacturing environments. Additionally, this study employs the ResNet (Residual Neural Network) architecture, which mitigates the vanishing gradient problem that can arise in deep network training through skip connections within residual blocks [
32,
33,
34,
35]. Compared to conventional CNN models, this structure enables the more robust handling of grayscale pattern complexity and data irregularities introduced by fabric color variations [
36,
37]. As a result, the ResNet-based approach ensures consistent and reliable resistance predictions across fabrics of different colors.
This study proposes a non-contact resistance prediction technique using image data by employing a ResNet-based CNN for conductive fabrics fabricated from white, red, green, and blue cotton textiles through the SWCNT dip-coating process. The primary objective of this research is to analyze the relationship between resistance reduction and brightness variation as a function of dip-coating repetitions, and to precisely evaluate the electrical properties of conductive textiles. Colored fabrics pose greater analytical challenges compared to white fabrics due to color variations. To address this issue, the ResNet CNN model is adopted to effectively mitigate color variability caused by color and surface structure while learning the correlation between brightness and resistance. The proposed approach overcomes the limitations of traditional contact-based resistance measurement methods by preventing fabric surface damage and ensuring high reliability and accuracy in repeated measurements. This study enhances manufacturing process efficiency through non-contact resistance measurement, and establishes a technological foundation for the commercialization of wearable electronic devices and smart textiles. This approach can play a crucial role in applications such as manufacturing process automation and real-time quality monitoring. By enabling automated data processing and analysis, it is expected to significantly enhance the overall efficiency of production processes.
2. Materials and Methods
2.1. Dataset Collection
2.1.1. Conductive Fabric Preparation Method
In this study, conductive fabrics were fabricated using the SWCNT (Single-Walled Carbon Nanotube) (KORBON Co., Ltd., Gangneung, Republic of Korea) dip-coating process on white, red, green, and blue fabrics made from 40 s 100% cotton twill. Cotton fabrics are composed of cellulose fibers, which possess a complex surface structure, high porosity, and functional groups such as hydroxyl groups that enable the absorption of water and polar solvents [
38,
39]. This structure facilitates strong van der Waals interactions with SWCNT, allowing for robust adhesion and uniform coating due to the mechanical flexibility of SWCNT and the high surface area and absorbency of cotton fibers [
40,
41]. Cotton-based conductive fabrics exhibit excellent electrical conductivity while maintaining the softness and flexibility of cotton fibers, ensuring superior wearability [
42,
43]. Additionally, their porous structure provides high breathability, making them well-suited for skin-contact wearable devices by improving overall comfort. The strong adhesion between SWCNTs and the textile surface prevents the delamination or degradation of the coating, ensuring stable electrical properties even under repeated bending and stretching. Given these advantages, conductive fabrics based on SWCNT-coated cotton textiles demonstrate significant potential for applications in various fields, including wearable electronics, smart textiles, health monitoring sensors, and energy storage devices.
Figure 1 illustrates the process of fabricating conductive textiles from cotton fabrics through the SWCNT dip-coating process. The SWCNT ink was stirred at 1000 rpm for at least one hour using an ultrasonic processor to prevent the formation of air bubbles and ensure uniform dispersion on the fabric surface. The SWCNTs used in this study have a G/D ratio of over 80 and a diameter ranging from 1.1 to 1.4 nm. The fabric, composed of cellulose fibers, was immersed in a 0.1 wt. % water-based SWCNT solution for one minute, followed by the absorption of conductive particles using a dip-padding machine (Daelim Lab, Seoul, Republic of Korea). The excess moisture retained in the fabric was subsequently removed by drying at a temperature range of 70–80 °C for five minutes in a dual dryer (Daelim Lab, Seoul, Republic of Korea), where a circulation fan operated at 1500 rpm. Finally, the dried fabric underwent a stabilization process at room temperature for one hour. Through this process, SWCNTs were uniformly coated onto the fabric surface, resulting in the fabrication of conductive textiles with high electrical conductivity.
2.1.2. Image Dataset Collection and Preprocessing
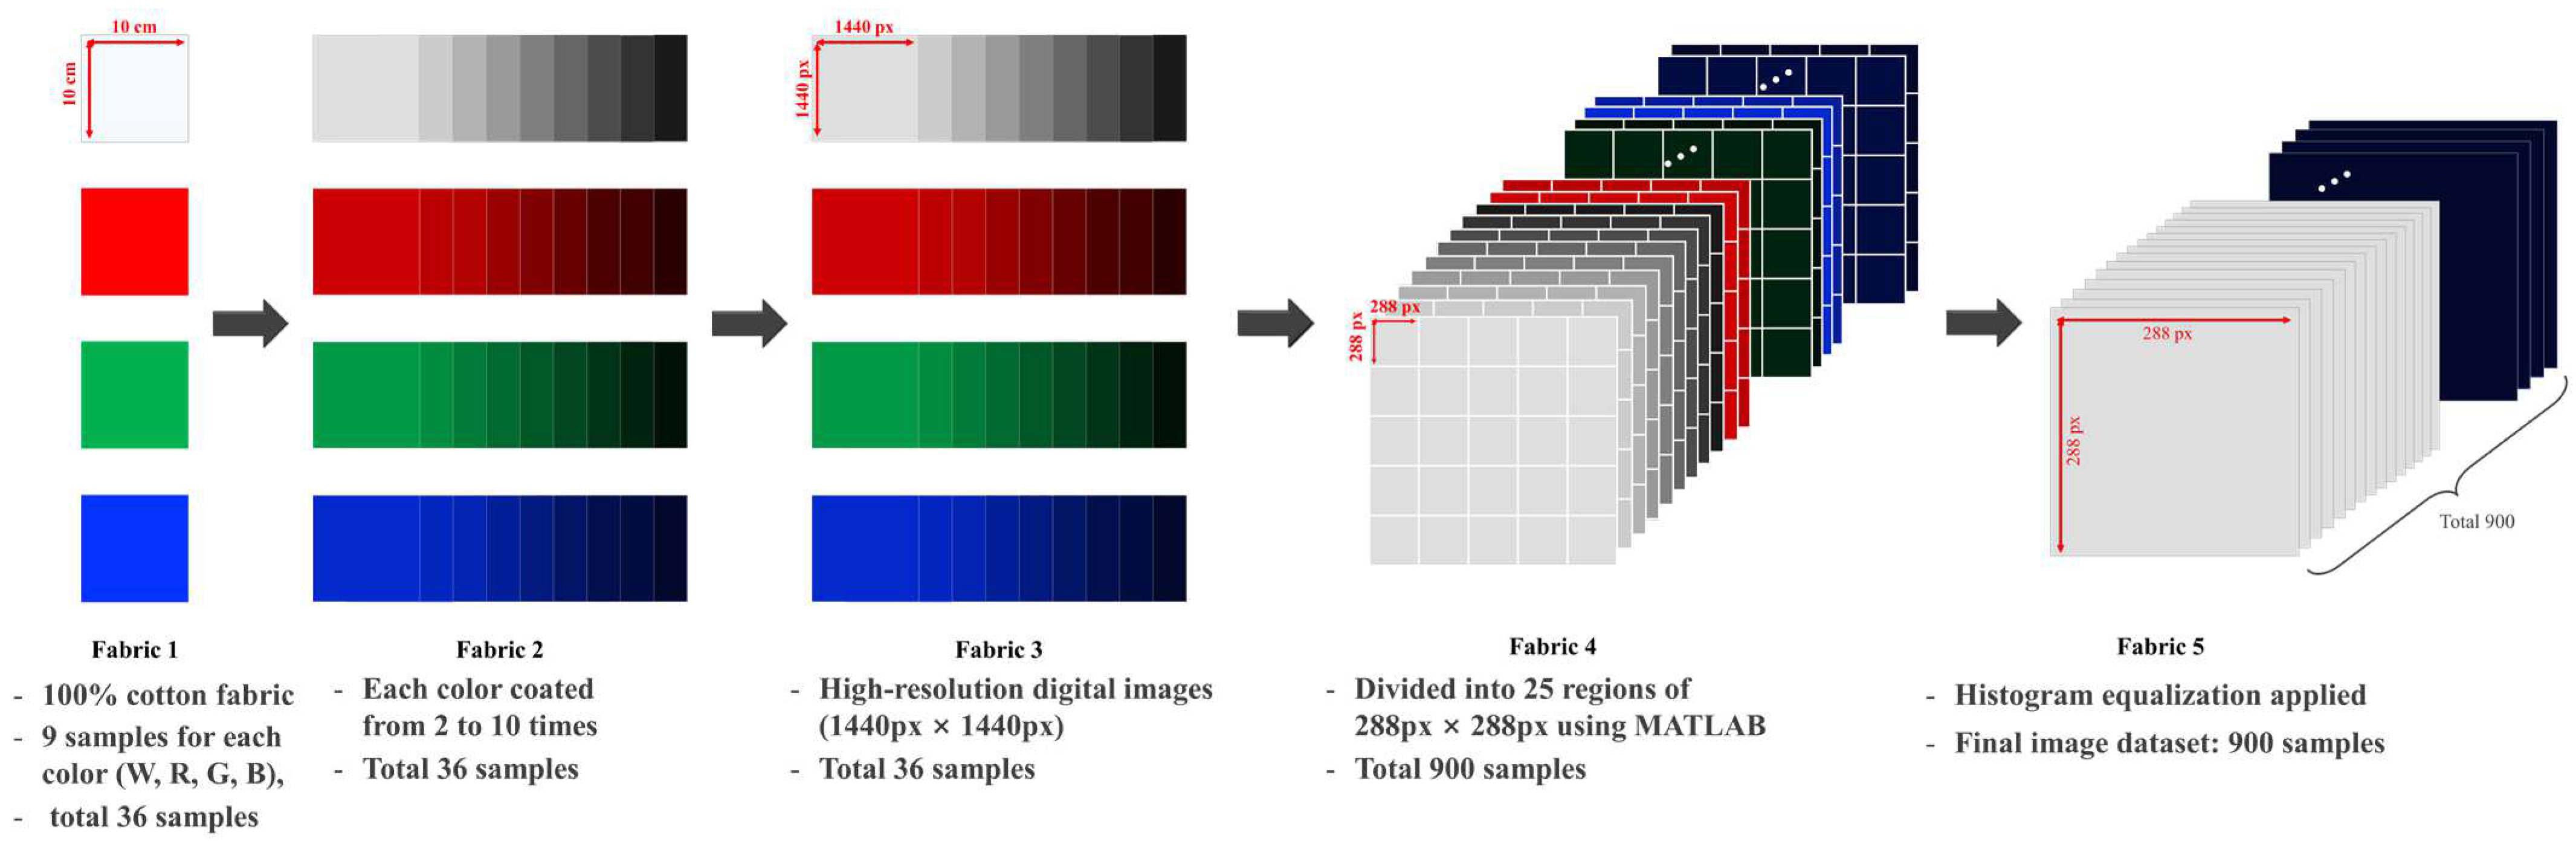
To enable non-contact resistance prediction using CNN based on image data, accurate and reliable data collection is essential. Acquiring high-quality images that precisely reflect the characteristics of conductive fabrics is crucial for accurately analyzing the relationship between brightness and resistance. To achieve this, the image data in this study were collected using the method illustrated in
Figure 2. This process was designed to effectively capture the brightness patterns and surface characteristics of conductive fabrics, optimizing the dataset to enhance the CNN model’s learning capability.
In this study, cotton fabrics (Holmes Fabric, Daegu, Republic of Korea) of four different colors (white, red, green, and blue) were prepared by laser-cutting each fabric into 9 pieces of 10 cm × 10 cm, resulting in a total of 36 samples, referred to as Fabric 1. Subsequently, to obtain a range of resistance values, dip-coating was performed with a specific number of repetitions (2, 3, 4, 5, 6, 7, 8, 9, or 10 cycles) on each of the nine samples for each fabric color.
Notably, single-coating samples were excluded from the study due to their high coating non-uniformity, which led to inconsistent resistance values and inadequate surface treatment. From a practical application perspective, such samples would likely be considered defective, and thus, they were omitted from the analysis. To train the CNN model, the fabricated conductive fabrics needed to be converted into digital images. To minimize distortions caused by external light, shadows, and camera lens effects, a scanner was used to obtain high-quality resolution images (1440 pixel × 1440 pixel), which were designated as Fabric 3. In AI training, a sufficient quantity of data is crucial, as it significantly influences model prediction accuracy and performance. To expand the dataset, each Fabric 3 image was divided into 25 non-overlapping regions of 288 × 288 pixels using MATLAB R2023 software, yielding a total of 900 image samples. This approach was not only more efficient than physically cutting the fabrics, but it also prevented material damage and increased the applicability of the dataset across various sizes and shapes. Finally, the 900 segmented images, referred to as Fabric 4, underwent histogram equalization, forming the final dataset, Fabric 5. Histogram equalization redistributes the contrast within an image to enhance subtle grayscale patterns while effectively mitigating brightness inconsistencies caused by color variations. This preprocessing technique enables the CNN model to learn fine grayscale differences with greater precision while offering high computational efficiency and implementation simplicity. Accordingly, this study adopted the histogram-equalized Fabric 5 images as the final dataset (
Table 1).
2.1.3. Label Dataset Collection
For the final 900 Fabric 5 images, the corresponding resistance values of each segmented region were used as labels. The label values were determined as the mean resistance obtained from 20 repeated measurements per region. This approach effectively reduced measurement variability and enhanced the reliability of the labeled data. The labeling process for Fabric 5 was designed to enable the CNN model to precisely learn the relationship between the brightness patterns and resistance of conductive fabrics. By ensuring a robust data foundation, this method contributed to improving the model’s predictive accuracy and overall performance.
2.2. ResNet-Based CNN Architecture
Residual Neural Network (ResNet) is a deep learning architecture designed to effectively address the vanishing gradient problem encountered in deep neural network training. By utilizing skip connections, ResNet enhances learning stability and efficiency. Traditional CNNs are highly sensitive to data complexity and noise, which can degrade predictive performance, particularly in high-resolution image datasets containing diverse colors. In contrast, ResNet is capable of learning complex patterns while mitigating noise, making it well-suited for predicting the resistance of conductive fabrics in this study.
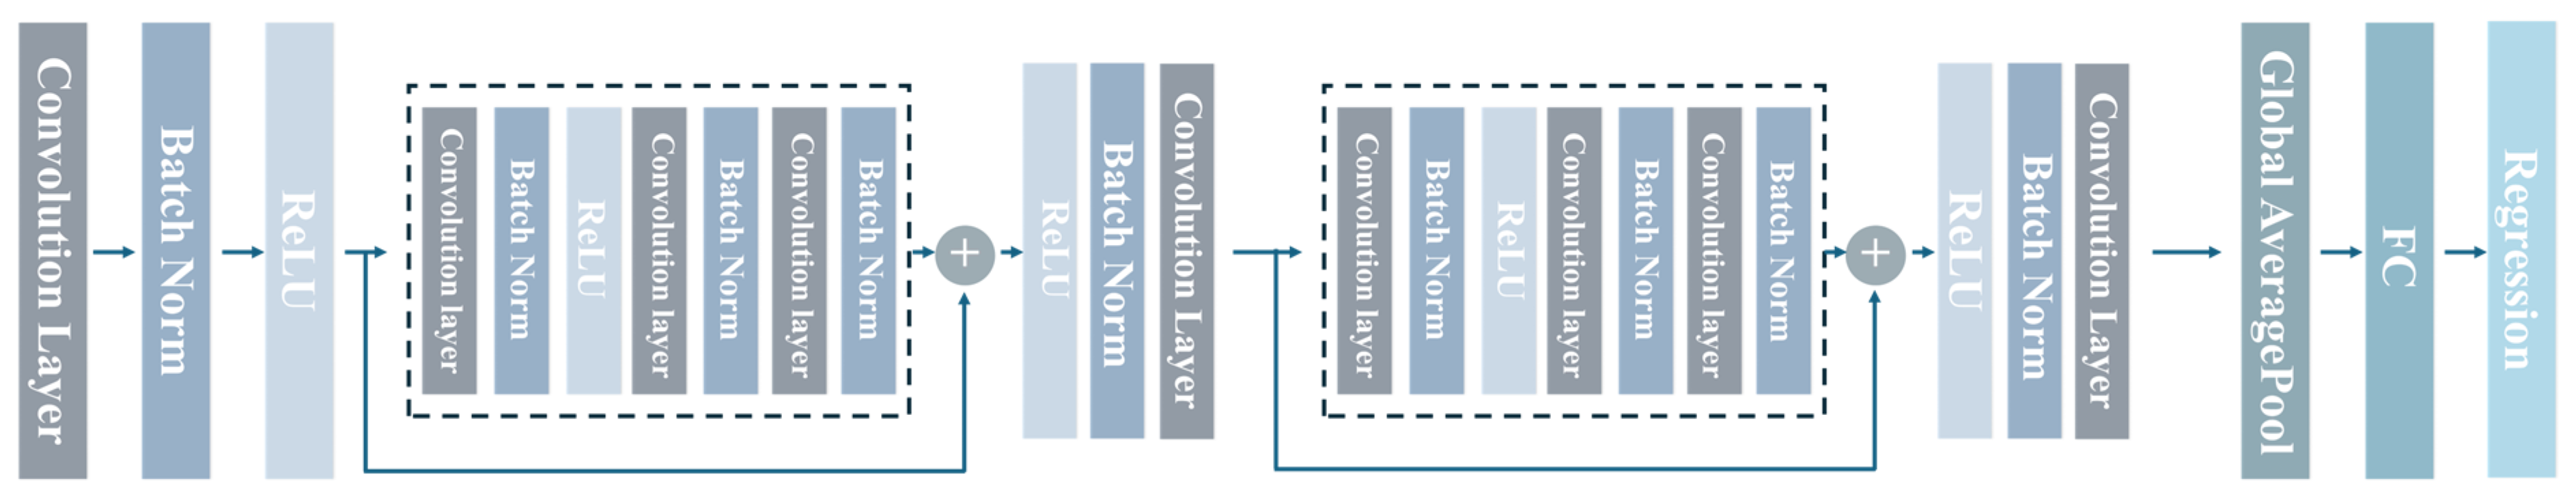
In this research, a ResNet-based CNN model was designed using 288 × 288 RGB images from the final dataset, Fabric 5, as input. The model was structured to effectively learn the intricate relationship between brightness and resistance in conductive fabrics. The convolutional layers were responsible for processing images and extracting features, employing 3 × 3 kernels to capture local patterns. Each residual block consisted of a convolutional layer, batch normalization, and a Rectified Linear Unit (ReLU) activation function. Batch normalization normalized data distribution, improving learning speed and stability, while the ReLU activation function introduced non-linearity by converting negative values to zero while preserving positive values, effectively alleviating the vanishing gradient problem and enhancing learning efficiency. To implement skip connections, an additional convolutional layer was included to align the dimensionality between input and output data. These skip connections combined input and output information, ensuring learning stability and facilitating effective training even in deep networks. Following the residual blocks, global max pooling was applied to reduce spatial dimensions and extract key features. Finally, a fully connected layer and regression layer were incorporated to predict the resistance values of conductive fabrics.
The final dataset consisted of 900 high-resolution images (Fabric 5) with corresponding resistance labels. The dataset was randomly shuffled and split into 70% training data and 30% test data, ensuring that image–label pairs were maintained throughout the process to prevent errors during model training.
Figure 3 summarizes the architecture of the ResNet CNN model used in this study. The proposed ResNet-based model is designed to effectively handle noise and variability in complex colored fabric images, surpassing traditional CNN architectures in robustness. By incorporating residual connections, the model enhances learning stability and ensures high predictive accuracy throughout the training process.
3. Results
3.1. Data Characterization and Data Preprocessing
3.1.1. Characterization of Conductive Fabric
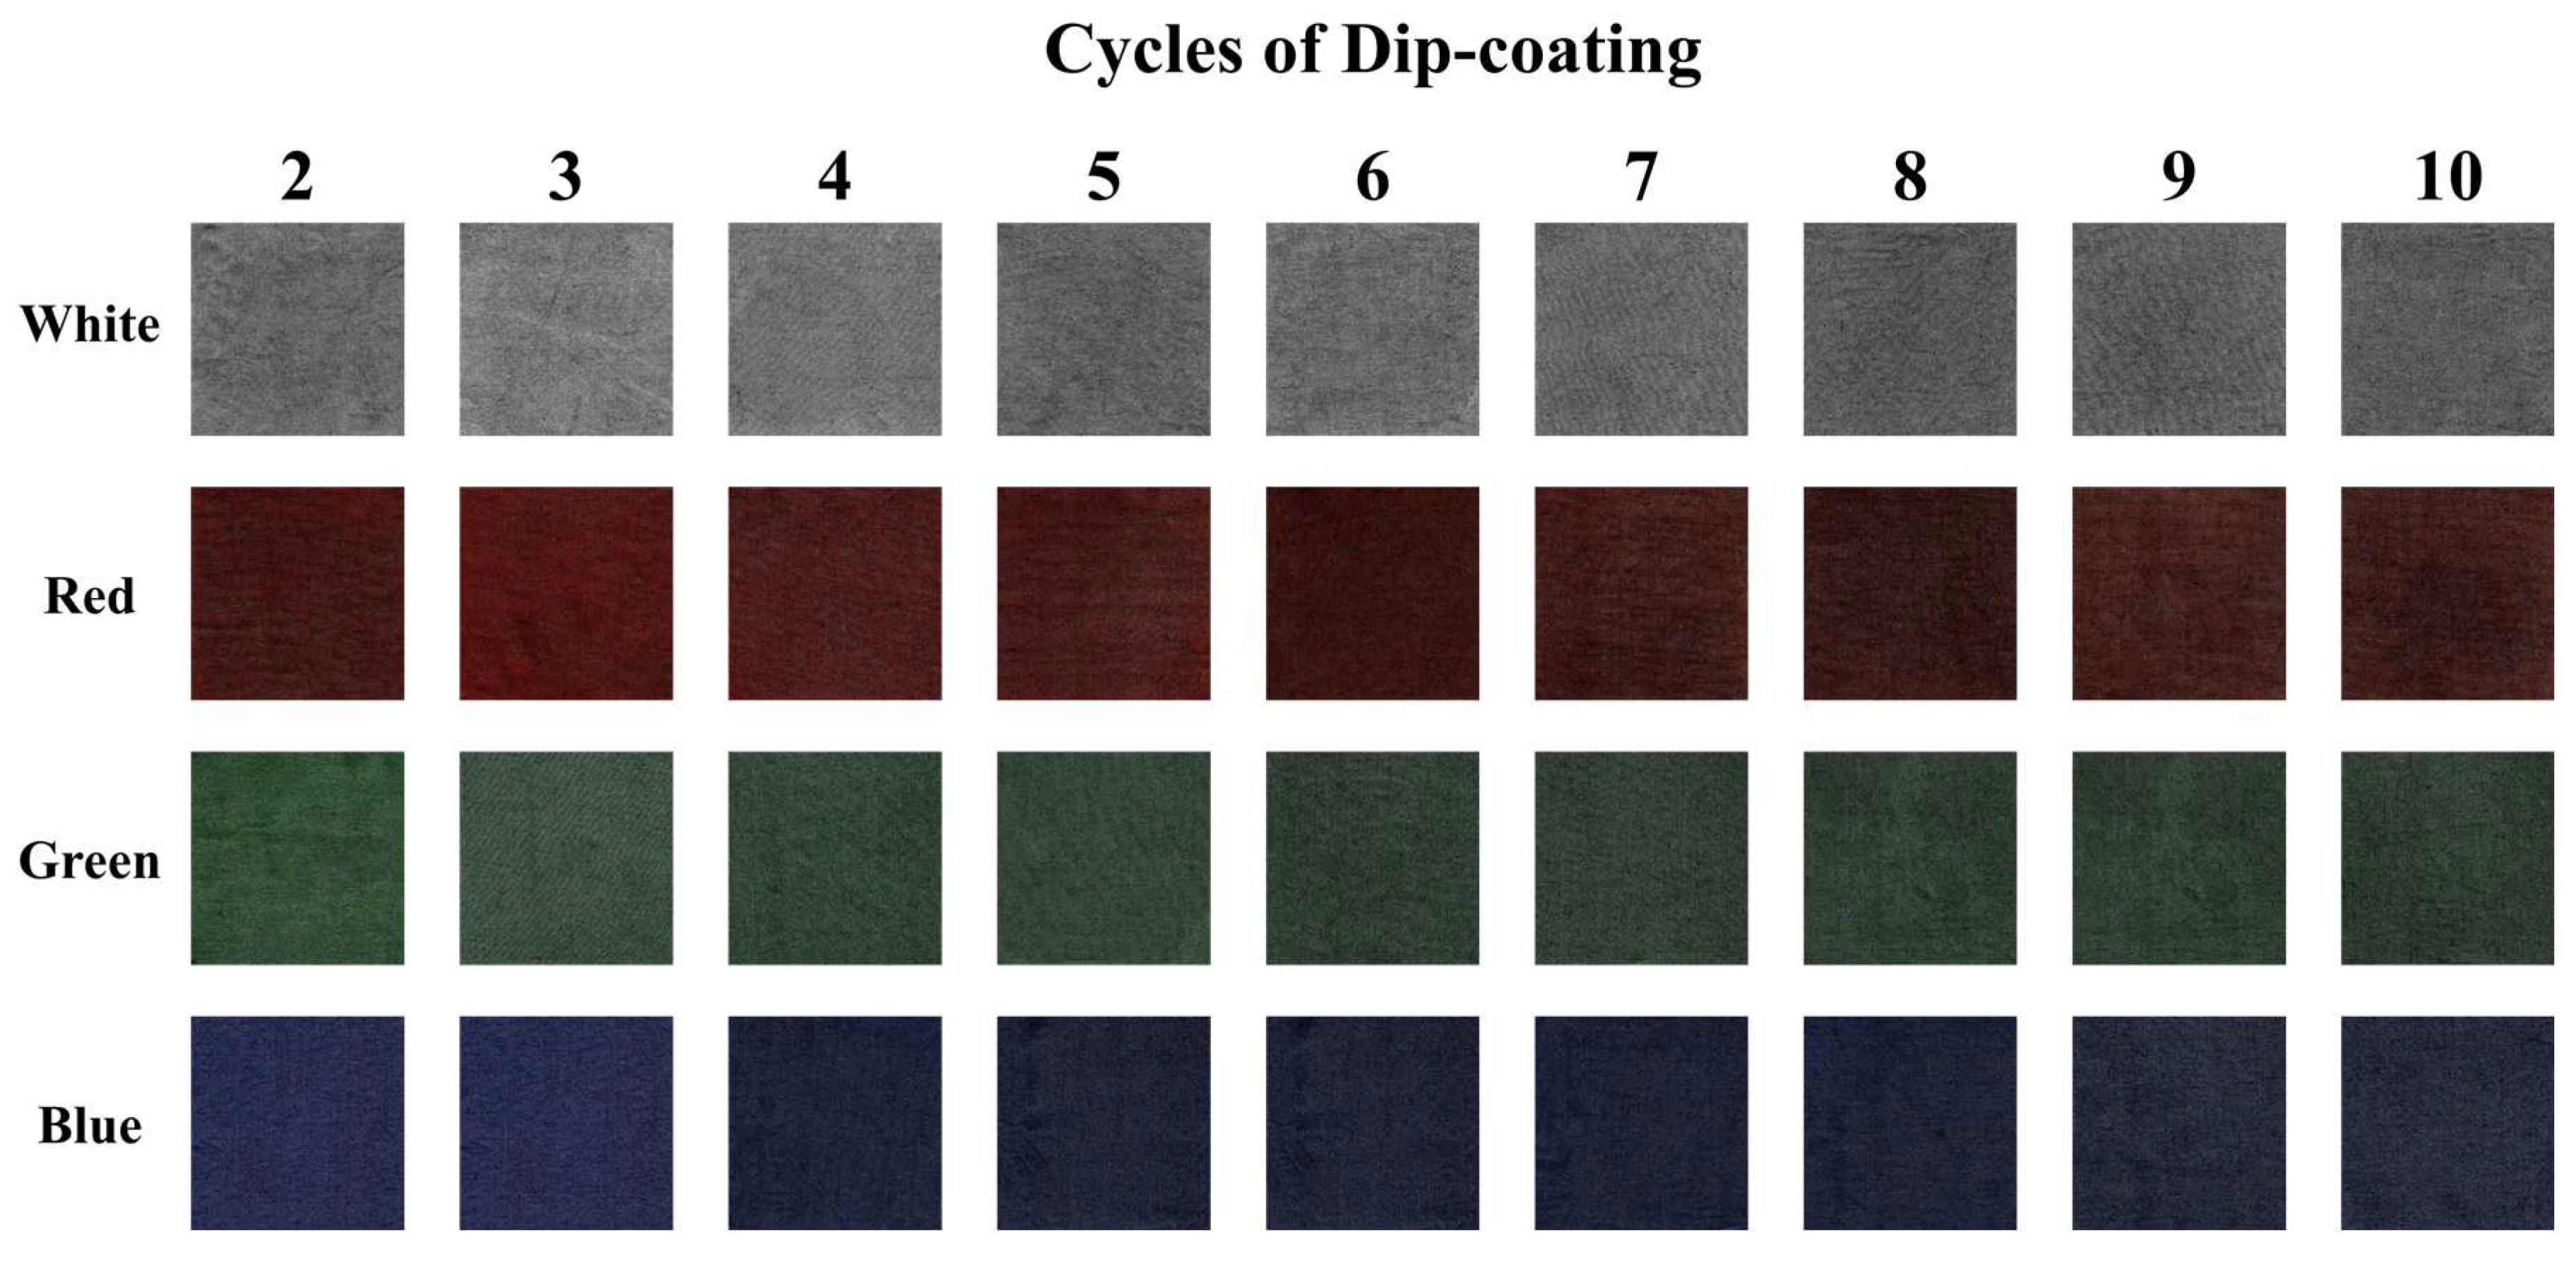
Figure 4 presents scanned images of SWCNT dip-coated conductive fabrics in white, red, green, and blue. To compare the microstructural changes before and after dip-coating, Scanning Electron Microscopy (SEM) analysis was performed. The results reveal a clear distribution of SWCNT particles within the fabric structure after dip-coating.
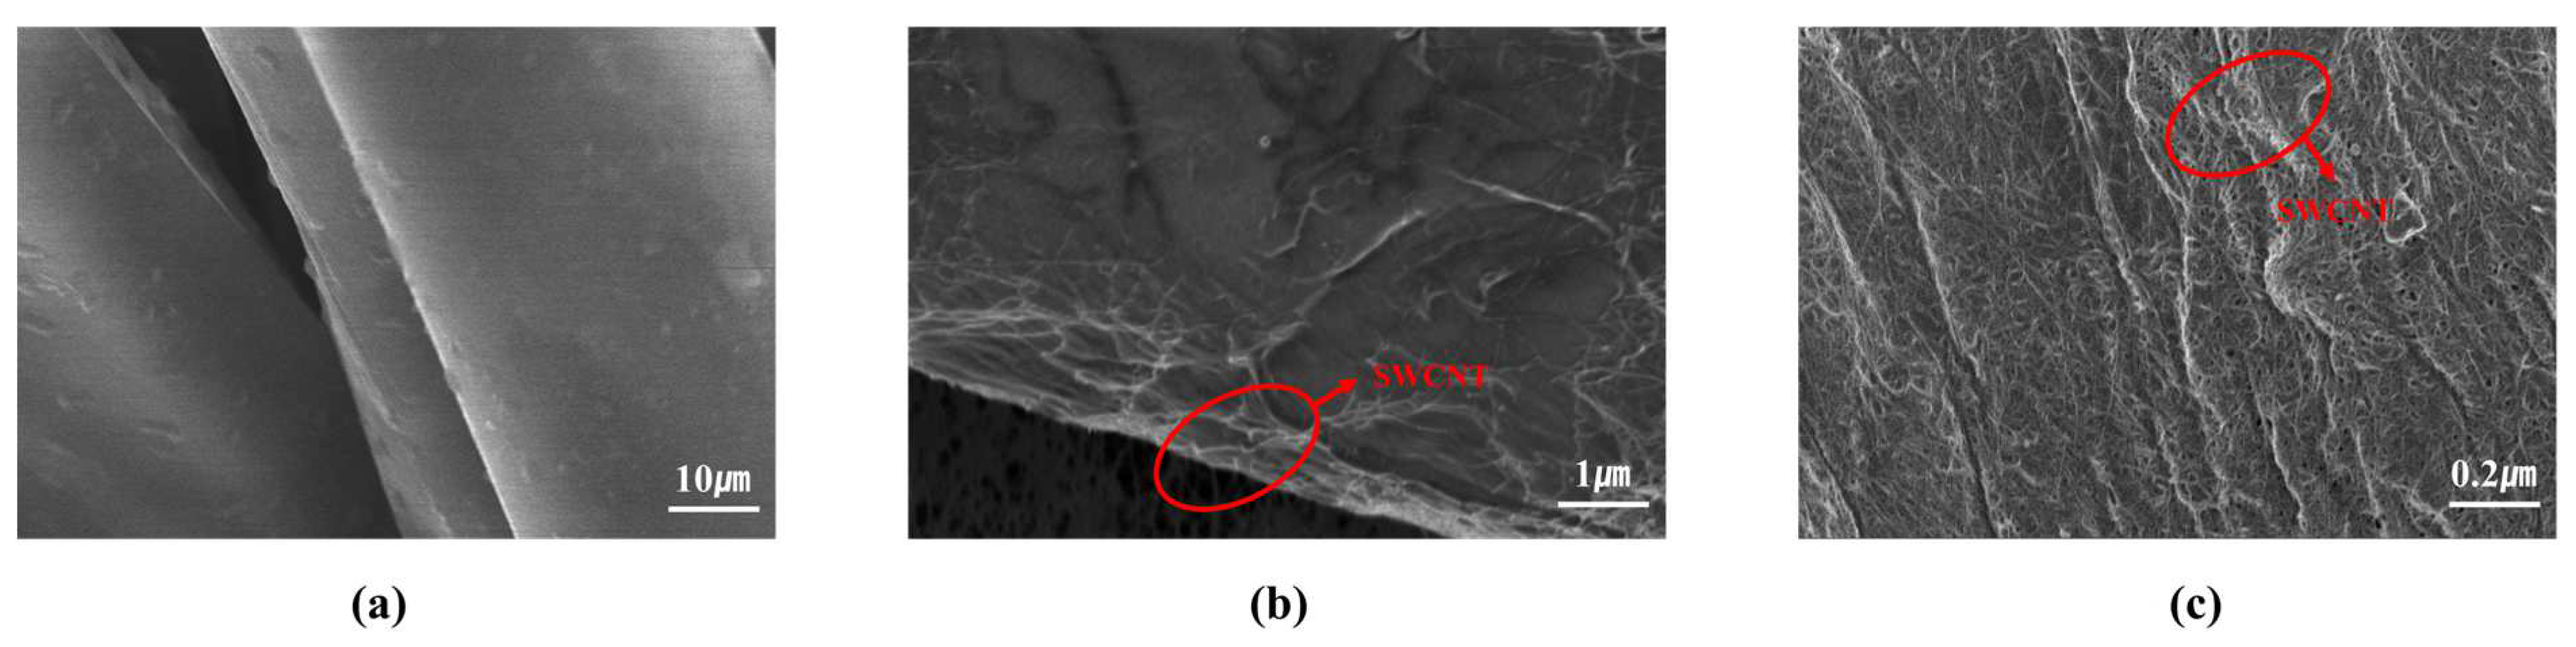
Figure 5 displays SEM images of (a) pristine fabric without dip-coating, (b) fabric dip-coated twice, and (c) fabric dip-coated ten times. The analysis confirmed that no conductive particles were observed in the untreated fabric, whereas the dip-coated fabrics exhibited SWCNT particles distributed across the fiber surface. Notably, a comparison between the twice-coated fabric (
Figure 5b) and the ten-times-coated fabric (
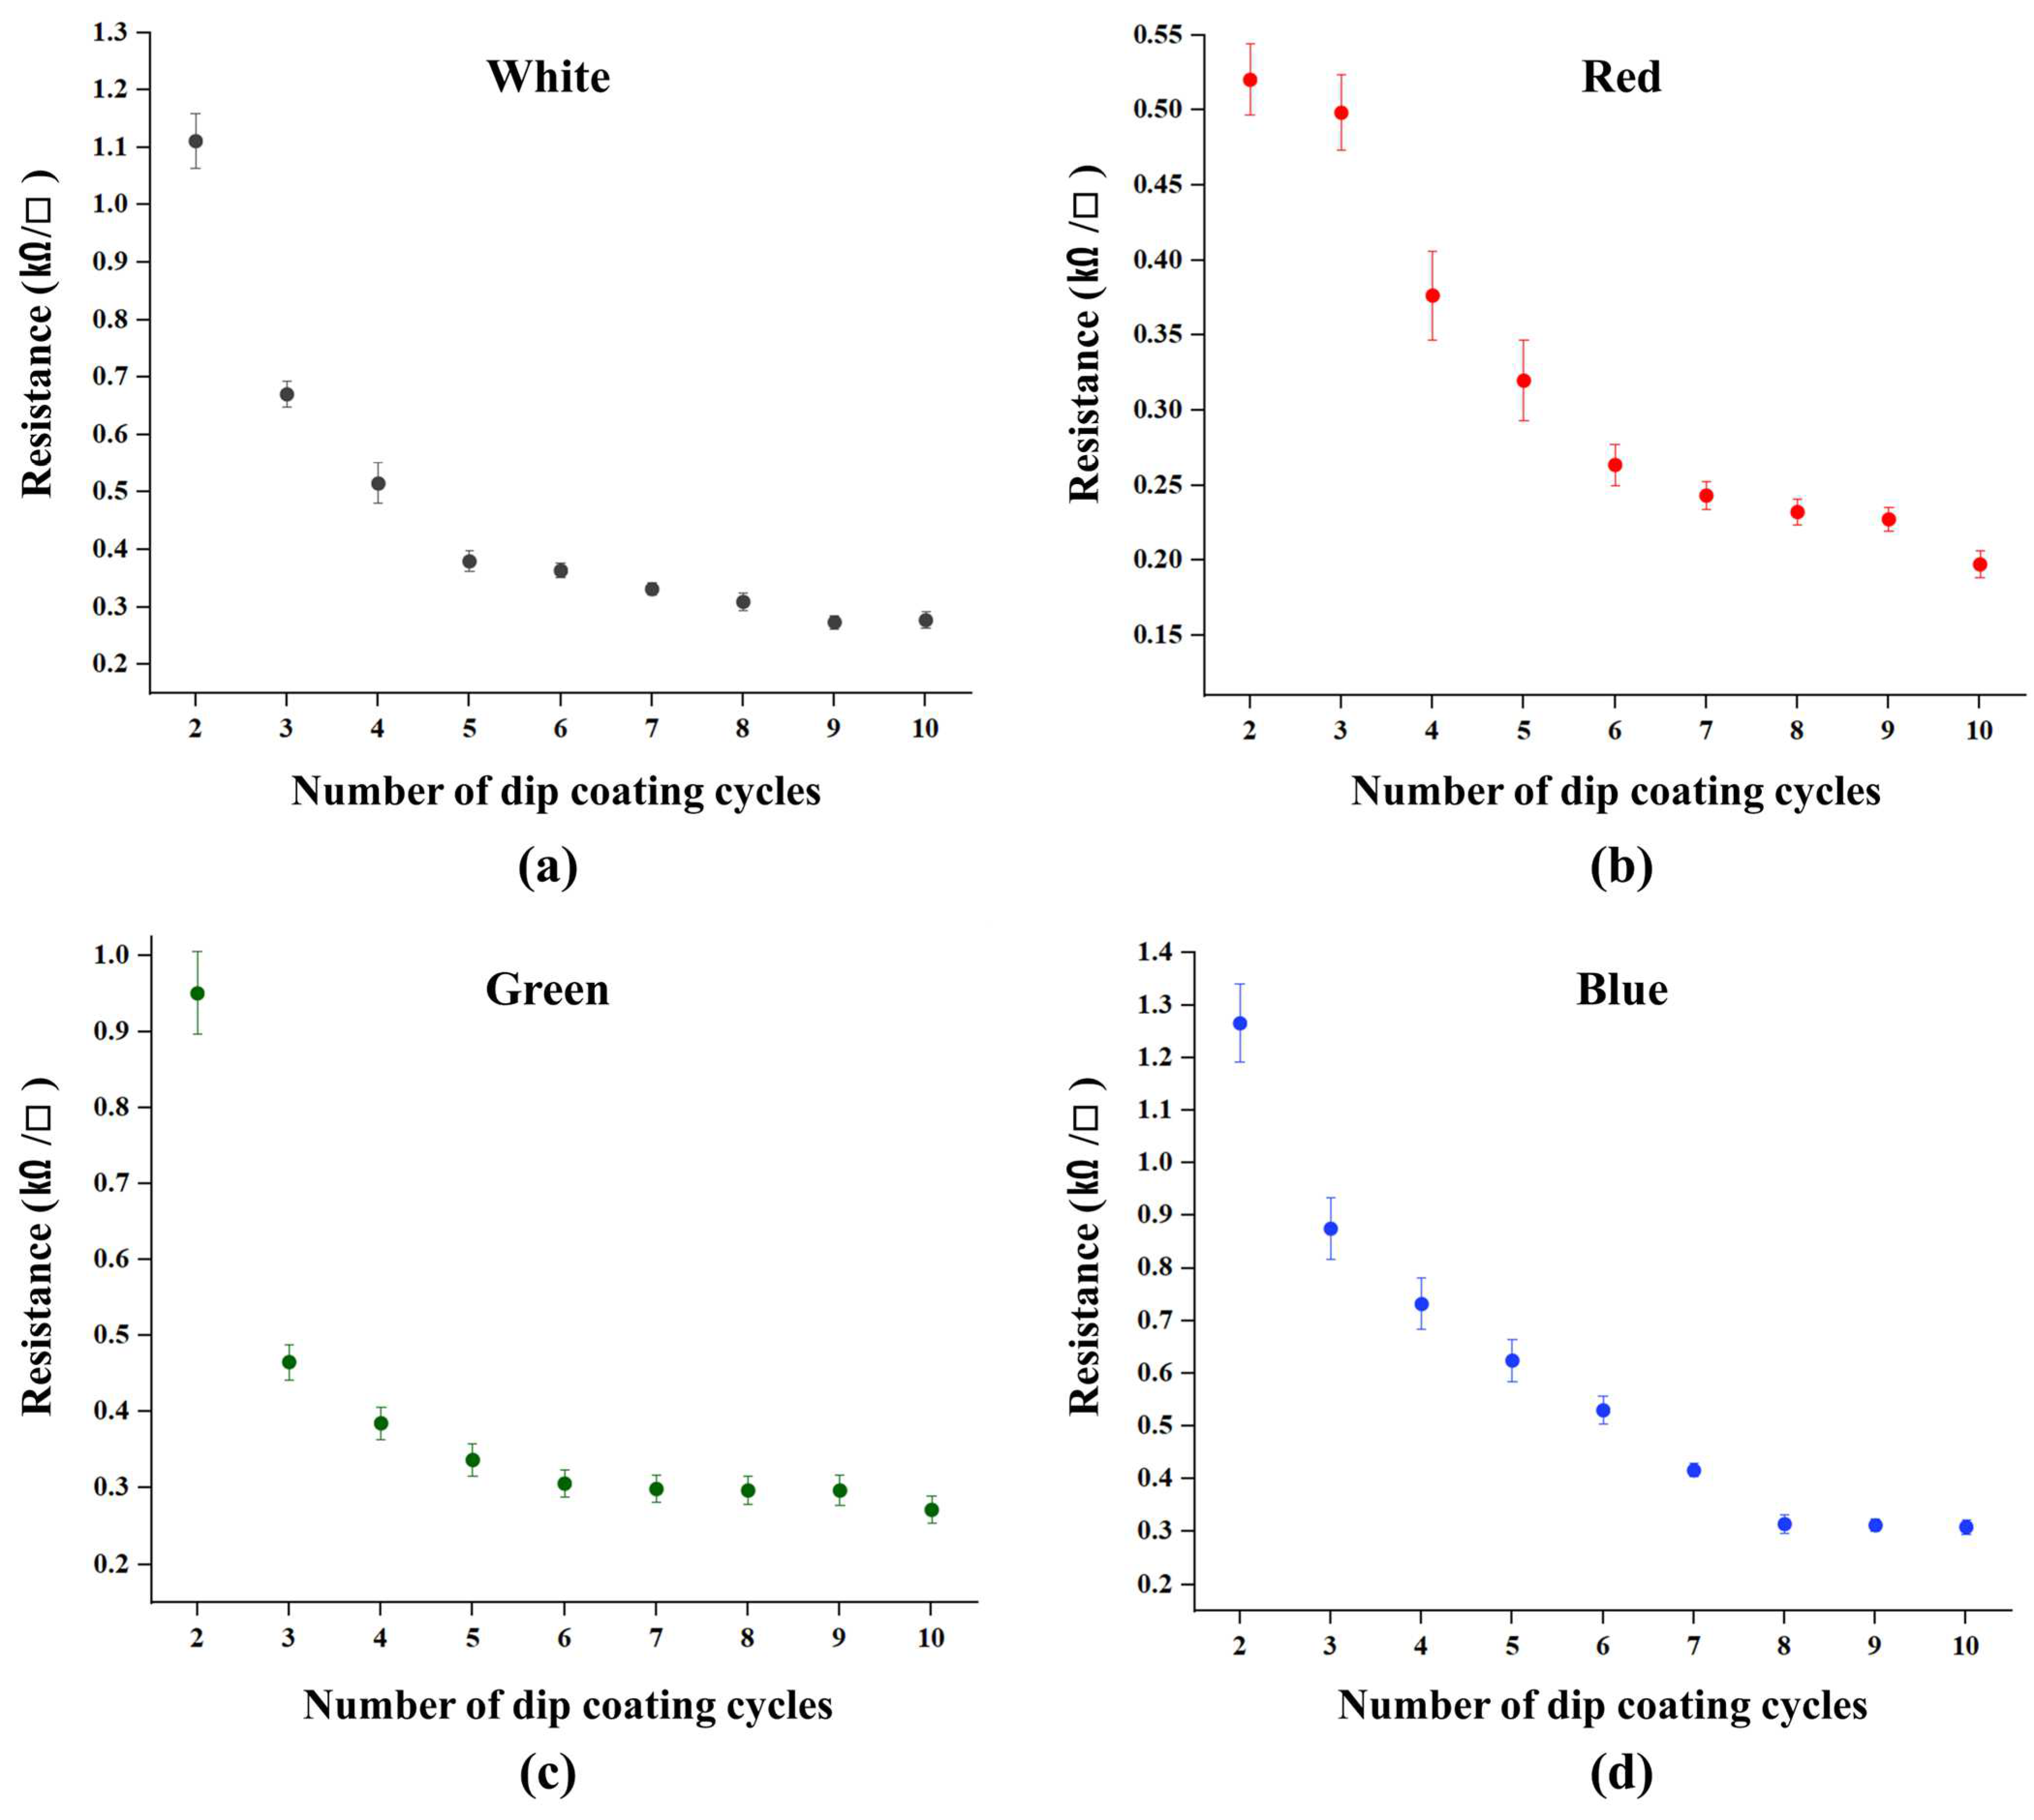
Figure 5c) demonstrated that as the number of dip-coating cycles increased, the distribution of SWCNT particles became more uniform, and their density increased. These findings suggest that successive dip-coating cycles lead to the accumulation of a greater number of SWCNT particles on the fabric surface, thereby enhancing conductivity. Additionally, since SWCNTs absorb a broad range of visible light, an increase in coating cycles resulted in reduced light reflection, causing the fabric to appear progressively darker. As the number of dip-coating cycles increased, the measured resistance exhibited a gradual decrease, indicating a direct correlation with the increasing density of conductive particles (
Figure 6). While additional coating cycles continued to enhance conductivity by forming more conductive pathways, the rate of resistance reduction diminished and eventually converged beyond a certain number of coating cycles, suggesting saturation in particle accumulation.
3.1.2. Data Analysis and Preprocessing Results
In this study, MATLAB was used for data analysis and statistical validation. To examine the statistical relationship between grayscale intensity and resistance for each fabric color, ANOVA analysis was performed. ANOVA assesses whether the mean differences between groups are statistically significant by calculating the F-value based on the ratio of between-group variance (SS_between) to within-group variance (SS_within). This analysis enables the evaluation of the correlation between grayscale intensity and resistance. Based on this, the null hypothesis (i.e., no significant difference among group means) is tested, and statistical significance is assessed using the
p-value. Conventionally, a
p-value below 0.05 indicates a statistically significant difference between groups. In this study, ANOVA was conducted using MATLAB’s anova1() function, which computes the F-value based on the between-group and within-group variances. The statistical significance of the observed differences was assessed by comparing the F-value to the F-distribution, considering the degrees of freedom
,
to derive the corresponding
p-value and determine the likelihood that the observed differences occurred by chance. In this study,
represents the number of groups,
denotes the number of samples within each group, and
indicates the total number of samples. Additionally,
refers to an individual sample in group
,
denotes the mean of group
, and
represents the overall mean. Subsequently, the mean square (MS) was obtained by dividing the between-group variance by the degrees of freedom
and the within-group variance by the degrees of freedom
. Finally, the F-value was calculated as the ratio of the between-group mean square to the within-group mean square, which was used to assess the statistical significance of the differences between group means.
The ANOVA analysis conducted on the entire dataset yielded an F-value of 1.68 and a p-value of 2.48426 × 10⁻⁸, confirming a statistically significant relationship between grayscale intensity and resistance. Additionally, the between-group sum of squares (SS) was 390,576, the degrees of freedom (df) were 460, and the mean square (MS) was 849.078, indicating that the probability of the observed differences occurring by chance is extremely low. When analyzed by fabric color, white (W) and green (G) fabrics exhibited strong correlations, with p-values of 2.3412 × 10⁻¹³ and 8.4938 × 10⁻⁷, respectively. In contrast, red (R) and blue (B) fabrics had p-values of 0.0047 and 0.0222, indicating a statistically significant relationship but with a relatively weaker correlation. Ultimately, as all fabric colors exhibited p-values below 0.05, the relationship between brightness and resistance was statistically significant across all samples. These findings support the feasibility of using a CNN model to accurately predict resistance values based on brightness patterns extracted from fabric images.
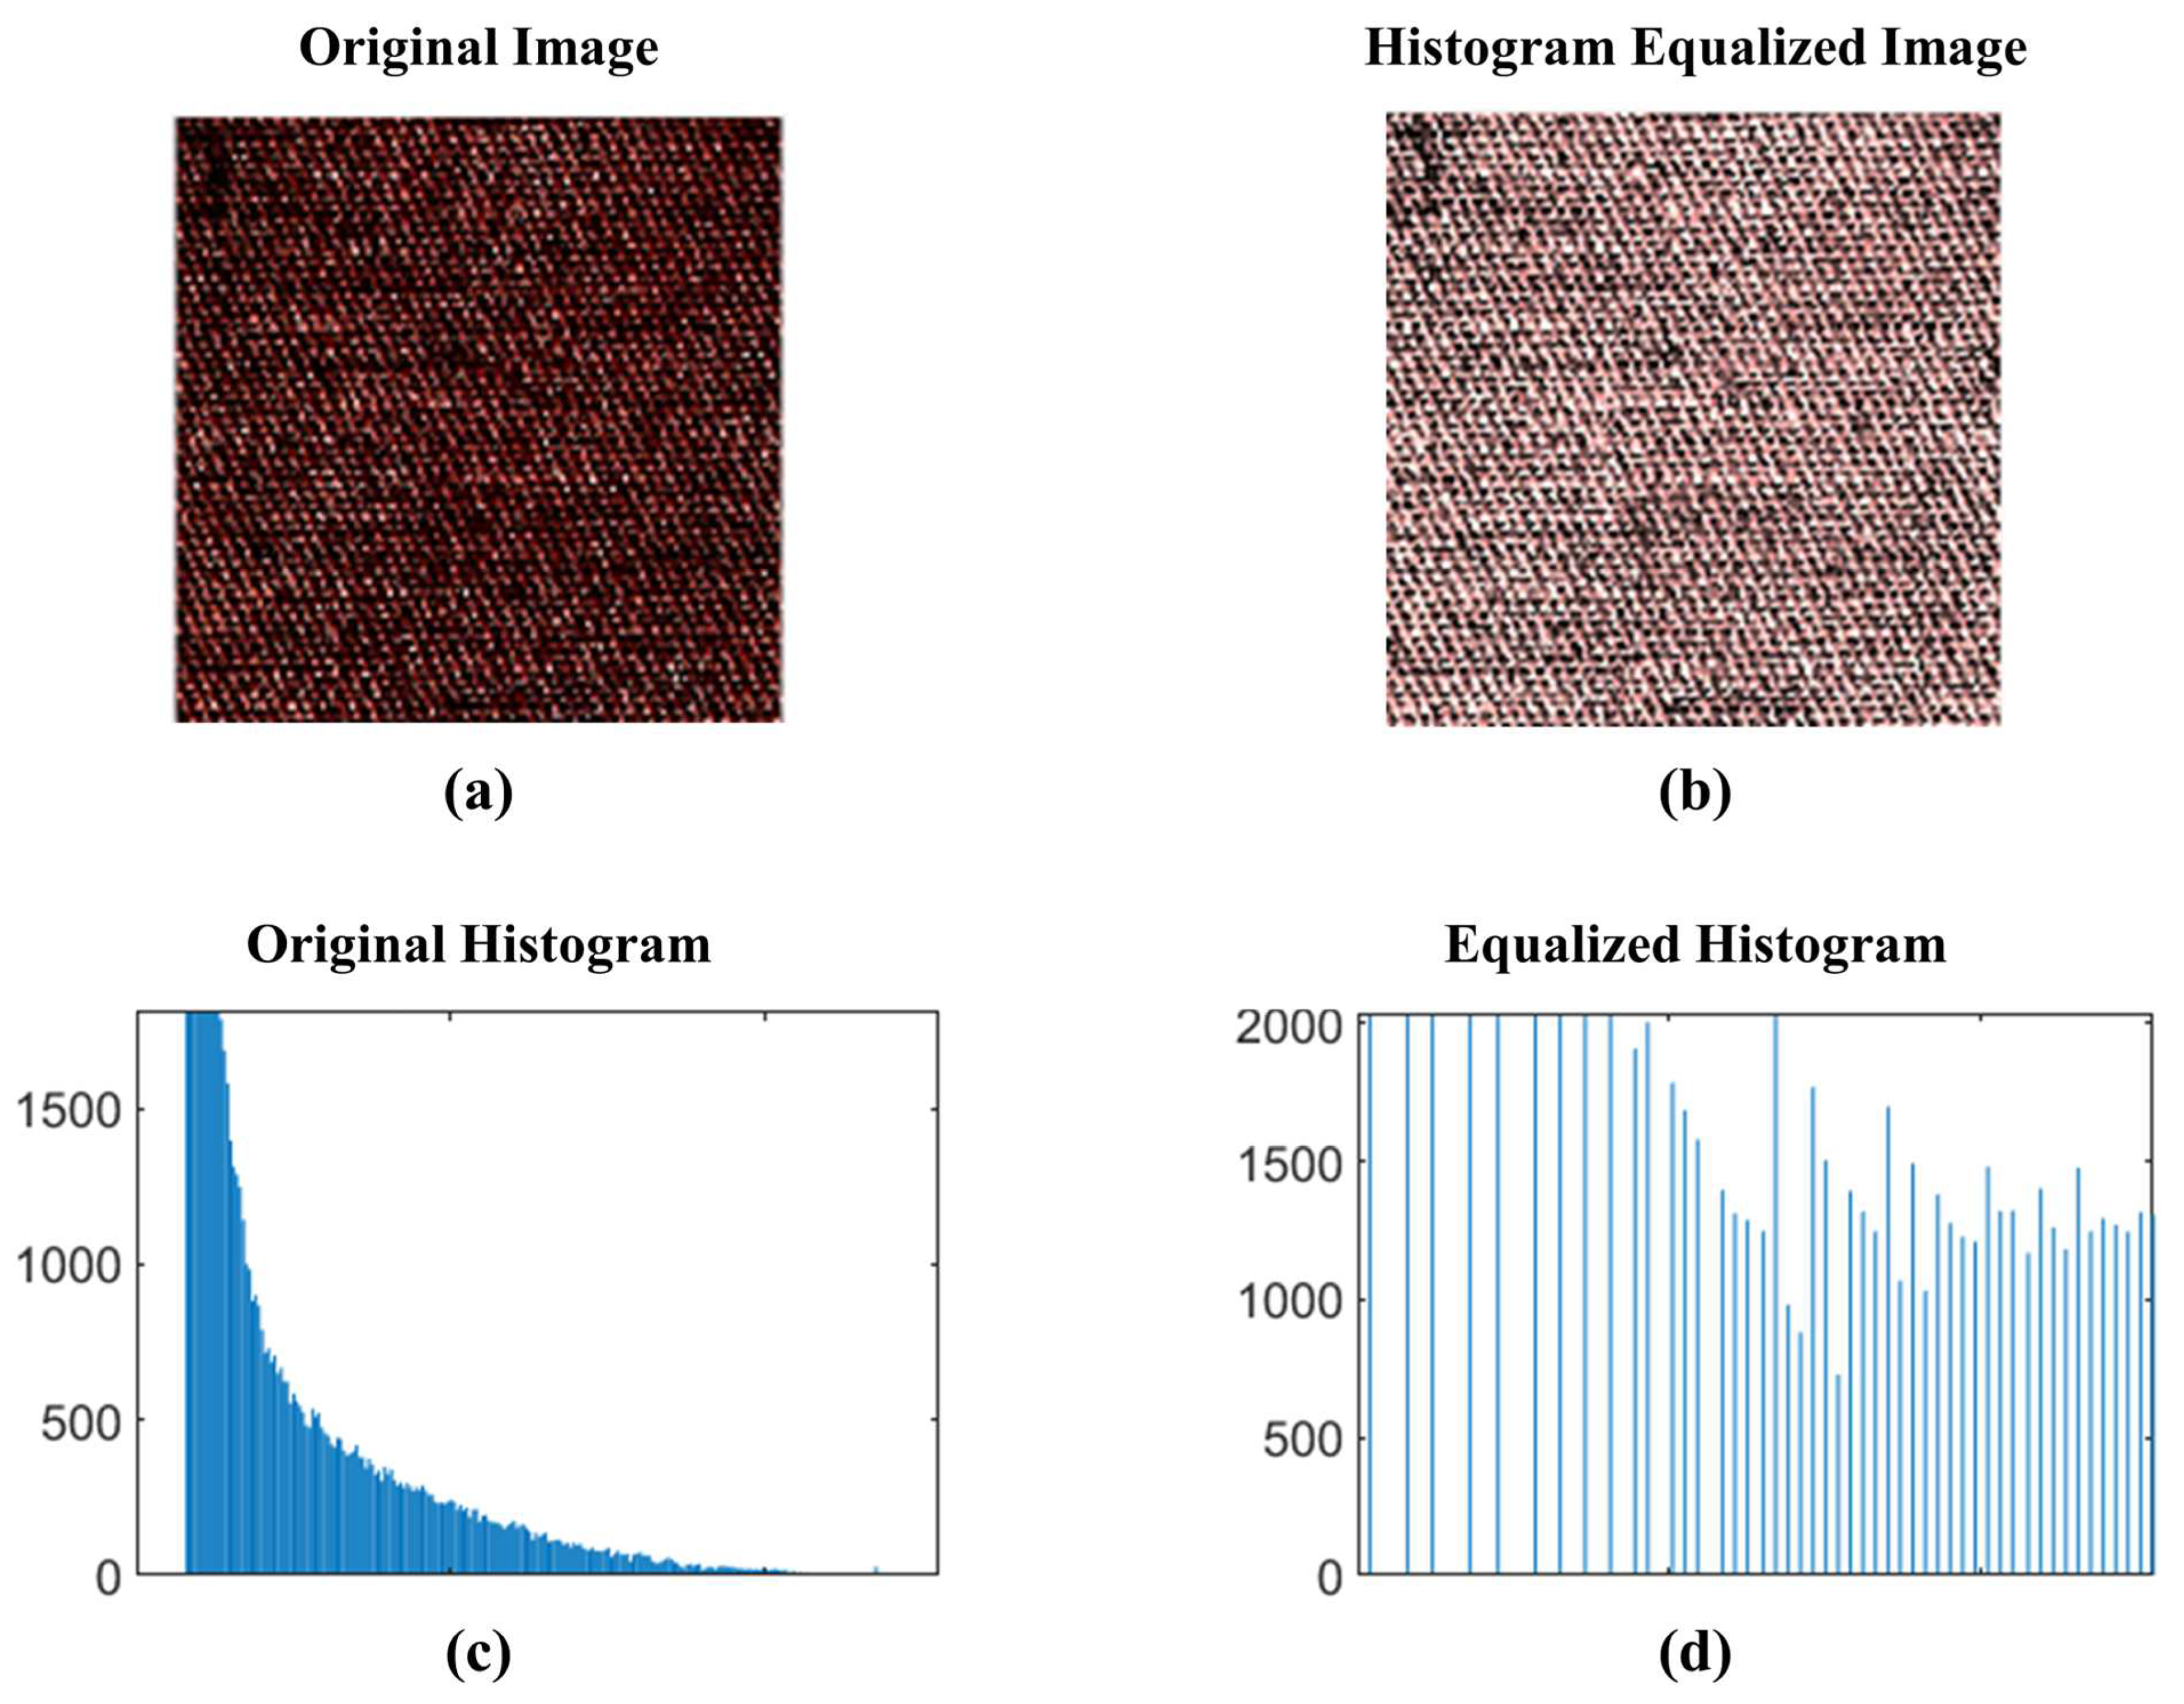
We used histogram-equalized Fabric 5 as the final image dataset.
Figure 7 visually compares the fabric images before and after histogram equalization, and illustrates the corresponding histogram distributions. (a) represents the fabric image before histogram equalization, while (b) shows the same fabric after processing. Histogram equalization adjusts image contrast, enhancing specific regions and emphasizing patterns. While visual differences before and after processing can be observed, the processed image may, in some cases, appear less sharp to the human eye. However, as illustrated in (c) and (d), histogram equalization expands the dynamic range of the data, resulting in a more uniform distribution. This transformation is crucial for improving the CNN model’s ability to learn brightness patterns in fabric images. Unlike human visual perception, histogram equalization enhances feature extraction, thereby contributing to more effective model learning and improved predictive performance.
3.2. ResNet-Based CNN Results
The experiments in this study were conducted using MATLAB R2023 software on a system based on the Z790 AORUS ELITE motherboard, equipped with a 13th Gen Intel
® Core™ i9-13900K processor (Intel Corporation, Santa Clara, CA, USA) (3.00 GHz), 32 GB of memory, and an NVIDIA GeForce RTX 4090 graphics card (driver version 536.40). For training the ResNet-based CNN model, the Adam optimization algorithm was utilized. The training conditions were set to a maximum of 50 epochs, a mini-batch size of 32, and an initial learning rate of 0.0005. To enhance training stability, the dataset was shuffled randomly at each epoch. Additionally, to evaluate model performance throughout training, validation data consisting of test images and their corresponding labels were used. Validation was conducted every five epochs to monitor model generalization and prevent overfitting.
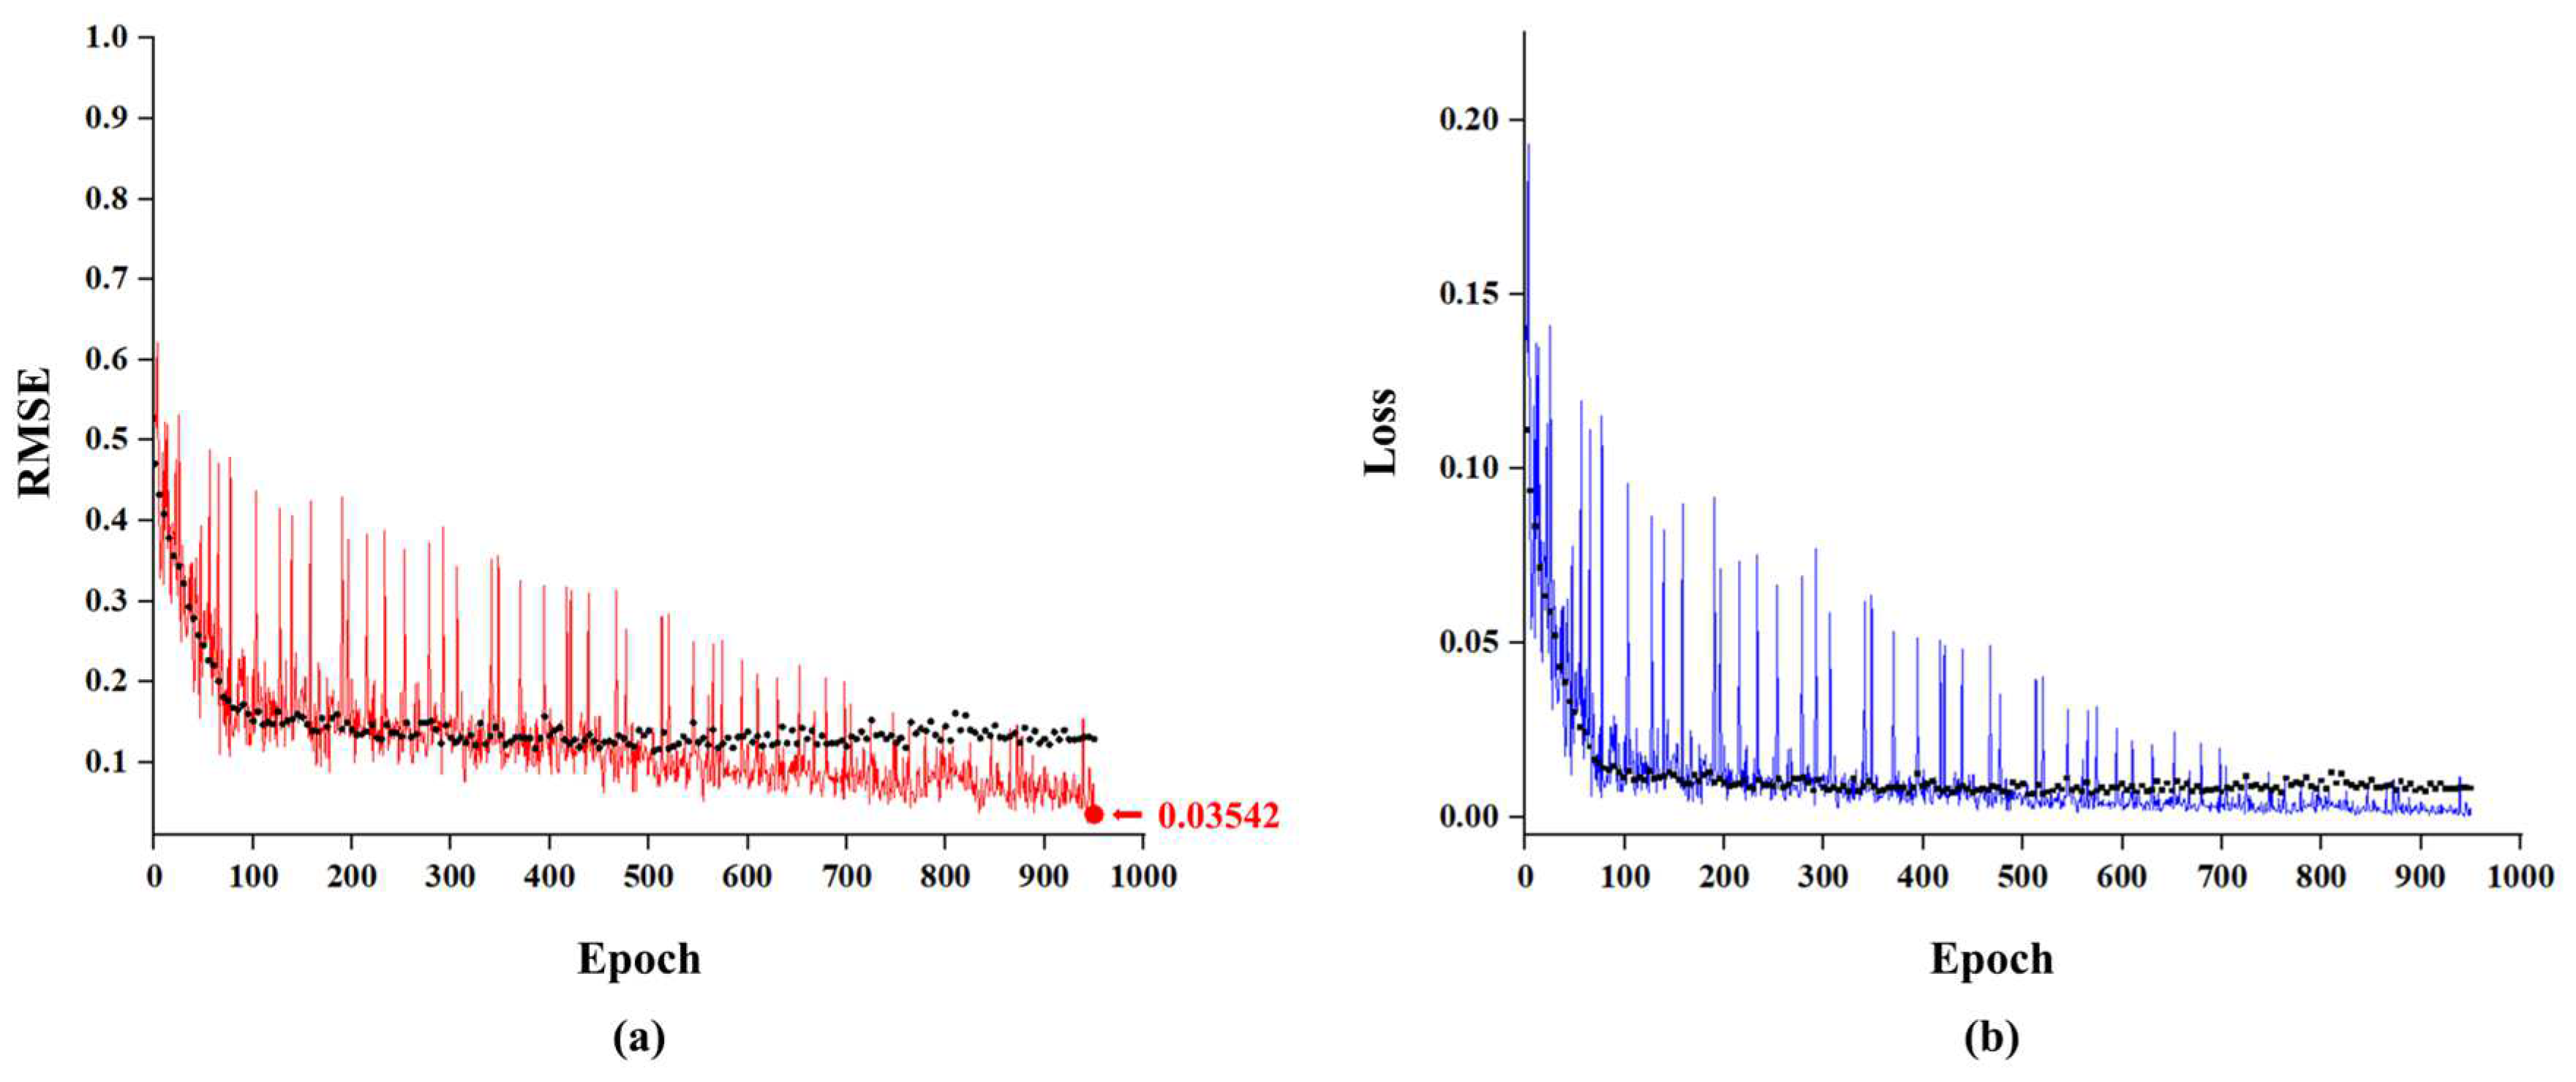
Figure 8 illustrates the variations in root mean square error (RMSE) and loss values during both training and validation. The figure demonstrates a steady decline in RMSE and loss, indicating that the model effectively learned from the data. Notably, the validation RMSE closely converged with the training RMSE, confirming that the ResNet model successfully trained without overfitting. The final training results yielded an RMSE of 0.0622 and a coefficient of determination (R
2) of 0.9416. These results indicate that the ResNet model exhibited very low prediction error across the entire dataset, demonstrating stable performance. Given its ability to accurately capture the relationship between grayscale intensity and resistance, the model effectively learned the underlying patterns. Furthermore, the low RMSE and high R
2 values suggest that the residual learning structure of the ResNet model successfully handled color variability and complex patterns within the data.
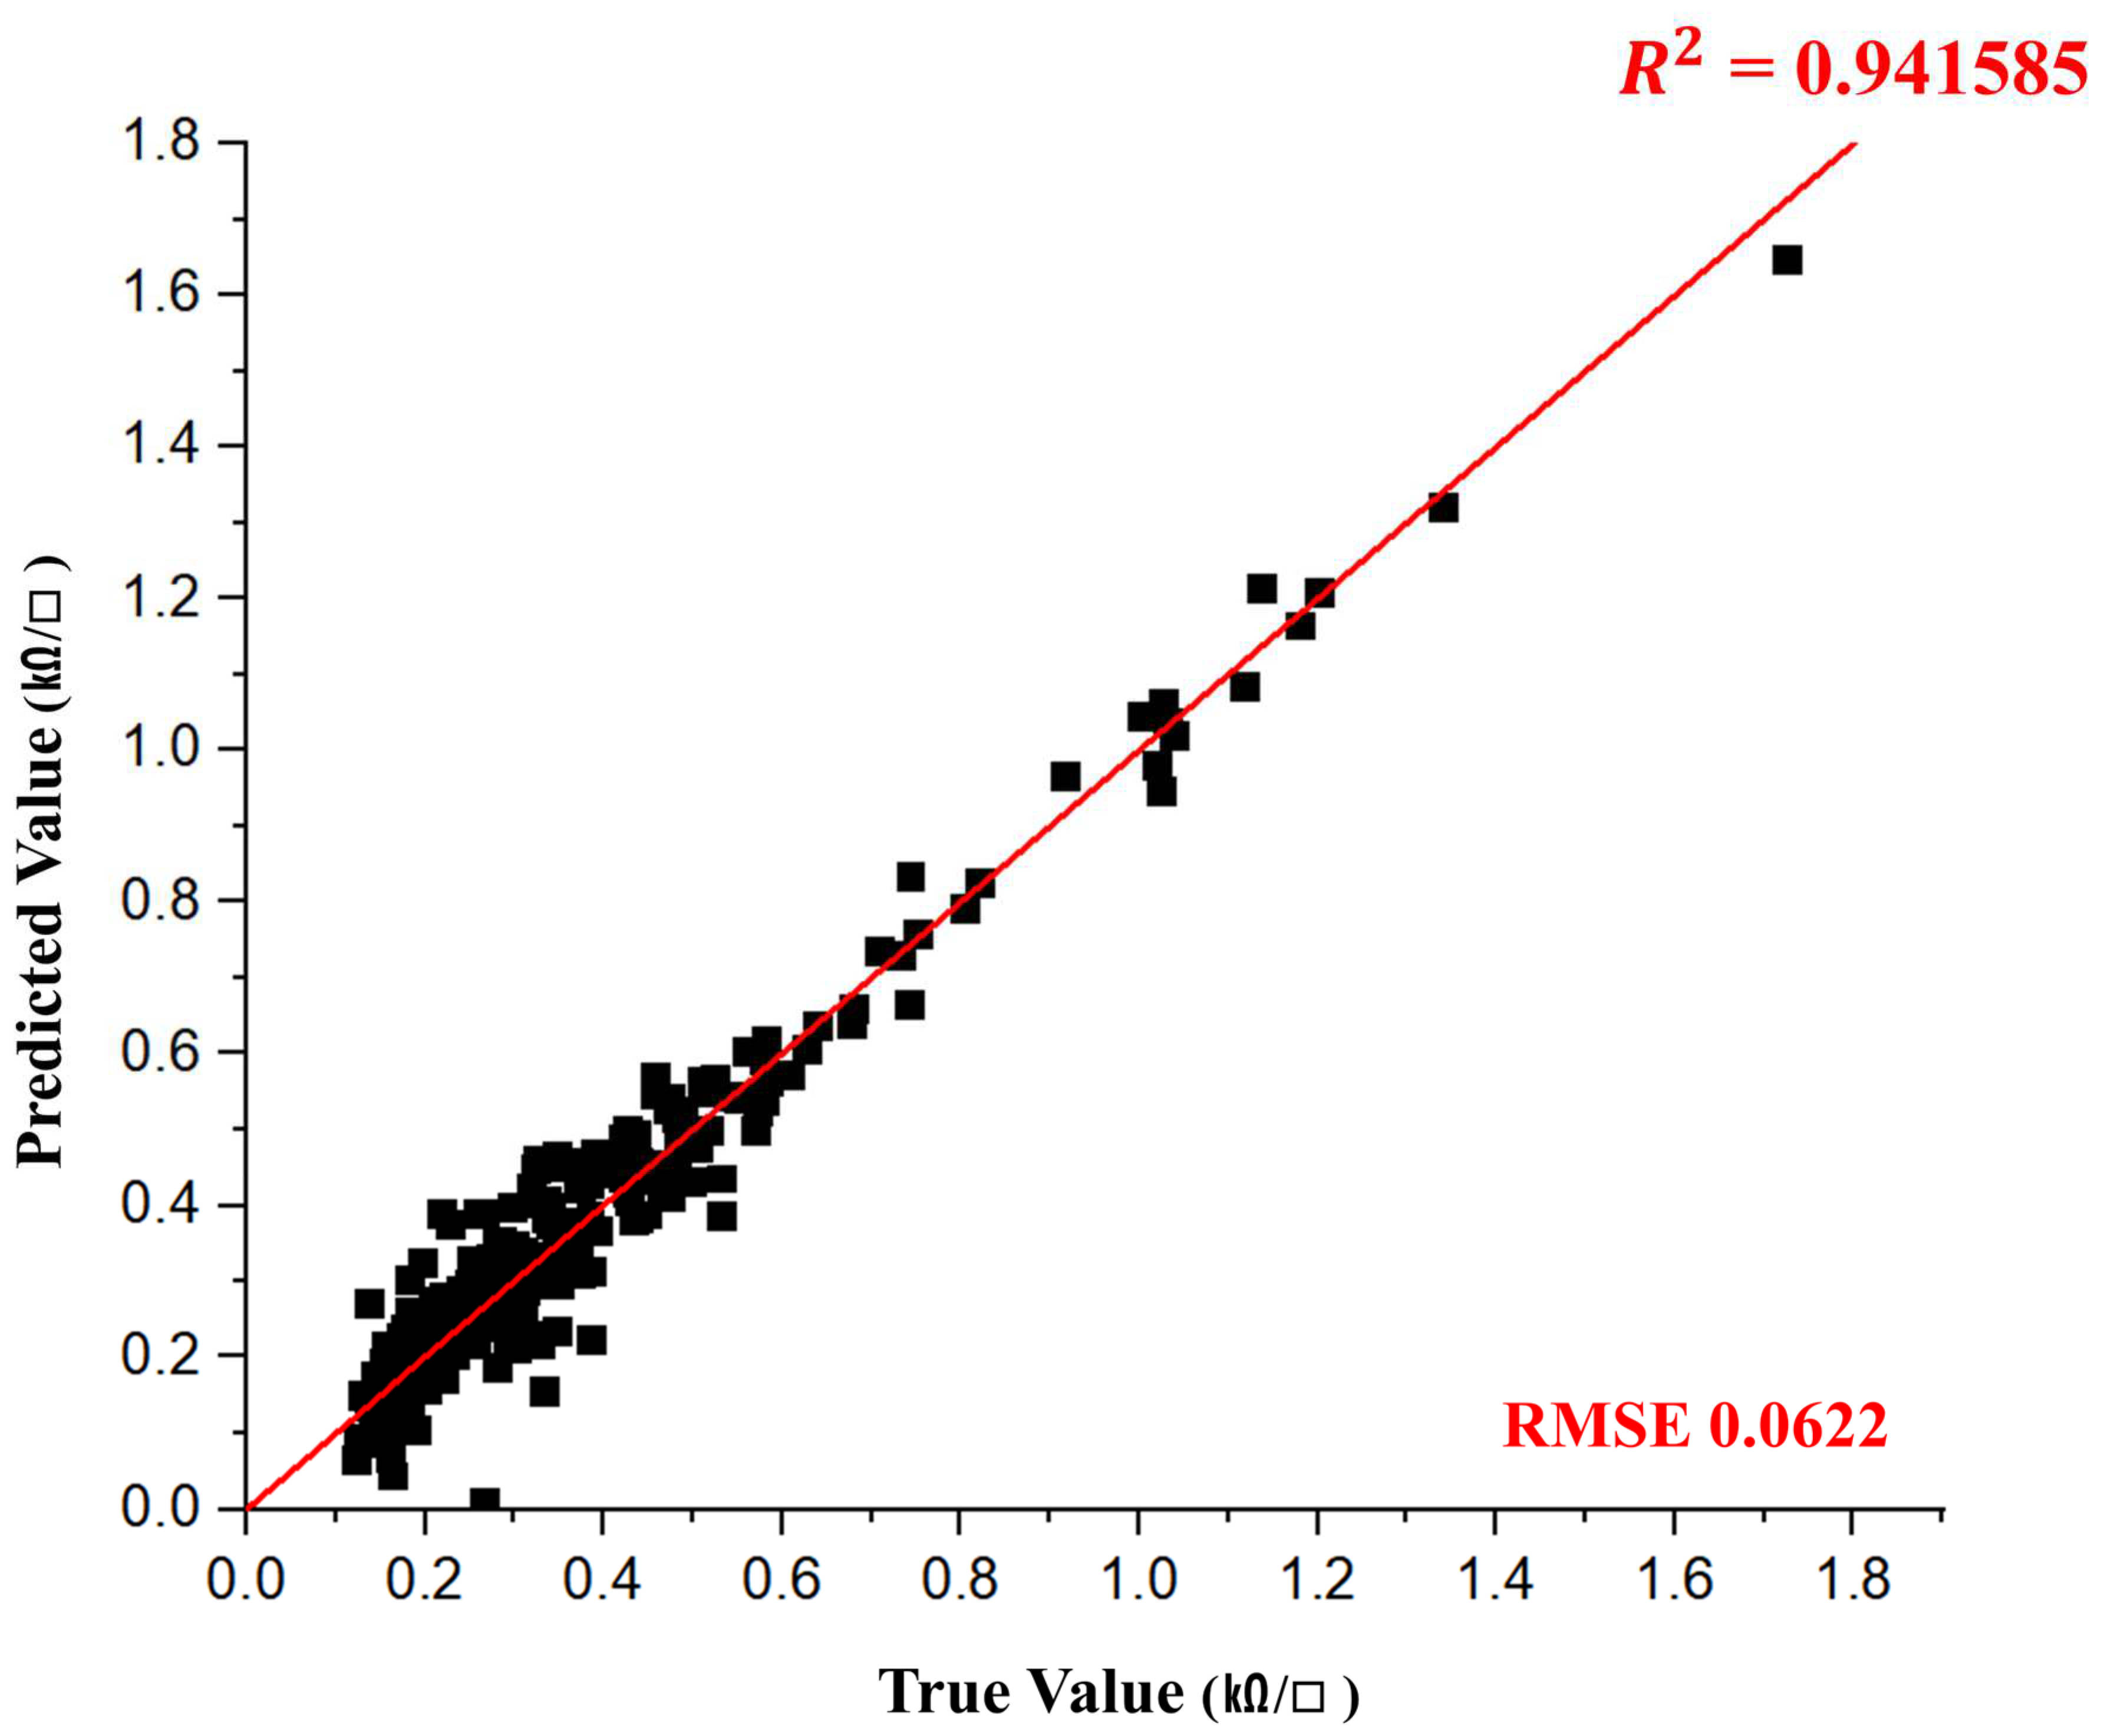
Figure 9 presents a comparison between actual and predicted resistance values, demonstrating that the ResNet model’s predictions closely align with real values across most data points. This result confirms the high predictive accuracy of the proposed model. Furthermore, these findings indicate that the ResNet model can operate robustly even in datasets containing complex variables such as color variability.
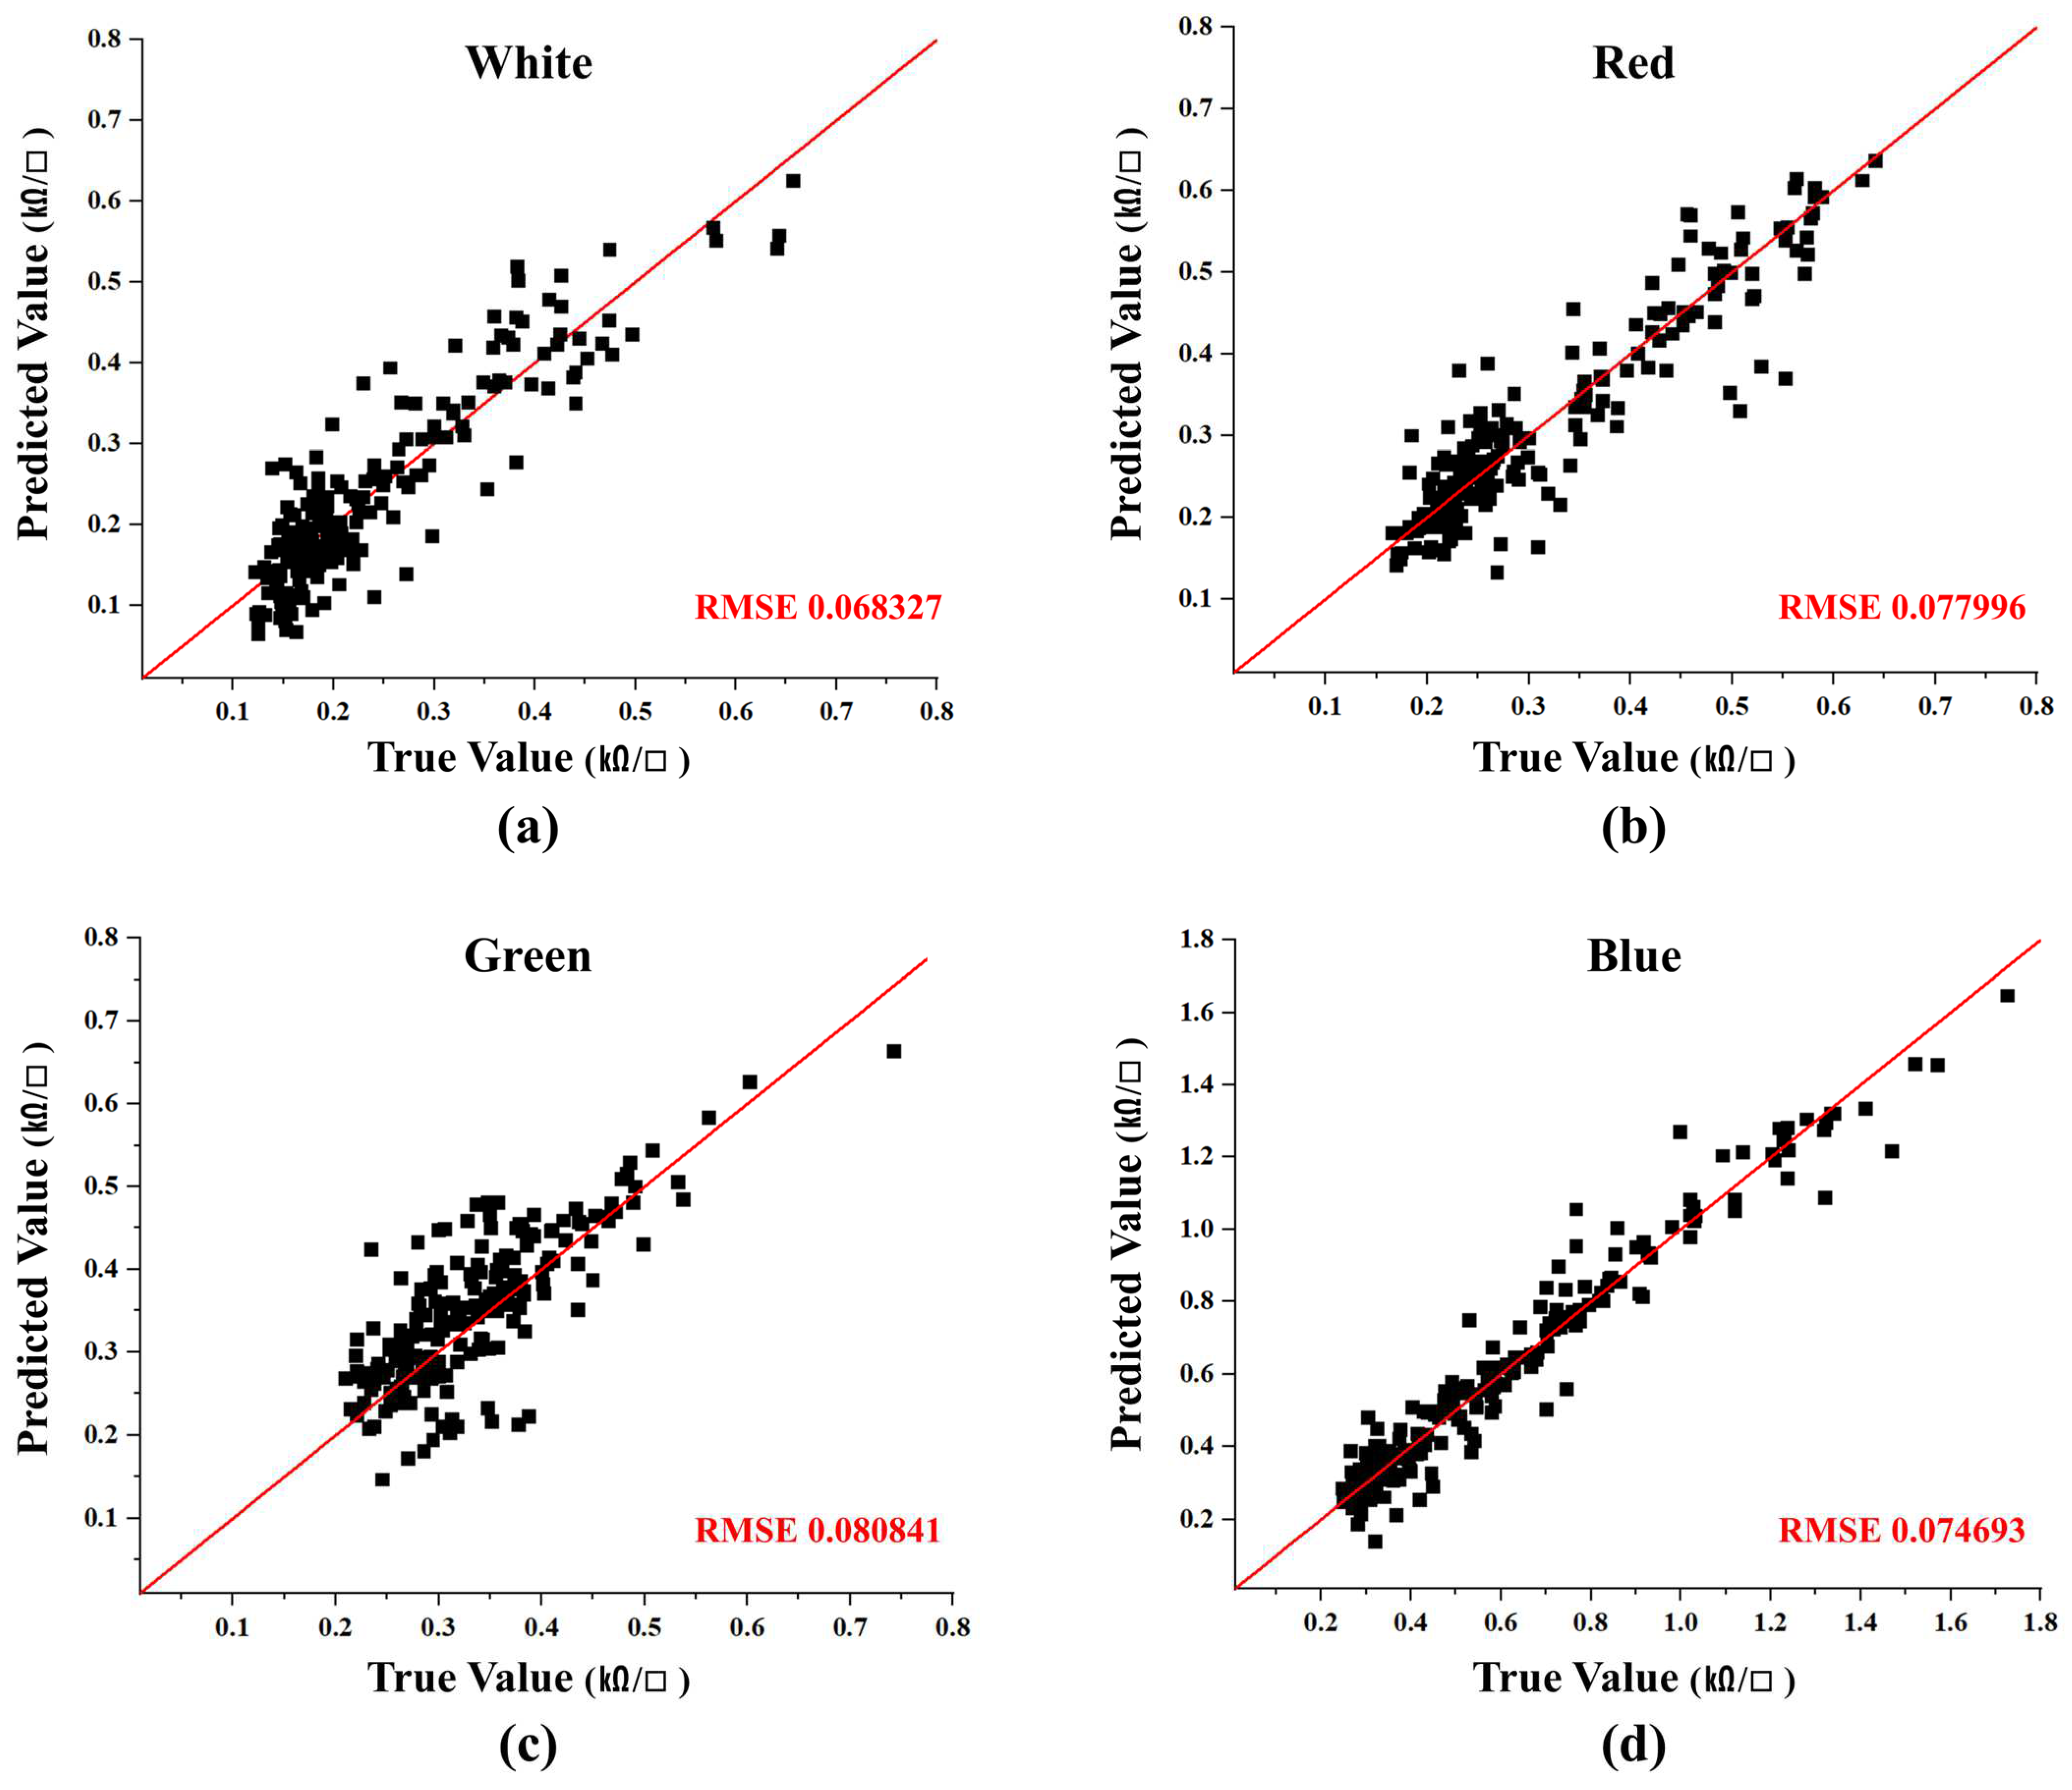
The prediction performances of the ResNet model for each fabric color recorded RMSE values of 0.0683, 0.0780, 0.0808, and 0.0747 for white, red, green, and blue fabrics, respectively. The white fabric exhibited the lowest RMSE due to the absence of color variability, which enhanced model training. Meanwhile, the red, green, and blue fabrics also demonstrated consistently low RMSE values, demonstrating that the ResNet model effectively accounted for color variability.
Figure 10a–d visually illustrate the distribution of actual and predicted values for each fabric color. Although minor variations were observed across different colors, the ResNet model achieved stable and high prediction accuracy across all fabric types. Notably, the model demonstrated strong performance even when dealing with complex variables such as color variability, further validating the effectiveness of the proposed non-contact image-based resistance evaluation method.
To compare with the performance of the ResNet model, a Baseline CNN model was designed and evaluated using the same dataset. The baseline CNN consisted of a relatively simple architecture comprising convolutional layers, max-pooling layers, fully connected layers, and a regression layer. To optimize performance, RMSprop was used as the optimization algorithm, along with a learning rate scheduling mechanism. The final RMSE of the baseline CNN was 0.1474, with an R
2 value of 0.620103. This indicates that the baseline CNN failed to adequately capture the variability within the data, resulting in predictions that exhibit a weaker correlation with the actual values.
Figure 11 presents the distribution of actual and predicted values for the baseline CNN, visually demonstrating that while the model learned the general patterns in the data, its predictive accuracy was limited when applied to complex datasets. In contrast, the ResNet model achieved lower prediction error, and demonstrated the ability to effectively capture grayscale pattern variations caused by color differences while maintaining high prediction accuracy. These results suggest that, compared to the baseline CNN, the ResNet model more effectively learns the data variability introduced by color differences, leading to more accurate resistance predictions. Furthermore, the findings confirm that the ResNet model surpasses the baseline CNN in handling data complexity, further reinforcing the effectiveness of the non-contact, image-based resistance evaluation method.
4. Discussion
This study proposes a non-contact image analysis method for predicting the resistance of SWCNT dip-coated colored conductive fabrics using ResNet CNN. The experimental results confirm that the ResNet model effectively learns the relationship between grayscale variations caused by color differences and resistance, demonstrating superior prediction performance compared to conventional CNN models.
SEM analysis was conducted to compare the surface microstructure before and after dip-coating. The results confirm that no conductive particles were observed in the uncoated fabric, whereas an increase in dip-coating cycles led to a higher density and a more uniform distribution of SWCNT particles. Additionally, as the number of coating cycles increased, the measured resistance exhibited a consistent decreasing trend, indicating the stable formation of conductive pathways within the coating layer. This suggests that the progressive development of conductive networks plays a crucial role in resistance reduction. Furthermore, SEM analysis revealed that as the amount of coated SWCNT increased, the fabric gradually darkened, which can be attributed to the light absorption properties of SWCNTs reducing surface reflectance. These findings demonstrate that non-contact image analysis effectively captures the correlation between SWCNT coating structure and electrical properties, further validating its applicability for resistance prediction.
The ANOVA analysis confirmed a statistically significant correlation between grayscale intensity and resistance (p-value = 2.48426 × 10⁻⁸). Color-specific analysis revealed that white and green fabrics exhibited relatively high correlation, whereas red and blue fabrics showed lower correlation. This suggests that differences in reflectance and grayscale variations across colors may influence the model’s learning process. Therefore, applying additional preprocessing techniques in future studies is expected to further enhance performance.
The performance evaluation of the proposed non-contact, image-based resistance prediction model demonstrated that the ResNet CNN achieved superior predictive accuracy compared to conventional models. The ResNet CNN recorded an RMSE of 0.0622 and a coefficient of determination (R2) of 0.9416, exhibiting a 58% improvement in predictive performance over the baseline CNN. Notably, the lowest RMSE was observed in white fabrics, likely due to their distinct grayscale contrast, which facilitated model learning. Additionally, the model maintained relatively low RMSE values for red, green, and blue fabrics, indicating that the impact of color variations on predictive performance was effectively minimized. Throughout the training process, RMSE and loss values steadily decreased, and the model consistently maintained stable performance on the validation dataset without signs of overfitting. Histogram equalization adjusted grayscale contrast to enhance model learning. While visual differences may be perceptible to the naked eye, this preprocessing technique had a positive impact on improving the model’s performance.
This study developed a non-contact, image-based resistance prediction model for SWCNT dip-coated cotton fabrics, proposing a novel approach to evaluating the electrical properties of conductive textiles. The proposed method demonstrates the potential to overcome the limitations of conventional contact-based measurements; however, further investigations are required to expand its applicability. This study focused on 100% cotton twill fabric, as cotton is a widely used textile material and provides relatively uniform surface characteristics after SWCNT coating. Future research will involve constructing an expanded dataset that includes various fabric compositions and colors to evaluate the generalization performance of the convolutional neural network model. Additionally, the effects of fabric material and weaving structure on electrical properties and model learning will be investigated. Furthermore, datasets captured under diverse lighting conditions will be utilized to account for real-world variations in illumination, and image correction techniques will be applied to enhance the model’s generalization performance. Through these efforts, the applicability of the proposed non-contact resistance prediction method will be assessed across various fabrics, colors, and environmental conditions.
This study proposes a novel approach to resistance prediction through non-contact image-based analysis, exploring its potential to expand methods for evaluating the electrical properties of conductive fabrics. Additionally, it aims to validate the effectiveness of non-contact image analysis in resistance prediction and investigate ways to complement conventional contact-based measurement techniques. Future research should further evaluate the model’s performance across various environments and materials, refining its abilities to enable practical applications in conductive fabric characterization and quality control. This method has the potential to be integrated into automated monitoring systems for the real-time quality assessment of conductive textiles in manufacturing processes. Moreover, it could be combined with traditional contact-based measurements to establish a hybrid approach for more precise quality inspection. To ensure stable resistance prediction under diverse lighting and environmental conditions, future studies should enhance image correction and data preprocessing techniques. Furthermore, integrating this approach with mobile or portable devices could facilitate on-site diagnostics, evolving into a practical non-contact measurement system. Through these advancements, the proposed technique is expected to establish itself as a new approach for non-contact conductive textile evaluation, with continuous research and development further refining it into a more sophisticated analytical tool.
5. Conclusions
This study proposes a ResNet-based CNN model for predicting the resistance of SWCNT dip-coated colored conductive fabrics using non-contact image analysis. The ANOVA analysis of the relationship between grayscale intensity and resistance yielded a p-value of 2.48426 × 10⁻⁸ for the entire dataset, confirming a statistically significant correlation between the two variables. Histogram equalization enhanced grayscale contrast, improving model training efficiency. The ResNet model achieved an RMSE of 0.0622 and a coefficient of determination (R2) of 0.9416, demonstrating high predictive accuracy. The RMSE values for each fabric color were 0.0683 (white), 0.0780 (red), 0.0808 (green), and 0.0747 (blue), indicating that the model effectively captured grayscale pattern variations caused by color differences. Compared to the baseline CNN, the ResNet model exhibited an approximate 58% reduction in RMSE and a significant improvement in R2, demonstrating its ability to handle the complex data variability introduced by color differences. The proposed non-contact, image-based resistance prediction method has the potential to complement conventional contact-based measurement techniques and contribute to the quality control and characterization of conductive fabrics. Future research should evaluate the model’s applicability across various textile materials and lighting conditions while refining data correction techniques to enhance its generalization and expand its practical implementation.
Author Contributions
As the corresponding author, J.-Y.K. was responsible for the overall study design and manuscript drafting. Meanwhile, E.K. oversaw experiment design, data collection, data processing, and modeling. S.-U.K. was in charge of data cleaning and material selection. J.-C.L. and M.J. contributed to preparing experimental data. All authors have read and agreed to the published version of the manuscript.
Funding
This research was partly supported by the Technology Innovation Program (or Industrial Strategic Technology Development Program-Materials/Parts Package Type) (20016038, Development of the textile–IT converged digital sensor modules for smart wear to monitor bio and activity signals in exercise, and KS standard) funded by the Ministry of Trade, Industry and Energy (MOTIE, Republic of Korea) and the Korea Institute for Advancement of Technology (KIAT) grant funded by the Korea Government (MOTIE) (P0012770, The Competency Development Program for Industry Specialist).
Data Availability Statement
The original contributions presented in this study are included in the article. Further inquiries can be directed to the corresponding author(s).
Conflicts of Interest
The authors declare that they have no competing interests.
References
- Stoppa, M.; Chiolerio, A. Wearable Electronics and Smart Textiles: A Critical Review. Sensors 2014, 14, 11957–11992. [Google Scholar] [CrossRef] [PubMed]
- Boumegnane, A.; Douhi, S.; Batine, A.; Dormois, T.; Cochrane, C.; Nadi, A.; Cherkaoui, O.; Tahiri, M. Rheological Properties and Inkjet Printability of a Green Silver-Based Conductive Ink for Wearable Flexible Textile Antennas. Sensors 2024, 24, 2938. [Google Scholar] [CrossRef]
- Mokhtari, F.; Cheng, Z.; Raad, R.; Xi, J.; Foroughi, J. Piezofibers to smart textiles: A review on recent advances and future outlook for wearable technology. J. Mater. Chem. A 2020, 8, 9496–9522. [Google Scholar] [CrossRef]
- Krifa, M. Electrically Conductive Textile Materials—Application in Flexible Sensors and Antennas. Textiles 2021, 1, 239–257. [Google Scholar] [CrossRef]
- Wang, B.; Facchetti, A. Mechanically Flexible Conductors for Stretchable and Wearable E-Skin and E-Textile Devices. Adv. Mater. 2019, 31, e1901408. [Google Scholar]
- Wen, J.; Xu, B.; Gao, Y.; Li, M.; Fu, H. Wearable technologies enable high-performance textile supercapacitors with flexible, breathable and wearable characteristics for future energy storage. Energy Storage Mater. 2021, 37, 94–122. [Google Scholar] [CrossRef]
- Azani, M.R.; Hassanpour, A. Electronic textiles (E-Textiles): Types, fabrication methods, and recent strategies to overcome durability challenges (washability & flexibility). J. Mater. Sci. Mater. Electron. 2024, 35, 1–51. [Google Scholar]
- Chatterjee, K.; Tabor, J.; Ghosh, T.K. Electrically Conductive Coatings for Fiber-Based E-Textiles. Fibers 2019, 7, 51. [Google Scholar] [CrossRef]
- Ismar, E.; Kurşun Bahadir, S.; Kalaoglu, F.; Koncar, V. Futuristic Clothes: Electronic Textiles and Wearable Technologies. Glob. Chall. 2020, 4, 1900092. [Google Scholar]
- Alhashmi Alamer, F.; Almalki, G.A. Fabrication of Conductive Fabrics Based on SWCNTs, MWCNTs and Graphene and Their Applications: A Review. Polymers 2022, 14, 5376. [Google Scholar] [CrossRef]
- Ghasempour, R.; Narei, H. CNT Basics and Characteristics—ScienceDirect. Carbon Nanotub. Reinf. Polym. 2018, 1–24. [Google Scholar]
- Meirowitz, R.E. Coating processes and techniques for smart textiles—ScienceDirect. Act. Coat. Smart Text. 2016, 159–177. [Google Scholar]
- Javaid, S.; Mahmood, A.; Nasir, H.; Iqbal, M.; Ahmed, N.; Ahmad, N.M. Layer-By-Layer Self-Assembled Dip Coating for Antifouling Functionalized Finishing of Cotton Textile. Polymers 2022, 14, 2540. [Google Scholar] [CrossRef]
- Hu, L.; Pasta, M.; La Mantia, F.; Cui, L.; Jeong, S.; Deshazer, H.D.; Choi, J.W.; Han, S.M.; Cui, Y. Stretchable, Porous, and Conductive Energy Textiles. Nano Lett. 2010, 10, 708–714. [Google Scholar]
- Wang, C.; Xia, K.; Wang, H.; Liang, X.; Yin, Z.; Zhang, Y. Advanced Carbon for Flexible and Wearable Electronics. Adv. Mater. 2018, 31, e1801072. [Google Scholar]
- Zhang, S.; Nguyen, N.; Leonhardt, B.; Jolowsky, C.; Hao, A.; Park, J.G.; Liang, R. Carbon-Nanotube-Based Electrical Conductors: Fabrication, Optimization, and Applications. Adv. Electron. Mater. 2019, 5, 1800811. [Google Scholar]
- Wang, G.; Long, S.; Yu, Z.; Zhang, M.; Ye, T.; Li, Y.; Xu, D.; Lv, H.; Liu, Q.; Wang, M.; et al. Improving resistance uniformity and endurance of resistive switching memory by accurately controlling the stress time of pulse program operation. Appl. Phys. Lett. 2015, 106, 092103. [Google Scholar]
- Lee, W.; Park, J.; Kim, S.; Woo, J.; Shin, J.; Lee, D.; Cha, E.; Hwang, H. Improved switching uniformity in resistive random access memory containing metal-doped electrolyte due to thermally agglomerated metallic filaments. Appl. Phys. Lett. 2012, 100, 142106. [Google Scholar]
- Xu, N.; Fang, L.; Chi, Y.; Zhang, C.; Tang, Z. Resistance uniformity of TiO2 memristor with different thin film thickness. In Proceedings of the 14th IEEE International Conference on Nanotechnology, Toronto, ON, Canada, 18–27 August 2014. [Google Scholar]
- Knittel, D.; Schollmeyer, E. Electrically high-conductive textiles. Synth. Met. 2009, 159, 1433–1437. [Google Scholar] [CrossRef]
- Beckmann, L.; Neuhaus, C.; Medrano, G.; Jungbecker, N.; Walter, M.; Gries, T.; Leonhardt, S. Characterization of textile electrodes and conductors using standardized measurement setups. Physiol. Meas. 2010, 31, 233. [Google Scholar] [CrossRef]
- Isings, J. The Influence of Stress and Deformation on the Structure of the Cotton Fiber. Text. Res. J. 1964, 34, 236–246. [Google Scholar]
- Singh, S.; Das, A.; Kumar, N.; Kumar, B. Study on Cut-Resistance Properties of Composite Yarn Based Knitted UHMWPE Textiles: Influence of Reinforcement, Radiant Heat Exposure, Outdoor Environment, and Cutting Angles. J. Appl. Polym. Sci. 2025, 142, e56690. [Google Scholar] [CrossRef]
- Archana, R.; Jeevaraj, P.E. Deep learning models for digital image processing: A review. Artif. Intell. Rev. 2024, 57, 1–33. [Google Scholar]
- Rane, N.L.; Paramesha, M.; Choudhary, S.P.; Rane, J. Machine Learning and Deep Learning for Big Data Analytics: A Review of Methods and Applications. Partn. Univers. Int. Innov. J. 2024, 2, 172–197. [Google Scholar]
- Paramesha, M.; Rane, N.L.; Rane, J. Big Data Analytics, Artificial Intelligence, Machine Learning, Internet of Things, and Blockchain for Enhanced Business Intelligence. Partn. Univers. Int. Innov. J. 2024, 1, 110–133. [Google Scholar]
- Dhawas, P.; Ramteke, M.A.; Thakur, A.; Polshetwar, P.V.; Salunkhe, R.V.; Bhagat, D. Big Data Analysis Techniques: Data Preprocessing Techniques, Data Mining Techniques, Machine Learning Algorithm, Visualization. In Big Data Analytics Techniques for Market Intelligence; IGI Global Scientific Publishing: Hershey, PA, USA; Available online: https://www.igi-global.com/chapter/big-data-analysis-techniques/336350 (accessed on 31 January 2025).
- Liu, J.; Zhang, K.; Wu, S.; Shi, H.; Zhao, Y.; Sun, Y.; Zhuang, H.; Fu, E. An Investigation of a Multidimensional CNN Combined with an Attention Mechanism Model to Resolve Small-Sample Problems in Hyperspectral Image Classification. Remote Sens. 2022, 14, 785. [Google Scholar] [CrossRef]
- Ge, Z.; Cao, G.; Li, X.; Fu, P. Hyperspectral Image Classification Method Based on 2D–3D CNN and Multibranch Feature Fusion. IEEE J. Sel. Top. Appl. Earth Obs. Remote Sens. 2020, 13, 5776–5788. [Google Scholar]
- Liu, L.; Chen, J.; Fieguth, P.; Zhao, G.; Chellappa, R.; Pietikäinen, M. From BoW to CNN: Two Decades of Texture Representation for Texture Classification. Int. J. Comput. Vis. 2018, 127, 74–109. [Google Scholar]
- Melekoodappattu, J.G.; Dhas, A.S.; Kandathil, B.K.; Adarsh, K.S. Breast cancer detection in mammogram: Combining modified CNN and texture feature based approach. J. Ambient. Intell. Human Comput. 2023, 14, 11397–11406. [Google Scholar] [CrossRef]
- He, F.; Liu, T.; Tao, D. Why ResNet Works? Residuals Generalize. IEEE Trans. Neural Netw. Learn. Syst. 2020, 31, 5349–5362. [Google Scholar]
- Sarwinda, D.; Paradisa, R.H.; Bustamam, A.; Anggia, P. Deep Learning in Image Classification using Residual Network (ResNet) Variants for Detection of Colorectal Cancer. Procedia Comput. Sci. 2021, 179, 423–431. [Google Scholar] [CrossRef]
- Xu, W.; Fu, Y.-L.; Zhu, D. ResNet and its application to medical image processing: Research progress and challenges. Comput. Methods Progr. Biomed. 2023, 240, 107660. [Google Scholar] [CrossRef]
- Gao, M.; Qi, D.; Mu, H.; Chen, J. A Transfer Residual Neural Network Based on ResNet-34 for Detection of Wood Knot Defects. Forests 2021, 12, 212. [Google Scholar] [CrossRef]
- Chen, C.; Qi, F. Single Image Super-Resolution Using Deep CNN with Dense Skip Connections and Inception-ResNet. In Proceedings of the 2018 9th International Conference on Information Technology in Medicine and Education (ITME), Hangzhou, China, 19–21 October 2018; pp. 999–1003. [Google Scholar]
- Zhou, Z.; Siddiquee MM, R.; Tajbakhsh, N.; Liang, J. UNet++: Redesigning Skip Connections to Exploit Multiscale Features in Image Segmentation. IEEE Trans. Med. Imaging 2019, 39, 1856–1867. [Google Scholar]
- Baghaei, B.; Skrifvars, M. All-Cellulose Composites: A Review of Recent Studies on Structure, Properties and Applications. Molecules 2020, 25, 2836. [Google Scholar] [CrossRef]
- Etale, A.; Onyianta, A.J.; Turner, S.R.; Eichhorn, S.J. Cellulose: A Review of Water Interactions, Applications in Composites, and Water Treatment. Chem. Rev. 2023, 123, 2016–2048. [Google Scholar]
- Zhang, Z.; Dong, H.; Liao, Y. Facile fabrication of SWCNT film-based superhydrophobic cotton fabrics for oil/water separation and self-cleaning. J. Environ. Chem. Eng. 2023, 11, 109570. [Google Scholar]
- Alhashmi Alamer, F.; Badawi, N.M.; Alsalmi, O. Preparation and Characterization of Conductive Cotton Fabric Impregnated with Single-Walled Carbon Nanotubes. J. Electron. Mater. 2020, 49, 6582–6589. [Google Scholar]
- Kim, S.J.; Song, W.; Yi, Y.; Min, B.K.; Mondal, S.; An, K.S.; Choi, C.G. High Durability and Waterproofing rGO/SWCNT-Fabric-Based Multifunctional Sensors for Human-Motion Detection. ACS Appl. Mater. Interfaces 2018, 10, 3921–3928. [Google Scholar]
- Horita, Y.; Kuromatsu, S.; Watanabe, T.; Suga, R.; Koh, S. Polydopamine-assisted dip-and-dry fabrication of highly conductive cotton fabrics using single-wall carbon nanotubes inks for flexible devices. Cellulose 2022, 30, 1971–1980. [Google Scholar]
| Disclaimer/Publisher’s Note: The statements, opinions and data contained in all publications are solely those of the individual author(s) and contributor(s) and not of MDPI and/or the editor(s). MDPI and/or the editor(s) disclaim responsibility for any injury to people or property resulting from any ideas, methods, instructions or products referred to in the content. |
© 2025 by the authors. Licensee MDPI, Basel, Switzerland. This article is an open access article distributed under the terms and conditions of the Creative Commons Attribution (CC BY) license (https://creativecommons.org/licenses/by/4.0/).


