Abstract
China generates a significant amount of dredged sediment annually, much of which is contaminated with heavy metals. This study investigates the adsorption of Pb(II) from water and dredged sediment using different biochar materials, including BC and HC. The results show that the maximum adsorption of Pb(II) by BC-350-2h and HC-350-1:2-0.5h was 9.90 mg/g and 9.95 mg/g, respectively, with adsorption efficiencies of 99.0% and 99.5% for a 50 mg/L Pb(II) solution at a dosing concentration of 5 g/L, under 10 min of adsorption. BC-350-2h effectively adsorbed Pb(II) from dredged sediment, with no detectable Pb(II) concentration in the liquid fraction of the dredged sediment after 20 days. However, when the adsorption time increased, a small portion of Pb migrated into an unstable form, probably due to its binding to dissolved organic carbon (DOC), which dissolves out of the biochar. Microbial activity may also contribute to the degradation of DOC into small-molecule dissolved organic carbon (SDOC), thereby reducing the binding strength of biochar to DOC, which adsorbs Pb(II). This study highlights the importance of considering the effects of DOC and the long-term stability of biochar when used to treat contaminated dredged sediment.
1. Introduction
China generates large quantities of dredged sediment annually [1]. Due to various human activities, heavy metals accumulate in the dredged sediment [2,3], with Pb and Cd being the most prevalent and hazardous contaminants [4,5]. This contamination significantly hinders the reuse of dredged sediment, such as its application in agriculture and building foundations. Consequently, effective remediation of heavy metals in dredged sediment is crucial.
Generalized biochar materials, including biochar (BC, pyrolyzed char) and hydrochar (HC, hydrothermal char), are well known for their excellent adsorption properties and are widely used for heavy metal removal from water [6,7,8] and contaminated soil remediation [9,10,11]. In China’s coastal harbors, approximately 80% of dredged sediment consists of silt [1], which typically has higher organic content and moisture levels compared to ordinary soils. Wang et al. [12] demonstrated that biochar can enhance the stabilization of heavy metals in contaminated sediment. Similarly, Zhang et al. [13] explored the remediation of Pb- and Cd-contaminated sediment using biochar, showing its effectiveness in reducing the mobility of heavy metals. However, these studies primarily focused on the migration of Pb in silt solids and did not examine the concentration of Pb(II) in the free water solution of the sediment. In this study, we focused on the high water content of dredged sediment (60%), which contains a significant amount of free water. We examined the distribution of Pb between the free water and the solid components of the dredged sediment, enabling a better understanding of the stabilizing effect and the mechanism of biochar in the remediation of heavy metal-contaminated dredged sediment.
In this study, BC and HC were prepared from straw to investigate the adsorption of Pb(II) in water and identify the most effective. In addition, Pb(II)-contaminated sediment was remediated using the selected biochar. The results of this research provide both theoretical insights and technical support for the use of biochar materials in the remediation of heavy metal-contaminated sediment.
2. Materials and Methods
2.1. Experimental Apparatus and Materials
An experimental salt-bath furnace with 5 batch reactors was used for preparation of HC, as described in reference [14]. The wheat straw (WS) used in the experiment was sourced from Guo Mang Town, Yancheng City, with a particle size of 5 mm. The straws were dried at 105 °C for 1 h before use. The reagents used in the experiment—lead nitrate, nitric acid, and anhydrous ethanol—were all of analytical grade (AR) and were purchased from Shanghai Shanpu Chemical Co., Ltd. (Shanghai, China).
2.2. Preparation of Biochar Materials
- (1)
- Pyrolyzed biochar
A total of 50.0 g of WS powder was weighed and placed in an aluminum foil container, which was then tightly sealed with two layers of tinfoil. Once the muffle furnace reached the predetermined reaction temperature, the aluminum foil container containing the WS powder was placed into the furnace to initiate pyrolysis. The time of insertion was recorded as the reaction start time. After pyrolysis, the biochar was stored in a sealed plastic bag and kept in a dry dish to prevent moisture absorption. Different pyrolyzed biochars were labeled as BC-temperature-time (e.g., biochar pyrolyzed at 350 °C for 2 h was recorded as BC-350-2h).
- (2)
- Hydrochar
Hydrochar was prepared according to the method described in [15]. First, a certain volume of pure water (20 or 40 mL) was added to the reactor, followed by the addition of 10.0 g of WS powder. The temperature of the salt-bath oven was set to 30 °C above the target reaction temperature to allow rapid temperature increase once the reactor was placed inside. The reaction start time was when the desired reaction temperature was reached. At the end of the reaction, the interior of the reactor was washed with anhydrous ethanol, and the products were thoroughly rinsed until the eluate became colorless and transparent. The products were then filtered and dried at 95 °C for 1 h to obtain hydrochar. It was stored in a sealed plastic bag and placed in a dry dish. The different hydrochars were labeled as HC-temperature-material–water ratio-time. For example, the hydrothermal carbon produced with 20 mL of water at 350 °C for 2 h was recorded as HC-350-1:2-2h. If the preparation temperature, the amount of water added, and preparation time are the same, the same parameters can be omitted. For example, the hydrothermal carbon produced with 20 mL was recorded as HC-1:2.
2.3. Characterization of Biochar Materials
Ash content was determined according to the standard (GB/T 15224.1-2018) [16]. The pH value was measured using a pH meter (Leici PHS-3C, Shanghai, China) after extracting the biochar with distilled water at a solid-to-liquid ratio of 1:20 for 24 h. The measurement was repeated in at least duplicate for each sample.
The surface morphology and structural features of the biochar material were examined using a scanning electron microscope (SEM, Nova NanoSEM 450, Hillsboro, OR, USA) to observe its pore structure. The Brunauer–Emmett–Teller (BET) surface area and BJH pore volume and pore size distribution were determined using a surface area and porosity analyzer (Beckman Coulter SA3100, Brea, CA, USA). Surface functional groups were analyzed using an infrared spectrometer (FTIR, NEXUS-670, Waltham, MA, USA). Additionally, the mineral compositions were determined using X-ray diffraction (XRD, X’Pert3Powder, Almelo, The Netherlands).
2.4. Heavy Metal Adsorption Experiment
- (1)
- Adsorption of Pb(II) in water
A measured amount of biochar was placed in a 50 mL centrifuge tube, and 40 mL of a lead nitrate solution with a known concentration was added. The reaction was conducted at 25 °C, with shaking at 120 rpm. After the reaction, the solution was filtered using a 0.45 µm filter membrane, and the concentration of Pb(II) in the filtrates was determined. All experiments were conducted with more than two parallel samples. The specific adsorption parameters are detailed in Table 1.

Table 1.
Experimental conditions for Pb(II) adsorption in water by biochar.
The adsorption efficiency and capacity of the biochar materials were calculated using Equations (1)–(3). To investigate the adsorption behavior and characterize the adsorption kinetics of biochar for Pb(II), the pseudo-first-order (PFO) and pseudo-second-order (PSO) kinetic models, as well as the intraparticle diffusion model (IPD), were applied. Isothermal adsorption was fitted using the Langmuir and Freundlich models, as shown in Equations (4)–(9).
- (2)
- Adsorption of Pb(II) in sediment
The initial water content of the sediment was determined, and a certain amount of Pb(NO3)2 solution was added to prepare Pb(II)-contaminated sediment. The following conditions were met: the concentration of Pb(II) in the sediment was 500 mg/kg (on a dry sediment basis), and the water content of the sediment was 60%. The prepared contaminated sediment was aged at 30 °C for 14 days, after which biochar (BC-350-2h) was added to determine the content and distribution of Pb over several days.
To determine the concentration of Pb(II) in the free water of the sediment, 1.67 g of wet sediment (containing 1 g of free water) was diluted in 50 mL of pure water. After filtration through a 0.45 µm filter membrane, the concentration of Pb(II) in the filtrates was measured. The total heavy metal content in the sediment was determined using mixed acid digestion (HNO3-HClO4, 1:4). Heavy metals were extracted using the BCR continuous extraction method [12,17], and the metals were classified into four fractions: extractable acid-soluble fraction (F1), reducible fraction (F2), oxidizable fraction (F3), and residual fraction (F4). For each experiment, 2–3 parallel samples were used.
3. Results
3.1. Yield and Characterization of Biochar Materials
3.1.1. Yield of Biochar Materials
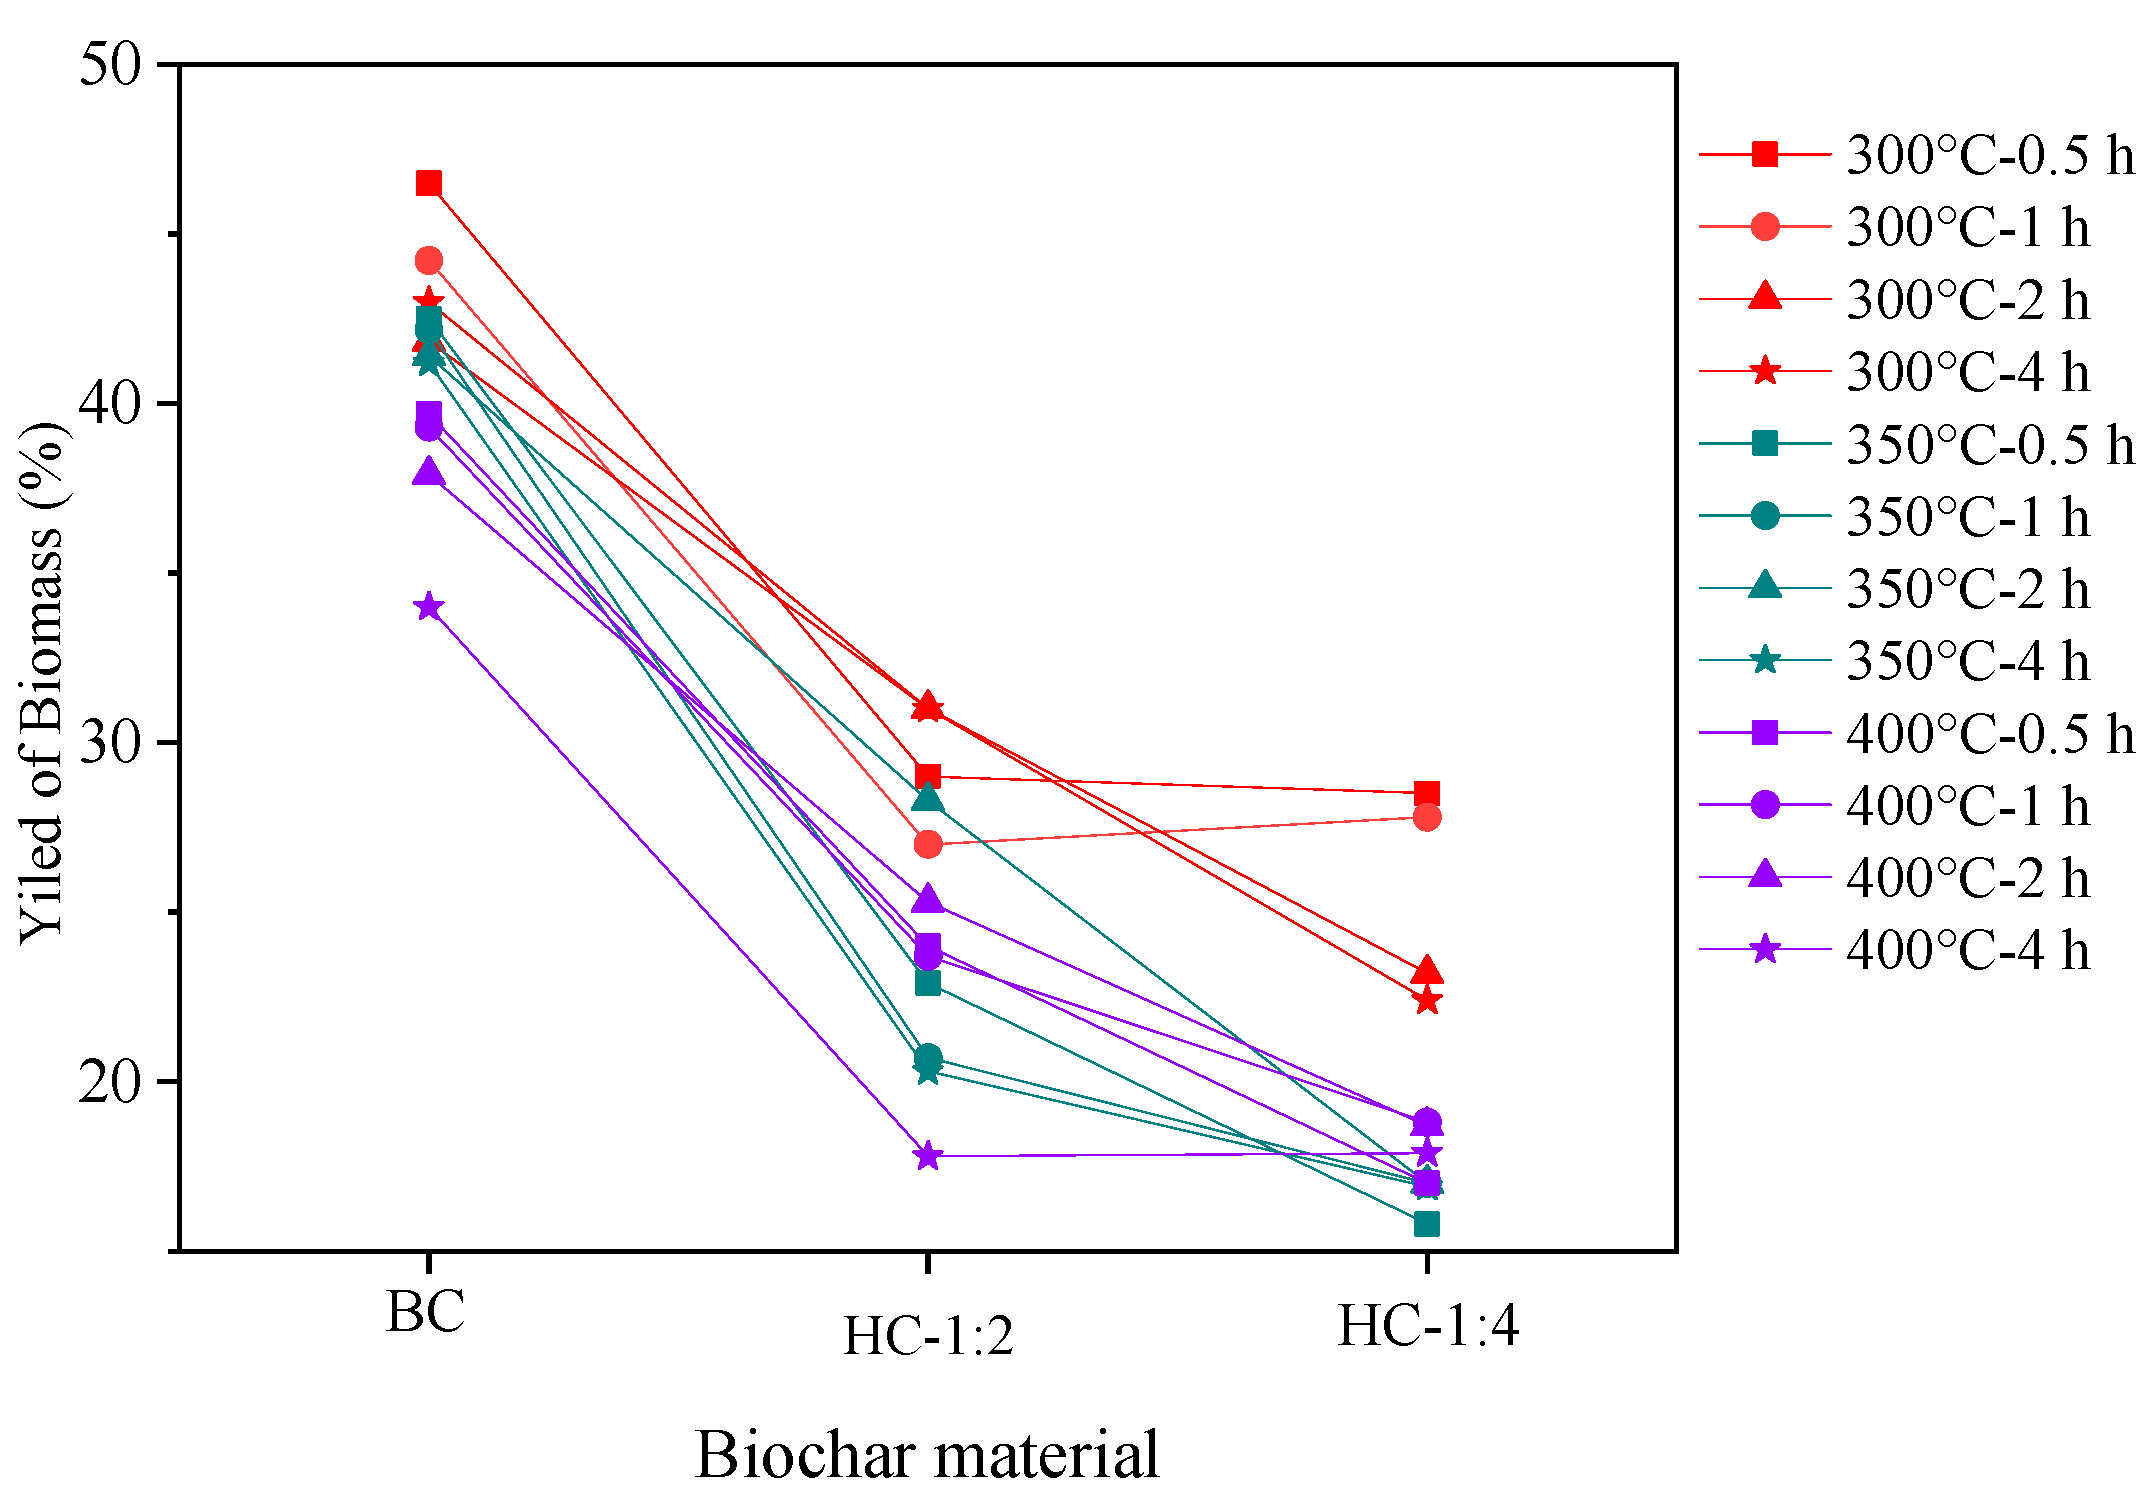
As shown in Figure 1, the amount of water added significantly affected the yield. As the water addition increased, the yield exhibited a decreasing trend. The highest yield was observed for BC, with values all above 35%, followed by HC with a material–water ratio of 1:2 and 1:4. For the BCs, the yield decreased as the reaction temperature increased. For the HCs, the yield initially decreased with rising temperature, then slightly increased. Overall, the biochar yield decreased with increasing temperature. The highest yield of 46.5% was obtained for BC-300-0.5h, but incomplete charring of the WS was observed in the product. Therefore, subsequent experiments were conducted at 350 °C for biochar preparation.
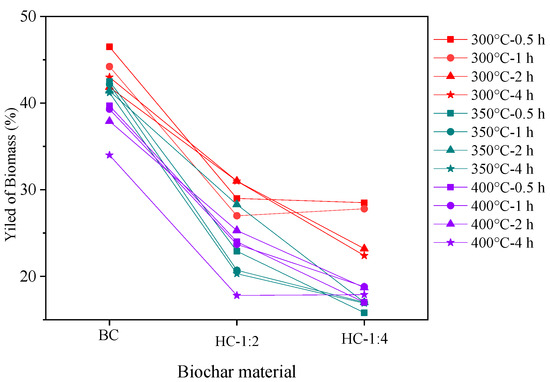
Figure 1.
Yield of different biochar materials.
The yield of biochar decreased with increasing reaction time. At 350 °C, the BC yields for reaction times of 0.5, 1, 2, and 4 h were 42.50%, 41.18%, 41.40%, and 41.20%, respectively, showing minimal variation. Considering that the carbonization reaction was sufficiently completed, a reaction time of 2 h was selected for subsequent experiments.
3.1.2. Analysis of Biochar
The basic physical and chemical properties of different biochar materials are shown in Table 2.
Table 2.
Basic physical and chemical properties of different biochar.
As shown in Table 2, the ash content of both BC and HC is quite similar, ranging from 24.85% to 25.36%. BC is alkaline, whereas HC is either weakly acidic or neutral.
All biochar materials exhibited pH values close to or higher than their pHpzc values (see Table 2 and Figure S1). Generally, when the solution pH exceeds the pHpzc, adsorption is enhanced [18]. Consequently, the addition of biochar to a Pb(NO3)2 solution with an initial pH of 6.49 promotes Pb(II) adsorption. Furthermore, previous studies have indicated that a pH range of 4–7 is suitable for Pb(II) adsorption [19,20]. Therefore, the Pb(NO3)2 solution was used directly in all subsequent experiments.
Table 2 and Figure S2 illustrate that the BET-specific surface area and total pore volume of BC were either lower than or comparable to those of HC. This difference could likely be attributed to the production of dissolved organic carbon (DOC) in biochar [21,22], which may have obstructed pore spaces. Both BC and HCs were dominated by 54.55 nm diameter mesopores (Figure S2). For HCs, the proportion of mesopores at 54.55 nm decreased with increasing preparation time and the amount of water.
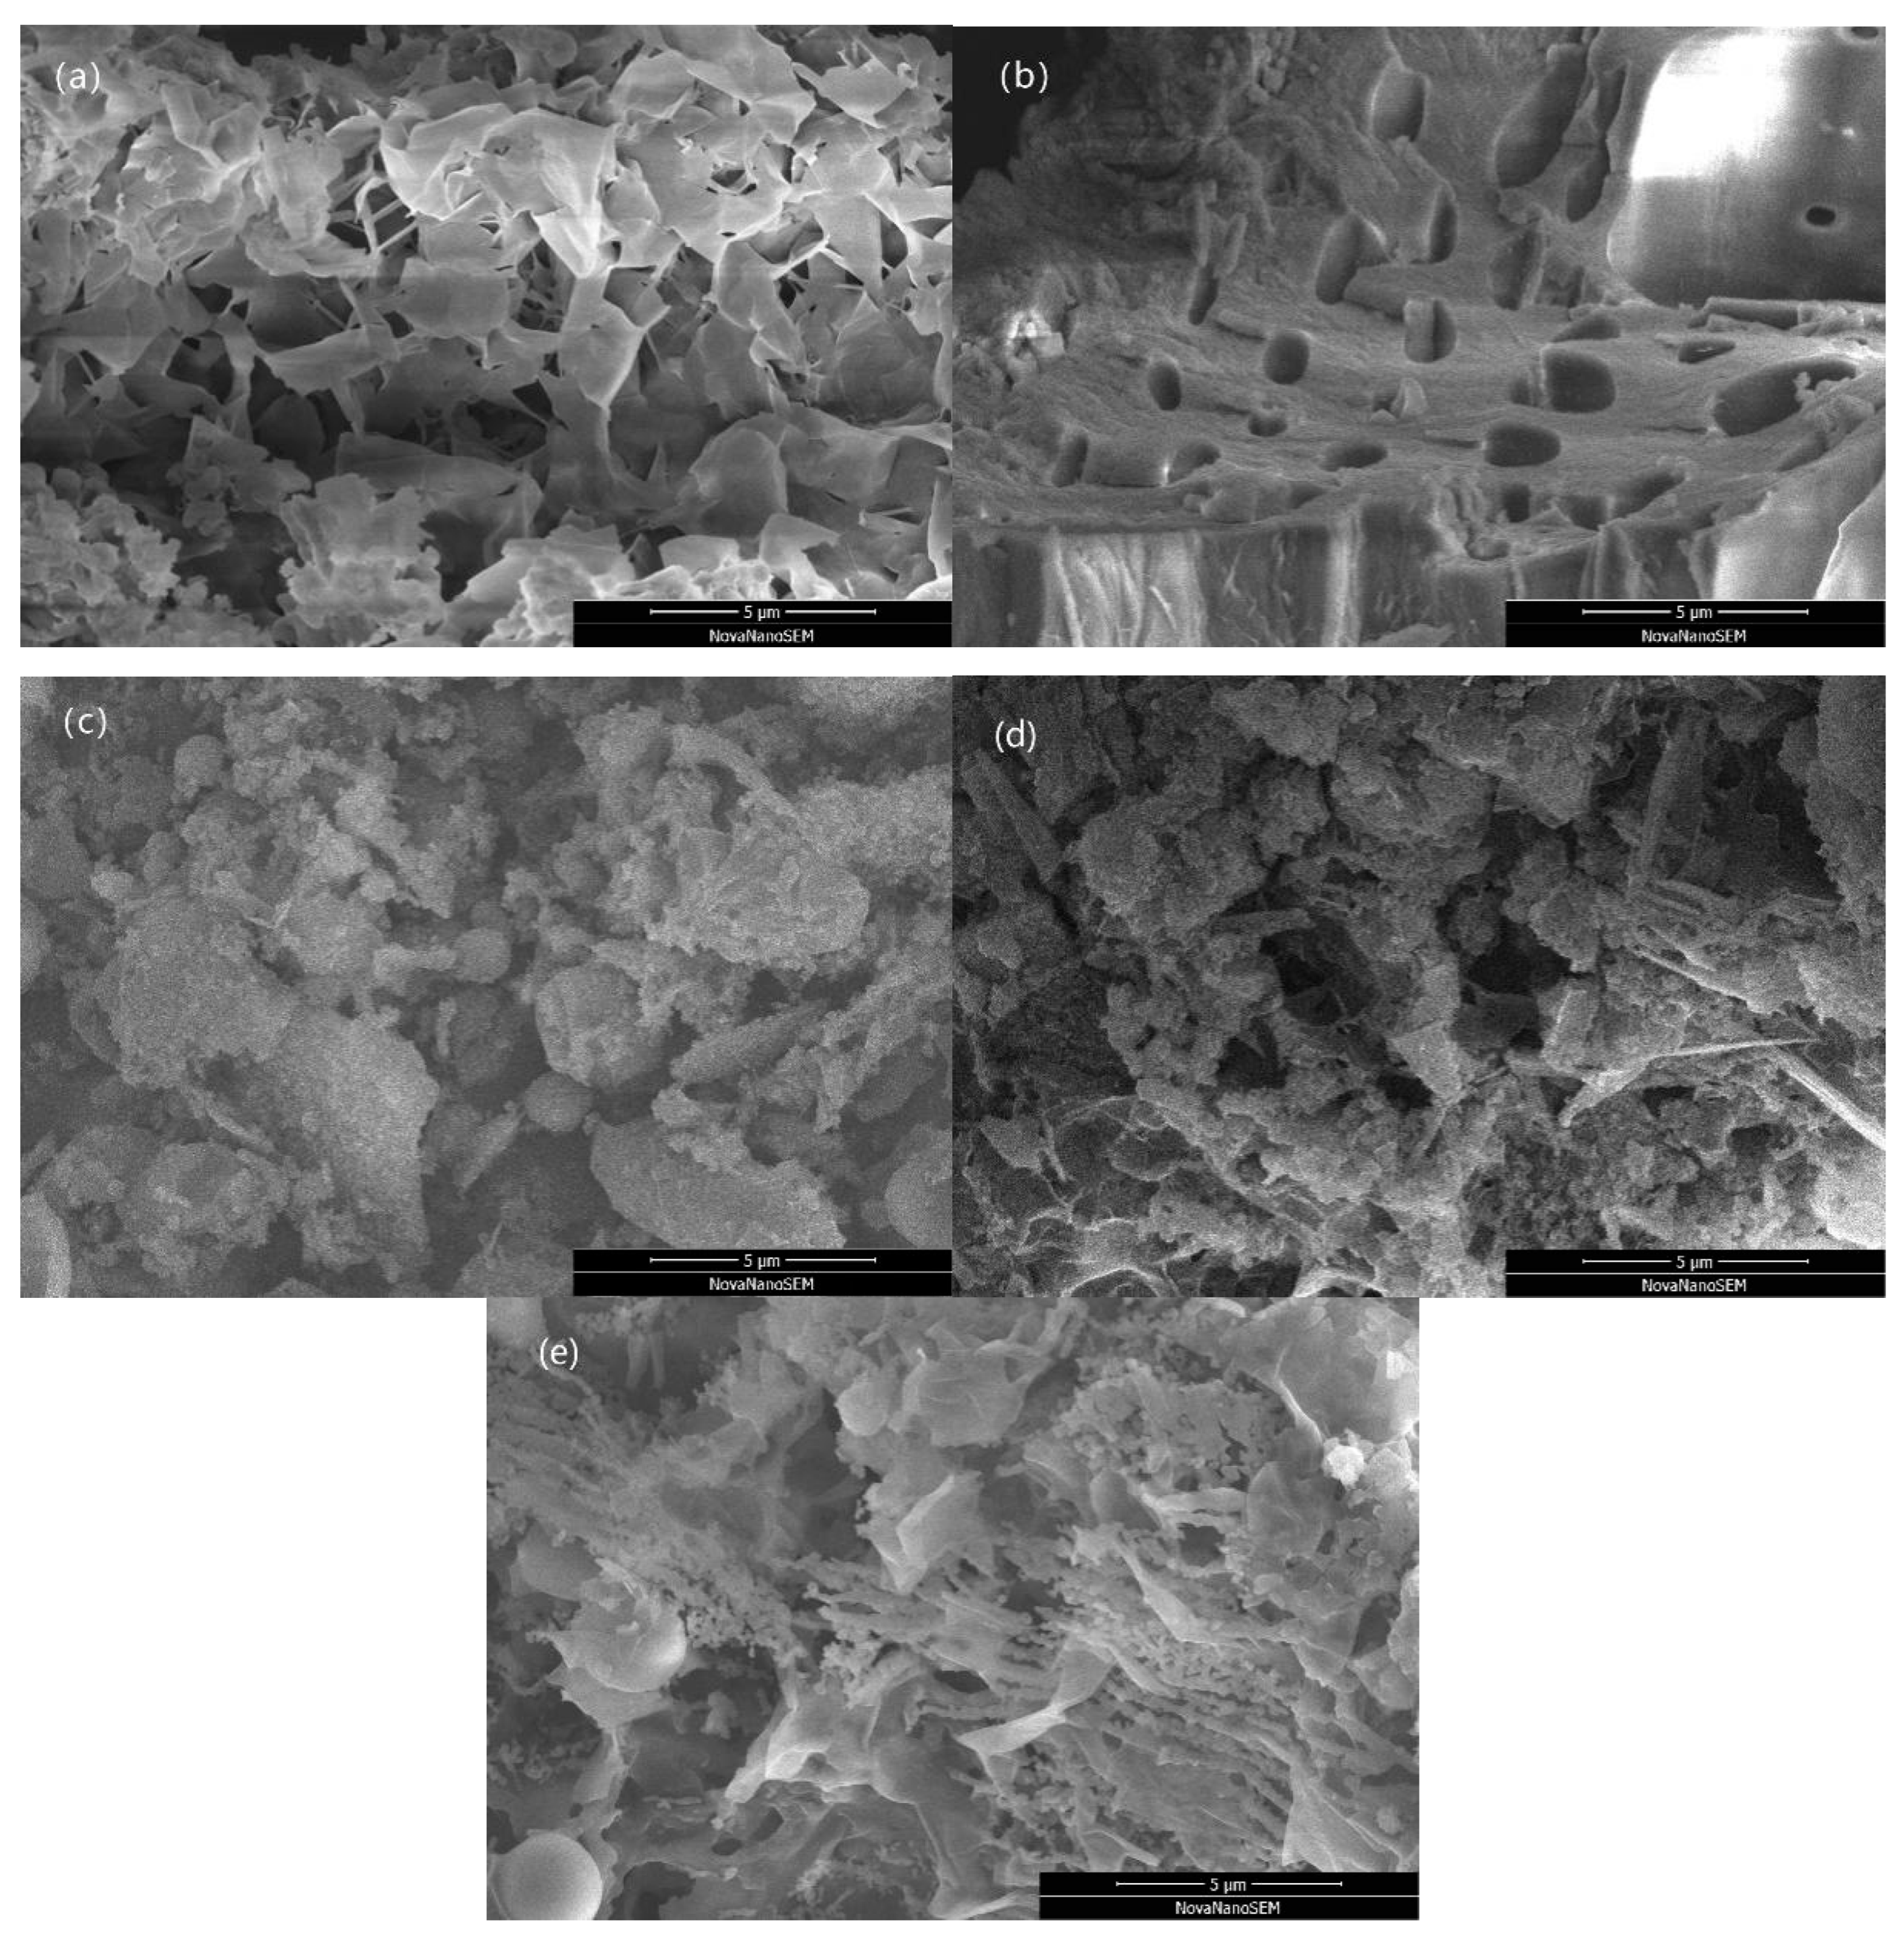
As shown in the biochar SEM images (Figure 2), the WS particles have larger pores and a looser structure. The BC material also exhibits large pores. With the increase in preparation time, the surface of HC transforms from a lumpy to a lamellar texture and develops numerous spherical particles. The spherical particles in HC-350-1:2-0.5h and HC-350-1:2-2h are larger and may originate from glucose, whereas HC-350-1:4-2h contains more smaller particles, which may be SiO2 nanospheres (see XRD analysis).

Figure 2.
SEM images of (a) WS, (b) BC-350-2h, (c) HC-350-1:2-0.5h, (d) HC-350-1:2-2h, and (e) HC-350-1:4-2h.
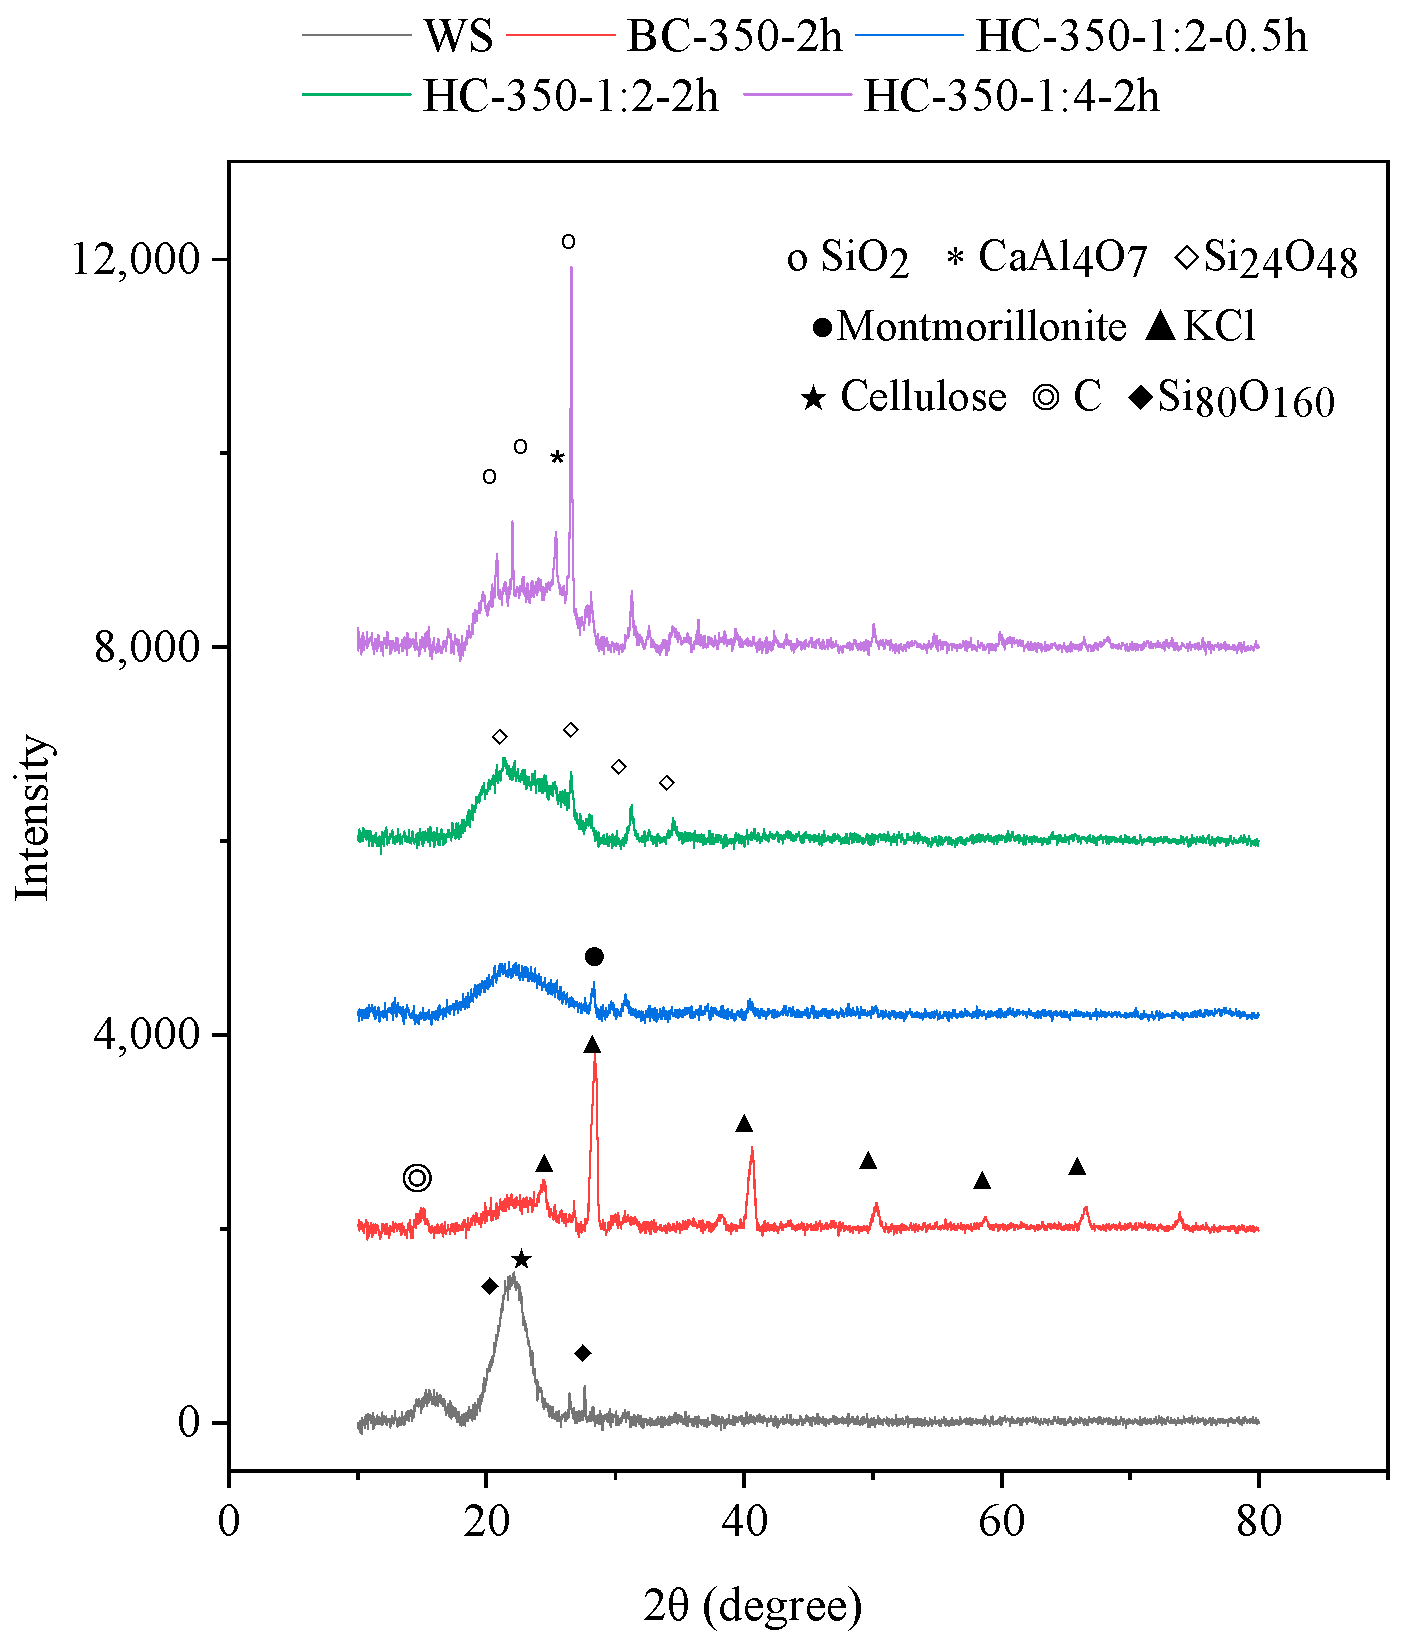
The XRD patterns of WS and biochar materials are shown in Figure 3. The WS mainly consists of carbohydrates such as cellulose, as well as silica-containing compounds like Tridymite (Si80O160). The main inorganic component in BC-350-2h is KCl, which is primarily derived from the original WS. HC, however, lacks significant KCl content, as it is dissolved in water during the hydrothermal preparation process. The primary inorganic component in HC is a compound containing silicon dioxide (SiO2), with a small amount of CaAl4O7 present in HC-350-1:4-2h, which may have originated from Tridymite in the WS.
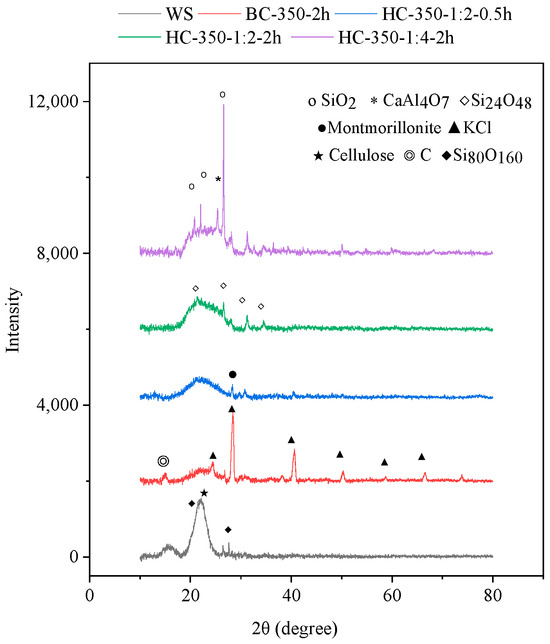
Figure 3.
XRD patterns of the samples.
The FTIR spectra of biomass and biochar materials are shown in Figure 4. The peaks at 3421 cm−1, 2923 cm−1, and 1638 cm−1 correspond to O-H, C-H, and C=C stretching vibrations, respectively [19,23,24,25]. The peak at 1103 cm−1 is attributed to C-O stretching vibrations or C-C skeleton vibrations. These peaks reflect the main components of straw, such as cellulose, hemicellulose, and lignin. In the FTIR spectrum of BC, the peaks at 1453 cm−1, 1379 cm−1, 1319 cm−1, and 1103 cm−1 correspond to bending vibrations of carboxylic acids (O-H), alcohols (O-H), phenols (O-H), and C-O stretching, respectively [26,27]. The intensity of these four peaks suggests an increase in the production of alcohols, carboxylic acids, and phenols. A small peak at 786 cm−1, attributed to the planar swing peak of methylene groups (-CH2-), indicates the formation of olefins or aromatic rings [24,26,27]. These results suggest that the primary components of wheat straw biochar (BC) may be aromatic substances with a higher content of hydroxyl groups.
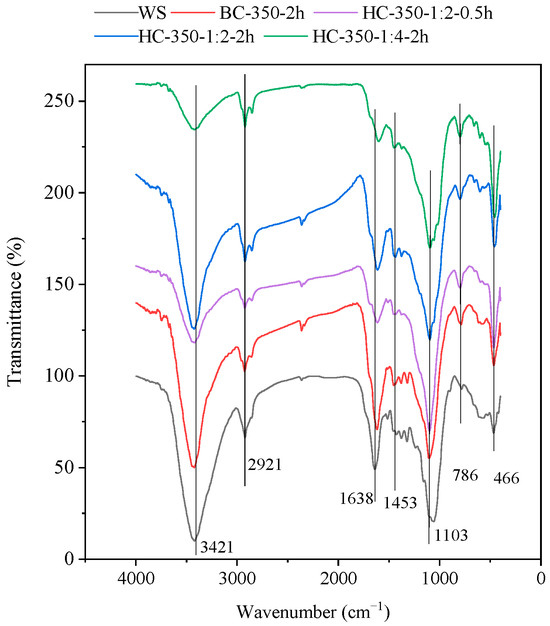
Figure 4.
FTIR spectra of the samples.
In the FTIR spectrum of HC, the peak for C=C at 1638 cm−1 is smaller than in BC, and its relative area has decreased. This reduction is likely due to the additional reaction between water and C=C during the hydrothermal process. HC also lacks the bending vibrational peak for phenolic O-H at 1319 cm−1, which is present in BC. However, there is a significant increase in the peak at 1103 cm−1, corresponding to the C-O stretching vibration. This indicates that HC is less aromatic than BC but contains more oxygenated functional groups. Comparing HC-350-1:2-0.5h and HC-350-1:2-2h, the O-H peak at 3421 cm−1 increases with reaction time. In contrast, for HC-350-2h, the O-H peak at 3421 cm−1 decreases as the material–water ratio shifts from 1:2 to 1:4. The increase in water leads to dehydration reactions, which may explain the lower yield of HC-350-1:4-2h (Table 2).
3.2. Adsorption of Pb(II) in Water by Biochar
3.2.1. Determination of Biochar Dosage
As shown in Figure 5, the adsorption of Pb(II) by BC decreased gradually with increasing dosage, while the adsorption efficiency of Pb(II) initially increased rapidly and then leveled off. When the dosage was less than 5 g/L, the adsorption sites on BC were insufficient to adsorb all the Pb(II) in the solution, resulting in a lower adsorption efficiency. As the dosage of biochar increased, more adsorption sites became available, leading to a higher adsorption efficiency. The adsorption efficiency reached its maximum when the biochar dosage reached 5 g/L, at which point the number of available adsorption sites exceeded the concentration of Pb(II) in the solution. Further increases in the dosage had little effect on the adsorption efficiency. Therefore, a biochar dosage of 5 g/L was selected for the subsequent experiments.
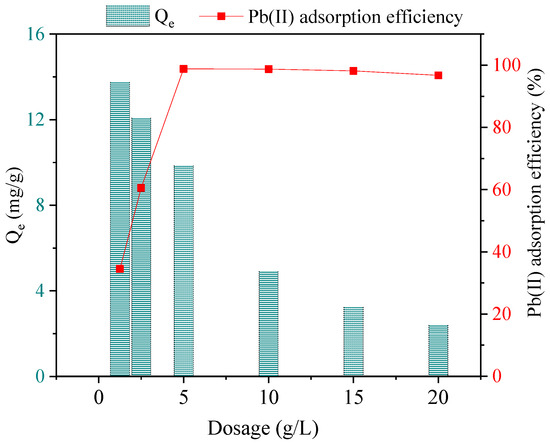
Figure 5.
Pb(II) adsorption by BC at different dosages (50 mg/L Pb(II), 10 min).
3.2.2. Pb(II) Adsorption with Different Biochar Materials
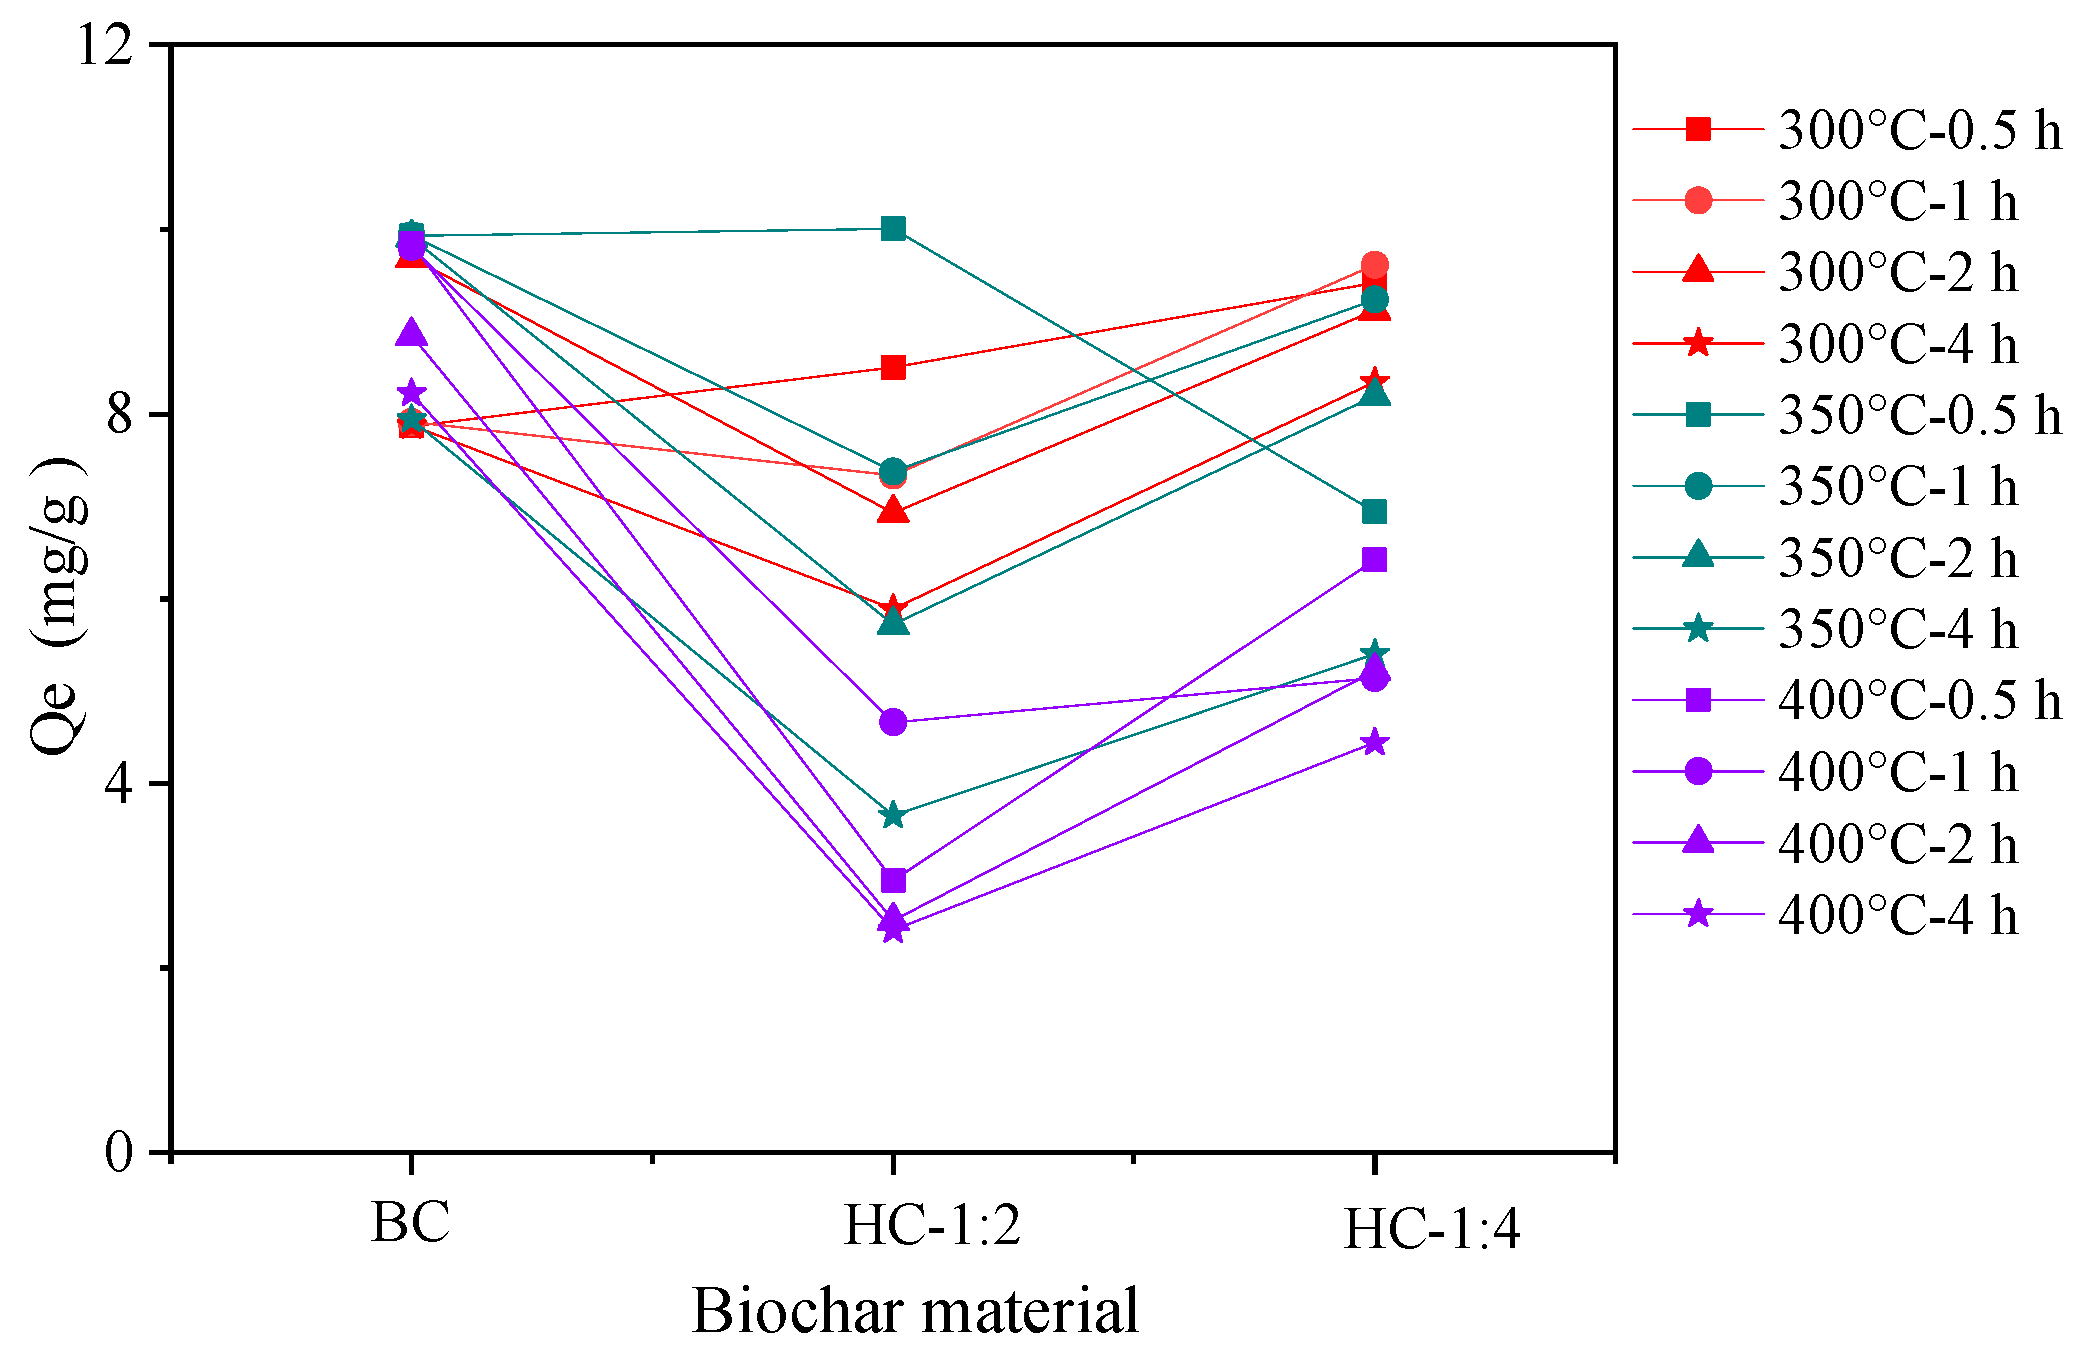
Figure 6 shows that BC and HC-1:4 exhibited a higher Pb(II) adsorption capacity, whereas HC-1:2 had the lowest Pb adsorption. However, despite their higher adsorption capacity, BC and HC-1:4 had smaller specific surface areas and total pore volumes compared to HC-1:2 (Table 2), indicating that pore size had a minimal effect on Pb adsorption by biochar materials. Additionally, increased preparation time was found to decrease the adsorption capacity of the biochar materials. This could be due to longer pyrolysis or hydrothermal reaction times, which typically result in higher dissolved organic carbon (DOC) production, potentially influencing adsorption. This suggests that, in addition to pore space adsorption, other mechanisms, such as surface complexation with function groups, played a greater role in Pb(II) adsorption. This finding aligns with the microscopic analyses discussed in Section 3.1.2.
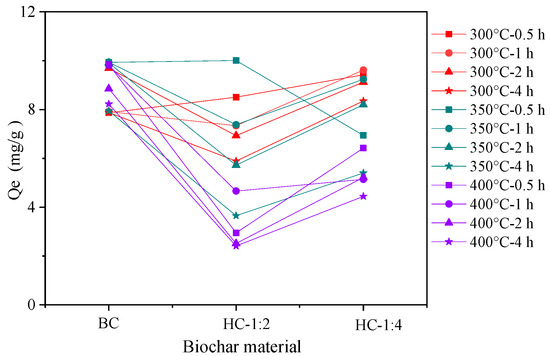
Figure 6.
Pb(II) adsorption with different biochar materials (50 mg/L Pb(II), 10 min, BC dosage 5 g/L).
The adsorption rate of BC for Pb(II) increased with the reaction temperature of the carbon material preparation, while the adsorption rate of HC (except HC-350-1:2-0.5h) tended to decrease. The highest Pb(II) adsorption rates were observed for BC-350-2h and HC-350-1:2-0.5h, with Pb(II) adsorption amounts of 9.90 mg/g and 9.95 mg/g, and adsorption efficiencies of 99.0% and 99.5%, respectively. Due to BC being easier to prepare, a reaction temperature of 350 °C for 2 h was identified as the optimal condition for biochar preparation.
3.2.3. Adsorption Kinetics of Biochar Materials
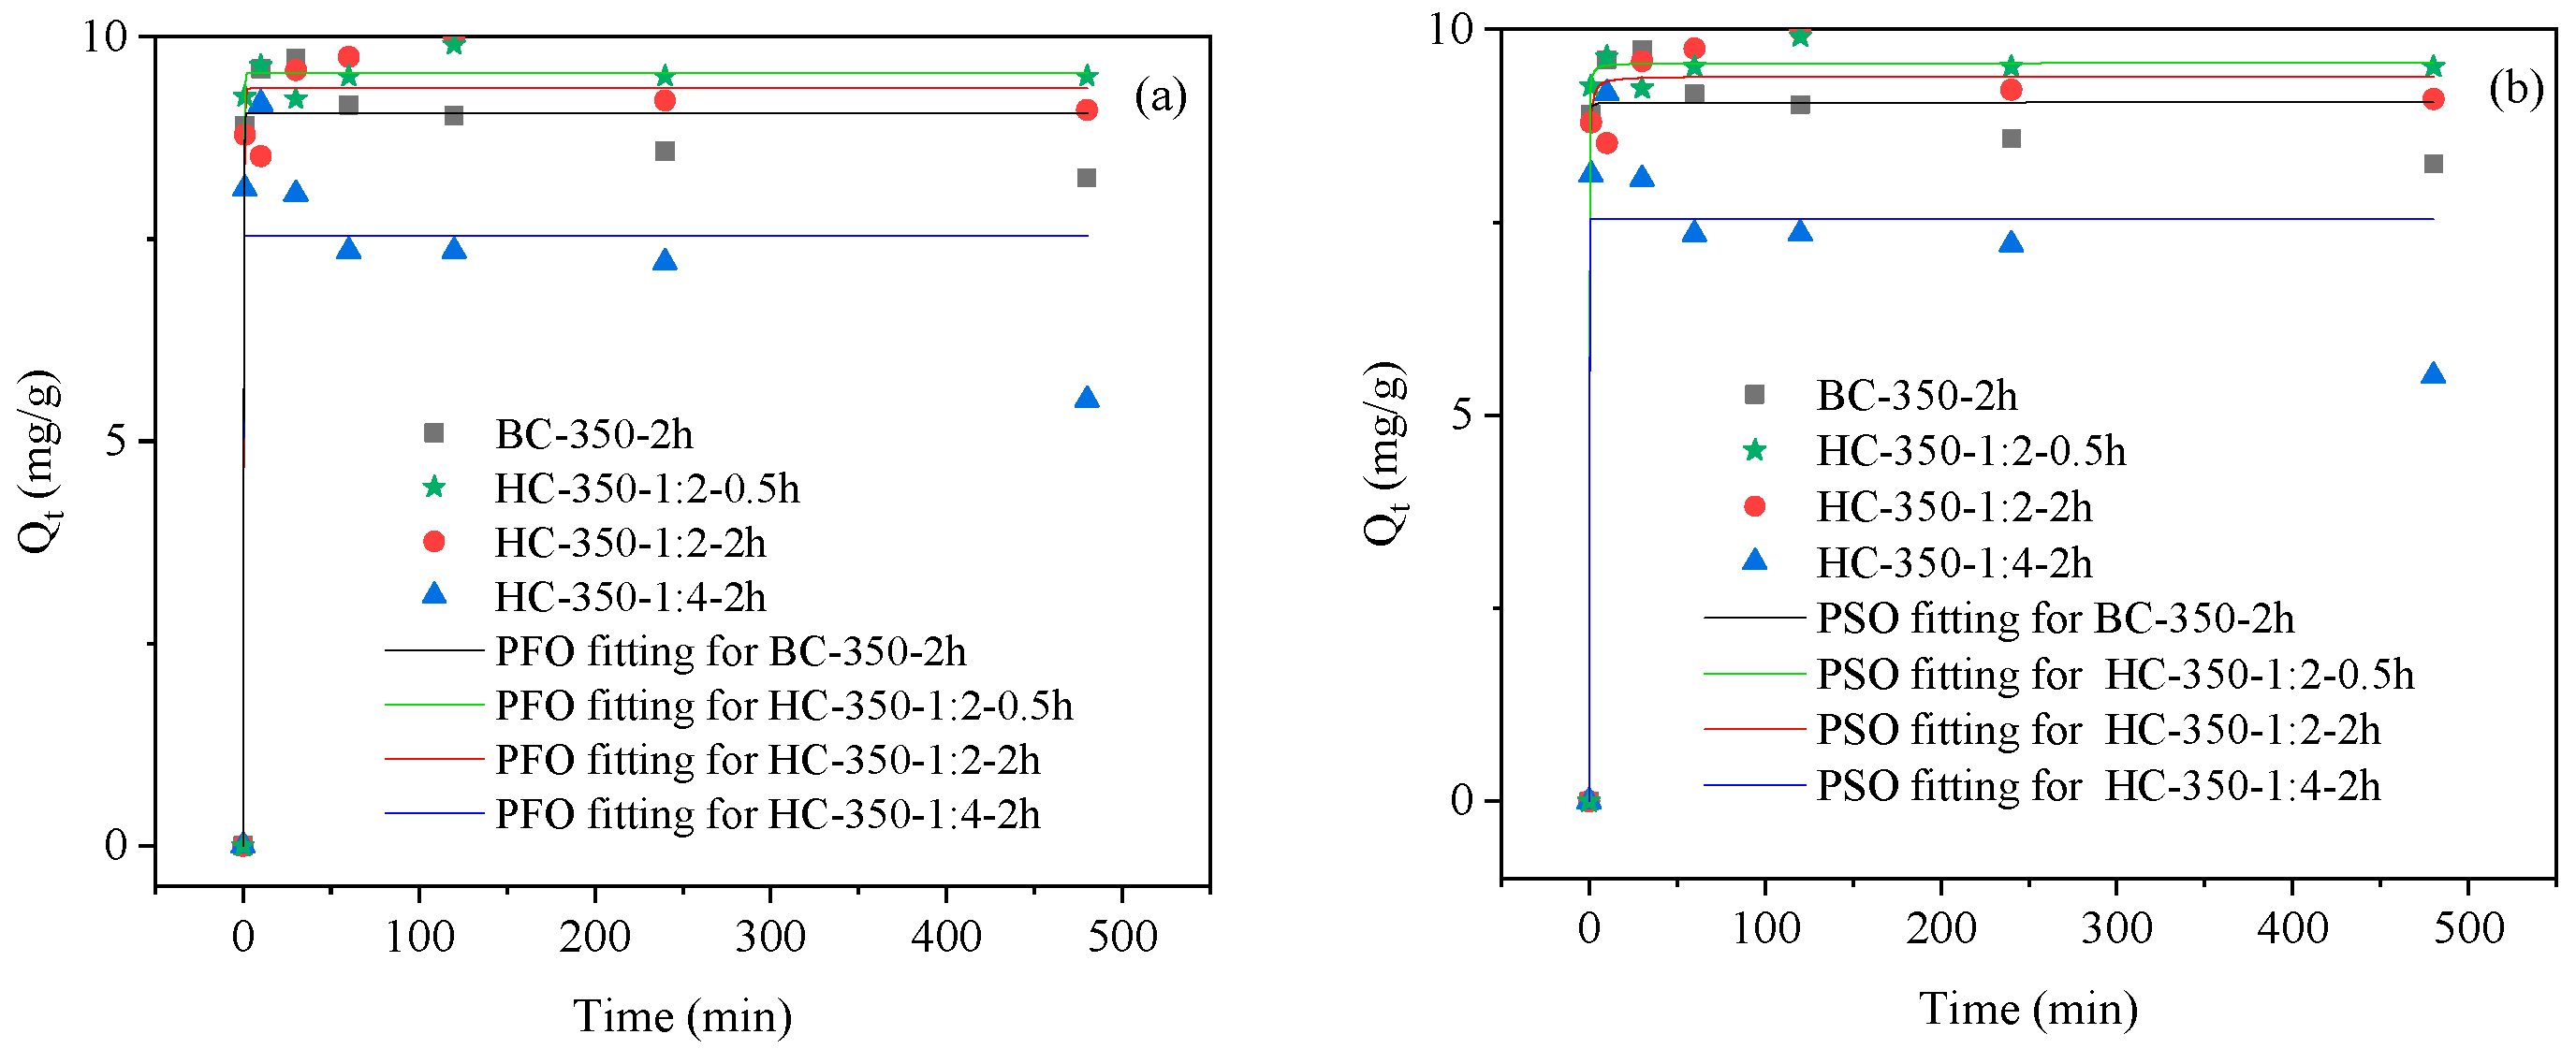
The PFO, PSO, and IPD models were used to investigate the adsorption behavior of biochar on Pb(II) and to characterize the adsorption kinetics. The kinetic fitting parameters are presented in Table 3, and the corresponding fitting curves are shown in Figure 7.
Table 3.
Adsorption kinetic parameters.
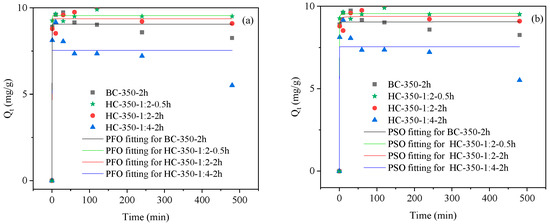
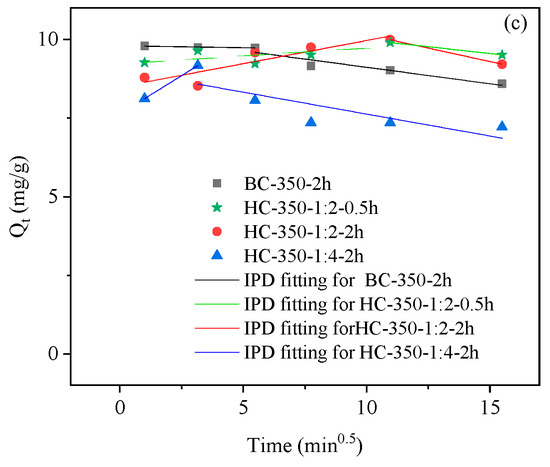
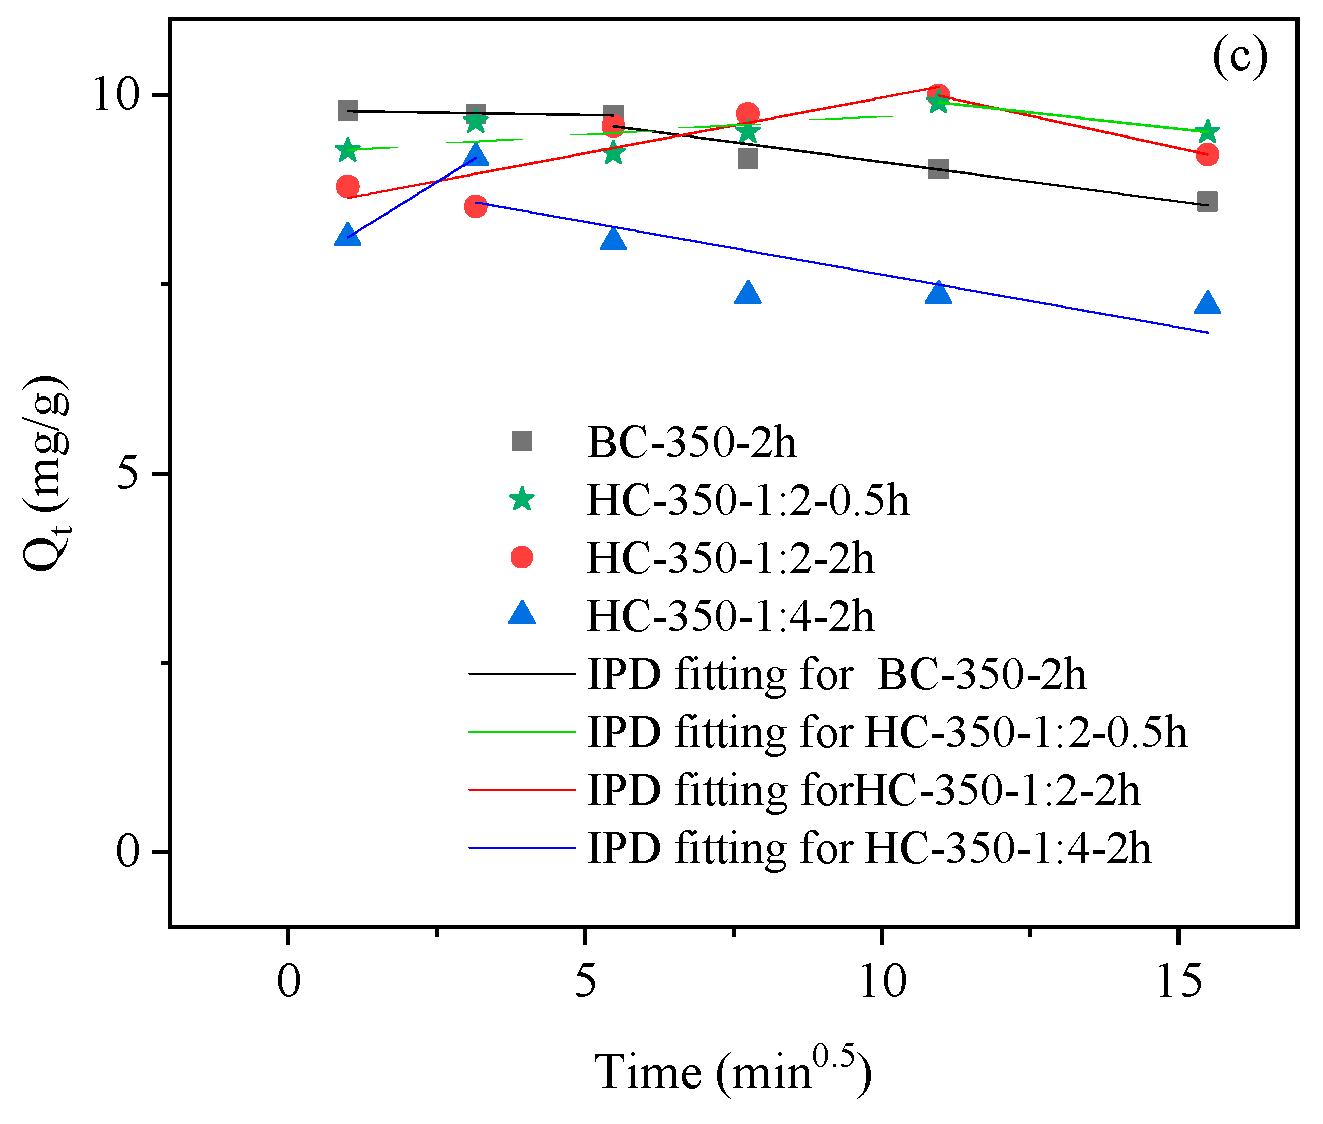
Figure 7.
Adsorption kinetics models for biochar materials: (a) PFO, (b) PSO, and (c) IPD.
As can be seen in Table 3 and Figure 7, BC, HC-350-1:2-2h, and HC-350-1:2-0.5h are more consistent with the PFO or PSO equations. HC-350-1:4-2h is more consistent with the IPD model.
As shown in Figure 7a,b, the adsorption rates of all four char materials increased rapidly over time. The removal rates of BC-350-2h, HC-350-1:4-2h, and HC-350-1:2-0.5h reached over 91.7% within the first 10 min of oscillation. The Pb(II) adsorption efficiency decreased to varying extents when the oscillation was continued. This decline may be attributed to Pb(II) being adsorbed onto the DOC that is easily detached from the biochar surface. As the oscillation time increased, this portion of Pb(II) was gradually re-released into the solution. The maximum adsorption efficiency for both BC and HC occurred between 10 and 30 min. The calculated equilibrium adsorption capacities Qe,cal for BC, HC-350-1:2-0.5h, and HC-350-1:2-2h were high, with experimentally calculated values of 9.06, 9.55, and 9.36 mg/g, respectively. In contrast, the Qe,cal for HC-350-1:4-2h was relatively low at 7.53 mg/g, which can be attributed to it having relatively fewer functional groups than other biochar materials (Figure 4).
From Table 3 and Figure 7c, it is evident that, during the initial stage of adsorption, Pb(II) adsorption increased rapidly, and none of the fitted lines passed through the origin. This suggests that intra-particle diffusion did not control the adsorption process, which was primarily driven by external diffusion from the particle surface. In the second stage of adsorption, the slopes of the simulation equations were negative, indicating the absence of intra-particle diffusion and the re-release of Pb(II) [28]. This finding is consistent with the analysis based on both the PFO and PSO models.
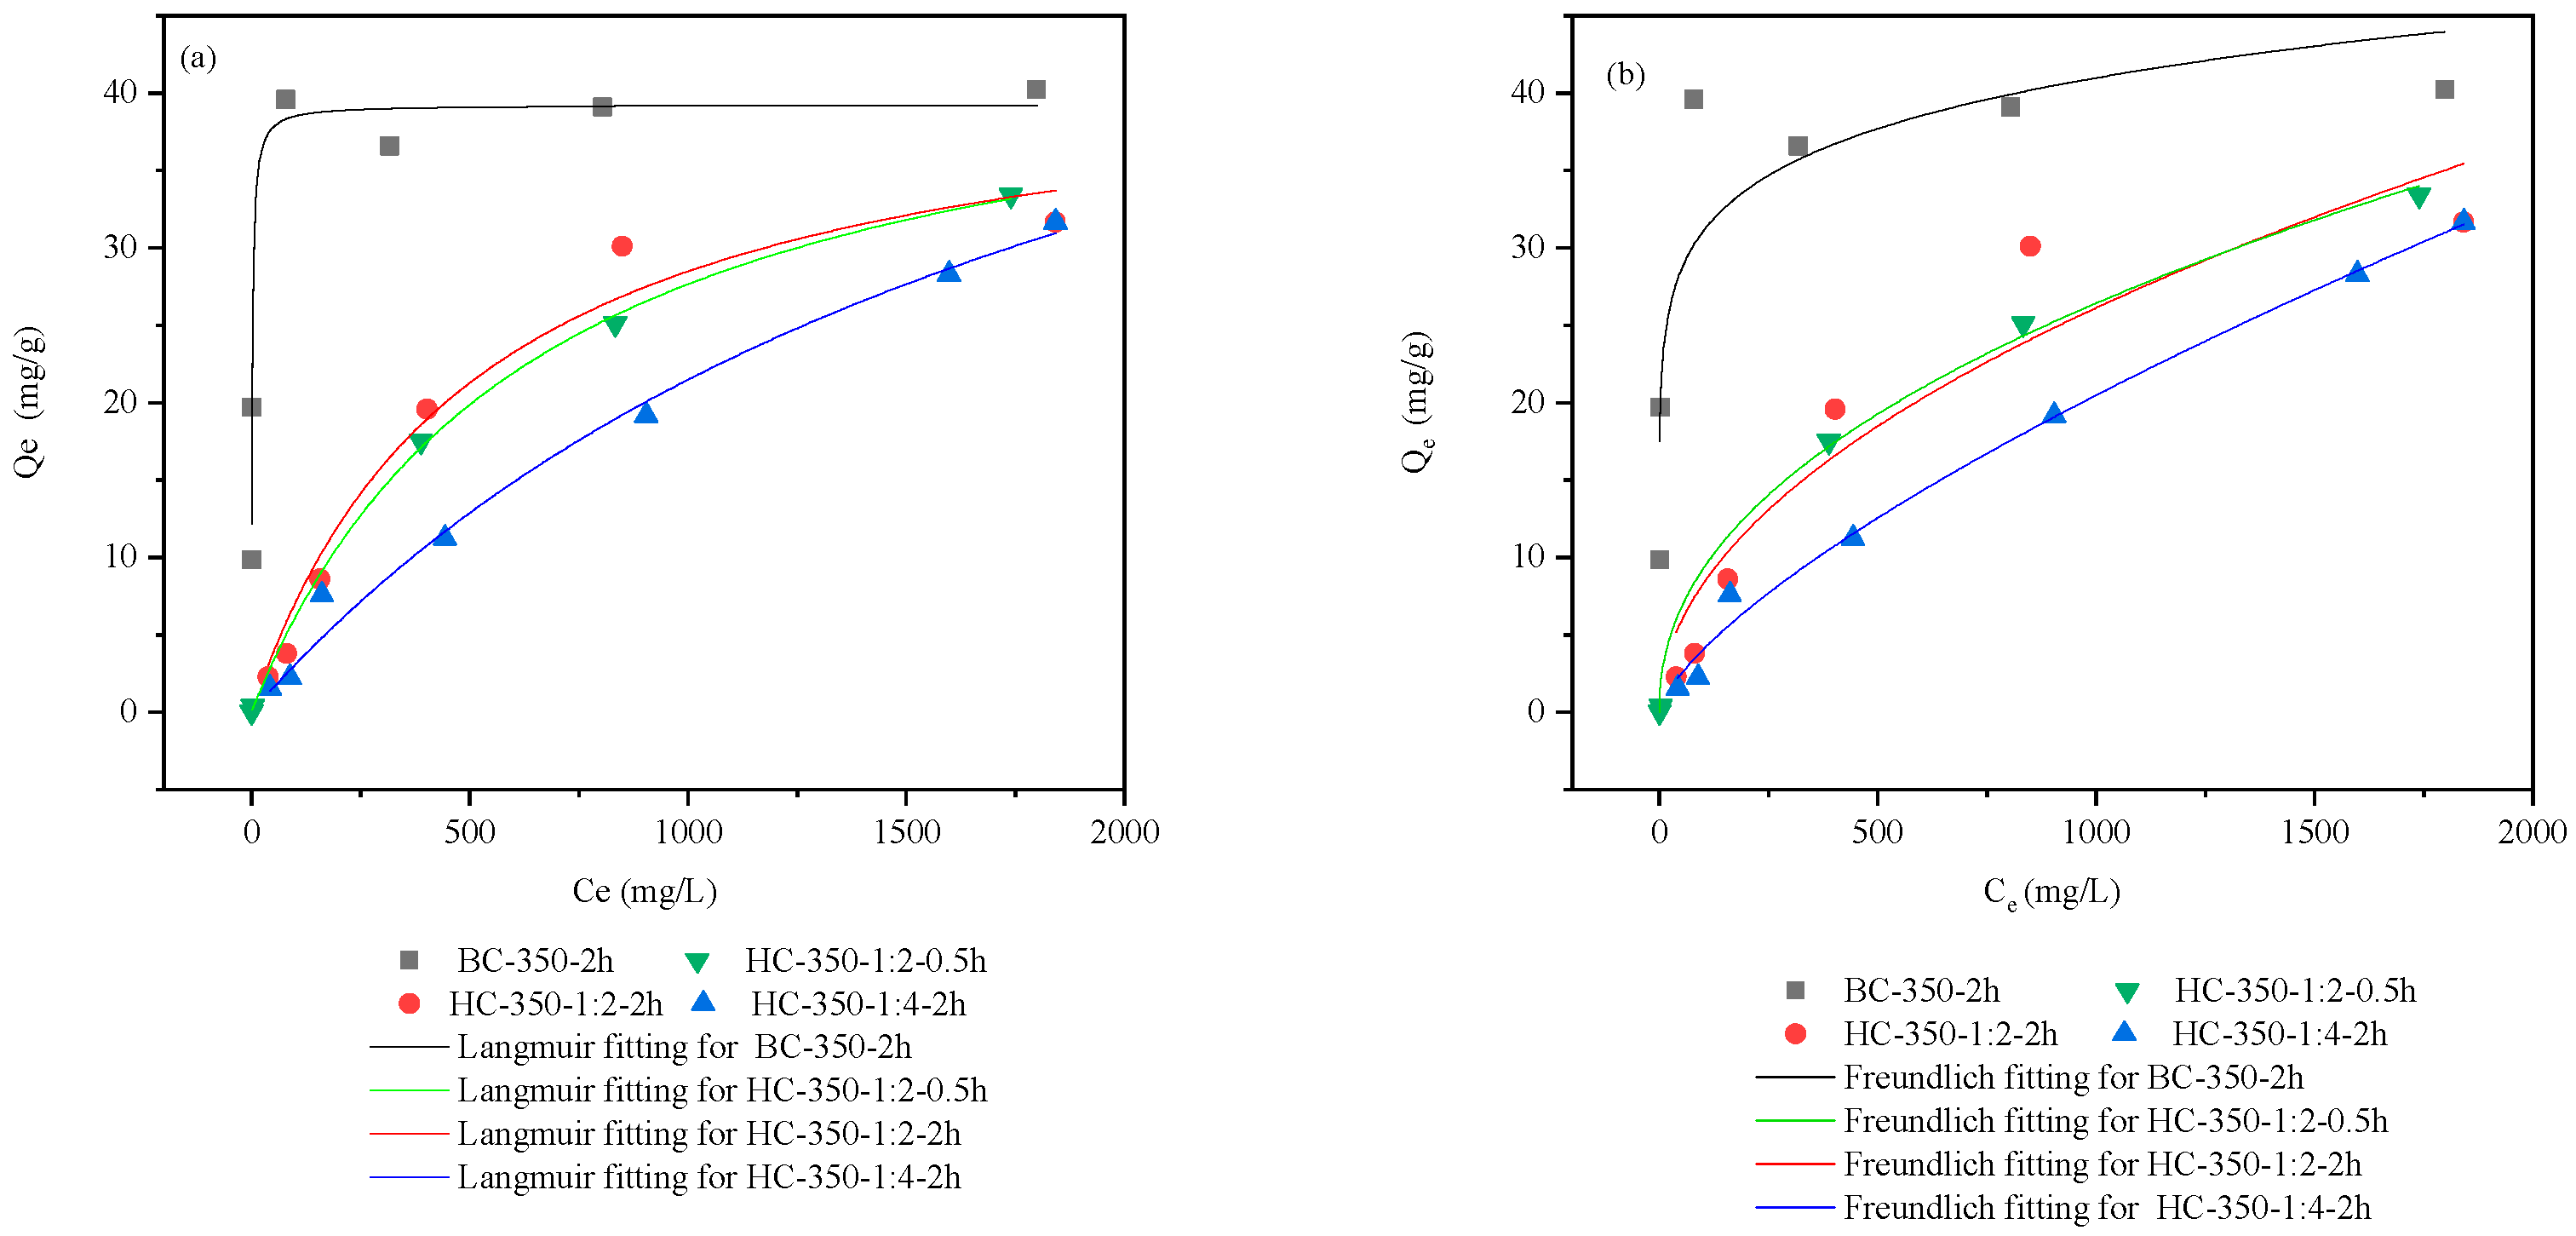
3.2.4. Isothermal Adsorption Modeling
As shown in Table 4, for BC, the adsorption process of Pb(II) by biochar was better described by the Langmuir equation than the Freundlich equation within the tested concentration range. For HC, both the Langmuir and Freundlich equations adequately described the adsorption process of Pb(II) by biochar.
Table 4.
Adsorption isotherm parameters of biochar materials.
The Langmuir model assumes that the adsorption process on biochar occurs as a monolayer on the surface [29], with all adsorption sites being identical and capable of adsorbing only one molecule per site. The shape and position of the fitted curves obtained for biochar under different preparation conditions (e.g., pyrolysis time, temperature, and material–water ratio) varied, reflecting the influence of these conditions on adsorption performance [30]. As shown in Table 4 and Figure 8, the maximum adsorption capacity of HC was 64.97 mg/g, which was higher than that of BC according to the Langmuir model. This indicates that HC has more adsorption sites than BC.
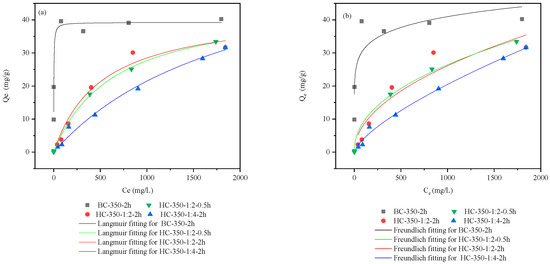
Figure 8.
Isothermal adsorption model for biochar materials: (a) Langmuir and (b) Freundlich.
The Freundlich model assumes that adsorption occurs on a non-uniform surface [31], with a diverse energy distribution of adsorption sites. In the Freundlich model, the constant KF reflects the adsorption affinity of the adsorbent, while the parameter n indicates the intensity of the adsorption process. A value of 1/n between 0.1 and 0.5 suggests ease of adsorption, while values greater than 2 indicate difficulty in adsorption. From Table 3, it is evident that BC is more suitable for Pb(II) adsorption compared to HC. Therefore, BC-350-2h was selected for the subsequent sediment remediation experiments.
3.3. Adsorption of Pb(II)-Contaminated Sediment
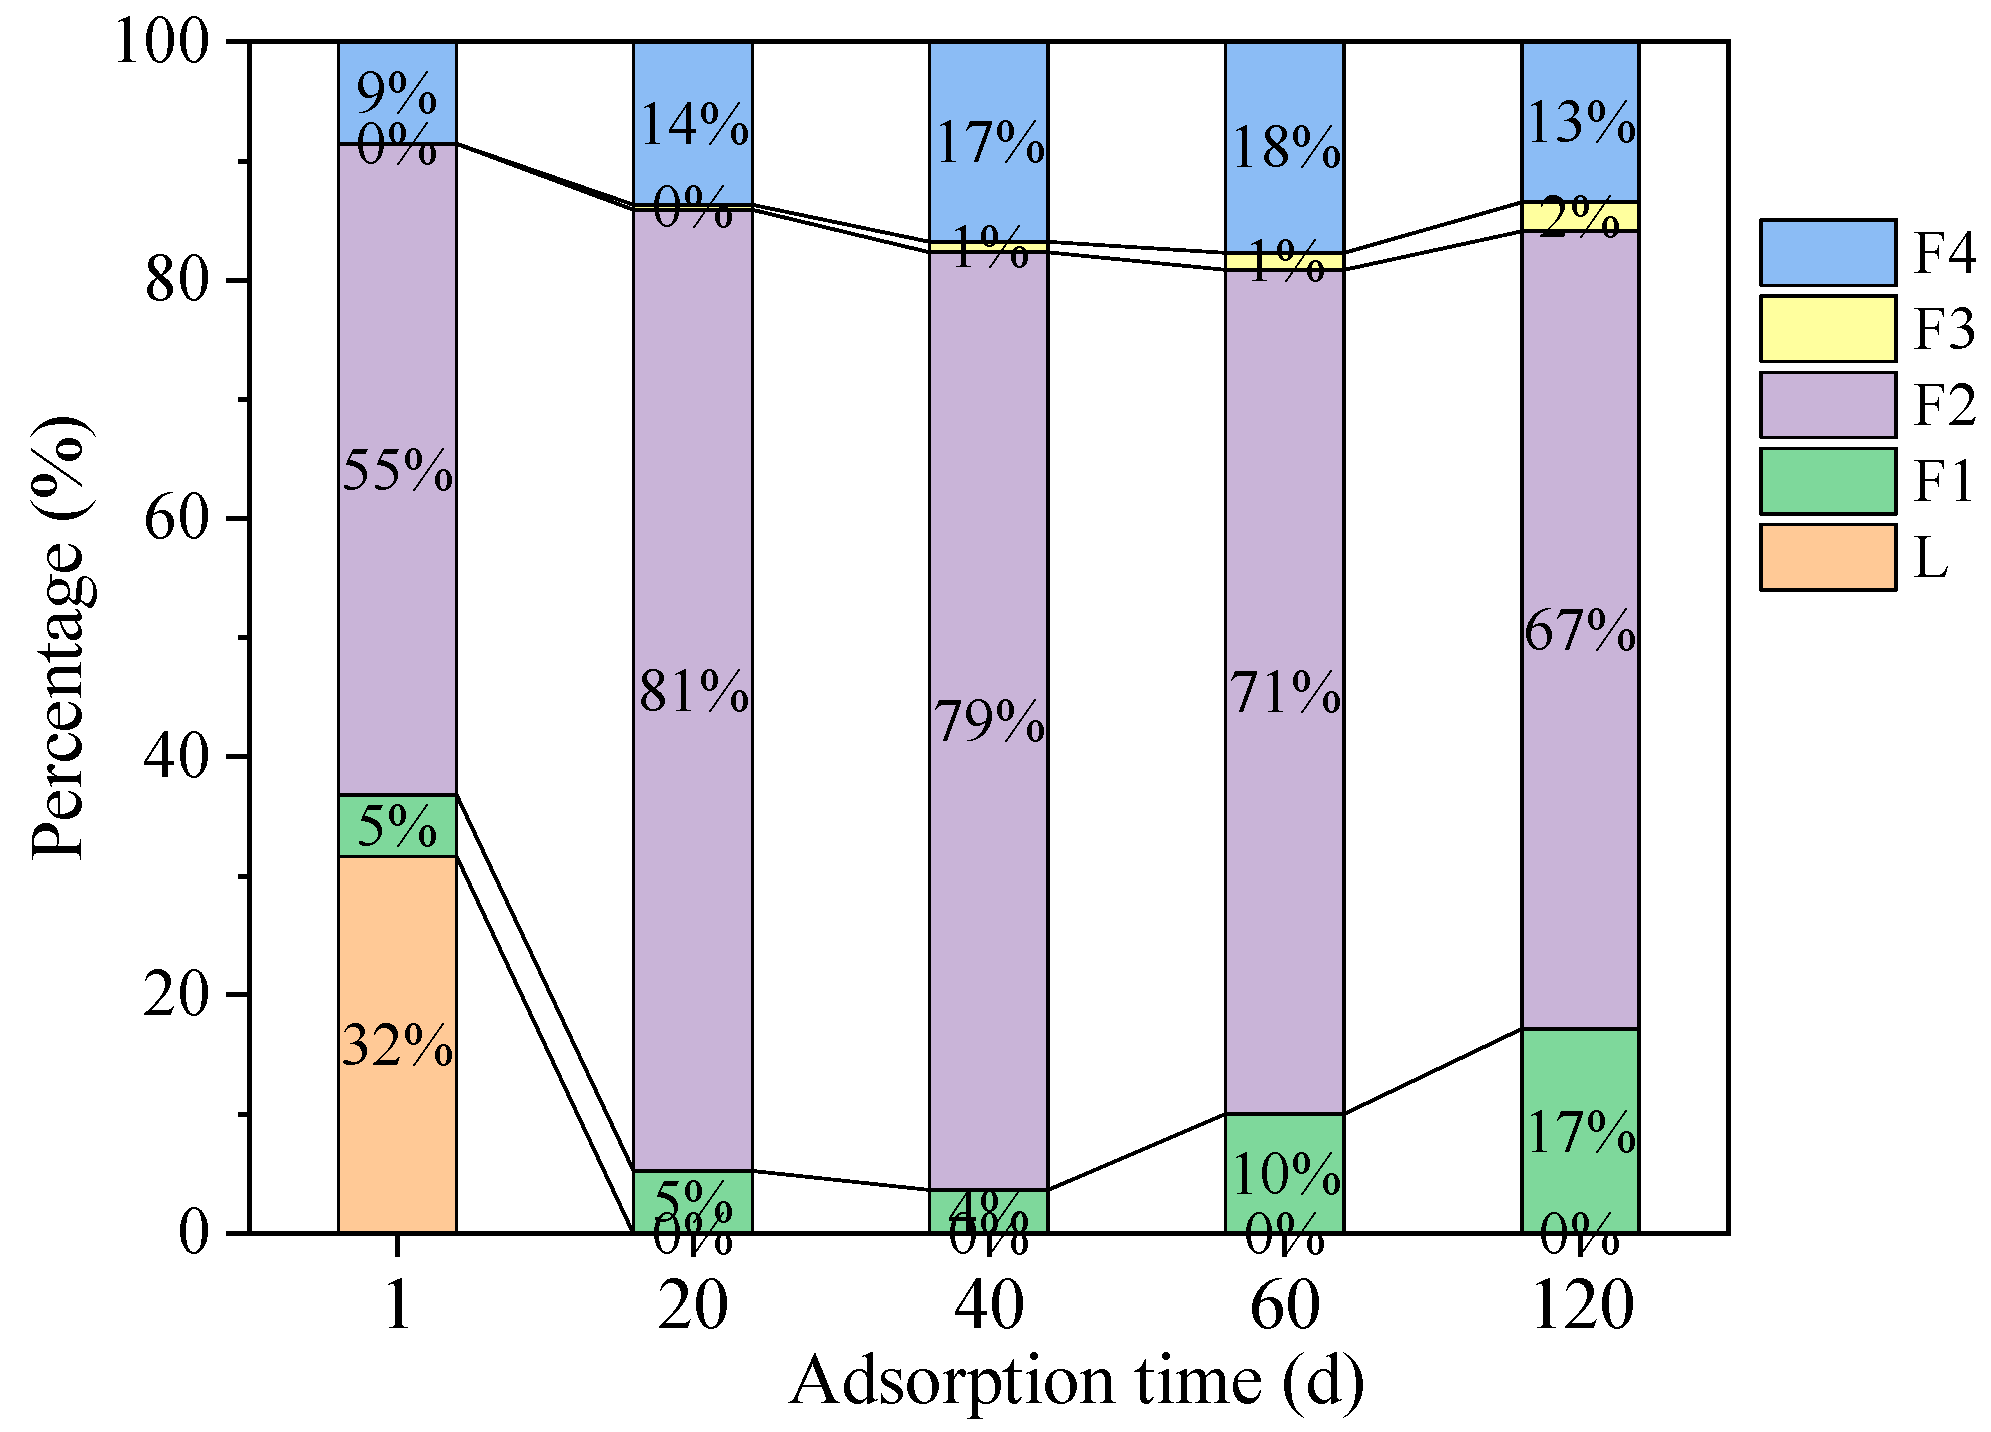
As noted in Section 3.2.2, BC is more effective for Pb(II) adsorption and is easier to prepare compared to HC. The distribution of Pb in the sediment is shown in Figure 9. At day 1 of adsorption, Pb content in the sediment liquid fraction accounted for 32% of the total Pb(II) content, and this concentration decreased to undetectable levels by day 20, suggesting that BC had successfully adsorbed all the Pb(II) in the liquid phase. For the silt solid, the Pb(II) content in the F1, F2, F3, and F4 fractions accounted for 5%, 55%, 0%, and 9% of the total Pb content at day 1, respectively. At day 20, these values shifted to 5%, 81%, 0%, and 14%, respectively, indicating that Pb(II) had been successfully transformed into more stable forms. However, the Pb(II) percentage of the F1 fraction in the silt solid slightly increased by day 120, suggesting that a small amount of Pb(II) migrated to an unstable state. Despite this, the absolute amount of the F1 fraction of Pb(II) remained low, at just 0.073 mg/g.
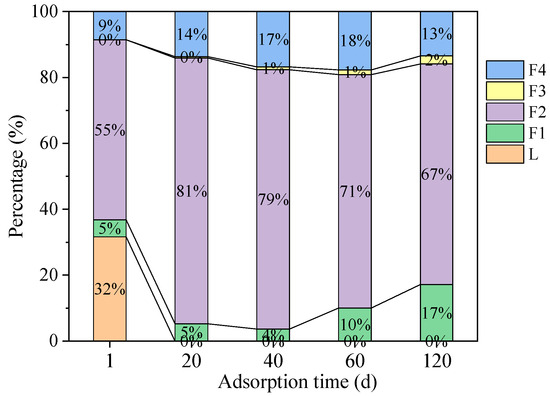
Figure 9.
Pb distribution in sediment (F1: acid-soluble fractions; F2: reducible fractions; F3: oxidizable fractions; F4: residual fractions; L: liquid fractions).
This re-unstabilizing phenomenon could be attributed to the large water content in the sediment, which leaches some DOC complexed with Pb(II). In contrast, Zhang et al. [13] found that the F1 fraction did not increase with time, likely because their biochar was prepared at a higher temperature (500 °C), which resulted in a lower concentration of DOC. Overall, Pb(II) in the sediment became more stable than in its initial state, though further studies are still needed to fully understand the long-term stability of Pb(II) in this system.
4. Discussion
From the property analysis of biochar materials in Section 3.1.2, it can be inferred that the main components of BC are likely aromatic substances with a high content of hydroxyl groups, and BC itself is alkaline. Therefore, cation-π interactions and precipitation could play a significant role in the adsorption of Pb(II) onto pyrolytic carbon. In addition, surface complexation from oxygen-containing functional groups, inorganic precipitation, inorganic nanoparticle adsorption, and electrostatic adsorption may also contribute. On the other hand, HC contains a greater amount of glucose and nanoparticle SiO2 spherical particles. The spherical particles are rich in oxygen-containing functional groups, which can adsorb Pb(II) through surface complexation, while the SiO2 nanoparticles may adsorb Pb(II) via molecular sieve mechanisms [26]. Additionally, cation-π interactions, electrostatic adsorption, and other mechanisms could be involved.
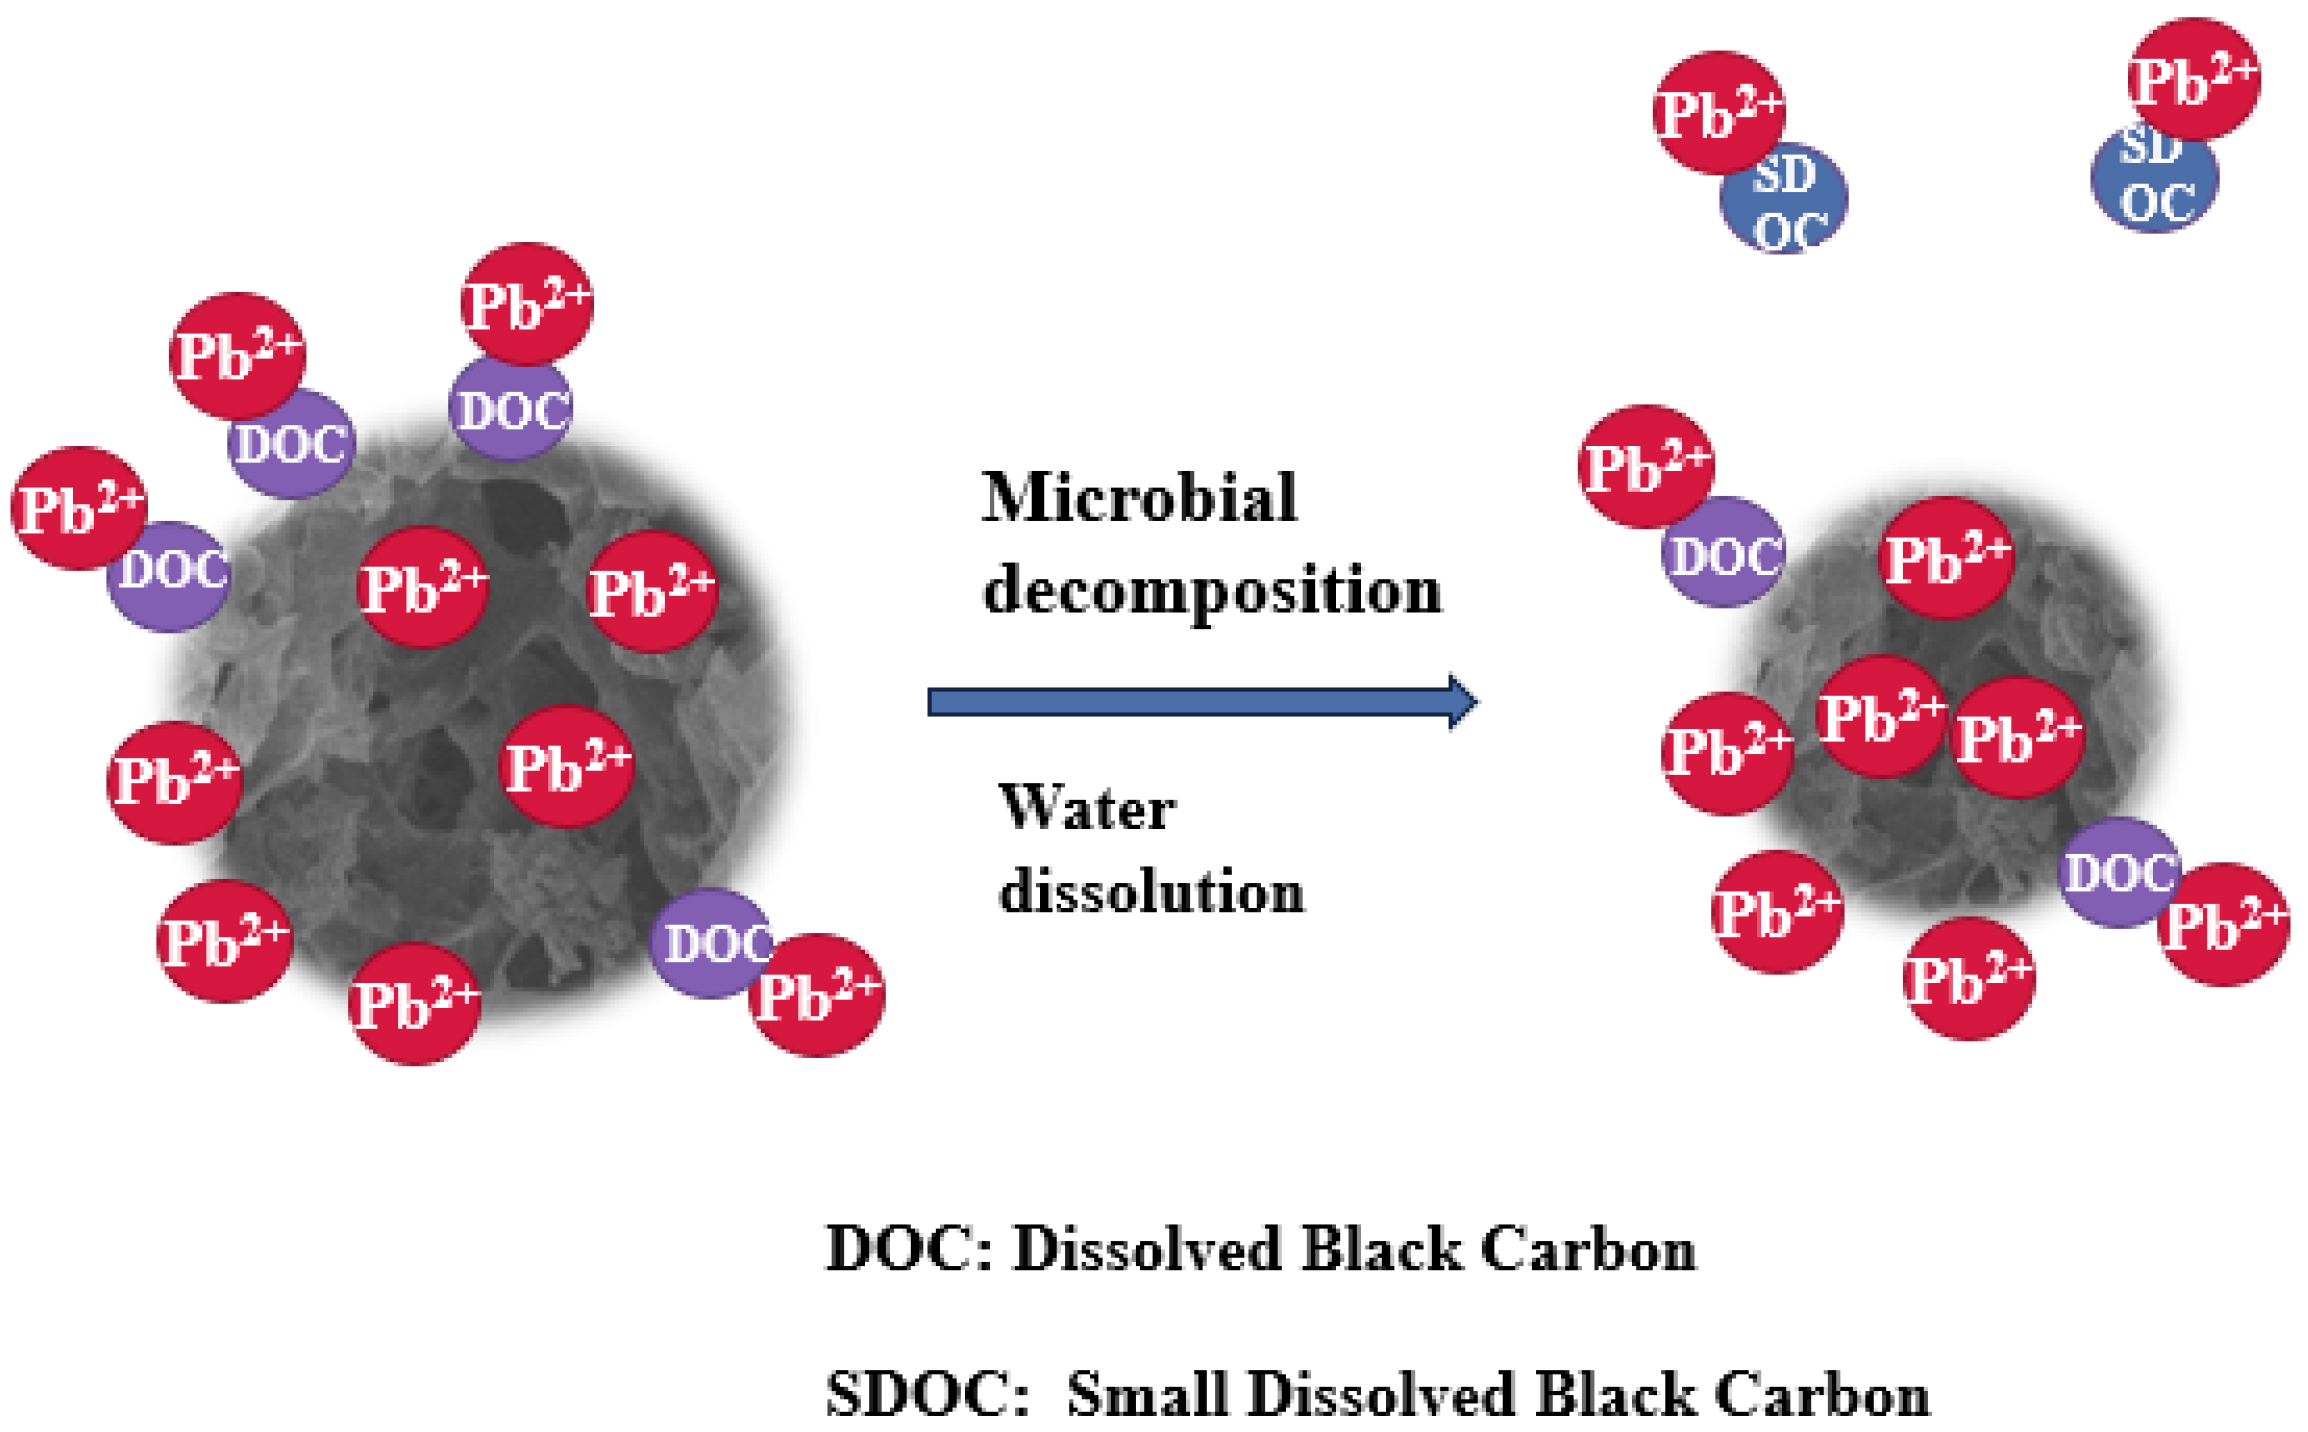
The migration of Pb(II) during adsorption is illustrated in Figure 10. During the initial phase of the remediation of the sediment, the DOC, containing a large amount of functional groups on BC, facilitates the adsorption of Pb(II) [32]. As the adsorption continues, the sediment, with its high water content, promotes the dissolution of DOC from the BC. This DOC serves as a nutrient for microbial growth and reproduction [13]. In the presence of microorganisms, DOC may degrade into smaller black carbon molecules (SDOCs), which weakens BC’s binding capacity, leading to an increase in the F2 fraction of Pb(II).
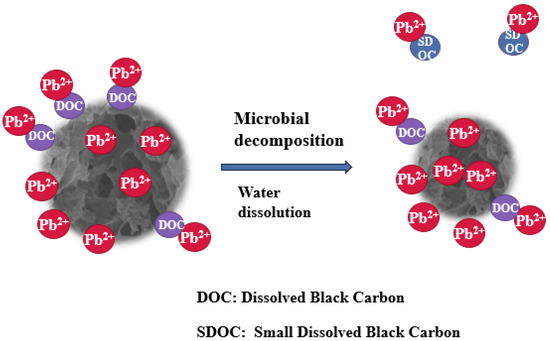
Figure 10.
Pb(II) migration during adsorption.
5. Conclusions
Various biochar materials were prepared and evaluated for the adsorption of a 50 mg/L Pb(II) solution, with BC also used for amendment experiments in Pb(II)-contaminated sediment at 500 mg/kg. The following conclusions were reached:
(1) The yield of BC was consistently above 35%, which was relatively higher than that of HC at the same temperature. Among all biochar materials, BC-300-0.5h achieved the highest yield (46.5%), but the straw was not fully carbonized at 300 °C. The yield of biochar decreased slightly with increasing reaction time, but the change was not significant. The optimal condition for BC preparation was 350 °C for 2 h, yielding 41.2%.
(2) For most biochar materials, the adsorption rate of Pb(II) from a 50 mg/L Pb(II) solution reached over 90% within 10 min of reaction, using a 5 g/L biochar dosage. The highest adsorption rates were observed with BC-350-2h and HC-350-1:2-0.5h, which showed adsorption capacities of 9.90 mg/g and 9.95 mg/g, respectively, achieving adsorption efficiencies of 99.0% and 99.5%.
(3) For biochar materials derived from WS, the Pb(II) adsorption rate increased rapidly within the first few minutes, reaching maximum adsorption between 10 and 30 min. Beyond this, the adsorption rate declined slightly, likely due to the detachment of DOC-bound Pb(II) from the biochar, which was re-released into the solution. The adsorption data were best fitted by the PFO or PSO models for BC, HC-350-1:2-2h, and HC-350-1:2-0.5h, while HC-350-1:4-2h was more consistent with the IPD model. According to the Langmuir model, HC demonstrated a higher maximum adsorption capacity than BC. However, the Freundlich model suggests that BC is more efficient in Pb(II) adsorption than HC.
(4) BC demonstrated a strong immobilization effect on Pb(II) in the sediment, with Pb(II) concentrations dropping to undetectable levels by day 20. However, a small amount of Pb(II) shifted to a less stable form when the adsorption time increased. This was attributed to the dissolution of DOC from BC which, under microbial action, may degrade into SDOC, weakening BC’s binding capacity. While BC was effective at stabilizing Pb(II) in dredged sediment, further research is needed to better understand the long-term effects of DOC dissolution and microbial interaction on the stability of adsorbed Pb(II).
Supplementary Materials
The following supporting information can be downloaded at: https://www.mdpi.com/article/10.3390/pr13040957/s1, Figure S1: The pHpzc values of biochar materials; Figure S2: Pore distribution of biochar materials.
Author Contributions
Conceptualization, Y.S.; Investigation, Y.S., Q.L., S.X., X.S., J.Z. and Y.L.; Methodology, Y.S. and Q.L.; Visualization, J.Z.; Writing—original draft, Y.S. and Q.L.; Writing—review and editing, W.W., Z.F. and D.L. All authors have read and agreed to the published version of the manuscript.
Funding
The work was supported by the Ministry of Housing and Urban-Rural Development of the People’s Republic of China research and development project (2016-K4-031).
Data Availability Statement
The original contributions presented in the study are included in the article, further inquiries can be directed to the corresponding authors.
Acknowledgments
The authors thank the Ministry of Housing and Urban-Rural Development of the People’s Republic of China research and development project (2016-K4-031) for support. We also thank Bing Xu for suggestions and assistance.
Conflicts of Interest
The authors declare no conflict of interest.
References
- Wang, H.; Wang, Z.W.; Yang, W.C.; Jia, H.L.; You, Z.J. Characterization, pollution, and beneficial utilization assessment of dredged sediments from coastal ports in China. Mar. Pollut. Bull. 2025, 211, 117389. [Google Scholar] [CrossRef] [PubMed]
- Wang, W.C.; Wu, S.Q.; Sui, X.Q.; Cheng, S.P. Phytoremediation of contaminated sediment combined with biochar: Feasibility, challenges and perspectives. J. Hazard. Mater. 2024, 465, 133135. [Google Scholar] [CrossRef]
- Deng, X.; Chen, G.; Zhang, C.; Gao, X.; Sun, B.; Shan, B. Manganese-modified biochar for sediment remediation: Effect, microbial community response, and mechanism. Environ. Pollut. 2024, 363, 125175. [Google Scholar] [CrossRef]
- Liu, H.; Bai, J.; Zhang, K.; Wang, C.; Liang, J.; Zhang, L.; Wang, Y.; Xiao, R. Heavy metal pollution and ecological risk assessment of surface sediments covered by emerged and submerged plants in a shallow lake. Ecohydrol. Hydrobiol. 2024, 24, 849–856. [Google Scholar] [CrossRef]
- Niu, Y.; Jiang, X.; Wang, K.; Xia, J.; Jiao, W.; Niu, Y.; Yu, H. Meta analysis of heavy metal pollution and sources in surface sediments of Lake Taihu, China. Sci. Total Environ. 2020, 700, 134509. [Google Scholar] [CrossRef]
- Negi, M.; Thankachan, V.; Rajeev, A.; Vairamuthu, M.; Arundhathi, S.; Nidheesh, P.V. Clean and Green Bamboo Magic: Recent Advances in Heavy Metal Removal from Water by Bamboo Adsorbents. Water 2025, 17, 454. [Google Scholar] [CrossRef]
- Ye, S.Y.; Jiang, X.Y.; Yang, Y.R.; Xu, X.M.; Zhao, C.H.; Ma, J.Z.; Yang, W.; Liu, L.F. Removal of Pb2+ from Aqueous Media by Solidago canadensis L.-Derived and Crab Shell-Derived Biochar: Adsorption Behavior and Optimization of Adsorption Conditions. Water Air Soil. Pollut. 2025, 236, 87. [Google Scholar] [CrossRef]
- Das, S.K.; Ghosh, G.K.; Avasthe, R. Conversion of crop, weed and tree biomass into biochar for heavy metal removal and wastewater treatment. Biomass Convers. Biorefinery 2023, 13, 4901–4914. [Google Scholar] [CrossRef]
- Lebrun, M.; Macri, C.; Miard, F.; Hattab-Hambli, N.; Motelica-Heino, M.; Morabito, D.; Bourgerie, S. Effect of biochar amendments on As and Pb mobility and phytoavailability in contaminated mine technosols phytoremediated by Salix. J. Geochem. Explor. 2017, 182, 149–156. [Google Scholar] [CrossRef]
- Kiran, B.R.; Prasad, M.N.V. Biochar and rice husk ash assisted phytoremediation potentials of Ricinus communis L. for lead-spiked soils. Ecotoxicol. Environ. Saf. 2019, 183, 109574. [Google Scholar] [CrossRef]
- Dong, Y.C.; Yu, B.; Jia, Y.F.; Xu, X.K.; Zhou, P.; Yu, M.D.; Liu, J.G. Influence of sewage sludge compost on heavy metals in abandoned mine land reclamation: A large-scale field study for three years. J. Hazard. Mater. 2025, 486, 137098. [Google Scholar] [CrossRef] [PubMed]
- Wang, M.M.; Ren, L.S.; Wang, D.Y.; Cai, Z.S.; Xia, X.F.; Ding, A.Z. Assessing the capacity of biochar to stabilize copper and lead in contaminated sediments using chemical and extraction methods. J. Environ. Sci. 2019, 79, 91–99. [Google Scholar] [CrossRef] [PubMed]
- Zhang, Y.; Zhou, W.; Liu, C.; Liu, G.; Li, Y.; Ding, B.; Zhang, P.; Zhang, X.; Zhang, Z. Remediation of Pb and Cd contaminated sediments by wheat straw biochar and microbial community analysis. Environ. Technol. Innov. 2024, 36, 103849. [Google Scholar] [CrossRef]
- Xu, Z.R.; Zhu, W.; Gong, M.; Zhang, H.W. Direct gasification of dewatered sewage sludge in supercritical water. Part 1: Effects of alkali salts. Int. J. Hydrogen Energy 2013, 38, 3963–3972. [Google Scholar] [CrossRef]
- Su, Y.; Zhu, W.; Gong, M.; Zhou, H.; Fan, Y.; Amuzu-Sefordzi, B. Interaction between sewage sludge components lignin (phenol) and proteins (alanine) in supercritical water gasification. Int. J. Hydrogen Energy 2015, 40, 9125–9136. [Google Scholar] [CrossRef]
- GB/T 15224.1-2018; Classification for Quality of Coal. Part 1: Ash. Standards Press of China: Beijing, China, 2018.
- Yin, H.; Zhu, J. In situ remediation of metal contaminated lake sediment using naturally occurring, calcium-rich clay mineral-based low-cost amendment. Chem. Eng. J. 2016, 285, 112–120. [Google Scholar] [CrossRef]
- Tan, L.; Nie, Y.; Chang, H.; Zhu, L.; Guo, K.; Ran, X.; Zhong, N.; Zhong, D.; Xu, Y.; Ho, S.H. Adsorption performance of Ni(II) by KOH-modified biochar derived from different microalgae species. Bioresour. Technol. 2024, 394, 130287. [Google Scholar] [CrossRef]
- Park, G.; Phule, A.D.; Elkaee, S.; Kim, S.Y.; Zaman, M.W.U.; Yang, J.H.; Jeon, S.-C. Conversion of PET bottles into carbonaceous adsorbents for Pb(II) removal from aqueous solutions via KOH activation. J. Water Process Eng. 2024, 66, 106092. [Google Scholar] [CrossRef]
- Yun, X.; Ma, Y.; Zheng, H.; Zhang, Y.; Cui, B.; Xing, B.J.B. Pb(II) adsorption by biochar from co-pyrolysis of corn stalks and alkali-fused fly ash. Biochar 2022, 4, 66. [Google Scholar] [CrossRef]
- Uchimiya, M.; Ohno, T.; He, Z.Q. Pyrolysis temperature-dependent release of dissolved organic carbon from plant, manure, and biorefinery wastes. J. Anal. Appl. Pyrolysis 2013, 104, 84–94. [Google Scholar] [CrossRef]
- Qu, X.L.; Fu, H.Y.; Mao, J.D.; Ran, Y.; Zhang, D.N.; Zhu, D.Q. Chemical and structural properties of dissolved black carbon released from biochars. Carbon 2016, 96, 759–767. [Google Scholar] [CrossRef]
- Chen, Y.; Huang, S.A.; Yu, K.; Guo, J.Z.; Wang, Y.X.; Li, B. Adsorption of lead ions and methylene blue on acrylate-modified hydrochars. Bioresour. Technol. 2023, 379, 129067. [Google Scholar] [CrossRef]
- Bai, J.; Li, L.; Chen, Z.; Chang, C.; Pang, S.; Li, P. Study on the optimization of hydrothermal liquefaction performance of tobacco stem and the high value utilization of catalytic products. Energy 2023, 281, 128283. [Google Scholar] [CrossRef]
- Jindo, K.; Mizumoto, H.; Sawada, Y.; Sanchez-Monedero, M.A.; Sonoki, T. Physical and chemical characterization of biochars derived from different agricultural residues. Biogeosciences 2014, 11, 6613–6621. [Google Scholar] [CrossRef]
- Su, Y.; Liao, Q.; Xia, S.; Yang, Y.; Sun, Y.; Wang, W. Adsorption of Pb(II) by hydrochar derived from wheat straw and swine manure: Focus on mineral constituents. Energy Sources Part A-Recovery Util. Environ. Eff. 2024, 46, 14977–14988. [Google Scholar] [CrossRef]
- Hong, C.; Wang, Z.; Si, Y.; Xing, Y.; Yang, J.; Feng, L.; Wang, Y.; Hu, J.; Li, Z.; Li, Y. Catalytic Hydrothermal Liquefaction of Penicillin Residue for the Production of Bio-Oil over Different Homogeneous/Heterogeneous Catalysts. Catalysts 2021, 11, 849. [Google Scholar] [CrossRef]
- Nzediegwu, C.; Naeth, M.A.; Chang, S.X. Lead(II) adsorption on microwave-pyrolyzed biochars and hydrochars depends on feedstock type and production temperature. J. Hazard. Mater. 2021, 412, 125255. [Google Scholar] [CrossRef]
- Skodras, G.; Diamantopoulou, I.; Pantoleontos, G.; Sakellaropoulos, G.P. Kinetic studies of elemental mercury adsorption in activated carbon fixed bed reactor. J. Hazard. Mater. 2008, 158, 1–13. [Google Scholar] [CrossRef]
- Gupta, V.K.; Mittal, A.; Malviya, A.; Mittal, J. Adsorption of carmoisine A from wastewater using waste materials—Bottom ash and deoiled soya. J. Colloid. Interface Sci. 2009, 335, 24–33. [Google Scholar]
- Raji, C.; Anirudhan, T.S. Batch Cr(VI) removal by polyacrylamide-grafted sawdust: Kinetics and thermodynamics. Water Res. 1998, 32, 3772–3780. [Google Scholar]
- Tang, J.; Li, X.; Luo, Y.; Li, G.; Khan, S. Spectroscopic characterization of dissolved organic matter derived from different biochars and their polycylic aromatic hydrocarbons (PAHs) binding affinity. Chemosphere 2016, 152, 399–406. [Google Scholar] [CrossRef] [PubMed]


Disclaimer/Publisher’s Note: The statements, opinions and data contained in all publications are solely those of the individual author(s) and contributor(s) and not of MDPI and/or the editor(s). MDPI and/or the editor(s) disclaim responsibility for any injury to people or property resulting from any ideas, methods, instructions or products referred to in the content. |
© 2025 by the authors. Licensee MDPI, Basel, Switzerland. This article is an open access article distributed under the terms and conditions of the Creative Commons Attribution (CC BY) license (https://creativecommons.org/licenses/by/4.0/).