Abstract
Poorly designed devices can cause flow maldistribution, leading to subpar performance during macromolecule separation. Analyzing the fluid flow in intricate membrane channel structures is challenging. In this study, computational fluid dynamics (CFD) was employed to investigate the effects of the channel tortuosity, size, and connectivity on flow distribution and chromatography performance. Sodium chloride (NaCl) and bovine serum albumin (BSA) were used as tracers. The results showed that the peaks from the NaCl and BSA were sharper as the tortuosity and size heterogeneity decreased to 0, revealing that both the tortuosity and size heterogeneity are critical factors that affect the flow distribution uniformity and thereby the membrane performance during biomacromolecule separation. These findings underscore the importance of optimizing the channel tortuosity and size to enhance membrane performance, offering practical insights for the design of next-generation purification systems. These insights pave the way for optimizing membrane design in future biopharmaceutical applications.
1. Introduction
Since the 19th century, the rapid development of biomedicine led to biological drugs accounting for over 50% of the top 100 best-selling drugs in 2020 [1,2]. However, their large molecular size, complex structure, and poor stability result in significant mass transfer resistance and stringent separation conditions, presenting major challenges for downstream purification [3,4,5]. Addressing these challenges is critical not only for improving the efficiency and cost-effectiveness of biopharmaceutical manufacturing but also for advancing global healthcare by enabling the large-scale production of life-saving therapies. Column chromatography, with its high resolution, flexibility, scalability, and reproducibility, has become the primary method for the downstream separation and purification of biopharmaceuticals. However, it is hindered by a slow mass transfer, high system pressure drop, and substantial flow resistance, all of which limit the efficiency of biological drug purification [6,7]. Membrane chromatography has emerged as a promising alternative that can overcome these limitations. In membrane chromatography, mass transfer occurs primarily through convective flow, bypassing the limitations of channel diffusion and enhancing the mass transfer rates. The ultrathin membrane thickness and large cross-sectional area significantly reduce system pressure drops and the mass transfer resistance, making this method an emerging alternative for the separation of current biopharmaceutics like monoclonal antibodies and the promising larger ones like virus like particles and exosomes [8,9,10]. The uniformity of the fluid distribution is a key factor influencing the separation efficiency in biopharmaceutical purification. Since the 1970s, researchers have widely studied this issue [11]. Nuclear magnetic resonance studies have shown that non-uniform fluid flow distribution leads to peak broadening and asymmetry, thereby reducing the separation selectivity. This non-uniform distribution is often a result of poor device design and heterogeneous resin or membrane structures [8,12]. Traditional chromatographic devices often exhibit a non-uniform flow and path distribution, along with radial velocity nonlinear decay, due to limitations in header design. Various optimizations have been proposed to improve the fluid distribution within these devices. Studies have demonstrated that specialized curtain-style inlets [13], a segmented parallel flow [14], and rectangular box-shaped designs [15] effectively enhance the flow distribution uniformity, leading to improved separation performance in both resin-based and membrane chromatography.
Non-uniform fluid distribution within packed or membrane beds is primarily caused by the inherent structure of the bed. In column chromatography, the distribution is mainly influenced by the shape and packing method of the packing materials [16,17], while in membrane chromatography, it is constrained by the channel structure within the membrane. M. Dorn et al. investigated optimal packing conditions and found that the repetitive application of flowing packing material combined with dynamic axial compression (DAC) results in the most uniform packing density distribution and the highest packing stability, which remain almost unchanged during long-term operation under cyclic fluid dynamic loads [18]. KHorváth et al. used numerical simulations to show that the column efficiency decreases with an increasing particle size distribution (PSD) of the chromatographic stationary phase [19]. As the size of the separated molecules increases, the impact of the PSD width on the separation efficiency becomes more pronounced. Shi et al. developed an affinity membrane chromatography adsorption model based on the Freundlich adsorption equation, demonstrating that increasing the membrane channel non-uniformity delays the time to complete saturation and reduces the solute recovery efficiency [20]. However, these studies have primarily focused on macroscopic flow distribution, leaving a critical gap in understanding regarding the microscopic flow dynamics within membrane channels.
Computational fluid dynamics (CFD) is an advanced approach in science and engineering that utilizes numerical methods and algorithms to simulate and analyze fluid flow and heat transfer, and can be used to analyze flow distribution microscopically. Traditional chromatographic theories often simplify the impact of geometric shapes on the packing material and its arrangement. In contrast, CFD can simulate the shape and arrangement of packing particles, providing more accurate and realistic simulation results. De Smet et al. constructed a CFD model and found that the band broadening in 2D-etched packed bed columns varied with the particle geometry [21]. Among the three shapes that were studied, cylindrical, equilateral hexagonal, and diamond-shaped, the axially elongated diamond shape exhibited 40% less separation impedance than the other shapes. Dolamore et al. used CFD to study the effect of the packing shape on the chromatographic performance of structured packings. Their research found that nonspherical packings outperformed spherical packings, which was attributed to their reduced “compression” effect caused by them having narrow flow restrictions compared to the spherical arrangements [22]. Notably, in membrane chromatography—a hybrid technology integrating membrane separation and chromatographic adsorption—the interplay between the microscale flow characteristics of packings and membrane structural features becomes significantly more complex, yet related CFD studies remain in their infancy. Recent advancements in CFD modeling further underscore its versatility in membrane process research. For instance, Mohammadi Amin et al. developed a high-fidelity 3D CFD framework for pressure-retarded osmosis (PRO), capturing intricate interactions between flow regimes, concentration polarization, and membrane geometry [23]. Similarly, Buell et al. employed COMSOL Multiphysics 5.6 to model diffusion and convection effects in microfluidic chips with greater precision [24]. Their integration of fluid–structure interaction solvers and adaptive mesh techniques provides valuable methodological insights for conducting multiscale flow simulations in membrane chromatography channels. While these studies have demonstrated the potential of CFD in chromatographic research, few have applied it to investigate the flow distribution uniformity within membrane chromatography. A lack of understanding regarding how microscopic variations in the channel geometry influence the flow distribution and separation performance limits the ability to design membranes optimized for biopharmaceutical preparation, which would be the focus of the current work.
Traditional membrane chromatography models typically rely on Langmuir and Freundlich adsorption isotherms to describe solute partitioning behavior, simplifying the complex dynamics of adsorption and desorption. However, this approach fails to capture the true microscopic interactions between the solute and the membrane matrix, reducing the accuracy of simulations. To overcome this limitation, the spatial mass approximation (SMA) method directly models the mass transfer process without relying on simplified assumptions about adsorption equilibrium, offering a more accurate representation of solute transport and distribution within membrane channels [25,26]. For example, van Beijeren et al. [27] successfully used the SMA model to analyze the dynamic adsorption behavior of bovine serum albumin (BSA) on anion/cation exchange membranes. They found that the adsorption capacity of cation-exchange membranes is jointly influenced by the flow rate and salt concentration, demonstrating the SMA’s ability to characterize non-ideal effects such as multilayer adsorption. Vicente et al. [28] further applied the SMA model to the membrane chromatography purification of virus-like particles (VLPs), showing its ability to precisely predict the elution profiles of complex biological particles and achieving a 98% removal of host proteins, thereby highlighting the advantages of SMA in multi-component separations.
This study employs CFD technology to construct models from a microscopic perspective, including the NaCl tracer flowthrough process and the bovine serum albumin (BSA) elution process within microchannels. By creating sets of channels with varying degrees of uniformity in terms of their tortuosity, size distribution, and connectivity, this study investigates how changes in channel structure affect the fluid flow distribution and the protein elution process within membrane chromatography. Subsequently, the NaCl tracer process within channels containing macroscopic membranes was modeled to validate the effect of non-uniform flow distribution on membrane performance, as predicted by the CFD simulations based on the channel structure.
2. Materials and Methods
The adsorption–desorption model for membrane chromatography was developed using COMSOL Multiphysics 6.1 (COMSOL AB, Stockholm, Sweden) to investigate the effect of channel uniformity on the membrane chromatography purification process. The study was conducted from two perspectives: microscopic channels and macroscopic membranes. The flowthrough and elution processes were performed using NaCl as the small molecule tracer and a model protein BSA as the macromolecule tracer within microscopic channels with varied channel parameters, such as tortuosity. The small molecular tracer flowing through a macroscopic membrane (uniform or specific non-uniform) was also examined. The NaCl tracer models were developed based on the following assumptions: (I) incompressible and isothermal flow, (II) negligible external forces, (III) laminar, steady-state flow, (IV) and negligible spatial steric hindrance. The BSA tracer models incorporated an additional assumption: (V) a 1:1 exchange ratio between BSA and NaCl.
2.1. Geometrical Structure
2.1.1. Geometric Structure of the Microscopic Channel
The geometric structure of the microscopic channel, as depicted in Figure 1, comprises uniform channels assembled from two cylindrical straight-through channels. Each channel is a cylindrical pore with a diameter (d) of 2 μm, a height of 100 μm, and a tortuosity (τ) of 1, and there are no interconnections between the two channels (Figure 1a). By adjusting the values of τ and d for channel 2, along with the connectivity between channels 1 and 2, we developed a series of non-uniform channel geometric structures with variations in their channel tortuosity distributions (Figure 1b), pore size distributions (Figure 1c), and channel connectivity modes (Figure 1d).
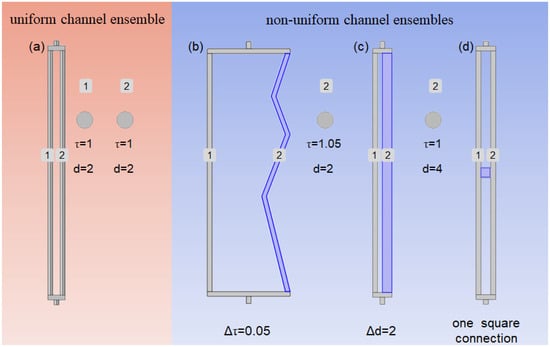
Figure 1.
Structure of channels: (a) the uniform channel ensemble; (b) channel tortuosity distributions with Δτ = 0.05; (c) pore size distributions with Δd = 2; (d) channel connectivity mode with one square connection.
The degree of heterogeneity (Δ) between the two channels was used to describe the uniformity of the channel ensemble. Here, τ represents the tortuosity, defined as the ratio of the actual length of the flow path through the channel to the vertical length traversing the porous medium [29]:
where Lt is the actual length of the fluid path through the channel, and L0 is the vertical length of the fluid path.
The asymmetry factor (As) can describe the symmetry of peaks within a channel set or a macroscopic membrane. The closer the As value is to 1, the more symmetrical the peak shape. It is defined as the ratio of the distance (B) between the front 10% peak height position and the peak height position to the distance (A) between the back 10% peak height position and the peak height position [30]:
2.1.2. Geometry of the Macroscopic Membrane
Microscopic channel simulations provide insights into localized flow patterns, enabling an analytical correlation between uniformity variations and channel performance. Macroscopic membranes, however, comprise thousands of interconnected microscopic channels with intricate structures that interact with and influence each other. Macroscopic modeling was performed to verify the accuracy of the microscopic simulations and examine the fluid distribution throughout the membrane.
The geometric structure of the macroscopic membrane, as shown in Figure 2, was designed as a cylindrical porous medium with a radius of 700 μm. To account for the impact of membrane thickness on residence time and flow path, membranes with thicknesses of 100 μm and 600 μm were constructed. To introduce differences in membrane uniformity, the cylindrical membrane was divided axially into three equal parts (A, B, and C) and radially into eight equal sections (1–8), resulting in 24 independent homogeneous subdomains. Porosity (ϵ) and permeability (k) were used to characterize the membrane’s flow and mass transfer properties. ϵ is defined as [31]:
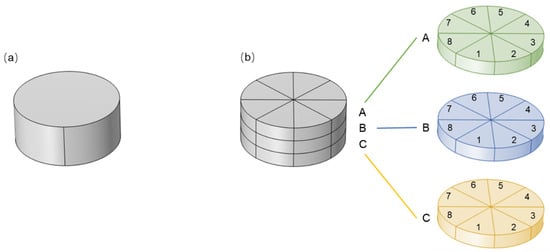
Figure 2.
Geometric structures of macroscopic membrane: (a) homogeneous membrane; (b) heterogeneous membrane with three layers (A, B, and C), with each layer contains eight regions (1–8) with varying ϵ and k.
Here, Vp represents the volume of the channels within the membrane, and V is the total volume of the membrane.
Flow rate (Q) is defined as [32]:
where k is the permeability, A is the cross-sectional area for fluid flow, ΔP is the pressure difference, and L is the flow path length.
Permeability (k) can be obtained from Equation (4):
The homogeneous membrane was assumed to be isotropic, with ϵ set to 0.37 and k set to 1.2 × 10⁻¹² m2. In contrast, the heterogeneous membrane had varying ϵ and k values at different regions, as shown in Table 1 and Table 2. The weighted averages of ϵ and k for the heterogenous membrane are equivalent to those of the homogeneous membrane.

Table 1.
ϵ settings for a heterogeneous membrane with 24 regions.
Table 2.
k settings for a heterogeneous membrane (unit: 10−12 m2) with 24 regions.
2.2. Solving Methods
Various interfaces in COMSOL Multiphysics 6.1 were used to describe the mass transfer phenomena of substances within the membrane chromatography channels, with the dilute species transport interface employed for analyzing substance transport. For fluid dynamics, the laminar flow interface was applied to the microchannels, while the Brinkman interface was used to model fluid behavior within the macroscopic membrane. The protein desorption process was modeled using established equilibrium equations.
2.2.1. Momentum Conservation Equation
The Navier–Stokes equation, a fundamental equation in fluid dynamics, describes the motion of fluids in free-flow regions [33]:
In this study, the fluid flow is considered to be in a steady-state condition. Therefore, the time-dependent term is neglected, simplifying the equation for steady-state analysis.
μ is the fluid’s dynamic viscosity, v is the fluid velocity, P is the pressure, t is the time, and ρ is the fluid density.
The Brinkman equation is a mathematical model used in fluid mechanics to describe viscous fluid flowthrough a membrane. It was used to simulate fluid behavior in the membrane [34]:
Similarly, for steady-state conditions, the time-dependent term is omitted, and the equation is simplified accordingly.
Where u is the fluid velocity in the membrane, ϵ is the porosity, k is the permeability, and Qin is the volumetric source term.
2.2.2. Mass Conservation Equation
The mass conservation equation, also known as the continuity equation, for incompressible fluids is expressed as [35]:
This equation inherently assumes steady-state flow, as no time-dependent terms are included, further supporting this study’s focus on steady-state conditions.
2.2.3. Convection-Diffusion Equation
Mass transfer in membrane chromatography is primarily dominated by convection, with diffusion playing a secondary role. The convection-diffusion equation describes mass transfer phenomena within the membrane or channels [36] as follows:
The dilute species transport interface solves this equation to capture the spatiotemporal variations in solute concentration, where the convection term v⋅∇c describes the influence of fluid flow on solute transport, the diffusion term D∇2c describes molecular diffusion of the solute, and the adsorption term describes the adsorption kinetics of the solute on the membrane surface.
c is the solute’s concentration, v is the velocity vector, D is the diffusion coefficient, and q refers to the concentration of the adsorbed species.
2.2.4. BSA Elution Equilibrium Equation
The space mass action (SMA) approximation for the exchange of BSA with NaCl describes the BSA elution process in the microchannels. The model combines mass action and steric hindrance effects, providing a more accurate and comprehensive description of the reaction kinetics [26,37]. The adsorption–desorption reaction is described by COMSOL Multiphysics 6.1, and the equilibrium equation is as follows:
This equation is coupled with the convection-diffusion equation through the dilute species transport interface, simulating the dynamic behavior of proteins during the elution process.
P(ads) represents proteins adsorbed on the wall before elution, S is salt ions in the eluent, P is proteins desorbed from the wall, and S(ads) is salt ions adsorbed on the wall.
2.3. Model Setup
To accurately describe the physical behavior of the system, the numerical simulations rely on a set of critical parameters. Table 3 details the names, physical significance, and assigned values of these parameters.
Table 3.
Parameters of the mathematical model.
2.3.1. NaCl Tracer Process in Microscopic Channels
In this study, NaCl was injected as a Gaussian pulse for a duration of 0.2 s. The flow velocity range used in the membrane chromatography process ranged from 1 × 10⁻⁶ m/s to 1 × 10⁻⁴ m/s [38]. To investigate the influence of membrane chromatography pore structures on performance, we selected the uniform pores containing membrane with a thickness of 100 μm as the benchmark. However, this is significantly smaller than the typical membrane channel height in stacked membranes used in conventional membrane chromatography (ranging from 1 × 10⁻² cm to 1 cm). To avoid the masking of flow differences by the short residence time, we selected a lower flow velocity within the conventional range, 5 × 10⁻⁵ m/s, while the outlet pressure was maintained at 0 MPa. This flow velocity setup was aimed to optimize the flow conditions and minimize the interference of short residence time by analyzing flow characteristics.
2.3.2. BSA Elution Process in Microscopic Channels
Unlike in the NaCl tracer process, in the BSA elution process, NaCl is used to elute the adsorbed BSA onto the channel walls. The boundary conditions include a ligand density of 1 × 10⁻⁸ mol/m2, an inlet flow velocity of 5 × 10⁻⁵ m/s, and an outlet pressure of 0 MPa.
2.3.3. NaCl Tracer Process in Macroscopic Membranes
NaCl was injected as a Gaussian pulse for 0.2 s. The inlet flow velocity of this process was set to 1.27 × 10⁻⁴ m/s (equivalent to 1 mL/min) to achieve an appropriate NaCl residence time. This velocity is higher than that used in the NaCl tracer process within microscopic channel geometries because the membrane bed volume in this setup is larger. The outlet pressure was maintained at 0 MPa.
2.3.4. Mesh Generation
The mesh generation for the two-dimensional model employs triangular and quadrilateral elements, while the three-dimensional model utilizes tetrahedral, pyramidal, prismatic, triangular, and quadrilateral elements. The number and quality of the generated meshes are presented in Table 4.
Table 4.
Mesh nodes and qualities.
The model was verified through spatial and temporal independence tests. The accuracy of spatial discretization was determined using a mesh independence test, with a relative error defined as 1% (=∅ − ∅ˆ/∅, in which ∅ represents the C result obtained with a lower grid number and ∅ˆ corresponds to the value obtained with the highest grid number). The same criterion was applied for the time independence test to determine the appropriate time step. Based on the temporal and mesh independence tests, the final selected mesh configuration is shown in Table 4, with a time step of 0.01 s.
2.3.5. Convergence History
The convergence history of different geometric structures is shown in Figure 3. The data, exported from COMSOL, illustrate the variation in the time step reciprocal with increasing time steps. From Figure 3a–d, it can be observed that, as the simulation progresses, the time step reciprocal gradually decreases and eventually stabilizes. Specifically, the rapid decline in the time step reciprocal during the initial phase reflects the quick adaptation to the system dynamics at the beginning of the simulation, while the subsequent stabilization trend indicates that the system gradually reaches an equilibrium state. This trend indicates that the numerical simulation has achieved good convergence under the studied conditions. Additionally, the adopted criterion included a relative tolerance of 2 × 10⁻⁴, which further ensures the accuracy and reliability of the convergence results. This convergence behavior not only validates the rationality of the model setup but also demonstrates that the numerical methods and parameter selections employed effectively capture the physical characteristics of the system.
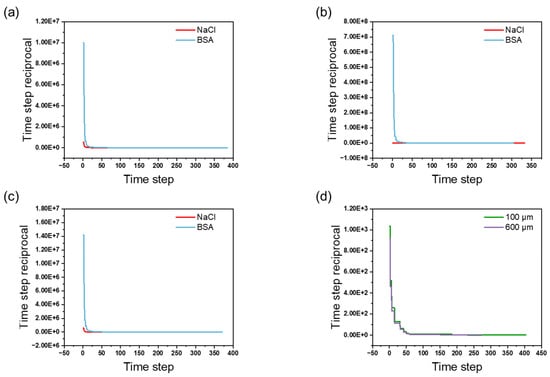
Figure 3.
Convergence history: (a) convergence profiles of NaCl flowthrough and BSA elution in channel tortuosity simulation; (b) convergence profiles of NaCl flowthrough and BSA elution in channel size variation simulation; (c) convergence profiles of NaCl flowthrough and BSA elution in channel connectivity simulation; (d) convergence profiles of NaCl flowthrough in simulation of membrane uniformity with different thickness.
3. Results and Discussions
3.1. The Effect of Channel Tortuosity on Membrane Chromatography Performance
The efficiency of membrane chromatography is critically dependent on uniform flow distribution to achieve sharp elution peaks and a high resolution. Figure 4a illustrates channel ensembles with varying degrees of tortuosity. A channel ensemble with Δτ = 0 represents a uniform configuration, where channels 1 and 2 exhibit the same tortuosity (τ = 1). By adjusting the tortuosity of channel 2 to 1.05, 1.2, and 1.58, non-uniform channel ensembles with Δτ values of 0.05, 0.2, and 0.58 were created. As Δτ increases, the uniformity of the channel ensembles decreases. To quantify this relationship, NaCl tracer studies were conducted which showed that increasing the channel tortuosity (Δτ = 0 to 0.58) resulted in a 15.66% reduction in the peak height (0.249 to 0.210 mol/m3) and a broadening peak width (Figure 4b). This degradation directly impacts the separation efficiency: broader peaks lead to increased band dispersion, which reduces the resolution between target biomolecules and impurities—a key challenge in biopharmaceutical purification. The velocity disparity observed between tortuous channels (Figure 4c) further explains this effect. At Δτ = 0.58, channel 1’s velocity (3.94 × 10⁻⁵ m/s) was four times greater than that of channel 2 (9.89 × 10⁻⁶ m/s), resulting in asynchronous elution. Such velocity mismatches increase the residence time in slower channels (e.g., channel 2), leading to peak tailing and overlap—critical limitations in high-throughput purification systems. The concentration distributions are shown in Figure 4d. Three time points were selected: before the peak (1.0 s), at the peak (1.5 s), and after the peak (2.0 s). At all three time points, the concentration distribution in the uniform channel structure (Δτ = 0) was even. As Δτ increased, the concentration distribution difference between channel 1 and channel 2 grew. For example, at 2 s, the concentration distribution in the uniform channel ensemble was symmetrical. However, as Δτ increased, asymmetry became evident, particularly in the 0.1–0.2 mol/m3 range.
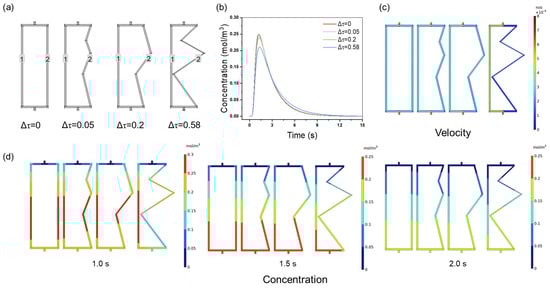
Figure 4.
(a) The geometry of the channel ensembles; (b) NaCl tracer peaks; (c) flow velocity distribution; (d) NaCl concentration distribution at 1.0, 1.5, and 2.0 s with different degrees of tortuosity.
These findings are consistent with practical challenges in chromatography. BSA elution studies (Figure 5a) revealed a 4.27-fold difference in peak height (0.0094 vs. 0.0022 mol/m3) between the uniform (Δτ = 0) and highly tortuous (Δτ = 0.58) channels. The sharp 10 s peak observed for the uniform channels versus the broad 25 s peak observed for the tortuous channels illustrates how structural homogeneity enhances elution kinetics. CFD visualization (Figure 5b) confirmed the asynchronous BSA elution: three time points were selected for the analysis. The BSA concentration distribution was similar to that of the NaCl tracer distribution. In channels with uniform structures, the BSA concentration distribution was more evenly distributed. As Δτ increases, the symmetry of the concentration distribution diminished. For example, at 5 s, when Δτ = 0.58, channel 1 was fully eluted (dark blue), while channel 2 retained high concentrations (red). This resulted in a greater discrepancy in the protein elution time between channel 1 and channel 2, which was the primary cause of the reduced peak height and broader peak at Δτ = 0.58. This asymmetry demonstrates that non-uniform channel tortuosity not only affects the flow distribution but also significantly impacts the separation performance, which is crucial for achieving high-resolution separations in biopharmaceutical processes.
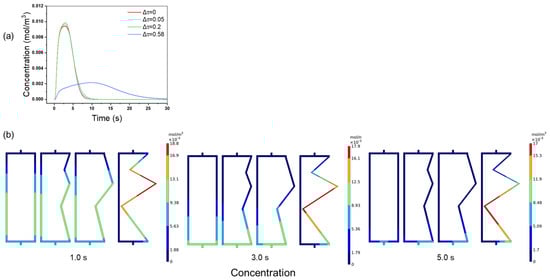
Figure 5.
(a) BSA elution peaks; (b) BSA concentration distribution at 1.0, 3.0, and 5.0 s with different tortuosity distributions.
3.2. Effect of Channel Size Variation on Membrane Chromatography Performance
First, the fluid distribution within channels with varying channel size distributions was studied using NaCl as a small molecule tracer. The channel structure is shown in Figure 6a. Δd = 0 represents a uniform channel ensemble consisting of two cylindrical through-channels with a pore size of 2 μm, while Δd = 2 represents the non-uniform channel ensemble with two cylindrical through-channels that have pore sizes of 2 and 4 μm, respectively. Figure 6b displays the NaCl tracer peaks in channels with different size distributions. The tracer peak height for the uniform channel ensembles is 0.360 mol/m3, while, for the non-uniform channel ensembles, it is 0.322 mol/m3. The peak height of the uniform channel ensembles (Δd = 0) is 11.8% higher than that of the non-uniform channel ensembles (Δd = 2). Similar to the results for channel tortuosity, the uniform channel ensemble exhibits a higher tracer peak height, sharper peak shape, and overall superior performance. To clarify the flow velocity distribution within the channel ensembles, the velocity distribution cloud maps are shown in Figure 6c. At Δd = 0, the flow velocities in channel 1 and channel 2 are identical, both being 2.38 × 10⁻⁵ m/s. However, at Δd = 2, the velocity difference between channel 1 and channel 2 is significant. In channel 1, the flow velocity is 5.69 × 10⁻⁶ m/s, while in channel 2, it is 2.13 × 10⁻⁵ m/s, 3.75 times that of channel 1. Figure 6d shows the concentration distribution within the channel ensembles. In the ensemble with varying channel sizes, the concentration distribution is uneven. For example, in the ensemble with Δd = 0 at 1.5 s, it is evident that channels 1 and 2 have identical concentration distributions, as indicated by the uniform color distribution. In contrast, the concentration distribution in the ensemble with Δd = 2 is uneven between the two channels, which is attributed to the flow velocity differences within the channel ensemble when Δd = 2.
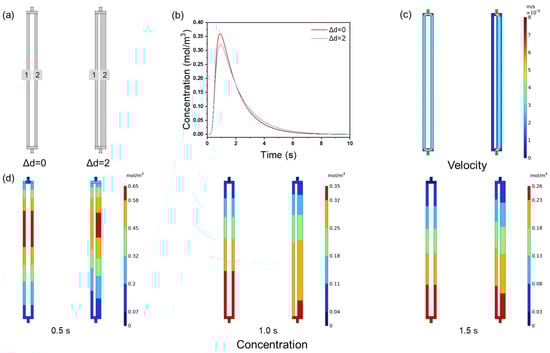
Figure 6.
(a) The geometry of the channel ensembles; (b) NaCl tracer peaks; (c) flow velocity distributions; (d) NaCl concentration distribution at 0.5, 1.0, and 1.5 s with different channel size distributions.
The protein elution process in channels with different channel size distributions (Figure 6a) was studied using BSA as the model protein. The protein elution peaks are shown in Figure 7a. For Δd = 0, the peak shape is relatively smooth and symmetric, with a peak height of 0.0074 mol/m³. For Δd = 2, the peak height decreases to 0.0046 mol/m3. The peak height for Δd = 0 is 1.61 times higher than that for Δd = 2. Compared to the NaCl tracer process (Figure 6b), the impact of channel uniformity on the protein elution is significantly more pronounced. This may be due to the elution reactions and the slower diffusion rate of proteins during the protein elution process, which increases the residence time difference. The concentration distribution at the three time points reveals this effect (Figure 7b). For example, at 5.0 s, the concentration distributions in channels 1 and 2 are identical when Δd = 0, but become asymmetric when Δd = 2. The lower flow rate in channel 2 (Figure 6c) slows the BSA elution, explaining the lower and broader peak at Δd = 2. The slower protein diffusion rate exacerbates the flow non-uniformity: in the narrow 2 μm channel, the reduced flow rate results in a longer adsorption–desorption cycle for the BSA, leading to delayed elution and a broader peak. The results highlight that pore size uniformity is a crucial parameter for enhancing membrane chromatography separation performance.
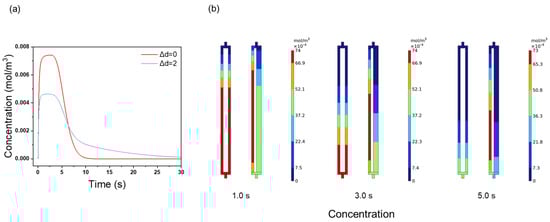
Figure 7.
(a) BSA elution peaks; (b) BSA concentration distribution contours at 1.0, 3.0, and 5.0 s with different channel size distributions.
3.3. Effect of Channel Connectivity on Membrane Chromatography Performance
This study examined the impact of channel connectivity on the performance of membrane chromatography using NaCl tracer and BSA elution. The channel configurations (Figure 8a) included no connection, single square connections, and variations in the connection number (three squares) and shape (long, wide, angled). Figure 8b shows the relationship between the connectivity and NaCl tracer peak height: the no-connection ensemble exhibited the highest peak (0.37 mol/m3), while additional connections reduced the peak height (0.359 mol/m3 for one connection and 0.340 mol/m3 for three connections). This trend suggests that more connections introduce longer diffusion paths and greater dispersion, which directly reduces the peak sharpness and implies a lower separation resolution.
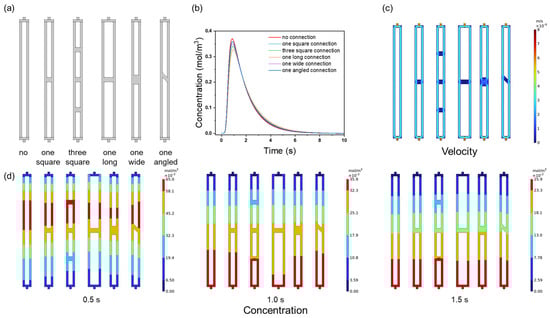
Figure 8.
(a) The geometry of the channel ensembles; (b) NaCl tracer peaks; (c) flow velocity distributions; (d) NaCl concentration distributions at 0.5, 1.0, and 1.5 s with different connectivity modes.
The connection shape further influenced the tracer behavior: the long connection produced the lowest peak height due to its extended diffusion area, while angled connections disrupted the symmetry (Figure 8d). This asymmetry, along with reduced velocities in the connection regions (Figure 8c), prolonged the residence time and increased the band broadening—critical factors affecting chromatographic efficiency.
For BSA elution, the unconnected channels outperformed the connected ones (Figure 9a). The unconnected ensemble exhibited a higher, narrower, and smoother elution peak, while the connected channels showed jagged peaks and irregular concentration distributions (Figure 9b). This irregularity results from the reduced flow velocity in the connection regions, which hampers convective transport and traps proteins, leading to unresolved peaks. These results highlight that excessive connectivity disrupts the flow uniformity and concentration gradients, directly reducing the membrane chromatography resolution.
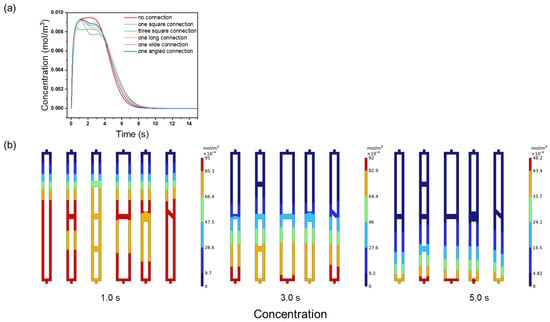
Figure 9.
(a) BSA elution peaks; (b) BSA concentration distributions at 1.0, 3.0, and 0.5 s with different connectivity modes.
3.4. Effect of Membrane Uniformity on Membrane Chromatography Performance
The above results demonstrated that both the NaCl tracer and BSA elution processes effectively reflect the impact of pore channel structure uniformity on membrane chromatography performance. The trends observed for NaCl are consistent with those observed for BSA elution, although the effects are more pronounced in the latter case. To further investigate the influence of flow distribution uniformity within microchannel assemblies on chromatographic performance and simplify the computational conditions, we developed a macroscopic model to study the behavior of small-molecule tracers (NaCl) in media with varying uniformities. The geometric structures are shown in Figure 2, and the parameter settings are detailed in Table 1 and Table 2. Figure 10a shows the NaCl tracer peaks for membranes of different thicknesses. The slightly higher peak (15.15%) with a low asymmetry factor observed for the non-uniform membrane when the thickness was 100 μm is due to the fast flowthrough of the solute before fully transverse dilution, where the flow distribution is uneven. The relatively broader peak dispersion could reduce the resolution between closely eluted species. However, in a 600 μm membrane, the effect was more pronounced, with the homogeneous membrane showing a two-fold improvement in its asymmetry factor (As = 0.32 vs. 0.16 for the non-uniform membrane). This suggests that non-uniformity in thicker membranes leads to broader residence time distributions, reducing the peak symmetry and efficiency.
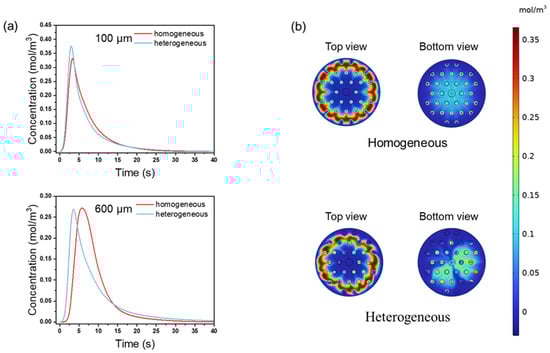
Figure 10.
(a) NaCl tracer peaks include thickness of 100 and 600 μm; (b) the concentration distribution of NaCl within a 600 μm-thick membrane at 5 s.
The concentration distribution in the homogeneous membrane is more uniform (Figure 10b). In contrast, in the heterogeneous membrane, the concentration distribution for NaCl varies due to regional differences in ϵ and k. The homogeneous membrane ensures simultaneous elution from all areas due to its more uniform structure. In the heterogeneous membrane, the flow velocity across different regions leads to a broader residence time distribution and reduced peak symmetry. This results in a decreased membrane chromatography separation performance. The asymmetric concentration distribution in the heterogeneous membrane further illustrates how variation in local permeability causes differences in fluid residence time, ultimately reducing the separation resolution and compromising the efficiency and purity of biopharmaceutical separations.
4. Conclusions
This study highlights the significant impact of the membrane channel structure on the fluid flow distribution in membrane chromatography. Computational fluid dynamics (CFD) simulations revealed that variations in the channel tortuosity, pore size distribution, and connectivity lead to heterogeneous flow behavior, ultimately impacting the chromatographic performance.
The results indicate that the channel tortuosity and pore size distribution are key factors that influence the flow uniformity. An increased tortuosity leads to a non-uniform velocity distribution and disparate flow paths, which significantly impact the peak performance. The peak heights for the NaCl tracer and BSA elution were 18.57% and 4.27 times higher, respectively, in the uniform channels (Δτ = 0) than in the non-uniform channels (Δτ = 0.58). Similarly, the pore size distribution influenced the velocity uniformity, with peak heights that were 11.8% and 1.61 times higher in the uniform pore structures (Δd = 0) compared to the non-uniform ones (Δd = 2).
Homogeneous membranes showed better peak symmetries and chromatographic resolutions than heterogeneous ones. When the membrane thickness increased to 600 μm, the As of the homogeneous membrane was superior to that of the heterogeneous membrane, indicating better separation characteristics.
These findings provide valuable insights into the design of high-performance membranes for chromatography. Understanding how pore-structure-related parameters such as the pore size distribution and channel tortuosity affect the flow uniformity and separation efficiency can inform the development of membranes optimized for specific applications. Membranes with low tortuosity and a more uniform pore size are likely to provide superior performance, with more symmetric elution peaks and an enhanced separation resolution.
Future research should focus on developing more realistic membrane pore structures in CFD simulations to improve performance predictions, refining adsorption–desorption equilibrium models to better simulate biomolecular interactions, and incorporating molecular-level simulations to capture the complexity of the adsorption and flow behavior within membranes. Additionally, integrating artificial intelligence and big data techniques can facilitate the prediction of chromatographic performance and assist in designing more efficient membrane chromatography systems. These advancements will help in the development of high-performance membranes and improve the separation efficiency in biopharmaceutical purification processes.
Author Contributions
Conceptualization, G.C.; methodology, X.Y. and L.T.; software, X.Y.; formal analysis, X.Y. and L.T.; investigation, X.Y., L.T. and Y.L.; resources, G.C.; data curation, X.Y. and L.T.; writing—original draft preparation, X.Y.; writing—review and editing, X.Y., Q.L. and G.C.; visualization, X.Y. and L.T.; supervision, Q.L., H.Z., Y.W. and G.C.; project administration, Y.W. and G.C.; funding acquisition, G.C. All authors have read and agreed to the published version of the manuscript.
Funding
This research was funded by National Natural Science Foundation of China (no. 22178352) and CAS Pioneer Hundred Talents Program (2023000366).
Data Availability Statement
The datasets generated or analyzed during the current study are available from the corresponding author on reasonable request.
Conflicts of Interest
The authors declare no conflicts of interest.
References
- Rasmussen, A.S.B.; Hammou, A.; Poulsen, T.F.; Laursen, M.C.; Hansen, S.F. Definition, categorization, and environmental risk assessment of biopharmaceuticals. Sci. Total Environ. 2021, 789, 147884. [Google Scholar] [CrossRef] [PubMed]
- Makurvet, F.D. Biologics vs. small molecules: Drug costs and patient access. Med. Drug Discov. 2021, 9, 100075. [Google Scholar] [CrossRef]
- Lavoie, J.; Fan, J.; Pourdeyhimi, B.; Boi, C.; Carbonell, R.G. Advances in high-throughput, high-capacity nonwoven membranes for chromatography in downstream processing: A review. Biotechnol. Bioeng. 2024, 121, 2300–2317. [Google Scholar] [CrossRef]
- Ngo, H.X.; Garneau-Tsodikova, S. What are the drugs of the future? Med. Chem. Comm. 2018, 9, 757–758. [Google Scholar] [CrossRef]
- Rathore, A.S.; Kumar, D.; Kateja, N. Recent developments in chromatographic purification of biopharmaceuticals. Biotechnol. Lett. 2018, 40, 895–905. [Google Scholar] [CrossRef] [PubMed]
- Yang, X.; Merenda, A.; Al-Attabi, R.; Dumée, L.F.; Zhang, X.; Thang, S.H.; Pham, H.; Kong, L. Towards next generation high throughput ion exchange membranes for downstream bioprocessing: A review. J. Membr. Sci. 2022, 647, 120325. [Google Scholar] [CrossRef]
- Ghosh, R. Protein separation using membrane chromatography: Opportunities and challenges. J. Chromatogr. A 2002, 952, 13–27. [Google Scholar] [CrossRef]
- Ghosh, R. Ultrahigh-speed, ultrahigh-resolution preparative separation of protein biopharmaceuticals using membrane chromatography. J. Sep. Sci. 2022, 45, 2024–2033. [Google Scholar] [CrossRef]
- Chen, G.; Wan, Y.; Ghosh, R. Bioseparation using membrane chromatography: Innovations, and challenges. J. Chromatogr. A 2025, 1744, 465733. [Google Scholar] [CrossRef]
- Orr, V.; Zhong, L.; Moo-Young, M.; Chou, C.P. Recent advances in bioprocessing application of membrane chromatography. Biotechnol. Adv. 2013, 31, 450–465. [Google Scholar] [CrossRef]
- Eon, C.H. Comparison of broadening patterns in regular and radially compressed large-diameter columns. J. Chromatogr. A 1978, 149, 29–42. [Google Scholar] [CrossRef]
- Hagemann, F.; Wypysek, D.; Baitalow, K.; Adametz, P.; Thom, V.; Wessling, M. Why device design is crucial for membrane adsorbers. J. Chromatogr. Open 2022, 2, 100029. [Google Scholar] [CrossRef]
- Camenzuli, M.; Ritchie, H.J.; Shalliker, R.A. Improving HPLC separation performance using parallel segmented flow chromatography. Microchem. J. 2013, 111, 3–7. [Google Scholar] [CrossRef]
- Camenzuli, M.; Ritchie, H.J.; Shalliker, R.A. Gradient elution chromatography with segmented parallel flow column technology: A study on 4.6 mm analytical scale columns. J. Chromatogr. A 2012, 1270, 204–211. [Google Scholar] [CrossRef]
- Ghosh, R.; Chen, G. Mathematical modelling and evaluation of performance of cuboid packed-bed devices for chromatographic separations. J. Chromatogr. A 2017, 1515, 138–145. [Google Scholar] [CrossRef]
- Janson, J.-C.; Hedman, P. Large-Scale Chromatography of Proteins. In Chromatography; Springer: Berlin/Heidelberg, Germany, 2005; pp. 43–99. [Google Scholar]
- Marchal, L.; Foucault, A.; Patissier, G.; Rosant, J.M.; Legrand, J. Influence of flow patterns on chromatographic efficiency in centrifugal partition chromatography. J. Chromatogr. A 2000, 869, 339–352. [Google Scholar] [CrossRef] [PubMed]
- Dorn, M.; Eschbach, F.; Hekmat, D.; Weuster-Botz, D. Influence of different packing methods on the hydrodynamic stability of chromatography columns. J. Chromatogr. A 2017, 1516, 89–101. [Google Scholar] [CrossRef] [PubMed]
- Horváth, K.; Lukács, D.; Sepsey, A.; Felinger, A. Effect of particle size distribution on the separation efficiency in liquid chromatography. J. Chromatogr. A 2014, 1361, 203–208. [Google Scholar] [CrossRef]
- Shi, W.; Zhang, F.; Zhang, G. Mathematical analysis of affinity membrane chromatography. J. Chromatogr. A 2005, 1081, 156–162. [Google Scholar] [CrossRef]
- De Smet, J.; Gzil, P.; Vervoort, N.; Verelst, H.; Baron, G.V.; Desmet, G. On the optimisation of the bed porosity and the particle shape of ordered chromatographic separation media. J. Chromatogr. A 2005, 1073, 43–51. [Google Scholar] [CrossRef]
- Dolamore, F.; Dimartino, S.; Fee, C.J. Numerical Elucidation of Flow and Dispersion in Ordered Packed Beds: Nonspherical Polygons and the Effect of Particle Overlap on Chromatographic Performance. Anal. Chem. 2019, 91, 15009–15016. [Google Scholar] [CrossRef] [PubMed]
- Amin, M.M.; Krühne, U. Computational Fluid Dynamics Modeling of Pressure-Retarded Osmosis: Towards a Virtual Lab for Osmotic-Driven Process Simulations. Membranes 2024, 14, 236. [Google Scholar] [CrossRef] [PubMed]
- Farzadfard, A.; Kunka, A.; Mason, T.O.; Larsen, J.A.; Norrild, R.K.; Dominguez, E.T.; Ray, S.; Buell, A.K. Thermodynamic characterization of amyloid polymorphism by microfluidic transient incomplete separation. Chem. Sci. 2024, 15, 2528–2544. [Google Scholar] [CrossRef]
- Ladd Effio, C.; Hahn, T.; Seiler, J.; Oelmeier, S.A.; Asen, I.; Silberer, C.; Villain, L.; Hubbuch, J. Modeling and simulation of anion-exchange membrane chromatography for purification of Sf9 insect cell-derived virus-like particles. J. Chromatogr. A 2016, 1429, 142–154. [Google Scholar] [CrossRef]
- Chen, Y.-C.; Yao, S.-J.; Lin, D.-Q. Parameter-by-parameter method for steric mass action model of ion exchange chromatography: Theoretical considerations and experimental verification. J. Chromatogr. A 2022, 1680, 463418. [Google Scholar] [CrossRef]
- van Beijeren, P.; Kreis, P.; Zeiner, T. Ion exchange membrane adsorption of bovine serum albumin—Impact of operating and buffer conditions on breakthrough curves. J. Membr. Sci. 2012, 415–416, 568–576. [Google Scholar] [CrossRef]
- Vicente, T.; Sousa, M.F.Q.; Peixoto, C.; Mota, J.P.B.; Alves, P.M.; Carrondo, M.J.T. Anion-exchange membrane chromatography for purification of rotavirus-like particles. J. Membr. Sci. 2008, 311, 270–283. [Google Scholar] [CrossRef]
- Ghanbarian, B.; Hunt, A.G.; Ewing, R.P.; Sahimi, M. Tortuosity in Porous Media: A Critical Review. Soil Sci. Soc. Am. J. 2013, 77, 1461–1477. [Google Scholar] [CrossRef]
- Pápai, Z.; Pap, T.L. Analysis of peak asymmetry in chromatography. J. Chromatogr. A 2002, 953, 31–38. [Google Scholar] [CrossRef]
- Danielson, R.E.; Sutherland, P.L. Porosity. In Methods of Soil Analysis; American Society for Agronomy: Madison, WI, USA, 1986; pp. 443–461. [Google Scholar]
- Renard, P.; de Marsily, G. Calculating equivalent permeability: A review. Adv. Water Resour. 1997, 20, 253–278. [Google Scholar] [CrossRef]
- Temam, R. Navier–Stokes Equations: Theory and Numerical Analysis; American Mathematical Society: Providence, RI, USA, 2024; Volume 343. [Google Scholar]
- Durlofsky, L.; Brady, J.F. Analysis of the Brinkman equation as a model for flow in porous media. Phys. Fluids 1987, 30, 3329–3341. [Google Scholar] [CrossRef]
- Constantin, P.; Foiaş, C. Navier-Stokes Equations; University of Chicago Press: Chicago, IL, USA, 1988. [Google Scholar]
- Stynes, M. Steady-state convection-diffusion problems. Acta Numer. 2005, 14, 445–508. [Google Scholar] [CrossRef]
- Karkov, H.S.; Sejergaard, L.; Cramer, S.M. Methods development in multimodal chromatography with mobile phase modifiers using the steric mass action model. J. Chromatogr. A 2013, 1318, 149–155. [Google Scholar] [CrossRef] [PubMed]
- Dimartino, S.; Boi, C.; Sarti, G.C. A validated model for the simulation of protein purification through affinity membrane chromatography. J. Chromatogr. A 2011, 1218, 1677–1690. [Google Scholar] [CrossRef]
Disclaimer/Publisher’s Note: The statements, opinions and data contained in all publications are solely those of the individual author(s) and contributor(s) and not of MDPI and/or the editor(s). MDPI and/or the editor(s) disclaim responsibility for any injury to people or property resulting from any ideas, methods, instructions or products referred to in the content. |
© 2025 by the authors. Licensee MDPI, Basel, Switzerland. This article is an open access article distributed under the terms and conditions of the Creative Commons Attribution (CC BY) license (https://creativecommons.org/licenses/by/4.0/).