Abstract
This study examines the differences in performance between orbitally shaken bioreactors (OSBs) and stirred tank bioreactors (STBs) in Chinese Hamster Ovary (CHO) cell perfusion culture in response to the growing market demand for monoclonal antibodies (mAbs). Although OSBs demonstrated higher cell densities, a notable reduction in specific antibody production rates was observed during the mid-to-late phases of the culture compared with STBs. To elucidate the underlying mechanisms, the rheological behaviour of high-density cell suspensions in both reactor types was initially characterised, confirming their adherence to the Sisko fluid model. Computational Fluid Dynamics (CFD) analysis revealed the influence of these rheological properties on the shear stress distribution and mass transfer. This analysis identified the key limiting factors for achieving higher cell densities: mass transfer efficiency in OSBs and shear stress in STBs. Using an Euler–Lagrangian cell-tracking methodology to analyse cellular “lifelines”, it was determined that OSBs exhibited approximately twice the number and frequency of shear stress peak occurrences compared to STBs. This persistent mechanical stimulation likely contributes to the reduced specific antibody production rates observed. This comprehensive investigation not only clarifies the comparative advantages and limitations of different bioreactor types in perfusion culture but also provides a robust theoretical basis and technical guidance for informed reactor selection, optimisation, and scale-up in industrial production environments.
1. Introduction
The widespread application of monoclonal antibodies (mAbs) in disease treatment and diagnosis has driven a significant surge in market demand [1]. To address the rising need for production capacity, perfusion culture technology using Chinese Hamster Ovary (CHO) cells has demonstrated significant potential because of its ability to enable continuous and efficient mAb production [2]. Current research on perfusion culture optimisation primarily focuses on enhancing medium formulation and perfusion rates. However, systematic comparative studies evaluating different bioreactor types remain limited [3,4,5]. Among the commonly used bioreactors, orbitally shaken bioreactors (OSBs) and stirred tank bioreactors (STBs) are the most common. OSBs utilise vessel body motion and surface aeration to effectively mitigate shear damage caused by traditional impeller blades and bubble formation or breakage [6,7]. Consequently, OSBs generally outperform STBs in batch and fed-batch cultures, as evidenced by key indicators such as cell density and antibody yield [8]. However, existing studies on mAb production using perfusion culture have predominantly focused on millilitre-scale OSB (shake tubes) and litre-scale STB comparisons, whereas litre-scale OSB applications have been more prevalent in high-titre virus production [9]. Given that OSBs have significant advantages such as a simple structure, low operating cost, and ease of scale-up [10,11], a comprehensive comparative analysis of OSB and STB performance in antibody production during perfusion cultures has substantial theoretical and practical significance. This analysis provides a valuable reference for reactor selection and optimisation in industrial-scale production.
Perfusion culture involves the continuous introduction of fresh medium while retaining cells and removing metabolites through hollow fibre columns. In comparison with conventional batch and fed-batch cultures, perfusion culture not only increases the maximum cell density several-fold but also sustains high-density cultures for durations of up to one month [3]. Previous studies have demonstrated that high-density cell suspensions, including blood cells, mesenchymal cells, and rat aortic smooth muscle cells, exhibit shear-thinning rheological behaviour, with their apparent viscosity substantially exceeding that of fresh media [12,13,14]. The alteration in the rheological properties can significantly influence the fluid dynamics within the reactor. Specifically, they lead to a significant reduction in the gas–liquid mass transfer coefficient () [15] and an underestimation of shear stress on the cells [16]. Consequently, inaccurate assessments of these rheological effects can lead to suboptimal selection of bioreactor configurations and operational parameters during perfusion culture design. This negatively impacts the microenvironment for cell growth and metabolism, ultimately influencing product yield and quality [17,18]. Therefore, understanding the fundamental causes of performance disparities between OSBs and STBs in CHO cell perfusion cultures requires a focus on two key aspects: firstly, the investigation of the rheological characteristics of CHO cell suspensions, particularly under maximal cell density conditions; and secondly, the precise quantification of shear stress distribution and mass transfer efficiency within both reactors, based on the obtained rheological parameters [19]. This systematic study provides important theoretical support for optimising reactor design and culture processes.
The rapid advancement of Computational Fluid Dynamics (CFD) technology has provided a powerful tool for the accurate simulation of fluid behaviour within bioreactors. CFD can now predict fluid velocity and mass transfer coefficients with deviations of no more than 15% from experimental data [20,21], making it an optimal method for quantitatively analysing cell shear stress and reactor mass transfer performance. The inherent spatial heterogeneity within bioreactors leads to dynamic fluctuations in crucial parameters, including shear stress and dissolved oxygen concentration, within the cellular microenvironment [22,23]. Consequently, focusing solely on the spatial distribution of shear stresses, gas hold-up, and mass transfer coefficients within the reactor cannot fully capture the actual impact of these spatial gradients on cell growth and metabolism. Building on previous studies that have demonstrated that CHO cells exhibit higher sensitivity to shear stress than dissolved oxygen levels [24,25], the Euler–Lagrange methodology was implemented, with particular emphasis on shear stress analysis. Through the synchronous tracking of cellular trajectories and the localised shear environments they encounter, the spatial gradients were transformed into time-series data representing the cellular microenvironment. This methodology facilitated the construction of cellular “lifelines” across different bioreactor configurations [26,27], thereby offering critical insights into the distinct performance characteristics of OSBs and STBs in perfusion-based cultivation.
To clarify the mechanisms underlying the performance disparities between OSBs and STBs in CHO cell perfusion culture, the investigation commenced with a systematic characterisation of CHO cell suspension rheology under high-density conditions and its impact on bioreactor performance. Subsequently, CFD simulations incorporating these rheological parameters were used to precisely map the shear stress distributions and quantify mass transfer efficiencies in both reactor configurations. Inspired by principles from fermentation technology, the “lifeline” concept was innovatively applied to track and analyse the dynamic shear exposure profiles of cells traversing different reactor environments. This systematic investigation not only identified critical determinants governing cell culture processes but also established novel strategies for the optimisation of perfusion processes.
2. Materials and Methods
2.1. Cell Culture
CHO-K1 cells were seeded at an initial cell density of 0.5 × 10⁶ cells/mL in a 3 L STB (Applikon, Delft, The Netherlands) and a 3 L OSB (SB-10X with a 3L adaptor, Adolf Kühner AG, Basel, Switzerland). Both reactor systems were equipped with an alternating tangential flux (ATF) system for perfusion culture, maintaining a perfusion rate of 1 working volume/day (1 VVD). The base and feed culture media used for perfusion were developed in-house, with certain medium parameters detailed in the publication by Zhang et al. [28]. Throughout the culture period, the temperature was maintained at 37 °C, and the pH was automatically regulated to 7.0 using CO2 and NaOH.
The working volume of the STB system was 1.4 L, with a vessel internal diameter of 130 mm and an impeller diameter of 45 mm. Oxygen was supplied via a deep aeration system using an L-type sparger, which featured seven orifices of approximately 0.8 mm in diameter each. As the cell density increased, the stirring speed was incrementally adjusted from an initial 250 revolutions per minute (rpm) to 520 rpm, and the gas flow rate was increased from 0.1 volume per volume per minute (VVM) to 0.4 VVM (see Appendix A Figure A1a).
The OSB used a 2 L disposable culture bag housed within a stainless-steel enclosure. The base of the culture bag was designed as a square with rounded corners, ensuring a smooth transition from the edge of the base to the sidewall, except at the central region. The bag had a diameter of 190 mm, and oxygen was supplied via surface aeration. The oscillation parameters were set as follows: the oscillation diameter was 50 mm, and the oscillation frequency incrementally increased from 50 rpm to 100 rpm in response to increasing cellular density (see Appendix A Figure A1b).
2.2. Cell and Metabolic Analysis
Viable cell density (VCD), cell viability, and mean cell diameter were measured using a Countstar® automated cell counter (Ruiyu, Shanghai, China), which employs image-based analysis. Glucose and lactate concentrations in the culture supernatant were determined using commercial reagent kits (Nanjing Jiancheng Institute of Bioengineering, Nanjing, China). The concentration of mAbs was determined using Protein A affinity chromatography columns (Thermo Scientific, Waltham, MA, USA), and analysis was conducted using high-performance liquid chromatography (HPLC) (Agilent, Santa Clara, CA, USA).
Given that perfusion culture is a continuous process, the specific consumption or generation rates for glucose, lactate, and mAbs must account for the continuous addition of fresh medium. The following formula was applied:
where qx represents the specific consumption or generation rate (pmol/cell/day or pg/cell/day). Specifically, qGlc, qLac, and qP correspond to the glucose, lactate, and mAb levels, respectively. Ci and CB denote the concentrations of the respective substances in the fresh medium and within the bioreactor (mol/L or g/L). PR represents the perfusion rate (VVD).
2.3. Rheology Measurements
Sampling was performed from both reactors starting on day 9 of cultivation and continued until 1 day after the peak cell density was observed. Each 30 mL sample was evenly divided into three portions for analysis. To prevent oxygen deprivation during the pre-analysis holding period, samples in shake tubes were maintained under shaking conditions in an incubator at 37 °C. Due to the consistency in rheological measurements across samples from the same reactor, the rheological data from the sample with the highest cell density were selected for presentation. The impeller rotation in the STB provides effective mixing, with experimental verification showing good consistency among samples from different sampling ports. As for the OSB, although sterility requirements prevented multi-point sampling verification during perfusion culture, batch cultivation experiments have confirmed good sample homogeneity across sampling ports.
The rheological properties were measured using an Anton Paar MCR-302 rheometer (Melbourne, Austria). Preliminary tests indicated that the viscosity of the samples remained below 100 mPa·s across the tested shear rate range. Following the manufacturer’s guidelines, a double-gap coaxial cylinder system was used to measure the variations in the viscosity at different shear rates. To prevent cell sedimentation during measurements, samples were preconditioned at a shear rate of 100 s−1 before data collection. Based on the CFD simulations of the OSB and STB submerged medium conditions, the shear rate distribution in 99.9% of the region ranged between 0.1 s−1 and 1000 s−1; thus, this interval was selected for measurements, with the test temperature maintained at 37 °C. To enhance the precision of fresh medium rheology measurements, the shear rate range was adjusted to 1–1000 s−1. Each sample was measured once, and data from three replicate samples were used for statistical analysis to ensure the reliability and representativeness of the results.
2.4. CFD Simulation
2.4.1. Reactor Modelling and Grid Generation
This study employed CFD simulations to examine how the rheological properties of high-density cell suspensions influence the shear stress distribution and mass transfer in OSBs and STBs. The objective was to elucidate the mechanisms responsible for performance variations between the two reactors during CHO cell perfusion culture. The computational models were developed to replicate the physical configurations of the respective bioreactors. The STB model incorporated representations of dissolved oxygen, pH, and temperature electrodes, along with multiple inlet and outlet pipelines. The computational domain for the STB utilised a dynamic–static region approach, where the impeller region was designated as the rotating zone and the remaining area as the stationary zone. The interaction between these regions was simulated using the multiple reference frame (MRF) method.
The computational domains of both the OSB and STB were discretised using hexahedral and polyhedral meshes, respectively. To optimise the accuracy of the fluid flow simulations and computational efficiency, boundary layer meshing and localised mesh refinement were implemented in regions with high-velocity gradients. These regions included the wall regions of the OSB, the rotating zone, and the aeration port region of the STB. Mesh independence tests were performed to assess the influence of varying mesh densities on the simulation outcomes. Specifically, the OSB simulations used mesh configurations of approximately 1 × 10⁶, 2 × 10⁶, and 4 × 10⁶ cells, while the STB simulations used 0.55 × 10⁶, 1.2 × 10⁶, and 2.4 × 10⁶ cells. The optimal mesh configurations were determined by comparing the mass transfer coefficient () derived from the cold model experiments. For the OSB, a mesh configuration of approximately 2 × 10⁶ was selected, while for the STB, a configuration of approximately 1.2 × 10⁶ cells was deemed optimal. The general mesh sizes were maintained within a range of 1–5 mm, with localised mesh refinements down to 0.15 mm applied to critical structures, such as the aeration ports in the STB. These refinements ensured the accurate capture of complex flow characteristics in these regions.
2.4.2. CFD Simulation Setup
The CFD simulations were conducted using ANSYS Fluent 2021R1 (ANSYS Inc., Canonsburg, PA, USA). Owing to the structural and operational differences between the OSB and STB, distinct numerical simulation methods were used for each reactor type.
For the OSB, the k–ω shear stress transport (SST) turbulence model was selected to solve the governing equations for fluid motion based on the work of Zhu et al. [29]. The volume of fluid (VOF) model was used to track the dynamic behaviour of the gas–liquid interface. No-slip boundary conditions were applied to all wall surfaces, and pressure–velocity coupling was implemented using the pressure-implicit with splitting of operators (PISO) algorithm. Additionally, a centrifugal force source term was incorporated into the Navier–Stokes equations to enhance the accuracy of fluid motion simulation in the OSB.
For the STB, the standard k–ε turbulence model was adopted, and the Euler–Euler multiphase model was used to describe the interactions between the gas and liquid phases [30]. The interphase drag force was calculated using the well-validated Grace model [31]. To account for the dynamic behaviour of bubbles during the culture process, a population balance model (PBM) was incorporated to simulate bubble aggregation and breakage. The bubble size range was defined within a range of 2–10 mm, partitioned into 10 intervals, and resolved using a discrete numerical approach. The aggregation and breakage mechanisms were modelled using the Luo model [32] and the Laakonen model [33], respectively. Boundary conditions were defined by designating the upper boundary of the computational domain as a degassing outlet and the aeration ports as velocity inlet boundaries. Pressure–velocity coupling was solved using the Phase-Coupled semi-implicit method for pressure-linked equations (SIMPLE) algorithm.
In the numerical simulations of both reactors, the enhanced wall functions were used to resolve the fluid flow characteristics in the near-wall regions. For spatial discretisation, the quadratic upstream interpolation for convective kinetics (QUICK) scheme was implemented for volume fraction calculations, while second-order upwind schemes were employed for momentum equations and other transport equations. All numerical models were systematically validated by comparing values with those obtained from cold model experiments. For transient tracking analysis, tracer particles were introduced into the computational domain using the Euler–Lagrangian method. Custom User-Defined Functions (UDFs) were developed to continuously monitor and record the temporal evolution of the shear stresses experienced by the particles. The numerical simulations were performed with a time step of 0.0001 s, and data acquisition and analysis commenced only after the residuals of all governing equations converged below 10−4 and the value had reached steady-state conditions. To ensure computational robustness and reliability, each operating condition was simulated for a minimum duration of 10 characteristic times, thus mitigating potential influences from initial transient effects.
2.4.3. Quantitative Analysis of Mass Transfer and Shear
The gas–liquid mass transfer mechanisms for the OSB and STB were modelled based on the Higbie penetration theory [34]. For the OSB, the effect of surface renewal was also considered during the mass transfer process [19,35]. The liquid-side mass transfer coefficient, , was determined using the following equation:
where K is a constant. For the OSB, , while for the STB, . D represents the diffusion coefficient of oxygen, while ε, ρ, and μ denote the turbulent energy dissipation rate, density, and dynamic viscosity of the liquid phase, respectively.
The method for calculating the gas–liquid specific interfacial area (a) differs between reactor types. For the OSB, a is determined as the ratio of the gas–liquid interfacial area (Ainter) to the working volume (Vw):
For the STB, it can be calculated using the gas phase volume fraction (α) and Sauter mean bubble diameter (d32):
The product of and a yields the volumetric mass transfer coefficient . The shear stress (τ) experienced by cells is expressed as the product of the shear rate (γ) and the dynamic viscosity (μ), while γ is determined from the spatial derivatives of the three velocity field components (u, v, and w):
3. Results and Discussion
3.1. Cell Culture Results
The evaluation of the cell perfusion culture outcomes requires systematic monitoring and analysis of multiple key parameters. The primary focus was on cell growth characteristics, including VCD, viability, specific growth rate (η), and average cell diameter, as these indicators directly reflect the growth status and physiological activity of the cell population. The second focus was on the metabolic characteristics, including the specific consumption rate of glucose (qGlc), the specific production rate of lactate (qLac), and the specific production rate of antibodies (qp). These parameters provide a comprehensive assessment of the cellular energy metabolism and the production efficiency of target products.
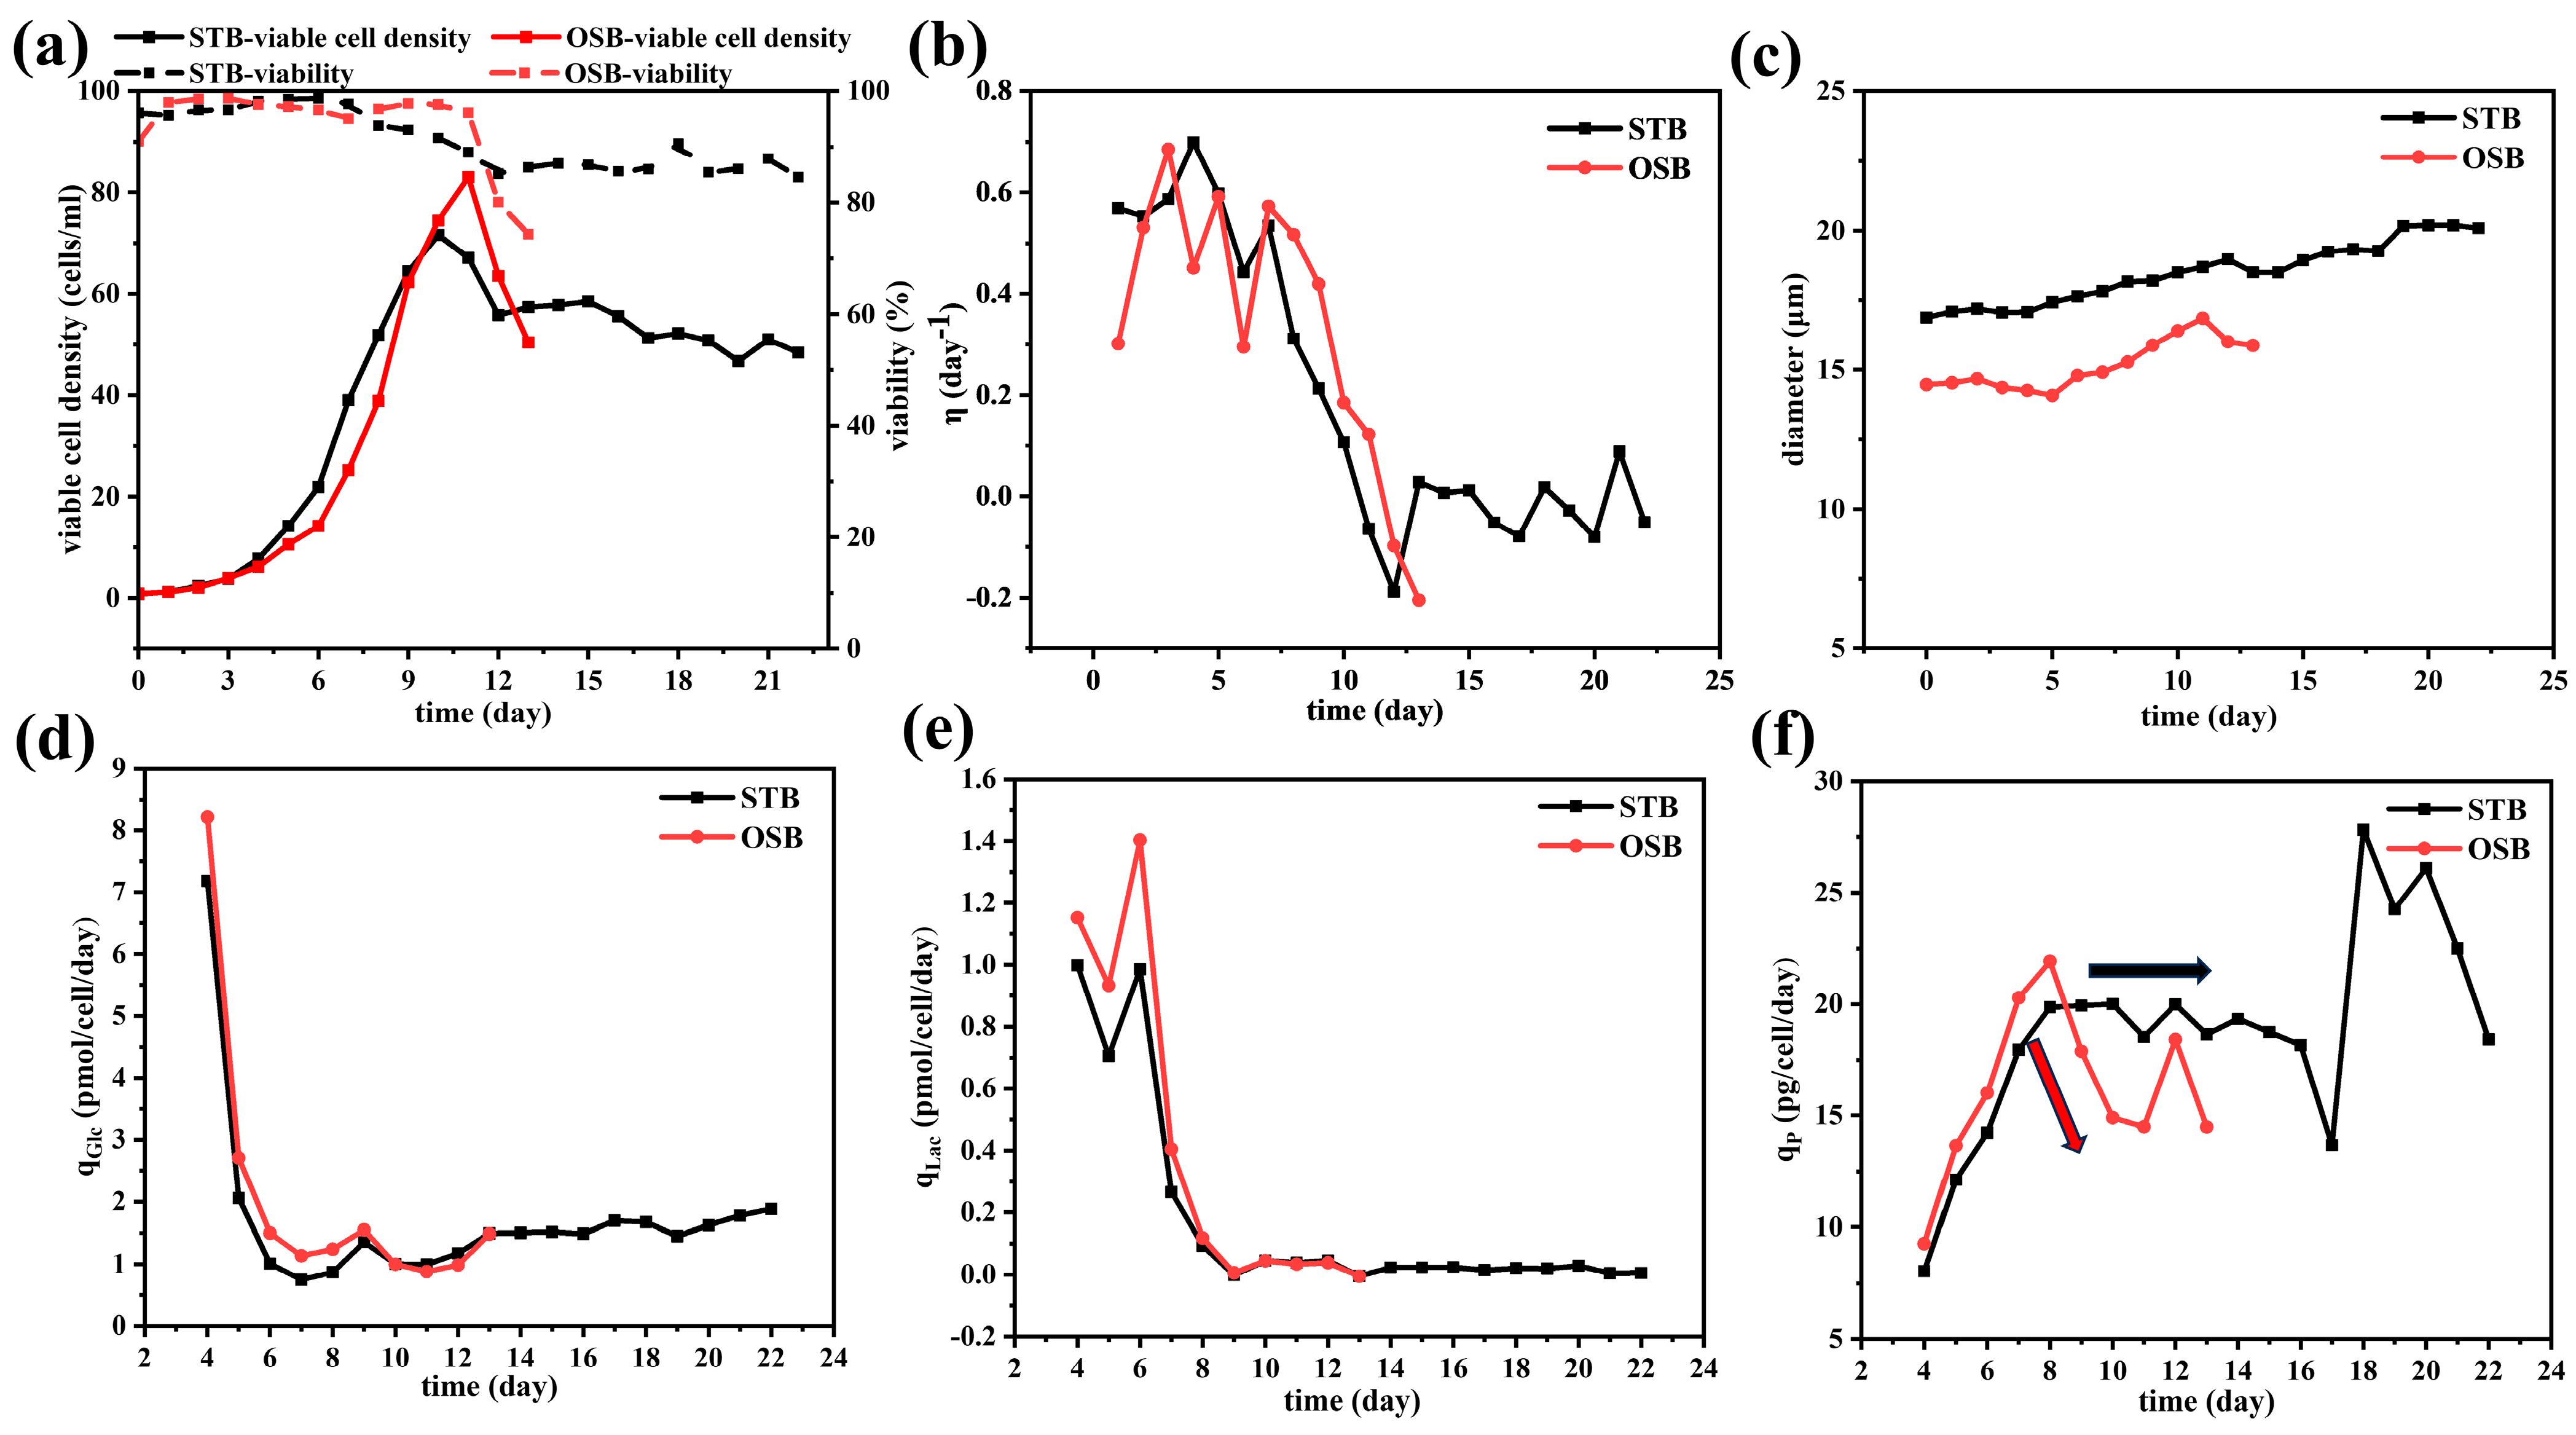
Figure 1 illustrates the growth characteristics (a–c) and metabolic performance (d–f) of cells in the OSB and STB. As shown in Figure 1a, the cell density in the OSB system peaked on day 11, reaching 83 × 106 cells/mL at an oscillation frequency of 100 rpm. Under this condition, the lowest liquid level in the culture was slightly above the electrode and ATF infusion pipeline positions, thereby restricting any further increase in the rotation speed. Excessive rotational speed not only induces electrode misalignment and subsequent calibration loss but also allows air to enter the ATF system, prolonging cell residence time within the ATF and ultimately affecting the metabolic state of cell growth [36].

Figure 1.
Time profiles of (a) viable cell density (cells/mL) and cell viability (%); (b) specific growth rate (day−1); (c) average cell diameter (μm); (d) specific glucose consumption rate (pmol/cell/day); (e) specific lactate production rate (pmol/cell/day); and (f) specific antibody production rate (pg/cell/day) during perfusion culture of the OSB (red) and STB (black).
Dynamic degassing measurements conducted using fresh medium as the test fluid indicated that the OSB, operating at a working volume of 2 L and an oscillation rate of 100 rpm, exhibited a value of 20.12 h−1. Based on experimental data for the cell-specific oxygen consumption rate (approximately 0.165 pmol/cell/day), the mass transfer capacity was theoretically sufficient to support a cell density of 118 × 106 cells/mL. However, during actual cultivation, an oxygen supply bottleneck was observed, preventing the dissolved oxygen level from being maintained at a set value of 40%. This limitation resulted in a sharp decline in cell viability and density between days 12 and 13. This discrepancy between the theoretical predictions and the experimental outcomes indicates that increasing cell density induces substantial alterations in the physical characteristics of the culture medium, notably in terms of viscosity. These alterations, in turn, exert a profound influence on the effective oxygen mass transfer efficiency [13,15].
In the STB system, when operated at an agitation speed of 520 rpm and an aeration rate of 0.4 VVM, the cell density peaked at 71.6 × 10⁶ cells/mL on day 10. Following this peak, the cell density stabilised, maintaining a steady state at approximately 55 × 106 cells/mL. When the fresh medium was used as the test medium under the same operational parameters, the in the STB was determined to be 21.6 h−1. The measured value theoretically surpasses the oxygen consumption requirements associated with the peak cell density observed in the STB. However, the actual oxygen mass transfer efficiency during cultivation was likely lower than the predicted value. It is noteworthy that the maximum cell density in the OSB exceeded that in the STB, which may be attributed to the STB’s deep oxygen supply and mixing characteristics achieved through mechanical agitation. Such agitation could potentially generate localised shear stress exceeding the cell tolerance limit in the STB [37]. This observation highlights the importance of systematically investigating the dynamic variations in the physical properties of suspensions during high-density cultivation and their effects on mass transfer and shear stress.
In both reactors, the η of cells followed a similar trend: it remained at a high level of approximately 0.5 day−1 during the exponential growth phase before gradually decreasing over time (Figure 1b). This dynamic change reflects the characteristic transition of CHO cells in perfusion culture from the nutrient-independent (NI) exponential growth phase to the substrate-independent (SI) cell volume increase phase (SI phase) [38]. Regarding cell morphology, cells cultured in the STB exhibited diameters consistently 5–20% larger than those in the OSB, with the average cell diameter in both reactors increasing significantly over time (Figure 1c). The observed size difference may be attributed to variations in the shear stress intensity and dissolved oxygen levels between the two reactors. Notably, changes in cell diameter not only directly influence the volume fraction of cells in suspension but are also closely related to their metabolic state [39]. These observations have important implications for process optimisation and scale-up.
Metabolic analysis showed that the specific glucose consumption rate (qGlc) and specific lactate production rate (qLac) exhibited near-identical trends in both reactors (Figure 1d,e). However, the specific antibody production rate (qp) differed significantly. During the exponential growth phase (before day 8) under perfusion culture conditions, the qp of the OSB was slightly higher than that of the STB. Conversely, in the later stages of cultivation, the qp in the OSB was significantly lower than that in the STB (Figure 1f). This observed pattern contrasts with the trends typically observed in batch and fed-batch cultures [8], highlighting the need for further investigation into the underlying mechanisms.
In this experiment, the sudden drop in cell viability in the OSB was due to an issue with oxygen supply, which led to the death of a large number of cells due to hypoxia and consequently caused a rapid decline in cell viability (Figure 1a). We observed that after the cell density decreased, the metabolism of the surviving cells did not change immediately (Figure 1d,e). Previous studies have shown that changes in the metabolic state of cells require more than three days to stabilise [40]. Therefore, it is possible that the cells maintained a similar metabolic state in the short-term following the occurrence of hypoxia. Another possibility is that after a large number of cells died due to irreversible damage from hypoxia, the remaining live cells were able to obtain sufficient oxygen to maintain normal metabolism. Since the specific growth rate calculation is only related to the density of live cells, the specific growth rate of cells in the OSB exhibited a trend similar to that in the STB.
3.2. Rheology of Cell Suspension
Unlike batch and fed-batch cultures, perfusion culture enables significantly higher cell densities, with studies demonstrating that cell concentrations can approach theoretical maximum packing densities [38]. At the maximum cell density, the volume fractions (φ) of CHO cell suspensions in the OSB and STB were 0.21 and 0.24, respectively. Although the OSB achieved a higher maximum cell density than the STB, its φ was slightly lower due to differences in cell diameter.
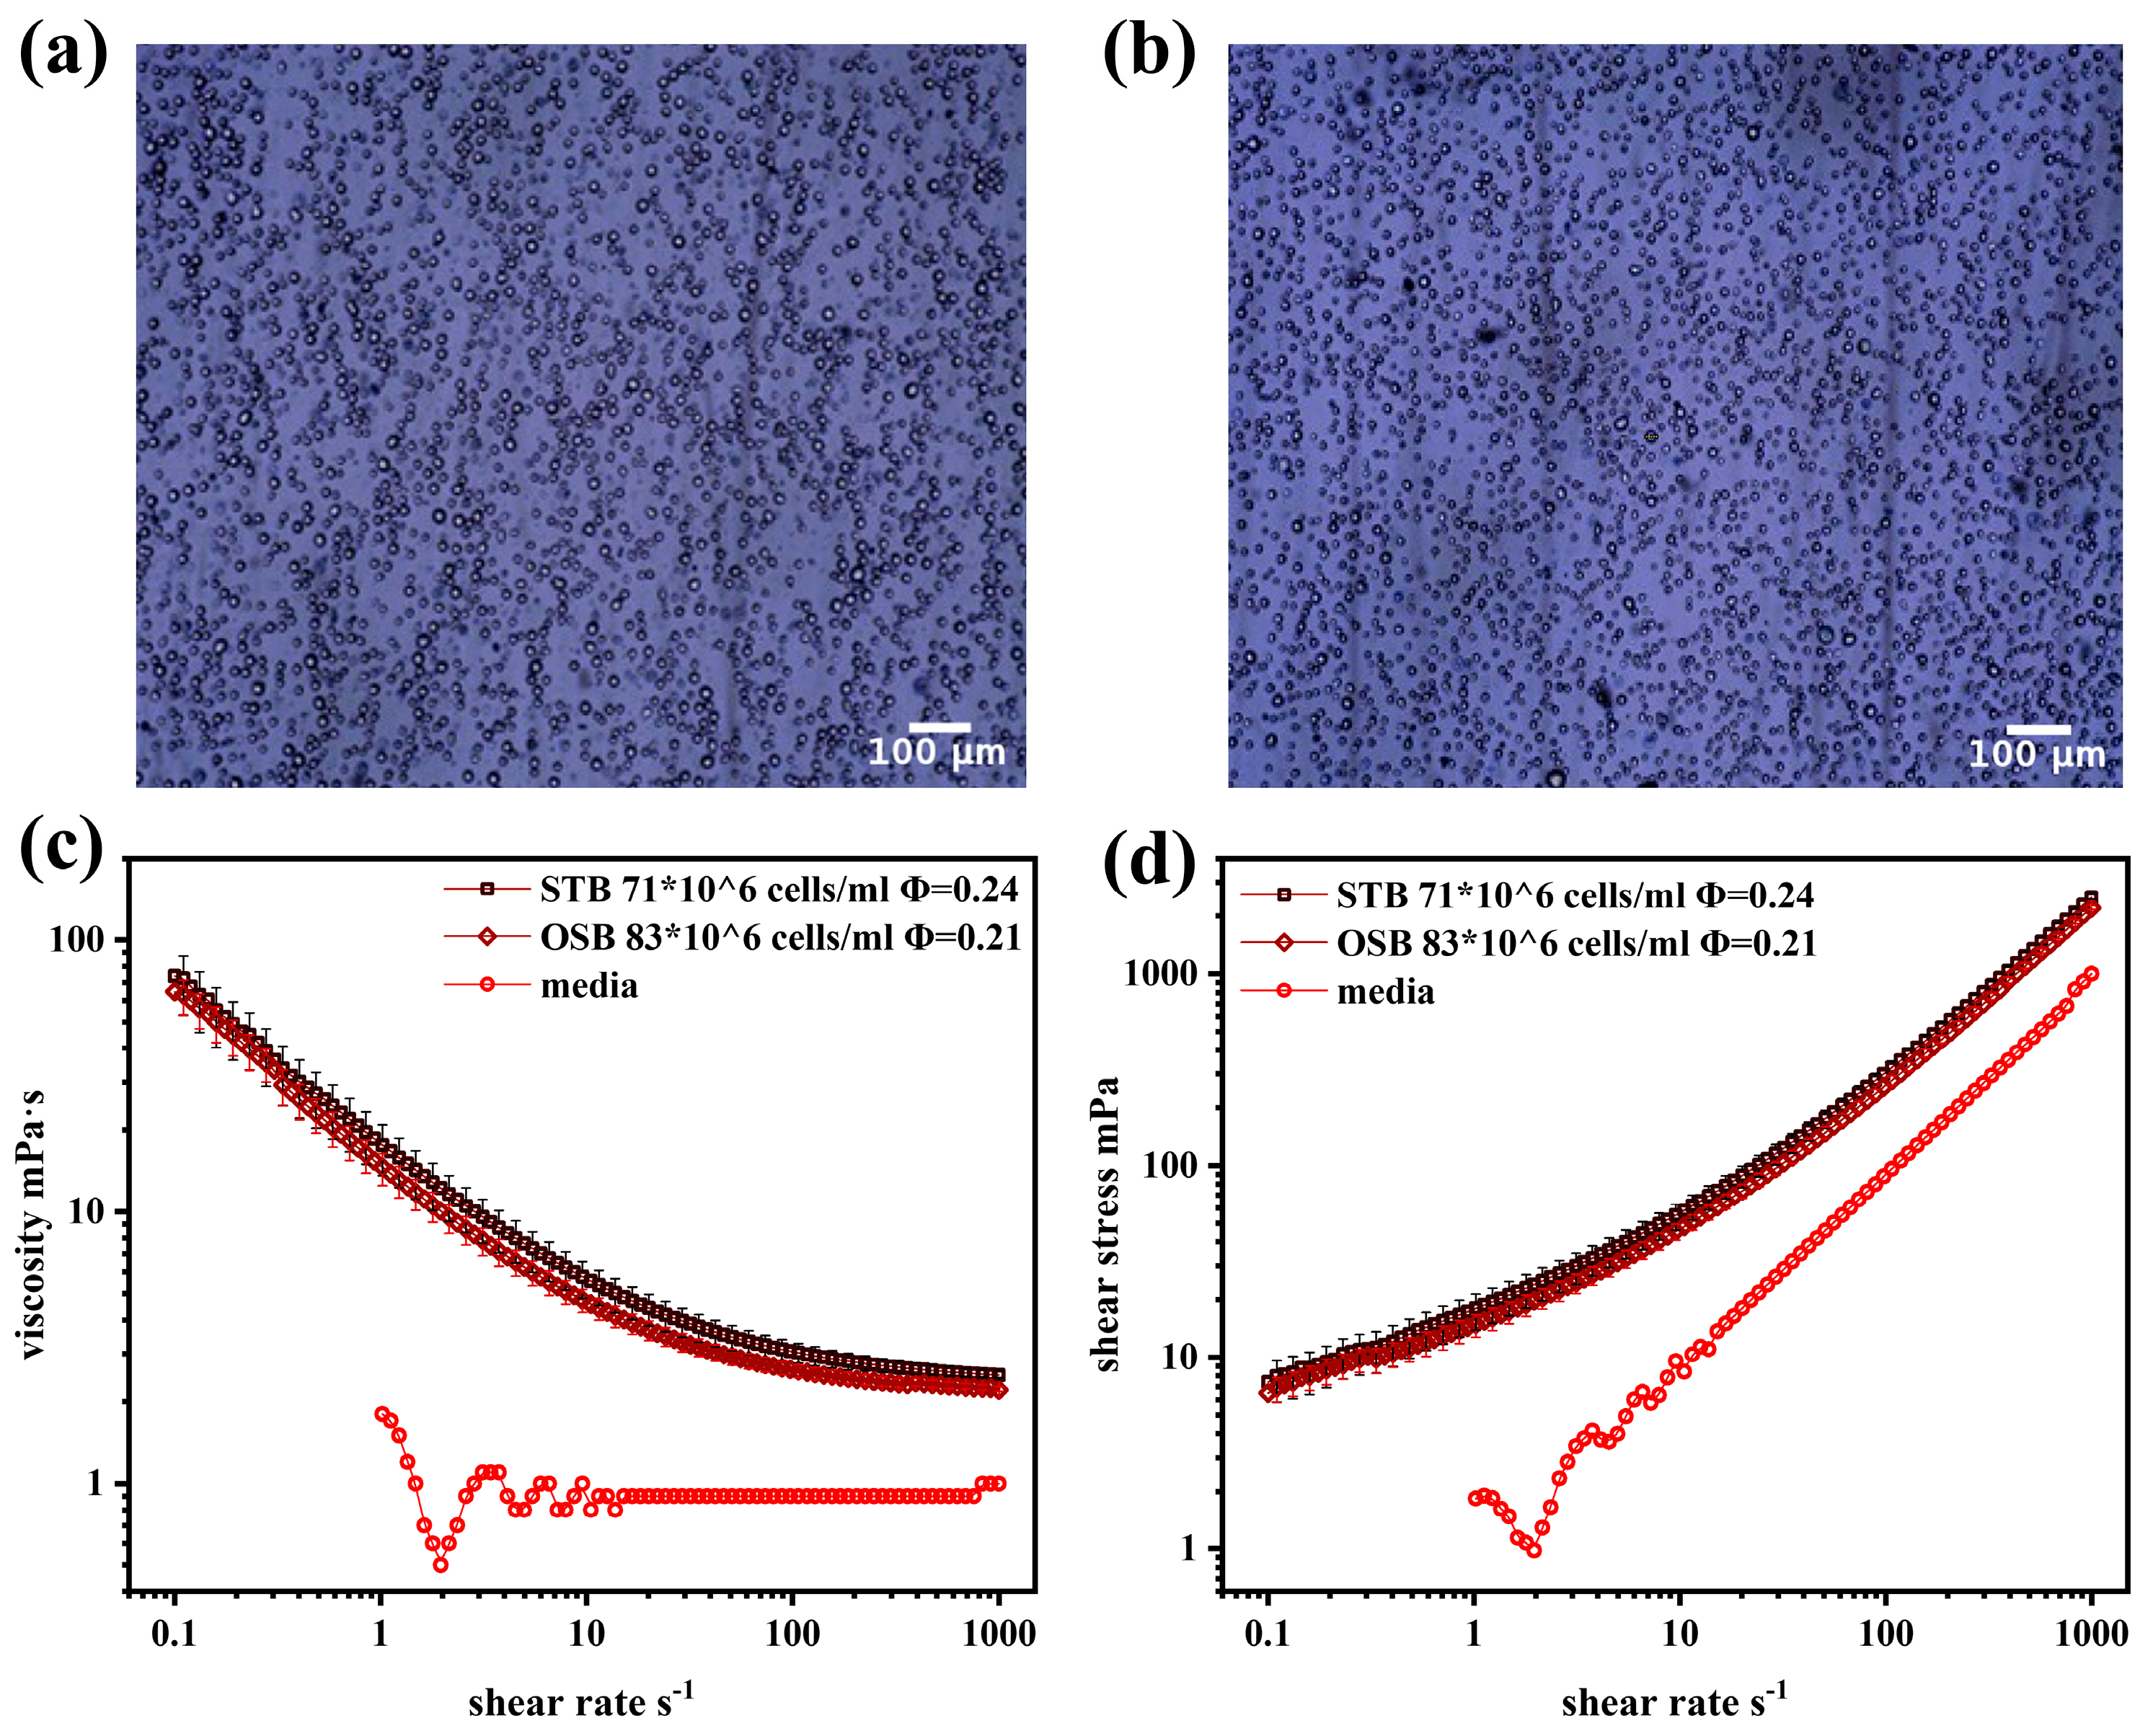
Previous studies have shown that both biconcave disc-shaped erythrocyte suspensions and spindle-shaped rat aortic smooth muscle cell suspensions exhibit shear-thinning rheological behaviour at high concentrations [12,14]. However, CHO cells differ significantly in morphology. As shown in Figure 2a,b, under maximum cell density conditions (dilution ratio of 1:10), CHO cells in both the STB and OSB appeared spherical, maintaining similar morphological features despite variations in cell density and diameter.
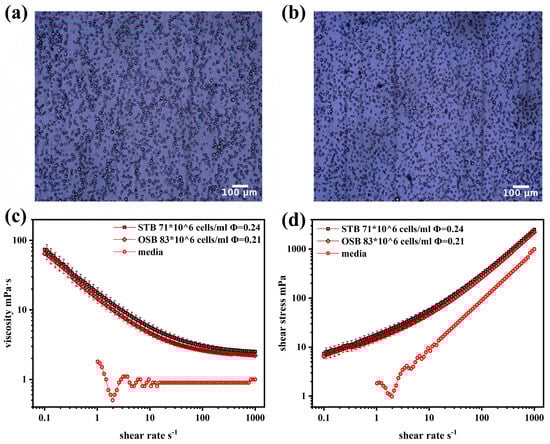
Figure 2.
(a) Optical microscope images of CHO cells at maximum cell density in the STB; (b) optical microscope images of CHO cells at maximum cell density in the OSB; (c) viscosity–shear rate curve; and (d) shear stress–shear rate curve comparing cell suspension at maximum density in the OSB and STB with fresh medium.
Notably, MacQueen et al. demonstrated that CHO cells exhibit significant structural stability, with a deformation rate of 0.2 under approximately 20 Pa of stress. CFD simulations further confirmed that CHO cells can maintain their spherical shape during movement within the reactor. However, suspensions of non-living spherical particles, such as glass beads suspended in glycerol at a volume fraction of 0.2, exhibit typical Newtonian fluid behaviour [41]. Therefore, further investigation of the rheological properties of CHO cell suspensions is required.
Figure 2c,d compares the rheological properties of the suspension and fresh culture medium at maximum cell density in the OSB and STB. The fresh culture medium behaved as a typical Newtonian fluid, maintaining a constant viscosity of 0.9 mPa·s across different shear rates, which was slightly higher than that of water at the same temperature (0.69 mPa·s). The observed viscosity of the fresh culture medium, which was slightly higher than that of water, was primarily attributed to the presence of glucose and surfactant (F68) at specific concentrations in the medium [42,43]. In contrast, the cell suspension exhibits significant non-Newtonian fluid characteristics, specifically shear-thinning. This behaviour is characterised by a gradual decrease in the suspension viscosity with increasing shear rate, which eventually stabilises at high shear rates. This rheological behaviour is accurately described by the Sisko fluid model, expressed as follows:
where μcs and μ∞ represent the viscosity of the cell suspension and the viscosity at an infinite shear rate (mPa·s), respectively; and Kcs and n denote the consistency index (mPa·sn) and flow behaviour index, respectively. The model parameters derived from the Sisko model fitting (Table 1) indicate that the cell suspension exhibits a significant degree of shear-thinning, with a flow behaviour index (n) of approximately 0.3. The shear-thinning characteristics observed in the cell suspension can be explained by relevant studies on particle rheology [41], where the cell’s microscopic behaviour indicates that intercellular interactions are the primary cause of the suspension’s shear-thinning behaviour. Under static or low shear conditions, cells tend to form loose aggregates due to protein interactions on their surfaces and electrostatic forces from membrane surface charges. The presence of these cell aggregates significantly increases the internal resistance of the fluid medium, resulting in enhanced apparent viscosity, particularly at low shear rates. When shear stress is applied, the cell aggregates gradually disintegrate as the shear rate increases. Simultaneously, the hydrophilic groups on the cell membranes interact with the suspending medium to form a solvation layer that reduces the flow resistance and consequently decreases the apparent viscosity. This process is reversible; when the shear stress decreases, the intercellular interactions reform the aggregates.

Table 1.
Parameters obtained by fitting the viscosity curves of fresh medium and cell suspensions in the STB and OSB at the maximum cell density using the Sisko model.
Given that the viscosity of the cell suspension consistently exceeded that of the fresh culture medium across the entire shear rate spectrum, it is imperative to comprehensively account for the evolution of the suspension’s rheological characteristics throughout the cultivation process. This consideration is crucial when conducting relevant cold model experiments and CFD simulations, thereby facilitating the accurate assessment of mass transfer efficiency and shear stress distribution within the bioreactor system. Notably, a key observation was made: at the same volume fraction (ϕ), the viscosity curves, shear stress curves, and corresponding model parameters exhibit a high degree of consistency, irrespective of variations in cell density and diameter. This finding strongly suggests that ϕ is the predominant factor governing the rheological properties of the cell suspension, while the influence of cell diameter and density is relatively minor. This insight not only enhances the understanding of the rheological behaviour of cell suspensions but also provides an important theoretical basis for the optimisation and precise control of bioreactor design.
3.3. Impact of Rheology on Shear Stress and Mass Transfer in Bioreactors
To gain deeper insight into the effects of fluid rheological properties on bioreactor performance, this study integrated the developed rheological model into CFD simulations to systematically examine the transition from Newtonian fluid (culture medium) to non-Newtonian fluid (high-density cell suspension) and its impact on shear stress and mass transfer in both the STB and OSB. The detailed analysis revealed that the primary factors governing the maximum cell density and specific antibody production rate differed significantly between the two bioreactor types.
3.3.1. Comparative Analysis of Gas–Liquid Phase Distribution
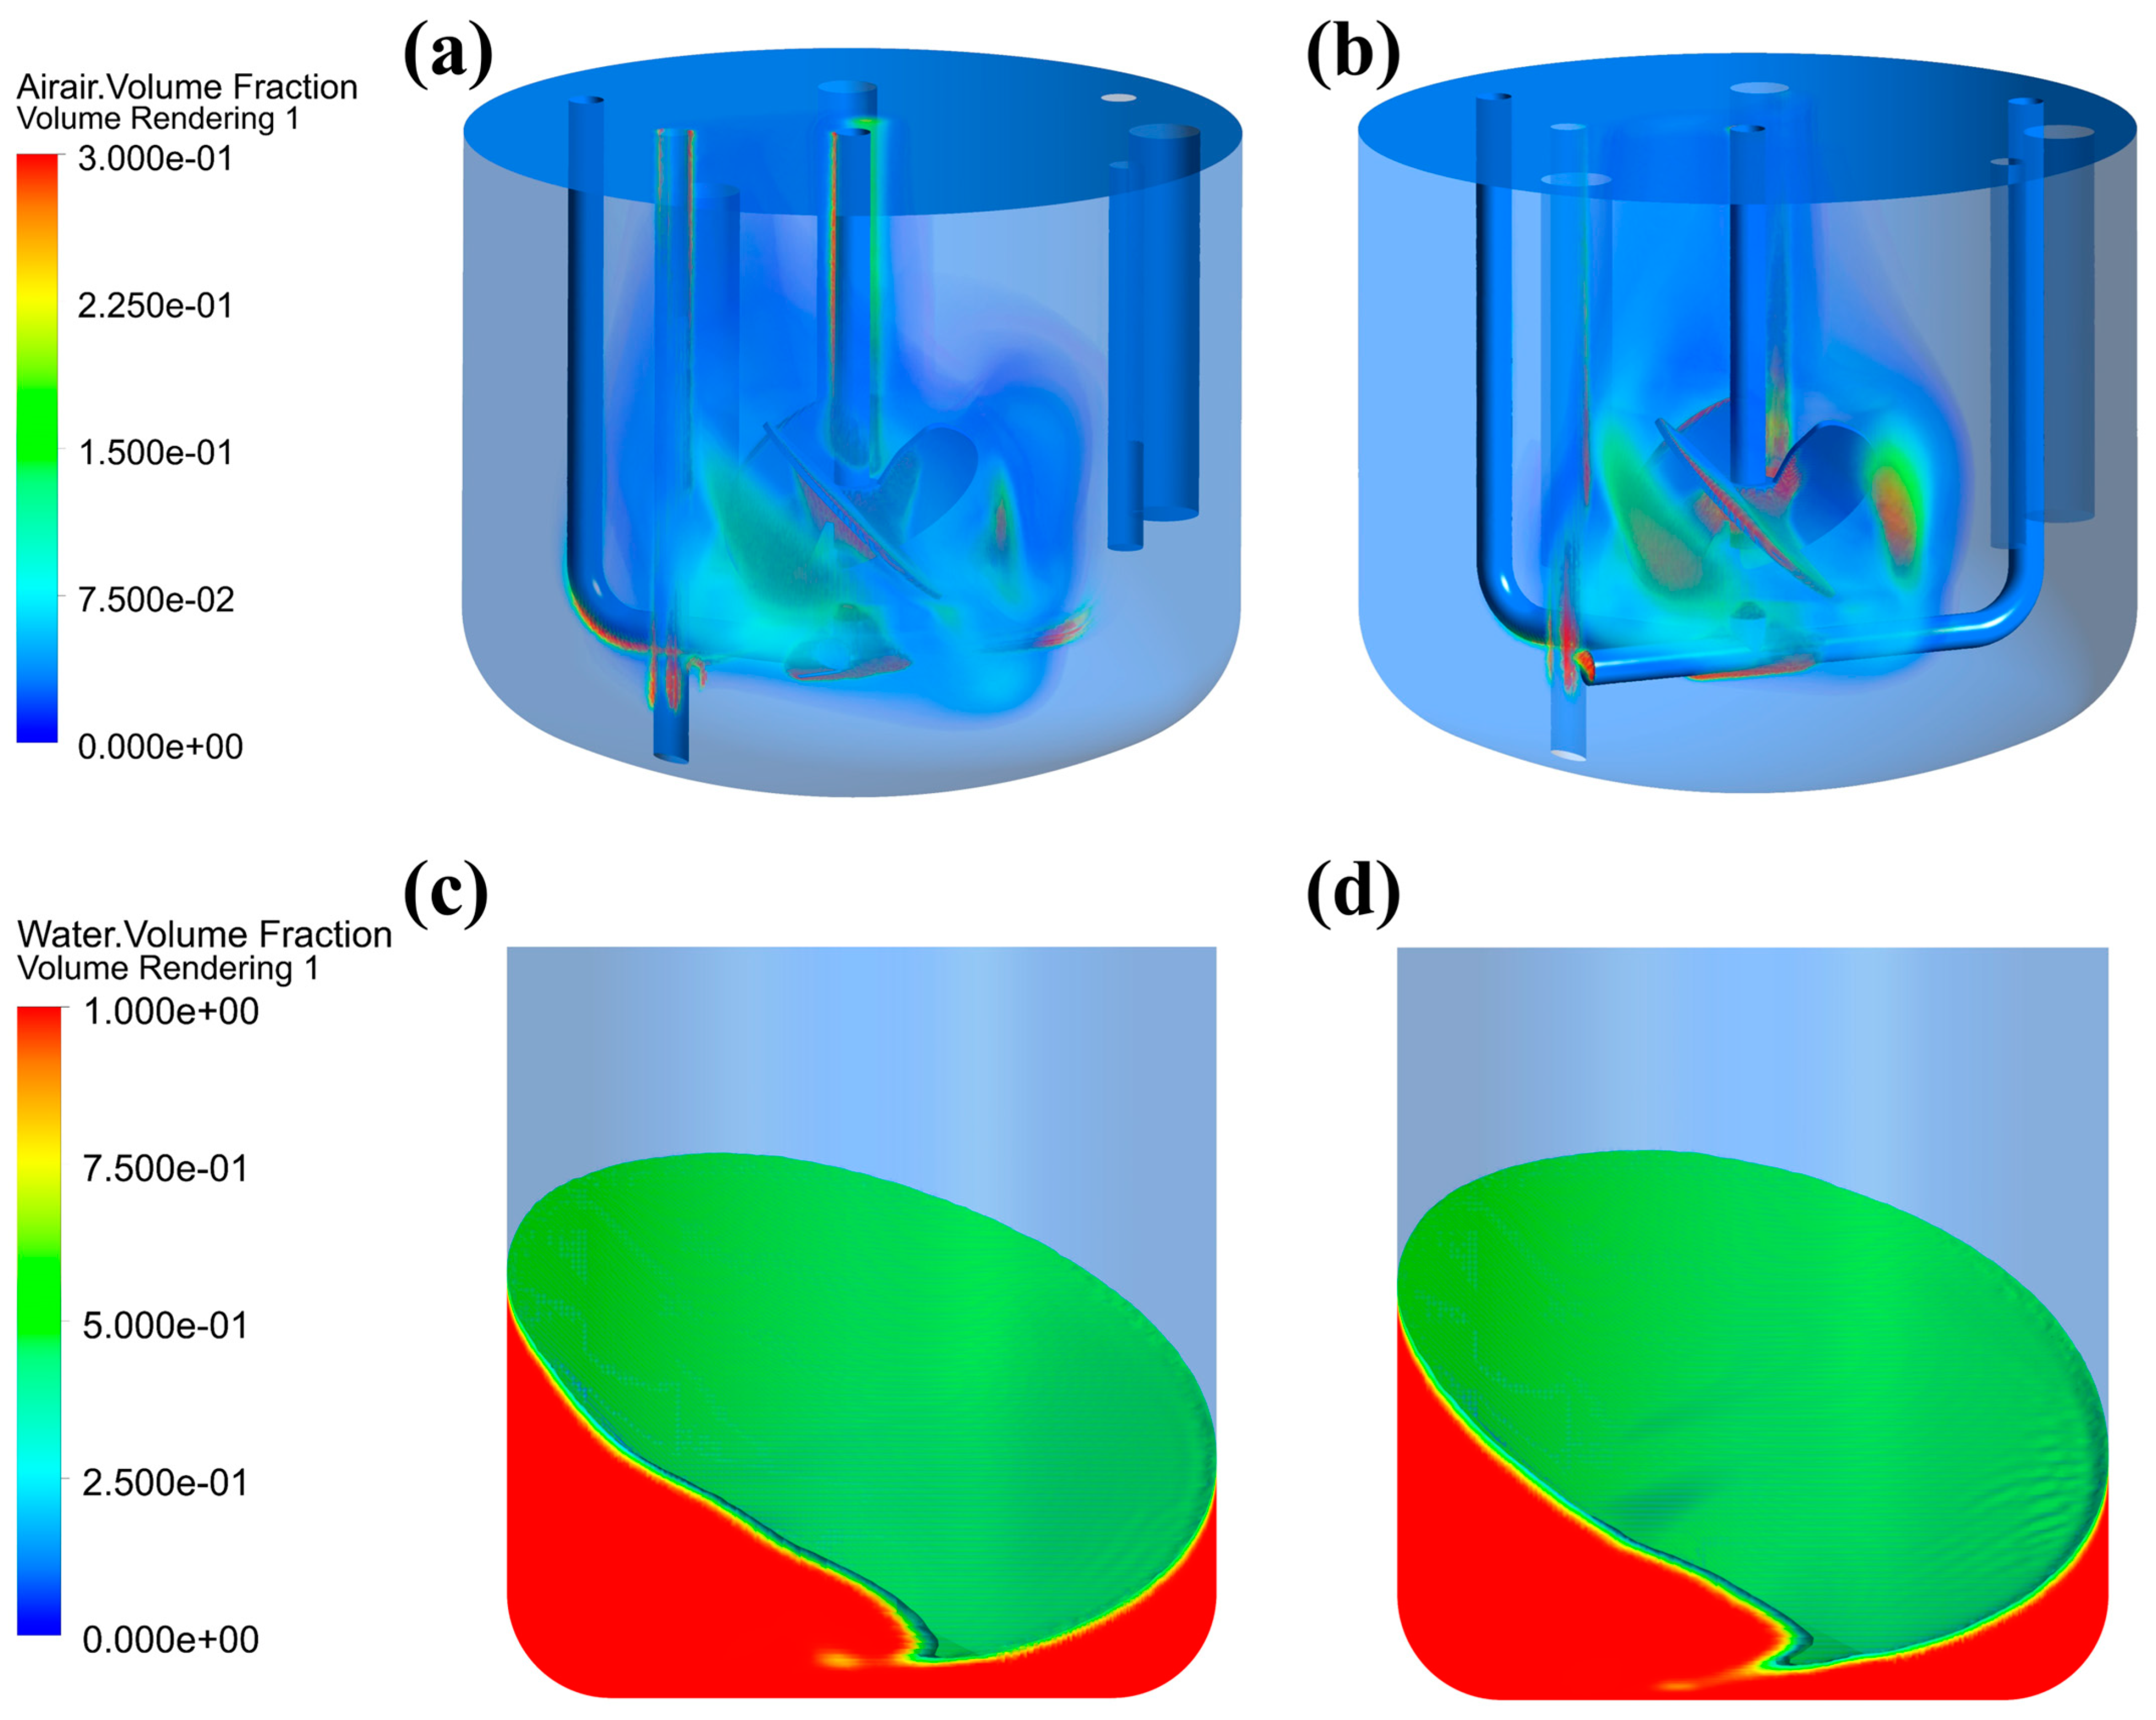
This study demonstrated that alterations in fluid rheological properties had a considerably greater effect on gas–liquid phase distribution in the STB than in the OSB. As shown in Figure 3a, the gas phase exhibited effective dispersion throughout the impeller region when fresh culture medium was used as the test fluid. Conversely, upon transitioning to cell suspension (Figure 3b), the gas phase distribution was substantially altered, becoming predominantly confined to the immediate vicinity of the impeller and forming a concentrated upward flow along the central stirring shaft axis, thus leading to a significant reduction in the gas dispersion efficiency. In contrast, changes in the rheological properties of the medium had minimal effect on the gas–liquid interface shape and height difference in the OSB (Figure 3c,d).

Figure 3.
Gas–liquid distribution characteristics in different reactors: (a) gas phase distribution in an STB with fresh medium; (b) gas phase distribution in an STB with cell suspension at maximum density; (c) liquid phase distribution in an OSB with fresh medium; and (d) liquid phase distribution in an OSB with cell suspension at maximum density.
This difference arises from fundamental differences in the mixing mechanism, gas dispersion method, and aeration mode between the two reactor types. In an STB, mixing and gas dispersion are driven by mechanical stirring generated by a rotating impeller, while aeration is achieved through a sparger positioned below the impeller. As the medium transitions to a cell suspension, its increased viscosity impedes fluid flow, reducing the expulsion of liquid from the impeller region and consequently limiting gas dispersion. Furthermore, due to the shear-thinning characteristics of the cell suspension, the viscosity of the fluid decreases in the impeller region. This reduction causes the gas entering through the sparger to preferentially accumulate around the impeller and stirrer shaft, further reducing gas dispersion efficiency [44]. In contrast, an OSB achieves fluid mixing through overall rotation, thereby making its flow characteristics relatively less sensitive to viscosity changes. Moreover, with the surface aeration method, gas distribution is primarily governed by the reactor’s motion characteristics rather than the rheology of the liquid phase. Consequently, variations in fluid rheological properties have a limited impact on gas–liquid distribution in an OSB.
3.3.2. Fluid Velocity Distribution Under Rheological Variations
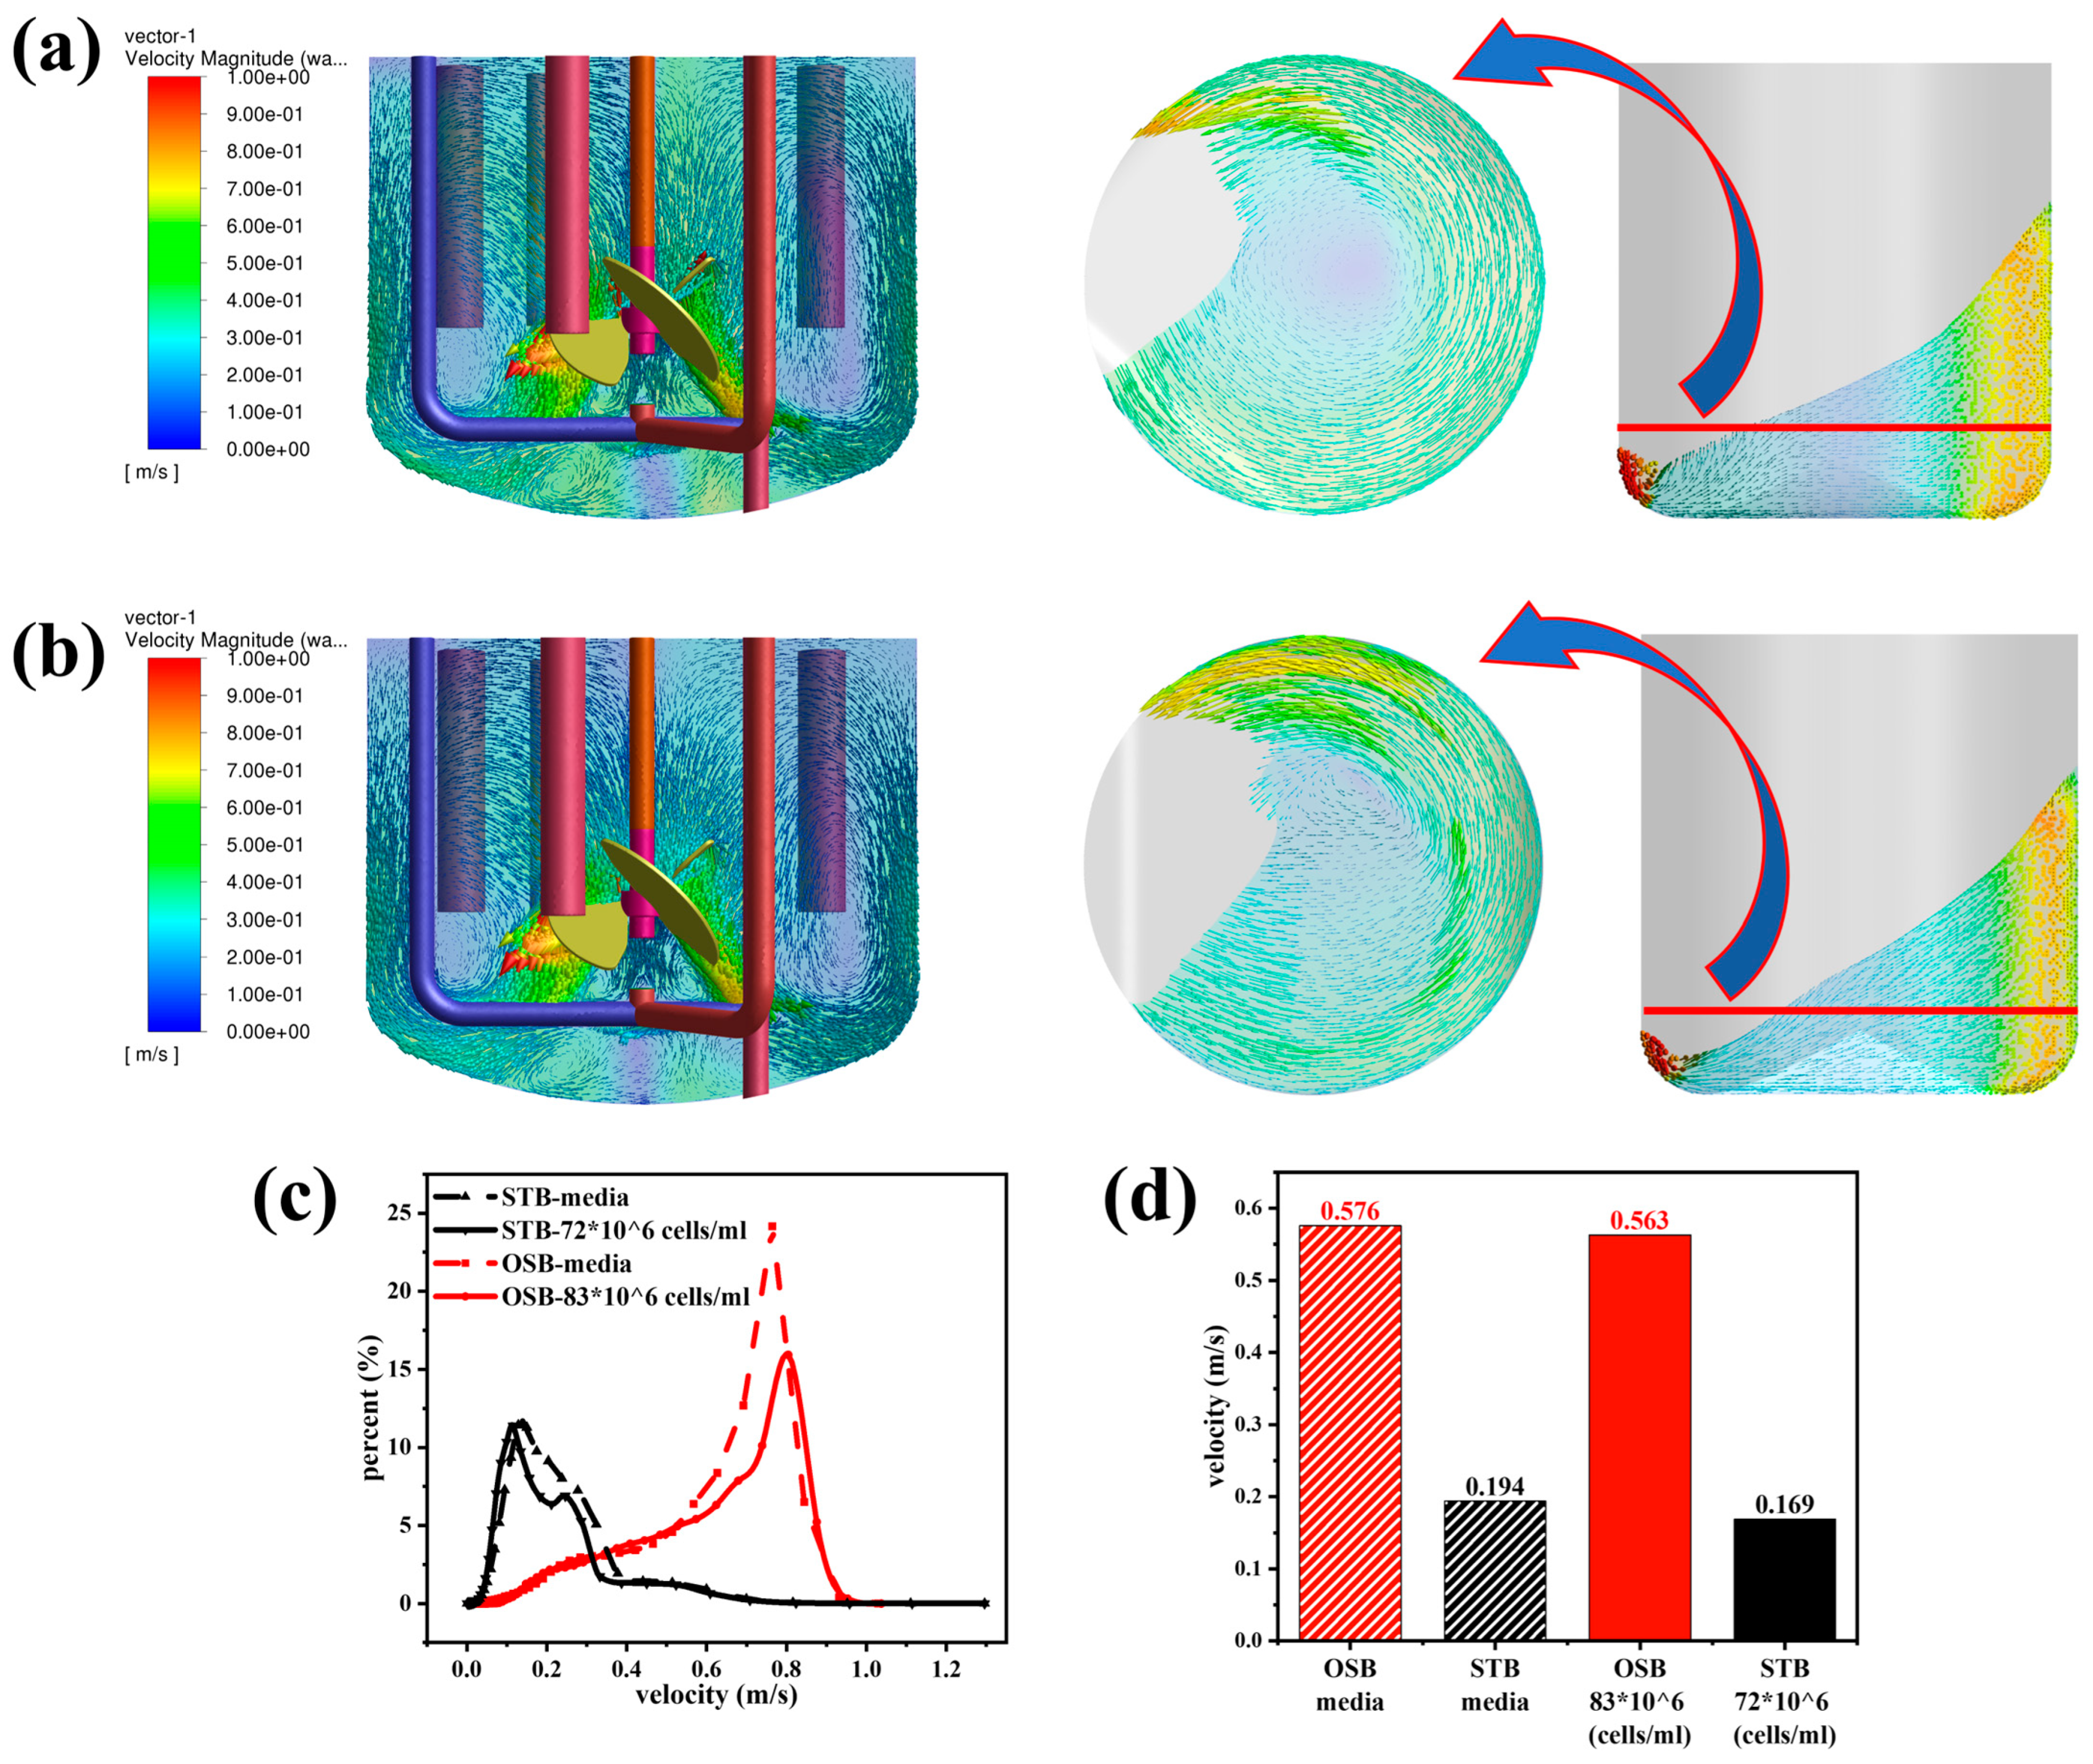
Changes in fluid rheology had distinct effects on the fluid flow characteristics in the STB and OSB. As shown in Figure 4a,b, compared to the fresh culture medium, the velocity contour of the cell suspension in the STB exhibited an increased presence of blue areas, indicating a slight reduction in the overall flow velocity as the fluid transitioned from Newtonian to shear-thinning behaviour. However, the velocity vector diagram revealed that the flow pattern remained stable, maintaining a typical axial circulation pattern from the bottom of the reactor’s base to the liquid surface. In contrast, the velocity contour in the OSB exhibited no significant changes following the transition in rheology, and the fluid flow velocity remained essentially constant. However, it is significant to note that the position of the vortex centre generated by the reactor oscillation shifted significantly from the reactor’s centre (Figure 4a) to the side corresponding to the minimum liquid level in the OSB (Figure 4b). The observed phenomenon can be attributed to the non-uniform viscosity distribution within the reactor, which primarily originates from the fluid’s shear-thinning properties. In the central region, where the shear rates are relatively low, the fluid exhibits increased viscosity (as illustrated in Figure A2 and Figure A3). This localised high-viscosity zone subsequently hinders fluid transport from low-level to high-level regions, ultimately causing the displacement of the vortex centre.
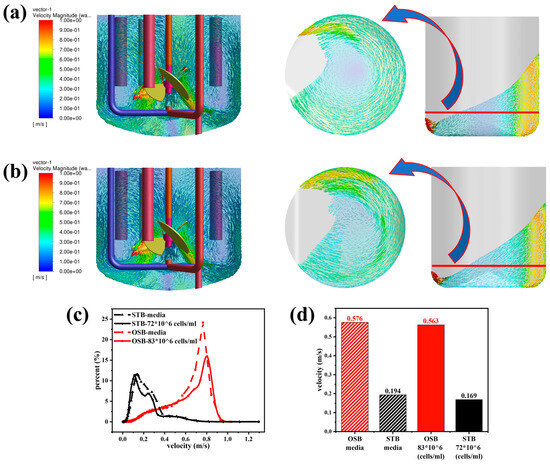
Figure 4.
Comparison of flow field characteristics in the STB and OSB: (a) velocity vector-superimposed contour plots in fresh medium; (b) velocity vector-superimposed contour plots in cell suspension at maximum density; (c) volume distribution proportion across velocity intervals; and (d) volume-averaged velocity analysis.
Quantitative analysis of volume fraction distributions across different velocity ranges revealed that, upon transitioning from culture medium to high-density cell suspension, the velocity distribution curve in the STB shifts overall towards lower velocities. In the OSB, while the peak height of the distribution curve decreased, the corresponding velocity at the peak increased (Figure 4c). Further statistical analysis demonstrated that the average flow velocity of the suspension in the STB decreased by 15% compared with the culture medium, whereas the flow velocity in the OSB remained unchanged (Figure 4d). Notably, the overall flow velocity in the STB was significantly lower than in the OSB. These distinct flow characteristics align with the analytical results in the “Gas Phase Distribution Comparison” section, providing more robust theoretical evidence for understanding the mechanism by which rheological properties influence gas phase distribution.
3.3.3. Analysis of Shear Stress Distribution and Evolution
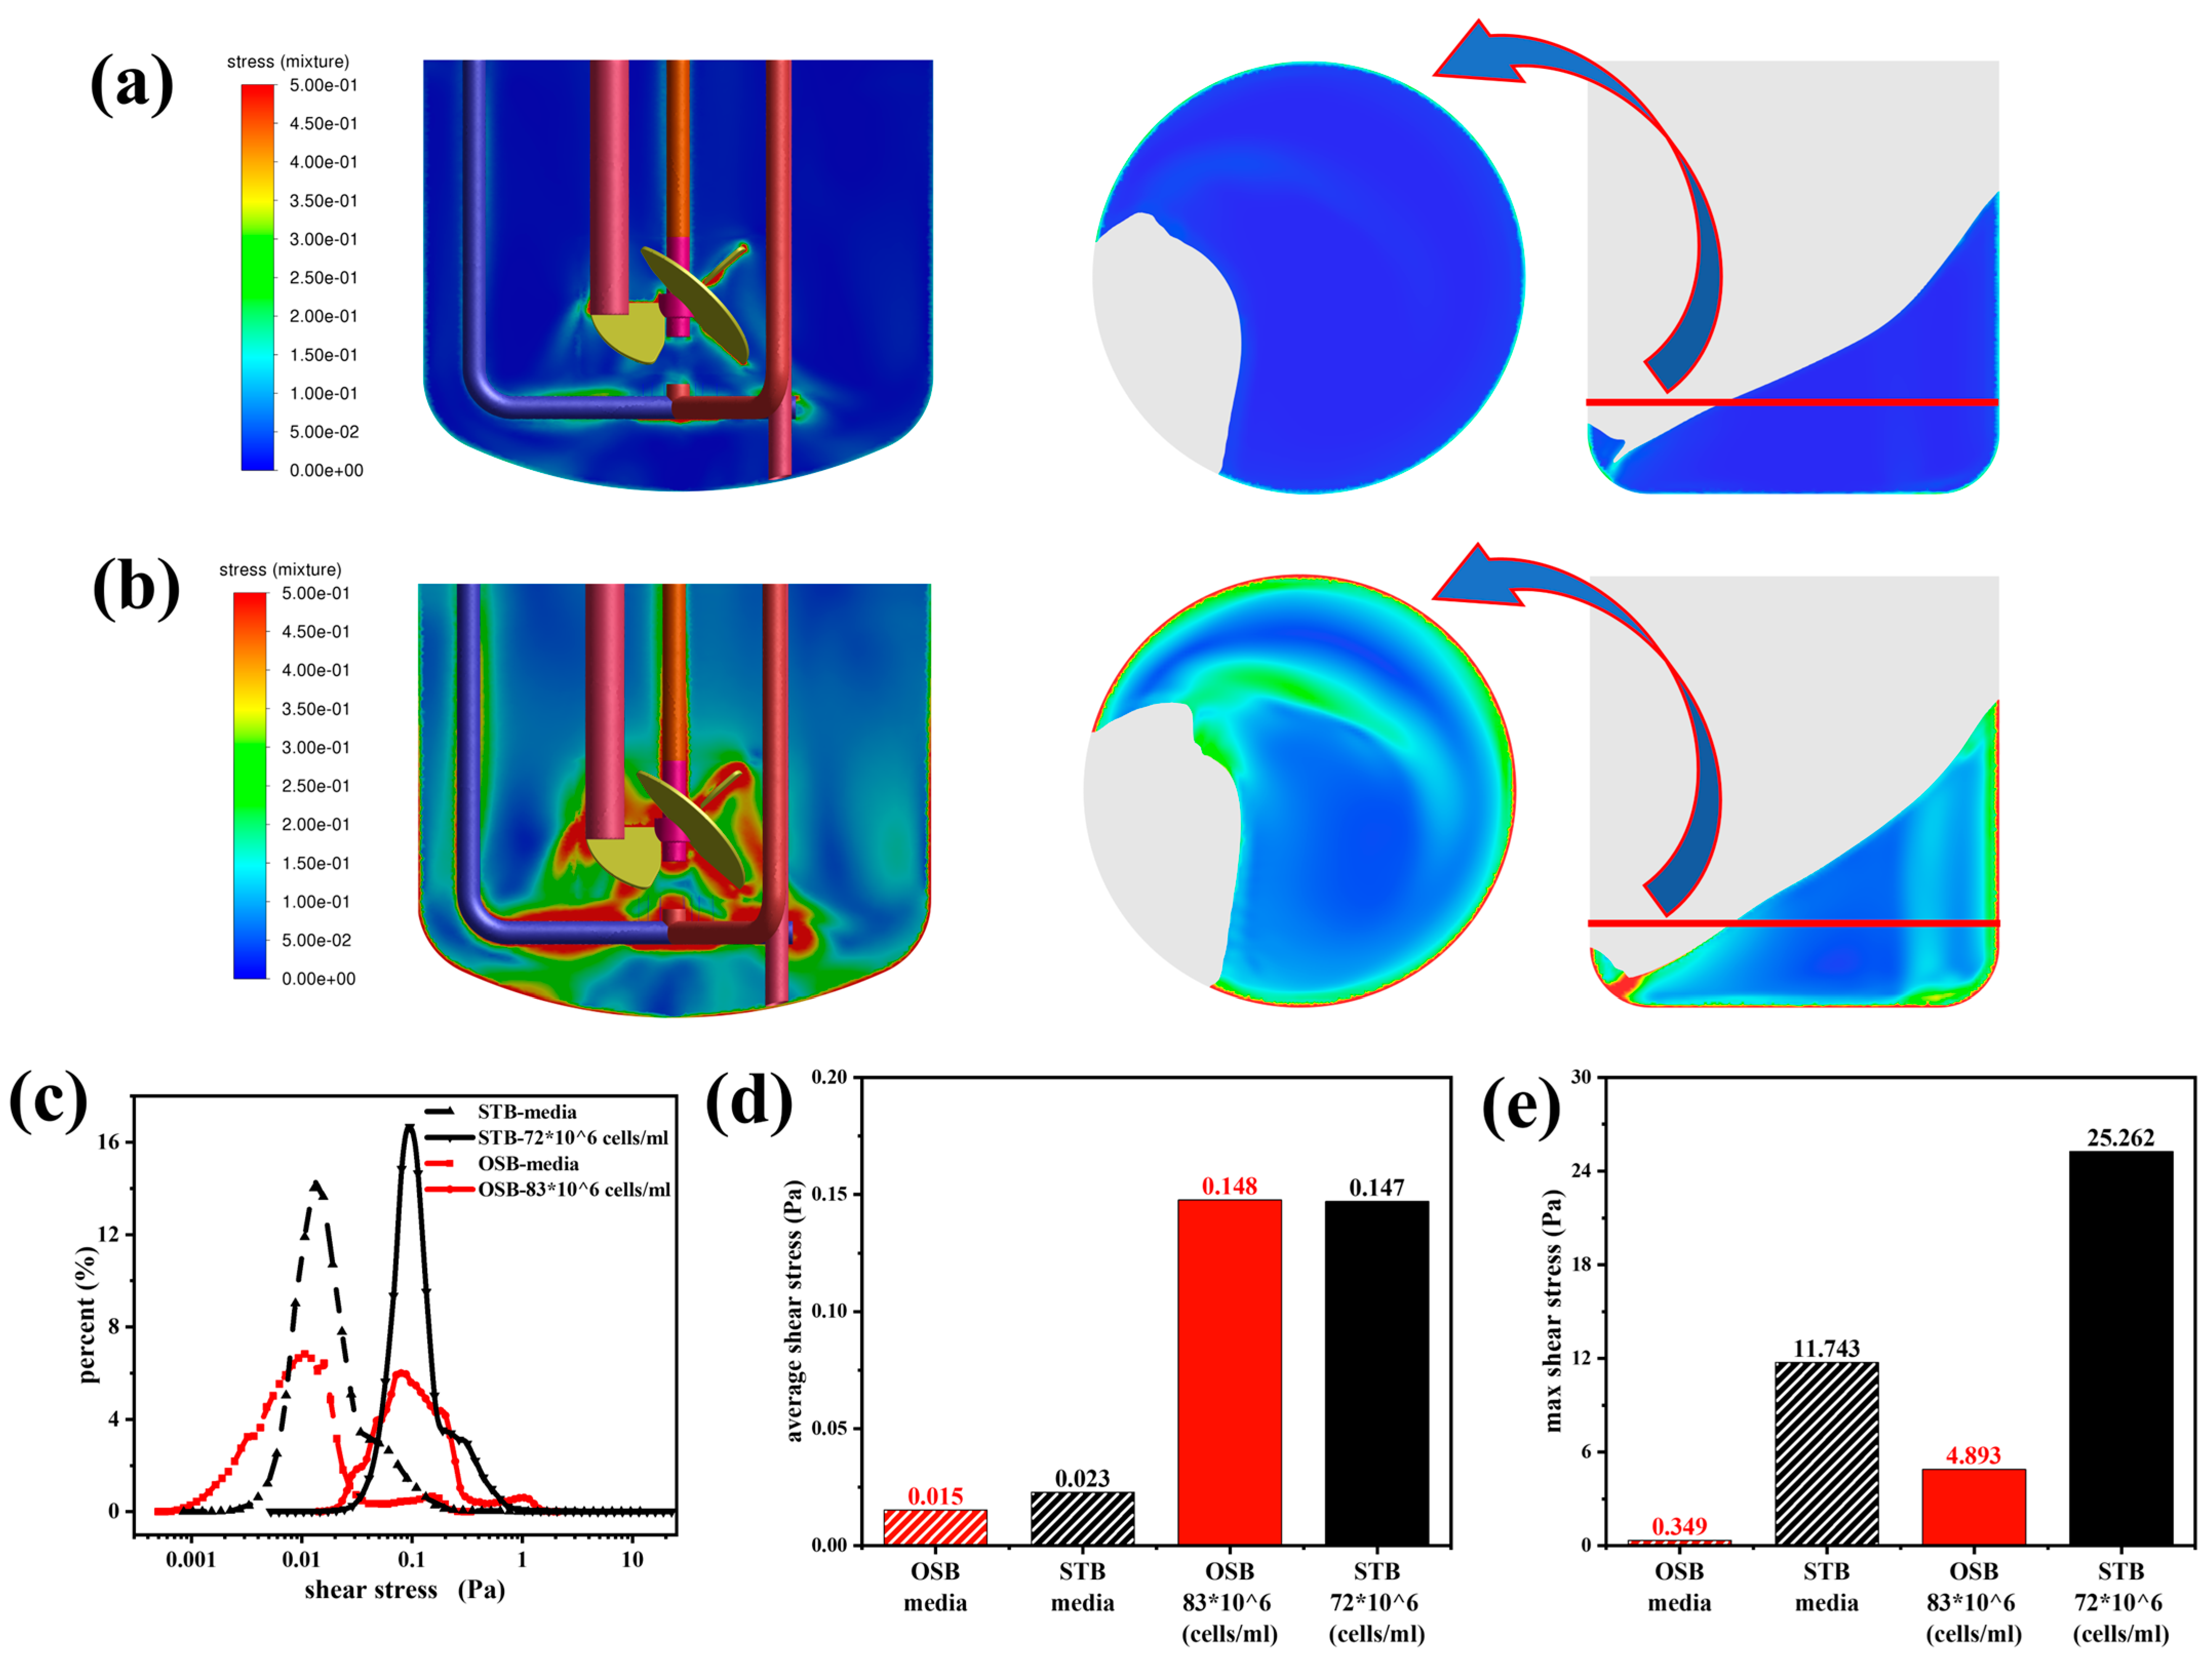
Variations in fluid rheology significantly altered the shear stress distribution in both the STB and OSB. Analysis of the numerical simulation results (Figure 5a) revealed that the two bioreactors exhibited distinctly different spatial distribution patterns of shear stress. In the STB, regions of high shear stress were concentrated around the impeller, within the high-speed fluid ejection zone, and near the sparger. In contrast, in the OSB, shear stresses were predominantly distributed along the vessel walls and in low liquid-level regions created by the orbital trajectory. This finding is closely consistent with the results of Zhu et al. [19]. Notably, following the incorporation of the rheological model into the CFD simulation, it became apparent that previous studies may have underestimated the actual shear stress experienced by cells during perfusion culture. A comparison of Figure 5a and Figure 5b reveals that in cell suspensions exhibiting shear-thinning behaviour, the shear stresses in both bioreactors increased significantly. This increase was accompanied by a noticeable expansion in the volume of regions where the shear forces exceeded 0.5 Pa, whereas the spatial distribution patterns of high shear force regions remained unchanged.

Figure 5.
Comparative analysis of shear stress distributions between the STB and OSB: (a) shear stress contours in fresh culture medium; (b) shear stress contours in cell suspension at maximum density; (c) volumetric distribution across shear stress ranges; (d) volume-averaged shear stress; and (e) maximum shear stress analysis.
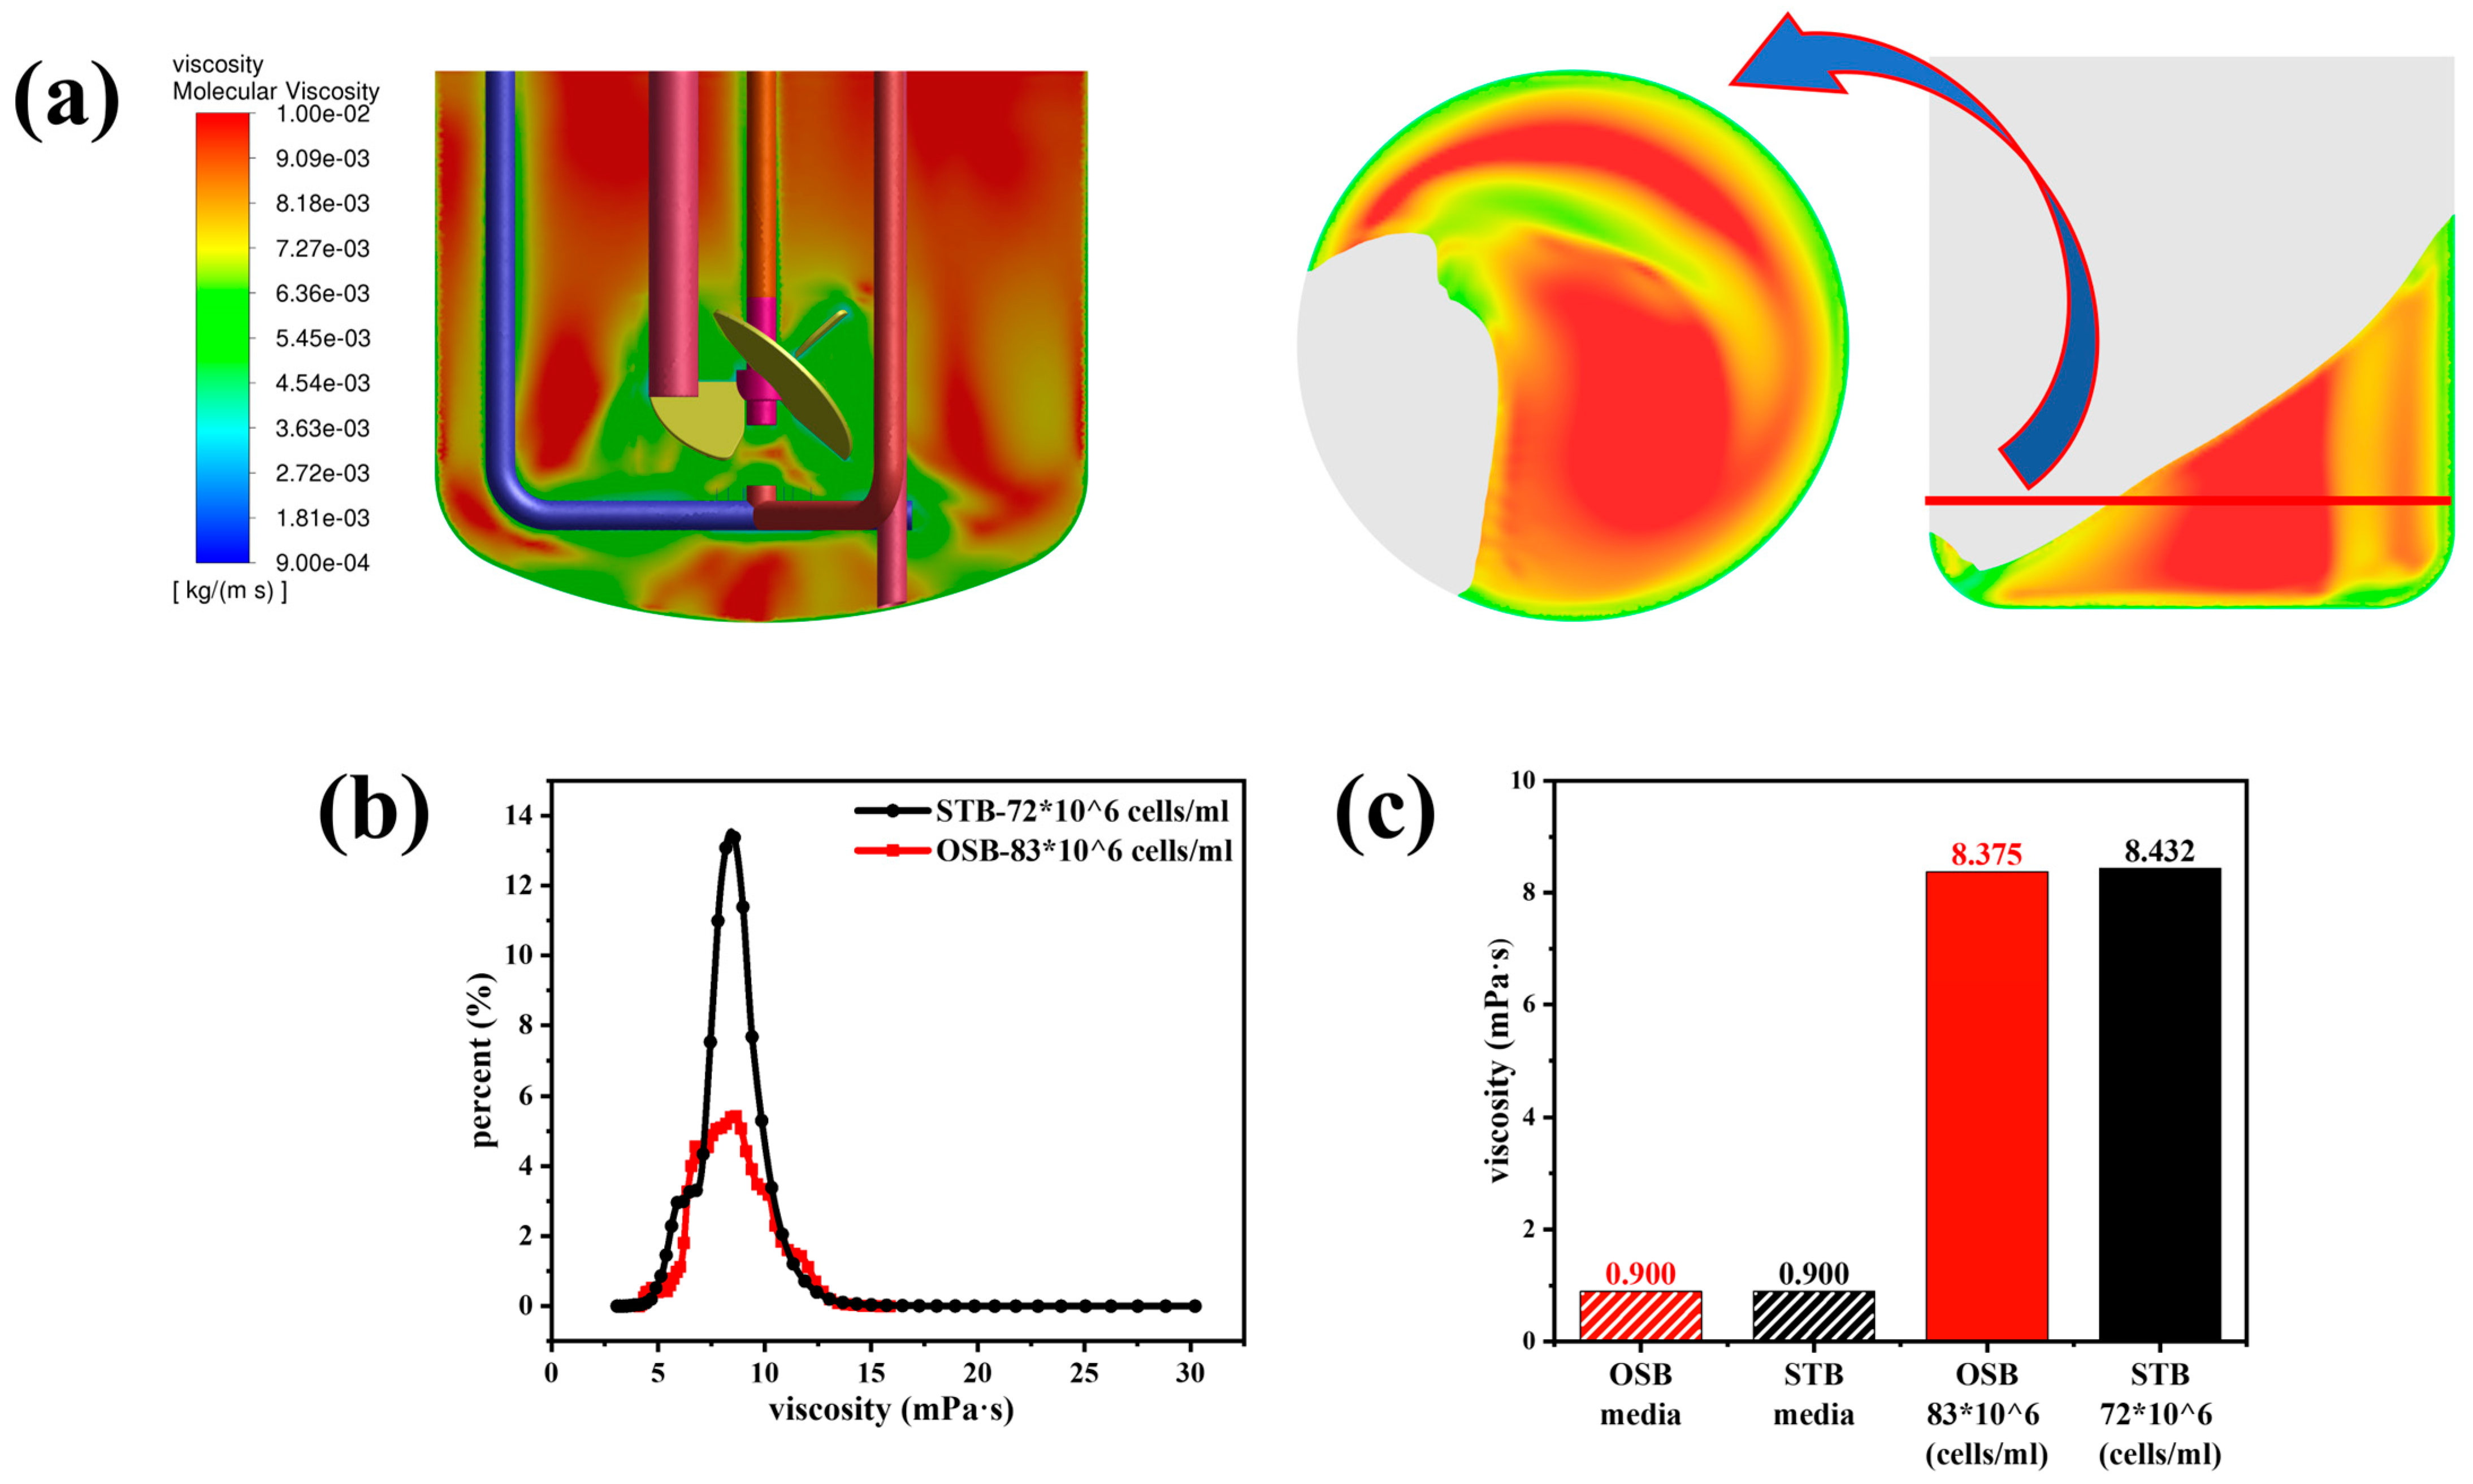
The shear stress volume distribution curve (Figure 5c) provides quantitative evidence for this phenomenon. As the test fluid transitioned from a Newtonian culture medium to high-density cell suspensions exhibiting shear-thinning behaviour, the distribution curve retained its original shape but shifted significantly to the right. This shift indicates a substantial increase in the probability of cells being exposed to high shear stress. Further quantitative analysis (Figure 5d,e) revealed that as the rheological properties changed, the average and maximum shear stress in the OSB increased by an order of magnitude. In contrast, the STB exhibited a sevenfold increase in average shear stress and a twofold increase in maximum shear stress. A detailed investigation revealed that the substantial increase in the observed shear stress was primarily attributed to the elevation in the medium viscosity rather than the variations in the shear rate. Specifically, while the average shear rate in both the OSB and STB exhibited a relative change of approximately 25% (see Appendix A Figure A2), the volume-averaged viscosity increased sharply from 0.9 mPa·s to 8.4 mPa·s (see Appendix A Figure A3).
The comparative analysis results indicated that under identical test fluid conditions, the average shear stress levels in the OSB and STB were similar. However, the maximum shear stress in the STB, reaching up to 25.26 Pa, was significantly higher than that in the OSB (Figure 5e) and was primarily concentrated around the aeration ports. According to Godoy-Silva et al. [45], intermittent exposure of CHO-6E6 cells to turbulent dissipation rates exceeding 2.9 × 10⁵ W/m3 (equivalent to approximately 17 Pa shear stress) leads to cell growth stagnation or even cell death. Šrom et al. further substantiated that the shear stress tolerance threshold for CHO-K1 cells is 24 Pa, beyond which viable cell density decreases [46]. These findings provide a plausible explanation for the observed phenomena in Section 3.1: the lower maximum cell density in the STB compared to the OSB (Figure 1a) is likely attributable to cells experiencing shear stresses near or exceeding their tolerance threshold in the STB. In contrast, although the shear stresses in the OSB did not exceed the cell tolerance threshold, the actual cell density achieved remained below the theoretical level predicted by the value measured in the culture medium. This discrepancy indicates that further investigations are necessary to explore the influence of rheological changes on the reactor mass transfer performance during culture.
3.3.4. Rheology-Dependent Changes in Mass Transfer Coefficients
Variations in the rheological properties induced by increasing cell density significantly affected the mass transfer performance of the OSB and STB. As illustrated in Figure 6a, under identical fluid medium conditions, values in the OSB and STB were comparable. However, upon transitioning the working fluid from fresh culture medium to high-density cell suspensions, the value in both reactors decreased by approximately 30%. Given that is determined by both the gas–liquid interfacial area () and the liquid-side mass transfer coefficient (), and considering that the value of remained relatively constant during rheological changes (Figure 6b), the decrease in can be primarily attributed to the reduction in (Figure 6c).
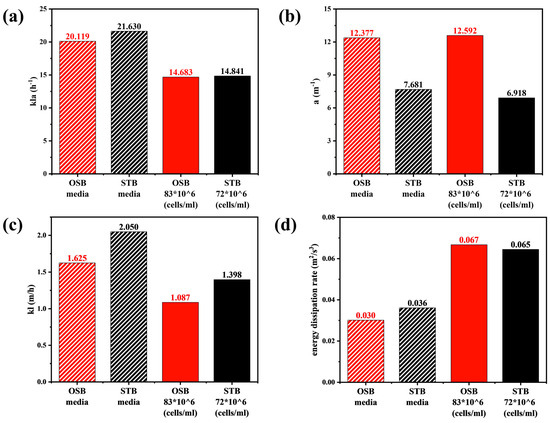
Figure 6.
Comparison of volume-averaged (a) kla, (b) a, (c) kl, and (d) turbulence dissipation rates in the OSB and STB with fresh culture medium and high-density cell suspension.
In the OSB, the gas–liquid interfacial area is primarily governed by the ratio of the gas–liquid-free surface area to the working volume. Due to its distinctive oscillating mechanism, the OSB exhibits low sensitivity to rheological variations in terms of free surface area, as confirmed by Figure 3c,d and corroborated by Rodriguez et al. [47]. Although rheological changes caused variations in local gas holdup (Figure 3a,b), reducing the overall gas holdup from 0.0101 to 0.0086, the simultaneous decrease in volume-averaged bubble diameter from 7.50 mm to 6.32 mm resulted in similar trends in the gas–liquid specific interfacial area for both reactors.
According to Equation (2), the mass transfer coefficient is primarily influenced by two factors: the turbulence dissipation rate and the medium viscosity. The quantitative analysis indicated that variations in the rheological properties led to a significant intensification of the turbulent energy dissipation, resulting in a 100% increase in the volume-averaged dissipation rate in both reactor systems (Figure 6d). This increase resulted from the higher viscosity, which amplified intermolecular viscous friction, causing more mechanical energy to be converted into thermal energy and thereby intensifying the dissipation of turbulent kinetic energy [48]. Notably, the minimum critical turbulence dissipation rate, calculated using Kolmogorov’s eddy scale theory, closely approximated the maximum turbulence dissipation rate within the reactor. Consequently, the turbulence dissipation rate was not used as a quantitative indicator of cell shear stress in this study. As the rheological properties changed, the medium viscosity in the reactor increased by an order of magnitude (Figure A3). According to the double-film theory, the liquid-film thickness increases with rheological transition, which significantly elevates the liquid-side mass transfer resistance. Consequently, the in both reactors decreased by more than 30%, which is the primary reason for the decrease in .
The values derived from simulations incorporating the rheological model, combined with the specific oxygen consumption rate of cells, indicated a theoretical capacity to support cell densities of approximately 85 × 106 cells/mL. In contrast to an STB, where localised high shear stresses restrict cell growth, the primary factor limiting further cell density increase in an OSB is likely oxygen mass transfer. Experimental observations demonstrated that in the later stages of OSB culture (days 11–13), maintaining the target dissolved oxygen concentration became increasingly challenging, thereby validating the aforementioned inference. Regarding the inability to sustain the peak cell density in the OSB during days 12–13, it is speculated that rheological changes may have influenced the vertical circulation of cells. Specifically, cells near the gas–liquid interface receive sufficient oxygen supply and continue proliferating, resulting in an overall increase in reactor cell density. The increase in apparent viscosity further decreases , leading to prolonged hypoxic conditions for cells at the bottom of the reactor. This prolonged hypoxia not only reduces antibody yield and causes cell death [49], but may also induce cell aggregation, thereby further deteriorating the overall culture condition [50].
A particularly notable phenomenon observed during the OSB perfusion culture was that even before reaching the maximum cell density, the cell-specific antibody production rate was consistently lower than that of the STB. This disparity persisted throughout the culture period, contrasting sharply with the trends typically observed in batch or fed-batch cultures [8]. The underlying mechanism responsible for this phenomenon remains unclear and requires further systematic investigation.
3.3.5. Dynamic Evolution of Cellular Microenvironment and “Lifeline” Analysis via Euler–Lagrangian Tracking
Spatial heterogeneity within a bioreactor creates a dynamic and challenging environment for CHO cells. As they move, they encounter variations in dissolved oxygen, pH, and nutrients, alongside time-varying shear stresses [22,23,51]. These shear stresses can directly induce cell death or elicit sublethal effects, such as transcriptional stress responses or the suppression of antibody expression [18,52]. Therefore, precise quantification of the dynamic shear forces exerted on cells during fluid flow is essential for optimising bioreactor performance. This approach extends beyond conventional assessments of volume-averaged shear stress or capillary tests, providing a novel theoretical framework for optimising reactor operational parameters, enhancing structural design, and facilitating reactor scale-up. Although conventional Euler–Euler CFD simulations are restricted to providing spatial parameter distributions within the reactor, the Euler–Lagrangian approach integrates tracer particles to model cellular movements. This enables real-time tracking and recording of the shear stress encountered by particles at any given location. This method provides a more precise representation of the mechanical environment experienced by cells during actual cultivation processes (Figure 7). Given that the magnitude and duration of shear stress directly influence the physiological conditions of cells, the shear stress–time profile can be defined as the “lifeline” of cells. Analysing this trajectory enables a comprehensive assessment of the mechanical environment that cells experience during cultivation [26,27].
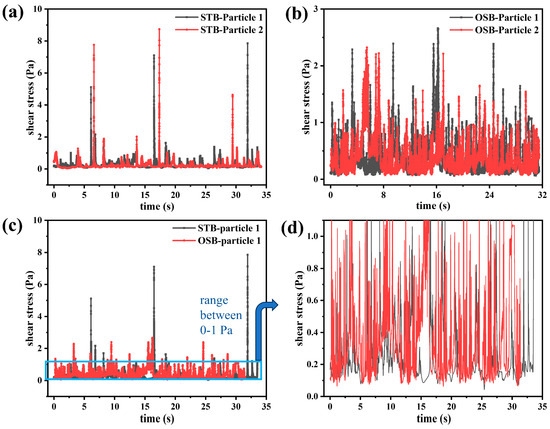
Figure 7.
Temporal evolution of shear stress (’lifelines’) experienced by two randomly selected particles in the (a) STB and (b) OSB. (c) Comparison of the “lifeline” of particles in the two reactors, and (d) amplification of the 0–1 Pa range to observe the frequency of shear stress peaks in that range.
A comparative analysis of the “lifeline” of two randomly selected tracer particles in the STB and OSB revealed distinct shear stress profiles. In the STB, the shear stress peaks experienced by cells were concentrated within two ranges: 0.2–2 Pa, occurring every 1–3 s (corresponding to particles located in the impeller sweep region); and greater than 5 Pa, occurring every 10–15 s (corresponding to particles located near the impeller or sparger) (Figure 7a). Based on the definition of bioreactor circulation time, the cellular circulation period in the STB was determined to be 1–3 s. In contrast, the shear stress peaks in the OSB were predominantly within the 0.2–3 Pa range and primarily occurred when particles were near the vessel wall or within regions of low liquid level (Figure 7b). During the 30 s observation period, the maximum shear stress experienced by cells in the STB was approximately three times that in the OSB (Figure 7c). This disparity in maximum shear stress may explain why the maximum cell density was lower in the STB than in the OSB. However, within the 0–1 Pa range, the frequency of peak shear stresses was significantly higher in the OSB than in the STB (Figure 7d). This observation highlights the need to further quantify the shear stress pattern characteristics in both reactors using signal processing techniques.
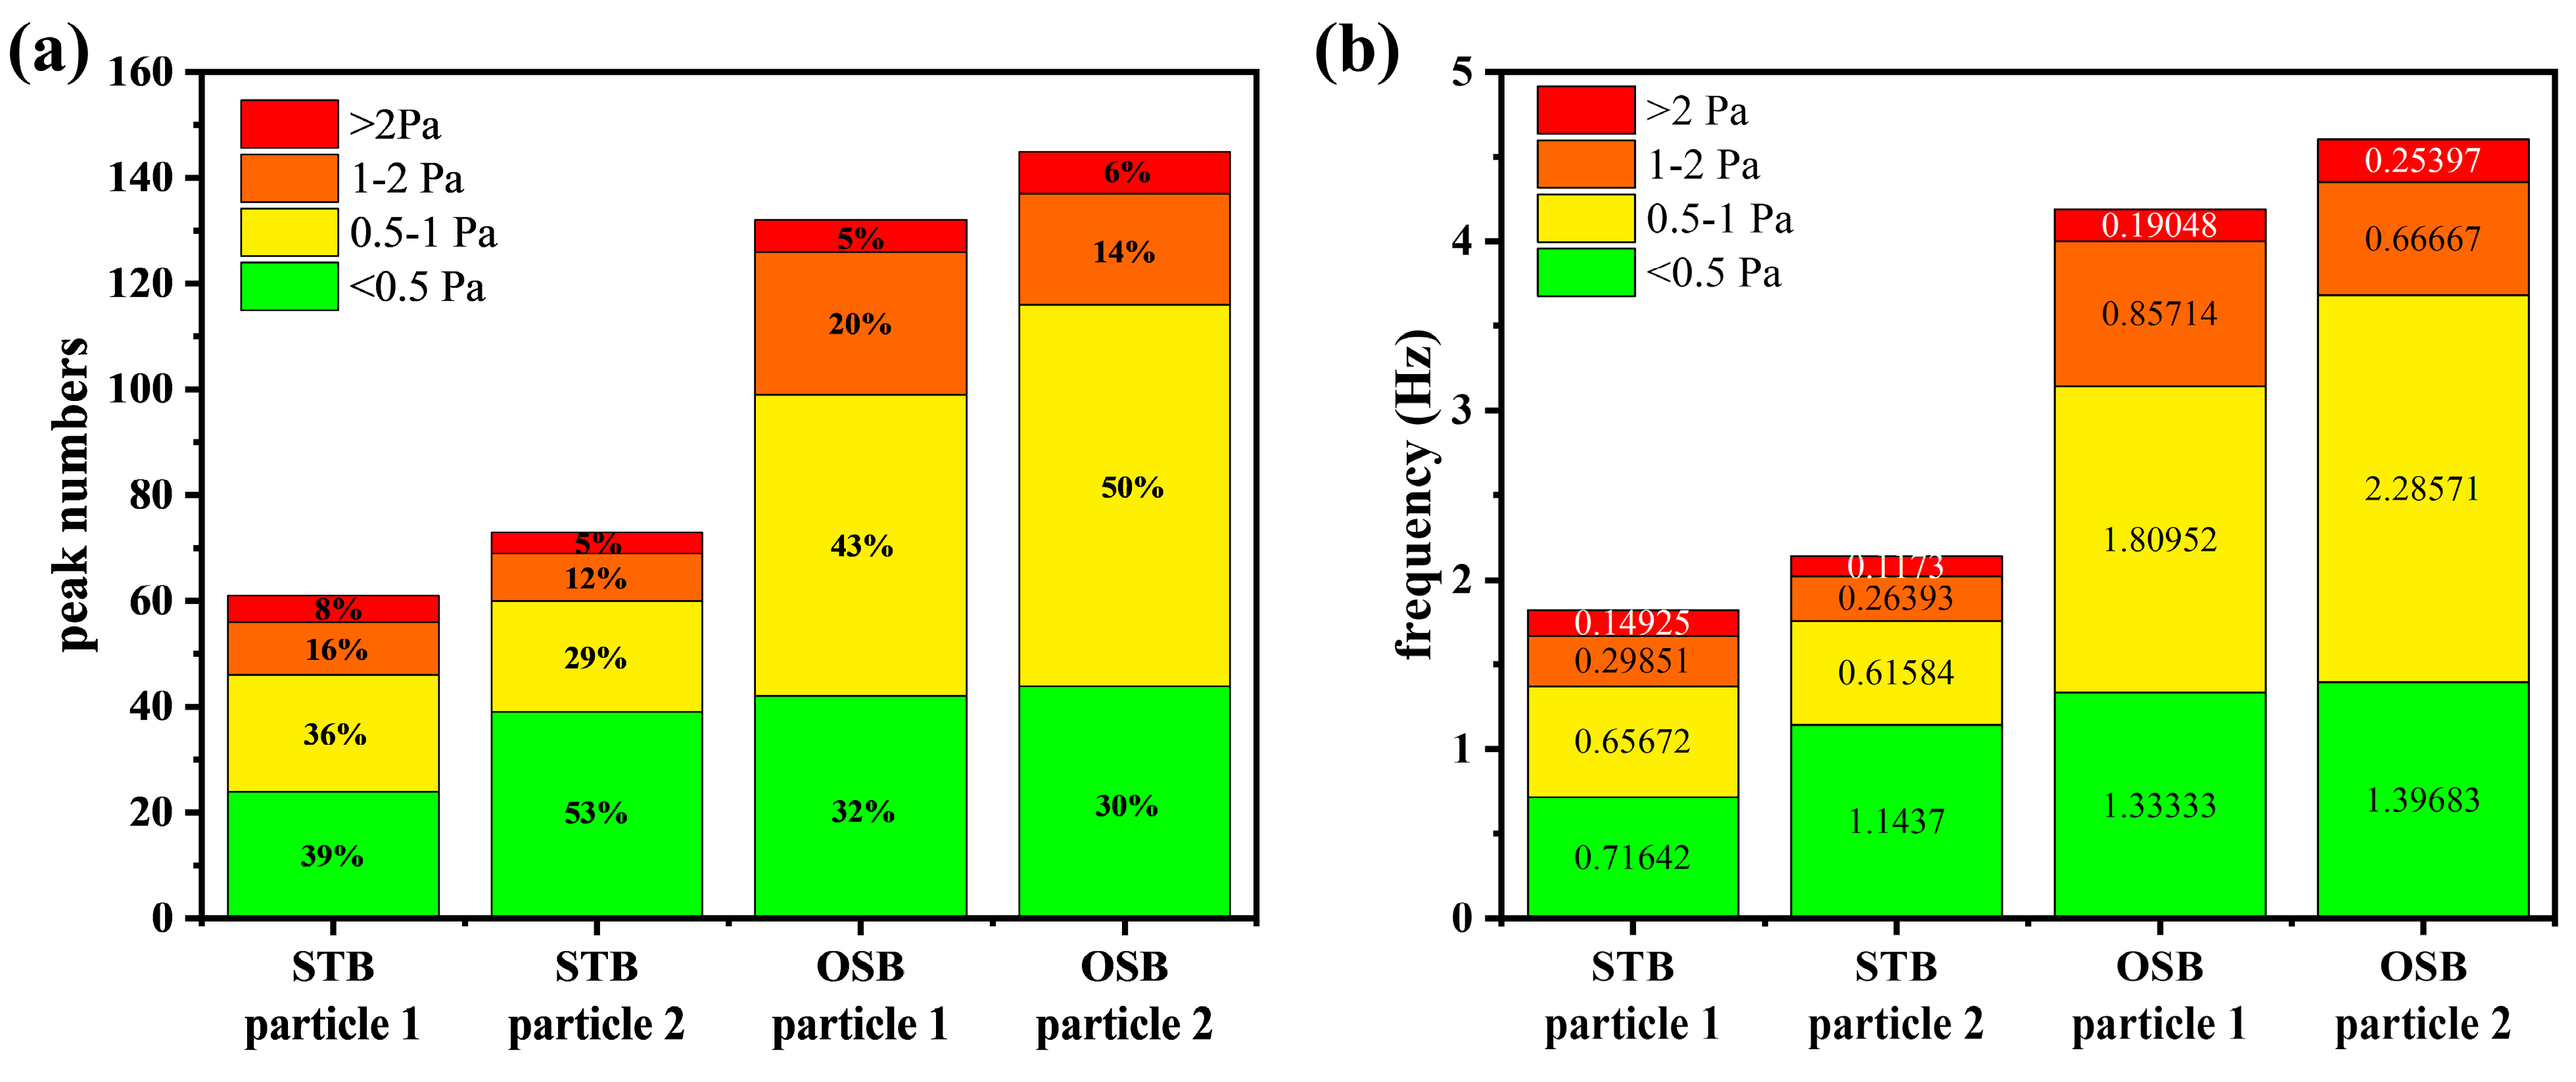
Peak detection analysis using signal processing revealed that both the number and frequency of shear stress peaks in the OSB were approximately twice those in the STB (Figure 8). The reported thresholds for sublethal effects on cells vary across studies due to differences in cell lines and experimental methodologies. For example, Sieck et al. [18] proposed a threshold of 0.64 Pa (corresponding to a turbulent energy dissipation rate of 0.4 W/kg), whereas Neuss et al. [52] suggested 2.0 Pa (corresponding to 3.84 W/kg). Based on these findings, the shear stress peaks were classified into four intervals using 0.5 Pa, 1.0 Pa, and 2.0 Pa as the boundary values. Given that no studies have reported cellular sublethal responses below 0.5 Pa, peaks within this range were designated as safe peaks. The analysis indicated that safe peaks occurred at similar frequencies in both reactors. However, peaks exceeding this threshold were more frequent in the OSB than in the STB. These findings indicate that cells in the OSB were subjected to more frequent shear-induced sublethal responses. This increased frequency likely contributes to a lower cell-specific antibody production rate in the OSB perfusion cultures than in the STB. This finding clarifies the underlying cause of cultivation performance differences between the bioreactors and provides new perspectives for design optimisation. Notably, during cell culture scale-up and intensification, emphasis should be placed on the temporal distribution characteristics of shear stress rather than solely concentrating on spatial distribution or average values. Further improvements in cell culture performance may be achieved by minimising high-frequency shear stress occurrences, which has significant implications for optimising industrial-scale biopharmaceutical processes.
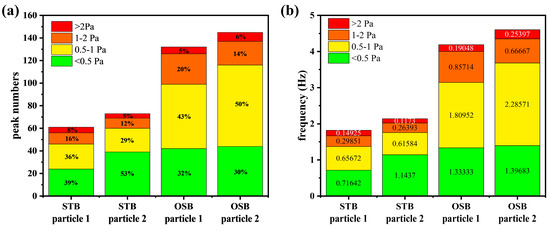
Figure 8.
Quantification of shear stress peaks in the “lifeline” of cells using peak detection technology in signal processing, showing the (a) number of peaks and (b) frequency of peaks in different shear stress intervals. The numerical values within the bars represent the relative proportions or frequencies of the peaks within each range.
4. Conclusions
This study systematically compared the performances of an OSB and STB in CHO cell perfusion culture, elucidating the underlying mechanisms. The experimental results indicated that the OSB achieved a higher maximum cell density (83 × 106 cells/mL) than the STB (71.6 × 10⁶ cells/mL). However, the OSB exhibits significantly lower cell density maintenance capability and cell-specific antibody production rates than the STB. This notable performance disparity prompted a thorough investigation into the fluid dynamics characteristics.
Rheological studies demonstrated that high-density CHO cell suspensions exhibit significant shear-thinning characteristics, which can be accurately described by the Sisko fluid model. Leveraging this rheological model, CFD simulations coupled with the Euler–Lagrange method enabled precise quantification of the shear stress and mass transfer distribution in both reactors. This study established that the shear-thinning characteristics of the cell suspension significantly influenced the shear stress distribution and mass transfer efficiency in bioreactors. Specifically, shear stress levels increased several-fold in both bioreactors, while decreased by 30%. The maximum shear stress in the STB was approximately five times higher than that in the OSB. However, analysis of the “lifeline” revealed that the frequency of peak shear stresses in the OSB was approximately twice that of those in the STB.
The detailed analysis revealed that the underlying cause of the performance disparity between the two reactors is the spatiotemporal dynamic characteristics of the cell culture environment. In OSBs, reduced mass transfer efficiency due to changes in suspension rheology limits the maximum cell density and the duration of maintenance. Furthermore, frequent exposure to shear stress may induce sublethal stress responses in cells, leading to decreased antibody production. Conversely, in STBs, cell growth is primarily constrained by localised high-shear stresses that exceed the cell tolerance threshold.
This study systematically elucidates the advantages and limitations of different bioreactor types for perfusion culture, highlighting the critical balance between shear stress management and mass transfer optimisation in bioreactor design. This investigation proposes that dynamic process control or geometric structure optimisation should prioritise increasing while reducing the maximum shear stress in STBs or the frequency of shear exposure in OSBs. These findings establish a robust theoretical foundation and mechanistic framework for enhancing the scalability and efficiency of perfusion culture processes and monoclonal antibody production, providing valuable guidance for industrial biomanufacturing.
Author Contributions
Conceptualization, B.Z. and G.D.; methodology, B.Z. and G.D.; software, B.Z.; validation, Q.R., Q.Y., and W.-S.T.; formal analysis, B.Z. and Q.R.; investigation, B.Z. and Q.R.; resources, L.Z.; data curation, B.Z.; writing—original draft preparation, B.Z.; writing—review and editing, B.Z. and G.D.; visualization, B.Z.; supervision, G.D. and W.-S.T. All authors have read and agreed to the published version of the manuscript.
Funding
This research received no external funding.
Data Availability Statement
The original contributions presented in this study are included in the article. Further inquiries can be directed to the corresponding author.
Conflicts of Interest
The authors Liang Zhao and Wen-Song Tan were employed by the company Shanghai BioEngine Sci-Tech Co., Ltd. The remaining authors declare that the research was conducted in the absence of any commercial or financial relationships that could be construed as a potential conflict of interest.
Appendix A
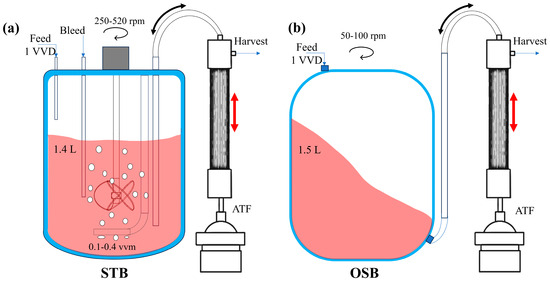
Figure A1.
Schematic diagram of the perfusion culture system (including key operational parameters) and structural characteristics of the (a) STB and (b) OSB.
Figure A1.
Schematic diagram of the perfusion culture system (including key operational parameters) and structural characteristics of the (a) STB and (b) OSB.


Figure A2.
Comparison of shear rate distributions in the STB and OSB: (a) shear rate contours in fresh medium; (b) shear rate contours in cell suspension at maximum density; (c) volume fraction distribution across shear rate intervals; and (d) volume-averaged shear rate analysis.
Figure A2.
Comparison of shear rate distributions in the STB and OSB: (a) shear rate contours in fresh medium; (b) shear rate contours in cell suspension at maximum density; (c) volume fraction distribution across shear rate intervals; and (d) volume-averaged shear rate analysis.
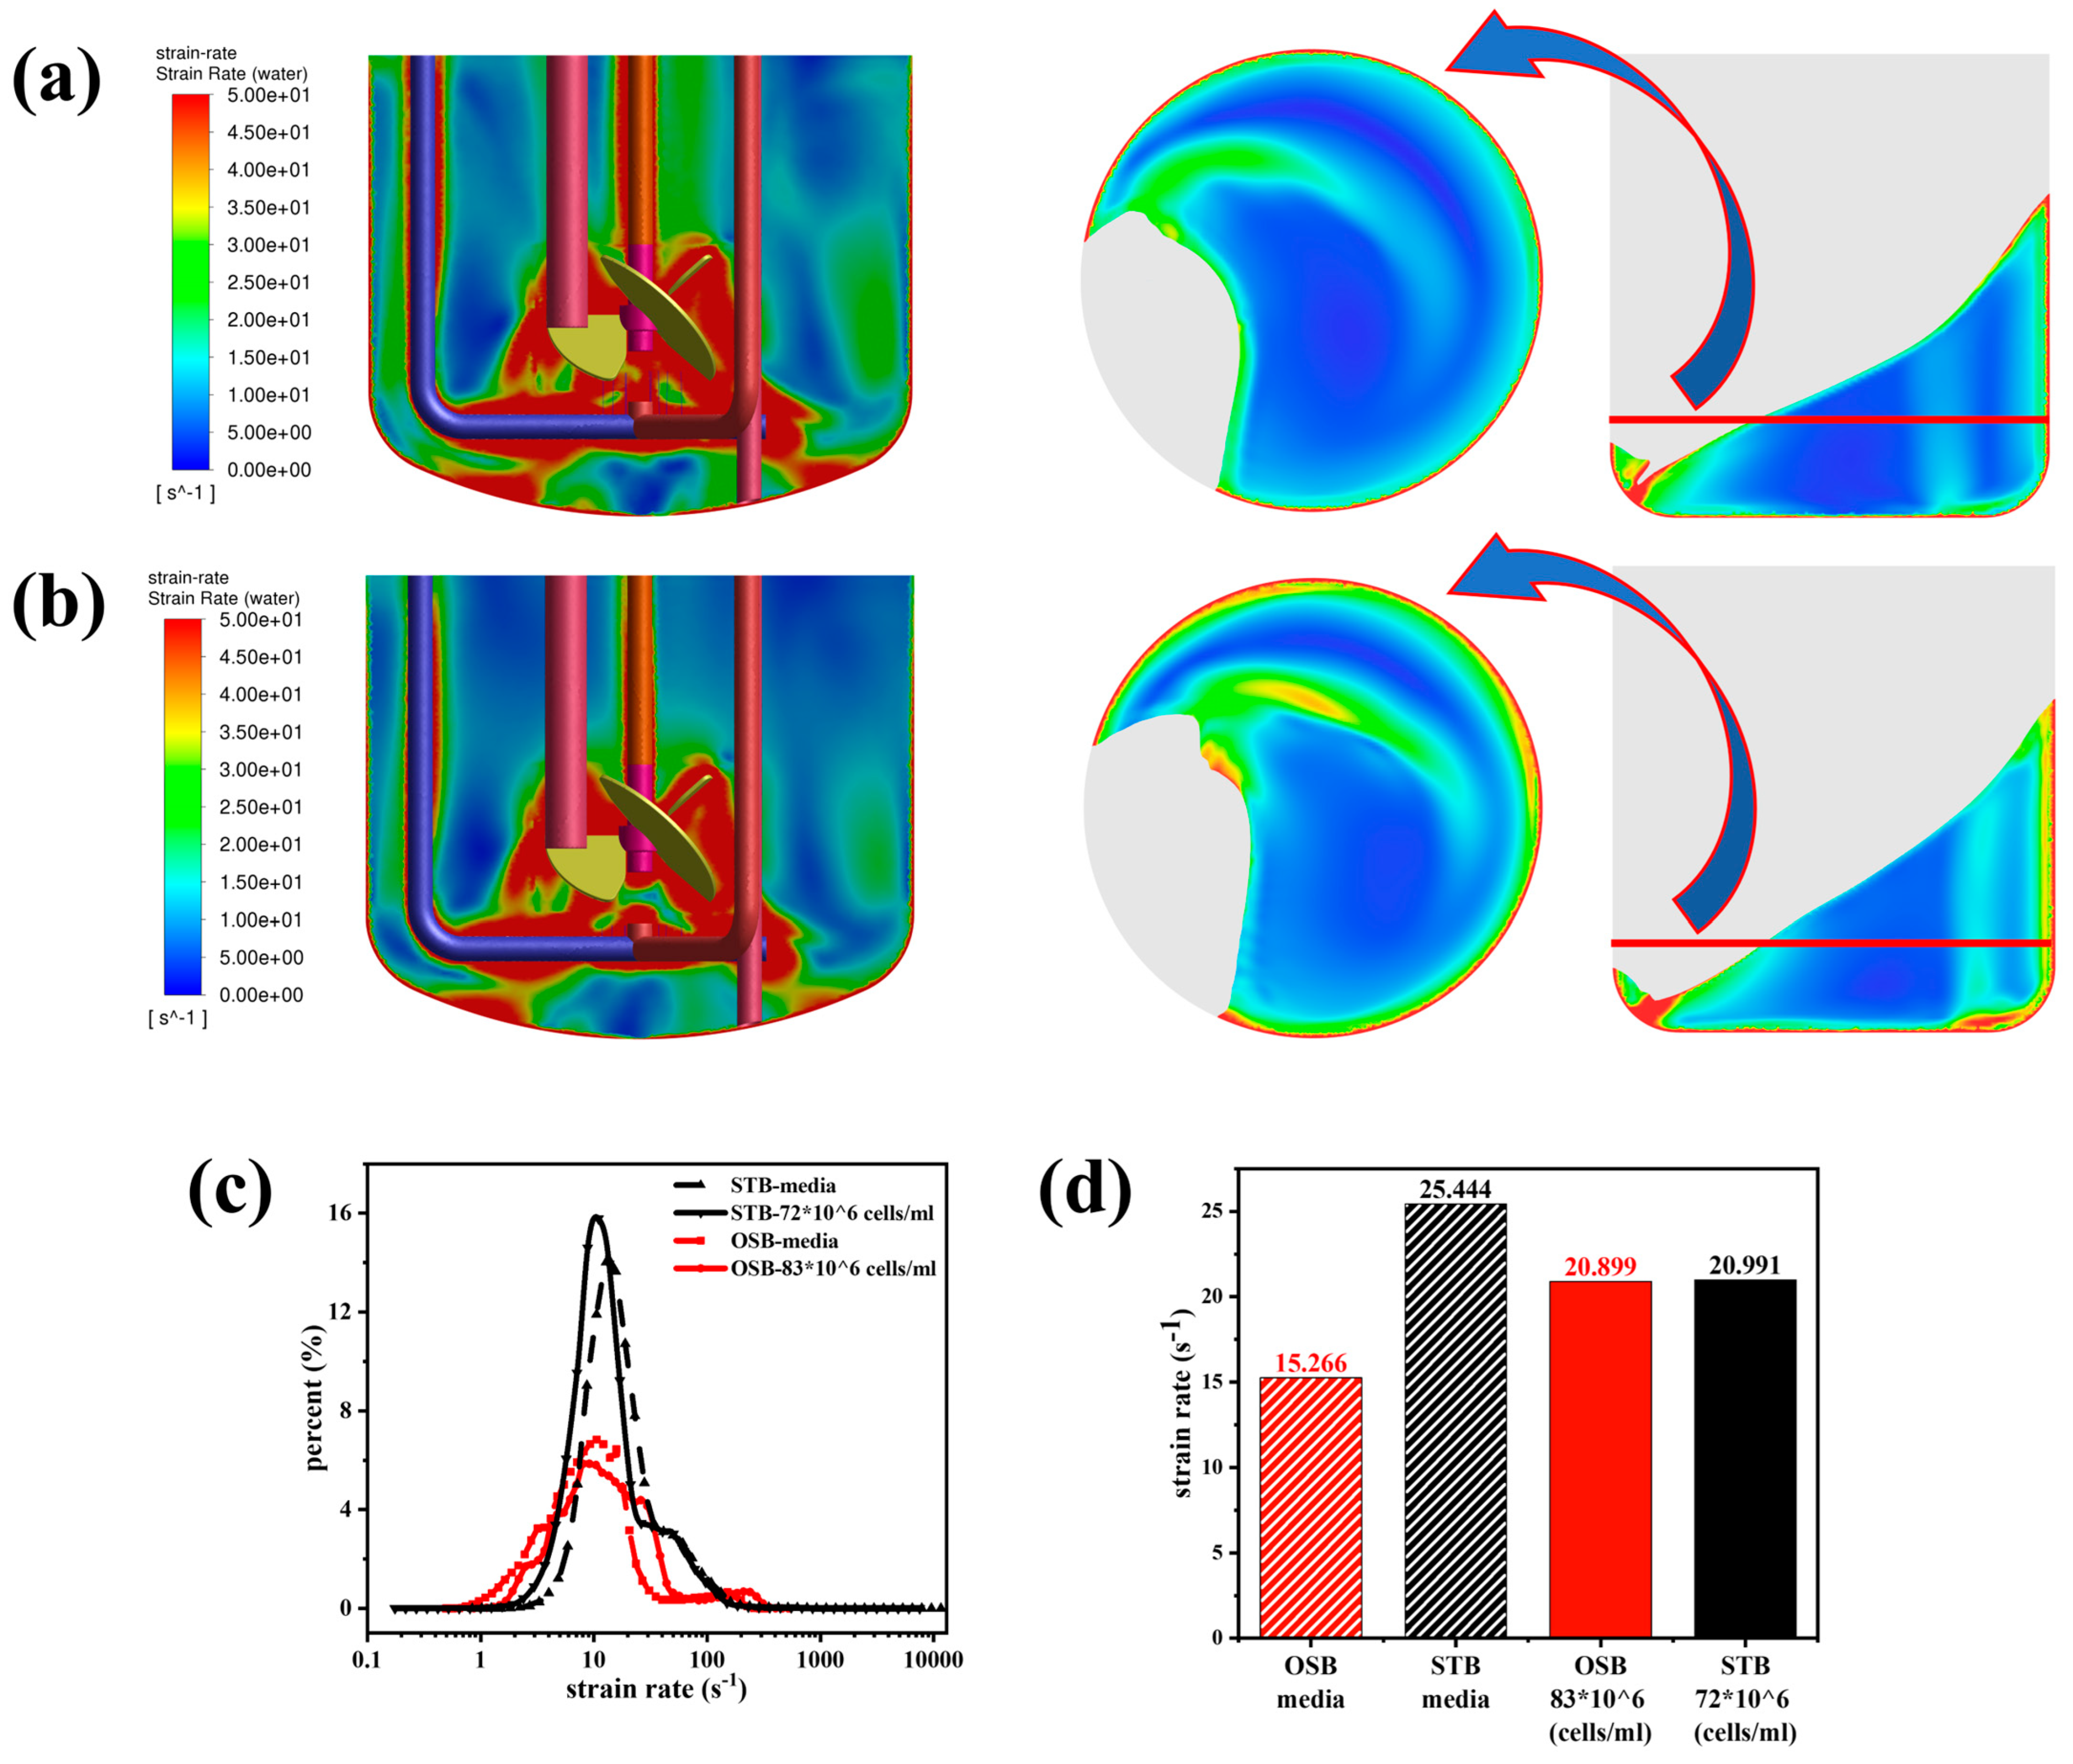

Figure A3.
Comparison of viscosity distributions in the STB and OSB: (a) viscosity contours in cell suspension at maximum density; (b) volumetric distribution across viscosity ranges; and (c) volume-averaged viscosity analysis.
Figure A3.
Comparison of viscosity distributions in the STB and OSB: (a) viscosity contours in cell suspension at maximum density; (b) volumetric distribution across viscosity ranges; and (c) volume-averaged viscosity analysis.
References
- Stone, C.A.; Spiller, B.W.; Smith, S.A. Engineering therapeutic monoclonal antibodies. J. Allergy Clin. Immunol. 2024, 153, 539–548. [Google Scholar] [CrossRef] [PubMed]
- Yang, O.; Prabhu, S.; Ierapetritou, M. Comparison between Batch and Continuous Monoclonal Antibody Production and Economic Analysis. Ind. Eng. Chem. Res. 2019, 58, 5851–5863. [Google Scholar] [CrossRef]
- Chotteau, V.; Schwarz, H.; Mäkinen, M. Continuous Bioprocessing for Upstream Process: Perfusion Process. In Biopharmaceutical Manufacturing: Progress, Trends and Challenges; Pörtner, R., Ed.; Springer International Publishing: Cham, Switzerland, 2023; pp. 113–158. [Google Scholar]
- Nöbel, M.; Barry, C.; MacDonald, M.A.; Baker, K.; Shave, E.; Mahler, S.; Munro, T.; Martínez, V.S.; Nielsen, L.K.; Marcellin, E. Harnessing metabolic plasticity in CHO cells for enhanced perfusion cultivation. Biotechnol. Bioeng. 2024, 121, 1370–1382. [Google Scholar] [CrossRef]
- Maria, S.; Bonneau, L.; Fould, B.; Ferry, G.; Boutin, J.A.; Cabanne, C.; Santarelli, X.; Joucla, G. Perfusion process for CHO cell producing monoclonal antibody: Comparison of methods to determine optimum cell specific perfusion rate. Biochem. Eng. J. 2023, 191, 108779. [Google Scholar] [CrossRef]
- Pörtner, R. Bioreactors for Mammalian Cells. In Animal Cell Culture; Al-Rubeai, M., Ed.; Springer: Cham, Switzerland, 2015; pp. 89–135. [Google Scholar]
- Klöckner, W.; Diederichs, S.; Büchs, J. Orbitally Shaken Single-Use Bioreactors. In Disposable Bioreactors II; Eibl, D., Eibl, R., Eds.; Springer: Berlin/Heidelberg, Germany, 2014; pp. 45–60. [Google Scholar]
- Wang, X.; Xu, J.; Guo, Q.; Li, Z.; Cao, J.; Fu, R.; Xu, M.; Zhao, X.; Wang, F.; Zhang, X.; et al. Improving product quality and productivity of an antibody-based biotherapeutic using inverted frustoconical shaking bioreactors. Front. Bioeng. Biotechnol. 2024, 12, 1352098. [Google Scholar] [CrossRef]
- Coronel, J.; Behrendt, I.; Bürgin, T.; Anderlei, T.; Sandig, V.; Reichl, U.; Genzel, Y. Influenza A virus production in a single-use orbital shaken bioreactor with ATF or TFF perfusion systems. Vaccine 2019, 37, 7011–7018. [Google Scholar] [CrossRef]
- Bürgin, T.; Coronel, J.; Hagens, G.; Keebler, M.V.; Genzel, Y.; Reichl, U.; Anderlei, T. Orbitally Shaken Single-Use Bioreactor for Animal Cell Cultivation: Fed-Batch and Perfusion Mode. In Animal Cell Biotechnology: Methods and Protocols; Pörtner, R., Ed.; Springer: New York, NY, USA, 2020; pp. 105–123. [Google Scholar]
- Zhang, X.; Stettler, M.; De Sanctis, D.; Perrone, M.; Parolini, N.; Discacciati, M.; De Jesus, M.; Hacker, D.; Quarteroni, A.; Wurm, F. Use of Orbital Shaken Disposable Bioreactors for Mammalian Cell Cultures from the Milliliter-Scale to the 1000-Liter Scale. In Disposable Bioreactors; Eibl, R., Eibl, D., Eds.; Springer: Berlin/Heidelberg, Germany, 2010; pp. 33–53. [Google Scholar]
- Ameenuddin, M.; Anand, M.; Massoudi, M. Effects of shear-dependent viscosity and hematocrit on blood flow. Appl. Math. Comput. 2019, 356, 299–311. [Google Scholar] [CrossRef]
- Maisonneuve, B.G.C.; Roux, D.C.D.; Thorn, P.; Cooper-White, J.J. Effects of Cell Density and Biomacromolecule Addition on the Flow Behavior of Concentrated Mesenchymal Cell Suspensions. Biomacromolecules 2013, 14, 4388–4397. [Google Scholar] [CrossRef]
- Zoro, B.J.H.; Owen, S.; Drake, R.A.L.; Mason, C.; Hoare, M. Regenerative medicine bioprocessing: Concentration and behavior of adherent cell suspensions and pastes. Biotechnol. Bioeng. 2009, 103, 1236–1247. [Google Scholar] [CrossRef]
- Gabelle, J.C.; Jourdier, E.; Licht, R.B.; Ben Chaabane, F.; Henaut, I.; Morchain, J.; Augier, F. Impact of rheology on the mass transfer coefficient during the growth phase of Trichoderma reesei in stirred bioreactors. Chem. Eng. Sci. 2012, 75, 408–417. [Google Scholar] [CrossRef]
- Wyma, A.; Martin-Alarcon, L.; Walsh, T.; Schmidt, T.A.; Gates, I.D.; Kallos, M.S. Non-Newtonian rheology in suspension cell cultures significantly impacts bioreactor shear stress quantification. Biotechnol. Bioeng. 2018, 115, 2101–2113. [Google Scholar] [CrossRef]
- Pérez-Rodriguez, S.; Reynoso-Cereceda, G.I.; Valdez-Cruz, N.A.; Trujillo-Roldán, M.A. A comprehensive comparison of mixing and mass transfer in shake flasks and their relationship with MAb productivity of CHO cells. Bioprocess Biosyst. Eng. 2022, 45, 1033–1045. [Google Scholar] [CrossRef] [PubMed]
- Sieck, J.B.; Cordes, T.; Budach, W.E.; Rhiel, M.H.; Suemeghy, Z.; Leist, C.; Villiger, T.K.; Morbidelli, M.; Soos, M. Development of a Scale-Down Model of hydrodynamic stress to study the performance of an industrial CHO cell line under simulated production scale bioreactor conditions. J. Biotechnol. 2013, 164, 41–49. [Google Scholar] [CrossRef] [PubMed]
- Zhu, L.; Liao, Y.; Chang, X.; Su, M.; Ou, Y.; Wu, S.; Wu, Z.; Yang, H.; Li, J.; Huang, H. A Comparative Study of the Performance of Orbitally Shaken Bioreactors (OSRs) and Stirred Tank Bioreactors (STRs). Processes 2024, 12, 2849. [Google Scholar] [CrossRef]
- Wang, Z.; Li, D.; Gao, Q.; Yang, Q.; Xiong, X.; Jiang, C.; Zhang, F. Study of the flow field of a new fishtail-type stirring impeller in a stirred tank. Chem. Eng. Process.-Process Intensif. 2023, 194, 109577. [Google Scholar] [CrossRef]
- Mishra, S.; Kumar, V.; Sarkar, J.; Rathore, A.S. CFD based mass transfer modeling of a single use bioreactor for production of monoclonal antibody biotherapeutics. Chem. Eng. J. 2021, 412, 128592. [Google Scholar] [CrossRef]
- Lara, A.R.; Galindo, E.; Ramírez, O.T.; Palomares, L.A. Living with heterogeneities in bioreactors. Mol. Biotechnol. 2006, 34, 355–381. [Google Scholar] [CrossRef]
- Villiger, T.K.; Neunstoecklin, B.; Karst, D.J.; Lucas, E.; Stettler, M.; Broly, H.; Morbidelli, M.; Soos, M. Experimental and CFD physical characterization of animal cell bioreactors: From micro- to production scale. Biochem. Eng. J. 2018, 131, 84–94. [Google Scholar] [CrossRef]
- Vickroy, B.; Lorenz, K.; Kelly, W. Modeling Shear Damage to Suspended CHO Cells during Cross-Flow Filtration. Biotechnol. Progr. 2007, 23, 194–199. [Google Scholar] [CrossRef]
- Zakrzewski, R.; Lee, K.; Lye, G.J. Development of a miniature bioreactor model to study the impact of pH and DOT fluctuations on CHO cell culture performance as a tool to understanding heterogeneity effects at large-scale. Biotechnol. Progr. 2022, 38, e3264. [Google Scholar] [CrossRef]
- Lapin, A.; Müller, D.; Reuss, M. Dynamic Behavior of Microbial Populations in Stirred Bioreactors Simulated with Euler−Lagrange Methods: Traveling along the Lifelines of Single Cells. Ind. Eng. Chem. Res. 2004, 43, 4647–4656. [Google Scholar] [CrossRef]
- Haringa, C.; Tang, W.; Deshmukh, A.T.; Xia, J.; Reuss, M.; Heijnen, J.J.; Mudde, R.F.; Noorman, H.J. Euler-Lagrange computational fluid dynamics for (bio)reactor scale down: An analysis of organism lifelines. Eng. Life Sci. 2016, 16, 652–663. [Google Scholar] [CrossRef] [PubMed]
- Zhang, W.; Ran, Q.; Zhao, L.; Wan, Y.; Ye, Q.; Tan, W.-S. Effective development of intensified perfusion culture based on shake tube semi-continuous bioreactors and optimal osmolarity constraint. Biochem. Eng. J. 2024, 206, 109309. [Google Scholar] [CrossRef]
- Zhu, L.; Monteil, D.T.; Wang, Y.; Song, B.; Hacker, D.L.; Wurm, M.J.; Li, X.; Wang, Z.; Wurm, F.M. Fluid dynamics of flow fields in a disposable 600-mL orbitally shaken bioreactor. Biochem. Eng. J. 2018, 129, 84–95. [Google Scholar] [CrossRef]
- Rahimzadeh, A.; Ein-Mozaffari, F.; Lohi, A. Analyzing of hydrodynamic stress and mass transfer requirements of a fermentation process carried out in a coaxial bioreactor: A scale-up study. Bioprocess Biosyst. Eng. 2024, 47, 633–649. [Google Scholar] [CrossRef]
- Grace, J.R.; Wairegi, T.; Nguyen, T.H. Shapes and Velocities of Single Drops and Bubbles Moving Freely Through Immiscible Liquids. Trans. Inst. Chem. Eng. 1976, 54, 167–173. [Google Scholar]
- Luo, H. Coalescence, Breakup and Liquid Circulation in Bubble Column Reactors; Technical University Library Of Norway: Trondheim, Norway, 1995. [Google Scholar]
- Laakkonen, M.; Moilanen, P.; Alopaeus, V.; Aittamaa, J. Modelling local bubble size distributions in agitated vessels. Chem. Eng. Sci. 2007, 62, 721–740. [Google Scholar] [CrossRef]
- Higbie, R.W.Z. The Rate of Absorption of a Pure Gas into a Still Liquid During Short Periods of Exposure. Trans. Am. Inst. Chem. Eng. 1934, 31, 365–389. [Google Scholar]
- Zhang, Z.; Thomas, C.R. Eddy Number Distribution in Isotropic Turbulence and Its Application for Estimating Mass Transfer Coefficients. Chem. Eng. Commun. 1995, 140, 207–217. [Google Scholar] [CrossRef]
- Walther, J.; McLarty, J.; Johnson, T. The effects of alternating tangential flow (ATF) residence time, hydrodynamic stress, and filtration flux on high-density perfusion cell culture. Biotechnol. Bioeng. 2019, 116, 320–332. [Google Scholar] [CrossRef]
- Zhang, W.; Ran, Q.; Zhao, L.; Ye, Q.; Tan, W.-S. Characterization of cellular responses and cell lysis to elevated hydrodynamic stress from benchtop perfusion bioreactors. Biotechnol. J. 2024, 19, 2400063. [Google Scholar] [CrossRef]
- Clincke, M.-F.; Mölleryd, C.; Zhang, Y.; Lindskog, E.; Walsh, K.; Chotteau, V. Very high density of CHO cells in perfusion by ATF or TFF in WAVE bioreactor™. Part I. Effect of the cell density on the process. Biotechnol. Prog. 2013, 29, 754–767. [Google Scholar] [CrossRef]
- Pan, X.; Dalm, C.; Wijffels, R.H.; Martens, D.E. Metabolic characterization of a CHO cell size increase phase in fed-batch cultures. Appl. Microbiol. Biotechnol. 2017, 101, 8101–8113. [Google Scholar] [CrossRef] [PubMed]
- Karst, D.J.; Steinhoff, R.F.; Kopp, M.R.G.; Serra, E.; Soos, M.; Zenobi, R.; Morbidelli, M. Intracellular CHO Cell Metabolite Profiling Reveals Steady-State Dependent Metabolic Fingerprints in Perfusion Culture. Biotechnol. Prog. 2017, 33, 879–890. [Google Scholar] [CrossRef]
- Papadopoulou, A.; Gillissen, J.J.; Wilson, H.J.; Tiwari, M.K.; Balabani, S. On the shear thinning of non-Brownian suspensions: Friction or adhesion? J. Non-Newton. Fluid Mech. 2020, 281, 104298. [Google Scholar] [CrossRef]
- Bui, A.V.; Nguyen, M.H. Prediction of viscosity of glucose and calcium chloride solutions. J. Food Eng. 2004, 62, 345–349. [Google Scholar] [CrossRef]
- Di Spirito, N.A.; Grizzuti, N.; Lutz-Bueno, V.; Urciuoli, G.; Auriemma, F.; Pasquino, R. Pluronic F68 Micelles as Carriers for an Anti-Inflammatory Drug: A Rheological and Scattering Investigation. Langmuir 2024, 40, 1544–1554. [Google Scholar] [CrossRef]
- Rahimzadeh, A.; Ein-Mozaffari, F.; Lohi, A. A Methodical Approach to Scaling Up an Aerated Coaxial Mixer Containing a Shear-Thinning Fluid: Effect of the Fluid Rheology. Ind. Eng. Chem. Res. 2023, 62, 8454–8476. [Google Scholar] [CrossRef]
- Godoy-Silva, R.; Mollet, M.; Chalmers, J.J. Evaluation of the effect of chronic hydrodynamical stresses on cultures of suspensed CHO-6E6 cells. Biotechnol. Bioeng. 2009, 102, 1119–1130. [Google Scholar] [CrossRef]
- Šrom, O.; Trávníková, V.; Wutz, J.; Kuschel, M.; Unsoeld, A.; Wucherpfennig, T.; Šoóš, M. Characterization of hydrodynamic stress in ambr250® bioreactor system and its impact on mammalian cell culture. Biochem. Eng. J. 2022, 177, 108240. [Google Scholar] [CrossRef]
- Rodriguez, G.; Micheletti, M.; Ducci, A. Macro- and micro-scale mixing in a shaken bioreactor for fluids of high viscosity. Chem. Eng. Res. Des. 2018, 132, 890–901. [Google Scholar] [CrossRef]
- Zheng, Z.; Wang, P.; He, N.; Si, Q.; Li, G.; Du, D.; Yuan, J. Effects of shear-thinning rheological properties on the energy loss characteristics of a biomass mixing vessel. Phys. Fluids 2023, 35, 073110. [Google Scholar] [CrossRef]
- Gao, Y.; Ray, S.; Dai, S.; Ivanov, A.R.; Abu-Absi, N.R.; Lewis, A.M.; Huang, Z.; Xing, Z.; Borys, M.C.; Li, Z.J.; et al. Combined metabolomics and proteomics reveals hypoxia as a cause of lower productivity on scale-up to a 5000-liter CHO bioprocess. Biotechnol. J. 2016, 11, 1190–1200. [Google Scholar] [CrossRef] [PubMed]
- Qian, Y.; Rehmann, M.S.; Qian, N.-X.; He, A.; Borys, M.C.; Kayne, P.S.; Li, Z.J. Hypoxia and transforming growth factor-beta1 pathway activation promote Chinese Hamster Ovary cell aggregation. Biotechnol. Bioeng. 2018, 115, 1051–1061. [Google Scholar] [CrossRef] [PubMed]
- Freiberger, F.; Budde, J.; Ateş, E.; Schlüter, M.; Pörtner, R.; Möller, J. New Insights from Locally Resolved Hydrodynamics in Stirred Cell Culture Reactors. Processes 2022, 10, 107. [Google Scholar] [CrossRef]
- Neuss, A.; Tomas Borges, J.S.; von Vegesack, N.; Büchs, J.; Magnus, J.B. Impact of hydromechanical stress on CHO cells’ metabolism and productivity: Insights from shake flask cultivations with online monitoring of the respiration activity. New Biotechnol. 2024, 84, 96–104. [Google Scholar] [CrossRef]


Disclaimer/Publisher’s Note: The statements, opinions and data contained in all publications are solely those of the individual author(s) and contributor(s) and not of MDPI and/or the editor(s). MDPI and/or the editor(s) disclaim responsibility for any injury to people or property resulting from any ideas, methods, instructions or products referred to in the content. |
© 2025 by the authors. Licensee MDPI, Basel, Switzerland. This article is an open access article distributed under the terms and conditions of the Creative Commons Attribution (CC BY) license (https://creativecommons.org/licenses/by/4.0/).