Abstract
The steady smoldering of rod-shaped fuels, a traditional Chinese disinfection and pest control technique, presents unique challenges in theoretical modeling. Conventional analytical approaches based on energy and mass conservation equations form an underdetermined system, failing to uniquely resolve three critical parameters: temperature field, char morphology, and propagation velocity. This study establishes a quantitative relationship between smoldering propagation velocity and smoke schlieren thickness through integrated experimental and theoretical methodologies. Systematic experiments were conducted on vertically oriented fuel rods (upward and downward configurations), measuring propagation velocity, char cone geometries, and schlieren photographs. By incorporating surface oxidation kinetics and oxygen transport mechanisms into a theoretical model, we revealed an inverse proportionality between propagation velocity and schlieren thickness, thereby introducing a third constraint to resolve the system. Comparative analysis demonstrated excellent agreement between calculated and measured velocities for downward smoldering, with deviations below 20% for biomass rods and 60% for commercial incense rods. Significant discrepancies in upward smoldering were attributed to smoke plume entrainment effects. This work enhances the mechanistic understanding of smoldering propagation dynamics in anisotropic fuel systems.
1. Introduction
The uses of biomass are extremely broad [1], extending beyond heating and power generation to commercial applications across various industries, including the production of bioethanol [2], biodiesel [3], and fume products. Incense burning is widely used in festive rituals across many Asian countries for its antibacterial and insect-repelling properties [4], as well as for disinfection [5] and calming effects [6]. While high doses of smoldering fumes may pose health risks to humans [7], small amounts of specific fumes have been shown to have therapeutic effects [8] or to eliminate harmful microorganisms [9]. They hold great potential in pest control and disinfection in vegetable greenhouses and livestock housing, odor removal and sanitation in public restrooms, and the preservation of ancient wooden structures.
The practice of incense burning is more extensively studied in Asia than in Europe and North America, with systematic investigations emerging primarily from Asian researchers. As early as 1966–1967, Japanese investigators Kinbara et al. [10,11] conducted pioneering studies on vertical downward smoldering propagation, hypothesizing that propagation velocity (v) increases with reaction heat (q). In 2007, Indian investigators Mukunda et al. [12] experimentally investigated the forward and reverse forced smoldering of 3 mm Buddhist incense rods under varying wind speeds. Using a one-dimensional cross-sectional oxidation front theory and energy balance analysis, they explained the observation that forward smoldering velocity increases monotonically with wind speed, while reverse smoldering velocity first increases and then decreases. More recently, Chinese scholars Lin et al. [13] performed systematic experiments on the smoldering propagation of cylindrical fuels with diameters of 1.5–5.0 mm and densities of 720–1100 kg/m3 under different air velocities. Their results revealed three distinct regimes of smoldering control: oxygen-controlled, thermally controlled, and reaction-controlled. Specifically, in the oxygen-controlled regime (0–10 m/s), propagation velocity scaled quadratically with wind speed, transitioning from mm/min to cm/min levels. Notably, all prior studies have attributed smoldering propagation primarily to heat transfer driven by reaction heat [14]. Moreover, the derived propagation velocity equations often involve experiment-dependent empirical parameters, limiting their generalizability to other materials.
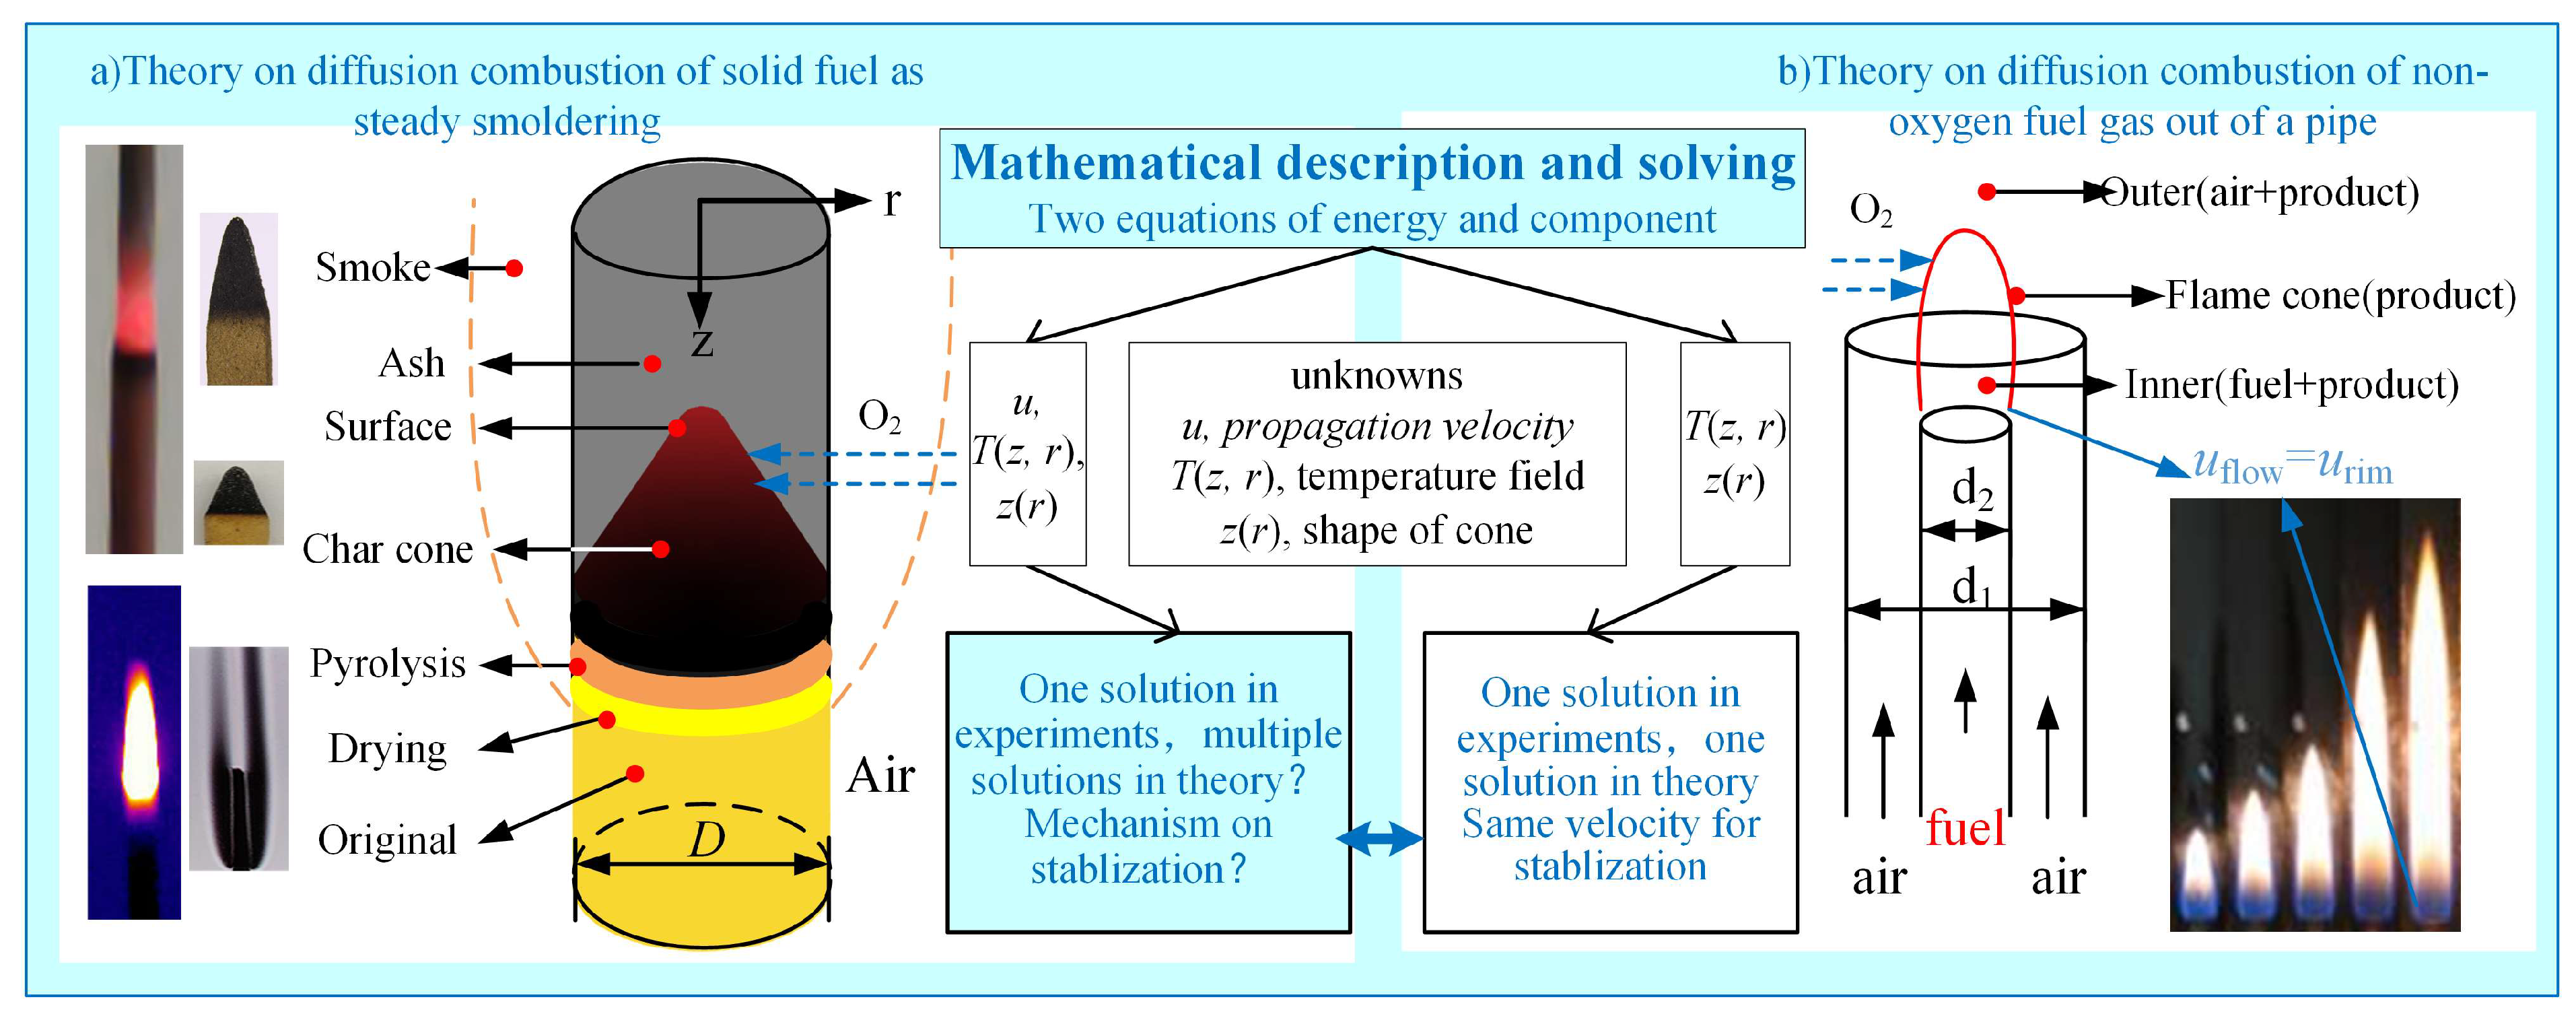
The smoldering of fuel rods belongs to solid-phase surface heterogeneous combustion processes, while gas diffusion combustion represents a gas-phase homogeneous flame reaction. Although these two combustion modes differ in phase state, they both fall within the category of diffusion combustion. Their common characteristics are schematically illustrated in Figure 1. In pipe gas diffusion combustion systems, the formation of the “flame cone” reaction zone is governed by fuel composition, nozzle diameter, and flow velocity. Analogously, the internal smoldering process of fuel rods also develops dynamically evolving “carbon cones”, whose geometric characteristics exhibit marked variations with changing combustion conditions [15]. Gas-phase diffusion combustion systems only require solving for two unknowns—temperature field distribution and flame cone morphology—through the coupling of energy and species conservation equations to obtain a unique steady-state solution. However, analyzing fuel rod smoldering necessitates simultaneously determining three independent variables: temperature field, carbon cone geometric parameters, and propagation velocity. The existing two-equation framework fails to achieve system closure, leading to fundamental challenges in theoretically predicting propagation velocity.

Figure 1.
Comparison of steady smoldering of fuel rod with diffusion flame of fuel gas flowing out from pipe.
During steady-state smoldering, fume morphology and surface temperature distribution can be non-intrusively and quantitatively characterized using shadowgraph imaging and infrared thermography [16]. To investigate the relationship between propagation velocity and fume layer thickness in rod-shaped fuels, and to elucidate the critical mechanisms governing smoldering propagation, this study systematically conducts experiments on smoldering of fuels with diverse types and orientations. A theoretical framework will subsequently be developed to establish a predictive model correlating smoldering propagation velocity with fume layer thickness.
2. Materials and Methods
2.1. Experiment
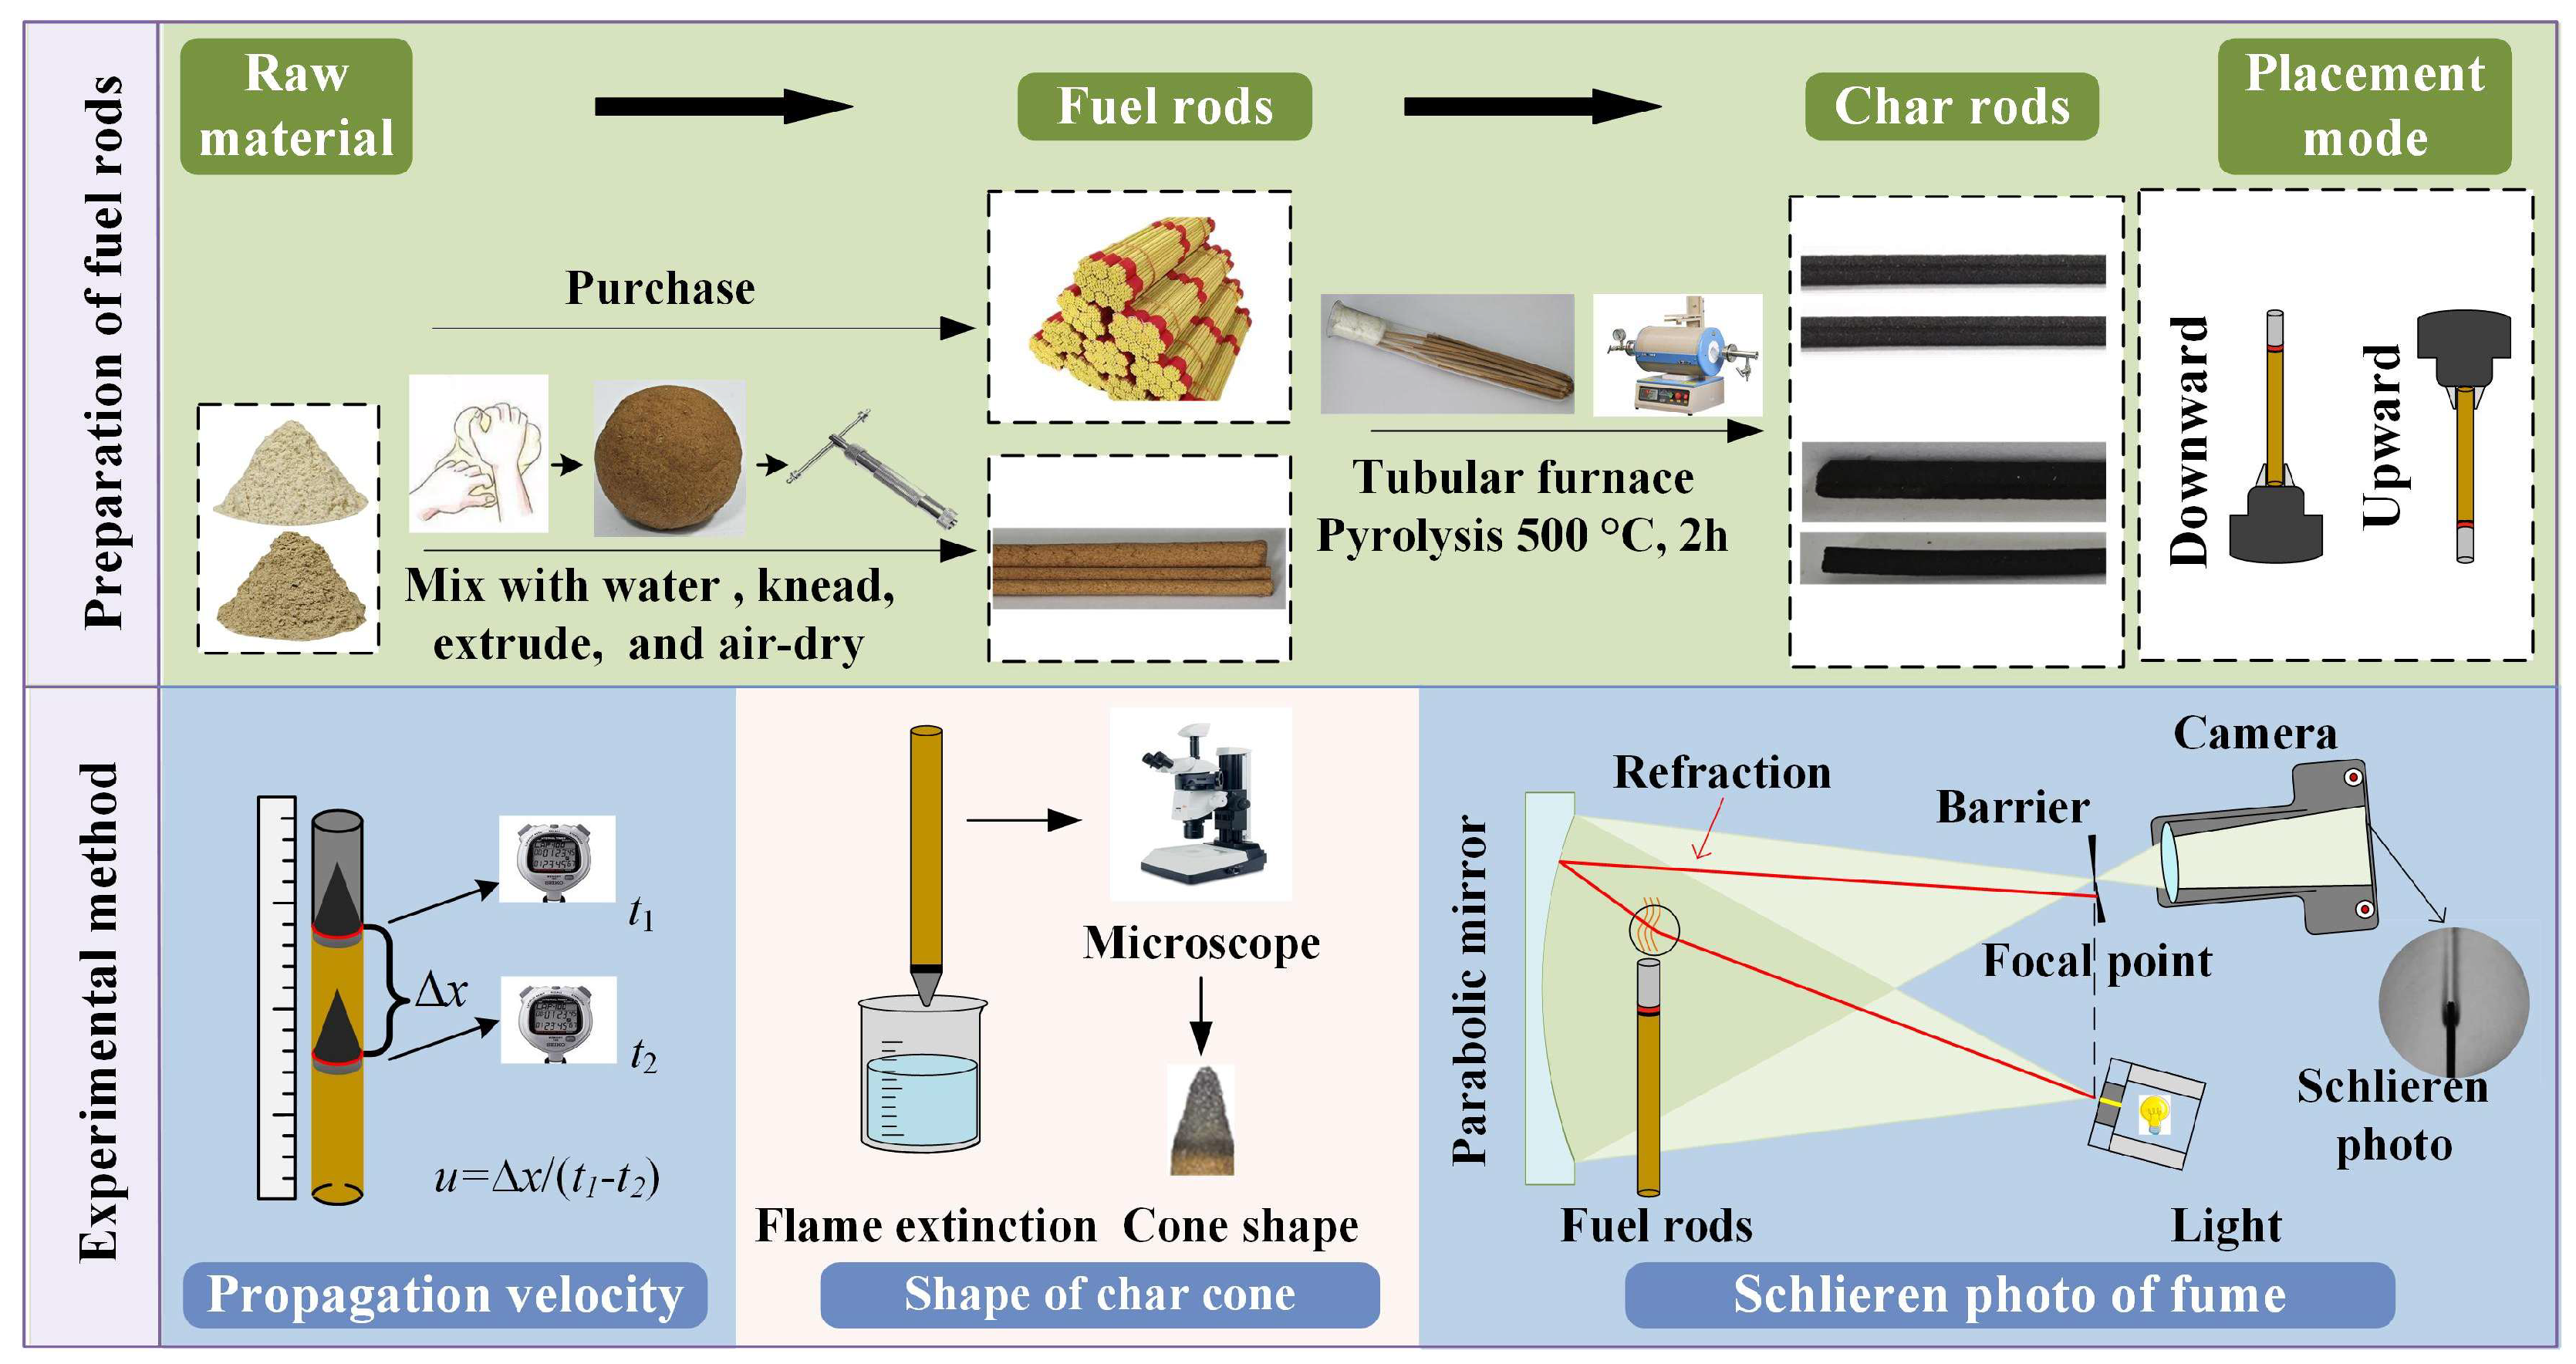
The experiments primarily focused on quantitatively measuring the steady-state smoldering characteristics of biomass and carbon rods under both vertically downward and upward orientations. Specifically, the propagation velocity, carbon cone geometry, and fume plume contour of steady-state smoldering were systematically investigated. The experimental setup and methodology are illustrated in Figure 2.
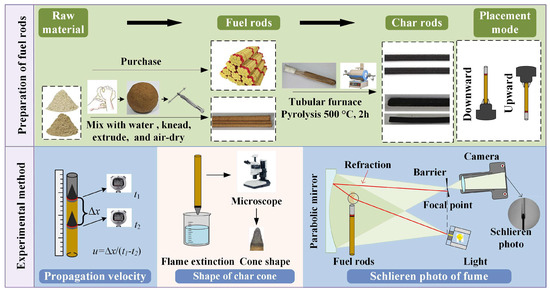
Figure 2.
Illustration of experimental procedure and setup.
2.1.1. Preparation of Biomass Rods and Char Rods
The biomass rods used in this study were categorized into commercially purchased and self-prepared samples. The purchased biomass rods were manufactured by Henghu Shandi Xiangye Co., Ltd. (Hebei Province, Hengshui City, China) and consisted of 4 mm diameter and 300 mm length incense rods classified into brown-scented (brown incense) and yellow-scented (yellow incense) types based on color.
Self-prepared biomass rods were produced using cedar wood powder (particle size < 0.15 mm) and pure elm bark powder, supplied by Taojiaxiang Agricultural Products Co., Ltd. (Baoding, Hebei, China). The preparation procedure involved the following steps: (1) mixing 80 g of cedar wood powder with 80 g of elm bark powder in a sealed bag and shaking thoroughly (>3 min); (2) transferring the mixture to a stainless-steel basin, adding 240 g water (mass ratio 1:1:3), and kneading into a dough; (3) extruding the dough through an incense rod mold to form rods with diameters of 3, 5, or 8 mm, with the length of the sample being approximately 120 mm; (4) low-temperature drying at 8 °C for 48 h in a refrigerator to prevent rapid moisture loss and dimensional distortion, followed by air-drying at room temperature.
Carbon rods were prepared via the pyrolysis of purchased and self-made biomass rods. Approximately 10 rods of biomass rods (either purchased or self-prepared) were loaded into a 300 mm × 40 mm quartz tube, sealed with asbestos at both ends, and heated in a tubular furnace at 10 °C/min from room temperature to 500 °C. The sample was maintained at 500 °C for 2 h before cooling to ambient temperature to obtain carbon rods.
Both purchased and self-prepared biomass rods, along with the resulting carbon rods, were subjected to proximate analysis (GB/T 28731-2012 [17]: Solid Biomass Fuel—Proximate analysis Analysis Methods) to determine proximate composition, bulk density, and dimensional properties. The physical property measurements and analytical results are summarized in Table 1.

Table 1.
Properties of material used in experiments.
2.1.2. Placement Methods and Environmental Conditions for Smoldering of Rod-Shaped Fuels
In the case of vertically oriented rod-shaped fuels undergoing downward or upward smoldering, gravitational and buoyancy forces act parallel to the rod axis, resulting in an axial symmetry of the problem. The physical quantities (e.g., temperature and flow velocity) vary only along the axial and radial directions, effectively reducing the problem to a two-dimensional domain. Consequently, the smoldering propagation can be simplified as one-dimensional movement of the carbon oxidation cone surface along the axial direction. Therefore, this study systematically investigates the upward and downward smoldering behavior of the tested fuel rods under controlled conditions. Each experiment was repeated three times under room-temperature and atmospheric-pressure environments to ensure data reproducibility.
2.1.3. Experimental Methods
Smoldering Propagation Velocity Measurement
The rod-shaped fuels were vertically fixed either upward or downward before ignition using clamping tools. Preliminary experiments indicated that all tested samples achieved steady-state smoldering after burning 5 cm. Once the smoldering front had migrated 5 cm into the steady state, the time taken for the reaction front to travel distance l was recorded. Propagation velocity v was subsequently calculated using the following formula:
where l is the distance traveled by the reaction front and t is the corresponding time duration.
Char Cone Shape Microscopic Photographs
Steady-state smoldering rods were rapidly inserted into water to achieve quenching, causing the ash column to disperse instantly. The residual tip of the rod represented the carbon cone formed during steady-state smoldering. The carbon cones were photographed sequentially under a Leica M135C microscope (Leica Microsystems GmbH, Munich, Germany). Adobe Photoshop was employed to replace the background of the carbon cone images with white, followed by cropping the images using drawing software to isolate the carbon cone regions for export.
Smoldering Fume Contour Schlieren Detection
Rod-shaped fuels with a total length of 100 mm were fixed in a test fixture and positioned within the shadowgraph system such that the distance from the concave mirror was maintained at 10 mm. After ignition, the smoldering front was allowed to migrate 5 cm until steady-state conditions were reached. Subsequently, fume plume contours were captured using a Canon EOS R6 camera. The obtained color images were processed using image processing software: median filtering (neighborhood block size [15, 15]) was applied to remove spatial noise, followed by desaturation to retain luminance information and convert the images to grayscale. The processed fume contour images were then imported into drawing software, where the fuel rod diameter in the fume profiles was aligned with that in the corresponding carbon cone images. Finally, the images were cropped by trimming 4 mm downward and 28.8 mm upward from the reaction front baseline, yielding the final fume contour profiles. All images were exported, and the maximum fume diameter was measured.
2.2. Theoretical Analysis
2.2.1. Mathematical Description of Carbon Oxidation Spread Rate on Fuel Rod Surface
To analyze the relationship between fume morphology and carbon oxidation propagation velocity, the region shown in Figure 3 was selected for investigation. Under steady-state smoldering conditions, the propagation velocity of the rod-shaped fuel is consistent with the outward carbon oxidation progression. The control volume was defined within the peripheral carbon oxidation zone of the smoldering front, where oxygen diffuses from the flue gas to the carbon surface without significant infiltration or diffusion through the ash layer.
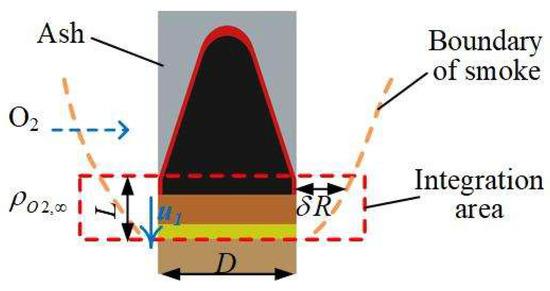
Figure 3.
Propagation velocity of char oxidation at outer surface of fuel rod.
The propagation velocity of outward carbon oxidation on the rod-shaped fuel surface is correlated with the mass transport flux of oxygen through the fume layer to the outer surface and the chemical kinetics of carbon oxidation. The oxygen flux from the environment to the carbon oxidation surface is governed by gas diffusion [16] and temperature effects (Arrhenius equation-derived), which can be expressed by the following equation:
where O2,surface is the mass transport flux of oxygen to the carbon oxidation surface (kg·m−3·s−1), ρO2,∞ is the ambient oxygen density (kg·m−3), δRox is the fume layer thickness (m), DO2 is the oxygen diffusion coefficient in the fume layer (m2·s−1), A is the pre-exponential factor (m·s−1), E is the activation energy per unit area (J·mol−1·m−2), T is the carbon oxidation temperature (K), R is the fuel rod radius (m), and L is the control volume height (m).
The carbon (mc,surface kg·m−1) on the outer surface of the biomass rods is given by
where ρC is the carbon density of in the fuel rod after pyrolysis (kg·m−3).
Based on reaction Equation (4) (carbon–oxygen reaction), the mass fraction of oxygen required (γ) for the complete oxidation of a unit mass of char can be calculated, as explicitly presented in Equation (5).
Based on the principle of mass conservation, the propagation velocity u1 is
Under smoldering conditions where oxygen transport dominates, the diffusion velocity u1 is determined by the oxygen mass balance equation and can be expressed as
2.2.2. Determination of Fume Layer Thickness δRox on Rod’s Outer Surface
The determination of the gas-phase product layer thickness δRox at the carbon oxidation surface is critical for accurately calculating the propagation velocity u1. During smoldering, the spatial distribution of the oxidation interface exhibits significant variation depending on the orientation of the fuel elements. Specifically, four distinct configurations were experimentally observed: (1) vertical downward orientation of carbon rods, (2) vertical downward orientation of biomass rods, (3) vertical upward orientation of carbon rods, and (4) vertical upward orientation of biomass rods. These configurations are schematically illustrated in Figure 4, demonstrating how the placement angle influences the location of the active oxidation zone.
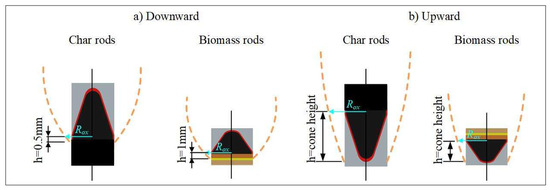
Figure 4.
Thickness of fume at position of char oxidation of outer surface.
Figure 4 shows that during vertically downward smoldering, the carbon oxidation surface exhibits significant spatial correlation with the lower boundary of the steady-state gas-phase product layer. Notably, carbon rods differ from biomass rods in that their oxidation surfaces are closer to this boundary due to the absence of pronounced pyrolysis zones. The experimental procedure involves the following steps: First, the position of the gas-phase product layer’s lower boundary is experimentally determined. Subsequently, a vertical upward differential displacement is applied from this baseline (1 mm for biomass rods and 0.5 mm for carbon rods) to locate the carbon oxidation surface. Finally, fume layer thickness under downward smoldering conditions is measured at this defined surface.
For upward smoldering, the fume originates from the cone tip, with the oxidation surface near the base of the carbon cone. In this case, the lower edge of the fume layer is identified, and the oxidation surface is defined as the vertical distance from this edge to the apex of the cone. Fume layer thickness under upward smoldering conditions is then measured at this position.
When determining the fume thickness, radius Rox of the fume layer at the outer surface position of the carbon oxidation is first measured, and Equation (8) is used to calculate the fume thickness δRox outside the rod
2.2.3. Oxygen Diffusion Coefficient in Fume Layer and Parameters Involved in Calculation
The diffusion coefficient of oxygen from the ambient environment to the outer surface of the carbon oxidation is related to the fume temperature, as shown in Equation (9).
where DO2 is the oxygen diffusion coefficient in the fume (m2 s−1); T is the temperature of the rod-shaped fuel fume layer (K); T∞ is the ambient temperature (K); and DO2,∞ is the oxygen diffusion coefficient in the ambient environment.
The temperature distribution within the fume layer exhibits gradient characteristics, which necessitates a simplified computational approach for analytical purposes. In this study, the temperature of the rod-shaped fuel fume layer was approximated by taking the arithmetic mean of the pyrolysis surface temperature and ambient temperature. Experimental measurements of the pyrolysis surface temperatures were conducted using an infrared camera during the smoldering process of the fuel rods [16]. The maximum temperature was observed at the carbon oxidation region, with detailed temperature values provided in Table 2. The calculation involves environmental parameters including oxygen diffusion coefficient (DO2,∞), ambient oxygen density (ρO2,∞), equivalence ratio (γ), and carbon density (ρC), which are also enumerated in Table 2.
Table 2.
Parameters involved in calculation.
3. Results and Discussion
3.1. Analysis of Experimental Results
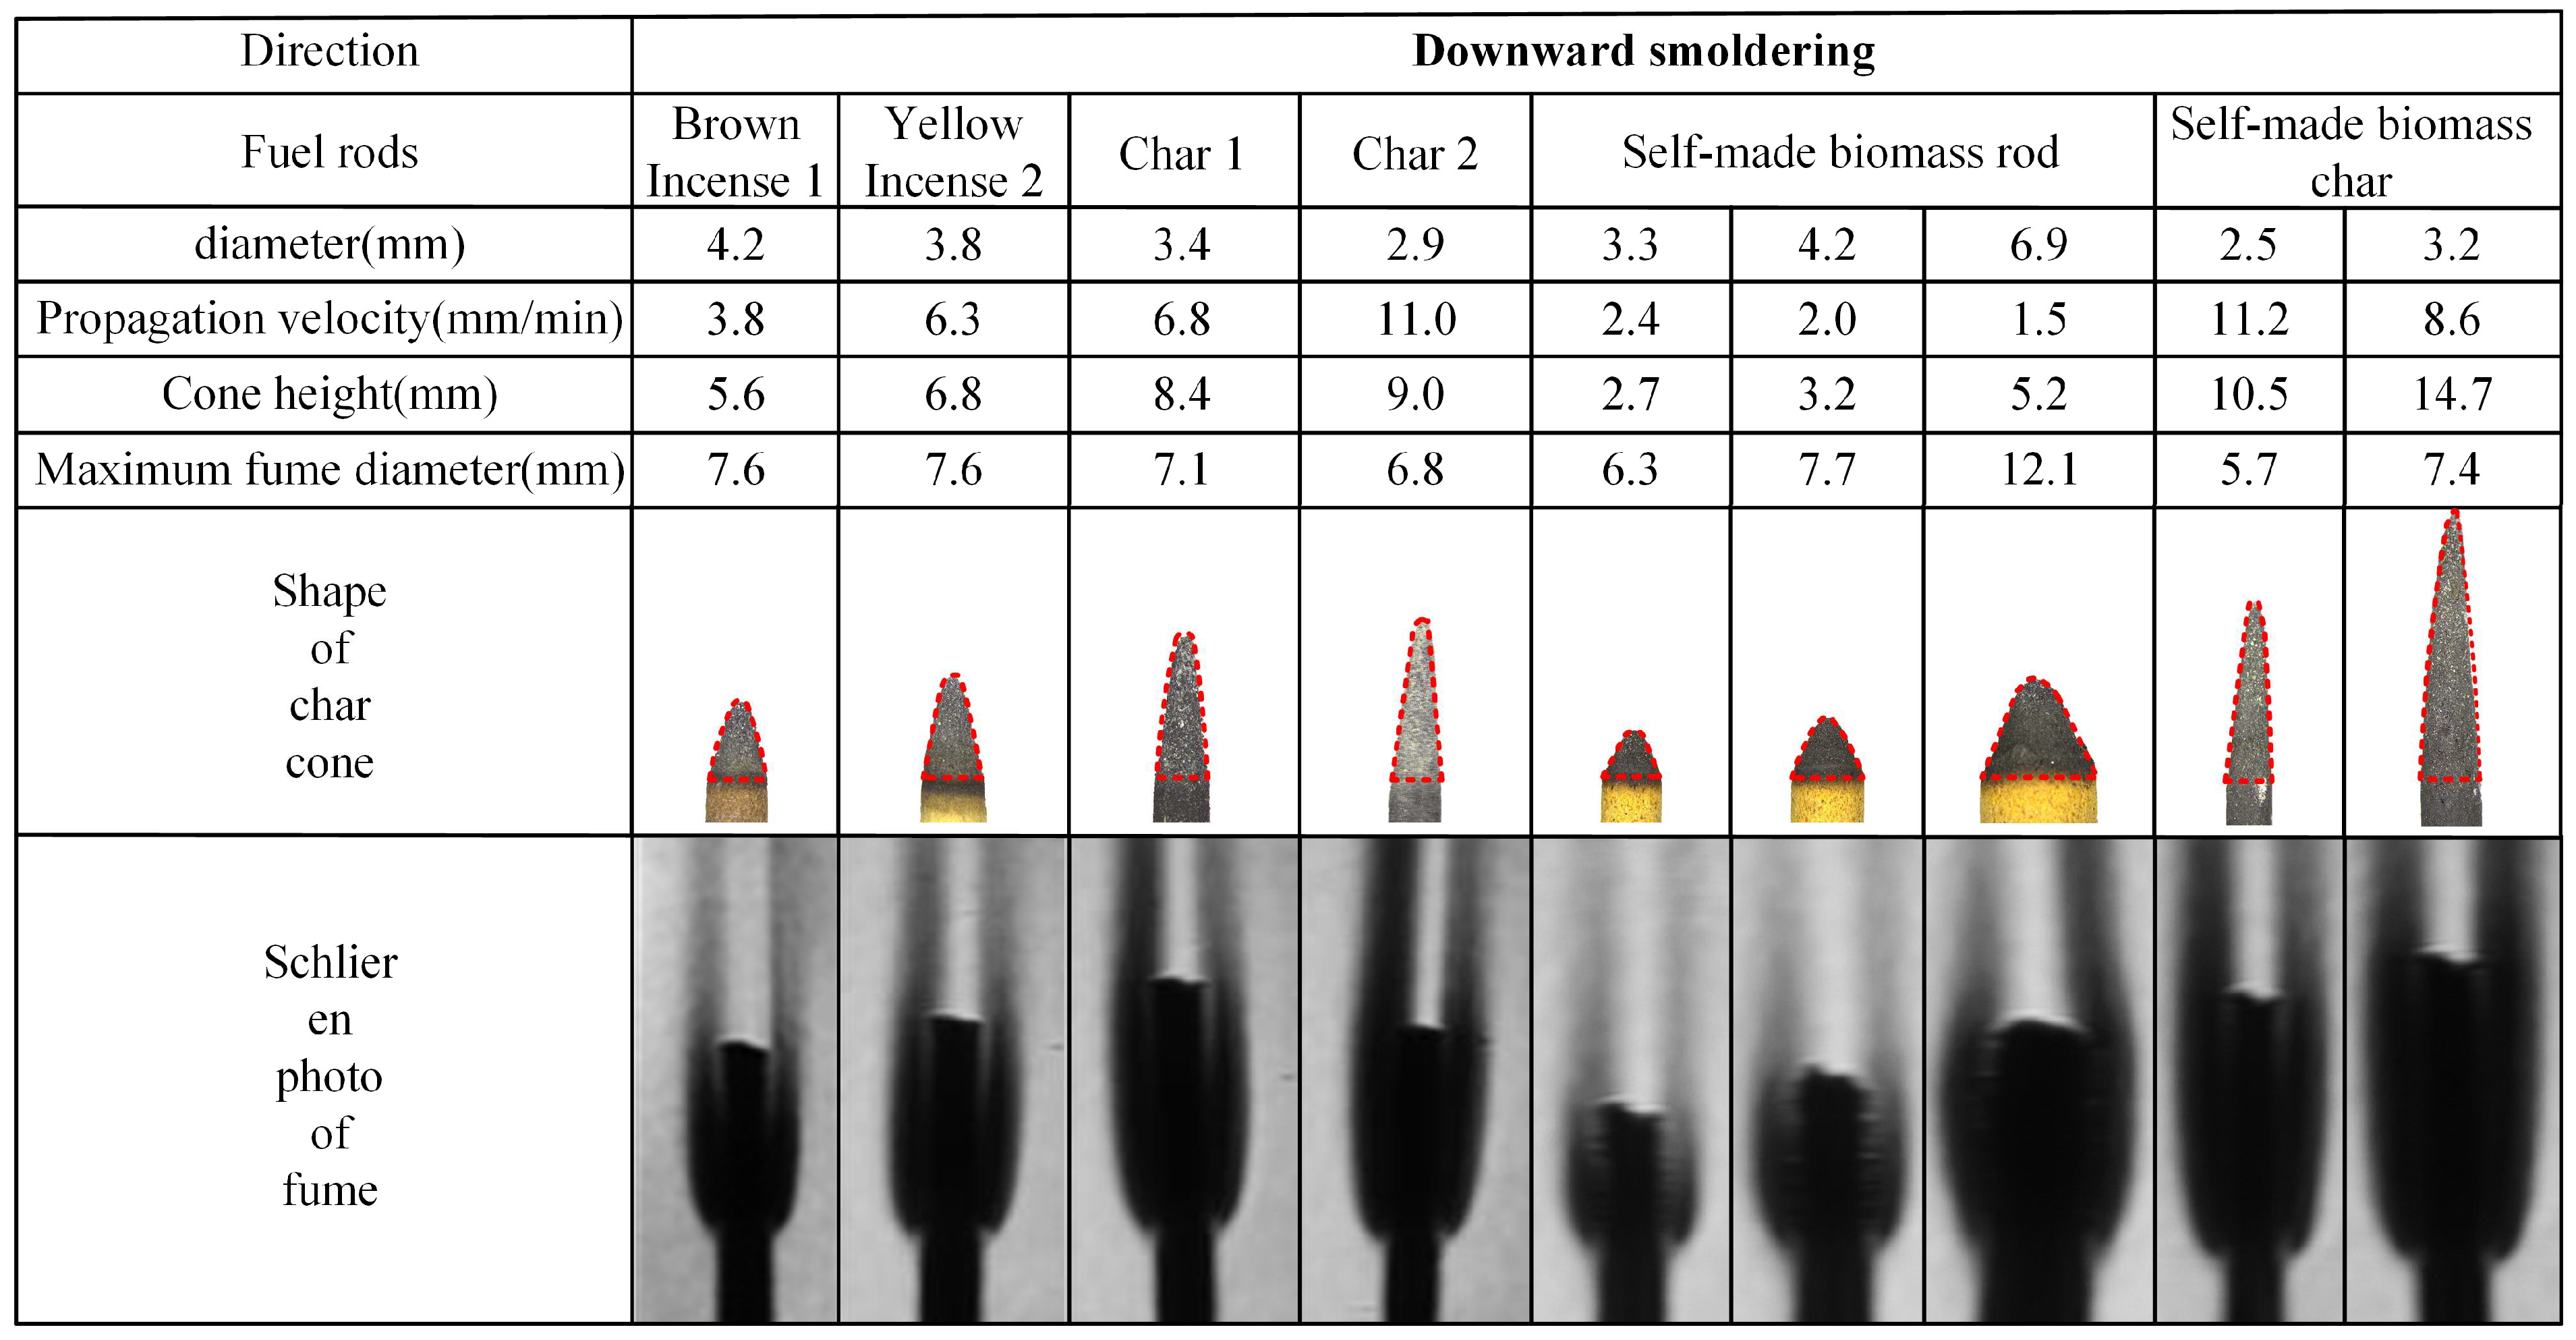
The experimental results of rod-shaped fuel smoldering characteristics are presented in Figure 5 and Figure 6. The analysis reveals that, with the exception of the self-manufactured biomass rods with 6.9 mm diameter (which failed to form a stable char cone due to cracking during smoldering and thus are not included in the tables), all other tested fuel rods achieved stable smoldering conditions. Stable char cones and corresponding fume shadowgraph images were successfully formed under these conditions. The char cone sections in the tables are highlighted using dashed lines for visual emphasis.
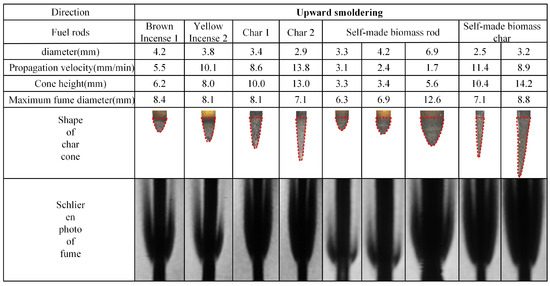
Figure 5.
Photos of char cone and fume schlieren of downward smoldering fuel rods.
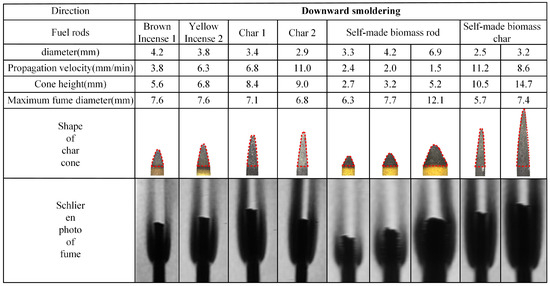
Figure 6.
Photos of char cone and fume schlieren of upward smoldering fuel rods.
3.1.1. Comparison of Smoldering Propagation Speed of Fuel Rods
The propagation velocity data presented in Figure 5 and Figure 6 reveal two distinct ranges, 1.5–10.1 mm/min for upward smoldering and 6.8–13.8 mm/min for downward smoldering, both maintaining consistent magnitude with values in the literature [13]. Analyzing the placement orientation, upward smoldering generally exhibits higher propagation velocity compared to downward smoldering. Specifically, commercial biomass rods and their char cones demonstrate 1.3–1.5 times higher propagation velocity in the upward direction, while self-manufactured counterparts show an increase of 1.0–1.2 times.
Regarding material comparison, commercial biomass rods exhibit greater propagation velocities than self-manufactured counterparts, and char cones consistently outperform their original rods in both directions. For downward smoldering, brown charcoal rods display a velocity increase of 1.5 times compared to their original rods, while yellow incense charcoal rods show an acceleration of 1.3 times. Self-manufactured char cones achieve a remarkable enhancement of 4.4 times, aligning with findings in the literature [16]. In upward smoldering scenarios, brown and yellow incense char cones exhibit increases of 1.6 times and 1.3 times, respectively, while self-manufactured char cones demonstrate a significant acceleration of 3.7 times.
3.1.2. Comparison of Char Cone Heights of Fuel Rods
The morphological data of char cones presented in Figure 5 and Figure 6 reveal that the cone height of rod-shaped fuels varies between 0.5 and 5 times the corresponding diameter. Analyzing the placement orientation, upward smoldering cones generally exhibit slightly greater heights compared to their downward counterparts. Material-specific analysis demonstrates that char cones produced from charred rods consistently surpass those generated from biomass materials. Specifically, commercial char cones achieve an approximately 2-fold height increase relative to their original rods, while self-manufactured biomass char cones display a remarkable 4-fold elevation compared to their respective feedstocks.
3.1.3. Comparison of Fume Contours of Fuel Rods
The maximum fume diameter data presented in Figure 5 and Figure 6, combined with fume shadowgraph images, reveal that both biomass rods and their char cones exhibit fume diameters ranging from 2 to 4 times the original rod diameter. Analyzing the placement orientation, the maximum fume diameter generated during upward smoldering is 1.0–1.2 times that of downward smoldering. Notably, the bottom portion of upward smoldering exhibits significantly reduced fume thickness compared to downward conditions. The observed sharper fume profiles result from the inverted char cone formation at the base of upward smoldering, which creates lower carbon oxidation rates and consequently reduced fume generation within the rod.
Comparative material analysis demonstrates that commercial biomass rods produce distinctly darker fume shadowgraph images compared to self-manufactured counterparts. This phenomenon arises from the presence of inherent oxidizing agents in commercial products, which promote more complete combustion processes and result in higher fume concentrations compared to self-manufactured biomass rods.
3.2. Comparison of Smoldering Propagation Speed Between Experiment and Calculated Values
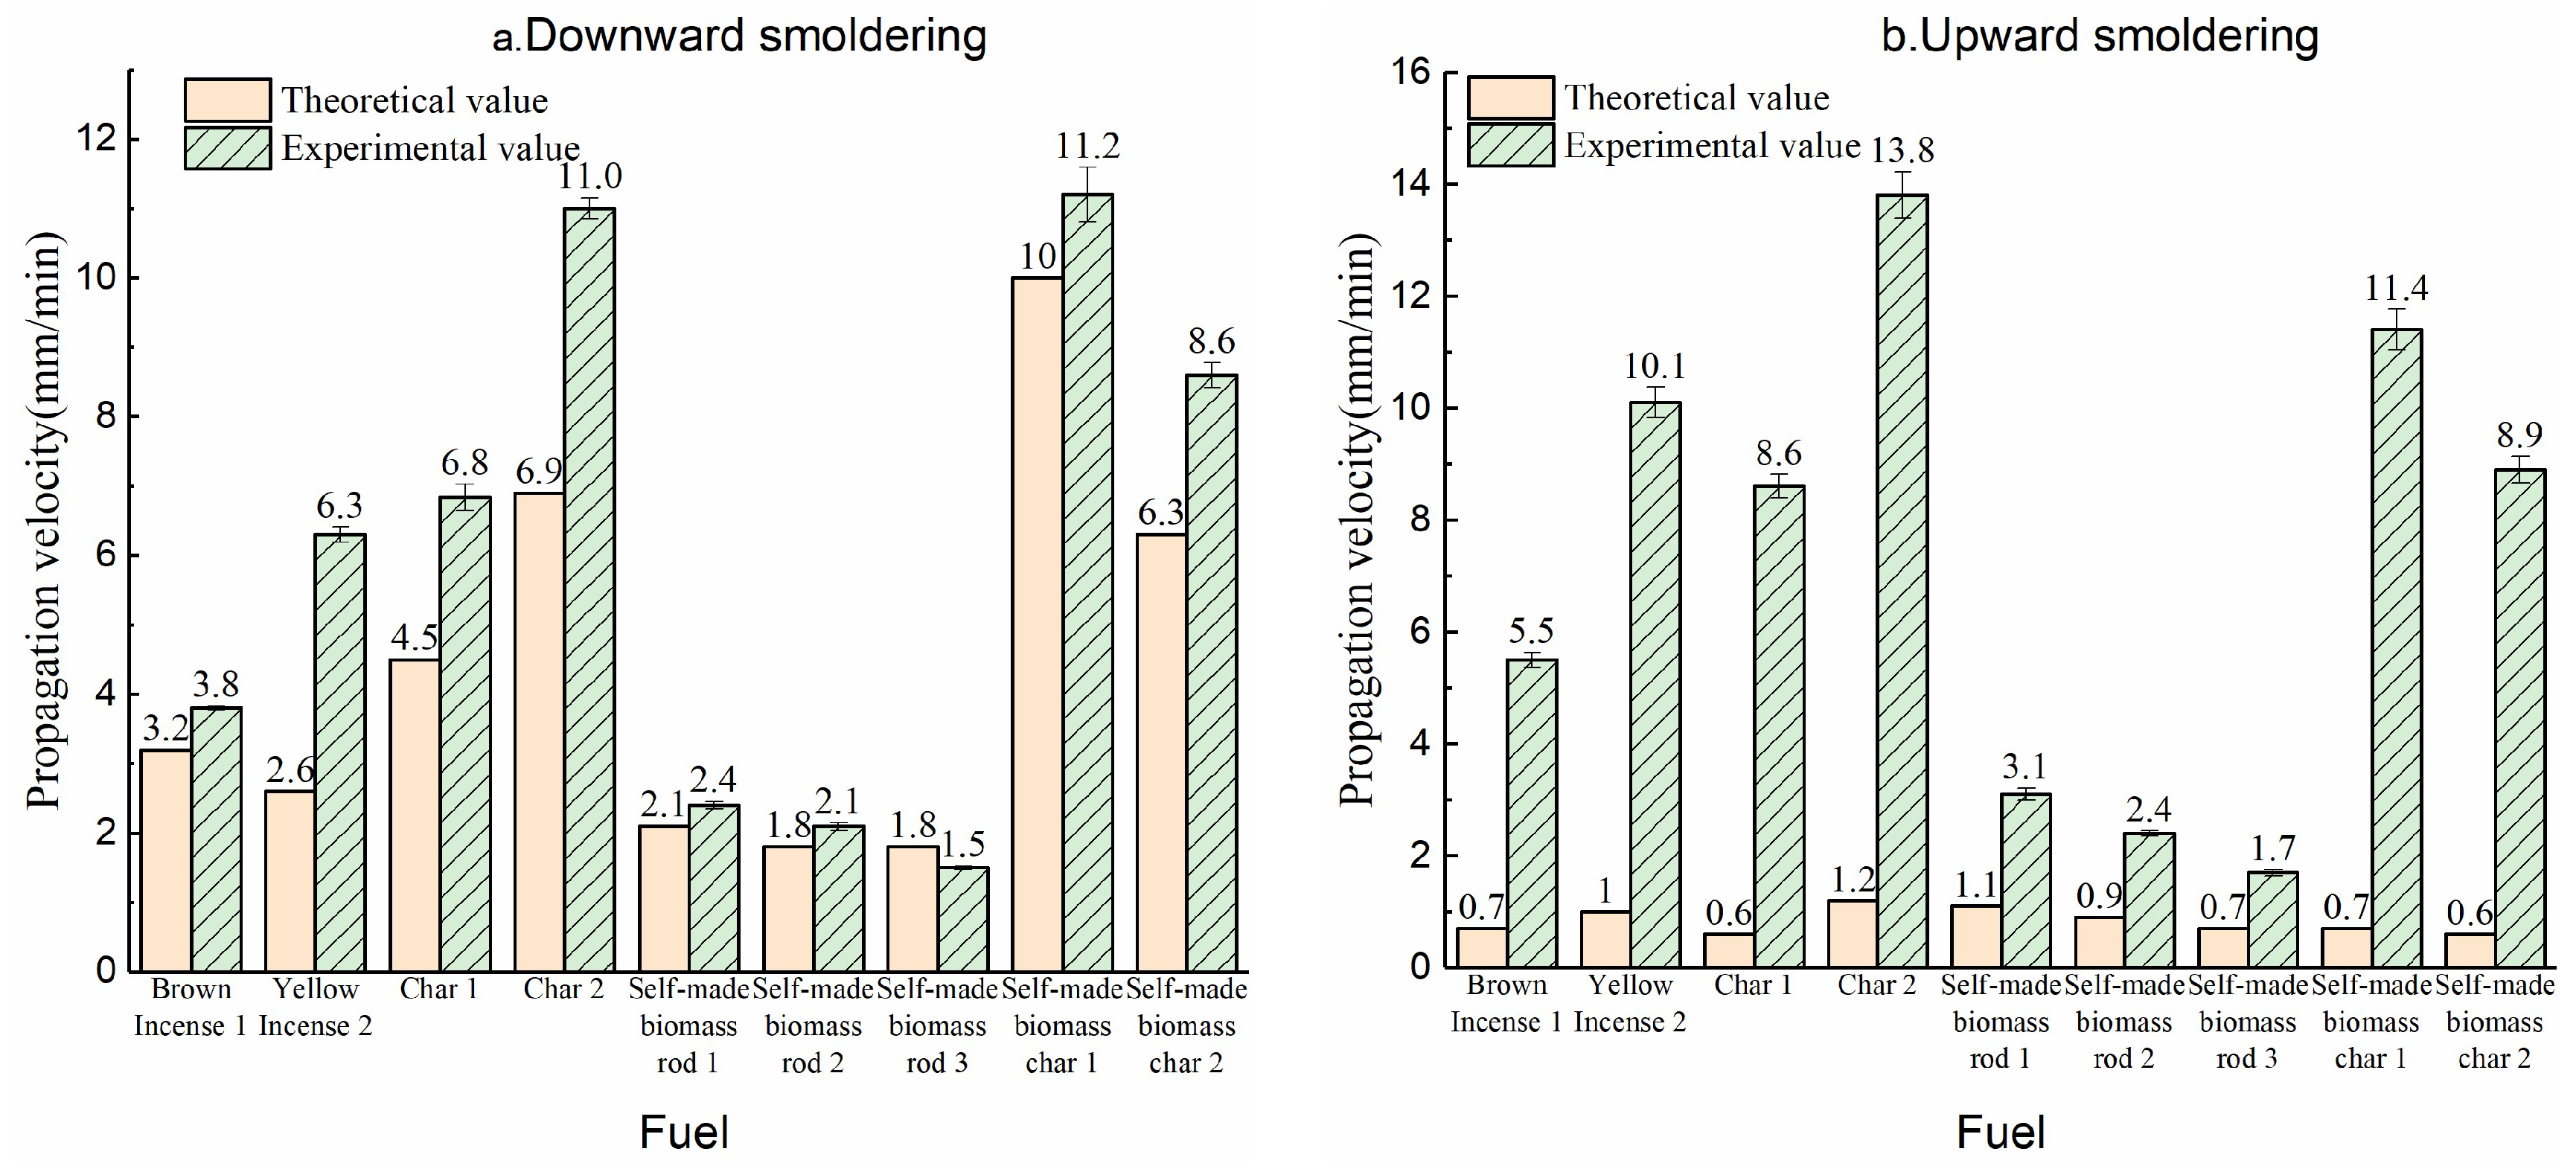
The comparison of experimental and calculated propagation velocities for rod-shaped fuels is shown in Figure 7. The left panel presents the downward smoldering velocity comparison, while the right panel displays the upward smoldering velocity contrast. The results clearly indicate that most calculated values generally fall within the same order of magnitude as the experimental data, with notable agreement observed in the downward smoldering process. Notably, the calculated propagation velocity for downward smoldering exhibit excellent consistency with experimental measurements.
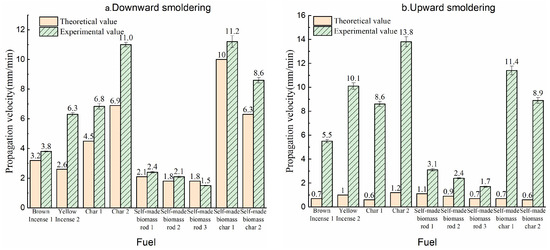
Figure 7.
Comparison of propagation velocity between experimental and theoretical analysis ((a) downward smoldering; (b) upward smoldering).
3.2.1. Comparison of Downward Smoldering Propagation Speed Between Experiment and Calculated Values
The left panel of Figure 7 demonstrates that for downward smoldering, the calculated propagation velocities exhibit good agreement with experimental measurements. Specifically, the error margins for both biomass rods and char cones remain below 20%, while those for commercial products are within 60%. The superior agreement observed for commercial biomass rods can be attributed to their formulation containing inherent oxidizing agents, which reduces oxygen consumption during combustion and results in lower equivalence ratio (γ) values in the actual reaction process (Equation (5)). The discrepancy between calculated and experimental velocities primarily stems from the adoption of larger relative values in the computational model, leading to underestimated propagation speeds. Conversely, self-manufactured biomass rods, characterized by well-defined raw material compositions and experimentally determined parameters, demonstrate exceptional numerical and experimental consistency.
3.2.2. Comparison of Upward Smoldering Propagation Speed Between Experiment and Calculated Values
The right panel of Figure 7 reveals that upward smoldering exhibits significantly lower calculated velocities compared to experimental measurements. This discrepancy can be attributed to both experimental and computational factors. From an experimental perspective, the char oxidation surface during upward smoldering is positioned farther from the fume base, leading to a laminar-to-turbulent flow transition in the fume plume. In turbulent flow regimes, oxygen transport to the char surface occurs through turbulent entrainment rather than linear diffusion, which substantially accelerates the smoldering propagation velocity.
In computational modeling, the larger δRox values observed during upward smoldering directly impact oxygen transport dynamics. The increased δRox thicknesses reduce the effective oxygen flux to the char oxidation surface through the computational framework, resulting in underestimated propagation speeds. Additionally, the fume stream preheats the fuel rod during upward smoldering, which enhances smoldering progression.
This study focuses on establishing the steady-state relationship between smoldering propagation velocity and fume layer thickness, with oxygen diffusion identified as the primary controlling factor. Temperature effects will be systematically investigated in follow-up studies.
3.2.3. Analysis of Control Mechanisms for Smoldering Propagation
The present computational results, particularly for downward smoldering, demonstrate excellent agreement with experimental measurements. This methodology surpasses previous studies [9] that merely analyzed the empirical correlation between propagation velocity (v) and reaction heat release rate (q) through the relation {v2 = (4k/c2ρ2)(p/S){[q/(Ti-Ta)] − h}}, relying on data fitting for parameter determination. Similarly, our approach outperforms the study [12], which employed Darcy’s law (forwards) and boundary layer diffusion (reverse) to establish velocity relationships within conical porous carbons, presenting significant computational complexity.
Through systematic analysis of experimental data and numerical–experimental comparisons, this research establishes that the propagation speed of smoldering is fundamentally governed by the oxygen transport rate to the outer surface of the rod via diffusion and mixing mechanisms, and its consumption rate through char oxidation at the exterior surface. This mass balance condition directly determines the smoldering propagation velocity.
4. Conclusions
To investigate the relationship between the steady-state smoldering propagation velocity and fume shadowgraph thickness of rod-shaped fuels, systematic experiments were conducted on different types of fuels under both upward and downward orientations. These experiments measured propagation velocity, char cone morphology, and steady-state fume patterns. Based on the principle that oxygen diffusion governs the external surface oxidation rate, a theoretical model was developed to establish the correlation between smoldering velocity and fume layer thickness. Numerical–experimental comparisons revealed that for downward smoldering, both calculated and experimental velocities show excellent agreement: errors remained below 20% for biomass rods and char cones, while those for commercial products were within 60%. In upward smoldering, the oxygen enrichment at the char oxidation site due to fume mixing resulted in significantly lower calculated velocities compared to experiments. This research confirms that the oxygen transport rate to the rod’s exterior surface and its consumption rate through char oxidation constitute the critical factor governing smoldering propagation kinetics.
Author Contributions
Conceptualization, F.H.; methodology, G.Y. and X.C.; validation, G.Y., Y.Z. and J.Z. All authors have read and agreed to the published version of the manuscript.
Funding
This work is supported by the Sino-German Mobility Programme (M-0183) and the Natural Science Foundation of Shandong Province (ZR2022ME038).
Data Availability Statement
All data are provided in the article.
Conflicts of Interest
The authors declare no conflicts of interest.
References
- Mustafa, A.; Faisal, S.; Singh, J.; Rezki, B.; Kumar, K.; Moholkar, V.S.; Kutlu, O.; Aboulmagd, A.; Thabet, H.K.; El-Bahy, Z.M.; et al. Converting lignocellulosic biomass into valuable end products for decentralized energy solutions: A comprehensive overview. Sustain. Energy Technol. Assess. 2024, 72, 104065. [Google Scholar] [CrossRef]
- Yousuf, A.; Pirozzi, D.; Sannino, F. Fundamentals of lignocellulosic biomass. In Lignocellulosic Biomass to Liquid Biofuels; Academic Press: Cambridge, MA, USA, 2020; pp. 1–15. [Google Scholar] [CrossRef]
- Escalante, J.; Chen, W.H.; Tabatabaei, M.; Hoang, A.T.; Kwon, E.E.; Lin, K.Y.; Saravanakumar, A. Pyrolysis of lignocellulosic, algal, plastic, and other biomass wastes for biofuel production and circular bioeconomy: A review of thermogravimetric analysis (TGA) approach. Renew. Sustain. Energy Rev. 2022, 169, 112914. [Google Scholar] [CrossRef]
- Vivekanandhan, P.; Senthil-Nathan, S.; Shivakumar, M.S. Larvicidal, pupicidal and adult smoke toxic effects of Acanthospermum hispidum (DC) leaf crude extracts against mosquito vectors. Physiol. Mol. Plant Pathol. 2018, 101, 156–162. [Google Scholar] [CrossRef]
- Tayel, A.A. Innovative system using smoke from smoldered plant materials to control Aspergillus flavus on stored grain. Int. Biodeterior. Biodegrad. 2010, 64, 114–118. [Google Scholar] [CrossRef]
- Li, J.; Xu, H.; Song, D.; Wang, Z.; Zhang, B.; Feng, R.; Gu, Y.; Jiang, Z.; Ji, X.; Liu, S.; et al. Emission characteristics and assessment of potential health risks on PM2.5-bound organics from incense burning. Atmos. Pollut. Res. 2022, 13, 101326. [Google Scholar] [CrossRef]
- Liang, Z.; Chen, Y.; Lin, S.; Huang, X. Emission Characteristics of Smoldering Combustion of Peat. J. Combust. Sci. Technol. 2023, 29, 429–434. (In Chinese) [Google Scholar]
- Liu, M.; Zhou, H. Comparison of Chemical Constituents Between Essential Oil and Smog from Artemisia argyi. J. South China Univ. Technol. (Nat. Sci. Ed.) 2012, 40, 30–34. (In Chinese) [Google Scholar]
- Hasheminia, S.; Sho’ouri, N. The effect of musk incense rod aroma inhalation on different features of electroencephalogram signals and working memory for use in neurofeedback training. Biomed. Signal Process. Control 2023, 83, 104658. [Google Scholar] [CrossRef]
- Kinbara, T.; Endo, H.; Sega, S. Combustion propagation through solid materials I—Downward propagation of smouldering along a thin vertical sheet of paper. Combust. Flame 1966, 10, 29–36. [Google Scholar] [CrossRef]
- Kinbara, T.; Endo, H.; Sega, S. Downward propagation of smoldering combustion through solid materials. Symp. (Int.) Combust. 1967, 11, 525–531. [Google Scholar] [CrossRef]
- Mukunda, H.S.; Basani, J.; Shravan, H.M.; Philip, B. Smoldering Combustion of “Incense” Rods—Experiments and Modeling. Combust. Sci. Technol. 2007, 179, 1113–1129. [Google Scholar] [CrossRef]
- Lin, S.; Chow, T.H.; Huang, X. Smoldering propagation and blow-off on consolidated fuel under external airflow. Combust. Flame 2021, 234, 111685. [Google Scholar] [CrossRef]
- Zhou, Y.; Zhou, P.; Bu, R.; Zhang, X.; Chu, T.; Wang, Z. Horizontal flame spread behavior of densified wood: Effect of structural characteristics. Fuel 2024, 362, 130687. [Google Scholar] [CrossRef]
- Yan, S.; He, F.; Cai, J.; Sun, P.; Zhang, Y.; Behrendt, F.; Dieguez-Alonso, A. Characteristics of Char Cone Covered by Ash in Steady Smoldering of a Char Rod. J. Combust. Sci. Technol. 2022, 196, 2697–2706. [Google Scholar] [CrossRef]
- Zhao, W.; Zhang, Y.; Yu, G.; Behrendt, F.; He, F. Comparison on the steady smoldering characteristics of char and biomass rods. Trans. Chin. Soc. Agric. Eng. 2023, 39, 215–221. (In Chinese) [Google Scholar]
- GB/T 28731-2012; Proximate Analysis of Solid Biofuels. The Standardization Administration of China: Beijing, China, 2012.


Disclaimer/Publisher’s Note: The statements, opinions and data contained in all publications are solely those of the individual author(s) and contributor(s) and not of MDPI and/or the editor(s). MDPI and/or the editor(s) disclaim responsibility for any injury to people or property resulting from any ideas, methods, instructions or products referred to in the content. |
© 2025 by the authors. Licensee MDPI, Basel, Switzerland. This article is an open access article distributed under the terms and conditions of the Creative Commons Attribution (CC BY) license (https://creativecommons.org/licenses/by/4.0/).