

Optimal Sizing and Techno-Economic Feasibility of Hybrid Microgrid

 ,
,  ,
,  ,
,  , and
, and
Abstract
1. Introduction
- A design that combines PV–battery–hydrogen with grid connection to meet both short-term (battery) and long-term (hydrogen) storage needs.
- Dual-objective optimization that combines the minimization of the levelized cost of electricity (LCOE) with the restriction of the loss of power supply potential (LPSP) to balance cost and reliability.
- Bidirectional grid modeling to explicitly consider import costs (α) and export revenues (β).
- A replicable model for MENA universities leveraging Egypt solar potential and green hydrogen ambitions.
2. Literature Review
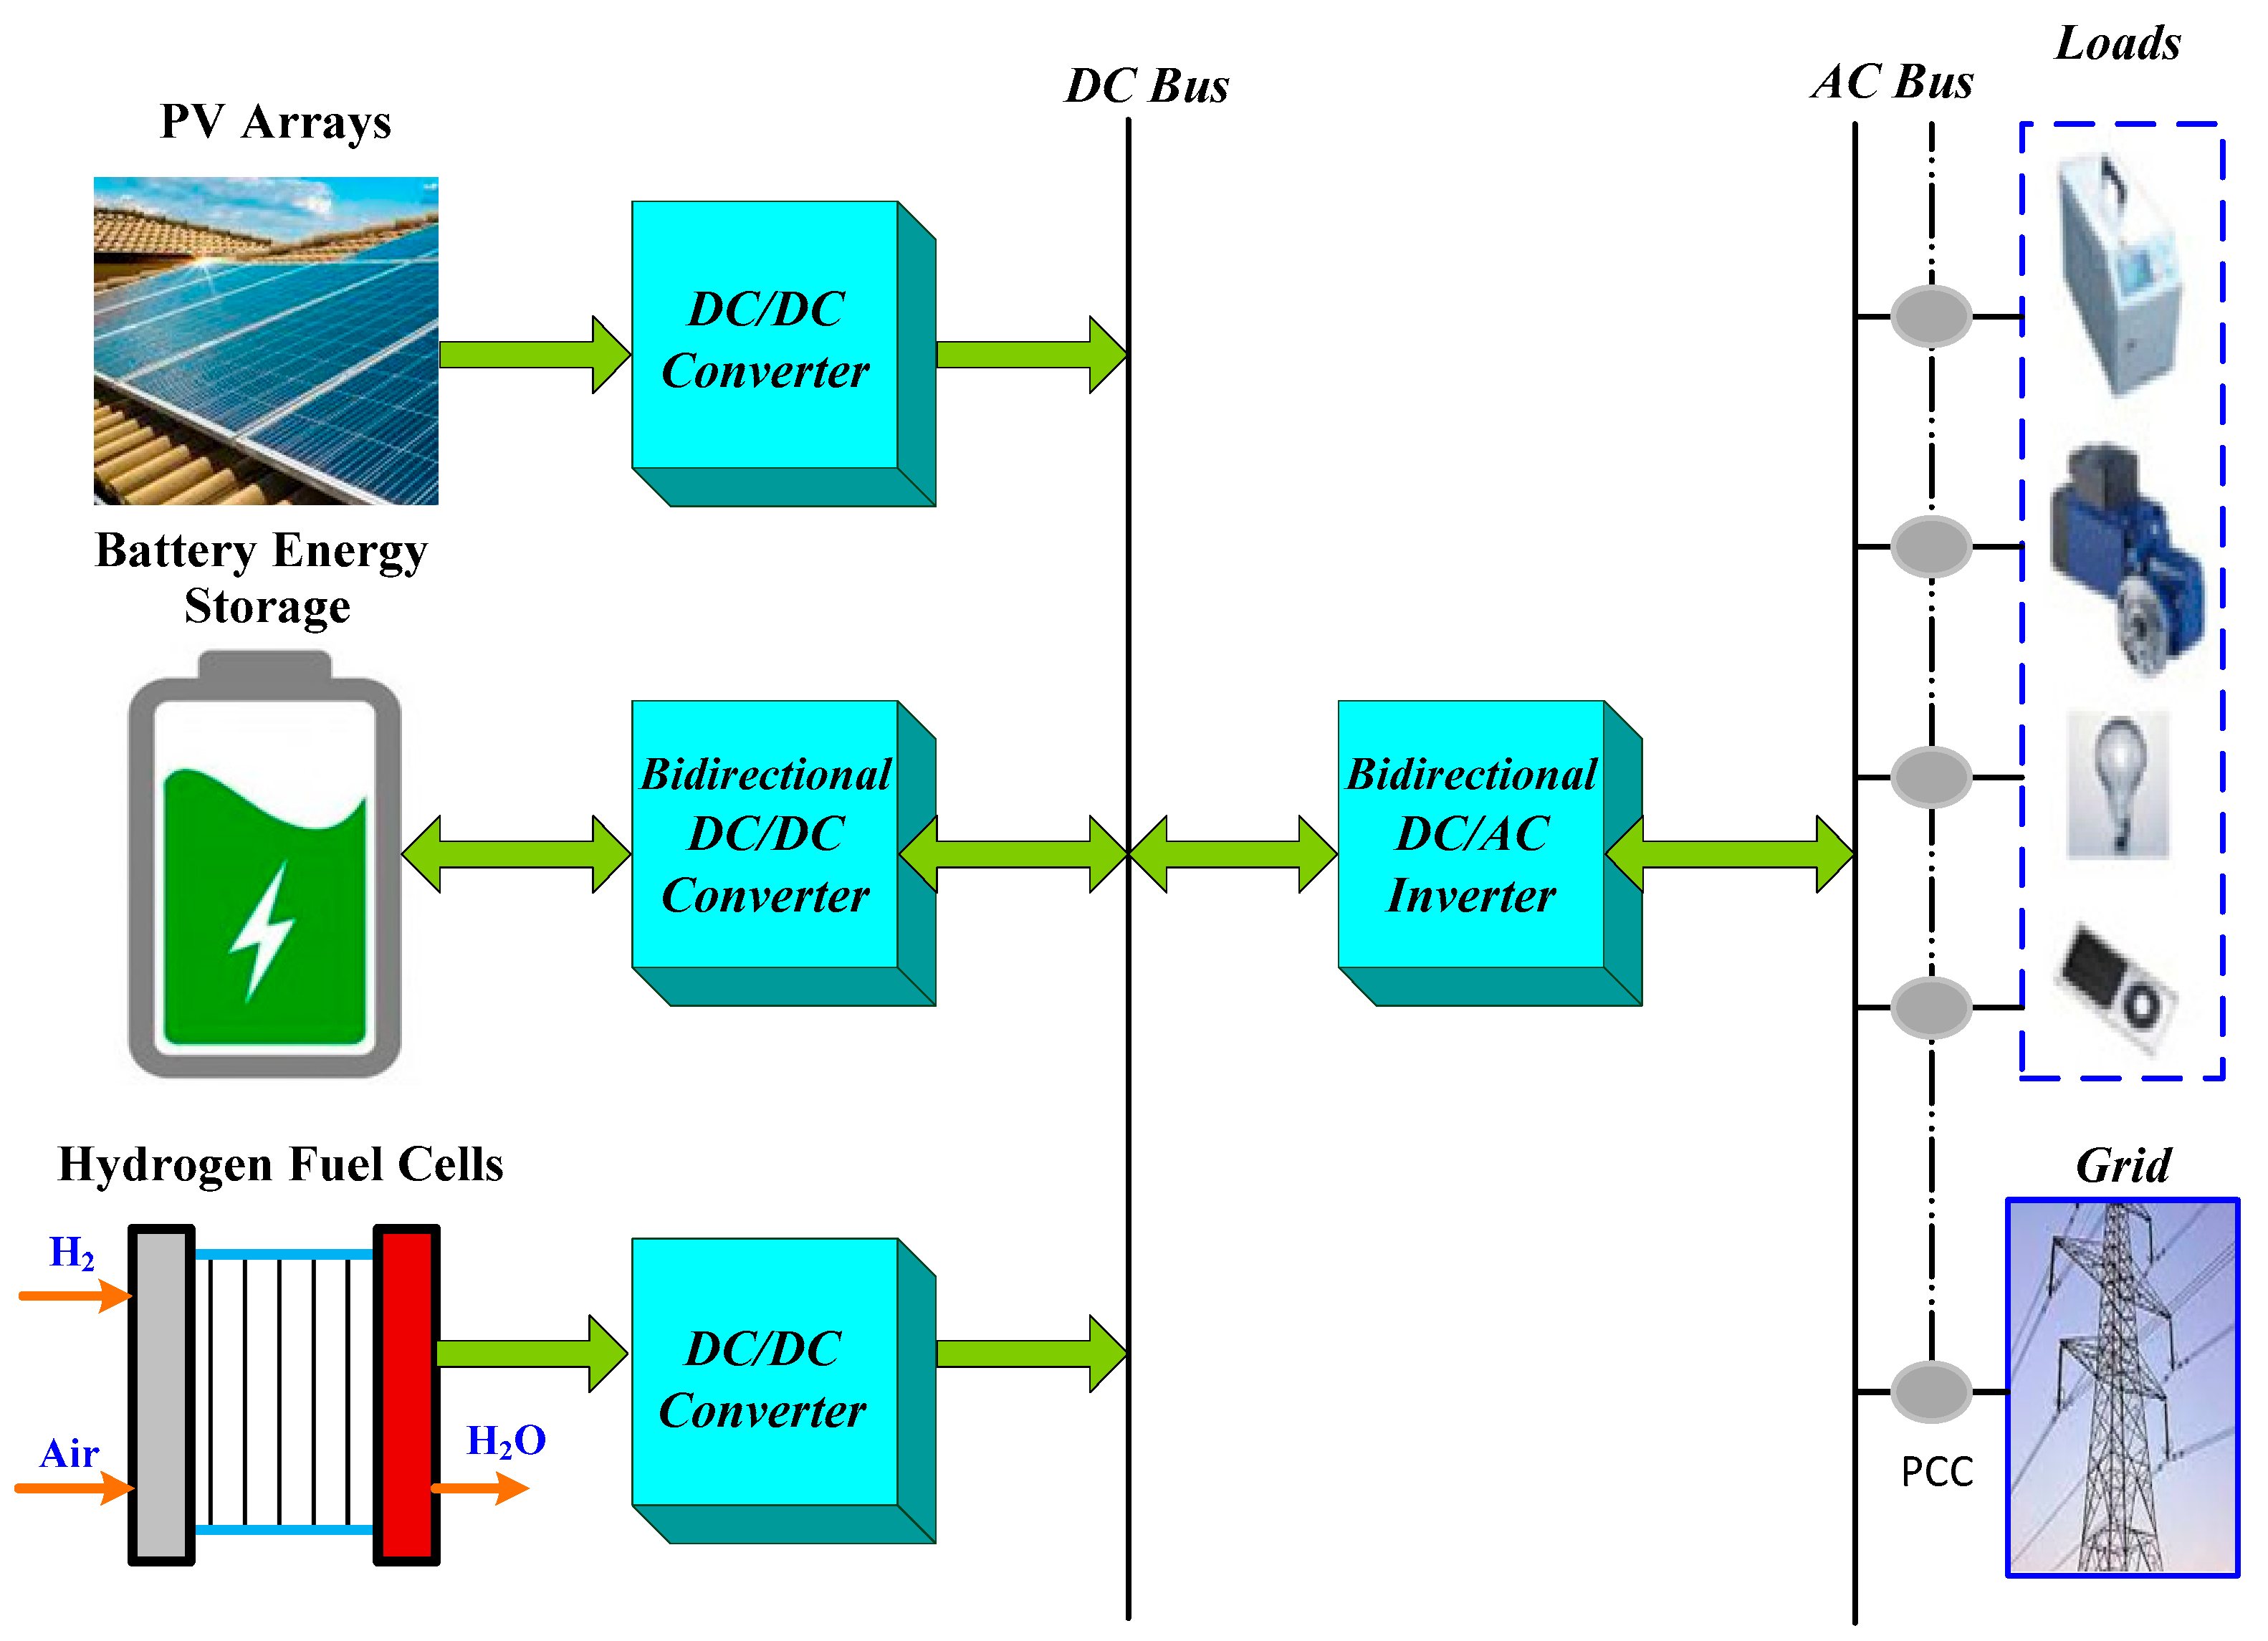
3. MG System Description
3.1. Operation Modes
3.2. Load Profile and Power Demand Assessment
3.3. Load Demand Profile Modeling
3.4. Simulation Tools and Data Sources
- ➢
- Software: MATLAB R2023a (Optimization Toolbox) for component sizing; HOMER Pro 3.14 for sensitivity analysis.
- ➢
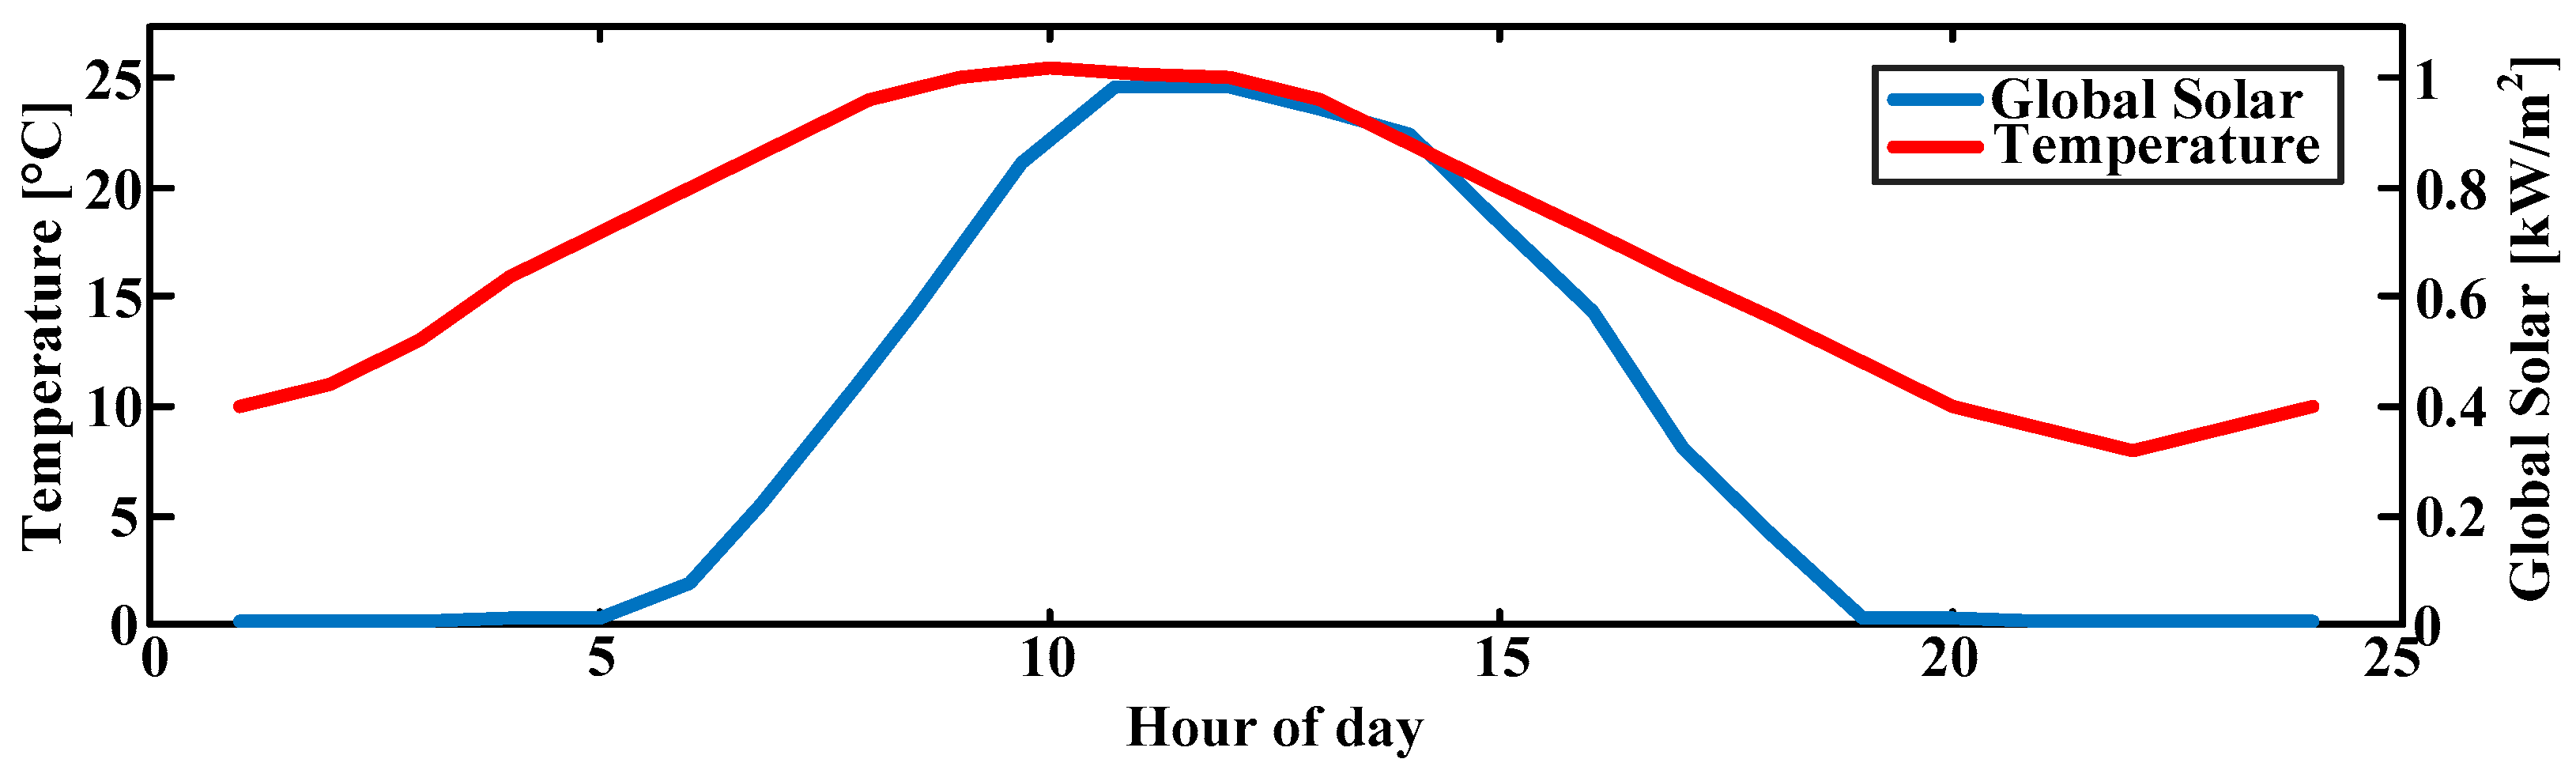
- Weather Data: Solar irradiance/temperature from NASA POWER (26.3° N, 31.4° E) at 1 h resolution.
- ➢
- Load Profiles: Measured campus demand (2023–2024) with ±5% uncertainty, as shown in Figure 2.
- ➢
- Cost Data: As shown in Table 4.
4. Proposed Sizing Method
4.1. PV Generator Cost
- CPV = Total cost of the PV system;
- PPV = Power produced by the PV system (in kW);
- CMPV = Maintenance cost per unit power (USD/kW);
- FPV = Fixed costs (e.g., PV panel purchase price, installation, permits, inverters, and other non-scalable costs).
4.2. Battery Energy Storage Cost
- Cb = Total cost of the BES;
- Pb = Power capacity of the BES (in kW);
- CMb = Maintenance cost per unit power (USD/kW);
- Fb = Fixed costs (battery purchase price, installation, control systems, etc.).
4.3. Hydrogen Generator Cost
- CHG = Total cost of the HG;
- PHG = Power output of the HG (in kW);
- CMHG = Maintenance cost per unit power (USD/kW);
- NHG = Fixed costs (HG purchase price, installation, equipment, inverters, etc.).
4.4. Grid Interaction Costs
- α = The price per kWh of electricity purchased from the grid;
- Pgrid > 0 = MG imports power from the grid at rate α (USD/kWh).
- β = The price power selling rate to the grid in USD/kWh.
- Pgrid < 0 = MG exports surplus power to the grid at rate β (USD/kWh).
4.5. Transition Sequence Between Modes
- Daytime (PV Active):
- ▪
- Priority 1: Serve load directly from PV.
- ▪
- Priority 2: Charge battery to SOC = 90%.
- ▪
- Priority 3: Export to the grid if β > 0.021 USD/kWh.
- Sunset Transition (PV Ramp-Down):
- ▪
- Trigger: dP_PV–dt < −10% P_rated per hour.
- ▪
- Action:
- -
- Phase out exports over 15 min.
- -
- Initiate battery discharge at a 50% rate.
- Nighttime (PV Inactive):
- ▪
- Primary source: Battery until SOC = 40%.
- ▪
- Secondary: Fuel cell if P_load > 1.2 × P_battery_rated.
- ▪
- Tertiary: Grid import if α < 0.027 USD/kWh.
- Grid Interaction Protocol
5. Levelized Cost of Electricity
5.1. Total Annualized Cost
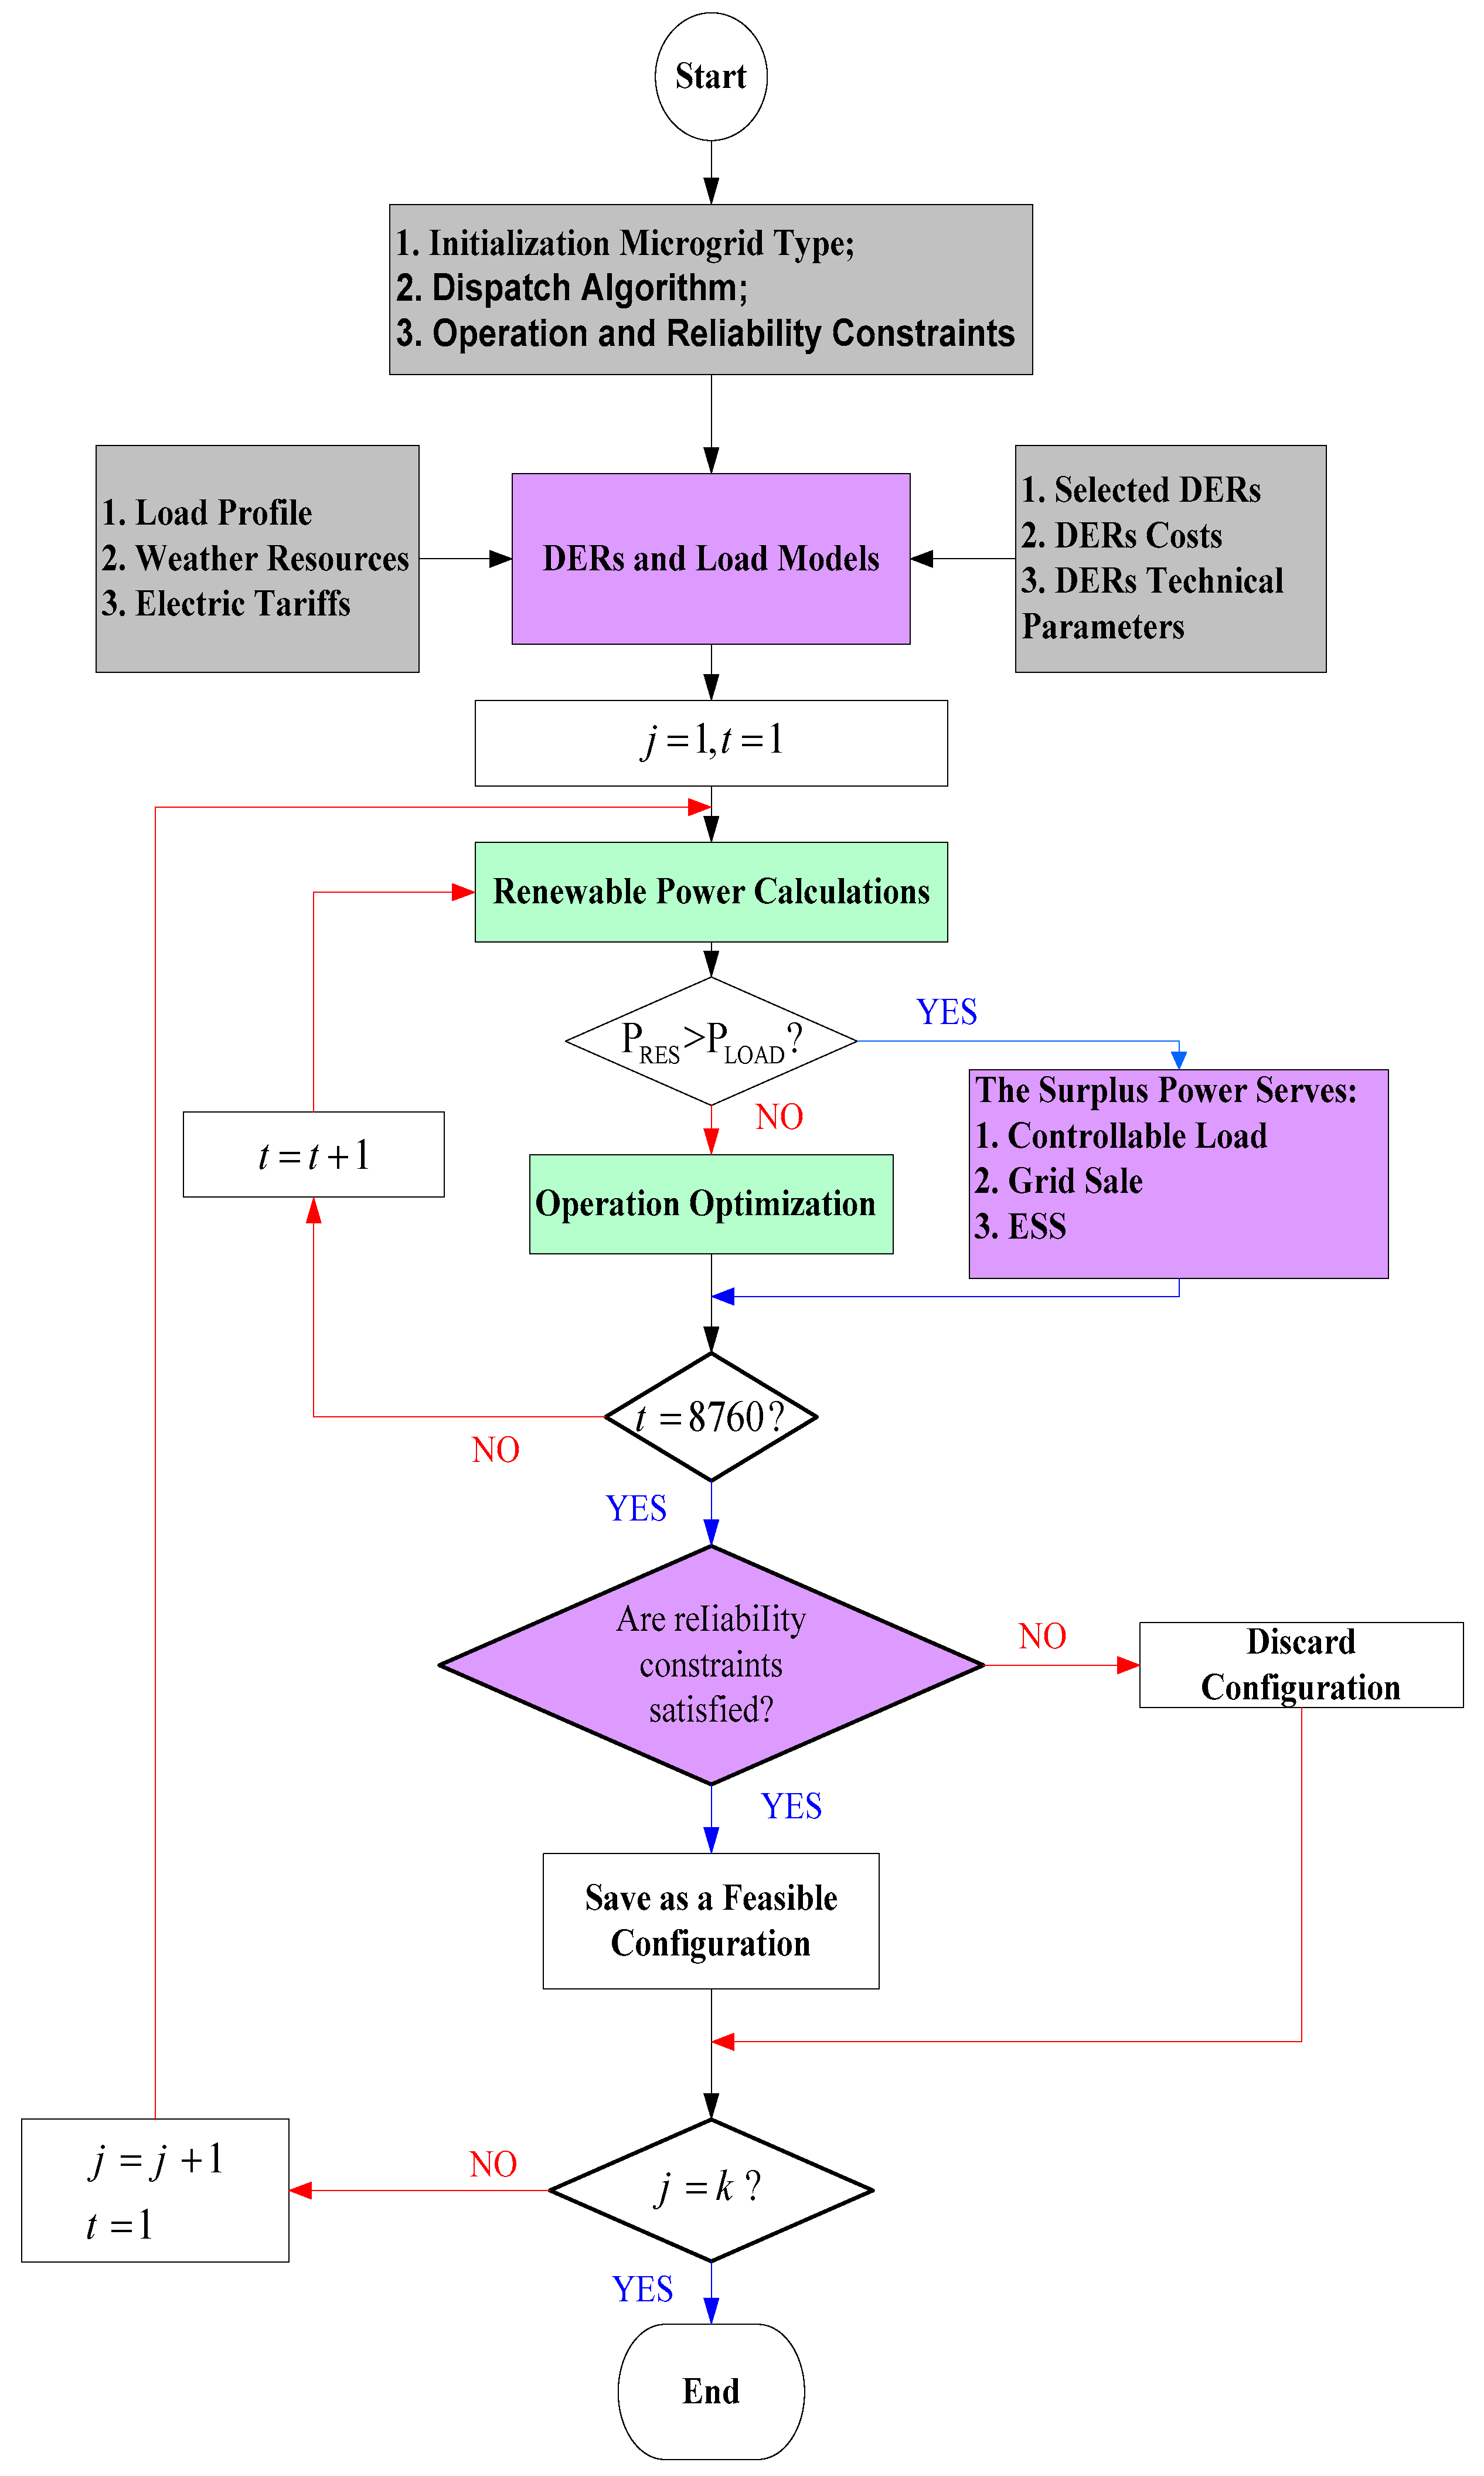
5.2. Sizing Algorithm
- CNPC denotes the minimum net present cost, which includes the costs of the PV system, batteries, the inverter, and the converter;
- CAPEX denotes capital expenditures;
- OP&MEX denotes the operating and maintenance expenditures.
5.3. Loss of Power Supply Probability Calculation
- The program first asks for the properties of the system parts and determines the minimum and maximum configurations for the system while adhering to all previously set restrictions.
- Power generated by the various components is determined, which changes every hour depending on the weather, starting with the minimal configuration so achieved.
- The LPSP value given in (14) is computed.
- The configuration is saved, its cost is determined, and a new configuration is examined if the LPSP acquired is negative or equal to zero. The current configuration will not be preserved if this value is positive, and a fresh one will be examined instead.
- The less expensive configuration will be the one that solves the optimization problem within the set of possible configurations.
5.4. Discounted Cash Flow Analysis
6. Results and Discussion
6.1. Simulation Results
6.2. Sizing Algorithm Results for 100 kW Microgrid
- Optimal Sizing Methodology
- B.
- Sensitivity Analysis
- -
- PV systems: Annual output reduction of 0.8% (typical for monocrystalline modules).
- -
- Battery systems: Capacity fades to 80% of initial capacity after 5000 full cycles.
- -
- Electrolyzer membranes: 15% efficiency loss over 60,000 operating hours.
- -
- PV soiling losses: 12% reduction in output (monthly cleaning assumed).
- -
- Temperature effects:
- PV derating: −0.5%/°C above STC.
- Battery efficiency penalty: 5% reduction at 35 °C ambient.
7. Conclusions
- Integrated hybrid energy system with dual storage:
- ○
- Unlike conventional PV–battery systems, this study introduces a PV–battery–hydrogen hybrid MG, combining short-term (battery) and long-term (hydrogen) energy storage to address intermittency and ensure reliability.
- ○
- The hydrogen subsystem (electrolyzer, storage tank, and fuel cell) provides seasonal storage capability, a critical advantage over battery-only systems in regions with fluctuating solar availability.
- Dual-objective optimization balancing cost and reliability:
- ○
- The levelized cost of electricity (LCOE) and loss of power supply probability (LPSP) are optimized simultaneously, ensuring cost-effectiveness (LCOE: 0.005–0.015 USD/kWh) while maintaining high reliability (LPSP ≤ 5%).
- ○
- This approach outperforms single-objective optimization methods found in prior studies, providing a balanced trade-off between economic and technical performance.
- Bidirectional grid interaction with realistic pricing:
- ○
- Unlike simplified grid models, this work explicitly accounts for import costs (α) and export revenues (β), reflecting Egypt’s real-world electricity tariffs.
- ○
- The economic model demonstrates how energy trading with the grid enhances financial viability, reducing payback periods to 8–10 years.
- Replicable model for MENA universities:
- ○
- This study provides a scalable methodology for universities in the Middle East and North Africa (MENA), leveraging high solar potential (5–7 kWh/m2/day) and Egypt’s emerging green hydrogen policies.
- ○
- The operating modes and control strategies are generalizable, making the system adaptable to other academic or institutional microgrids.
- Techno-economic validation via advanced simulation tools:
- ○
- The combined use of MATLAB (for optimization) and HOMER Pro (for sensitivity analysis) ensures robust sizing and performance validation, addressing uncertainties in load demand and solar variability.
- ○
- The economic analysis confirms 20–30% cost savings over 20 years compared to conventional grid reliance, alongside 90–100 tons/year CO2 reduction.
8. Future Research Directions
- ➢
- Probabilistic sizing methods to account for dust storms, demand growth, and component degradation.
- ➢
- Integration with electric vehicle (EV) charging stations to enhance campus sustainability.
- ➢
- Policy incentives analysis to accelerate adoption across MENA universities.
Author Contributions
Funding
Data Availability Statement
Conflicts of Interest
Abbreviations
| AC | Alternating Current | HSA | Harmony Search Algorithm |
| ACS | Annualized Cost System | IEC | International Electro-Technical Commission |
| BCR | Benefit–Cost Ratio | IRR | Internal Rate of Return |
| BES | Battery Energy Storage | KSA | Kingdom of Saudi Arabia |
| CO2 | Carbon Dioxide | KVA | Kilo Volt Amperes |
| DC | Direct Current | LCOE | Levelized Cost of Electricity |
| DCFA | Discounted Cash Flow Analysis | Li-Ion | Lithium-Ion |
| DER | Distributed Energy Resource | LPSP | Loss of Power Supply Potential |
| DG | Diesel Generator | MENA | Middle East and North Africa |
| DGs | Distributed Generators | MG | Micro-Grid |
| EMS | Energy Management System | MPC | Model Predictive Control |
| ESS | Energy Storage System | MPPT | Maximum Power Point Tracking |
| EV | Electric Vehicle | NPC | Net Present Cost |
| FA | Firefly Algorithm | PEME | Proton Exchange Membrane Electrolyzed |
| FC | Fuel Cell | PSO | Particle Swarm Optimization |
| GA | Genetic Algorithm | PV | Photovoltaic |
| GW | Gigawatt | RES | Renewable Energy Source |
| H2 | Hydrogen Storage | ROI | Return on Investment |
| HESS | Hybrid Energy Storage System | SFLA | Shuffled Frog Leaping Algorithm |
| HMGS | Hybrid Micro-Grid System | SOC | State of Charge |
| HOMER | Hybrid Optimization of Multiple Energy Resources | WACC | Weighted Average Cost of Capital |
| HPS | Hybrid Power System | WT | Wind Turbine |
References
- Rasul, M. Clean Energy for Sustainable Development: Comparisons and Contrasts of New Approaches; Academic Press: Cambridge, MA, USA, 2016. [Google Scholar]
- Akram, U.; Khalid, M.; Shafiq, S. An innovative hybrid wind-solar and battery-supercapacitor microgrid system—Development and optimization. IEEE Access 2017, 5, 25897–25912. [Google Scholar] [CrossRef]
- Ritchie, H.; Rosado, P.; Roser, M. Access to Energy. Our World in Data. 2024. Available online: https://ourworldindata.org/energy-access (accessed on 5 December 2024).
- Mandelli, S.; Barbieri, J.; Mereu, R.; Colombo, E. Off-grid systems for rural electrification in developing countries: Definitions, classification, and a comprehensive literature review. Renew. Sustain. Energy Rev. 2016, 58, 1621–1646. [Google Scholar] [CrossRef]
- Valverde, L.; Rosa, F.; Del Real, A.; Arce, A.; Bordons, C. Modeling, simulation and experimental set-up of a renewable hydrogen-based domestic microgrid. Int. J. Hydrogen Energy 2013, 38, 11672–11684. [Google Scholar] [CrossRef]
- Avtar, R.; Sahu, N.; Aggarwal, A.K.; Chakraborty, S.; Kharrazi, A.; Yunus, A.P.; Dou, J.; Kurniawan, T.A. Exploring renewable energy resources using remote sensing and GIS—A review. Resources 2019, 8, 149. [Google Scholar] [CrossRef]
- Emeghara, M.; Obi, P.; Onah, A. Modeling and performance evaluation of a hybrid solar-wind power generation plant. J. Energy Technol. Environ. 2022, 4, 21–38. [Google Scholar]
- Petrakopoulou, F.; Robinson, A.; Loizidou, M. Simulation and evaluation of a hybrid concentrating-solar and wind power plant for energy autonomy on islands. Renew. Energy 2016, 96, 863–871. [Google Scholar] [CrossRef]
- Lazaroiu, G.; Osman, M.G.; Strejoiu, C.-V. Performance Evaluation of Renewable Energy Systems: Photovoltaic, Wind Turbine, Battery Bank, and Hydrogen Storage. Batteries 2023, 9, 468. [Google Scholar] [CrossRef]
- Uwineza, L.; Kim, H.-G.; Kim, C.K. Feasibility study of integrating the renewable energy system in Popova Island using the Monte Carlo model and HOMER. Energy Strategy Rev. 2021, 33, 100607. [Google Scholar] [CrossRef]
- Shamshirband, S.; Mohammadi, K.; Yee, P.L.; Petković, D.; Mostafaeipour, A. A comparative evaluation for identifying the suitability of extreme learning machine to predict horizontal global solar radiation. Renew. Sustain. Energy Rev. 2015, 52, 1031–1042. [Google Scholar] [CrossRef]
- Dorel, S.; Osman, M.G.; Strejoiu, C.-V.; Lazaroiu, G. Exploring Optimal Charging Strategies for Off-Grid Solar Photovoltaic Systems: A Comparative Study on Battery Storage Techniques. Batteries 2023, 9, 470. [Google Scholar] [CrossRef]
- Yüksel, I. Hydropower for sustainable water and energy development. Renew. Sustain. Energy Rev. 2010, 14, 462–469. [Google Scholar] [CrossRef]
- Osman, M.G.; Strejoiu, C.-V.; Panait, C.; Lazaroiu, A.C.; Lazaroiu, G. Microgrid Model for Evaluating the Operational Dynamics of Solar-Powered Hydrogen Production. In Proceedings of the 2024 9th International Conference on Energy Efficiency and Agricultural Engineering (EE&AE), Ruse, Bulgaria, 27–29 June 2024. [Google Scholar]
- Kuznetsova, E.; Ruiz, C.; Li, Y.-F.; Zio, E. Analysis of robust optimization for decentralized microgrid energy management under uncertainty. Int. J. Electr. Power Energy Syst. 2015, 64, 815–832. [Google Scholar] [CrossRef]
- Jayachandran, M.; Ravi, G. Design and optimization of hybrid micro-grid system. Energy Procedia 2017, 117, 95–103. [Google Scholar] [CrossRef]
- El-Fergany, A.A.; El-Hameed, M.A. Efficient frequency controllers for autonomous two-area hybrid microgrid system using the social-spider optimizer. IET Gener. Transm. Distrib. 2017, 11, 637–648. [Google Scholar] [CrossRef]
- Lorestani, A.; Gharehpetian, G.; Nazari, M.H. Optimal sizing and techno-economic analysis of energy-and cost-efficient standalone multi-carrier microgrid. Energy 2019, 178, 751–764. [Google Scholar] [CrossRef]
- Al-Buraiki, A.S.; Al-Sharafi, A. Hydrogen production via using excess electric energy of an off-grid hybrid solar/wind system based on a novel performance indicator. Energy Convers. Manag. 2022, 254, 115270. [Google Scholar] [CrossRef]
- Abdelghany, M.B.; Al-Durra, A.; Gao, F. A coordinated optimal operation of a grid-connected wind-solar microgrid incorporating hybrid energy storage management systems. IEEE Trans. Sustain. Energy 2023, 15, 39–51. [Google Scholar] [CrossRef]
- Trifkovic, M.; Sheikhzadeh, M.; Nigim, K.; Daoutidis, P. Modeling and control of a renewable hybrid energy system with hydrogen storage. IEEE Trans. Control Syst. Technol. 2013, 22, 169–179. [Google Scholar] [CrossRef]
- Garcia-Torres, F.; Bordons, C.; Tobajas, J.; Marquez, J.J.; Garrido-Zafra, J.; Moreno-Munoz, A. Optimal schedule for networked microgrids under deregulated power market environment using model predictive control. IEEE Trans. Smart Grid 2020, 12, 182–191. [Google Scholar] [CrossRef]
- Ishaq, H.; Dincer, I. Comparative assessment of renewable energy-based hydrogen production methods. Renew. Sustain. Energy Rev. 2021, 135, 110192. [Google Scholar] [CrossRef]
- Endrődi, B.; Simic, N.; Wildlock, M.; Cornell, A. A review of chromium (VI) use in chlorate electrolysis: Functions, challenges and suggested alternatives. Electrochim. Acta 2017, 234, 108–122. [Google Scholar] [CrossRef]
- Apostolou, D.; Enevoldsen, P.; Xydis, G. Supporting green Urban mobility—The case of a small-scale autonomous hydrogen refueling station. Int. J. Hydrogen Energy 2019, 44, 9675–9689. [Google Scholar] [CrossRef]
- Yang, T.; Yan, X.; Cai, W.; Luo, H.; Xu, N.; Tong, L.; Yan, F.; Chahine, R.; Xiao, J. Parametric Study and Optimization of Hydrogen Production Systems Based on Solar/Wind Hybrid Renewable Energies: A Case Study in Kuqa, China. Sustainability 2024, 16, 896. [Google Scholar] [CrossRef]
- Chen, C.; Lu, Y.; Xing, L. Levelling renewable power output using hydrogen-based storage systems: A techno-economic analysis. J. Energy Storage 2021, 37, 102413. [Google Scholar] [CrossRef]
- Dagdougui, H.; Ouammi, A.; Sacile, R. A regional decision support system for onsite renewable hydrogen production from solar and wind energy sources. Int. J. Hydrogen Energy 2011, 36, 14324–14334. [Google Scholar] [CrossRef]
- Abbasi, T.; Abbasi, S. ‘Renewable’ hydrogen: Prospects and challenges. Renew. Sustain. Energy Rev. 2011, 15, 3034–3040. [Google Scholar] [CrossRef]
- Fernández, F.J.V.; Manzano, F.S.; Márquez, J.M.A.; Godoy, A.J.C. Extended model predictive controller to develop energy management systems in renewable source-based smart microgrids with hydrogen as a backup. Theoretical foundation and case study. Sustainability 2020, 12, 8969. [Google Scholar] [CrossRef]
- Ji, M.; Zhang, W.; Xu, Y.; Liao, Q.; Klemeš, J.J.; Wang, B. Optimisation of multi-period renewable energy systems with hydrogen and battery energy storage: A P-graph approach. Energy Convers. Manag. 2023, 281, 116826. [Google Scholar] [CrossRef]
- Pereira, M.; Limon, D.; Álamo, T.; Valverde, L. Application of periodic economic MPC to a grid-connected micro-grid. IFAC-PapersOnLine 2015, 48, 513–518. [Google Scholar] [CrossRef]
- Acevedo-Arenas, C.Y.; Correcher, A.; Sánchez-Díaz, C.; Ariza, E.; Alfonso-Solar, D.; Vargas-Salgado, C.; Petit-Suárez, J.F. MPC for optimal dispatch of an AC-linked hybrid PV/wind/biomass/H2 system incorporating demand response. Energy Convers. Manag. 2019, 186, 241–257. [Google Scholar] [CrossRef]
- Fonseca, J.D.; Camargo, M.; Commenge, J.-M.; Falk, L.; Gil, I.D. Trends in the design of distributed energy systems using hydrogen as energy vector: A systematic literature review. Int. J. Hydrogen Energy 2019, 44, 9486–9504. [Google Scholar] [CrossRef]
- Mohseni, S.; Brent, A.C. Economic viability assessment of sustainable hydrogen production, storage, and utilization technologies integrated into on-and off-grid micro-grids: A performance comparison of different meta-heuristics. Int. J. Hydrogen Energy 2020, 45, 34412–34436. [Google Scholar] [CrossRef]
- De Crisci, A.G.; Moniri, A.; Xu, Y. Hydrogen from hydrogen sulfide: Towards a more sustainable hydrogen economy. Int. J. Hydrogen Energy 2019, 44, 1299–1327. [Google Scholar] [CrossRef]
- Acar, C.; Beskese, A.; Temur, G.T. Sustainability analysis of different hydrogen production options using hesitant fuzzy AHP. Int. J. Hydrogen Energy 2018, 43, 18059–18076. [Google Scholar] [CrossRef]
- Pivorienė, A. Real options and discounted cash flow analysis to assess strategic investment projects. Econ. Bus. 2017, 30, 91–101. [Google Scholar] [CrossRef]
- Hosseini, S.J.A.D.; Moazzami, M.; Shahinzadeh, H. Optimal sizing of an isolated hybrid wind/PV/battery system with considering loss of power supply probability. Majlesi J. Electr. Eng. 2017, 11, 63–69. [Google Scholar]
- Bilal, B.O.; Sambou, V.; Ndiaye, P.; Kébé, C.; Ndongo, M. Optimal design of a hybrid solar–wind-battery system using the minimization of the annualized cost system and the minimization of the loss of power supply probability (LPSP). Renew. Energy 2010, 35, 2388–2390. [Google Scholar] [CrossRef]
- Heydari, A.; Askarzadeh, A. Optimization of a biomass-based photovoltaic power plant for an off-grid application subject to loss of power supply probability concept. Appl. Energy 2016, 165, 601–611. [Google Scholar] [CrossRef]
- Abbes, D.; Martinez, A.; Champenois, G. Life cycle cost, embodied energy and loss of power supply probability for the optimal design of hybrid power systems. Math. Comput. Simul. 2014, 98, 46–62. [Google Scholar] [CrossRef]
- Shi, Z.; Wang, R.; Zhang, T. Multi-objective optimal design of hybrid renewable energy systems using preference-inspired coevolutionary approach. Sol. Energy 2015, 118, 96–106. [Google Scholar] [CrossRef]
- Torreglosa, J.P.; García, P.; Fernández, L.M.; Jurado, F. Energy dispatching based on the predictive controller of an off-grid wind turbine/photovoltaic/hydrogen/battery hybrid system. Renew. Energy 2015, 74, 326–336. [Google Scholar] [CrossRef]
- Zaenal, M.U.; Mohammed, S.S.; Wahhab, A.A.; Abdalgbar, O.J. Complementary power supply to compensate the wind power in water electrolytic system for hydrogen production. In Proceedings of the 2019 Global Conference for Advancement in Technology (GCAT), Bangaluru, India, 18–20 October 2019; pp. 1–4. [Google Scholar]
- Samy, M.; Barakat, S.; Ramadan, H. Techno-economic analysis for rustic electrification in Egypt using multi-source renewable energy based on PV/wind/FC. Int. J. Hydrogen Energy 2020, 45, 11471–11483. [Google Scholar] [CrossRef]
- Brunet, J.; Ponssard, J.-P. Policies and deployment for fuel cell electric vehicles an assessment of the Normandy project. Int. J. Hydrogen Energy 2017, 42, 4276–4284. [Google Scholar] [CrossRef]
- Marocco, P.; Ferrero, D.; Lanzini, A.; Santarelli, M. Optimal design of stand-alone solutions based on RES+ hydrogen storage feeding off-grid communities. Energy Convers. Manag. 2021, 238, 114147. [Google Scholar] [CrossRef]
- González, I.; Calderón, A.; Andújar, J. Novel remote monitoring platform for RES-hydrogen based smart microgrid. Energy Convers. Manag. 2017, 148, 489–505. [Google Scholar] [CrossRef]
- Sarkar, T.; Bhattacharjee, A.; Samanta, H.; Bhattacharya, K. Optimal design and implementation of solar PV-wind-biogas-VRFB storage integrated smart hybrid microgrid for ensuring zero loss of power supply probability. Energy Convers. Manag. 2019, 191, 102–118. [Google Scholar] [CrossRef]
- Alavi, O.; Mostafaeipour, A.; Qolipour, M. Analysis of hydrogen production from wind energy in the southeast of Iran. Int. J. Hydrogen Energy 2016, 41, 15158–15171. [Google Scholar] [CrossRef]
- Mostafaeipour, A.; Jooyandeh, E. Prioritizing the locations for hydrogen production using a hybrid wind-solar system: A case study. Adv. Energy Res. 2017, 5, 107–128. [Google Scholar]
- Nasser, M.; Hassan, H. Assessment of standalone streetlighting energy storage systems based on hydrogen of hybrid PV/electrolyzer/fuel cell/desalination and PV/batteries. J. Energy Storage 2023, 63, 106985. [Google Scholar] [CrossRef]
- Rezk, H.; Dousoky, G.M. Technical and economic analysis of different configurations of stand-alone hybrid renewable power systems—A case study. Renew. Sustain. Energy Rev. 2016, 62, 941–953. [Google Scholar] [CrossRef]
- Ali, M.H.; El-Rifaie, A.M.; Youssef AA, F.; Tulsky, V.N.; Tolba, M.A. Techno-Economic Strategy for the Load Dispatch and Power Flow in Power Grids Using Peafowl Optimization Algorithm. Energies 2023, 16, 846. [Google Scholar] [CrossRef]
- Diab AA, Z.; El-Rifaie, A.M.; Zaky, M.M.; Tolba, M.A. Optimal Sizing of Stand-Alone Microgrids Based on Recent Metaheuristic Algorithms. Mathematics 2022, 10, 140. [Google Scholar] [CrossRef]
- Abdelwahab SA, M.; El-Rifaie, A.M.; Hegazy, H.Y.; Tolba, M.A.; Mohamed, W.I.; Mohamed, M. Optimal Control and Optimization of Grid-Connected PV and Wind Turbine Hybrid Systems Using Electric Eel Foraging Optimization Algorithms. Sensors 2024, 24, 2354. [Google Scholar] [CrossRef] [PubMed]
- Ahmed, I.; El-Rifaie, A.M.; Akhtar, F.; Ahmad, H.; Alaas, Z.; Ahmed, M. Cybersecurity in microgrids: A review on advanced techniques and practical implementation of resilient energy systems. Energy Strat. Rev. 2025, 58, 101654. [Google Scholar] [CrossRef]
- Egyptian Electricity Regulatory Agency. Available online: https://www.egyptera.org/ (accessed on 28 March 2025).
- Elhadidy, M.; Shaahid, S. Feasibility of hybrid (wind+ solar) power systems for Dhahran, Saudi Arabia. Renew. Energy 1999, 16, 970–976. [Google Scholar] [CrossRef]
- Salman, S.Y. Egypt Desert Paradoxes, Promises, and Possibilities: A Study of Land Reclamation Policies Along Cairo-Alexandria Desert Road. Master’s Thesis, Middle East Studies Center, Columbus, OH, USA, 2018. [Google Scholar]
- Yang, H.; Zhou, W.; Lu, L.; Fang, Z. Optimal sizing method for stand-alone hybrid solar–wind system with LPSP technology by using genetic algorithm. Sol. Energy 2008, 82, 354–367. [Google Scholar] [CrossRef]
- IEC 60038:2009; IEC Standard Voltages. International Electrotechnical Commission: London, UK, 2009.
- Kamel, S.; Dahl, C. The economics of hybrid power systems for sustainable desert agriculture in Egypt. Energy 2005, 30, 1271–1281. [Google Scholar] [CrossRef]
- Demiroren, A.; Yilmaz, U. Analysis of change in electric energy cost with using renewable energy sources in Gökceada, Turkey: An island example. Renew. Sustain. Energy Rev. 2010, 14, 323–333. [Google Scholar] [CrossRef]
- NREL ATB. 2023. Available online: https://atb.nrel.gov/ (accessed on 28 March 2025).
- IRENA Renewable Cost Database. Available online: https://www.irena.org/costs (accessed on 28 March 2025).
- IEA Hydrogen Projects Database. Available online: https://www.iea.org/reports/hydrogen (accessed on 28 March 2025).
- DOE Hydrogen and Fuel Cell Technologies Office. Available online: https://www.energy.gov/eere/fuelcells (accessed on 28 March 2025).
- Hydrogen Council Report. 2023. Available online: https://hydrogencouncil.com/ (accessed on 28 March 2025).
- BloombergNEF Hydrogen Economy Outlook. Available online: https://about.bnef.com/ (accessed on 28 March 2025).
- Lazard LCOE. 2023. Available online: https://www.lazard.com/research-insights/ (accessed on 28 March 2025).
- NREL Solar Integration Dataset. Available online: https://www.nrel.gov/grid/solar-power-data.html (accessed on 28 March 2025).
- Hafez, O.; Bhattacharya, K. Optimal planning and design of a renewable energy based supply system for microgrids. Renew. Energy 2012, 45, 7–15. [Google Scholar] [CrossRef]
- Kassem, R.; Mahmoud, M.M.; Ibrahim, N.F.; Alkuhayli, A.; Khaled, U.; Beroual, A.; Saleeb, H. A Techno-Economic-Environmental Feasibility Study of Residential Solar Photovoltaic/Biomass Power Generation for Rural Electrification: A Real Case Study. Sustainability 2024, 16, 2036. [Google Scholar] [CrossRef]
- Yang, H.; Wei, Z.; Lou, C. Optimal design and techno-economic analysis of a hybrid solar-wind power generation system. Appl. Energy 2009, 86, 163–169. [Google Scholar] [CrossRef]


| Mode | Trigger Condition | Primary Action | Critical Parameters |
|---|---|---|---|
| Normal Daytime (High Solar) | Solar irradiance > 600 W/m2 | PV powers load → excess charges battery → surplus to electrolyzer (H2 production) | PV output, battery SOC (60–90%), load demand |
| Battery Charging | PV generation > load + battery SOC < 90% | Excess PV energy charges the battery | Battery charge rate, SOC limits |
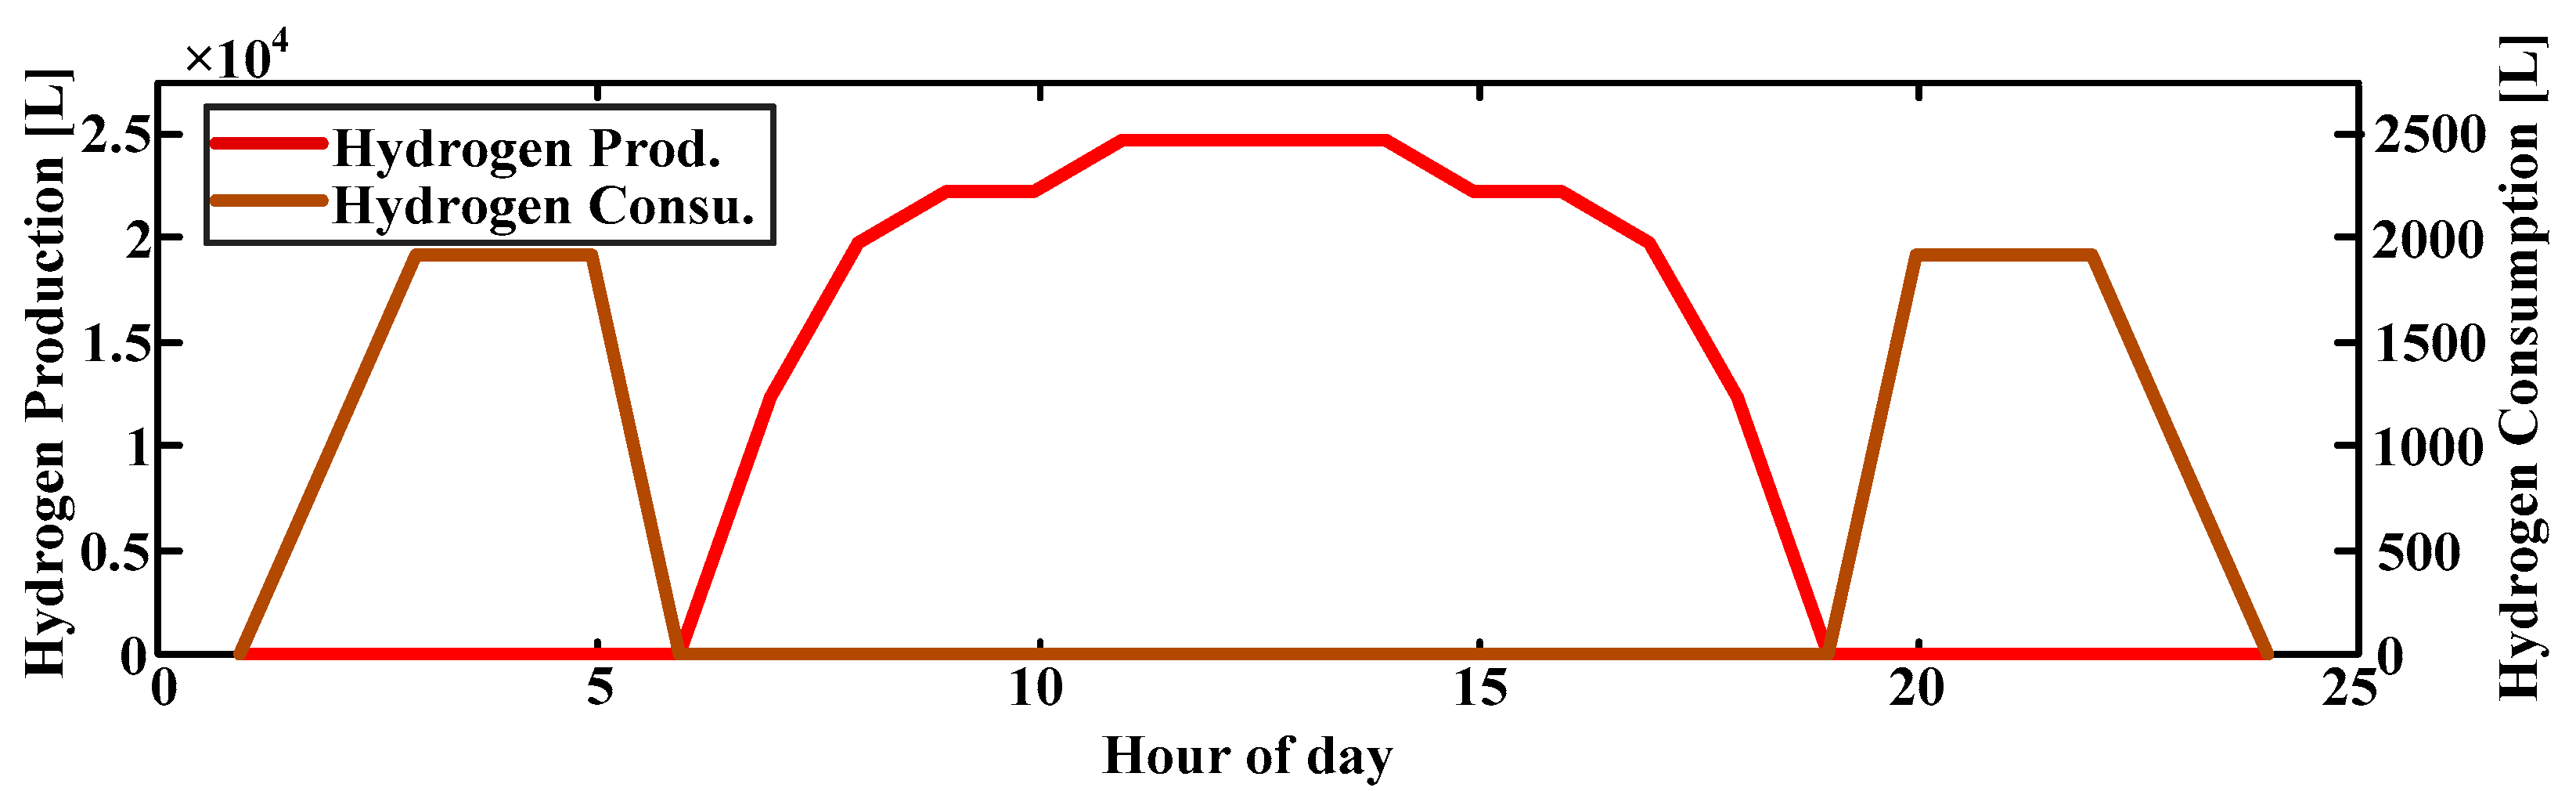
| Hydrogen Production | Battery SOC = 90% + PV surplus | Electrolyzer activates (1.8–2.5 kg H2/h at 60–80% efficiency) | Electrolyzer capacity, H2 storage pressure (30–80 bar) |
| Nighttime (Battery Discharge) | Solar irradiance = 0 | Battery discharges → FC supplements if SOC < 40% | Battery SOC, FC hydrogen consumption (6 kg/h) |
| Grid-Connected | Grid available + surplus/deficit | Export excess to the grid (β = 0.021/kWh) or import (α = 0.027/kWh) | Grid tariffs (α, β), import/export limits |
| Islanded (Off-Grid) | Grid failure | PV + battery + FC sustain load; load shedding if deficit | LPSP (<5%), H2 reserve, battery SOC |
| Building | Area | Air Conditioning | Specific Load | Total kW per Floor | Total kW for 3 Floors Build. | KVA Assuming 0.7 PF |
|---|---|---|---|---|---|---|
| Dean building | 1897 | 100 W/m2 | 30 W/m2 | 246 | 738 | 1054 |
| Lecture building | 2814 | 100 W/m2 | 30 W/m2 | 366 | 1098 | 1568 |
| MG Components | Parameters | Symbols | Value/Unit |
|---|---|---|---|
| PV Array | Rated power | Prat | 305 W |
| Voltage at Max. power | Vmp | 54.7 V | |
| Current at Max. power | Imp | 5.58 A | |
| Open circuit voltage | Voc | 64.9 V | |
| Short circuit current | Isc | 5.98 A | |
| Dimensions | 61.3 × 41.2 × 1.8 in (1557 × 1046 × 46 mm) | ||
| Weight | ~18.6 kg | ||
| Sun-Power SPR-305E-WHT-D modules with a 100 kW rating that are 330 (Nser = 5 Npar = 66) in series and parallel configuration | |||
| BES | Li-ion battery | A 48 V, 500 Ah | |
| Battery SOC | SOCmin–SOCmax | 60–90% | |
| Electrolyzer | Capacity | 50–100 kW | |
| Efficiency | 60–80% | ||
| Hydrogen production rate | 1.8–2.5 kg/h | ||
| Operating pressure | 30–80 bar | ||
| Hydrogen Storage | Capacity | 50–70 kg | |
| Pressure (compressed gas) | 350–700 bar | ||
| Fuel Cel | Capacity | 100 kW | |
| Efficiency | 40–60% | ||
| Hydrogen consumption rate | 6 kg/h | ||
| Inverter and Converter | Bidirectional DC-DC Converter | A 50 kW, controlled voltage/current outputs | |
| Bidirectional hybrid inverter system | A 120 kVA, 400 V AC, 270 V DC input, 50 Hz | ||
| AC Distribution System (400 V AC Bus) | Cable type | XLPE | (cross-linked polyethylene) |
| Length | 1 km | (typical for campus-scale MGs) | |
| Resistance | R | 0.05 Ω/km | |
| Reactance | X | 0.04 Ω/km | |
| Voltage tolerance | ±5% (380–420 V) | complies with IEC 60038 standards [63] | |
| Power losses | 3.1 kW | (3.1% loss, acceptable) | |
| Component | Cost | Value | Unit | Reference Sources |
|---|---|---|---|---|
| PV System | Capital cost | 2000 | USD/kW | [66,67] |
| O&M cost | 10 | USD/kW/y | ||
| Lifetime | 25 | years | ||
| A 50 kW PEM Electrolyzer | Capital cost | 1200 | USD/kW | [68,69] |
| Lifetime | 60,000–90,000 | hours | ||
| Hydrogen Storage (compressed gas) | Capital cost | 25,000–70,000 | USD (50–100 kg at 350 bar) H2 | [70] |
| Lifetime | 15–20 | years | ||
| Fuel Cell | Capital cost | 1000–3000 | USD/kW | [71] |
| Lifetime | 30,000–40,000 | hours | ||
| BES (Li-ion) | Capital cost | 400–600 | USD/kWh | [72] |
| Replacement cost | 200 | USD/kWh | ||
| O&M cost | 5 | USD/kWh/y | ||
| Throughput | 3000 | kWh/unit | ||
| Round-trip efficiency | 9 | % | ||
| Inverter and Converter (bidirectional) | Capital cost | 200–500 | USD/kW | [73] |
| Replacement cost | 200 | USD/kW | ||
| Lifetime | 15 | years | ||
| Efficiency | 95 | % |
| Condition | Action | Control Parameters |
|---|---|---|
| P_excess > 10% P_rated AND β > LCOE | Export to grid | Ramp rate: 5%/min of P_rated |
| P_deficit > 5% P_load AND α < H2_cost | Import from grid | Max import: 80% of grid connection capacity |
| Component | Optimal Size | Sizing Criteria | Feasibility Proof |
|---|---|---|---|
| PV Array | 120 kWp | Meets 120% of average daily load (72 kW) | NASA irradiance data + 20% oversizing for haze |
| Battery (Li-ion) | 150 kWh | Covers 6-h nighttime load (40 kW × 6 h) | SOC constraints (60–90%) + 5000-cycle lifespan |
| Electrolyzer | 50 kW | Matches surplus PV (>80 kW for 4 h/day) | H2 production rate (1.8 kg/h) and 65% efficiency |
| Fuel Cell | 30 kW | Supplies 75% of peak deficit (112 kW–80 kW) | 40% efficiency + 6 kg-H2/h consumption |
| H2 Storage | 60 kg | Stores 3 days of FC demand (18 kg/day) | 350-bar compression + 98% storage efficiency |
| Metrics | Details |
|---|---|
| System Cost | Capital Cost: 150,000 USD–250,000 USD LCOE: 0.005–0.015 USD/kWh. |
| Emissions | CO2 reduction: 90–100 tons/year Near-zero carbon emissions are possible with a renewable-powered system |
| Reliability | Energy autonomy due to complementary energy sources Grid independence during outages Enhanced power quality through battery and hydrogen storage |
| Capacity Factor | 18–22% (for PV energy in Sohag, Egypt) |
| Energy Resilience | Continuous power supply during peak demand or outages; extended operation with hydrogen storage |
| Sustainability | Aligns with global decarbonization goals; promotes renewable energy usage |
| Payback Period | 8–15 years |
| Return on Investment | ROI: 6–10% over 25–30 year system lifespan |
| Battery Storage | 100–200 kWh capacity provides 2–6 h of short-term storage |
| Hydrogen Storage | Long-term storage with ~60–70% efficiency, ideal for seasonal or extended outages |
| Environmental Impact | Building rooftops use: 800–1000 m2 for PV energy Water usage: 9 L/kg of hydrogen produced |
Disclaimer/Publisher’s Note: The statements, opinions and data contained in all publications are solely those of the individual author(s) and contributor(s) and not of MDPI and/or the editor(s). MDPI and/or the editor(s) disclaim responsibility for any injury to people or property resulting from any ideas, methods, instructions or products referred to in the content. |
© 2025 by the authors. Licensee MDPI, Basel, Switzerland. This article is an open access article distributed under the terms and conditions of the Creative Commons Attribution (CC BY) license (https://creativecommons.org/licenses/by/4.0/).
Share and Cite
Saleeb, H.; El-Rifaie, A.M.; Sayed, K.; Accouche, O.; Mohamed, S.A.; Kassem, R. Optimal Sizing and Techno-Economic Feasibility of Hybrid Microgrid. Processes 2025, 13, 1209. https://doi.org/10.3390/pr13041209
Saleeb H, El-Rifaie AM, Sayed K, Accouche O, Mohamed SA, Kassem R. Optimal Sizing and Techno-Economic Feasibility of Hybrid Microgrid. Processes. 2025; 13(4):1209. https://doi.org/10.3390/pr13041209
Chicago/Turabian StyleSaleeb, Hedra, Ali M. El-Rifaie, Khairy Sayed, Oussama Accouche, Shazly A. Mohamed, and Rasha Kassem. 2025. "Optimal Sizing and Techno-Economic Feasibility of Hybrid Microgrid" Processes 13, no. 4: 1209. https://doi.org/10.3390/pr13041209
APA StyleSaleeb, H., El-Rifaie, A. M., Sayed, K., Accouche, O., Mohamed, S. A., & Kassem, R. (2025). Optimal Sizing and Techno-Economic Feasibility of Hybrid Microgrid. Processes, 13(4), 1209. https://doi.org/10.3390/pr13041209