Abstract
To reveal the variation characteristics of the pressure drop during the corn hot air drying process and provide some reference for designing the drying process, a pressure drop model focusing on the dynamic drying process was established based on the response surface methodology and the variation characteristics of the pressure drop has been analyzed in the present work. In detail, a corn convective drying apparatus was established, and a center rotation regression experiment was conducted followed by a Box–Behnken design by considering hot air temperature (T), corn flow velocity (vc), air velocity (va), and thickness of the materials layer (L) as independent variables while and the pressure drop (δP) was considered as the dependent variable. The results show that the va has the most significant impact on the δP, followed by L, vc, and T. The established model δPRSM shows a better fitting and prediction performance (R2 = 0.969, Cook’s distance < 1) than that of commonly used models. In addition, the minimize δP was determined as 368.392 Pa, and the corresponding drying conditions are T of 60 °C, vc of 0.06 m/s, va of 0.2 m/s, and L of 500 mm, and the hot air temperature should be within 72 °C, which can form the basis for designing the corn hot air drying process.
1. Introduction
Corn is the largest grain product in China. In 2022, China’s total grain production was 686.53 million tons, accounting for approximately a quarter of the world’s total grain production. As a principal cereal crop ranking among the three most crucial grain species, corn serves dual roles as both a fundamental dietary ingredient and premium livestock feed, while simultaneously functioning as a critical industrial resource for bioethanol production and starch-derived manufacturing processes [1,2]. Due to the high moisture content of freshly harvested corn, rot, mildew, and other conditions can occur without sufficient drying in time, resulting in huge economic losses [3]. However, during the drying process of corn, the internal pressure drop is affected by the flow rate of corn, the thickness of the drying layer, and the wind speed. Therefore, the variation characteristics of the pressure drop during corn drying were studied to provide a relevant theoretical basis for the design of corn drying equipment.
In recent years, scholars at home and abroad have performed a lot of research on hot air drying technology of corn, such as Zeng Z. [4], Zhang S. [5], da Silva G.M. [6], and Wei S. [7] et al. who studied corn drying mechanical heat exchanger, energy saving and emission reduction technology, hot pipe technology, and convection heat and mass transfer modeling, respectively. Many studies show that energy utilization is the core content of corn concentrated drying technology. Researchers have also performed a lot of work on corn concentrated drying and energy-saving technology from many aspects. The grain layer pressure drop is a key parameter for designing and optimizing the structure of the drying chamber, and it is also an important reference parameter for selecting the fan power [8,9]. In the drying process, due to the porosity of the bed layer and the viscosity of air, there must be a pressure drop in the hot air pressure when the hot air flows through the grain layer. Too high pressure drop may make it difficult for hot air to flow through the grain layer, and further lead to an increase in drying nonuniformity. Too low-pressure drop may lead to a waste of fan power, too short heat transfer time, and a large amount of heat energy carried by the medium is greatly wasted [10,11]. Therefore, it is necessary to seek a reasonable pressure drop under the premise of ensuring the drying quality.
In the past few decades, researchers have used classical pressure drop models (Ergun model, Shedd model) to study the ventilation resistance of grain layer [12,13,14,15]. For example, Gunasekaran S. and Jackson C. [16] used the Ergun model to study the ventilation resistance of sorghum grain layer, and measured the pressure drop of sorghum with moisture content of 16.5%w.b., 18.5%w.b. and 23%w.b. under the air current range of 0.05 m/s to 0.3 m/s. The result shows that the pressure drop increases with the increase in air velocity and grain layer thickness, and increases with the decrease in water content. Li Q. et al. [9] used Shedd model to simulate the ventilation resistance of hot air flowing through the rice bed, and found that the ventilation resistance of hot air increased with the increase in air velocity. Zhang Y. et al. [17] studied the pressure drop of natural air (velocity range 0.1~0.6 m/s) flowing through the grain layer with a depth range of 100~1000 mm, and found that only when the air velocity is lower than 0.2 m/s, the fitting accuracy of the Ergun pressure drop model can be guaranteed. From the above analysis, it can be seen that although scholars at home and abroad have performed a lot of research on the ventilation resistance of agricultural products with different particle, there are few studies on the ventilation resistance of corn grain layer. In addition, although the Ergun pressure drop model is suitable for describing the characteristic of ventilation resistance of particle agricultural products and can investigate the influence of single factor on pressure drop, it cannot analyze the influence of interaction among various factors on pressure drop.
The response surface method (RSM) is widely adopted as an effective modeling method for optimizing the influence of various factors on the target response in multi-variable systems [18,19]. Within the realm of agricultural research, RSM assumes a pivotal role in optimizing process parameters and constructing predictive models. For example, Geng Z. et al. [20] employed RSM to model and optimize key factors such as dry air temperature, speed, and infrared power. Through RSM modeling and optimization of drying parameters, the optimal drying conditions were determined as air temperature 70 °C, speed 1 m/s, and infrared power 0.225 kW. The results show that there is a strong correlation between the experimental values and the predicted values, and the maximum relative error is 3.15%. In order to deal with the optimization of energetic and exergetic parameters of a hybrid solar dryer, Parhizi Z. et al. [21] considered the effects of air temperature and bed thickness, and optimized exergy performance using RSM combined with the center combination design (CCD) and ideal function (DF). The results indicate that the optimal drying conditions are 63.8 °C air temperature and 2 cm bed thickness, where the parameters achieve the maximum utility function value (D = 0.548). In addition, Zeng Z. et al. [22] utilized RSM and Artificial Neural Network (ANN) to optimize the vacuum drying process of konjac, identifying optimal conditions of 60.34 °C, 0.06 MPa vacuum pressure, and 2 mm thickness. The findings demonstrated that the RSM model exhibited superior predictive performance compared to the ANN model. All in all, as the demand for efficient drying processes increases, RSM has gained increasing attention in optimizing drying parameters and enhancing product quality. The response surface methodology (RSM) has been widely applied in multi-objective optimization within the agricultural drying field.
In summary, in order to find a pressure drop model suitable for describing the actual corn drying process, this paper uses the four-element quadratic center rotation combination design method to establish the δP model of corn ventilation pressure drop under different hot air temperature T (60, 70, and 80 °C), different corn flow velocity vc (0, 0.04, and 0.08 m/s), different hot air velocity va (0.1, 0.3, and 0.5 m/s), and different material thickness L (400, 600, and 800 mm), and was compared with the classical Ergun pressure drop model. The effects of the interaction between different factors on δP were investigated in order to obtain the optimal process parameter combination for optimizing practical corn drying operations [23].
2. Materials and Methods
2.1. Materials
The fresh corn sample (Great Wall 799 #) used in this paper was harvested from a local agricultural machinery cooperative in Yongchuan District, Chongqing, China. The initial moisture content averaged 32.2%d.b. through standardized oven drying at 105 °C, in accordance with conventional gravimetric analysis protocols [24]. The uniform and non-destructive samples were selected for the experiment, and the impurity rate of the sample was less than 5%.
2.2. Equipment Apparatus and Instruments
Figure 1 illustrates the schematic diagram of the experimental apparatus. The system comprises a centrifugal fan, a ventilation pipe, a PC, a test pipe (0.3 m in diameter), a paperless recorder, a screen valve, an anemometer, a pressure drop sensor, and a support bracket. Ten pressure measurement ports are uniformly distributed along the axial direction of the test pipe at 0.1 m intervals, each operable via manual control to meet experimental requirements. A stainless steel screen valve is integrated at the base of the test chamber to regulate corn flow rates by adjusting its aperture. To ensure pressure integrity, the corn storage compartment is hermetically sealed with a sealing ring. During preparatory procedures, the screen valve remains closed while corn grains are loaded vertically into the test pipe until the bed attains a predetermined thickness, after which the centrifugal fan is activated. Experimental measurements include inlet air velocity (va) via the anemometer, ambient temperature via a calibrated thermometer, and transient pressure drop across the corn bed via the pressure drop sensor, with all data logged by the paperless recorder. Technical specifications of the instrumentation are cataloged in Table 1, while operational parameters of the variable-speed fan are detailed in Table 2.
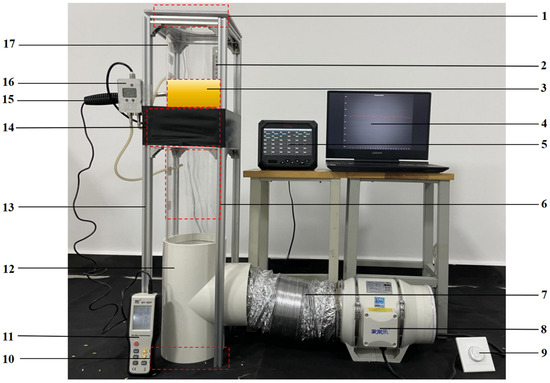
Figure 1.
The experimental platform. Note: 1—he material inlet; 2—the ruler; 3—the experimental chamber; 4—the PC; 5—the paperless recorder; 6—the air inlet; 7—the air duct; 8—the centrifugal fan; 9—the frequency converter; 10—the corn storage area; 11—the air velocity sensor; 12—the tee pipe; 13—the support bracket; 14—the screen valve; 15—the anemometer; 16—pressure drop sensor; 17—the measurement holes.

Table 1.
Details of the experimental instruments.
Table 2.
Parameters related to centrifugal fans.
In order to set the different levels of the corn flow velocity vc, a valve with six fan-shaped screens was designed and insulted at the bottom of the experimental chamber, as shown in Figure 2. The different vc are controlled by the valve opening degree l; in detail, the vc is determined by the mass of corn flowing out of the valve per unit time (vc = m/ρcS). The correlations between the vc and l are primarily ascertained and tabulated in Table 3. And the approximation of the measured vc is used for further calculations.
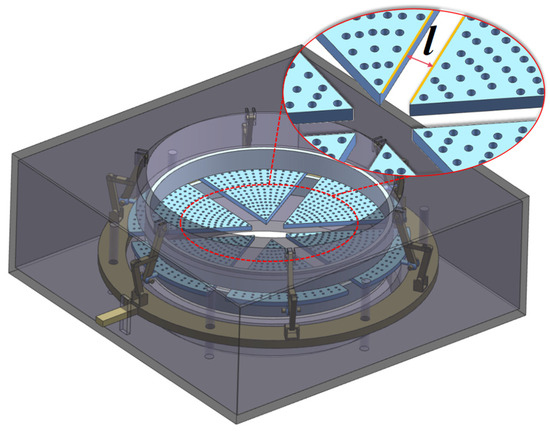
Figure 2.
The schematic diagram of the valve.
Table 3.
The correlations between the vc and l.
2.3. Experimental Design
In order to achieve the optimum comparability to the actual situation of corn hot air drying, the hot air temperature T, corn flow velocity vc, air velocity va, and thickness of paving materials L were selected as independent variables, and the grain layer pressure drop δP was used as the dependent variable. The central rotation combination experimental design method was used to investigate the effects of various factors and the interaction among factors on the pressure drop. The level of each factor of the independent variable is shown in Table 4.
Table 4.
Experimental design.
2.4. The Fitting Pressure Drop Models
In order to verify the reliability of the pressure drop model (δPRSM) that was established based on the RSM, the commonly used pressure drop models including Ergun mode, Shedd’s equation, and Hukill equation have been adopted to be the control models in the present work, which are respectively expressed as follows.
2.4.1. Ergun Model
The classic Ergun pressure drop model (δPErg) was selected in this paper to fit the experimental data. The Ergun model expression is shown in Formula (1) [25]:
where δPErg is the pressure drop calculated by the Ergun model, Pa; L is the grain layer thickness, m; va is the hot air velocity, m/s; ε is the porosity of grain layer, ε = 0.65 [18]; dc is the equivalent diameter of single corn, m of which dc can be calculated by the following Equation (2) [26].
where L0, W0, and H0 are the length, width and thickness of a single corn, m, respectively. and the L0, W0, and H0 can be measured, respectively. A total of 50 corn kernels with similar size were randomly selected to be the measured samples, the measured results are depicted in Figure 3, and the average dc is ascertained to be 7.29 × 10⁻⁴ m.
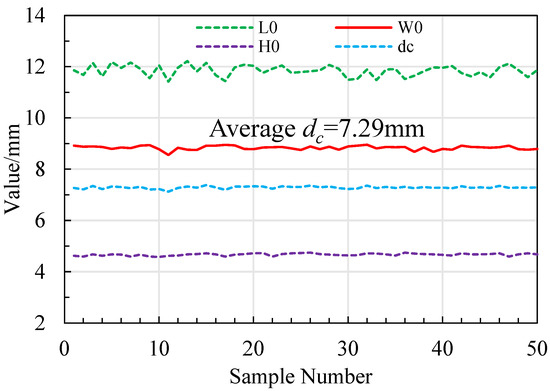
Figure 3.
The measured three-axis size of the corn kernels.
2.4.2. Shedd’s Equation
The Shedd’s equation is easy to incorporate into mathematical models for predicting the air pressure drop in stored grains [13], which has been widely used for estimating the pressure drops during the grain layer drying processes. The Shedd’s equation is expressed in Equation (3) [27].
where δPShded is the pressure drop calculated by the Shedd’s equation, Pa; VShedd is the inlet air flow rate, m3·s−1·m−2; L is the thickness of the grain layer, m; the A1 and B1 are the empirical coefficients which can be simulated by the experimental data.
2.4.3. Hukill Equation
The Hukill equation was also adopted to verify the reliability of the pressure drop model as well as investigate the pressure drop during the corn drying process, which is an empirical model proposed by Hukill and Ives in 1955 [28]. The Hukill equation is expressed in Equation (4).
where δPHukill is the pressure drop calculated by the Hukill equation, Pa; VHukill is the inlet air flow rate, m3·s−1·m−2; L is the thickness of the grain layer, m; the A2 and B2 are the empirical coefficients which can be simulated by the experimental data.
2.5. Statistical Analysis
In the present work, coefficient of determination (R2), mean square error (MSE), mean absolute error (MAE), and root mean square error (RMSE) are used to analyze the experimental results. The R2, MSE, MAE, and RMSE can be calculated by the following Equations (5)–(8), respectively [29,30].
3. Results and Discussion
3.1. Experimental Results
Hongtu Zhang [31] and colleagues conducted experimental research on the pressure drop characteristics of negative pressure sampling drill rods. By employing dimensional analysis methods with experimental pressure drop data, they established an additional pressure drop coefficient model that can accurately predict the pressure drop in drill rods. According to the experimental design presented in Table 4 above, the paper details the experimental scheme of the four-element quadratic center rotation combination experiment as shown in Table 5 below. Experiments were performed sequentially according to the experimental order, each experiment was quickly measured three times and the average value was used for the calculations. The experimental results are tabulated in Table 5.
Table 5.
Experimental design and the results.
3.2. Discussion and Analysis
3.2.1. ANOVA Analysis
Substituting the experimental results shown in Table 5 into the Design-Expert 12 software (Produced in the United States Stat-Ease company development), the variance analysis results of the pressure difference δP are obtained, as shown in Table 6.
Table 6.
The results of ANOVA for δP.
According to the variance analysis results shown in Table 6, it can be seen that the p-value of the model is less than 0.0001 while the lack of fit (0.1856) is higher than 0.05, indicating that the model is significant and the lack of fit is not significant. Moreover, it can be seen from Table 6 that the value of the coefficient of variation C.V. is 2.3%, indicating that only 2.3% of the experimental data cannot be explained by the established model. And the values of the AdjR2 and PreR2 are determined as 0.9879, and 0.9746, respectively, and the AdjR2 is in reasonable agreement with the PreR2. By comprehensively analyzing the above main results, it can be concluded that the model shows a good fit performance and can be used for further analysis.
On the other hand, it can also be drawn from the p-value test of the ANOVA that the terms of T, vc, va, L, T·va, T·L, vc·va, vc·L, va·L, T2, vc2, and L2 have significant influence (p < 0.0001) on the response δP. For the single factor, the F-value of the terms T, vc, va, and L, respectively, are determined as 985.56, 100.14, 866.25, and 7423.23, indicating that the influence of the single factor on the response in descending order is vc < va < T < L. This means that the material’s thickness has the most significant influence on δP, followed by hot air temperature, hot air velocity, and corn flow velocity. The established δPRSM model is expressed in Equation (9), and the coefficient of determination R2 of the model is 0.9989, which is close to 1 [32], indicating that the established model can be used to predict the δP during the corn convective drying process.
where T is hot air temperature, °C; vc is corn flow velocity, m/s; va is hot air velocity, m/s; L is thickness of corn drying layer, mm; δPRSM is pressure difference, Pa.
3.2.2. The Influence of Factors on Pressure Difference
Based on the ANOVA analysis above, the influences of the joint actions among the factors on the response δPRSM, the influence of individual action on the response δPRSM, and the corresponding statistical analysis have been carried out by Design-expert 12 software, the main results are depicted in Figure 4. Part A shows the joint graphical 3D analysis as a function of each considered variable, Part B shows the influence of each considered variable on the response, and Part C shows the statistical analysis including the Normal plot of residuals, Residuals vs. Run, Box–Cox plot for power transforms, and Cook’s distance.
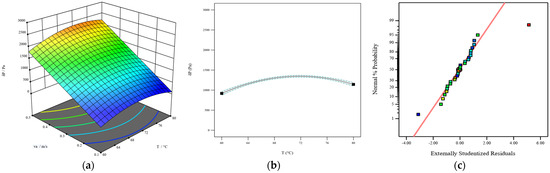
Figure 4.
The interaction influence of T and va on pressure drop (a), individual action (b), and statistical analysis (c).
As can be seen from Part A-1 in Figure 4, the maximum δP occurs in the ranges of 0.45 m/s ≤ va ≤ 0.5 m/s and 68 °C ≤ T ≤ 72 °C, while the minimum δP occurs at the point of T = 60 °C and va = 0.1 m/s. As for the influences of single factors on the response δP, which obviously can be drawn from the individual action shown in Part B that δP increases with an increase in L and va. This may be due to the fact that the length as well as the tortuosity of the air thoroughfare increases with an increase in L, and thus causes an increase in δP. On the other hand, δP decreases with an increase in vc, which might be due to the fact that the porosity of the corn layer increases with increasing vc, that is, the higher porosity, the lower ventilation resistance. Similar results have been reported in the paddy grain layer convective drying process by Li T. et al. [11] in 2018. Interestingly, Part B-1 shows that δP increases with an increase in T under 72 °C, which is beyond the 72 °C threshold. By comprehensively considering the drying quality of the product, it can be stated that in order to have a reasonable δP during the corn convective drying process, the hot air temperature should be 72 °C.
The statistical analysis of the established model δPRSM is presented in part c of Figure 4, Figure 5, Figure 6, Figure 7 and Figure 8. Externally Studentized Residuals are one of the most important indexes used in regression analysis to detect outliers, model hypotheses, and model fitting effects. It can be seen from Part C-1 that from a total of 30 sets of experimental data, the absolute values of Externally Studentized Residuals for the 28 data sets are within the ranges of 2~3 [33], with only two data sets being considered abnormal data and may affect the model fitting performance. However, the reasonable range of the index according to the statistical analysis is determined to be within the range of −3.87982~3.87982, and it can be seen from Figure 5c that there is only one set of data that is considered to be unreasonable. As obviously seen in Figure 5c, the abnormal data set is determined as the 17th data set. Cook’s distance is the key index to evaluate the impact of abnormal data on the model fitting performance [33]. Generally speaking, Cook’s distance of the investigated data set is within the threshold, and the data set is considered to have an acceptable influence on the model fitting performance. It can be seen in Figure 8c that the threshold of the model is ascertained to be 1, and Cook’s distance (0.91) of the 17th data set is within the threshold 1. Accordingly, it can be stated that a total of 30 sets of the experimental data are considered to be reasonable, and the established model δPRSM shows a good fitting performance.
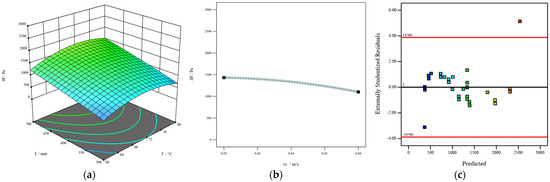
Figure 5.
The interaction influence of T and L on pressure drop (a), individual action (b), and statistical analysis (c).
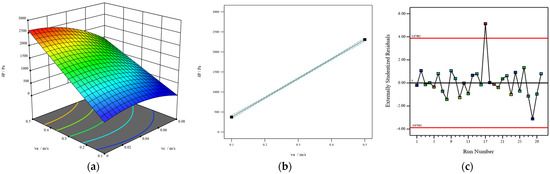
Figure 6.
The interaction influence of vc and va on pressure drop (a), individual action (b), and statistical analysis (c).
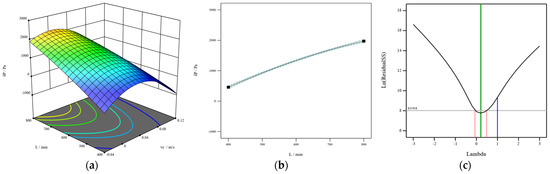
Figure 7.
The interaction influence of vc and L on pressure drop (a), individual action (b), and statistical analysis (c).
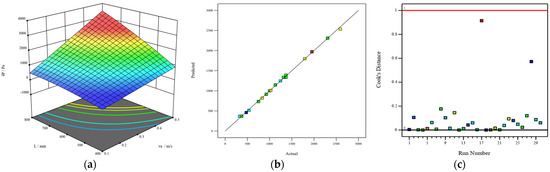
Figure 8.
The interaction influence of va and L on pressure drop (a), individual action (b), and statistical analysis (c).
3.2.3. Model Verification
In order to verify the feasibility of the established regression model δPRSM shown in the Equation (9), 12 sets of added experiments were conducted, as shown in Table 7. In order to avoid repetition between the experimental design shown in Table 5 and the verification experiments shown in Table 6, different levels of T (62 °C, 68 °C, and 74 °C), vc (0.03 m·s−1, 0.05 m·s−1, and 0.07 m·s−1), va (0.15 m·s−1, 0.25 m·s−1, and 0.35 m·s−1), and L (450 mm, 550 mm, and 650 mm) were selected. And the experimental data were inputted into Equations (1), (3), (4), and (9) for calculating the pressure drop model predicted by the Ergun model (δPEur), Shedd’s equation (δPShedd), Hukill equation (δPHukill), and the established regression model (δPRSM), respectively. The predicted pressure drops were compared with the experimental values, and the indexes of R2, MSE, MAE, and RMSE shown in Equations (5)–(8) were adopted to evaluate the predicting performance of the above models, the results are depicted in Figure 9.
Table 7.
The verification experimental design.
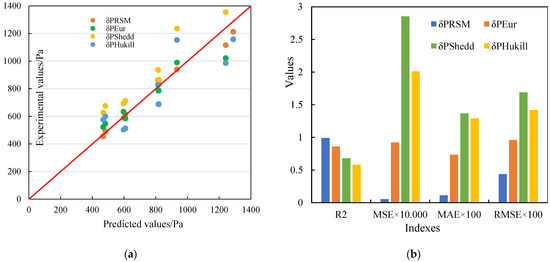
Figure 9.
The comparison results (a) and the statistical results (b).
The comparison between the experimental and predicted results is depicted in Figure 9a, which shows that the array group representing the RSM prediction values (δPRSM) are closest to the experimental values, followed by δPEur, δPShedd, and δPHukill. It can be deduced that the established pressure drop model in the present work shows a better prediction performance than the commonly used models. To further confirm the deduction, statistical analysis was conducted, and the results are shown in Figure 9b. It is clear that the R2 of δPRSM is significantly higher than that of δPEur, δPShedd, and δPHukill, and the R2 of the δPRSM, δPEur, δPShedd, and δPHukill, is determined as 0.969, 0.859, 0.680, and 0.581, respectively. The MSE of the δPRSM, δPEur, δPShedd, and δPHukill is determined as 1911.522, 9222.59, 28,529.49, and 20,098.366, respectively. The MAE of the δPRSM, δPEur, δPShedd, and δPHukill, is determined as 11.228, 73.486, 136.798, and 129.068, respectively, and the RMSE of the δPRSM, δPEur, δPShedd, and δPHukill is determined as 43.721, 96.034, 168.907 and 141.769, respectively. Above all, the δPRSM has the highest R2 but the lowest MSE, MAE, and RMSE, concluding that the δPRSM established in the present work shows a good prediction performance and can be used to predict the pressure drop during the corn hot air convective drying process.
3.2.4. Drying Process Optimization
Based on the above analysis, the optimization function in Design-expert 12 software was used to optimize the corn hot air convective drying process by considering the minimum pressure drop as the goal. The solutions are tabulated in Table 8.
Table 8.
The solution results of the comprehensive optimization.
According to the comparison of the pressure drop in Table 8, it can be found that all the results are close to the single objective optimization value, and the desirability for all the solutions is higher than 0.9, indicating that the solutions are reliable. According to the desirability of the evaluations, the first group of schemes is the best, and the result is the comprehensive optimal solution, that is, when the drying temperature is 60 °C, corn flow velocity is 0.06 m/s, hot air velocity is 0.2 m/s, and thickness of layer is 500 mm, the pressure drop has a minimize value of 368.392 Pa, which can provide some reference for the corn practical drying process.
4. Conclusions
In the present work, RSM was adopted to establish the pressure drop model and investigate the influences of the drying conditions on the pressure drop during the corn drying process. The main conclusions depending on the results can be summarized as follows:
- (1)
- During the corn drying process, the va has the most significant impact on the pressure drop, followed by L, vc, and T. In detail, δPRSM is positively correlated with factors va and L, and negatively correlated with vc.
- (2)
- An empirical pressure drop model δPRSM focusing on the corn hot air convective drying process was established and verified. The determination coefficient R2 of the model is determined to be 0.969, and Cook’s distances for the model are within 1, indicating that the model shows a good fitting performance.
- (3)
- By considering the minimum pressure drop as the goal, the optimal corn hot air drying conditions were determined to be a drying temperature of 60 °C, corn flow velocity of 0.06 m/s, hot air velocity of 0.2 m/s, and layer thickness of 500 mm, and the corresponding minimum pressure drop is 368.392 Pa. This set of parameter values can provide theoretical parameter values for the design of corn drying equipment.
The obtained conclusions can provide some references in the corn hot air drying process. Though the model can be used to provide some reference for designing the corn drying process, further work should be focused on combining the pressure drop and drying behavior of the corn material.
Author Contributions
Conceptualization, H.Z. and B.L.; methodology, H.Z. and C.L.; software, H.Z. and C.L.; validation, H.Z.; formal analysis, H.Z.; investigation, H.Z. and X.Z.; resources, B.L. and G.P.; data curation, H.Z. and X.Z.; writing—original draft preparation, H.Z. and B.L.; writing—review and editing, H.Z. and B.L.; visualization, G.P. and B.L.; supervision, B.L. and G.P.; project administration, G.P.; funding acquisition, B.L. All authors have read and agreed to the published version of the manuscript.
Funding
This research was funded by National Natural Science Foundation of China (Grant No. 32401733); Chongqing Postdoctoral Science Foundation Project (CSTB2022NSCQ-BHX0016); China Postdoctoral Science Foundation (Grant No. 2023T160768); Special Support Project of Chongqing Postdoctoral Science Foundation (Grant No. 2021XM1034).
Data Availability Statement
The original contributions presented in this study are included in the article. Further inquiries can be directed to the corresponding author.
Acknowledgments
The authors would like to thank to the editors and reviewers for their valuable and constructive comments.
Conflicts of Interest
The authors declare that we have no known competing financial interests or personal relationships that could have appeared to influence the work reported in this paper.
References
- Liu, D.; Liu, Z.; Liu, S.; Feng, T. Research on drying characteristics of corn kernel based on COMSOL porous media model. J. Food Process Eng. 2024, 47, e14711. [Google Scholar] [CrossRef]
- Gao, X.; Lin, Z.; Wang, D.; Xin, S.; Liu, G. Study on the influencing factors and moisture variation of maize deep-layer drying. J. Shenyang Agric. Univ. 2024, 55, 574–582. [Google Scholar]
- Zhu, J.; Wang, Q. Analysis of Hot Air Drying Characteristics of Corn Grain Considering the Effect of Flow Field. Anal. Test. 2022, 28, 164–167. [Google Scholar] [CrossRef]
- Zeng, Z.; Li, B.; Li, C.; Huang, J.; Ou, W.; Li, C. Establishment of a New Heat Transfer Model for Corn Drying System Based on BP Neural Network. Res. Agric. Mech. 2021, 43, 237–244. [Google Scholar] [CrossRef]
- Zhang, S.; Kong, N.; Zhu, Y.; Zhang, Z.; Xu, C. 3D Model-Based Simulation Analysis of Energy Consumption in Hot Air Drying of Corn Kernels. Math. Probl. Eng. 2013, 2013 Pt 7, 601–622. [Google Scholar] [CrossRef]
- Da Silva, G.; Ferreira, A.; Coutinho, R.; Maia, C. Energy and exergy analysis of the drying of corn grains. Renew. Energy 2021, 163, 1942–1950. [Google Scholar]
- Wei, S.; Wang, Z.; Xie, W.; Wang, F.; Chen, P.; Yang, D. A heat and mass transfer model based on multi-component heterogeneity for corn kernel tempering drying: Development and application. Comput. Electron. Agric. 2020, 171, 105–109. [Google Scholar]
- Li, C. Theoretical analysis of exergy transfer and conversion in grain drying process. Trans. Chin. Soc. Agric. Eng. (Trans. CSAE) 2018, 34, 1–8. [Google Scholar] [CrossRef]
- Li, Q.; Hu, T.; Yu, Z.; Yang, Y.; Fang, Y. Experimental study of fluid drag in granary ventilation. J. Hydrodyn. Ser. A 2006, 21, 473–478. [Google Scholar]
- Li, C.; Fang, Z.; Mai, Z. Design and Test on Porosimeter for Particle Material. Trans. Chin. Soc. Agric. Mach. 2014, 45, 200–206. [Google Scholar] [CrossRef]
- Li, T.; Li, C.; Li, C.; Fang, Z. Porosity of flowing rice layer: Experiments and numerical simulation. Biosyst. Eng. 2019, 179, 1–12. [Google Scholar] [CrossRef]
- Brzinski, T.; Mayor, P.; Durian, D. Depth-Dependent Resistance of Granular Media to Vertical Penetration. Phys. Rev. Lett. 2013, 111, 168002. [Google Scholar] [CrossRef]
- Kashaninejad, M.; Tabil, L. Resistance of bulk pistachio nuts (Ohadi variety) to airflow. J. Food Eng. 2009, 90, 104–109. [Google Scholar] [CrossRef]
- Yazdanpanah, F.; Sokhansanj, S.; Lau, A.; Lim, C.; Bi, X.; Melin, S. Airflow versus pressure drop for bulk wood pellets. Biomass Bioenergy 2011, 35, 1960–1966. [Google Scholar] [CrossRef]
- Petre, C.; Larachi, F.; Iliuta, I.; Grandjean, B. Pressure drop through structured packings: Breakdown into the contributing mechanisms by CFD modeling. Chem. Eng. Sci. 2003, 58, 163–177. [Google Scholar] [CrossRef]
- Gunasekaran, S.; Jackson, C. Resistance to airflow of grain sorghum. Trans. ASAE 2013, 31, 1237–1240. [Google Scholar] [CrossRef]
- Zhang, Y.; Li, C.; Ma, X.; Li, J.; Zou, X.; Wang, R. Experiment and Numerical Simulation of Layer Resistance Parameters in Dryer. Trans. Chin. Soc. Agric. Mach. 2014, 45, 216–221. [Google Scholar] [CrossRef]
- Li, B.; Peng, G.; Luo, C.; Qiu, G.; Yang, L. Optimization of rapeseed vacuum drying technology parameter by response surface methodology. Food Ferment. Ind. 2016, 42, 105–110. [Google Scholar] [CrossRef]
- Mezher, Z.; Tameemi, H.; Al-Shati, A. Thermal cracking process on atmospheric residue from Al-Dewaniya petroleum refinery using Response Surface Methodology (RSM). AIP Conf. Proc. 2023, 2787, 18. [Google Scholar] [CrossRef]
- Geng, Z.; Wang, H.; Torki, M.; Beigi, M.; Zhu, L.; Huang, X.; Yang, X.; Hu, B. Thermodynamically analysis and optimization of potato drying in a combined infrared/convective dryer. Case Stud. Therm. Eng. 2023, 42, 102671. [Google Scholar] [CrossRef]
- Parhizi, Z.; Karami, H.; Golpour, I.; Kaveh, M.; Szymanek, M.; Blanco-Marigorta, A.M.; Marcos, J.D.; Khalife, E.; Skowron, S.; Adnan Othman, N.; et al. Modeling and Optimization of Energy and Exergy Parameters of a Hybrid-Solar Dryer for Basil Leaf Drying Using RSM. Sustainability 2022, 14, 8839. [Google Scholar] [CrossRef]
- Zeng, Z.; Chen, M.; Wang, X.; Wu, W.; Zheng, Z.; Hu, Z.; Ma, B. Modeling and Optimization for Konjac Vacuum Drying Based on Response Surface Methodology (RSM) and Artificial Neural Network (ANN). Processes 2020, 8, 1430. [Google Scholar] [CrossRef]
- Li, B.; Li, C.; Huang, J.; Li, C. Application of Artificial Neural Network for Prediction of Key Indexes of Corn Industrial Drying by Considering the Ambient Conditions. Appl. Sci. 2020, 10, 5659. [Google Scholar] [CrossRef]
- Mohsenin, N. Physical Properties of Plant and Animal Materials. J. Biomed. Mater. Res. Part B Appl. Biomater. 1986, 11, 83–89. [Google Scholar] [CrossRef]
- Oliveros, N.; Hernández, J.; Sierra-Espinosa, F.; Guardián-Tapia, R.; Pliego-Solórzano, R. Experimental study of dynamic porosity and its effects on simulation of the coffee beans roasting. J. Food Eng. 2017, 199, 100–112. [Google Scholar] [CrossRef]
- Kenghe, R.; Nimkar, P.; Shirkole, S.; Shinde, K. Airflow resistance in soybean. Int. Agrophysics 2012, 26, 137–143. [Google Scholar] [CrossRef]
- Giner, S.; Denisienia, E. Pressure Drop Through Wheat as Affected by Air Velocity, Moisture Content and Fines. J. Agric. Eng. Res. 1996, 63, 73–85. [Google Scholar] [CrossRef]
- Chokphoemphun, S. Moisture content prediction of paddy drying in a fluidized-bed drier with a vortex flow generator using an artificial neural network. Appl. Therm. Eng. Des. Process. Equip. Econ. 2018, 145, 630–636. [Google Scholar] [CrossRef]
- Yogendrasasidhar, D.; Setty, Y. Drying kinetics, exergy and energy analyses of Kodo millet grains and Fenugreek seeds using wall heated fluidized bed dryer. Energy 2018, 151, 799–811. [Google Scholar] [CrossRef]
- Ghodsiyeh, D.; Davoudinejad, A.; Hashemzadeh, M.; Hosseininezhad, N.; Golshan, A. Optimizing Finishing Process in Wedming of Titanium Alloy (Ti6Al4V) by Brass Wire based on Response Surface Methodology. Res. J. Appl. Sci. Eng. Technol. 2013, 5, 1290–1301. [Google Scholar] [CrossRef]
- Zhang, H.; Li, B.; Zhang, J.; Wei, J. Pressure Drop Characteristic of Dilute Negative Pressure Pneumatic Conveying. Part. Sci. Technol. 2019, 39, 101–107. [Google Scholar] [CrossRef]
- Weisberg, S. Applied Linear Regression, 4th ed.; Wiley: Hoboken, NJ, USA, 2014. [Google Scholar]
- Cook, R. Detection of influential observation in linear regression. Technometrics 1977, 19, 15–18. [Google Scholar] [CrossRef]
Disclaimer/Publisher’s Note: The statements, opinions and data contained in all publications are solely those of the individual author(s) and contributor(s) and not of MDPI and/or the editor(s). MDPI and/or the editor(s) disclaim responsibility for any injury to people or property resulting from any ideas, methods, instructions or products referred to in the content. |
© 2025 by the authors. Licensee MDPI, Basel, Switzerland. This article is an open access article distributed under the terms and conditions of the Creative Commons Attribution (CC BY) license (https://creativecommons.org/licenses/by/4.0/).