Article

A Prediction of the Monthly Average Daily Solar Radiation on a Horizontal Surface in Saudi Arabia Using Artificial Neural Network Approach

by
Waleed A. Almasoud
1,*,
Saleh M. Al-Sager
1,
Saad S. Almady
1,
Samy A. Marey
2,
Saad A. Al-Hamed
1,
Abdulrahman A. Al-Janobi
1 and
Abdulwahed M. Aboukarima
1,*
1
Department of Agricultural Engineering, College of Food and Agriculture Sciences, King Saud University, P.O. Box 2460, Riyadh 11451, Saudi Arabia
2
Deanship of Scientific Research, King Saud University, P.O. Box 2460, Riyadh 11451, Saudi Arabia
*
Authors to whom correspondence should be addressed.
Processes 2025, 13(4), 1149; https://doi.org/10.3390/pr13041149
Submission received: 20 February 2025 / Revised: 16 March 2025 / Accepted: 3 April 2025 / Published: 10 April 2025
(This article belongs to the Section Energy Systems)

Abstract

:
When planning a solar energy conversion system, having sufficiently reliable values of the monthly average daily solar radiation (MADSR) on a horizontal surface is essential. Traditionally, estimates based on other climatological variables for which more information is available have been relied upon to compensate for the lack of direct solar radiation measurements. Solar radiation varies widely, which requires the creation of site-specific forecast models. By using artificial neural network (ANN) models or similar methods using historical datasets, the monthly average daily solar radiation can be easily assessed. To verify the validity of the established ANN model, a series of analyses was performed using the mean squared error, the coefficient of determination (R2), and the mean absolute error. The study used a dataset collected from nine weather stations in Saudi Arabia from 1985 to 2000. The input parameters for the ANN model were the maximum air relative humidity, latitude, the maximum ambient air temperature, longitude, the minimum ambient air temperature, the minimum air relative humidity, sunshine duration, location altitude, and the corresponding month. The R2 for the whole test dataset was 0.8449. Furthermore, a sensitivity analysis using the established ANN model showed that site elevation (location altitude) had the most significant effect on MADSR on a horizontal surface, with a contribution value of 14.66%. The analysis results show that the ANN model accurately estimates MADSR on horizontal surfaces regardless of seasonal variations in weather conditions. Furthermore, this work is important not only for its contribution to the shape of information in solar radiation forecasting but also for establishing the practical application of ANNs in renewable energy management. The results of this work will help improve the utilization of solar energy and support sustainable energy efforts. Furthermore, the proposed ANN model is believed to be useful for predicting MADSR on horizontal surfaces in other locations in Saudi Arabia with similar climatic conditions to the study sites. Furthermore, the ANN approach may be functional to the basic strategy of a solar arrangement and is suitable for forecasting other meteorological data.

1. Introduction

The shift to a more sustainable and low-carbon energy system depends heavily on renewable energy sources like wind, solar, hydropower, and biofuels. In recent years, generating capacity has increased significantly, particularly for solar and wind power, thanks to regulatory support and notable cost reductions. With the share of solar and wind energy increasing to 25%, renewable energy sources will generate over 42% of the world’s electricity by 2028 [1].
Due to the population explosion and technological advances, the world’s energy demand is growing rapidly. Therefore, to meet future energy demands, it is important to rely on reliable, cost-effective, and long-lasting renewable energy sources. Solar energy, among other renewable energy sources, is a promising, freely accessible energy source to address the long-term problem of the energy crisis [2]. However, it has been documented as one of the most readily available renewable energy sources, meeting a significant portion of the world’s energy needs [3,4,5], for several reasons, including the fact that the sun produces energy at a rate of 3.8 × 10²³ kW. Of this total, only a tiny fraction, about 1.8 × 10¹⁴ kW, is received by the earth, which is about 150 million km away from the sun. About 60% of this amount, or 1.08 × 10¹⁴ kW, reaches the earth’s surface. The rest is reflected into space and absorbed by the atmosphere. Even if we could convert just 0.1% of this energy with only a 10% efficiency, this would be four times the world’s total generating size of about 3000 GW [6]. Furthermore, solar energy is an attractive form of energy in the world as it is non-exhaustive and provides a steadily increasing output power compared to other energy sources [7].
The mean extraterrestrial radiation intensity or flux density at the mean Earth-Sun distance and perpendicular to the sun’s rays is called the solar constant and, according to the latest estimates, is 1366.1 W/m2. The energy emitted by the sun is intermittent and varies throughout the day and the seasons. Once this power concentration is around the earth’s surface, it is reduced by a factor of four. A one-half decrease is because of losses during passage through the earth’s atmosphere. Accordingly, the average horizontal radiation throughout the year is about 170 W/m2. When 170 W/m2 is collected over a year, it would have an impact of 5.4 GJ/m2 on the ground, about the same amount of energy as 140 m3 of natural gas, 200 kg of coal, or one barrel of oil [6].
The most crucial factor in solar conversion and renewable energy applications is the daily global solar radiation measured on a horizontal surface [8]. Therefore, precise information on solar radiation through forecast or measurement is considered a fundamental step in assessing the availability of solar energy [9]. However, the forecasting phase aims to reduce uncertainties and provide a benchmark for controlling the generated power [10]. Nevertheless, solar radiation is measured directly using pyranometers at weather stations. Unlike other essential weather variables, such as air temperature, precipitation, air relative humidity, etc.,) that are readily available, maintaining and calibrating pyranometers is costly and complex, leading to an absence of dependable data for the amount of solar radiation in many developing countries, negatively impacting climate change and research activities that depend on it [11]. Thus, due to the lack of solar measurements at various locations worldwide, various solar radiation approaches have been established to predict global solar radiation [12,13].
Saudi Arabia seeks to differentiate its energy base by utilizing renewable properties. Robust solar radiation, with an annual average value of more than 2200 kWh/m2, is one of the country’s most important renewable energy base strengths [14]. Due to the availability of solar radiation in several parts of the country, Saudi Arabia has decided to implement the “Saudi Arabia 2030 Vision” program that includes a plan to gradually transition from fossil fuels to renewable energy, mainly solar energy, in the near future [15]. The country has set a goal of developing 9.5 GW of renewable energy by 2030, most of which will come from solar energy [16]. However, the situation has become such that the sustainable development of Saudi Arabia requires a fundamental change in solar energy conservation strategies for various applications, especially for electricity generation in various sectors [16]. Therefore, an estimation of solar radiation is required in this situation. Since the measurement of this radiation is not possible in many locations, several models have been anticipated to predict solar radiation [17,18,19,20]. These models are offered to predict solar radiation using different methods, such as empirical procedures. Conversely, recent artificial neural network (ANN) methods that rely on using different forms of data, such as meteorological parameters and geographical data, can be employed to estimate solar radiation [21,22,23,24,25]. Numerous revisions have been supported to investigate the usefulness of different solar models in calculating solar irradiance at different locations. Generally, models based on meteorological variables are the most widely considered and used worldwide. The most commonly used meteorological characteristics to forecast global solar radiation are relative humidity, air temperature, and the duration of sunshine. These models are grounded in empirical data [25,26]. Furthermore, Figure 1 shows common approaches for estimating solar radiation as described in the literature [27]. Figure 1 visually represents the different methods used to address renewable energy integration challenges [25].
Although it is costly and time-consuming, measuring solar radiation is necessary for solar energy installations. However, several techniques can be used to guess and predict solar radiation in any region without the high cost and effort of installing and maintaining measurement devices such as pyranometers. These techniques can potentially reduce the cost of installing and maintaining measurement setups. In order to forecast solar radiation in various parts of the planet, a number of empirical models have been created. Three types of empirical models can be distinguished: models based on sunshine, models based on the temperature, and models based on clouds [30]. Since then, with the advancement of computer science and machine learning techniques, several more solar radiation forecasting models have been developed. Each method has its advantages, limitations, difficulties, and accuracy [31].
Recently, there has been a growing trend to use a soft-computing approach in forecasting techniques, especially in solar radiation prediction [32]. The most commonly used machine learning method is the ANN method. ANNs are increasingly being used to address complex real-world challenges and are recognized as general function approximators. Their increasing use in data analysis highlights their possibility as a practicable alternative to traditional approaches in numerous scientific fields. ANNs can accurately approximate any continuous nonlinear relationship. ANN-based models have been employed to model several solar radiation parameters [5]. Moreover, various researchers have continuously improved the performance of ANNs in predicting solar radiation [32]. Hassan et al. [33] evaluated two types of neural networks, radial basis function networks and feedforward neural networks to estimate daily solar radiation levels in different cities in Libya. The models were trained on a comprehensive dataset from 25 cities in Libya, covering six years. Important parameters such as latitude, longitude, and month are considered during training. The network is then tested using data that are not in the training phase. This study’s results showed that the two networks’ performance in testing differs significantly. In particular, the radial basis function network is the best-performing network with a performance metric of 93%, compared to the slightly lower performance of the feedforward neural network at 93.15%. Furthermore, many solar radiation models have provided valid estimates by applying ANNs in different settings using input variables appropriate for specific climatic conditions. Still, the predictions are less accurate at regional scales [34]. Since radiation meteorological stations are relatively widely distributed even in developed countries, developing an indirect model based on common measurements at secondary network stations is interesting. However, they developed a monthly global solar radiation model based on a simple ANN structure, using geographical, air temperature, and topographical data from 105 weather stations representative of the whole of Spain. The estimate fits 1260 monthly data with a relative root-mean-square error value of about 6% [35].
Chiteka and Enweremadu [36] reported that dependable data on solar radiation are a prerequisite for well-founded designs and the implementation of solar energy supply systems. They presented an ANN approach for forecasting global horizontal solar radiation for key locations in Zimbabwe. The forecasting of global horizontal solar radiation was performed using geographical data on latitude, altitude, and longitude and meteorological information on air pressure, air relative humidity, the clarity index, and average air temperature. An ANN model with an input layer with seven inputs was used, along with a hidden layer and an output layer with one output. The ANN with 10 neurons and Tansig transfer functions in both the input and output layers was initiated to be the excellent predictive model among all the models evaluated. The ANN model achieved a coefficient of determination of 99.894%, a root mean square error of 0.223 kWh/m2/day, an absolute mean error of 0.17 kWh/m2/day, and an absolute mean error of 2.56%. Statistical analyses of the results showed that the clarity index, air temperature, and air relative humidity contributed significantly to the overall performance of the ANN model by 19%, 18%, and 17%, respectively.
Recent research shows that empirical and machine learning models for predicting solar radiation perform differently in different parts of the world, although they are still well beyond the prediction limits. Thus, using empirical models chosen from the literature or creating a new one using the ANN method is a current area of interest in identifying the most accurate models for any given region. The current study examined the same problem for various Saudi Arabian regions. Therefore, the aim of this study is to develop an accurate monthly average daily solar radiation (MADSR) model on a horizontal surface of the study site, for which a neural network-based model is currently missing, including maximum air relative humidity, sunshine hour, minimum ambient air temperature, maximum ambient air temperature, latitude, minimum air relative humidity, longitude, the altitude of the site, and the corresponding month as inputs, although several solar energy projects are planned in Saudi Arabia.
This work’s originality includes utilizing ANN analysis to approximate the intensity of solar radiation throughout the year in various parts of Saudi Arabia and examining the impact of multiple inputs on the MADSR on a horizontal surface. Additionally, a thorough literature analysis on solar radiation forecasting methods is the basis for the motivation to create an ANN model for MADSR prediction on a horizontal surface. Because ANN models enable more input variables than empirical models, which increases their dependability, it has been discovered that they can reliably estimate solar radiation at various places and under various climatic conditions. Nonetheless, the findings of this study can offer academics and society a fresh viewpoint for the next studies on solar forecasting. Moreover, it can be argued that ANN-based forecasts are more precise than empirical models [37].

2. Materials and Methods

2.1. Study Regions and Datasets

Saudi Arabia occupies a massive area of 2,150,000 km2 and is positioned at the following coordinates 23.8859° N and 45.0792° E [38]. The World Bank claims that the nation has a wealth of renewable energy resources. Solar energy is a widely available and promising source due to its ideal geographic position, defined by large open expanses and dry, sunny weather [39]. In most regions of Saudi Arabia, annual solar radiation exceeds 2100 kWh/m2, while daily solar radiation can reach as high as 5.8 kWh/m2 [39]. These aspects make Saudi Arabia a leading applicant for the large-scale deployment of solar photovoltaic systems. The climate in Saudi Arabia is generally hot and dry, with cool nights resulting in ice formation in winter. Humidity is high along the coast. Summer temperatures are high, well above 45 °C, but mostly cool at night. Over the past 100 years, average monthly temperatures in Saudi Arabia have ranged from 15.5 °C from December to February to 30 °C from May to September [40]. The effectiveness of the built models is evaluated and contrasted with data on global solar radiation obtained at the nine designated sites in Saudi Arabia. The coordinates of the meteorological stations employed are shown in Table 1. The stations are located at different altitudes and can be divided into coastal (0–300 m), low mountain (300–800 m), and mountain stations (800–1750 m) [41]. Additionally, in Saudi Arabia, the vast, flat, open land is exposed to high levels of terrestrial radiation (global solar radiation) and long periods of sunshine [42].
Weather data (from the year 1985 to the year 2000) were gathered for this study from nine weather stations spread across various parts of Saudi Arabia. Meteorological information recordings for these sites were used to collect experimental data, including a dataset of daily climatic data. However, the daily average was computed. After removing anomalous and missing values from the final dataset, we applied the standards for data quality control on solar radiation. We determined that the amount of solar radiation outside the Earth’s atmosphere should be 1.0 using the ratio of daily solar radiation measurements on a horizontal surface; however, because of the equipment’s inaccuracy, values far from unity are frequently recorded [43]. Thus, a ratio smaller than 1.0 was selected, and other readings were removed. However, the daily extraterrestrial radiation on horizontal surfaces (Ho, W/m2) can be calculated using the website [44], which calculates the daily extraterrestrial radiation on horizontal surfaces (W/m2) based on latitude (decimal degrees for the south), month, and day. The output is extraterrestrial solar radiation (W/m2), and the intermediate calculations are the hour angle of sunset (degrees) and the maximum possible sunshine duration (hours). The formula reference on the website is from Duffie and Beckman [45]. Given the duration of the study and the inherent inaccuracies in the instrument-based observations, quality control of the data was crucial. Table 2 shows descriptive statistics for all variables, including altitude, latitude, longitude, and RHmax, in the average monthly data set, the highest air relative humidity. RHmin, in the average monthly dataset. RHmin is the lowest air relative humidity, Tmax, in the average monthly dataset, is the highest temperature of the surrounding air, and Tmin is the lowest temperature of the surrounding air.

2.2. Building a Model to Estimate MADSR on Horizontal Surfaces Using an Artificial Neural Network Approach

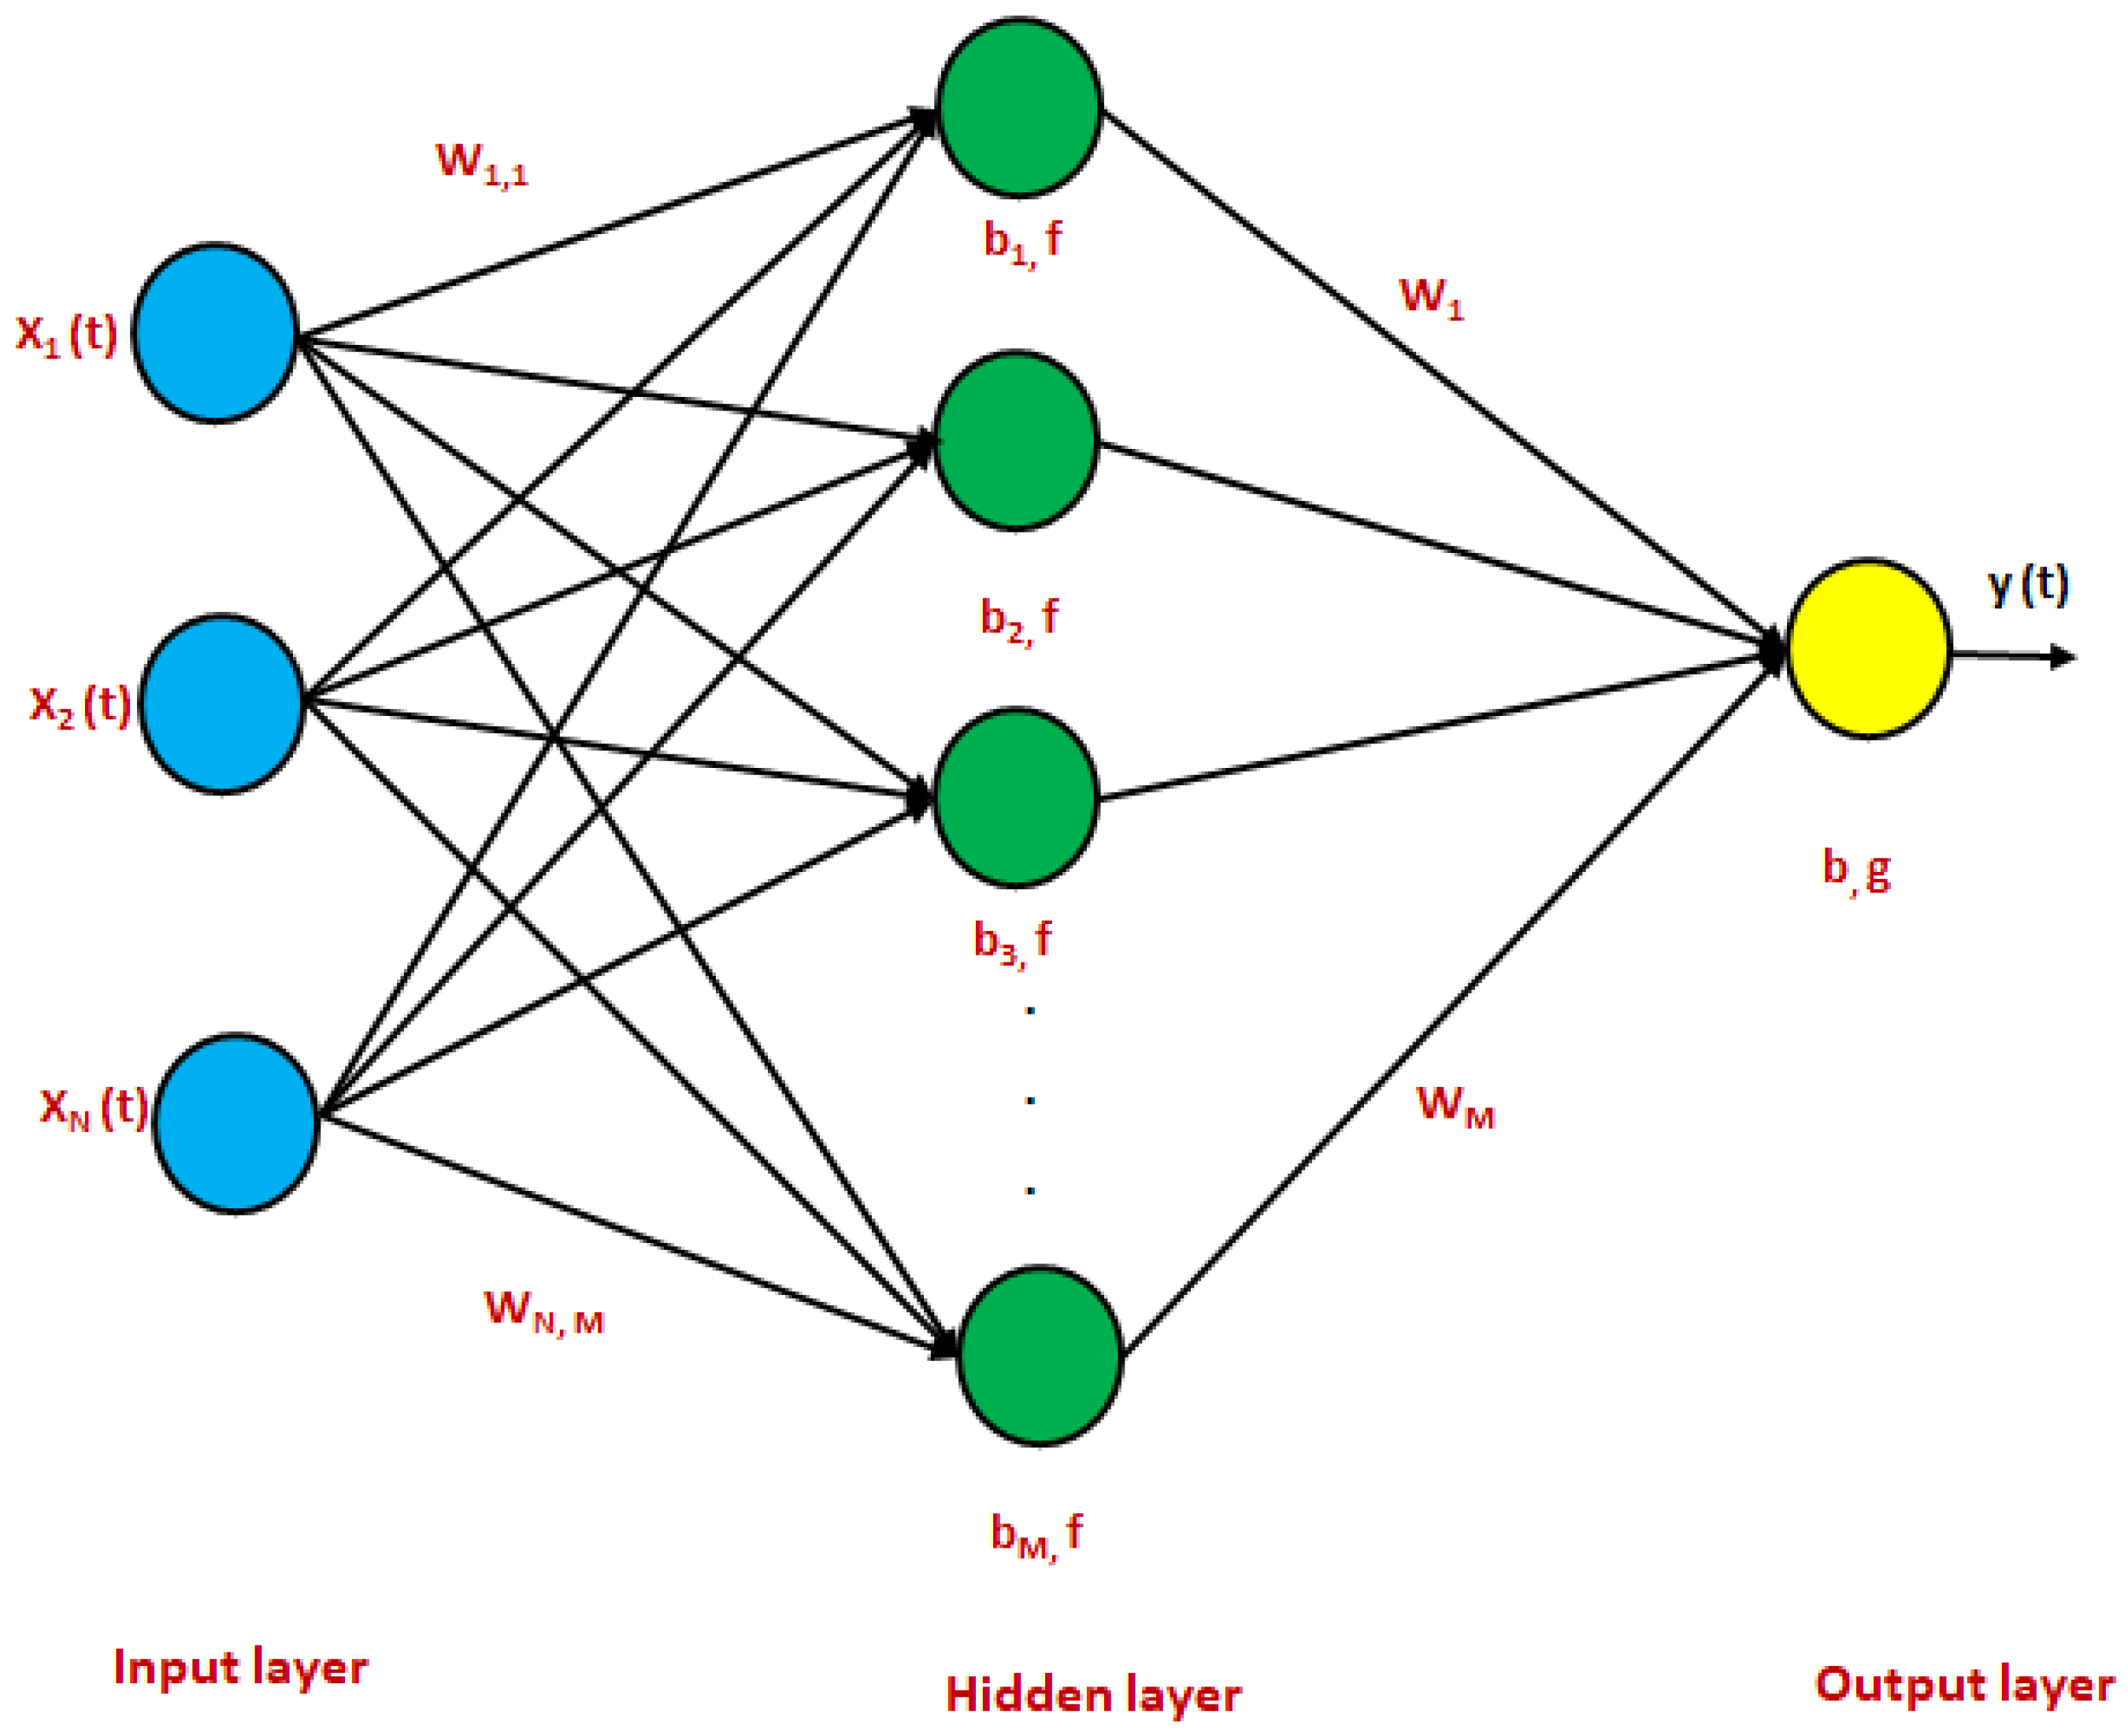
The basic building blocks of our brain are neurons. Neurons allow us to integrate previous knowledge into the current situation [13]. ANNs are components of artificial intelligence approaches that are ideal for various applications in different fields, such as forecasting, especially solar radiation [46,47,48]. ANNs are well-thought-out and are one of the great methods for solving complex and nonlinear problems [13]. They can learn from past cases and deal with inaccurate and incomplete data. Once trained, they can perform estimations at a good speed, making them effective modeling tools, especially in system modeling [13]. ANNs can be grouped based on structure, activation functions, and training procedures. In general, the structure of an ANN represents the relationships between layers and neurons. An ANN structure involves an input layer, at least one hidden layer, and an output layer. Figure 2 shows the main ANN designs (three layers).
Each layer of an ANN model is associated with communication links called weights and biases, which maintain their influence in transmitting information. Training algorithms determine these weights and biases differently. In general, ANNs can be classified into different types based on the training method used: supervised, unsupervised, and semi-supervised [13]. Activation functions govern how the output of a neuron relates to the input, depending on the level of input strength. The prediction method of an ANN model involves several phases. First, the input and output variables need to be determined. Then, the data separation phase begins, separating the data into two sets: the training and testing datasets [13]. Then, the ANN model is constructed, and the training constraints are set. Then, the established ANN model is trained, and different error metrics (correlation coefficient and training error) are considered to appraise the performance of the established ANN model. Finally, the ANN model with the lowest error and highest correlation coefficient is selected.
In Figure 2, the input layer (blue) comprises N neurons (X1(t), X2(t), …, XN(t)), which signify the amount of acquired data hand-me-down as input variables for the ANN. The hidden layer has M neurons (green), and the output layer has only one neuron (yellow) that generates the predictor variable, where t denotes the sampling period. The output of the hidden layer is considered as described by [49]:
h i t = f k N W k , i × X k t + b i , k = 1,2 , , N , i = 1,2 , , M
where hi(t) is the output of the hidden layer neuron at period t; Wk,i is the joining constraint, i.e., the synaptic weight; between the kth neuron in the input layer and the ith neuron in the hidden layer; bi is the bias value of the ith neuron in the hidden layer; and f is the activation function in the hidden layer. The assessment of predictor variables in the output layer is stated as mentioned in [49]:
y t = g i M W i , y × h i t + b y , i = 1,2 , , M
where y(t) is the target variable at period t in the output layer, Wi,y is the created weight until i-joins the neurons in the hidden layer and separates neurons in the output layer, by is the bias of the output neuron, and g is the activation function of the output node. Then, the relationship between the input and the output layers can be stated in the ANN model as shown in Equation (3) [49,50].
y t = g i M W i , y × f k N W k , i × X k t + b i + b y
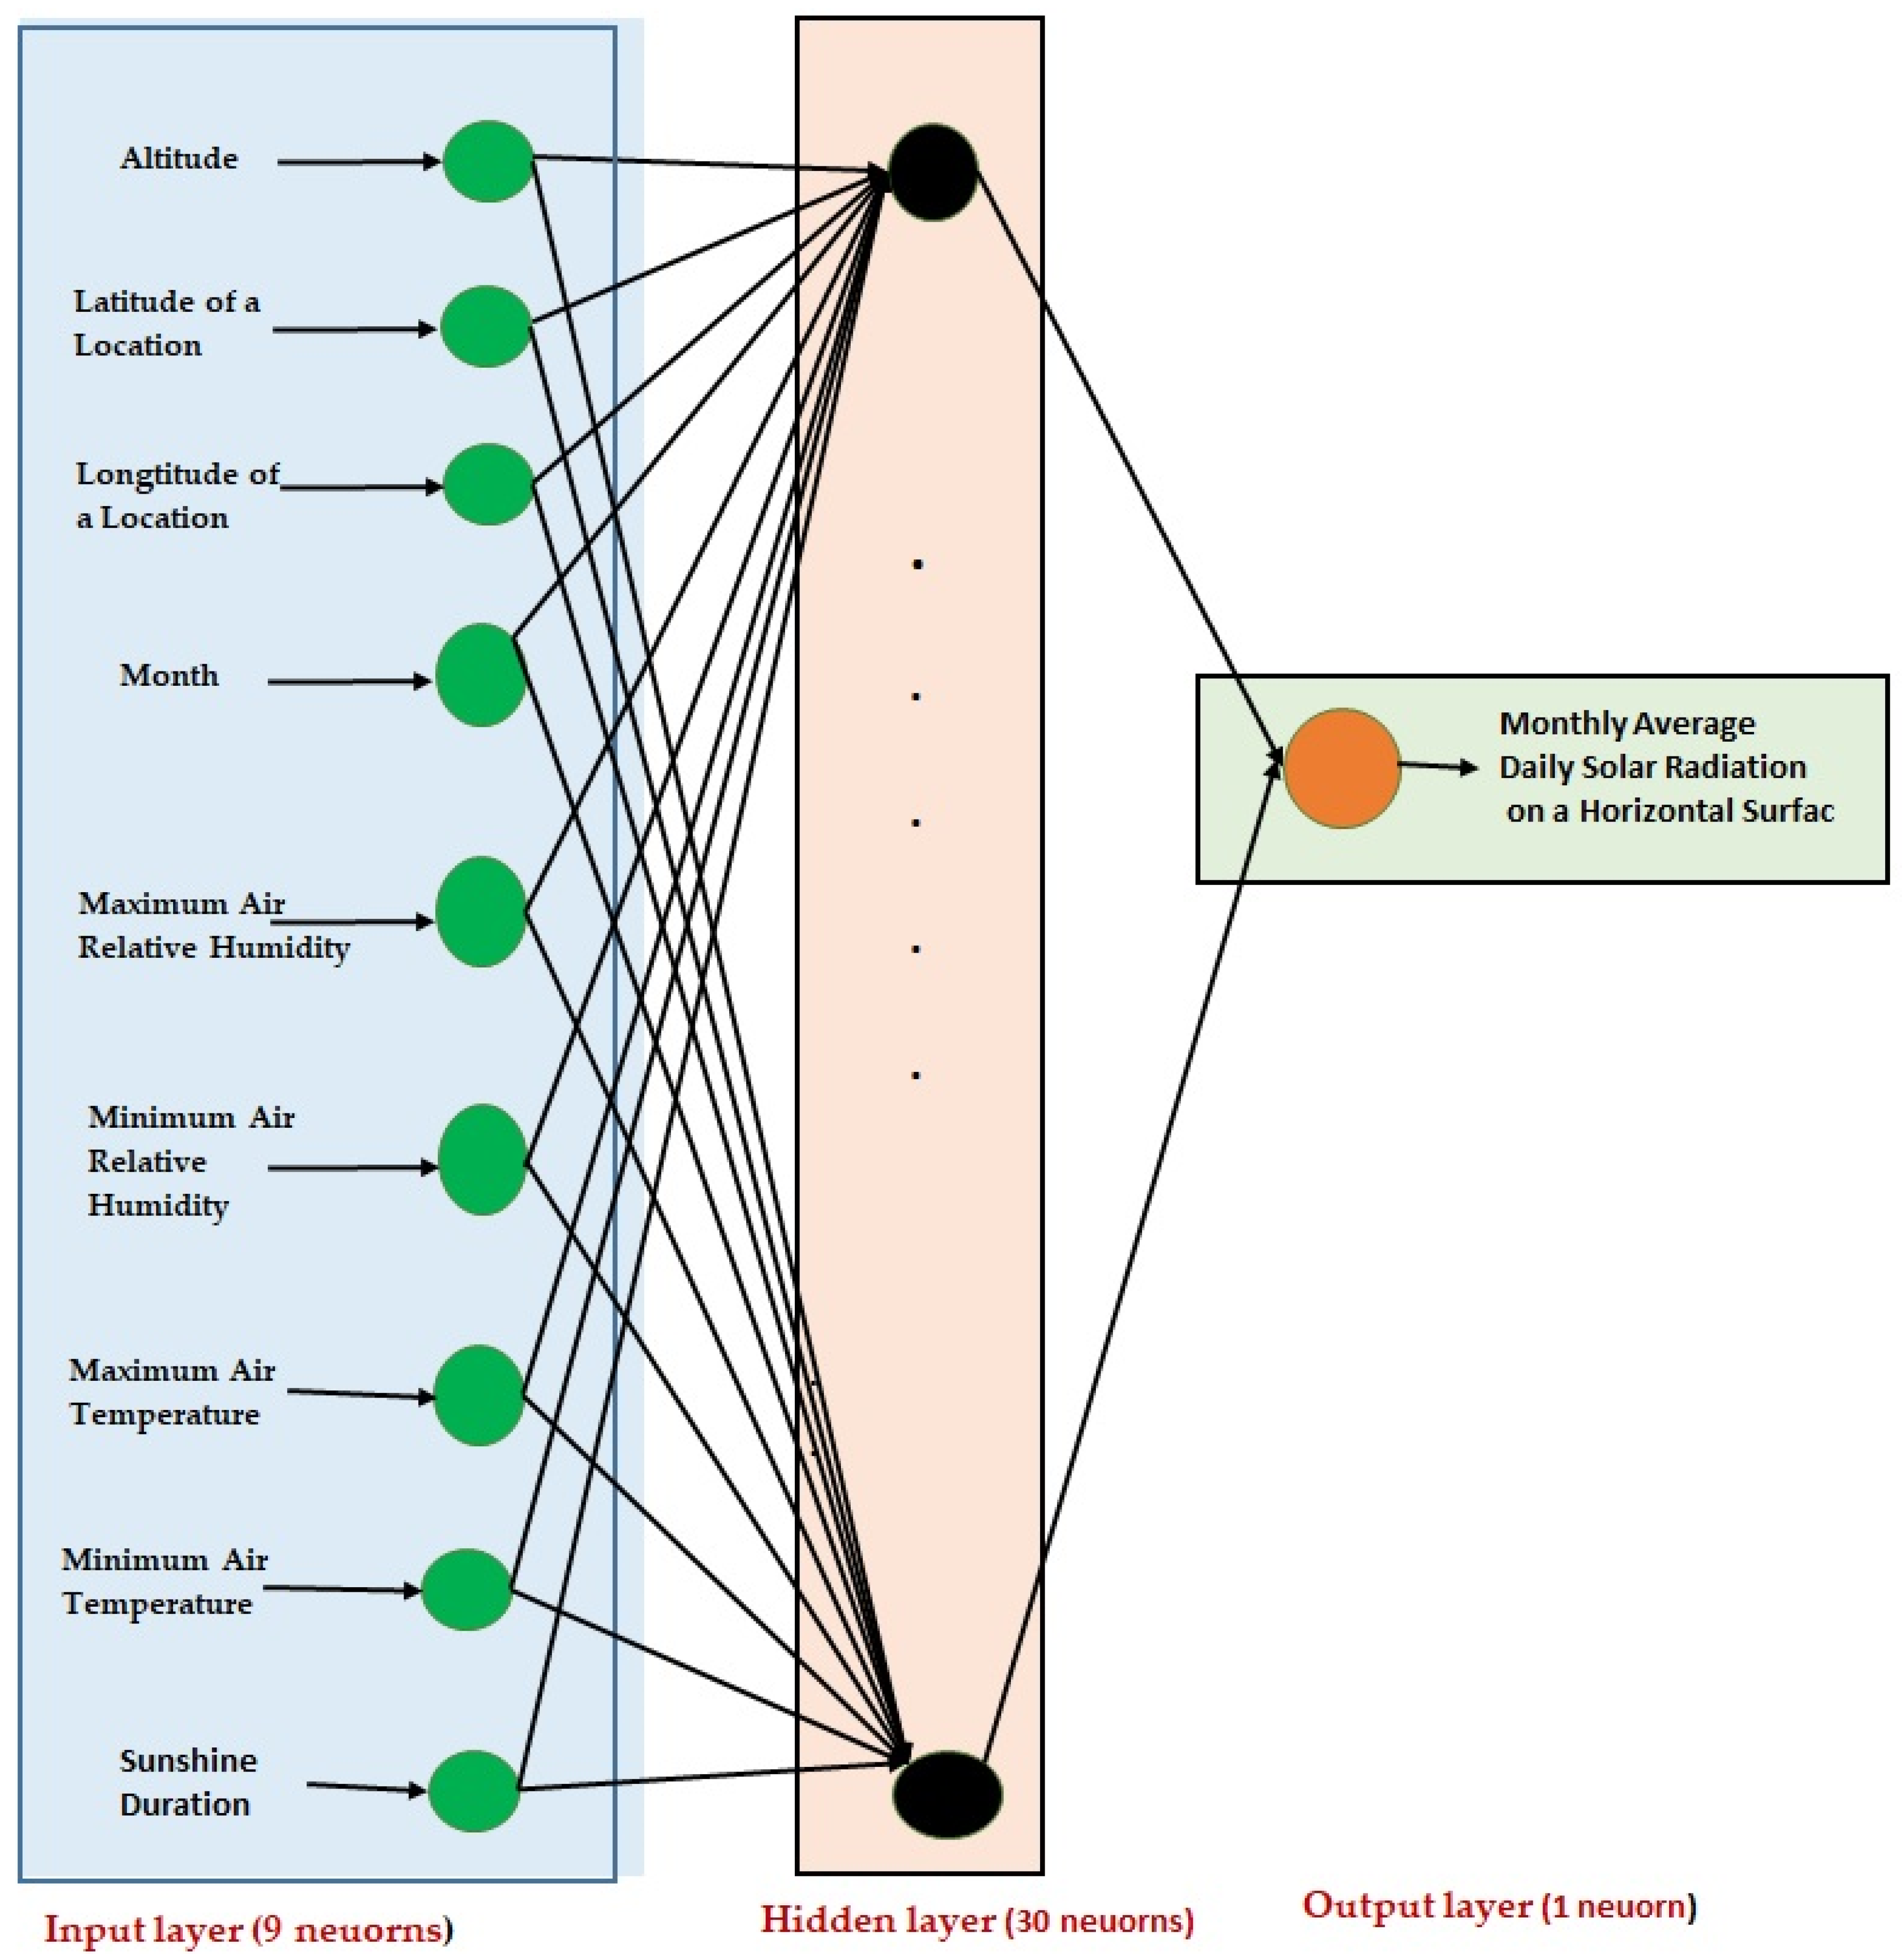
When using an ANN model to estimate solar radiation, the input and output parameters are first selected. The output parameters of the ANN model are usually hourly, daily, monthly, or annual average solar radiation [13]. In contrast, the input parameters are sunshine hours, air temperatures, air relative humidity; etc. [13]. This study nominated the established ANN architecture as a feedforward ANN with a single hidden layer. However, this ANN architecture has been confirmed to be a general approximator that can approximate any continuous representation [51,52]. Furthermore, the single-layer feedforward neural network has been documented for its effectiveness as it is one of the most commonly used fast-learning algorithms [53]. Furthermore, feedforward neural network models are easy to use and can signify quantifiable functions with high accuracy, particularly regarding weather forecasting, so they are being researched [54,55]. Furthermore, it has been confirmed that a single-layer feedforward neural network can solve various regression problems [56]. In this study, a three-layer neural network architecture was formed using the viable software called Qnet v2000 for Windows, which was established by Vesta Services Company [57], Winnetka, IL, USA. A typical backpropagation learning algorithm was employed to feedforward the ANN structure, and MADSR on a horizontal surface was predicted through supervised training. Usually, this kind of neural network comprises numerous layers of connected neurons. One or more hidden layers, referred to as the network’s first and last layers, may exist between the input and output layers. Although the process for creating and evaluating a neural network model with Qnet v2000 can be found in Al-Sager et al.’s study [58], the ideal number of hidden neurons was obtained through trial and error. Normalization was accomplished across the dataset’s input and output to prevent the algorithm’s concealed bias concerning higher values in the dataset [59]. The software (Qnet v2000) was directed to achieve normalization between 0.15 and 0.85. To test its judgments, Qnet v2000 was also directed to choose a reasonable number of points at random. The software scaled and normalized the data when the predictions were finished. Table 3 displays the data structure used to create the ANN model for predicting the MADSR on horizontal surfaces. Nine neurons, however, made up the input layer for location altitude, location latitude, location longitude, month, maximum and minimum air temperatures, high and low relative humidity, and daylight duration. MADSR on a horizontal surface was the result.
Two datasets were used; for training, 1354 samples were used, and 339 samples were used for testing purposes. The ANN model was constructed, weights and biases were established, and the model was optimized using the training dataset. The tweaked ANN model’s performance was verified using the test dataset. The component of the ANN model that transforms inputs into positive outputs is called an activation function. Neurons are activated and deactivated via activation functions. Thus, the activation functions’ weights and inputs/outputs are the primary determinants of neural networks. According to Al-Sager et al. [58], this study investigated several neural network topologies while accounting for various variables, including the kind of activation function, the number of hidden layers, and the number of neurons in each hidden layer. The optimal ANN prediction model structure, (9-30-1) (Figure 3), with a sigmoid activation function (0, 1) [60], was obtained through trial and error. In the work by Kassem et al. [61], the appropriate numbers of hidden layers and their neurons were fixed through trial and error. In this study, after 700,000 cycles, the training procedure was completed, resulting in a test error of 0.059649 and a training error of 0.050629. The momentum coefficient was 0.8, and the learning rate was 0.001256.

2.3. Sensitivity Analysis of the Established ANN Model for Predicting the MADSR on Horizontal Surfaces

Each neural network can show which input parameters are most important and have the biggest impact on the variables explained thanks to the sensitivity analysis [62]. Sensitivity analysis determines which input factors have the most effects on the ANN model’s results (outputs) [63]. However, the sensitivity analysis in this study evaluated the significance of several effective independent variables, including altitude, the location’s latitude and longitude, the month of the year, the maximum and minimum air relative humidity, the maximum and minimum air temperature, and sunshine duration, in the ANN model predicting the MADSR on a horizontal surface. The sensitivity analysis permits each neural network to display which input parameters are most vital and have the highest influence on the explained variables [62]. The sensitivity analysis was conducted using the Qnet v2000 [57] method, as outlined in Al-Dosary et al. [64], to identify the most beneficial variable in the ANN model.

2.4. Validation Performance of the ANN Model

The most widely used statistical errors—root mean square error; or RMSE; mean absolute error or MAE, and coefficient of determination, or R2—were used to assess the effectiveness of the created ANN model. The RMSE values, which are consistently expressed as positive numbers, provided information on the model’s short-term performance. A decreased RMSE indicates better model performance; zero is the optimum value. The values of (R2) show the goodness of fit. The intended value is the greatest of the R2 values, which range from zero to one (0 ≤ R2 ≤ 1) [65]. A clear indicator of accuracy, the RMSE reflects the average size of prediction mistakes; lower RMSE and MAE values indicate the best model performance (best value = 0; worst value = +∞) [65]. The MAE is a metric used to quantify the degree of agreement between measured and anticipated values. The established ANN model has good prediction accuracy, as seen by the relatively low MAE and RMSE. The following formula can be used to determine the RMSE and MAE [65]:
R M S E = q = 1 N t t P q P ^ q 2 N t t
M A E = q = 1 N t t P q P ^ q N t t
where P ^ q is the forecast value, Pq is the experimental value, and Ntt is the total number of data points in the test and training datasets.
The mean absolute percentage error (MAPE), representing the discrepancy between the expected and actual values, is also the most often utilized to evaluate the effectiveness of the created ANN model. An incorrect forecast is indicated by a MAPE value higher than 50%. A MAPE score between 20% and 50%, however, suggests that a good forecast has been made, according to Qazi et al. [66]. A good forecast has been made if the MAPE value is between 10% and 20%, but the best forecast is only made when the MAPE value is less than 10% [66]. The following is the formula for MAPE calculation [66]:
M A P E = 100 1 N t t q = 1 N t t P q P ^ q P q

3. Results and Discussion

3.1. Solar Radiation and Input Parameters Analysis

3.1.1. Air Relative Humidity

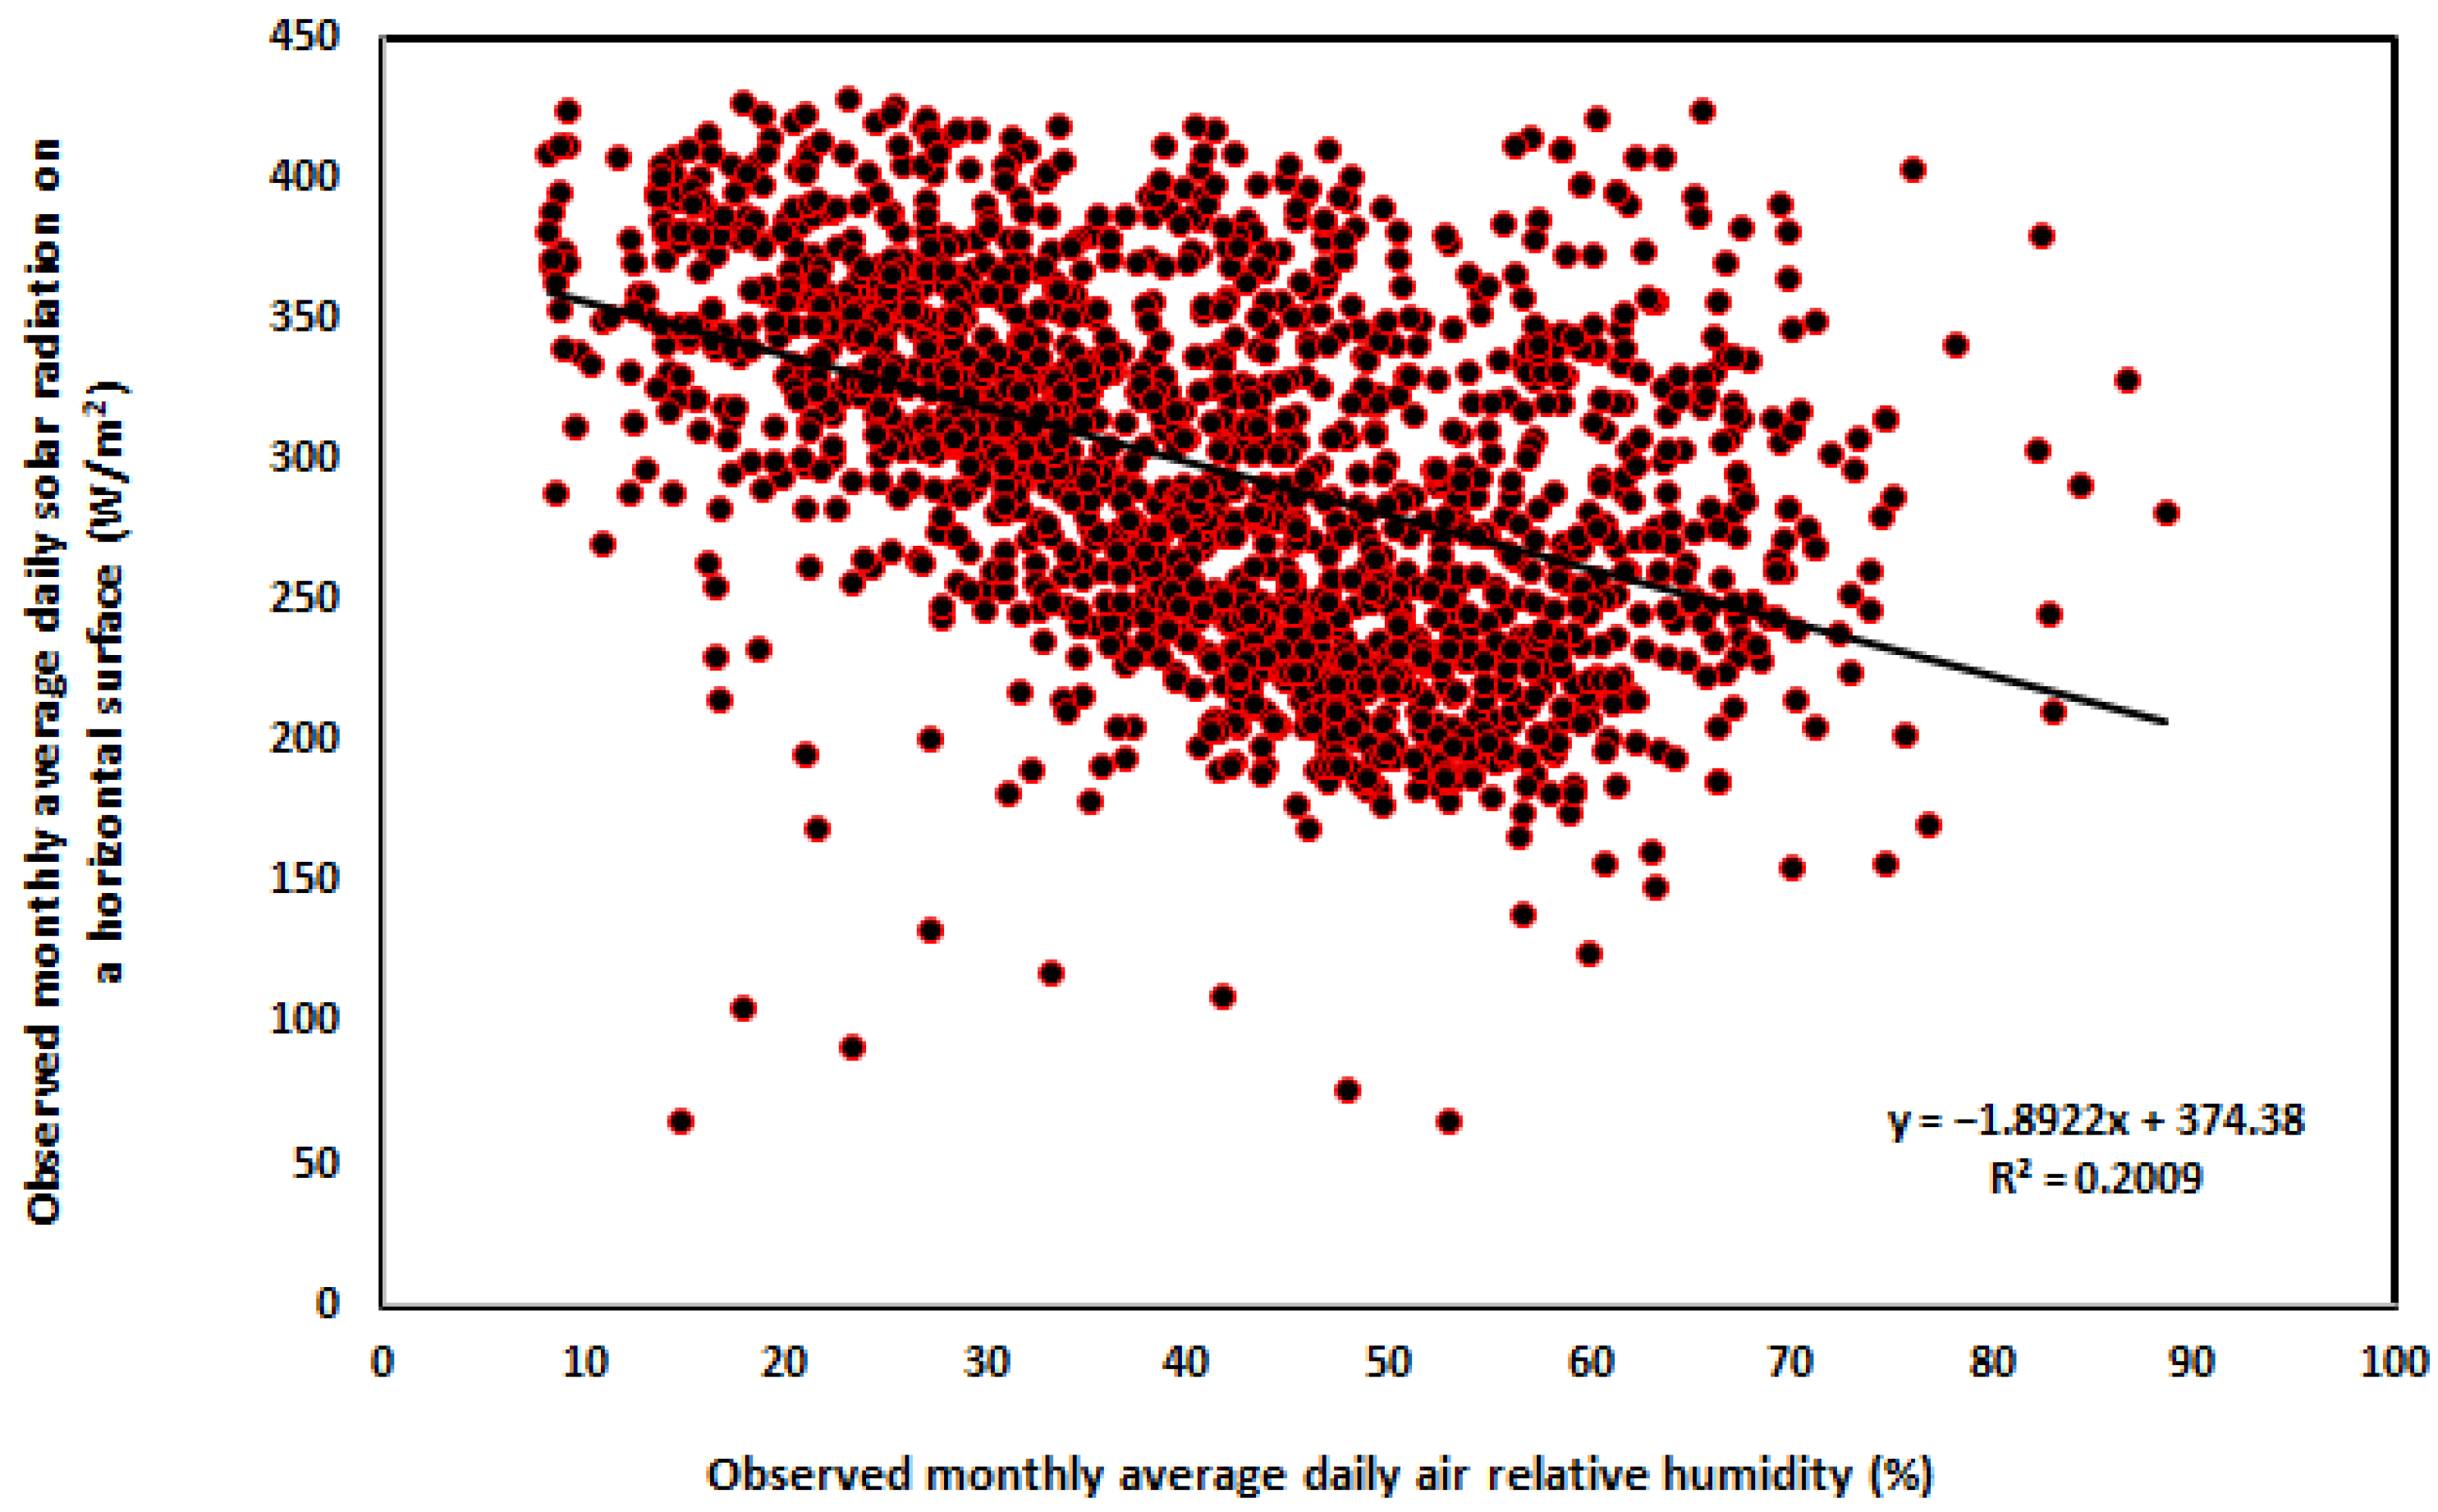
This study developed a solar radiation ANN model using different input parameters, such as the maximum ambient air temperature, sunshine duration, the maximum air relative humidity, the minimum ambient air temperature, and the minimum air relative humidity, collected between 1985 and 2000. In addition, other input parameters such as the altitude, latitude, longitude of the location, as well as the corresponding month were used. The data were split into two datasets, one for training and the other for validation. These processes were randomly performed using the simulation software. The relationship between the parameters is called a basic mathematical function. A regression line with the coefficient of determination (R2) was used to show the fit between the dependent variable (MADSR on a horizontal surface) and the independent variables. Figure 4 shows the correlation between the MADSR on a horizontal surface and monthly average daily air relative humidity for both the training dataset and the testing dataset.
The study proposes that solar radiation is directly proportional to the air’s relative humidity, showing that increasing the air’s relative humidity reduces solar energy potential. From Figure 4, it was observed that the air’s relative humidity has an effect on solar radiation. The comparison between the two quantities shows a negative correlation with R2 equal to 0.2009 for mean data, implying that the two quantities would increase and decrease. This trend is observed in other research papers [67,68], which found that an increase in air relative humidity leads to a decrease in solar radiation and vice versa. The minimum, maximum, and mean air relative humidity were 8.25, 88.63, and 40.92%, as depicted in Table 4. The difference in air relative humidity can be explained as follows: there is a relatively high mass of water vapor in the atmosphere at night, but at higher temperatures (during the day), there is a high enough amount of evaporation to convert water to water vapor, and there is a relatively low mass of water vapor in the atmosphere of a given volume; consequently, the relative humidity is also low [69].

3.1.2. Air Temperature

Temperature is a quantity of the thermal behavior of a substance, expressing how hot or cold a body is, and is a widely measured variable in determining changes in the weather, as it affects and controls other elements of the weather [70]. The disparity of the air temperature with solar radiation is shown in Figure 5. The peak mean air temperature was 40.18 °C; the minimum was 5.16 °C, and the mean was 25.45 °C for all data (Table 4). The comparison between the two quantities shows a positive linear correlation, with R2 equal to 0.4324 (Figure 5) for mean data, implying that the two quantities would increase and decrease similarly. The research directed by Regmi and Adhikary [71] and Poudyal et al. [72] also stated the comparable monthly variation in solar radiation with air temperature.

3.1.3. Sunshine Hours

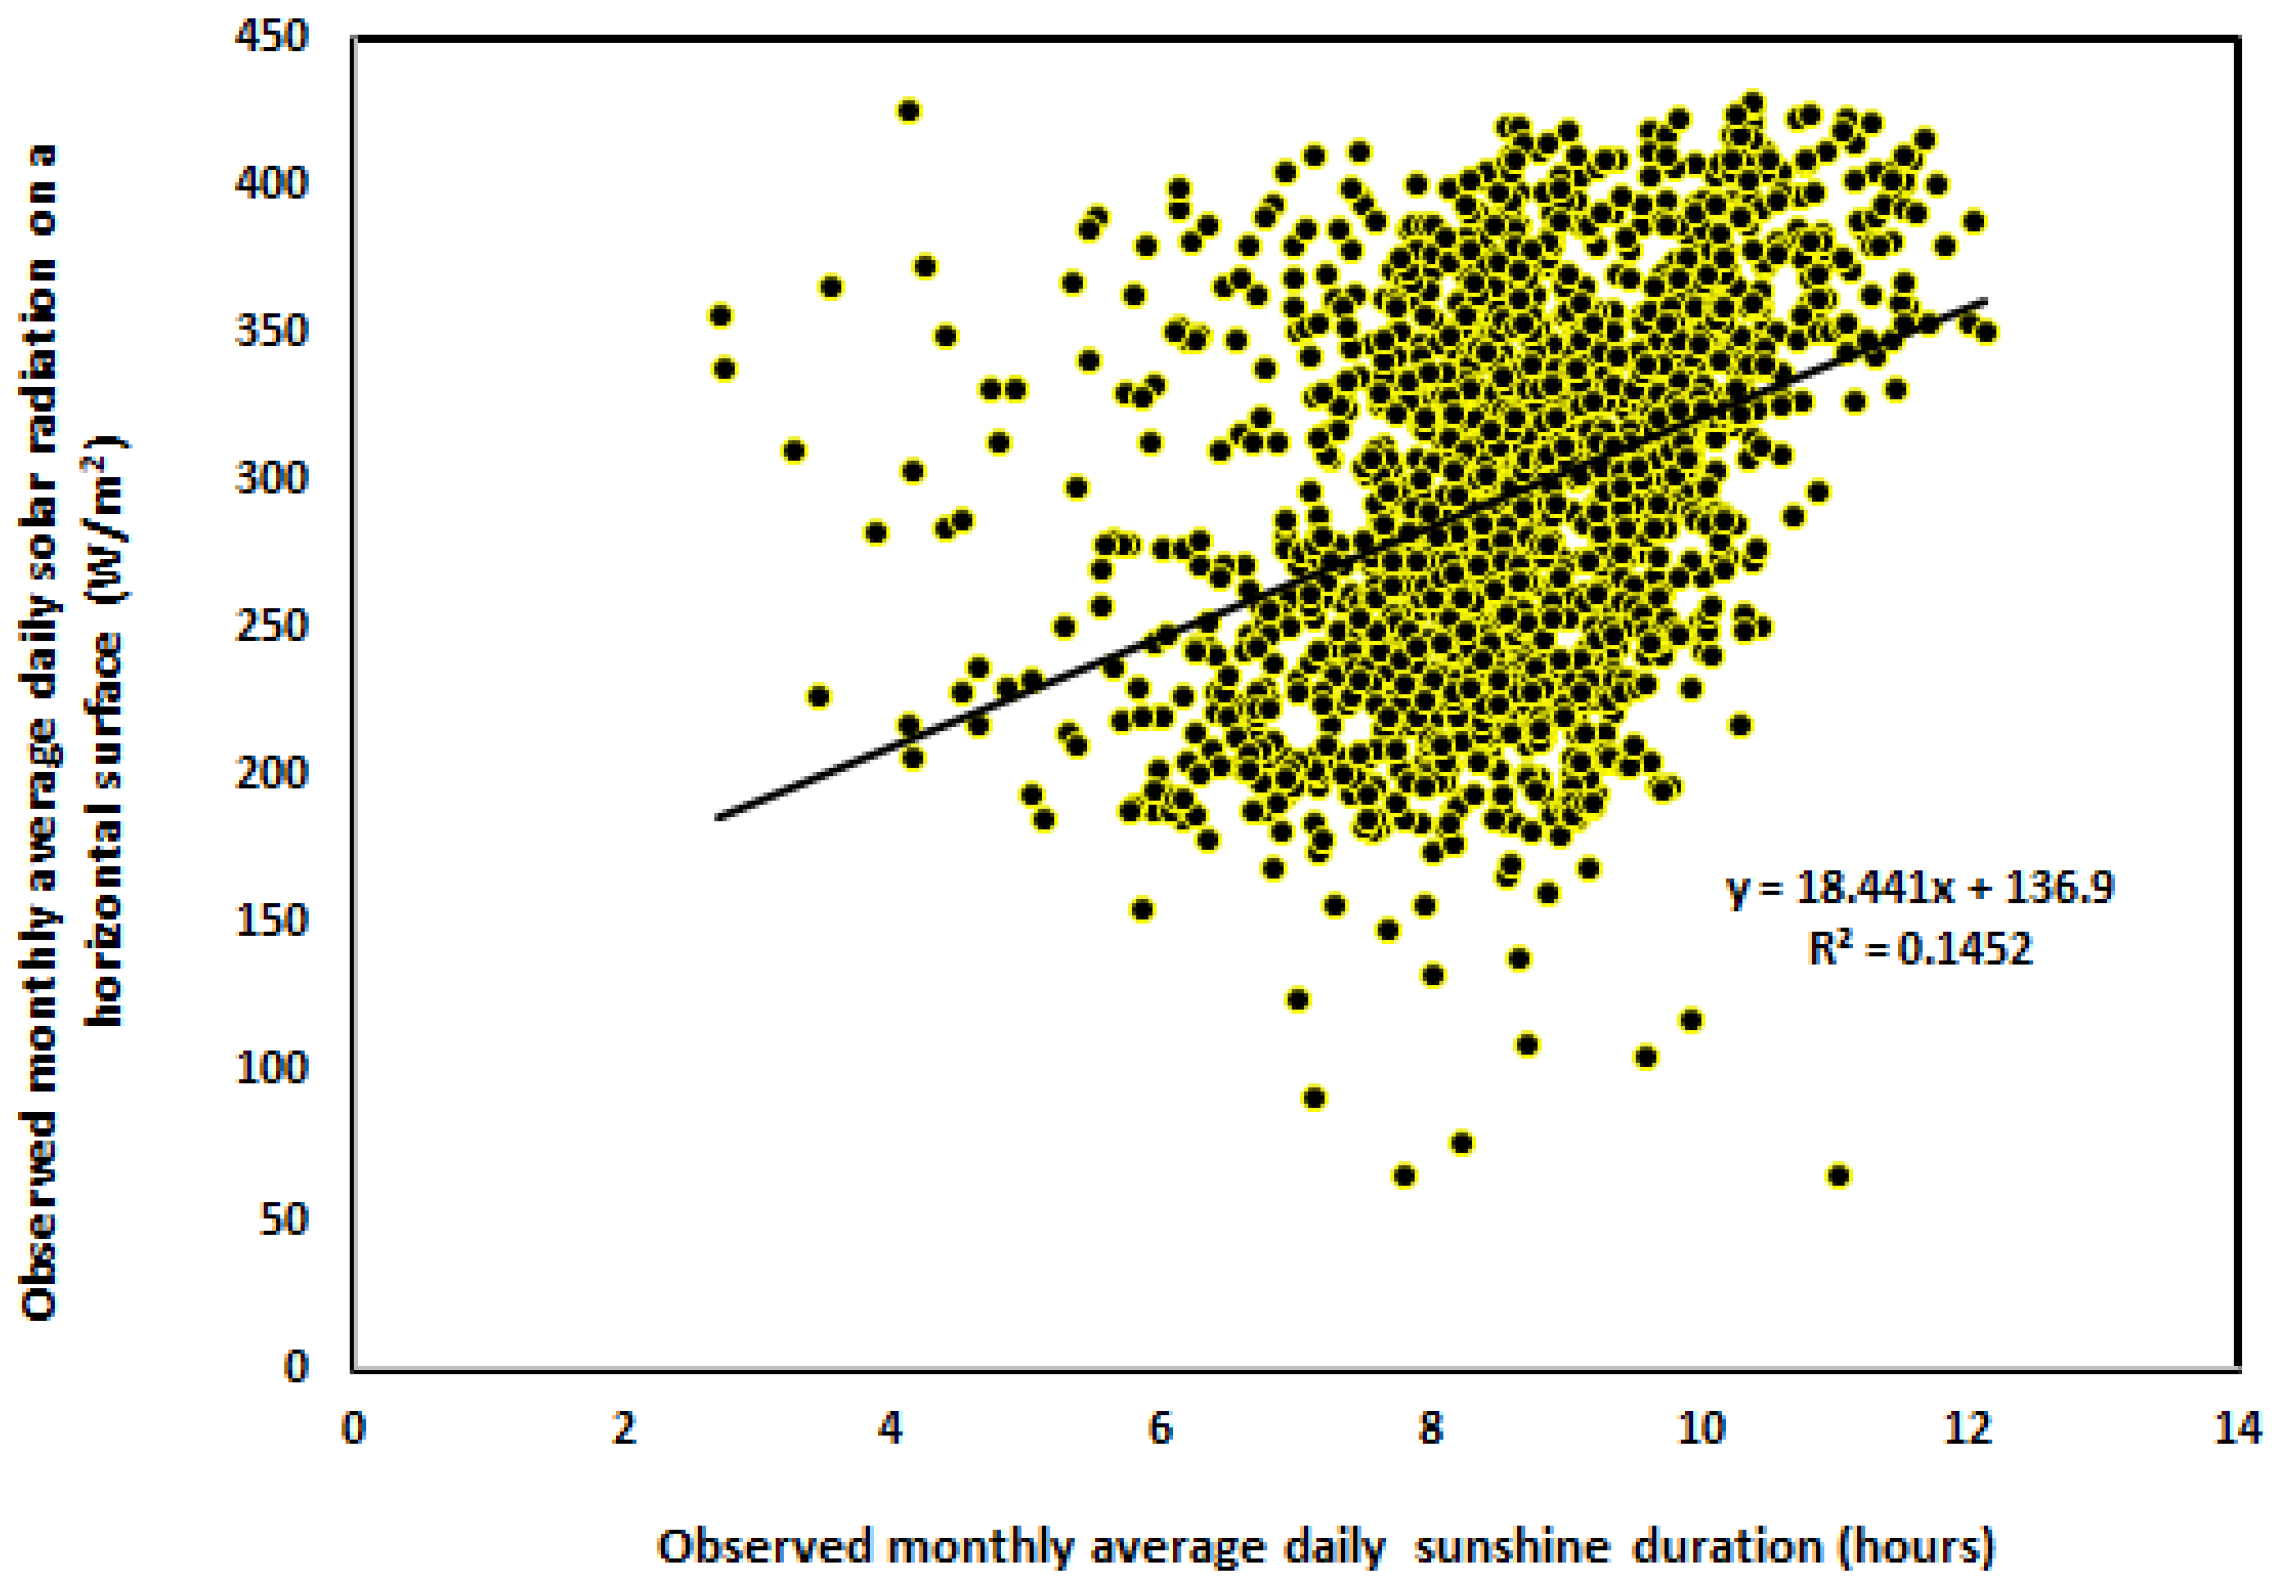
The duration of the sunshine hour directly impacts the amount of solar radiation that reaches the land surface, making it a crucial component in determining solar radiation [69]. The solar radiation has been calculated empirically using a number of different parameters. The duration of sunshine was employed in particular works [73,74,75,76,77]. For all data, the mean sunlight hours were 8.68, with the maximum being 12.11 h and the lowest being 2.71 h (Table 2). R2 is equal to 0.1452 (Figure 6) for mean data, indicating a positive linear correlation between the two numbers, suggesting that they would rise and fall in the same manner.

3.1.4. Altitude

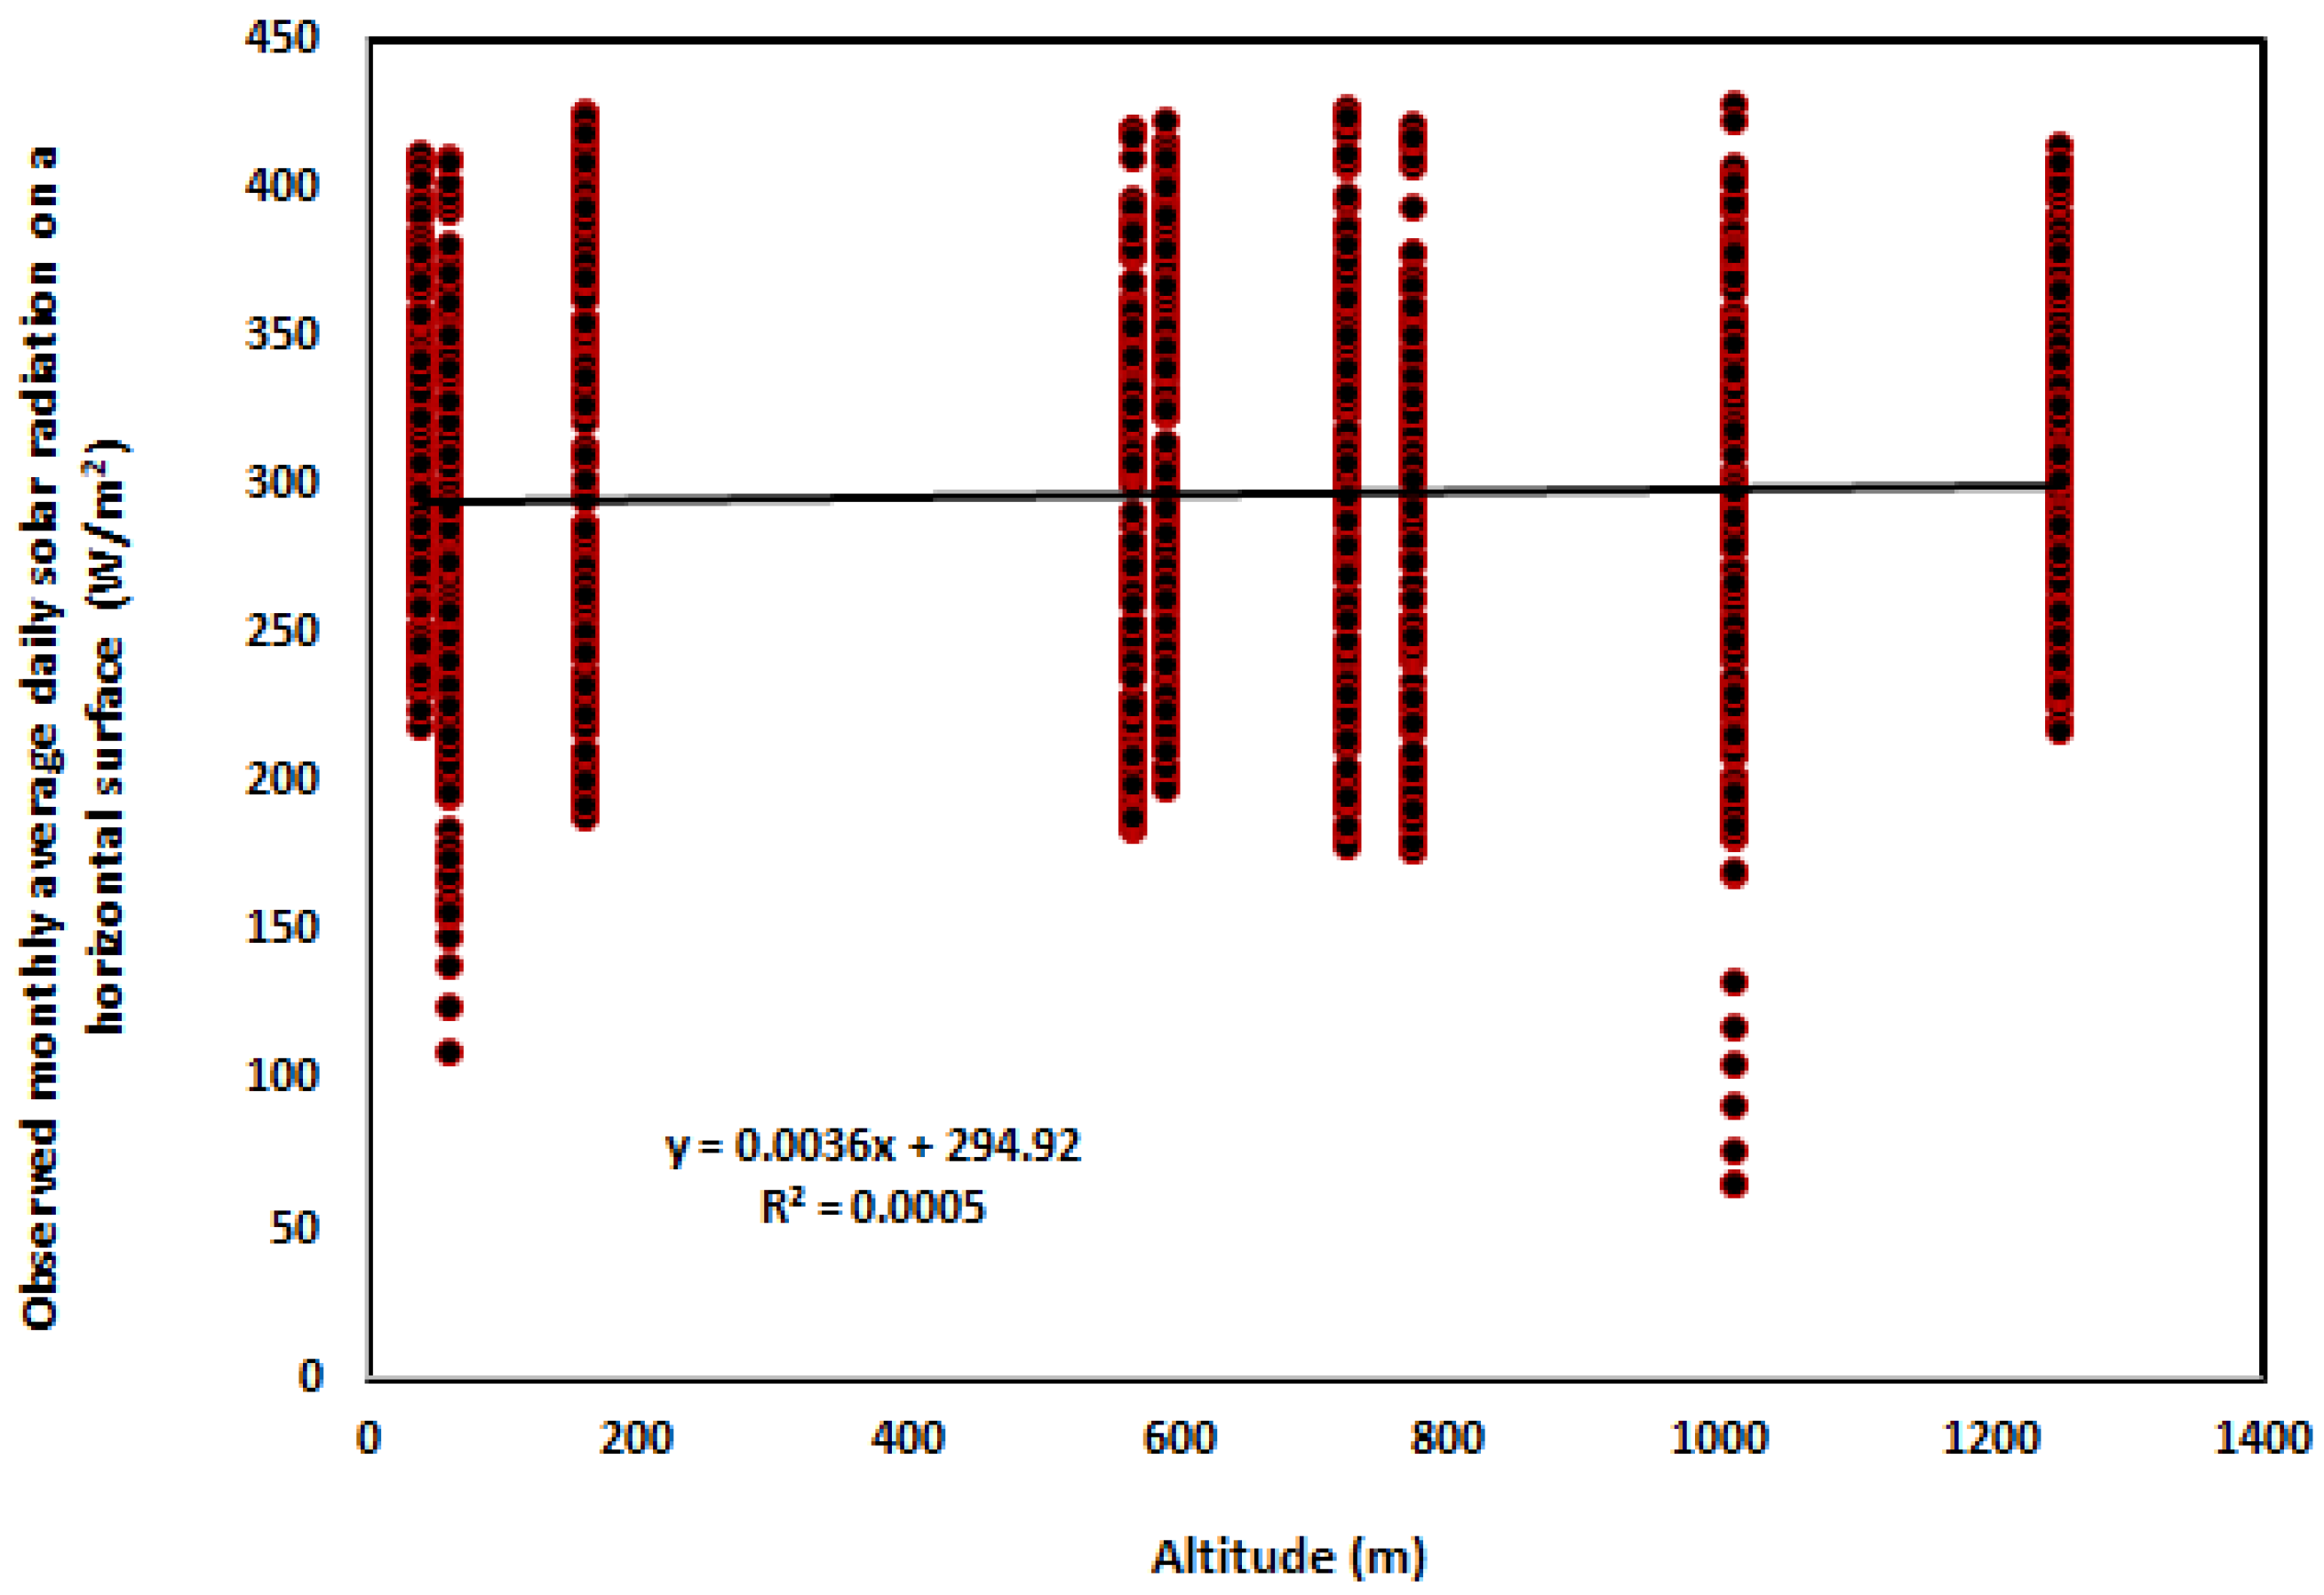
Knowing the solar climate of a region or country is important as it delivers information about the accessibility of the sun and the expected amount of solar radiation, which to some extent also designates the climate of the province, as solar radiation is one of the most significant variables that determine the climate [78]. The variation in the MADSR on a horizontal surface as a function of the altitude is depicted in Figure 7. The comparison between the two quantities shows a positive linear correlation with R2 equal to 0.0005 (Figure 7), implying that the two quantities would increase and decrease in the same way. This trend was observed by [79]. Another study [80] inspected the effect of altitude on solar radiation and analyzed the variation in solar radiation data in areas that have high diversity in altitude regions. They reported that a rise in altitude causes an increase in solar radiation.

3.1.5. Latitude and Longitude Coordinates

The significance of comprehending the geographic need for the spectral characteristics of the solar irradiance cannot be overstated, as the solar irradiance fluctuates depending on the location on Earth, primarily because of variations in the angle of incidence and the dependence of daytime duration on latitude owing to the Earth’s obliquity (the axial tilt relative to the orbital plane) [81]. Latitude and longitude are the two numbers that define any place on Earth. Your latitude determines how far north or south you are from the Equator [82]. Variations in the tilt of the Earth’s axis for the ecliptic and the distance between the Earth and the Sun are the most significant orbital effects that cause variations in solar radiation in the upper atmosphere perpendicular to the Earth’s surface throughout the year as a function of latitude and longitude [82]. Latitude, longitude, altitude, and sunshine duration are, therefore, possible inputs when estimating solar radiation using a model [83]. Moreover, latitude and longitude coordinates can be used to predict solar energy [84]. In a prior work [85], the solar irradiance in Iran was mathematically modeled in terms of time, longitude, and latitude of the studied region in June and July using a regression analysis method based on a multi-linear function. The findings showed that while latitude changes have an impact on solar radiation levels, longitude changes have no effect. Also, northern regions with higher latitudes receive more significant beam radiation at solar noon.
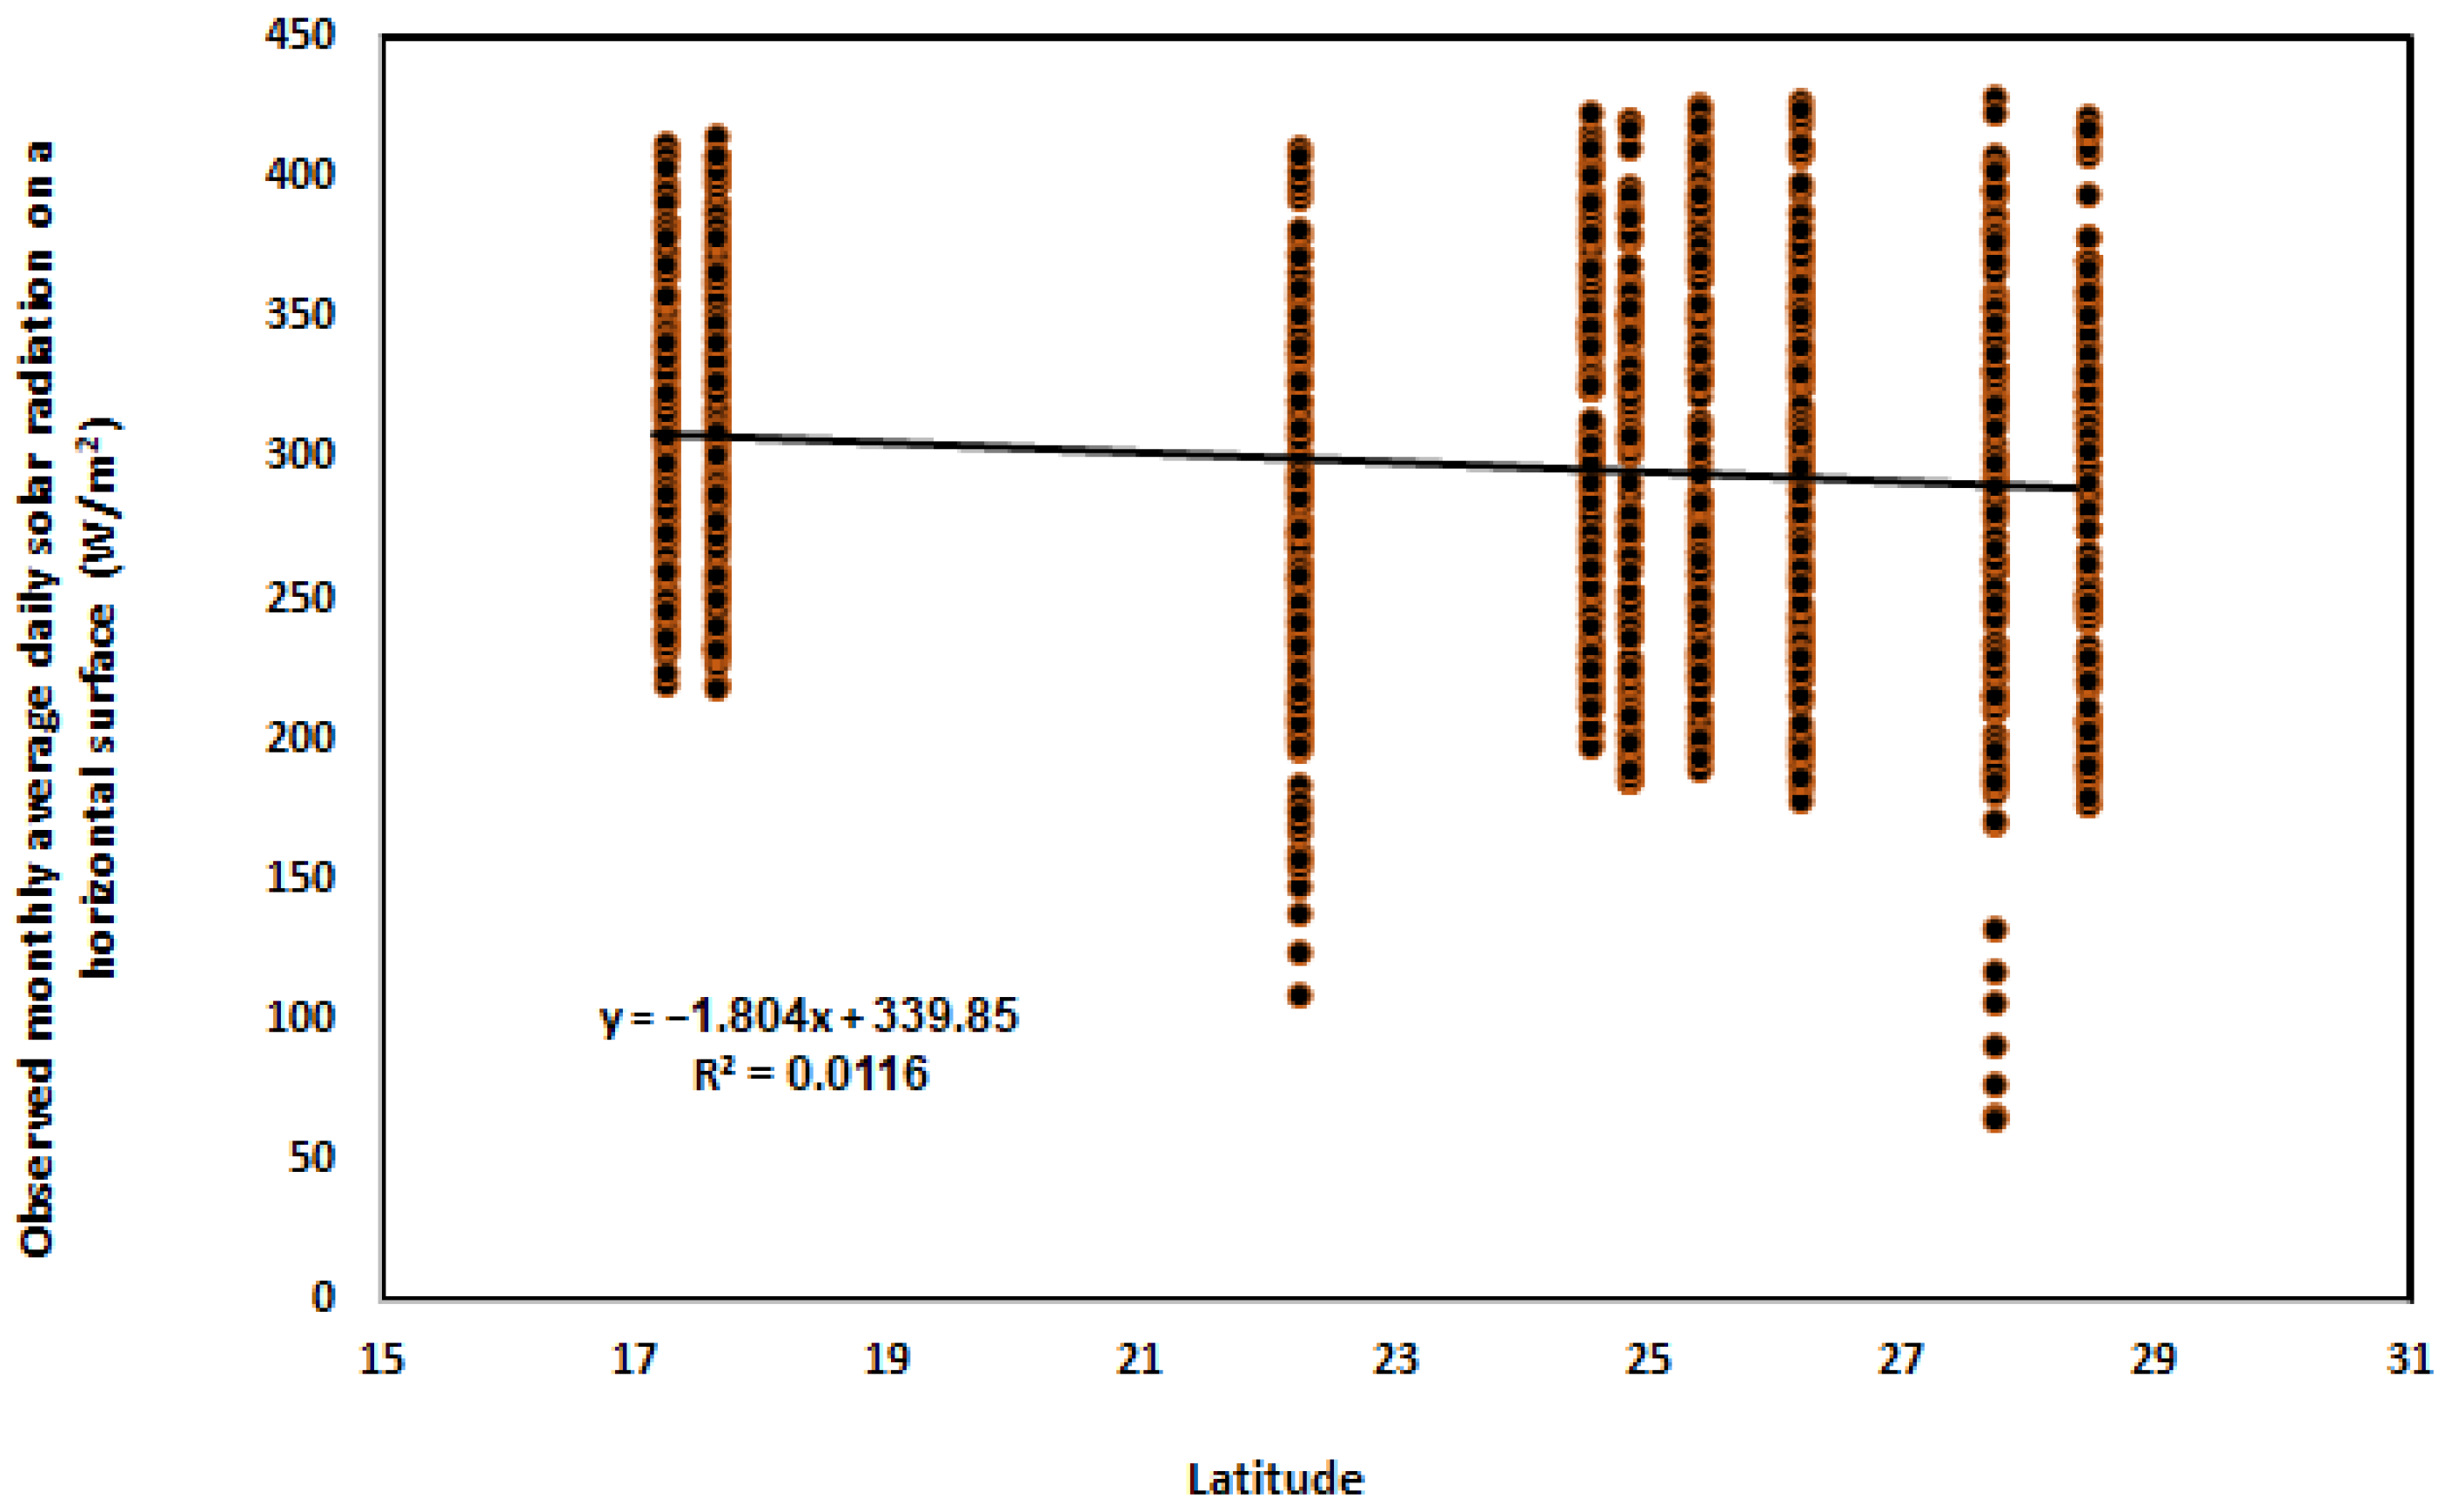
As shown in Figure 8 and Figure 9, respectively, the impact of latitude and longitude variation on solar radiation levels is examined. Figure 8 makes it evident that as latitude increased, solar radiation decreased. But according to Table 2, the latitude range was 17.15 to 28.38 (°N). According to a previous study by [86], the daily solar radiation levels in Adana in the southern belt and Istanbul in the northern belt diverged; Adana Province receives precisely 37.00 more solar radiation than Istanbul. However, Istanbul is located at latitude 41.00 ° N in the investigation. Additionally, rising latitude causes a decrease in solar energy in the latitude range of 18.5° to 23.5° N (Algeria) [87]. With an R2 of 0.0116, the solar radiation decreases with increasing latitude in the 17.15 36.57° to 28.38° N range, as seen in Figure 8. However, with an R2 of 0.0075, the solar radiation rises with increasing longitude in the 36.57° to 49.63° E range, as seen in Figure 9. In a previous study, solar radiation decreased as longitude coordinates increased [87]. However, the longitude coordinate range was −8.5° to 10° E (Algeria). Lastly, Kassem et al.’s findings [61] show that geographic coordinates do not significantly impact the estimation of solar radiation. According to Yadav et al. [88], latitude and longitude were found to not affect the forecast of solar radiation. Furthermore, rather than directly affecting solar radiation levels, latitude and longitude are mainly utilized to pinpoint the position of a particular place [89,90].

3.1.6. Month of the Year

Variation in the MADSR on a horizontal surface as a function of the month of the year (1 is January and 12 is December) is shown in Figure 10. As shown in Figure 10, the peak solar radiation occurred in June for all investigated sites. As shown in Table 2, the minimum, maximum, and mean of MADSR on a horizontal surface are 91.12, 427.91, and 297.74 W/m2. Indeed, changeability has been defined locally by some statistically similar coefficients of variations and the standard deviation (Table 2).

3.2. Performance of the Recognized ANN Model for MADSR on Horizontal Surface Prediction

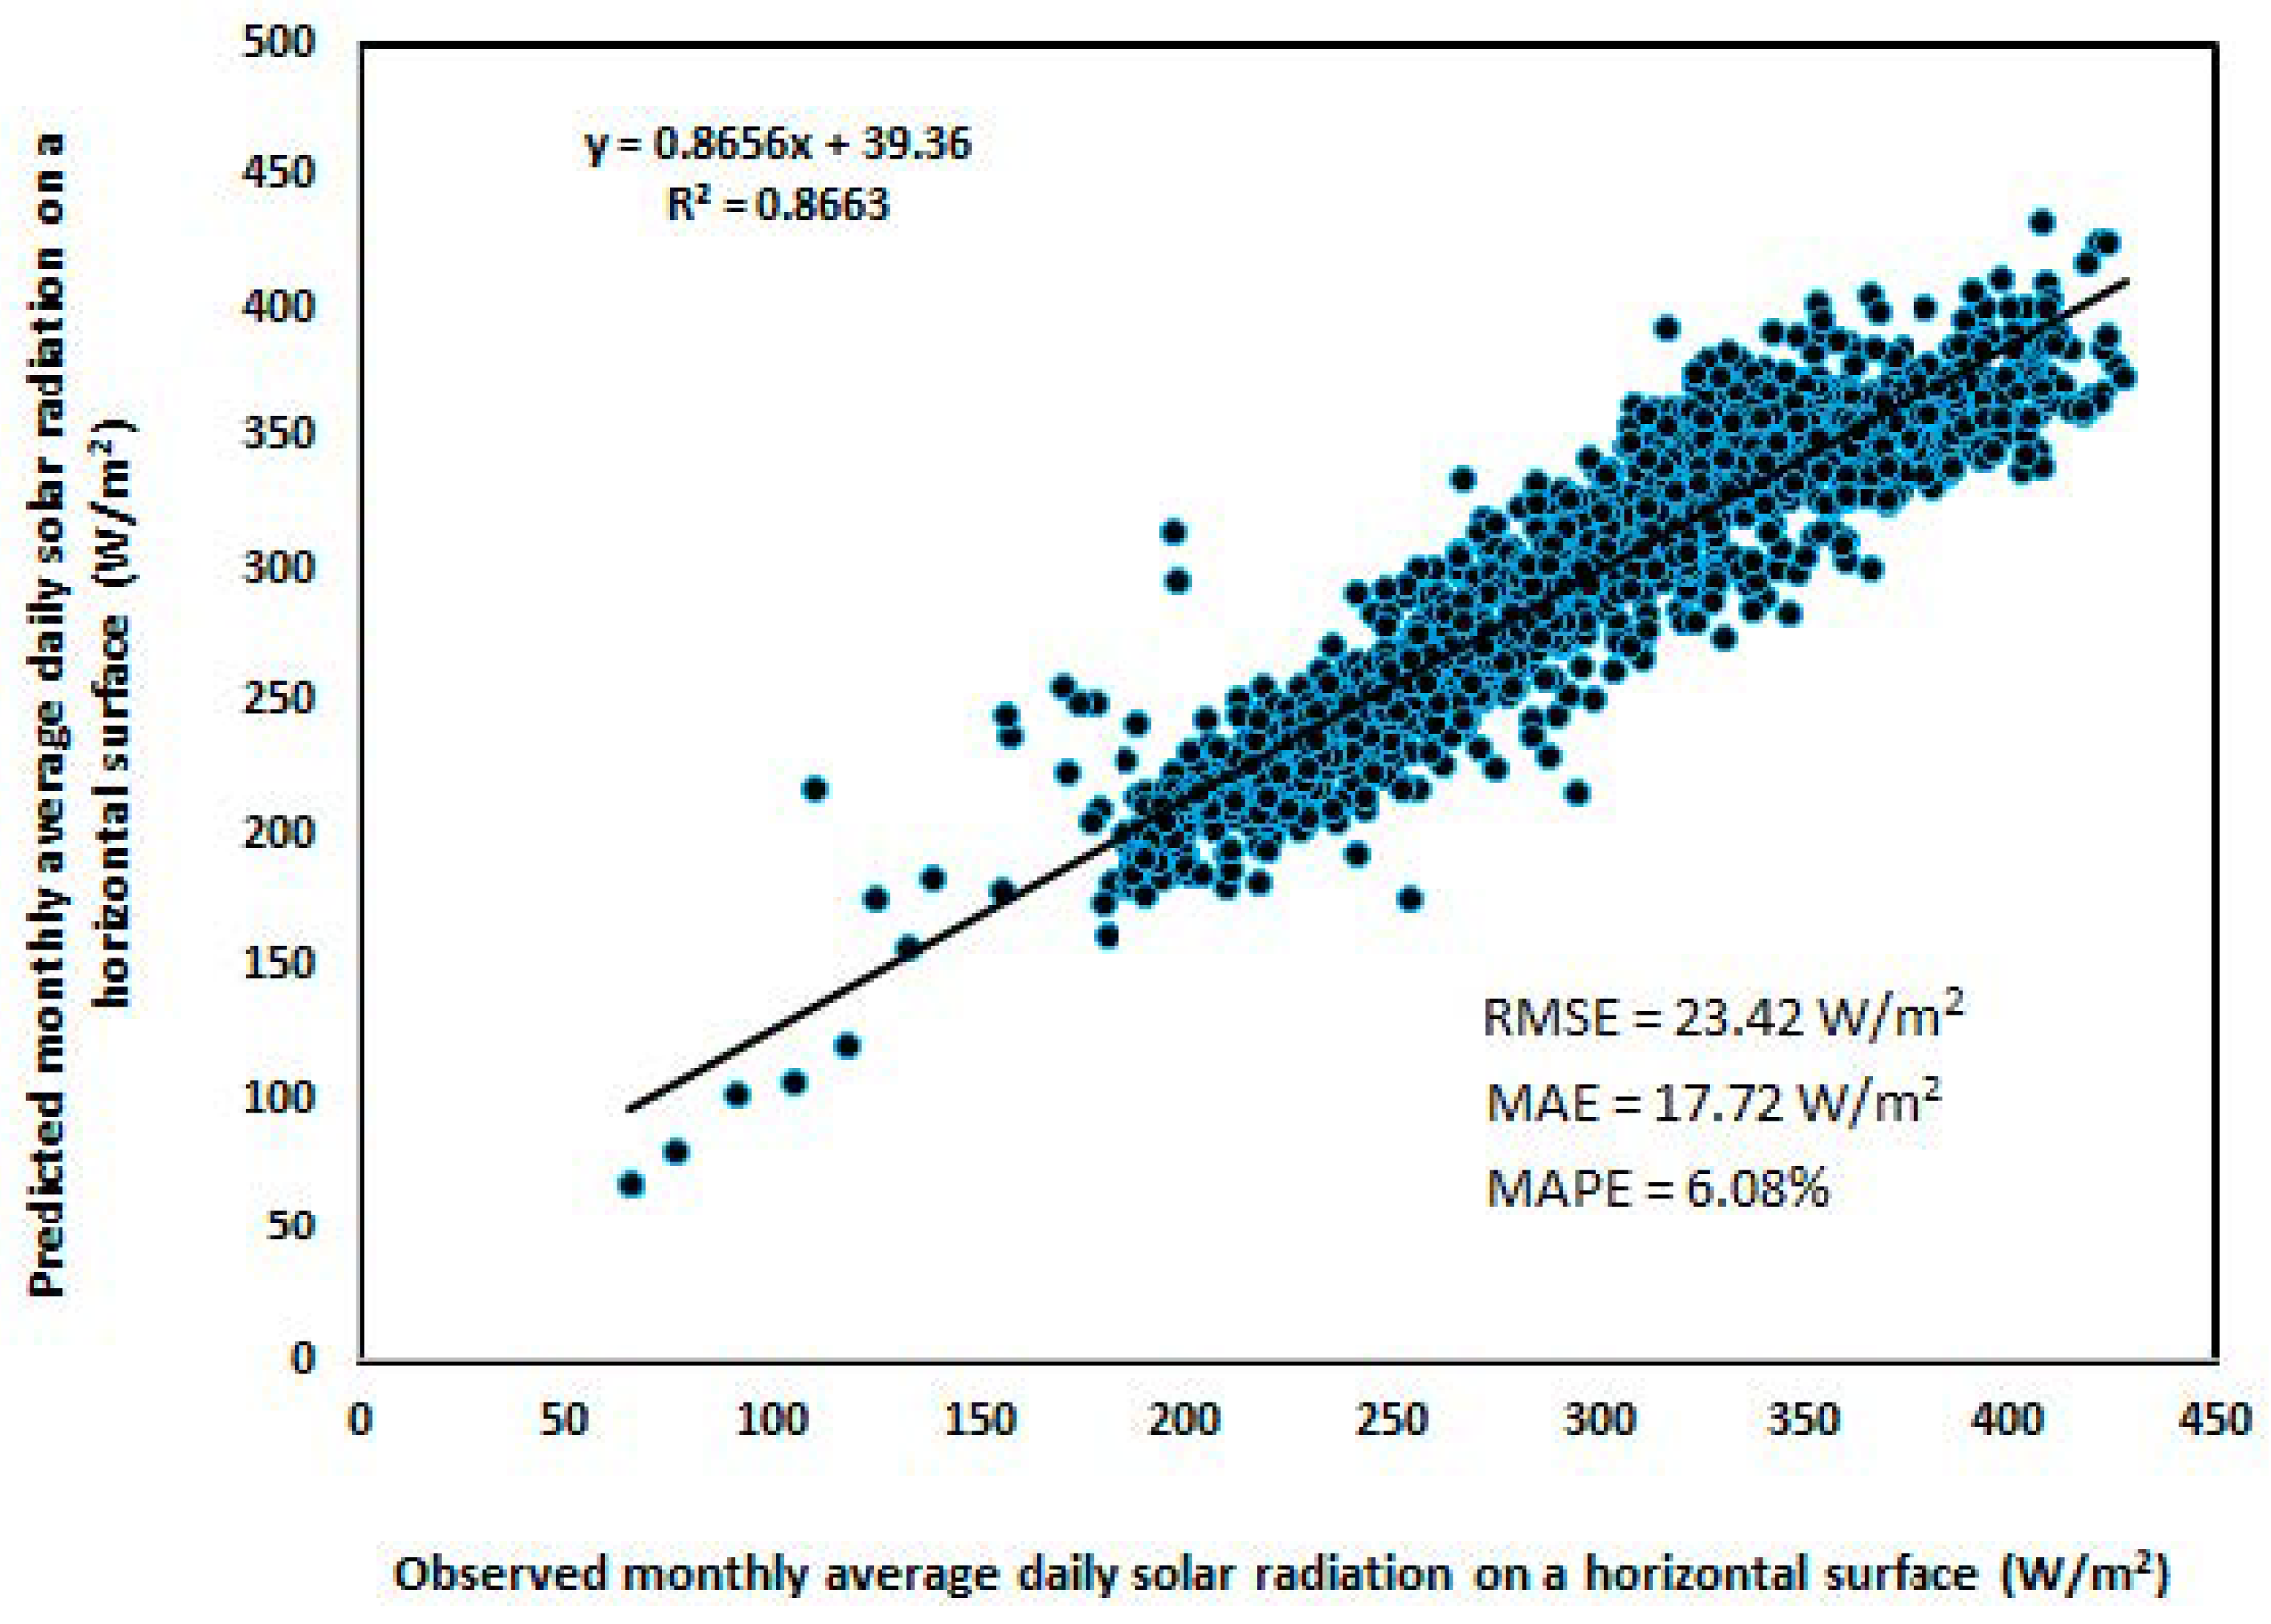
Table 5 displays the error outcomes of the built ANN model, which compares the mean absolute error (MAE) and root mean square error (RMSE) during the training and testing stages. These findings indicate that the ANN model accurately predicted the dependent variable of MADSR on a horizontal surface based on the examined explanatory variables. A scatter curve of the observed MADSR on a horizontal surface values in comparison to the values the ANN model predicted during training is displayed in Figure 11.
A scatter plot of the observed MADSR values on a horizontal surface in comparison to the values that the ANN model predicted during the testing phase is displayed in Figure 12. Additionally, it is predicted that the constructed ANN model will need a significant number of epochs (700,000 epochs) to reach optimal results during the training phase. The estimation findings over the data range were correct, as indicated by the R2, MAE, and RMSE values between the measured and estimated values of MADSR on a horizontal surface in Table 5. However, because the data points in the scatter plots are widely dispersed around the associated regression lines, Figure 11 and Figure 12 show that the prediction of higher solar radiation is partially reliable with more dataset. The accuracy might have dropped if the entire set of data had been considered. The results could be enhanced by collecting a more extensive dataset. Nonetheless, Table 5 indicates that the MAPE values were below 10% and were deemed acceptable [65].
Due to the rapid growth of solar power production worldwide and the associated fluctuations, effective solar radiation forecasting has become an important topic in the scientific literature in recent years [91]. Thus, diverse predictive models have been established to study their performance. Among these models, ANNs are the best because they are categorized by their capability to model complex nonlinear systems containing multiple dependent parameters of differing importance [92], and this is proved by a significant number of research papers cited in the literature involving modeling solar radiation using ANN techniques [5,8,21,23,24,27,32,33,36]. Our ANN model’s output was the MADSR on a horizontal surface (W/m2). We used nine input variables: altitude (m), the latitude of a location (°N), the longitude of a location (°E), the month of the year, maximum air relative humidity (%), the minimum air relative humidity (%), the maximum air temperature (°C), the minimum air temperature (°C), and sunshine duration (hrs). Other researchers used the same or different input variables. Thus, the behavior varied for various reasons, including ANN model configurations, explanatory features, training algorithms, the ANN type, the activation function, etc., when comparing the performance of the established ANN model with that of ANN models used in earlier studies to predict solar radiation. When ANN models are used to predict solar radiation, the explanatory features vary, which alters the models’ accuracy. Bezar et al. [93], for instance, looked at using an ANN model to forecast the amount of solar radiation present within a greenhouse, where air temperature, air relative humidity, and wind speed were used as inputs. The findings showed that the ANN predictions and the actual solar radiation had a correlation coefficient of more than 96%, suggesting that the model is entirely trustworthy for determining the amount of solar radiation in the greenhouse. Using a feedforward backpropagation ANN model, Koumi et al. [94] estimated the sun irradiation in Garoua (9.3° N, 13.4° E, 242 m above sea level). They used sunshine duration, air pressure, air temperature, and air relative humidity as inputs. Their best results had mean bias error (MBE) and RMSE close to zero, with a coefficient of determination of about 98%. Lastly, it can be concluded that the ANN models have a good forecast accuracy for the horizontal daily global sun irradiation [95].

3.3. Contribution of Each Input Parameter to the Prediction of MADSR on a Horizontal Surface Using the Developed ANN Model

Assessing the solar power potential of a particular location is an essential first step for effectively planning a solar energy system. Furthermore, because solar radiation forecasts are affected by various meteorological and geographic variables, identifying appropriate factors for accurate solar radiation forecasting is an important area of research. According to Dekker et al. [96], accurate information about the definite amount of solar energy accessible at a particular geographic location during a particular period is essential. It plays a vital role in the design of a photovoltaic system. Moreover, meteorological constraints play a crucial role in manipulating solar radiation [88,97].
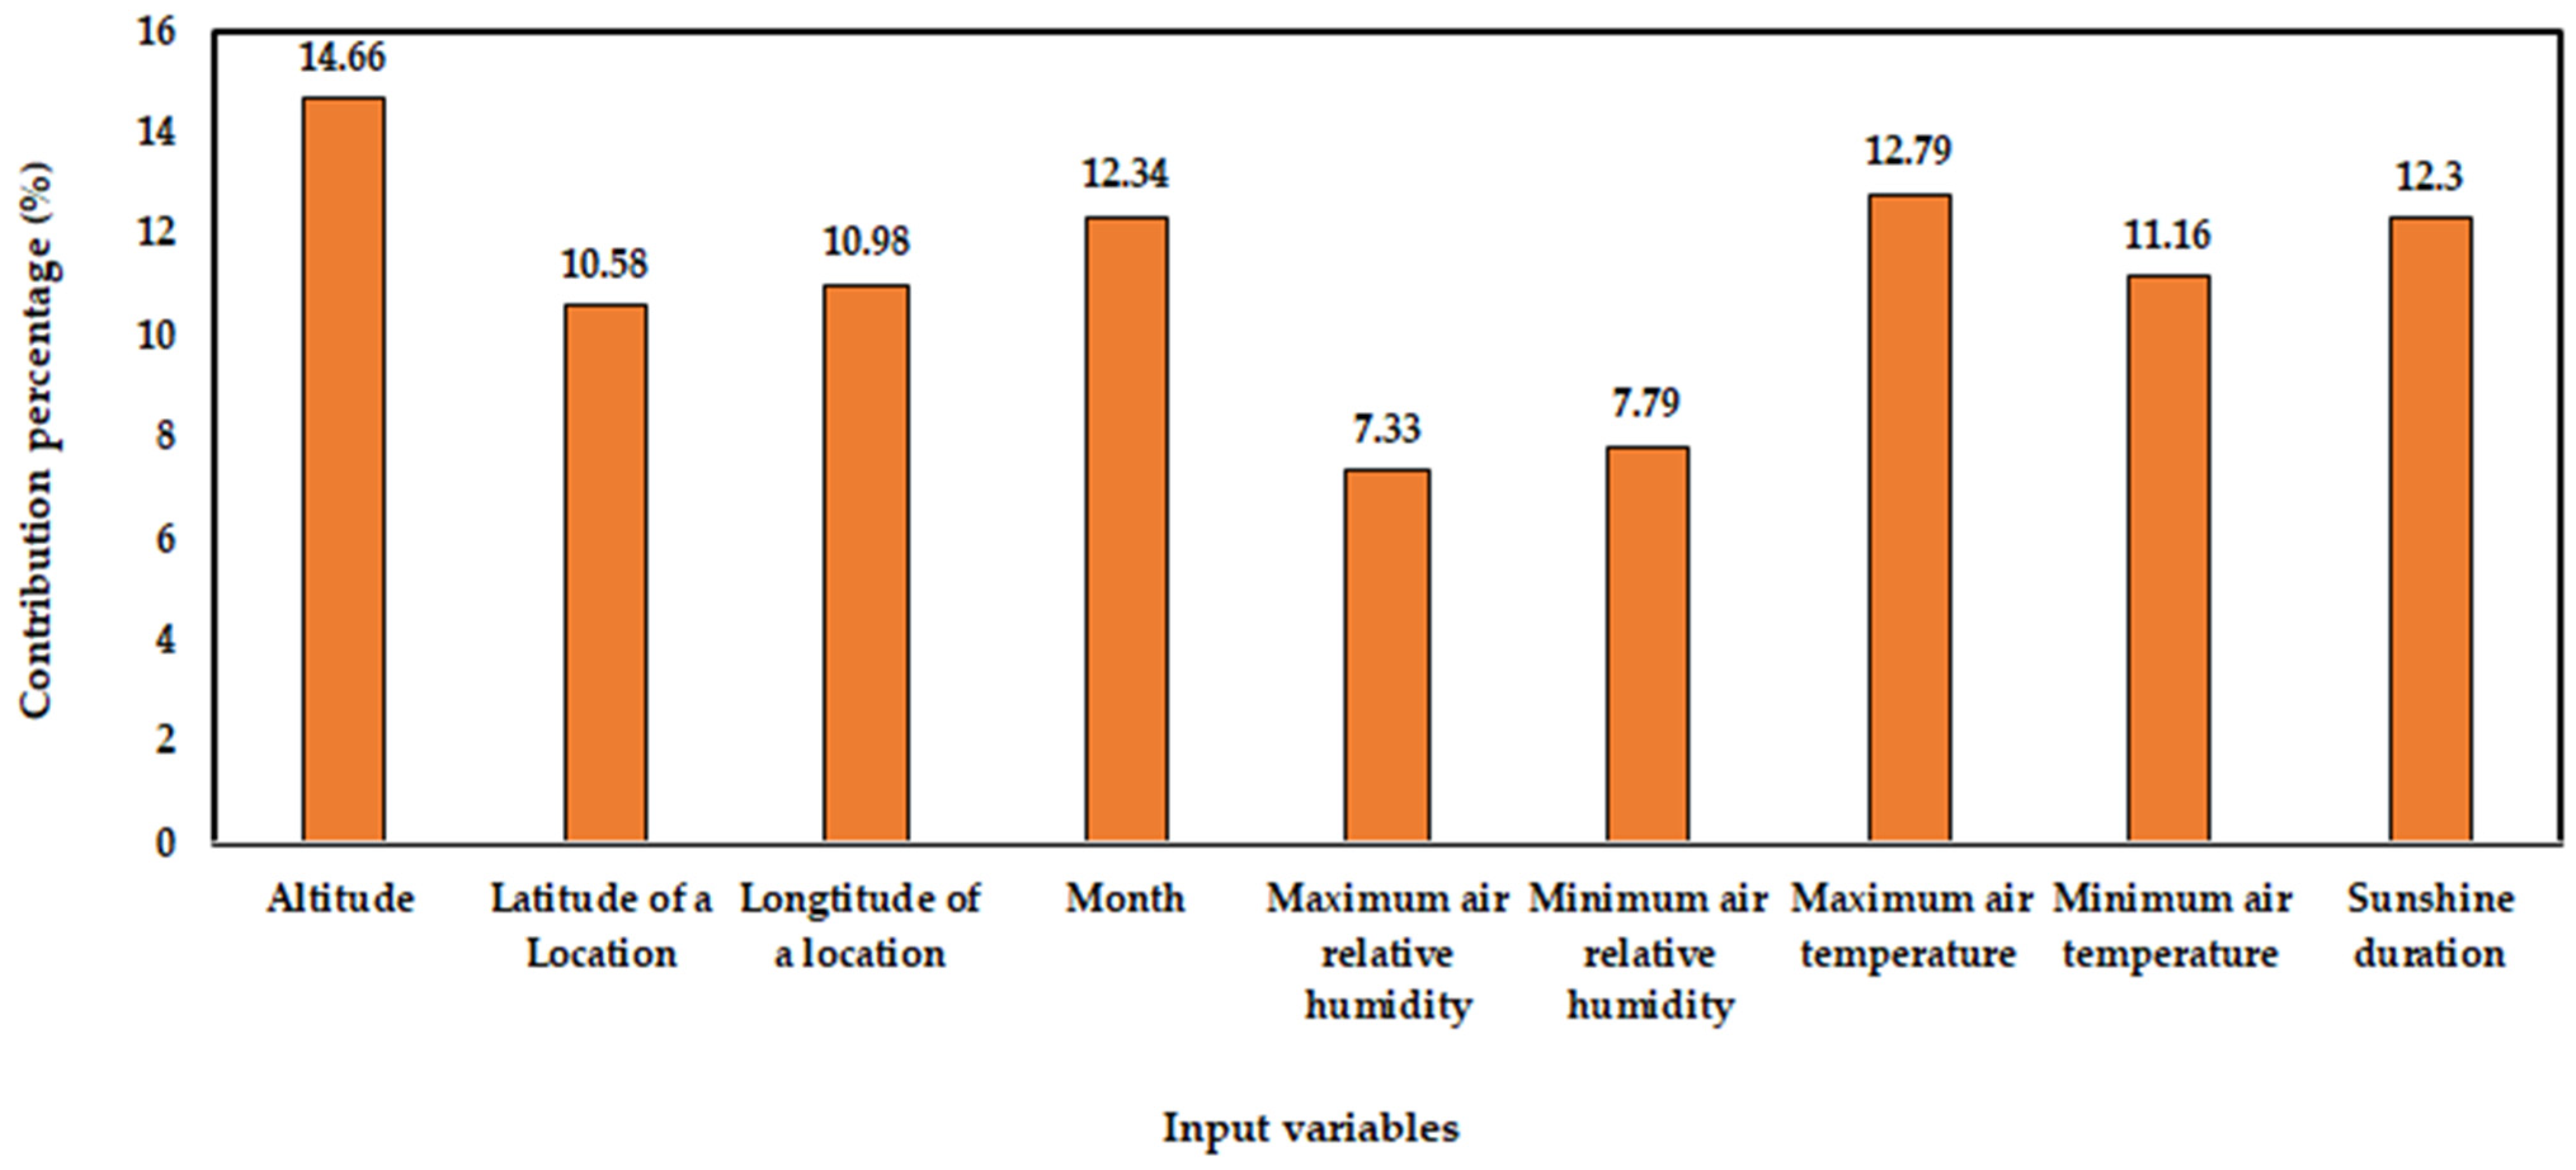
Each input parameter’s proportional importance as a percentage of its overall contribution is displayed in Figure 13. Remember that when a parameter has high sensitivity, even minor adjustments can significantly affect system performance and vice versa. Altitude, a process input variable, has the most considerable effect on the MADSR on a horizontal surface (14.66%), followed by the maximum air temperature (12.79%), the month of the year (12.34%), and sunshine length (12.30%), according to the contribution study. The contribution rate of latitude to solar radiation was 10.58%, whereas the contribution rate of longitude to solar radiation was 10.98%. Since including the parameter latitude and longitude makes probable an explanation for local features, the anticipated ANN model attains generalization. Based on the findings of Al-rubaye and Al-Khuzaie [98], air, temperature, air relative humidity, and rainfall all seem to have a significant effect on solar radiation.

3.4. Utilizing Developed ANN Model Weights and Biases to Forecast MADSR on a Horizontal Surface

In addition to offering insightful information about MADSR on a horizontal surface via prediction techniques in Saudi Arabia, this study emphasizes the pressing necessity for ongoing efforts to broaden data-gathering programs. Future studies can expand on this framework by tackling these issues to enhance knowledge and skills in local and global environmental management and solar energy forecasting. Therefore, this study focuses on employing an ANN model to forecast solar radiation based on various characteristics at numerous sites with disparate weather data. Therefore, Table 6 and Table 7 provide the weights and biases of the well-known ANN model MADSR on a horizontal surface. Equation (3) can create mathematical formulas that predict MADSR on a horizontal surface by utilizing the obtained biases and weights. The data gathered from measurements served as the basis for this study’s conclusions. However, in the future, a thorough examination of comparable data might be carried out to confirm different forecasting techniques for solar radiation. Lastly, to achieve better results, it is suggested that future studies on solar forecast carefully consider ANN approaches.

4. Conclusions

Predicting solar radiation is crucial for a variety of agricultural applications, such as calculating crop evapotranspiration for irrigation, tracking plant development and disease prevention, safeguarding the environment, preserving public health, adhering to legal requirements, and assisting in well-informed decision-making at the region, local, individual, and farming levels. The capacity of ANNs to model a process and learn as the process transmission function changes over time is one of their most intriguing features. To enable proper technical application, we made an effort to create networks with the most straightforward architecture and the most significant number of inputs. To estimate values of the monthly average daily solar radiation (MADSR) on a horizontal surface (W/m2), a consistent set of data regarding altitude, the location’s latitude and longitude, the maximum and the minimum air relative humidity, the month of the year, the maximum and minimum air temperatures, and sunshine duration was formulated. These could be measured on-site or estimated using the available models. For the training and testing datasets, the ANN built with architecture 9-30-1 produced accuracy coefficients of determination of 0.8663 and 0.8404, respectively. According to the findings, altitude had the most considerable influence on the MADSR on a horizontal surface (14.66%), followed by the maximum air temperature (12.79%), the month of the year (12.34%), and sunshine length (12.30%). The involvement rate of latitude to solar radiation was 10.58%, whereas the contribution rate of longitude to solar radiation was 10.98%. With contribution rates of 7.79%, the maximum air relative humidity affects the forecast of the MADSR on a horizontal surface. Despite the effectiveness of the ANN model, there are still positive limitations, which can be addressed in additional research, for example, the use of different seasons and times of the year with similar characteristics and the creation of models for each of them, as well as the use of other explicative variables that contribute to changes in the evolution of solar radiation, such as cloudiness and atmospheric pressure. In specific ways, the results of this study could inspire academics and progress the creation of artificial intelligence to forecast solar radiation. Furthermore, the suggested approach shows how ANN modeling approaches may be applied to identify the variables under investigation to accurately depict the temporal variation in solar radiation for a particular situation. The issue of deficient solar irradiance data in some areas may be significantly resolved by this study, which offers crucial baseline data for developing solar energy applications and identifying appropriate sites for them.

Author Contributions

Conceptualization, A.M.A., W.A.A., A.A.A.-J. and S.A.A.-H.; methodology A.M.A., S.S.A., S.A.M. and S.A.A.-H.; software, A.M.A., S.M.A.-S. and S.A.M.; formal analysis, A.M.A., S.S.A. and S.A.A.-H.; validation, A.M.A. and S.S.A.; visualization, S.S.A., S.M.A.-S. and A.M.A.; investigation, A.M.A., W.A.A., S.S.A., A.A.A.-J. and S.M.A.-S.; resources A.M.A., W.A.A. and S.A.M.; data curation, A.M.A., S.A.A.-H., S.S.A., A.A.A.-J. and S.A.M.; writing—original draft preparation, A.M.A., W.A.A., S.A.A.-H., S.S.A., S.A.M. and S.M.A.-S.; supervision, W.A.A.; funding acquisition, W.A.A., S.A.M. and S.M.A.-S.; writing—review and editing, all authors. All authors have read and agreed to the published version of the manuscript.

Funding

This research was funded by Researchers Supporting Project number (RSPD2025R752), King Saud University, Riyadh, the Kingdom of Saudi Arabia.

Institutional Review Board Statement

Not applicable.

Informed Consent Statement

Not applicable.

Data Availability Statement

Data are contained within the article.

Acknowledgments

The authors would like to extend their sincere appreciation to the Researchers Supporting Project (RSPD2025R752) at King Saud University, Riyadh, the Kingdom of Saudi Arabia.

Conflicts of Interest

The authors declare no conflicts of interest.

References

  1. The International Energy Agency. Available online: https://www.iea.org/energy-system/renewables (accessed on 1 January 2025).
  2. Kannan, N.; Vakeesan, D. Solar energy for future world: A review. Renew. Sustain. Energy Rev. 2016, 62, 1092–1105. [Google Scholar] [CrossRef]
  3. Anupong, W.; Jweeg, M.J.; Alani, S.; Al-Kharsan, I.H.; Alviz-Meza, A.; Cárdenas-Escrocia, Y. Comparison of Wavelet Artificial Neural Network, Wavelet Support Vector Machine, and Adaptive Neuro-Fuzzy Inference System Methods in Estimating Total Solar Radiation in Iraq. Energies 2023, 16, 985. [Google Scholar] [CrossRef]
  4. Shafi, I.; Khan, H.; Farooq, M.S.; Diez, I.D.l.T.; Miró, Y.; Galán, J.C.; Ashraf, I. An Artificial Neural Network-Based Approach for Real-Time Hybrid Wind–Solar Resource Assessment and Power Estimation. Energies 2023, 16, 4171. [Google Scholar] [CrossRef]
  5. Ali, M.A.; Elsayed, A.; Elkabani, I.; Akrami, M.; Youssef, M.E.; Hassan, G.E. Optimizing Artificial Neural Networks for the Accurate Prediction of Global Solar Radiation: A Performance Comparison with Conventional Methods. Energies 2023, 16, 6165. [Google Scholar] [CrossRef]
  6. World Energy Resources: Solar World Energy Council. 2013. Available online: https://www.worldenergy.org/assets/images/imported/2013/10/WER_2013_8_Solar_revised.pdf (accessed on 1 January 2025).
  7. Parida, B.; Iniyan, S.; Goic, R. A review of solar photovoltaic technologies. Renew. Sustain. Energy Rev. 2011, 15, 1625–1636. [Google Scholar] [CrossRef]
  8. Benghanem, M.; Mellit, A. Radial Basis Function Network-based prediction of global solar radiation data: Application for sizing of a stand-alone photovoltaic system at Al-Madinah, Saudi Arabia. Energy 2010, 35, 3751–3762. [Google Scholar] [CrossRef]
  9. Rodríguez, E.; Cardemil, J.M.; Starke, A.R.; Escobar, R. Modelling the Exergy of Solar Radiation: A Review. Energies 2022, 15, 1477. [Google Scholar] [CrossRef]
  10. Gao, X.; Cui, Y.; Hu, J.; Xu, G.; Wang, Z.; Qu, J.; Wang, H. Parameter extraction of solar cell models using improved shuffled complex evolution algorithm. Energy Convers. Manag. 2018, 157, 460–479. [Google Scholar] [CrossRef]
  11. Mohammadi, B.; Moazenzadeh, R. Performance Analysis of Daily Global Solar Radiation Models in Peru by Regression Analysis. Atmosphere 2021, 12, 389. [Google Scholar] [CrossRef]
  12. El-Sebaii, A.A.; Al-Ghamdi, A.A.; Al-Hazmi, F.S.; Faidah, A.S. Estimation of global solar radiation on horizontal surfaces in Jeddah, Saudi Arabia. Energy Policy 2009, 37, 3645–3649. [Google Scholar] [CrossRef]
  13. Ali, M.A.; Elsayed, A.; Elkabani, I.; Akrami, M.; Youssef, M.E.; Hassan, G.E. Artificial Intelligence-Based Improvement of Empirical Methods for Accurate Global Solar Radiation Forecast: Development and Comparative Analysis. Energies 2024, 17, 4302. [Google Scholar] [CrossRef]
  14. Asif, M. Growth and sustainability trends in the GCC countries with particular reference to KSA and UAE. Renew. Renew. Sustain. Energy Rev. 2016, 55, 1267–1273. [Google Scholar] [CrossRef]
  15. Hepbasli, A.; Alsuhaibani, Z. A Key review on present status and future directions of solar energy studies and applications in Saudi Arabia. Renew. Sustain. Energy Rev. 2011, 15, 5021–5050. [Google Scholar] [CrossRef]
  16. Asif, M. Urban Scale Application of Solar PV to Improve Sustainability in the Building and the Energy Sectors of KSA. Sustainability 2016, 8, 1127. [Google Scholar] [CrossRef]
  17. Youssef, M.E.; Hassan, G.E.; Mohamed, Z.E.; Ali, M.A. Investigating the performance of different models in estimating global solar radiation. Adv. Nat. Appl. Sci. 2016, 10, 379–389. [Google Scholar]
  18. Hassan, G.E.; Youssef, M.E.; Ali, M.A.; Mohamed, Z.E.; Hanafy, A.A. Evaluation of different sunshine-based models for predicting global solar radiation-Case study: New Borg El-Arab City, Egypt. Therm. Sci. 2018, 22, 979–992. [Google Scholar] [CrossRef]
  19. Tao, H.; Ewees, A.A.; Al-Sulttani, A.O.; Beyaztas, U.; Hameed, M.M.; Salih, S.Q.; Armanuos, A.M.; Al-Ansari, N.; Voyant, C.; Shahid, S.; et al. Global solar radiation prediction over North Dakota using air temperature: Development of novel hybrid intelligence model. Energy Rep. 2021, 7, 136–157. [Google Scholar] [CrossRef]
  20. Ali, M.A.; Elsayed, A.; Elkabani, I.; Youssef, M.E.; Hassan, G.E. Modeling global solar radiation using ambient temperature. Clean. Energy Syst. 2024, 7, 100101. [Google Scholar] [CrossRef]
  21. Amrouche, B.; Le Pivert, X. Artificial neural network based daily local forecasting for global solar radiation. Appl. Energy 2014, 130, 333–341. [Google Scholar] [CrossRef]
  22. Ali, M.A.; Hassan, G.E.; Youssef, M.E. Assessment the Performance of Artificial Neural Networks in Estimating Global Solar Radiation. In Proceedings of the First International Conference on New Trends for Sustainable Energy—ICNTSE, Alexandria, Egypt, 1–3 October 2016; pp. 148–150. [Google Scholar]
  23. Alzahrani, A.; Shamsi, P.; Dagli, C.; Ferdowsi, M. Solar irradiance forecasting using deep neural networks. Proc. Comput. Sci. 2017, 114, 304–313. [Google Scholar] [CrossRef]
  24. Shboul, B.; AL-Arfi, I.; Michailos, S.; Ingham, D.; Ma, L.; Hughes, K.J.; Pourkashanian, M. A new ANN model for hourly solar radiation and wind speed prediction: A case study over the north & south of the Arabian Peninsula. Sustain. Energy Technol. Assess. 2021, 46, 101248. [Google Scholar] [CrossRef]
  25. Mfetoum, I.M.; Ngoh, S.K.; Molu, R.J.J.; Nde Kenfack, B.F.; Onguene, R.; Naoussi, S.R.D.; Tamba, J.G.; Bajaj, M.; Berhanu, M. A multilayer perceptron neural network approach for optimizing solar irradiance forecasting in Central Africa with meteorological insights. Sci. Rep. 2024, 14, 3572. [Google Scholar] [CrossRef]
  26. Besharat, F.; Dehghan, A.A.; Faghih, A.R. Empirical models for estimating global solar radiation: A review and case study. Renew. Sustain. Energy Rev. 2013, 21, 798–821. [Google Scholar] [CrossRef]
  27. Ali, M.A.; Elsayed, A.; Elkabani, I.; Youssef, M.E.; Hassan, G.E. Evaluation and performance comparison of different models for global solar radiation forecasting: A case study on five cities. Environ. Dev. Sustain. 2023. [Google Scholar] [CrossRef]
  28. Busu, C.; Busu, M. An Application of the Kalman Filter Recursive Algorithm to Estimate the Gaussian Errors by Minimizing the Symmetric Loss Function. Symmetry 2021, 13, 240. [Google Scholar] [CrossRef]
  29. Yoon, B.J. Hidden Markov Models and their Applications in Biological Sequence Analysis. Curr. Genom. 2009, 10, 402–415. [Google Scholar] [CrossRef]
  30. Demir, V. Evaluation of Solar Radiation Prediction Models Using AI: A Performance Comparison in the High-Potential Region of Konya, Türkiye. Atmosphere 2025, 16, 398. [Google Scholar] [CrossRef]
  31. Al-Salihi, A.M.; Kadum, M.M.; Mohammed, A.J. Estimation of global solar radiation on horizontal surface using routine meteorological measurements for different cities in Iraq. Asian J. Sci. Res. 2010, 3, 240–248. [Google Scholar] [CrossRef]
  32. Gupta, S.; Singh, A.K.; Mishra, S.; Vishnuram, P.; Dharavat, N.; Rajamanickam, N.; Kalyan, C.N.S.; AboRas, K.M.; Sharma, N.K.; Bajaj, M. Estimation of Solar Radiation with Consideration of Terrestrial Losses at a Selected Location—A Review. Sustainability 2023, 15, 9962. [Google Scholar] [CrossRef]
  33. Hassan, M.A.; Almezhghwi, K.; Ghadedo, A. Solar Radiation Prediction in Libya Using Neural Networks. In Proceedings of the 2024 IEEE 4th International Maghreb Meeting of the Conference on Sciences and Techniques of Automatic Control and Computer Engineering (MI-STA), Tripoli, Libya, 19–21 May 2024; pp. 601–604. [Google Scholar] [CrossRef]
  34. Babatunde, O.M.; Munda, J.L.; Hamam, Y. Exploring the Potentials of Artificial Neural Network Trained with Differential Evolution for Estimating Global Solar Radiation. Energies 2020, 13, 2488. [Google Scholar] [CrossRef]
  35. González-Plaza, E.; García, D.; Prieto, J.-I. Monthly Global Solar Radiation Model Based on Artificial Neural Network, Temperature Data and Geographical and Topographical Parameters: A Case Study in Spain. Sustainability 2024, 16, 1293. [Google Scholar] [CrossRef]
  36. Chiteka, K.; Enweremadu, C.C. Prediction of global horizontal solar irradiance in Zimbabwe using artificial neural networks. J. Clean. Prod. 2016, 135, 701–711. [Google Scholar] [CrossRef]
  37. Nawab, F.; Hamid, A.S.A.; Ibrahim, A.; Sopian, K.; Fazlizan, A.; Fauzan, M.F. Solar irradiation prediction using empirical and artificial intelligence methods: A comparative review. Heliyon 2023, 9, e17038. [Google Scholar] [CrossRef]
  38. Alanazi, A.; Alanazi, M. Multicriteria Decision-Making for Evaluating Solar Energy Source of Saudi Arabia. Sustainability 2023, 15, 10228. [Google Scholar] [CrossRef]
  39. Khan, M.; Asif, M.; Stach, E. Rooftop PV Potential in the Residential Sector of the Kingdom of Saudi Arabia. Buildings 2017, 7, 46. [Google Scholar] [CrossRef]
  40. Almasoud, A.H.; Gandayh, H.M. Future of solar energy in Saudi Arabia. J. King Saud Univ. -Eng. Sci. 2015, 27, 153–157. [Google Scholar] [CrossRef]
  41. Pashiardis, S.; Pelengaris, A.; Kalogirou, S.A. Geographical Distribution of Global Radiation and Sunshine Duration over the Island of Cyprus. Appl. Sci. 2023, 13, 5422. [Google Scholar] [CrossRef]
  42. Mohandes, M.A.; Rehman, S. Estimation of sunshine duration in Saudi Arabia. J Renew Sustain. Energy 2013, 5, 033128. [Google Scholar] [CrossRef]
  43. El Alani, O.; Ghennioui, H.; Ghennioui, A.; Saint-Drenan, Y.V.; Blanc, P.; Hanrieder, N.; Dahr, F.E. A Visual Support of Standard Procedures for Solar Radiation Quality Control. Int. J. Renew. Energy Dev. 2021, 10, 401–414. [Google Scholar] [CrossRef]
  44. Available online: https://www.engr.scu.edu/~emaurer/tools/calc_solar_cgi.pl (accessed on 1 January 2025).
  45. Duffie, J.A.; Beckman, W.A. Solar Engineering of Thermal Processes; Wiley: New York, NY, USA, 1993. [Google Scholar]
  46. Şenkal, O.; Kuleli, T. Estimation of solar radiation over Turkey using artificial neural network and satellite data. Appl. Energy 2009, 86, 1222–1228. [Google Scholar] [CrossRef]
  47. Hassan, G.E.; Ali, M.A. Performance Evaluation of Artificial Neural Networks in Estimating Global Solar Ra-diation, Case Study: New Borg El-arab City, Egypt. Int. J. Environ. Sci. Sustain. Dev. 2017, 2, 16. [Google Scholar]
  48. Choudhary, A.; Pandey, D.; Bhardwaj, S. A Review for the Development of ANN Based Solar Radiation Estimation Models; Springer: Singapore, 2021; Volume 194. [Google Scholar]
  49. Foggno Fotso, H.R.; Aloyem Kazé, C.V.; Kenmoe, G.D. Optimal Input Variables Disposition of Artificial Neural Networks Models for Enhancing Time Series Forecasting Accuracy. Appl. Artif. Intell. 2020, 34, 792–815. [Google Scholar] [CrossRef]
  50. Fazeli, H.; Soleimani, R.; Ahmadi, M.A.; Badrnezhad, R.; Mohammadi, A.H. Experimental Study and Modeling of Ultrafiltration of Refinery Effluents Using a Hybrid Intelligent Approach. J. Energy 2013, 27, 3523–3537. [Google Scholar] [CrossRef]
  51. Bounoua, Z.; Ouazzani Chahidi, L.; Mechaqrane, A. Estimation of daily global solar radiation using empirical and machine-learning methods: A case study of five Moroccan locations. Sustain. Mater. Technol. 2021, 28, e00261. [Google Scholar] [CrossRef]
  52. Kumar, S.; Kaur, T. Development of ANN Based Model for Solar Potential Assessment Using Various Meteoro-logical Parameters. Energy Procedia 2016, 90, 587–592. [Google Scholar] [CrossRef]
  53. Çelik, Ö.; Teke, A.; Yildirim, H.B. The optimized artificial neural network model with Levenberg-Marquardt algorithm for global solar radiation estimation in Eastern Mediterranean Region of Turkey. J. Clean. Prod. 2016, 116, 1–12. [Google Scholar] [CrossRef]
  54. Marzouq, M.; Bounoua, Z.; El Fadili, H.; Mechaqrane, A.; Zenkouar, K.; Lakhliai, Z. New daily global solar irra-diation estimation model based on automatic selection of input parameters using evolutionary artificial neural networks. J. Clean. Prod. 2019, 209, 1105–1118. [Google Scholar] [CrossRef]
  55. Bounoua, Z.; Mechaqrane, A. Prediction of Short-Term and Long-Term Hourly Global Horizontal Solar Irradiation Using Artificial Neural Networks Techniques in Fez City, Morocco; Springer: Singapore, 2021; Volume 681. [Google Scholar]
  56. Bounoua, Z.; Mechaqrane, A. Hourly and sub-hourly ahead global horizontal solar irradiation forecasting via a novel deep learning approach: A case study. Sustain. Mater. Technol. 2023, 36, e00599. [Google Scholar] [CrossRef]
  57. Vesta Services, Inc. Qnet2000 Shareware. Vesta Services. Inc. 1001 Green Bay Rd, STE 196. Winnetka. IL 60093, USA, 2000. QnetV2kt. Qnet v2000 for Windows, the Complete Solution for Backpropagation Neural Network. Available online: https://qnetv2kt.software.informer.com/ (accessed on 1 January 2025).
  58. Al-Sager, S.M.; Almady, S.S.; Marey, S.A.; Al-Hamed, S.A.; Aboukarima, A.M. Prediction of Specific Fuel Consumption of a Tractor during the Tillage Process Using an Artificial Neural Network Method. Agronomy 2024, 14, 492. [Google Scholar] [CrossRef]
  59. Bakas, I.; Kontoleon, K.J. Performance Evaluation of Artificial Neural Networks (ANN) Predicting Heat Transfer through Masonry Walls Exposed to Fire. Appl. Sci. 2021, 11, 11435. [Google Scholar] [CrossRef]
  60. Pratiwi, H.; Windarto, A.P.; Susliansyah, S.; Aria, R.R.; Susilowati, S.; Rahayu, L.K.; Fitriani, Y.; Merdekawati, A.; Rahadjeng, I.R. Sigmoid Activation Function in Selecting the Best Model of Artificial Neural Networks. Conf. Ser. J. Phys. 2020, 1471, 012010. [Google Scholar] [CrossRef]
  61. Kassem, Y.; Camur, H.; Adamu, M.T.; Chikowero, T.; Apreala, T. Prediction of Solar Irradiation in Africa us-ing Linear-Nonlinear Hybrid Models. Eng. Technol. Appl. Sci. Res. 2023, 13, 11472–11483. [Google Scholar] [CrossRef]
  62. Mrzygłód, B.; Hawryluk, M.; Janik, M.; Olejarczyk-Wożeńska, I. Sensitivity analysis of the artificial neural networks in a system for durability prediction of forging tools to forgings made of C45 steel. Int. J. Adv. Manuf. Technol. 2020, 109, 1385–1395. [Google Scholar] [CrossRef]
  63. Yousefi, M.; Esrafili, A.; Gholami, M.; Mohammadi, A.A.; Khan, N.A.; Baziar, M.; Oskoei, V. Modeling and analysis of the groundwater hardness variations process using machine learning procedure. Desalination Water Treat. 2021, 238, 135–141. [Google Scholar] [CrossRef]
  64. Al-Dosary, N.M.N.; Alnajjar, F.M.; Aboukarima, A.E.W.M. Estimation of wheel slip in 2WD mode for an agricultural tractor during plowing operation using an artificial neural network. Sci. Rep. 2023, 13, 5975. [Google Scholar] [CrossRef]
  65. Pizarroso, J.; Portela, J.; Munoz, A. NeuralSens: Sensitivity Analysis of Neural Networks. J. Stat. Softw. 2022, 102. [Google Scholar] [CrossRef]
  66. Qazi, A.; Fayaz, H.; Wadi, A.; Raj, R.G.; Rahim, N.A.; Khan, W.A. The artificial neural network for solar radiation prediction and designing solar systems: A systematic literature review. J. Clean. Prod. 2015, 104, 1–12. [Google Scholar] [CrossRef]
  67. Khoshnevisan, B.; Rafiee, S.; Omid, M.; Mousazadeh, H.; Sefeedpari, P. Prognostication of environmental indices in potato production using artificial neural networks. J. Clean. Prod. 2013, 52, 402–409. [Google Scholar] [CrossRef]
  68. Chicco, D.; Warrens, M.J.; Jurman, G. The coefficient of determination R-squared is more informative than SMAPE, MAE, MAPE, MSE and RMSE in regression analysis evaluation. PeerJ Comput. Sci. 2021, 7, e623. [Google Scholar] [CrossRef]
  69. Tasie, N.N.; Israel-Cookey, C.; Banyie, L.J. The Effect of Relative Humidity on the Solar Radiation Intensity in Port Harcourt, Nigeria. Int. J. Res. 2018, 5, 128–136. [Google Scholar]
  70. Shrestha, A.K.; Thapa, A.; Gautam, H. Solar Radiation, Air Temperature, Relative Humidity, and Dew Point Study: Damak, Jhapa, Nepal. Int. J. Photoenergy 2019, 2019, 8369231. [Google Scholar] [CrossRef]
  71. Regmi, S.; Adhikary, S. Solar energy potential in Kath-mandu Valley, Nepal. J. Hydrol. Meteorol. 2012, 8, 77–82. [Google Scholar] [CrossRef]
  72. Poudyal, K.N.; Bhattarai, B.K.; Sapkota, B.K.; Kjeldstad, B.; Karki, N.R. Estimation of global solar radiation using pyranometer and NILU-UV irradiance meter at Pokhara Valley in Nepal. J. Inst. Eng. 2014, 9, 69–78. [Google Scholar] [CrossRef]
  73. Geerts, B. Empirical estimation of the monthly-mean daily temperature range. Theor. Appl. Climatol. 2002, 73, 101–132. [Google Scholar] [CrossRef]
  74. Villegas-Mier, C.G.; Rodriguez-Resendiz, J.; Álvarez-Alvarado, J.M.; Jiménez-Hernández, H.; Odry, Á. Optimized Random Forest for Solar Radiation Prediction Using Sunshine Hours. Micromachines 2022, 13, 1406. [Google Scholar] [CrossRef]
  75. Cañada, J. Global Solar Radiation in Pais Valenciano Using Sunshine Hours. Int. J. Ambient. Energy 1988, 9, 197–202. [Google Scholar] [CrossRef]
  76. Ibrahim, S.M.A. Predicted and Measured Global Solar Radiation in Egypt. Sol. Energy 1985, 35, 185. [Google Scholar] [CrossRef]
  77. Turton, S.M. The Relationship between Total Irradiation and Sunshine Duration in the Humid Tropics. Sol. Energy 1987, 38, 353. [Google Scholar] [CrossRef]
  78. Halouani, N.; Nguyen, C.T.; Vo-Ngoc, D. Calculation of Monthly Average Global Solar Radiation on Horizontal Surfaces using Daily Hours of Bright Sunshine. Sol. Energy 1993, 50, 247. [Google Scholar] [CrossRef]
  79. Atsbeha, A.K.; Gebremariam, G.G.; Gebreslassie, T.H. Analysis of sunshine hours data and estimation of global solar radiation for Mychew Tabia Smret station, Northern Ethiopia. Sustain. Energy Res. 2024, 11, 38. [Google Scholar] [CrossRef]
  80. Farahat, A.; Kambezidis, H.D.; Labban, A. The Solar Radiation Climate of Saudi Arabia. Climate 2023, 11, 75. [Google Scholar] [CrossRef]
  81. Dvorkin, A.Y.; Steinberger, E.H. A modeling the altitude effect on solar UV radiation. Sol. Energy 1999, 65, 181–187. [Google Scholar] [CrossRef]
  82. Aldobhani, A.M.S. Effect of Altitude and Tilt Angle on Solar Radiation in Tropical Regions. J. Sci. Technol. 2014, 19, 96–109. [Google Scholar]
  83. Bel, G.; Bandi, M.M. Geographic Dependence of the Solar Irradiance Spectrum at Intermediate to High Frequencies. Phys. Rev. Appl. 2019, 12, 024032. [Google Scholar] [CrossRef]
  84. Kopp, G. Daily solar flux as a function of latitude and time. Sol. Energy 2023, 249, 250–254. [Google Scholar] [CrossRef]
  85. Mohandes, M.A. Modeling global solar radiation using Particle Swarm Optimization (PSO). Sol. Energy 2012, 86, 3137–3145. [Google Scholar] [CrossRef]
  86. Sarkin, A.S.; Dindar, T. The Effect of Latitude Differences, Sunshine Periods, Solar Radiation Quantities and Air Temperatures on Solar Electricity Generation. J. Smart Grid Sustain. Energy Technol. 2017, 1, 20–23. [Google Scholar] [CrossRef]
  87. Chabane, F.; Arif, A.; Benramache, S. Prediction of the solar radiation map on Algeria by latitude and longitude coordinates. Tec. Ital. Ital. J. Eng. Sci. 2020, 64, 213–215. [Google Scholar] [CrossRef]
  88. Yadav, A.K.; Malik, H.; Chandel, S.S. Selection of most relevant input parameters using WEKA for artificial neural network based solar radiation prediction models. Renew. Sustain. Energy Rev. 2014, 31, 509–519. [Google Scholar] [CrossRef]
  89. Babar, B.; Graversen, R.; Boström, T. Solar radiation estimation at high latitudes: Assessment of the CMSAF databases, ASR and ERA5. Sol. Energy 2019, 182, 397–411. [Google Scholar] [CrossRef]
  90. Kafka, J.L.; Miller, M.A. A climatology of solar irradiance and its controls across the United States: Implications for solar panel orientation. Renew. Energy 2019, 135, 897–907. [Google Scholar] [CrossRef]
  91. Chodakowska, E.; Nazarko, J.; Nazarko, L.; Rabayah, H.S. Solar Radiation Forecasting: A Systematic Meta-Review of Current Methods and Emerging Trends. Energies 2024, 17, 3156. [Google Scholar] [CrossRef]
  92. Amiri, B.; Dizène, R.; Dahmani, K. Most relevant input parameters selection for 10-min global solar irradiation estimation on arbitrary inclined plane using neural networks. Int. J. Sustain. Energy 2020, 39, 779–803. [Google Scholar] [CrossRef]
  93. Bezari, S.; Adda, A.; Kherrour, S.; Zarrit, R. Artificial Neural Network Application for the Prediction of Global Solar Radiation Inside a Greenhouse. In Renewable Energy Resources and Conservation; Pong, P., Ed.; Green Energy and Technology; Springer: Cham, Switzerland, 2024. [Google Scholar] [CrossRef]
  94. Koumi Ngoh, S.; Ayina, O.; Monkam, L.; Kemajou, A. Estimation of the Global Solar Radiation Under Su-dan-Type Tropical Climate Using Artificial Neural Network Model. ISESCO J. Sci. Technol. 2013, 9, 22–33. [Google Scholar]
  95. Diez, F.J.; Navas-Gracia, L.M.; Chico-Santamarta, L.; Correa-Guimaraes, A.; Martínez-Rodríguez, A. Prediction of Horizontal Daily Global Solar Irradiation Using Artificial Neural Networks (ANNs) in the Castile and León Region, Spain. Agronomy 2020, 10, 96. [Google Scholar] [CrossRef]
  96. Dekker, J.; Nthontho, M.; Chowdhury, S.; Chowdhury, S.P. Investigating the effects of solar modelling using different solar irradiation data sets and sources within South Africa. Sol. Energy 2012, 86, 2354–2365. [Google Scholar] [CrossRef]
  97. Hussain, S.; Alili, A.A. A pruning approach to optimize synaptic connections and select relevant input parameters for neural network modelling of solar radiation. Appl. Soft Comput. 2017, 52, 898–908. [Google Scholar] [CrossRef]
  98. Al-rubaye, A.; Al-Khuzaie, M.M. Artificial Neural Networks for Solar Radiation Prediction: Case Study, Al-Qadisiyah, Iraq. J. Eng. Res. 2024, 20, 106–112. [Google Scholar] [CrossRef]
Figure 1. Common methods for forecasting solar radiation as described in the literature, adapted from [25] (ARMA: autoregressive moving average, SVM: support vector regression, ANN: artificial neural network, and ARIMA: autoregressive integrated moving average, A Kalman filter, also known as a linear quadratic estimation filter, recursively estimates the current state of a system over time using input measurements from a mathematical process model [28], and a hidden Markov model (HMM) is a statistical model that can be used to define the progress of observable events that depend on internal factors that cannot be directly observed [29].
Processes 13 01149 g001
Figure 2. The single hidden layer architecture of a feedforward neural network architecture [49].
Processes 13 01149 g002
Figure 3. The architecture (9-30-1) of the three layers of the developed ANN model in the present study is used to predict the MADSR on a horizontal surface.
Processes 13 01149 g003
Figure 4. Correlation between the MADSR on a horizontal surface and monthly average daily air relative humidity.
Processes 13 01149 g004
Figure 5. Correlation between the MADSR on a horizontal surface and monthly average daily air temperature.
Processes 13 01149 g005
Figure 6. Correlation between the MADSR on a horizontal surface and monthly average daily sunshine duration.
Processes 13 01149 g006
Figure 7. Variation in the MADSR on a horizontal surface as a function of the altitude.
Processes 13 01149 g007
Figure 8. Variation in the MADSR on a horizontal surface as a function of the latitude.
Processes 13 01149 g008
Figure 9. Variation in the MADSR on a horizontal surface as a function of the longitude.
Processes 13 01149 g009
Figure 10. Variation in the MADSR on a horizontal surface as a function of the month of the year (1 is January and 12 is December).
Processes 13 01149 g010
Figure 11. Scatter plot of observed monthly average daily solar radiation on horizontal surface values compared to estimated values by the ANN model using the training dataset with a regression line.
Processes 13 01149 g011
Figure 12. Scatter plot of observed monthly average daily solar radiation on horizontal surface values compared to estimated values by the ANN model using the testing dataset with regression line.
Processes 13 01149 g012
Figure 13. Relative importance as an influence of input variables to the prediction of MADSR on a horizontal surface by means of the established ANN model of (9-30-1).
Processes 13 01149 g013
Table 1. Coordinates of the investigated meteorological stations.
Station IDStation SettingAltitudeLatitudeLongitude
(m)(°N)(°E)
166Hofuf16025.3149.63
186Hail101027.6341.72
215Khlais6022.1539.34
366Madinah59024.4739.60
405Najran125017.5744.23
452Riyadh56424.7746.74
786Unaizah72426.0943.97
497Sabya 40 17.1542.68
769Tabuk 773 28.3836.57
Table 2. Descriptive statistics of all investigated variables; the values are the average monthly or daily data.
CriteriaAltitudeLatitudeLongitudeRHmaxRHminTmaxTminSunshine DurationMADSR on a Horizontal Surface
(m)(°N)(°E)(%)(%)(°C)(°C) (hrs) (W/m2)
Minimum4017.1536.5711.772.907.911.212.7191.12
Maximum125028.3849.6398.0384.6848.5044.3812.11427.91
Mean583.3323.7542.6957.1124.7332.7018.208.68297.74
Kurtosis coefficient−1.10−0.85−0.66−0.922.34−0.67−0.701.15−0.89
Skewness coefficient0.04−0.700.19−0.191.15−0.40−0.17−0.61−0.08
Standard deviation±396.88±3.82±3.74±20.51±11.80±7.69±7.59±1.32±62.92
Coefficient of variation (%)68.0416.078.7735.9147.7223.5041.7115.2321.13
Table 3. Data assembly for producing an ANN model was established to predict the MADSR on a horizontal surface.
Independent Variables (Inputs)Dependent Variable (Output)
AltitudeLatitude of a LocationLongitude of a LocationMonthMaximum Air Relative HumidityMinimum Air Relative HumidityMaximum Air TemperatureMinimum Air TemperatureSunshine DurationMADSR on a Horizontal Surface
(m)(°N)(°E)(-)(%)(%)(°C)(°C)(hrs)(W/m2)
6022.1539.344.0069.2026.1131.9520.294.23373.37
6022.1539.346.0072.6627.7638.9825.925.46341.51
16025.3149.637.0061.5026.4344.4826.682.71356.67
6022.1539.343.0073.8633.0333.3522.464.41283.57
16025.3149.634.0061.5026.4330.7813.432.76338.42
16025.3149.636.0031.6010.4042.8223.833.55366.03
6022.1539.3410.0091.8048.3037.0526.965.85155.13
4017.1542.687.0071.0340.9038.8931.057.68219.33
Table 4. Descriptive statistics of mean air relative humidity (RHmean) and mean air temperature (Tmean).
CriteriaRHmean = (RHmax + RHmin)/2Tmean = (Tmax + Tmin)/2
(%)(°C)
Minimum8.255.16
Maximum88.6340.18
Mean40.9225.45
Kurtosis coefficient−0.62−0.92
Skewness coefficient0.11−0.39
Standard deviation15.217.22
Coefficient of variation (%)37.1628.39
Table 5. Comparison of the established ANN model’s (9-30-1) performance on the training and testing datasets using statistical measures.
Output NodeTraining DatasetTesting Dataset
RMSE MAE MAPE, % R2 RMSE MAE MAPE, % R2
MADSR on a horizontal surface (W/m2)23.4217.726.080.866325.5619.426.860.8404
Table 6. Equation (3) spread on to the weights (Wk,i) between inputs and the hidden layer of the built ANN model (9-30-1) for MADSR prediction on a horizontal surface.
Neurons of the Hidden LayerWk,i = Values of the Weights Between the Input Layer and the Hidden Layer
AltitudeLatitude of a LocationLongitude of a LocationMonth of the YearMaximum Air Relative HumidityMinimum Air Relative HumidityMaximum Air TemperatureMinimum Air TemperatureSunshine Duration
(m)(°N)(°E)(-)(%)(%)(°C)(°C)(hrs)
13.643252.28576−0.252795.508580.51658−1.40753−0.20721−1.07723−5.28737
22.49036−2.691255.430940.76316.26345−0.658750.284760.86126−2.80097
3−1.64653−1.149381.466351.259782.40622.7282−2.13758−0.958970.77022
4−0.530440.035910.46227−0.5588−0.215120.26658−0.70735−0.43342−0.19672
55.4611−4.916451.721943.615612.52490.944210.71735−2.473870.14065
6−6.29028−0.43053−1.94248−3.51798−3.79139−3.177079.42016−7.04497−1.87773
7−0.00832−0.3269−0.3298−0.58201−0.094750.01211−0.494450.1567−0.60397
8−0.33478−0.64099−0.50119−0.33641−1.31591−0.91474−0.542910.18722−0.47037
9−6.21581−3.668772.10548−2.69447−1.281581.205783.010610.69961.40528
100.60409−0.32921−0.13627−0.54768−1.52076−1.1733−0.92987−0.77138−0.45265
11−1.45994−3.11725−0.40443−2.59807−2.753220.015023.601634.51328−4.08795
121.17886−0.37657−0.04258−0.1527−2.2182−1.10148−0.07266−0.85642−0.59411
13−0.98345−0.45196−1.11988−0.78257−0.45077−1.16004−0.226561.37189−0.88922
14−1.887330.46629−1.21425−0.35606−1.07621−1.30071.505222.93697−5.01394
151.04717−0.434640.044430.76904−2.49212−1.08612−1.51021−0.77521−0.37857
163.72529−0.6257−1.66129−5.575533.36003−2.53558−0.4524−1.34861−1.05367
170.9423−5.182261.0030.362620.368071.6469−1.121210.77612−3.08583
18−0.05788−0.78244−0.73355−0.968360.415260.231810.30208−0.60984−0.46381
19−2.787540.40895−6.73058−9.31486−0.668261.20828−0.857052.75672−3.88305
202.299840.061680.08106−1.64415−1.96686−0.883175.472032.546450.91788
215.50867−2.033770.92059−1.45215−1.41973−1.23092−0.77912−1.96309−0.25458
22−2.933771.51832−6.09499−14.35420.02584−0.580671.331622.92809−2.73823
23−0.233990.80378−1.850730.579252.92675−2.36815−0.97265−4.18414−0.16201
24−0.24979−0.790680.23047−0.254480.04990.14674−0.46218−0.02789−0.3555
25−0.14734−0.17937−0.27351−0.41305−0.37015−0.15855−0.25968−0.25839−0.46269
260.71323−0.059190.06520.30638−2.27481−0.77718−1.30538−1.36889−0.33638
274.249050.84893−6.92155−3.85277−6.98483−1.00357−0.047212.518232.33017
28−1.505340.61333−1.86707−13.42370.00806−1.724572.312371.061871.39098
293.13622−0.02797−1.49809−0.58727−5.56297−1.31044−3.10907−3.14824−0.30802
30−0.20973−0.13387−0.54791−0.09096−0.32142−0.064490.04704−0.54654−0.62289
Table 7. Equation (3) is used to guess the MADSR on a horizontal surface using the established ANN (9-30-1) model’s hidden layer biases (bi), output layer biases (by), and weight between the output and the hidden layer (Wi,y).
Neurons of the Hidden Layerbi = Biases Values for the Hidden LayerWi,y = Values of the Weights Between the Output and the Hidden Layerby = Biases Values for the Output Layer
MADSR on a Horizontal Surface (W/m2)
10.66127−4.84465−2.02257
2−2.075334.91145
30.107372.76182
4−0.607280.57118
5−3.19605−5.11818
62.714038.89179
7−0.67962−0.32213
80.31858−1.66883
90.39121−5.28378
100.0176−1.66251
112.847014.06481
12−0.38936−2.38008
130.67291−2.23174
141.53701−5.22902
15−0.04531−2.60486
16−0.864533.80742
172.059254.00986
18−0.549641.09945
198.40291−8.00214
20−2.904483.40216
21−0.52552−5.26179
227.194368.8439
232.379413.35191
24−0.394840.43398
25−0.51009−0.31124
26−0.01125−2.00613
270.758533.39389
282.8514−8.06339
294.605014.46458
30−0.604880.17584
Disclaimer/Publisher’s Note: The statements, opinions and data contained in all publications are solely those of the individual author(s) and contributor(s) and not of MDPI and/or the editor(s). MDPI and/or the editor(s) disclaim responsibility for any injury to people or property resulting from any ideas, methods, instructions or products referred to in the content.