Abstract
The blueberry fruit (Vaccinium corymbosum L.) exhibits a high content of bioactive compounds, including anthocyanins, that can be used as pigmenting agents, but they are mixed with sugars, which can hinder their utilization. The objective was to evaluate the use of aqueous two-phase extraction aided by centrifugation to separate bioactive compounds, particularly anthocyanins, from blueberry fruits, considering the reduction of sugars, for their use as pigmenting agents in a food product. A mixture of trisodium citrate (Na3C3H5O(COO)3; Na3Cit) and polyethylene glycol ([HO-(CH2CH2O)n-CH2OH]; poly (ethane-1,2-diol); PEG) with a molecular weight of 4 kDa was used. Based on the cloud point method, a binodal diagram was developed. After the evaluation of several systems with composition located on a tie line, conditions were identified to form biphasic systems with phases of equal volume. Passive sedimentation for 0, 15, and 30 min, followed by centrifugation and also passive sedimentation for 24 h without centrifugation, were evaluated. A system with 17.73% Na3Cit, 21.33% PEG, 30 min of passive sedimentation, and 15 min of centrifugation at 2940× g produced an extract with a high concentration of soluble phenols (0.353 mg/mL) and anthocyanins (0.202 mg/mL) and, likewise, high antioxidant activity (910.0 mmol gallic acid equivalents per mL), with reduced sugar content, which demonstrated to have the potential to pigment food beverages with a reddish tone.
1. Introduction
Blueberry (Vaccinium corymbosum L.) is a highly consumed fruit, both fresh and processed [1]. It is a fruit rich in bioactive compounds that give it a high antioxidant potential [2,3], which benefits the health of consumers [4]. Commonly, the packaging and processing industry of this type of fruit discards material that does not meet the minimum quality required or generates waste that is left without any further use, but it can be used to extract bioactive compounds or to formulate ingredients for other foods [1,5]. Among the group of bioactive substances of blueberry fruits, phenolic compounds stand out, particularly phenolic acids [6], flavonoids, and anthocyanins [7,8]. The color of the blueberry fruits is due to the presence of anthocyanins [9], which are water-soluble pigments from the flavonoid group contained in red-, purple-, and blue-colored plants, where they play roles in propagation and in the development of defense mechanisms [10]. In the blueberry fruit, delphinidin and petunidin accumulate rapidly as ripening progresses and the exocarp changes from green to pink, but in the ripe fruit, with a dark hue, cyanidin stands out [9].
Due to this chromophore property, anthocyanins have generated interest for their use as pigmenting agents in industries of foods [10,11], in cosmetics [11], in the development of active coatings [12], in the development of intelligent packaging [13,14,15], and even in the medical area, in the development of sensors for the detection of carcinoembryonic antigen [16]. This is particularly important in the context that the U.S. Food and Drug Administration has banned the use of artificial colorings such as Red No. 3 due to the risk of inducing cancer [17]. However, anthocyanins are unstable and susceptible to degradation by external factors such as pH, temperature, light, and oxygen, among others [18], which must be considered during the extraction and use of these compounds.
Anthocyanins can be recovered by conventional solid-liquid extraction with solvents such as ethanol and water and with the aid of ultrasonication or microwaves [19,20,21,22] or more directly from the juice if, as in the case of blueberry, it is a material with high moisture content [23]. In any case, the use of anthocyanins from blueberry fruits faces two problems: one related to the high sugar content, mainly glucose and fructose [24], and the other, related to the need to concentrate the compounds for their use as ingredients in a food. In the first case, fermentation can be used, which allows low-temperature handling with pH control to take care of the stability of the anthocyanins [25], but the treatment time can last several days, and the effect of the presence of fermentative metabolites and the need to eliminate the alcohol by evaporation would have to be evaluated. Another option is the use of membranes to undertake non-thermal separations by ultrafiltration or nanofiltration, where an important challenge is the selection or treatment of the membrane to have a low level of fouling [26]. On the other hand, the concentration of compounds must consider the need of using a low temperature condition to avoid degradation, for which vacuum evaporation [27] or progressive freeze concentration [28] can be used, where the use of freezing systems and the continuous removal of the formed crystals are necessary. Thus, in general, the extraction of anthocyanins requires a sequence of several unit operations that must be optimized.
Alternatively, the use of aqueous two-phase extraction has been shown to address both sugar reduction [29] and concentration of natural pigments by non-thermal procedures [30] in a single operation, giving it an advantage over other anthocyanin separation options. The aqueous two-phase extraction is a procedure that can be implemented by mixing two polymers, such as dextran or polyethylene glycol [31]; a polymer and a salt, such as sodium citrate [30] or potassium phosphate [29]; or a salt and an organic solvent such as propanol [32] or acetone [33]. Depending on the concentration of the components, the mixture can form systems of two immiscible phases, between which the present compounds are separated by a salting-out phenomenon [34]. Furthermore, it is possible to control the volume of the phases formed and thus the concentration of the compounds separated by a non-thermal procedure [30].
It has been reported that the mixture of polyethylene glycol and sodium citrate can form biphasic systems with adequate salting-out potential to separate bioactive compounds, including anthocyanins [35]. In addition, both sodium citrate [36] and polyethylene glycol [37] can be used as additives in the food industry, so their residual presence in the pigment extract can be approved by the corresponding organizations. However, the sodium citrate can cause an increase in the system pH [38], which can be a disadvantage since anthocyanins are stable with pH in the range of 3.0 to 5.0 [39], so the process must minimize the exposure of natural pigments to degradative conditions. In this regard, García-Cruz et al. [32] suggested that the aqueous two-phase extraction can be combined with centrifugation once the phase formation has started passively to reduce the separation time. In this sense, the present work had the objective of evaluating the use of aqueous two-phase extraction aided with centrifugation to separate bioactive compounds, particularly anthocyanins, from blueberry fruits, considering the reduction of sugars, for their use as pigmenting agents in a food product.
2. Materials and Methods
2.1. Raw Material
Ripe blueberry fruits (Vaccinium corymbosum L.) acquired in a commercial establishment were used. The fruits were evaluated in terms of total soluble solids with a refractometer (Atago Co. Ltd., Tokio, Japan) and titratable acidity with NaOH 0.01 N (Merk KGaA, Darmstadt, Germany) and phenolphthalein (Merk KGaA, Germany) as an indicator, obtaining 12.2 (±0.8) °Brix and 0.43% (±0.06), respectively. In addition, a color evaluation was performed with a Hunter Lab colorimeter (MiniScan XE® Plus, Hunter Associates Laboratory Inc., Reston, VA, USA), and lightness, hue angle, and chroma had values of 27.3 (±2.8), 281.1° (±29.2), and 4.3 (±0.4), respectively. The fruits were ground in Nutribullet® (Pro+ 1200, Mexico City, Mexico) until a puree was obtained, which was then filtered through two organza-type cloth sheets to obtain a juice.
2.2. Aqueous Two-Phase Systems
The methodology described by Jiménez-Velázquez et al. [35] was used to identify conditions that allowed the formation of aqueous biphasic systems (ABS) with the mixture of trisodium citrate (Na3C3H5O(COO)3; Na3Cit; Merk KGaA, Germany) and polyethylene glycol (HO-(CH2CH2O)n-CH2OH) with a molecular weight of 4 kDa (PEG 4000; Sigma-Aldrich Química, S. de R.L. de C.V., Toluca, Mexico). Samples of 5 g of a 40% PEG 4000 solution were placed in 70 mL Pyrex® tubes (Merk KGaA, Germany), and a solution with 40% Na3Cit was added dropwise until a persistent cloudy state appeared. Deionized water was then added until the mixture became transparent; the addition of Na3Cit was repeated until turbidity, then the addition of distilled water until transparency was also repeated, and so on. In each state of turbidity or transparency, the weight of the mixture was recorded using an analytical balance (Ohaus, Parsippany, NJ, USA; ±0.0001 g), and the binodal concentrations of Na3Cit () and PEG 4000 () for each condition were determined through mass balances. The procedure was performed in triplicate, and data of each repetition were fitted to Equation (1), which represented a binodal curve [40], where parameters (%), (%−0.5), and (%−3) are regression constants.
The procedure described by Hernández-Rodríguez et al. [41] was applied to construct a tie line. The experimental lowest () and highest () average binodal concentrations of Na3Cit were identified, and the corresponding highest () and lowest () of PEG 4000 were determined with Equation (1). Thereafter, conditions A (, ; % w/w) and B (, ; % w/w) were used to construct a tie line, where five equidistant conditions were chosen and named as C, D, E, F, and G, for which the concentrations of Na3Cit (, % w/w) and PEG 4000 (, % w/w) were identified and the corresponding mixtures were prepared using deionized water as a solvent. The systems were left to rest for 24 h, after which two phases were formed, one top () and one bottom (), which, based on the lever rule [42], had the composition of states A and B, respectively. The phases were separated, their volume ( and , respectively) was measured with a graduated cylinder, and, for each state, the volume ratio (, dimensionless) was evaluated with Equation (2).
The state that allowed equal volumes of phases () was identified. To do this, data of the volume of the top phases () and the concentration of PEG 4000 () of the states C, D, E, F, and G were submitted to linear regression to fit them to Equation (3). Likewise, data of the volume of the bottom phases () and the concentration of Na3Cit () of the same states were fitted by linear regression to Equation (4).
Equations (3) and (4) were equalized and generated Equation (5). Also, the concentration data of and were related by linear regression, and Equation (6) was obtained. Equations (5) and (6) were solved simultaneously, and thus the condition of equal volumes () on the tie line was identified, which was denoted as Z (, ).
2.3. Separation of Bioactive Compounds
Twelve mixtures of 20 g were prepared with Na3Cit and PEG 4000 at Z-state concentrations using blueberry juice as a solvent. The mixtures were vortexed in Vortemp 56 (Thermo Fisher Scientific, Waltham, MA, USA) for 10 min at 10,000 rpm. Four groups of three mixtures were formed. One of the groups was immediately centrifuged in a Frontier™ 5718R equipment (Ohaus, USA) at 2940× g to form the treatment S0C. Two groups were allowed to settle for passive sedimentation for 15 and 30 min, respectively, and then centrifuged (Frontier™ 5718R, Ohaus, USA) at 2940× g for 15 min to form treatments S15C and S30C. The remaining group was left to passively settle for 24 h, without centrifugation, to form the S24H treatment. All routines were performed at 23 °C and without exposure to light. The phases formed from each mixture were separated into glass vials, and their pH was adjusted to 3.0 using acetic acid. Then, the separated phases were stored at −10 °C in the dark and subjected to evaluation of antioxidant activity and total contents of soluble phenols, anthocyanins, and sugars, with the methodologies described in the following sections.
2.4. Total Soluble Phenols Content
The Folin–Ciocalteu (F-C) reagent method [43] was applied to determine total soluble phenols (TSP) content but adapted to the microplates of a SynergyTM 2 Multi-Mode Microplate Reader spectrophotometer (HTX, BioTek Instruments, Inc., Winooski, VT, USA). In a well of a microplate were placed 25 μL of sample, 125 μL of distilled water, 30 μL of 20% Na2CO3, and 20 μL of F-C reagent diluted in a 1:1 ratio with respect to the 2-N commercial presentation (Sigma-Aldrich Química, S. de R.L. de C.V., Mexico). The mixture was allowed to react for 30 min in the dark and then subjected to absorbance reading at 760 nm in the SynergyTM spectrophotometer. The quantification was based on a gallic acid (Sigma-Aldrich Química, S. de R.L. de C.V., Mexico) standard curve, and results were expressed as milligrams equivalent of gallic acid per milliliter of sample (mg/mL).
2.5. Total Anthocyanin Content
The pH differential method [39] was used to determine the total anthocyanin content. Two buffer solutions were prepared, one containing potassium chloride (KCl; Merk KGaA, Germany) at pH 1 and the other sodium acetate (Merk KGaA, Germany) at pH 4.5. In 1 mL of each buffer, 25 μL of sample was added. Mixing in a vortex was applied at 100 rpm for 15 min and centrifugation thereafter for 15 min at 2500 rpm. From the mixture of each buffer, aliquots of 100 μL were taken and placed in wells of a microplate for the absorbance to be measured at 518 () and 700 nM () with the SynergyTM spectrophotometer. The concentration of anthocyanins () was determined with Equation (7), where is the absorbance obtained by Equation (8), is a dilution factor, the constant is a conversion factor from grams to milligrams, and the constant 0.38 corresponds to the path length (cm). Meanwhile, (449.2 g/mol) and (26,900 L/mol cm) are the molecular weight and molar extinction coefficients, respectively, of cyanidin 3-glucoside. The results were expressed as milligram equivalents of cyanidin 3-glucoside per milliliter of sample (mg/mL).
2.6. Total Sugar Content
The method described by Nowotny [44] was applied to determine total sugar content. In a glass tube, 300 μL of sample was mixed with 300 μL of 5% phenol (Merk KGaA, Germany) and 1.5 mL of concentrated sulfuric acid (Merk KGaA, Germany). The mixture was left to stand for 20 min to allow the reaction between the components, and then 200 μL were transferred to a well of a microplate to measure absorbance at 490 nm in the Synergy™ spectrophotometer. The quantification was aided by a glucose (Sigma-Aldrich Química, S. de R.L. de C.V., Mexico) standard curve, and the results were expressed in milligrams of glucose equivalent per milliliter of sample (mg/mL).
2.7. Antioxidant Activity
The ferric reducing antioxidant power (FRAP) method [45] was used to assess the antioxidant activity. The FRAP reagent was prepared with a buffer of sodium acetate trihydrate (300 mM, pH 3.6) (Sigma-Aldrich Química, S. de R.L. de C.V., Mexico) mixed with a solution of 10 mM TPTZ (2,4,6-tris(2-pyridyl)-s-triazine) (Sigma-Aldrich Química, S. de R.L. de C.V., Mexico) dissolved in 40 mM HCl (Merk KGaA, Germany) and 20 mM FeCl3 6H2O (Merk KGaA, Germany), in a 10:1:1 ratio. Aliquots of 20 µL reacted with 180 µL of FRAP reagent and 60 µL of distilled water. Thereafter, absorbance at 595 nm was measured in the SynergyTM spectrophotometer. A Trolox® (Sigma-Aldrich Química, S. de R.L. de C.V., Mexico) standard curve was prepared, in the range of 3.8 to 46 µM, which aided the determination of the antioxidant activity in equivalent micromoles of Trolox® per milliliter of sample (mmol/mL).
2.8. Pigmenting Potential
The top phase of the aqueous biphasic system (ABS) corresponding to state Z handled under the S30C treatment conditions was used as a pigmenting agent (PA) of a colorless sports hydrating drink (Gatorade®, Quaker Oats Company, PepsiCo, Mexico City, Mexico), which was characterized in terms of pH using a potentiometer (Conductronic model pH120, Conductronic, Puebla de Zaragoza, Mexico). The PA was handled in two ways. The first corresponded to the fluid form obtained from the top phase of the ABS and constituted a treatment called FPA. The second was obtained by lyophilization of the fluid form in a Labconco equipment (Model 7755040, Labconco Corp., KCK, Kansas City, MO, USA) and constituted a treatment called LPA.
Batches of 10 g of hydrating drink were prepared, and 0.1 g samples of FPA were gradually added until 1 g of PA was completed. In another set of 10-g batches, the procedure was repeated but gradually adding 0.1 g samples of LPA, also completing 1 g. After each addition, the concentration of the pigmenting agent (, g/mL) and the hue angle (, degrees) of the system were determined with a Hunter Lab colorimeter (MiniScan XE® Plus, Hunter Associates Laboratory Inc., Reston, VA, USA). Data of and were fitted to models in the form of Equation (9) with the aid of the SigmaPlot® 2000 software [46], where (degrees), (degrees), and (%−1) were regression constants.
The addition of the pigmenting agent caused a reduction in the hue angle. Based on Equation (10) [47], the minimum value of the hue angle (, degrees) that could be reached after an infinite addition of PA was determined. With reference to this amount, the necessary concentration of PA to cause 7/8 or 87.5% pigmentation (, g/mL) was determined by means of the Equation (11).
One hundred and ninety-two new batches of 10 g of hydrating drink were prepared and organized into four groups of 48 units. Two of the groups were pigmented with FPA in the amount determined for . The other two groups were incorporated with LPA in equivalent amounts to produce the maximum pigmentation condition that could be achieved with FPA. Half of the units pigmented with FPA and half pigmented with LPA were placed under conservative conditions, consisting of handling at 4.5 °C and darkness. The remaining units were placed under degradative conditions, consisting of handling at 23 °C and exposure to light. Every 24 h and along 15 d, three units were removed from each group to be evaluated in terms of hue angle () with a Hunter Lab colorimeter (MiniScan XE® Plus, Hunter Associates Laboratory Inc., Reston, VA, USA) and total anthocyanin content with the differential pH method [39] described above.
2.9. Data Analysis
The separation stage of bioactive compounds with aqueous two-phase extraction had the separated phases (top and bottom) and the separation conditions (S0C, S15C, S30C, and S24H) as variation factors. The pigmenting stage had the pigmenting agent (FPA and LPA) as the only variation factor. In both stages, data were subjected to analysis of variance and treatment means comparison routines with the Tukey test applied with a significance level of 0.05.
3. Results and Discussion
3.1. Formation of Aqueous Biphasic Systems
The application of the cloud point method allowed obtaining binodal data that separated monophasic conditions from biphasic conditions for the mixture of Na3Cit and PEG 4000 (Figure 1). Data fitted well ( = 0.9942 ± 0.0015) to Equation (1), with values of 71.4748 (± 4.9729), −0.4187 (± 0.0296), and 3.674 × 10⁻⁴ (±1.547 × 10⁻⁵) in the parameters (%), (%−0.5), and (%−3), respectively. Based on experimental data and Equation (1), the binodal state with the lowest concentration of Na3Cit and the highest concentration of PEG 4000 was obtained at condition A (2.45, 38.33%), while the state with the highest concentration of Na3Cit and the lowest concentration of PEG 4000 was obtained at condition B (35.85, 1.19%). With this information, an A-B line was drawn and the equidistant states C (30.28, 7.38%), D (24.72, 13.57%), E (19.15, 19.76%), F (13.55, 25.95%), and G (8.01, 32.14%) were located, for which aqueous two-phase extraction systems (ATPE) were prepared. After phase separation, the volume ratio (; Equation (2)) varied between 0.202 and 3.639, with the highest values under conditions of lower Na3Cit concentration and higher PEG 4000 (Figure 1), which was consistent with the report of Jiménez-Velázquez et al. [35].
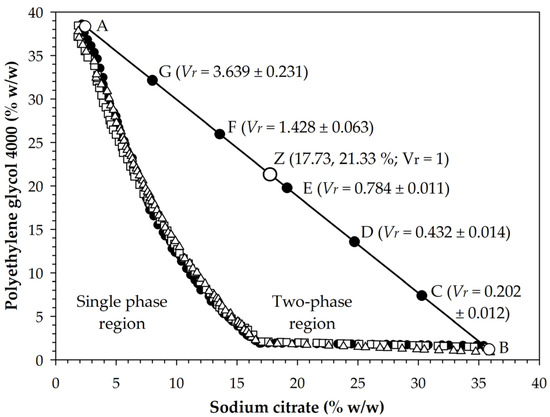
Figure 1.
Binodal data of the mixture of trisodium citrate and polyethylene glycol 4000 and identification of the prepared aqueous biphasic systems (A to G and Z). is volume ratio (Equation (2)). Values after the ± sign indicate standard deviation. Different symbols on the binodal curve correspond to different experimental routines.
The relationships between the volume of top phases () and the PEG 4000 concentration () and the volume of bottom phases () and the Na3Cit concentration () fitted well to Equations (3) and (4), with determination coefficients () of 0.989 and 0.984, respectively, and with values of 0.8374, 0.4394, 0.8655, and 0.4326 in the constants , , , and , respectively. Likewise, data of and fitted to Equation (6), which corresponds to line A-B, with values of and equal to 41.033 and −1.111, respectively. Thus, the simultaneous solution of Equations (5) and (6) allowed finding the state corresponding to equal volumes ( = 1) at condition Z (17.731, 21.332%). In this regard, the formation of phases in aqueous two-phase systems was caused by a salting-out effect, which was also the cause of the variation of that occurred with the change in the concentrations of the salt and the polymer [34].
3.2. Aqueous Two-Phase Extraction Assisted with Centrifugation
Separation systems were prepared with the composition of the Z state but using blueberry juice as a solvent. The use of centrifugation without prior gravitational sedimentation (S0C) did not allow the formation of two-phase systems, so the handling with the conditions of this treatment was cancelled. In contrast, the S15C, S30C, and S24H treatments did develop two phases, which indicated that the use of centrifugation favored the formation of two-phase systems but required that the start of separation be allowed with a minimum time of passive gravitational sedimentation, which was in agreement with the report of García-Cruz et al. [32]. In addition, the results showed that the minimum passive sedimentation time required to achieve the formation of two-phase systems was in the range of 0 to 15 min. On the other hand, the volume ratio () was 1.14 and 0.9 with treatments S15C and S30C, respectively, which indicated that the preparation with 17.63% Na3Cit and 21.33% PEG 4000 allowed the development of biphasic systems with approximately equal volumes, as expected with the simultaneous solution of Equations (5) and (6). However, the value of increased up to 3.67 with S24H, which suggested that with long passive sedimentation times the salting-out potential [34] was modified due to the presence of a greater number of components, such as sugars, which develop ionic interactions with water, in addition to the salt and the polymer.
3.3. Separation of Bioactive Compounds
The ATPE systems produced top phases with pH between 6.57 and 6.84 and bottom phases with pH between 6.17 and 6.26 (Table 1). A first objective of the work was to obtain an extract with pigmenting capacity based on the presence of anthocyanins from the blueberry fruit [7]. Anthocyanins are stable at pH between 3.0 and 5.0, and at the lower limit they exhibit the highest color intensity [39], so the pH of the obtained phases was adjusted to 3.0 with acetic acid.

Table 1.
Concentration of bioactive compounds and pH of top and bottom phases obtained from the aqueous two-phase systems.
The concentration of anthocyanins varied between 0.182 and 0.202 mg/mL in top phases obtained with S15C and S30C, with no significant difference (p ≤ 0.05) between them (Table 1). However, the concentration was significantly lower (p ≤ 0.05) with the S24H treatment, where the value was 0.150 mg/mL, which was due to a dilution effect derived from the increase in the volume of the top phase compared to the other two treatments. On the other hand, the anthocyanin content was null in lower phases, which indicated that these compounds were affected by the salting-out effect [34] caused by the ionic interactions of salt with water and migrated to the polymeric phase of the system with the formation of the biphasic system.
Anthocyanins belong to the group of flavonoids, and these belong to the group of phenolic compounds [48]. In this regard, the concentration of total soluble phenols (TSP) was also significantly higher (p ≤ 0.05) in the top phase compared to the bottom phase, where the content was practically zero (Table 1). The presence of these compounds gives the blueberry fruit antioxidant potential [7,49]. As a result, the antioxidant activity was significantly higher (p ≤ 0.05) in the top phase than in the bottom phase (Table 1). The top phases of treatments S15C and S30C presented TSP contents of 0.345 and 0.353 mg/mL, respectively, with no difference (p > 0.05) between them, but significantly higher than that found with a value of 0.293 mg/mL in treatment S24H. In addition, the antioxidant activity was higher in the top phases of S30C and S24H, with 910.95 and 896.57 mmol/mL, and lower in S15C, with a value of 848.03 mmol/mL.
A second objective of the work was to obtain an extract rich in anthocyanins but low in sugars. Due to the null anthocyanin content of the bottom phase and the higher content of the top phase, it was considered that the latter can be used in pigmenting assays. In this regard, the top phase had a significantly lower sugar content than the lower phase (p ≤ 0.05; Table 1), which has been reported as a distinctive characteristic of ATPE systems in the sense that these allow the separation of bioactive compounds taking into account the reduction of sugars [29]. In addition, the lowest concentration of sugars was found in the top phases of the S15C and S30C treatments, with values of 6.38 and 5.53 mg/mL, respectively.
3.4. Evaluation of Potential Pigmenting
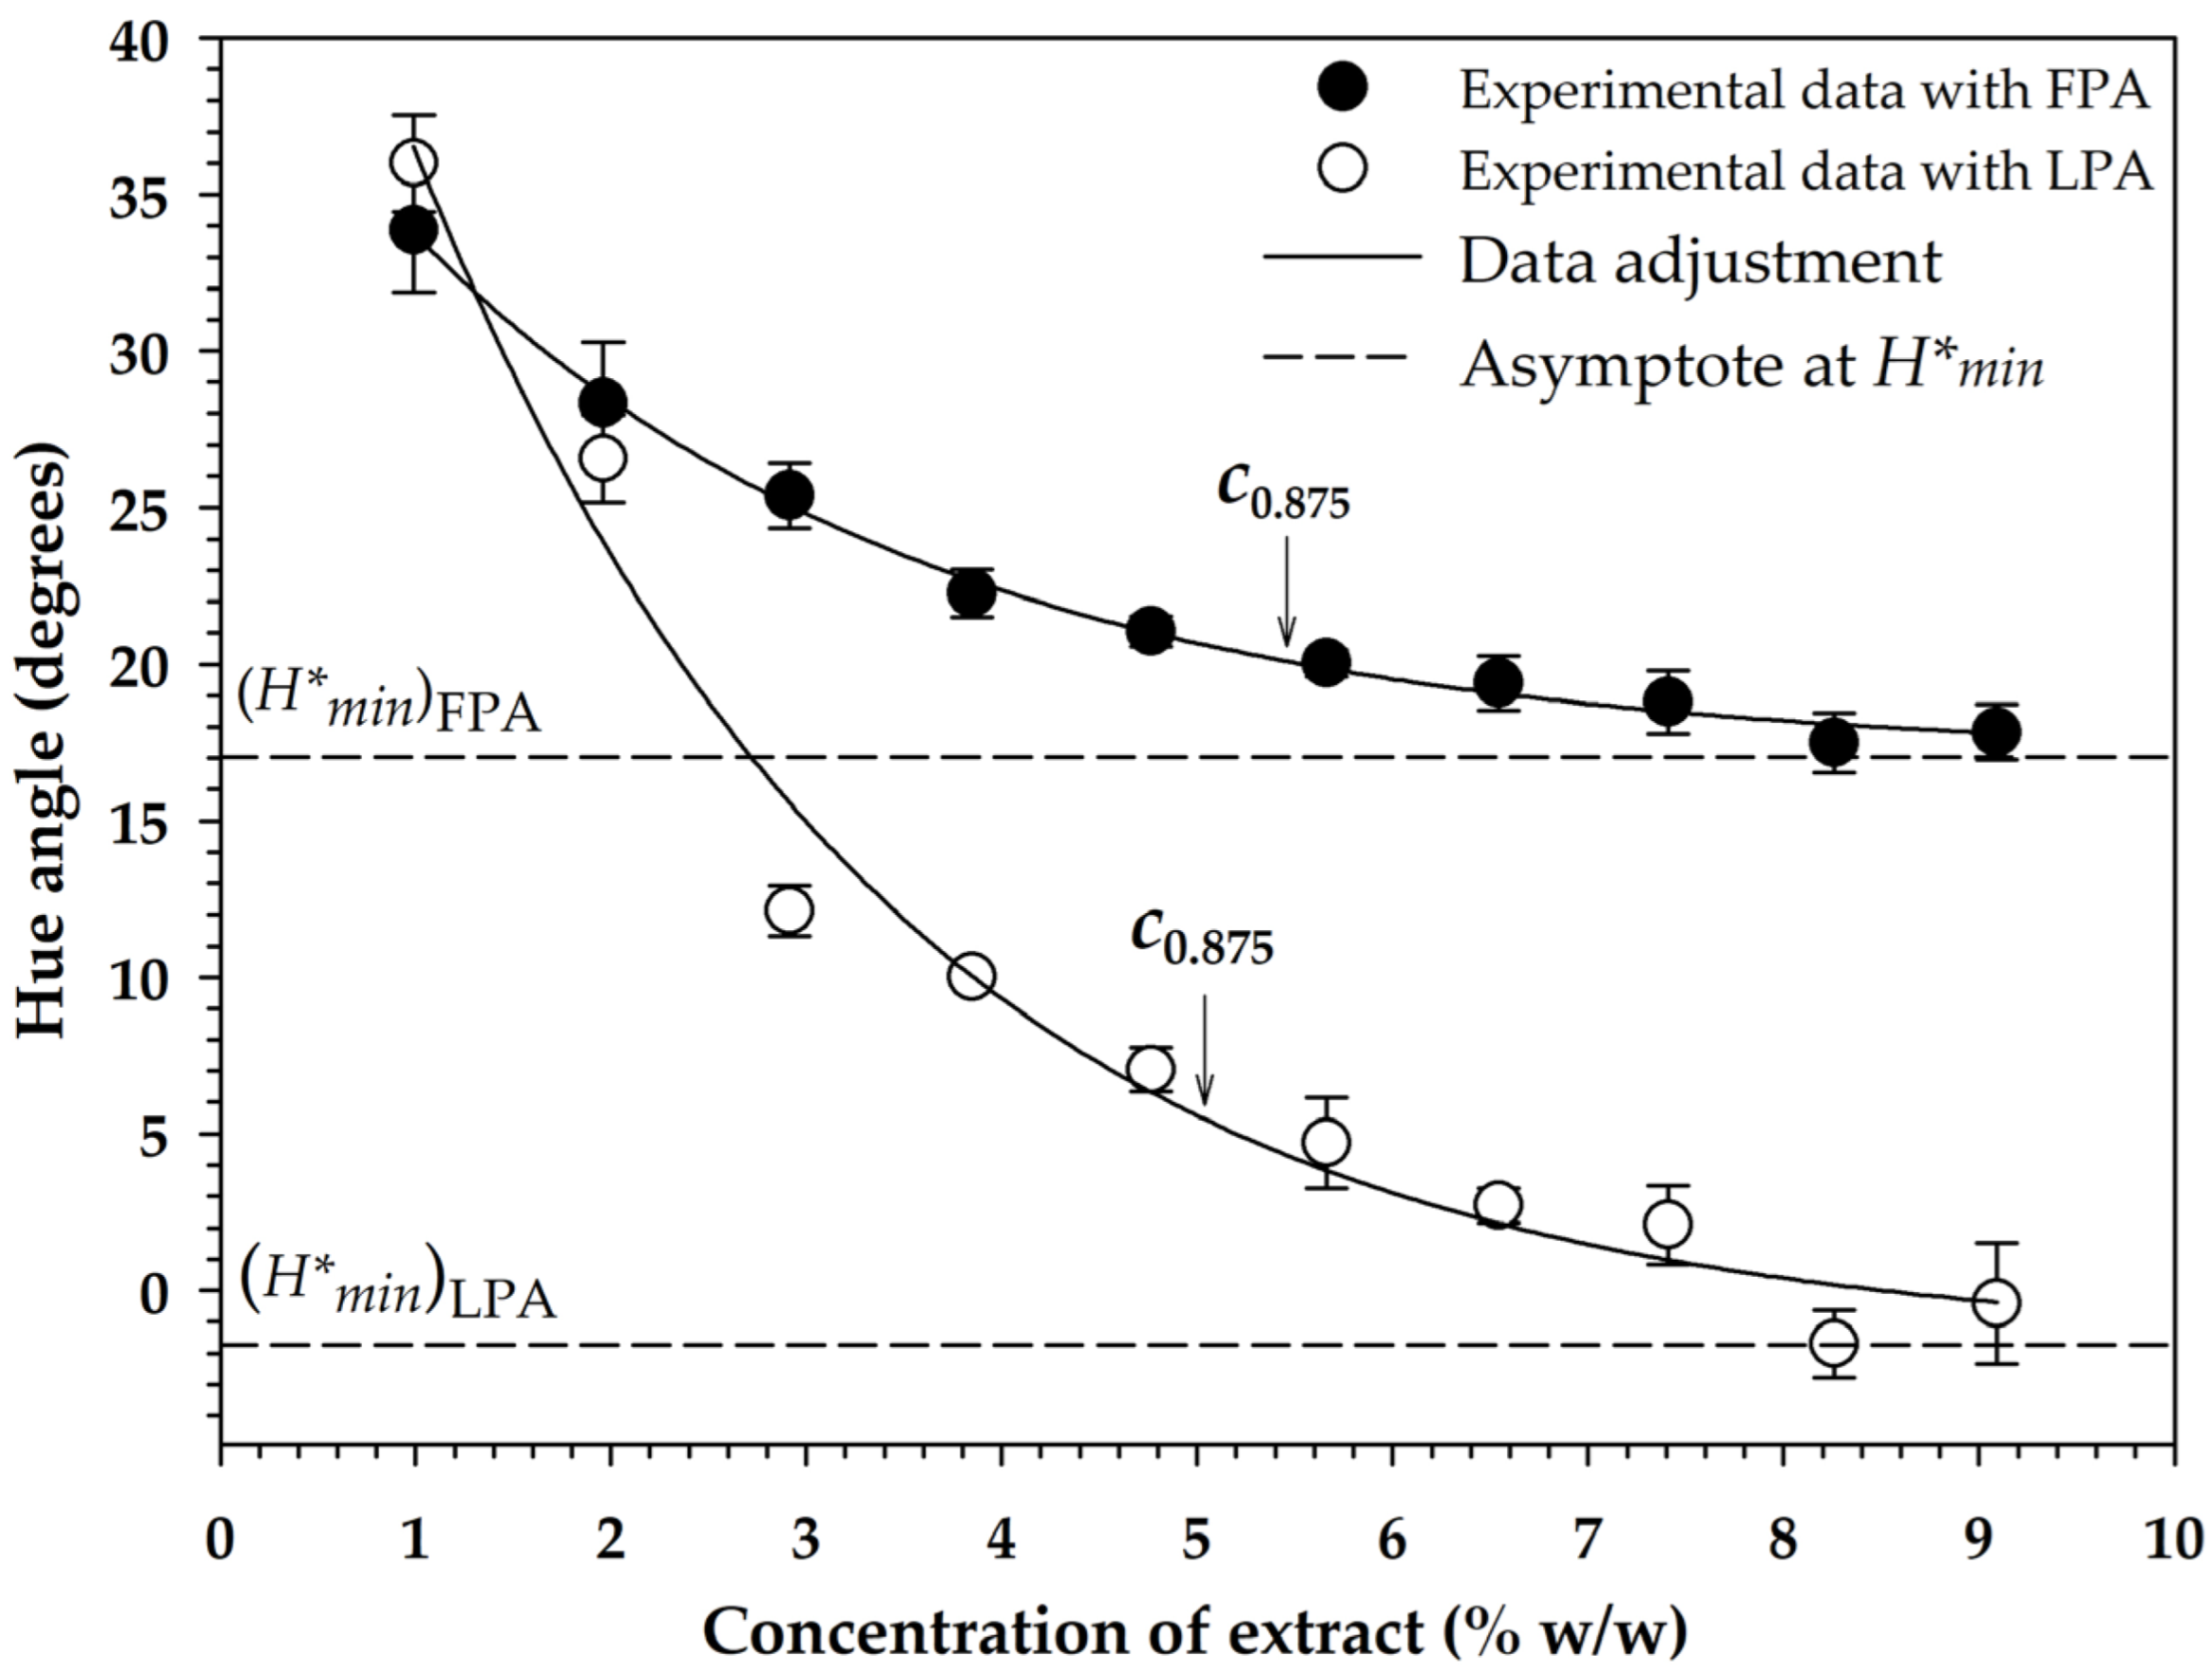
The top phase of the S30C treatment was chosen as a suitable extract to be used in pigmenting routines of a sports drink (Gatorade®; Quaker Oats Company, PepsiCo, Mexico) because it had a higher anthocyanin content, greater antioxidant activity, and lower sugar content. The gradual addition of the extract in fluid form (FPA) and in lyophilized form (LPA) caused a logarithmic reduction of the hue angle of the drink (Figure 2), so that in both cases data fitted well to Equation (9), with values of 41.4254°, −24.3873°, and 0.3807%−1 in regression constants , , and for the pigmentation with FPA ( = 0.900), and 55.8369°, −57.5678°, and 0.4127%−1 for that performed with LPA, respectively ( = 0.961). Thus, based on Equation (10), the graphing of the asymptote line to each pigmentation function under a condition of infinite addition of pigmenting agent indicated that the minimum value of the hue angle () that could be reached was 17.038° with FPA and −1.731° (358.269°) with LPA, which was an expected result, since the addition of FPA was performed in liquid form, which caused dilution of the pigmented medium, not so in the case of LPA, which was added in lyophilized form and did not cause dilution, allowing the hue angle to be very close to absolute red [50].
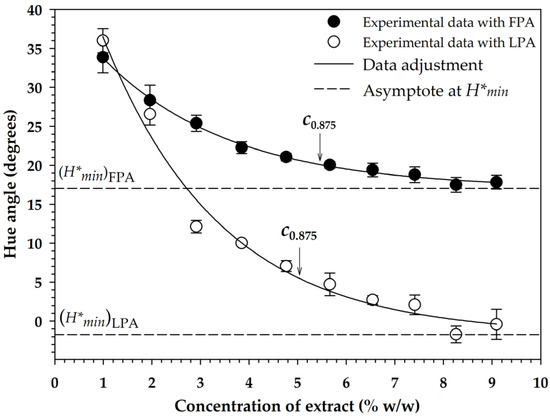
Figure 2.
Variation of the hue angle of a beverage with the addition of pigmenting agents applied in fluid form (FPA) and in lyophilized form (LPA). The symbol is the minimum hue angle that can be achieved with an infinite addition of pigmenting agents. The abbreviation is the required concentration to have 87.5% pigmentation with respect to .
Based on Equation (11), it was determined that 5.462% of FPA and 5.039% of LPA concentrations should be used to achieve 87.5% of pigmentation with respect to the limit value (), which allowed obtaining a hue angle of 20.1 and 5.5°, respectively. On the other hand, it was determined that with the use of LPA at a concentration of 2.8%, it was feasible to obtain the limit value of that can be obtained with FPA (Figure 2). For this reason, the pigmentation stability tests were carried out with FPA and LPA at concentrations of 5.5 and 2.8%, respectively.
3.5. Pigmentation Stability
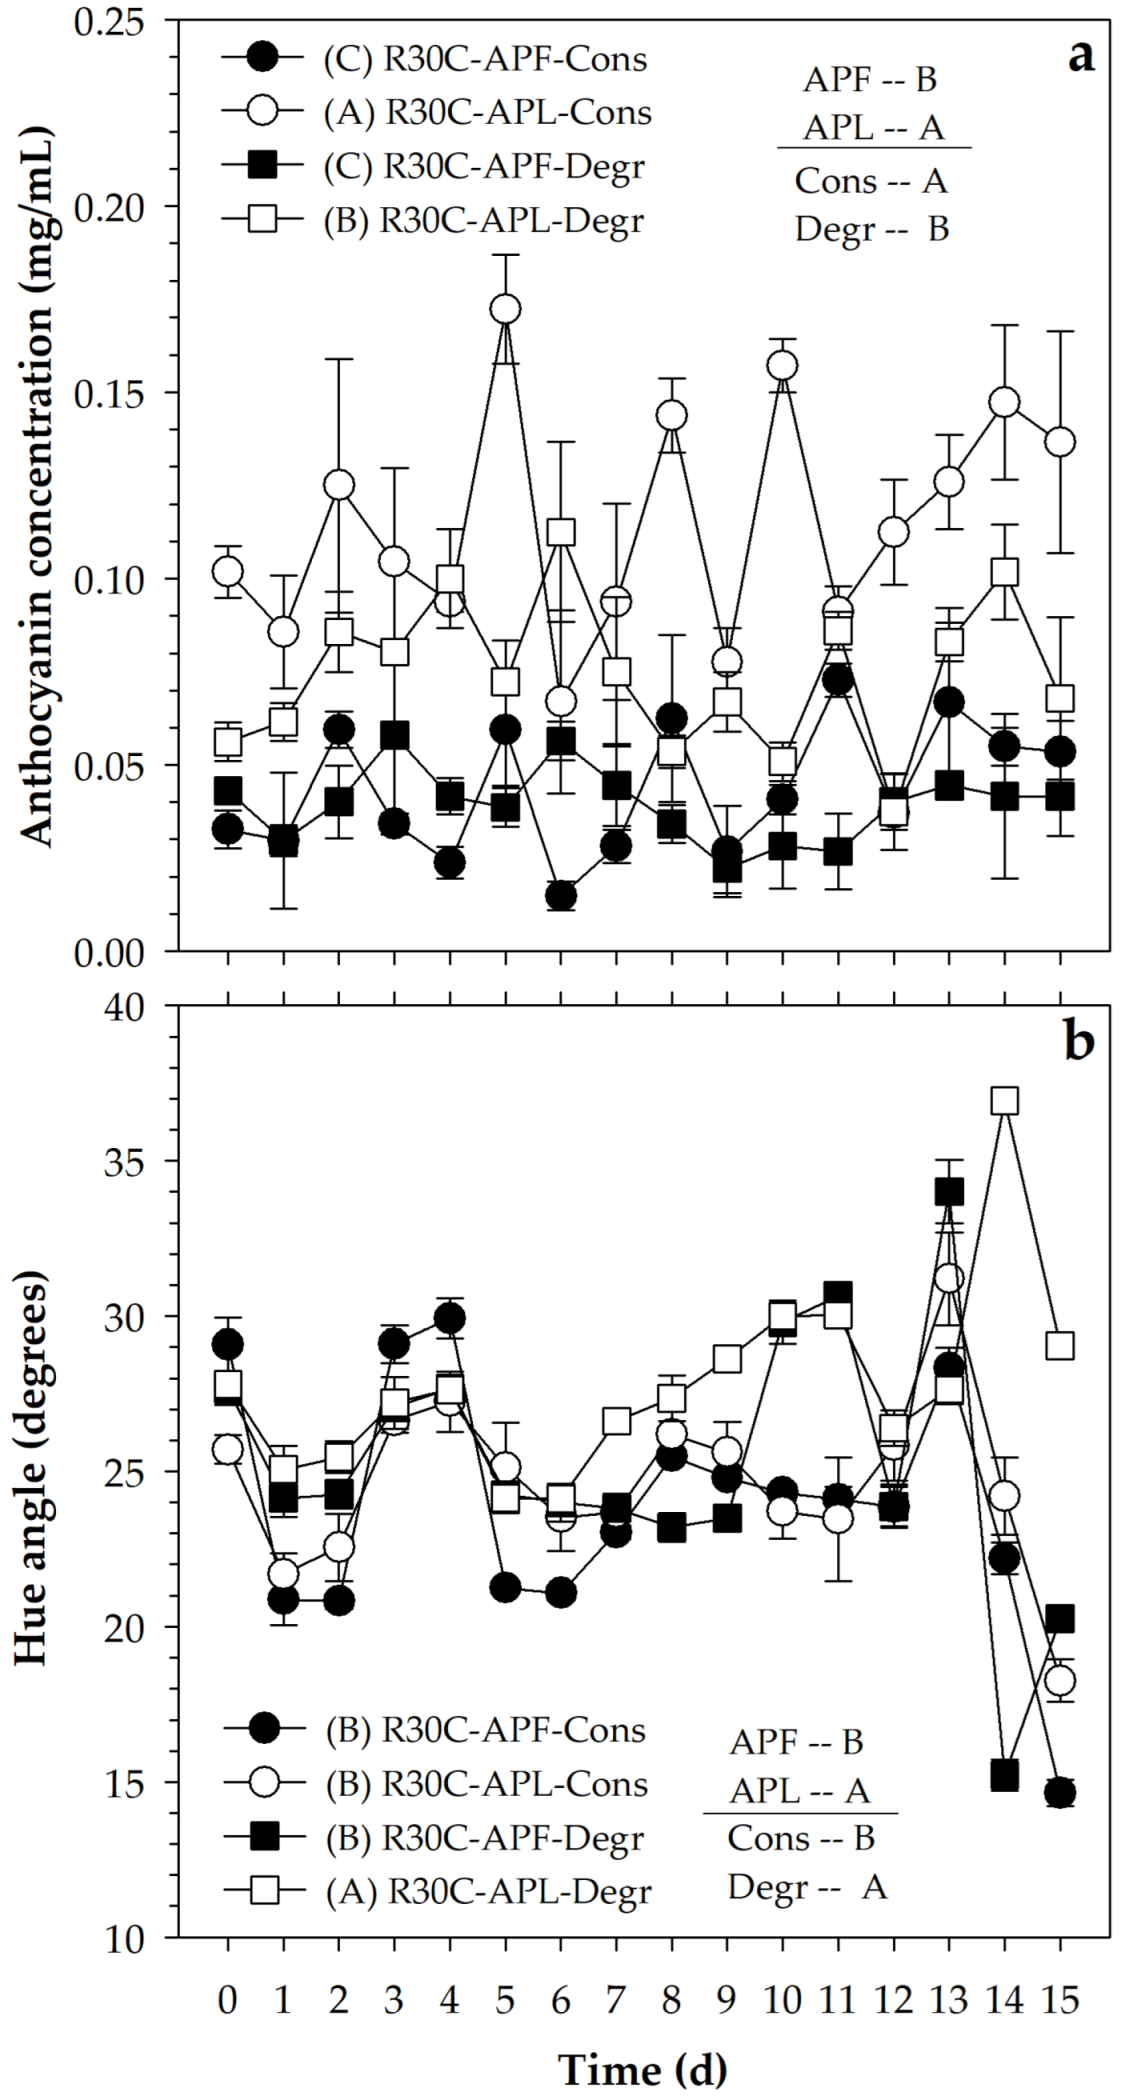
The addition of FPA caused a total anthocyanin content of 0.041 (±0.023) mg/mL, while the value was 0.095 (±0.043) with LPA, with a significant difference (p ≤ 0.05) between both (Figure 3a). This means that, although the addition of the pigmenting agents was performed to produce approximately the same hue angle, the use of the lyophilized material favored the presence of a higher content of compounds than that obtained when the PA was used in liquid form. However, the hue angle had values of 24.6° (±11.3°) and 26.2° (±11.7°) with FPA and LPA, respectively (Figure 3b), which was consistent with the hue angle estimated for an addition of FPA to produce 87.5% pigmentation with respect to the feasible limit value . On the other hand, although the difference between the hue angle caused by both pigmenting agents was significant (p ≤ 0.05), the contrast was small and had no practical significance.
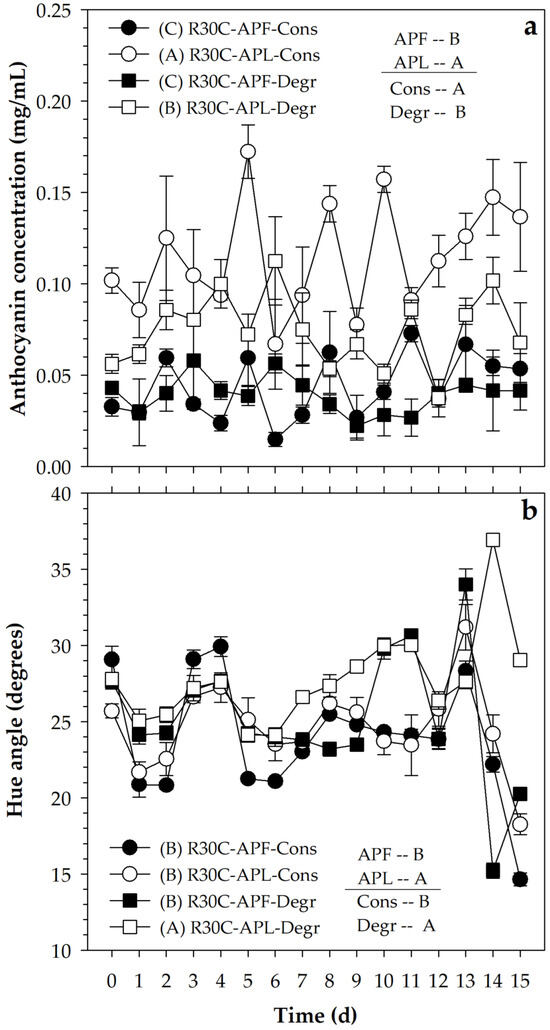
Figure 3.
(a) Variation of anthocyanin content and (b) hue angle in a beverage pigmented with FPA and LPA obtained with ATPE with 30 min rest and subsequent centrifugation (S30C) under conservative (Cons) and degradative (Degr) conditions. Equal letters (A or B) indicate a non-significant difference (Tukey, 0.05).
The pigmented media were exposed to conservative and degradative conditions, where the anthocyanin contents remained at 0.079 (±0.051) and 0.056 (±0.031) mg/mL, respectively. Although the difference was small, the statistical analysis reported that such contrast was significant (p ≤ 0.05), which indicated that the exposure to the degradative conditions caused a reduction in the content of these compounds. In addition, the hue angle was lower in the conservative conditions (24.3° ± 10.3°) than in the degradative condition (26.5° ± 11.9°) (Figure 2), which confirmed the tendency of the degradative condition to affect the stability. However, the differences were small, and this suggests adequate stability of the pigment, since the affectation was only 9.0% in relation to the conservative condition.
On the other hand, the variability throughout the storage of the pigmented systems was high, which was caused by using a handling without replacement of the experimental units during the monitoring of the anthocyanin content and the hue angle. However, even with this variability, the system pigmented with LPA and maintained in conservative conditions presented the highest content (p ≤ 0.05) of anthocyanins (0.116 ± 0.045 mg/mL), followed by the one pigmented with LPA but maintained in degradative conditions (0.074 ± 0.032 mg/mL) and finally by the two treatments pigmented with FPA and maintained in conservative (0.043 ± 0.026 mg/mL) and degradative (0.039 ± 0.021 mg/mL) conditions, with no difference between them (p > 0.05) (Figure 3a).
In the case of the hue angle (Figure 3b), the treatments pigmented with FPA in conservative (24.7° ± 11.0°) and degradative (25.2° ± 11.6°) conditions, as well as the one pigmented with LPA and handled in conservative condition (24.7° ± 11.0°), maintained similar hue angle values (p > 0.05), and only the treatment based on LPA maintained in degradative condition reduced its pigmenting potential (27.8° ± 12.4°). On this basis, the use of a pigmenting agent based on an anthocyanin-rich pigmenting agent obtained from blueberry fruits through aqueous biphasic systems was considered a viable alternative for its incorporation in liquid systems and to provide an appearance close to red, with hue angles between 24 and 28°.
4. Conclusions
The aqueous two-phase extraction technique developed using a mixture of polyethylene glycol 4000 and trisodium citrate demonstrated potential for separating anthocyanins and phenolic compounds from blueberry fruit, which migrated to the top phase, while sugars migrated primarily to the bottom phase of systems. Thus, it was feasible to obtain an extract rich in anthocyanins and phenolic compounds with a reduced sugar content. The volumes of the phases formed were modified as a function of the concentration of the components, allowing the selection of a system with equal phase volumes to favor a separation based on a salting-out mechanism. The use of centrifugation reduced the time required to separate the compounds of interest, but a minimum separation time is required. A process with passive sedimentation of 30 min using aqueous two-phase extraction followed by centrifugation yielded extracts with high anthocyanin content, low sugar content, and high antioxidant activity. The potential of blueberry anthocyanins in the stable pigmentation of colorless beverages was demonstrated, but color variation exhibited a logarithmic behavior toward a red hue depending on the amount of extract added; therefore, the optimal amount of extract must be determined to prevent overuse.
Author Contributions
Conceptualization, S.V.-G. and M.C.-G.; methodology, S.V.-G., R.D.-P., M.C.-G. and D.G.-R.; software, R.D.-P.; validation, S.V.-G. and M.C.-G.; formal analysis, M.C.-G. and O.S.-C.; investigation, S.V.-G., M.C.-G. and O.S.-C.; data curation, M.C.-G. and D.G.-R.; writing—original draft preparation, S.V.-G. and M.C.-G.; writing—review and editing, S.V.-G. and M.C.-G.; supervision, project administration, and funding acquisition, S.V.-G. All authors have read and agreed to the published version of the manuscript.
Funding
This research was funded by Universidad Autónoma Chapingo, Mexico, grant 24039-EI.
Data Availability Statement
The original contributions presented in this study are included in the article. Further inquiries can be directed to the corresponding author.
Acknowledgments
The authors thank the Secretaría de Ciencia, Humanidades, Tecnología e Innovación (Secihti), Mexico, for the support received from the National Scholarship Program.
Conflicts of Interest
The authors declare no conflicts of interest.
Abbreviations
The following abbreviations are used in this manuscript:
| ABS | Aqueous biphasic systems |
| ATPE | Aqueous two-phase extraction |
| FPA | Pigmenting agent in fluid form |
| FRAP | Ferric reducing antioxidant power |
| LPA | Pigmenting agent in lyophilized form |
| Na3Cit | Trisodium citrate (Na3C3H5O(COO)3 |
| PA | Pigmenting agent |
| PEG 4000 | Polyethylene glycol (HO-(CH2CH2O)n-CH2OH) |
References
- Klavins, L.; Puzule, E.P.; Kviesis, J.; Klavins, M. Optimisation of Blueberry (Vaccinium corymbosum L.) Press Residue Extraction Using a Combination of Pectolytic Enzyme and Ultrasound Treatments. J. Berry Res. 2022, 12, 41–57. [Google Scholar] [CrossRef]
- Kraśniewska, K.; Ścibisz, I.; Gniewosz, M.; Mitek, M.; Pobiega, K.; Cendrowski, A. Effect of Pullulan Coating on Postharvest Quality and Shelf-Life of Highbush Blueberry (Vaccinium corymbosum L.). Materials 2017, 10, 965. [Google Scholar] [CrossRef] [PubMed]
- Varo, M.Á.; Martín-Gómez, J.; Mérida, J.; Serratosa, M.P. Bioactive Compounds and Antioxidant Activity of Highbush Blueberry (Vaccinium corymbosum) Grown in Southern Spain. Eur. Food Res. Technol. 2021, 247, 1199–1208. [Google Scholar] [CrossRef]
- Seeram, N.P. Berry Fruits: Compositional Elements, Biochemical Activities, and the Impact of Their Intake on Human Health, Performance, and Disease. J. Agric. Food Chem. 2008, 56, 627–629. [Google Scholar] [CrossRef] [PubMed]
- Varo, M.A.; Serratosa, M.P.; Martín-Gómez, J.; Moyano, L.; Mérida, J. Influence of Fermentation Time on the Phenolic Compounds, Vitamin C, Color and Antioxidant Activity in the Winemaking Process of Blueberry (Vaccinium corymbosum) Wine Obtained by Maceration. Molecules 2022, 27, 7744. [Google Scholar] [CrossRef] [PubMed]
- Yang, G.; Yue, J.; Gong, X.; Qian, B.; Wang, H.; Deng, Y.; Zhao, Y. Blueberry Leaf Extracts Incorporated Chitosan Coatings for Preserving Postharvest Quality of Fresh Blueberries. Postharvest Biol. Technol. 2014, 92, 46–53. [Google Scholar] [CrossRef]
- Cvetković, M.; Kočić, M.; Dabić Zagorac, D.; Ćirić, I.; Natić, M.; Hajder, Đ.; Životić, A.; Fotirić Akšić, M. When Is the Right Moment to Pick Blueberries? Variation in Agronomic and Chemical Properties of Blueberry (Vaccinium corymbosum) Cultivars at Different Harvest Times. Metabolites 2022, 12, 798. [Google Scholar] [CrossRef]
- Zorzi, M.; Gai, F.; Medana, C.; Aigotti, R.; Morello, S.; Peiretti, P.G. Bioactive Compounds and Antioxidant Capacity of Small Berries. Foods 2020, 9, 623. [Google Scholar] [CrossRef]
- Yang, J.; Li, B.; Shi, W.; Gong, Z.; Chen, L.; Hou, Z. Transcriptional Activation of Anthocyanin Biosynthesis in Developing Fruit of Blueberries (Vaccinium corymbosum L.) by Preharvest and Postharvest UV Irradiation. J. Agric. Food Chem. 2018, 66, 10931–10942. [Google Scholar] [CrossRef]
- Ghosh, S.; Sarkar, T.; Das, A.; Chakraborty, R. Natural Colorants from Plant Pigments and Their Encapsulation: An Emerging Window for the Food Industry. LWT 2022, 153, 112527. [Google Scholar] [CrossRef]
- Mohammad Azmin, S.N.H.; Sulaiman, N.S.; Mat Nor, M.S.; Abdullah, P.S.; Abdul Kari, Z.; Pati, S. A Review on Recent Advances on Natural Plant Pigments in Foods: Functions, Extraction, Importance and Challenges. Appl. Biochem. Biotechnol. 2022, 194, 4655–4672. [Google Scholar] [CrossRef]
- Vergel-Alfonso, A.A.; Arias-Avelenda, R.; Casariego-Año, A.; Giménez, M.J.; Ruíz-Cruz, S.; López-Corona, B.E.; Del-Toro-Sánchez, C.L.; Gonzalez-Bravo, A.L.; Plascencia-Jatomea, M.; Menchaca-Armenta, M.; et al. Development and Characterization of Pectin and Beeswax-Based Coatings Enhanced with Anthocyanins and Its Antioxidant and Antifungal Properties. Processes 2025, 13, 542. [Google Scholar] [CrossRef]
- Cortés-Avendaño, P.; Macavilca, E.A.; Ponce-Rosas, F.C.; Murillo-Baca, S.M.; Quispe-Neyra, J.; Alvarado-Zambrano, F.; Condezo-Hoyos, L. Microfluidic Paper-Based Analytical Device for Measurement of PH Using as Sensor Red Cabbage Anthocyanins and Gum Arabic. Food Chem. 2025, 462, 140964. [Google Scholar] [CrossRef]
- Etxabide, A.; Kilmartin, P.A.; Maté, J.I. Color Stability and PH-Indicator Ability of Curcumin, Anthocyanin and Betanin Containing Colorants under Different Storage Conditions for Intelligent Packaging Development. Food Control 2021, 121, 107645. [Google Scholar] [CrossRef]
- Li, Y.; Wu, K.; Wang, B.; Li, X. Colorimetric Indicator Based on Purple Tomato Anthocyanins and Chitosan for Application in Intelligent Packaging. Int. J. Biol. Macromol. 2021, 174, 370–376. [Google Scholar] [CrossRef] [PubMed]
- Cheng, Y.; Wang, J.; Zheng, L.; Zhang, J.; Liu, D.; Nie, G. A Novel Signal-on Photoelectrochemical Immunosensor Based on Anthocyanin-Sensitized Poly(Indole-5-Carboxylic Acid) for Ultrasensitive Detection of CEA. Sensors Actuators B Chem. 2025, 422, 136681. [Google Scholar] [CrossRef]
- FDA. FDA to Revoke Authorization for the Use of Red No. 3 in Food and Ingested Drugs; Food and Drug Administration: Silver Spring, MD, USA, 2025. [Google Scholar]
- Wu, H.-Y.; Yang, K.-M.; Chiang, P.-Y. Roselle Anthocyanins: Antioxidant Properties and Stability to Heat and PH. Molecules 2018, 23, 1357. [Google Scholar] [CrossRef]
- Bani, O.; Taslim; Iriany; Sinaga, M.; Violleta, S. Extraction, Concentration, and Storage of Butterfly Pea Anthocyanin for Commercialization. Case Stud. Chem. Environ. Eng. 2024, 10, 100860. [Google Scholar] [CrossRef]
- Caldas, T.W.; Mazza, K.E.L.; Teles, A.S.C.; Mattos, G.N.; Brígida, A.I.S.; Conte-Junior, C.A.; Borguini, R.G.; Godoy, R.L.O.; Cabral, L.M.C.; Tonon, R.V. Phenolic Compounds Recovery from Grape Skin Using Conventional and Non-Conventional Extraction Methods. Ind. Crops Prod. 2018, 111, 86–91. [Google Scholar] [CrossRef]
- Da Porto, C.; Natolino, A. Extraction Kinetic Modelling of Total Polyphenols and Total Anthocyanins from Saffron Floral Bio-Residues: Comparison of Extraction Methods. Food Chem. 2018, 258, 137–143. [Google Scholar] [CrossRef]
- Romero-Díez, R.; Matos, M.; Rodrigues, L.; Bronze, M.R.; Rodríguez-Rojo, S.; Cocero, M.J.; Matias, A.A. Microwave and Ultrasound Pre-Treatments to Enhance Anthocyanins Extraction from Different Wine Lees. Food Chem. 2019, 272, 258–266. [Google Scholar] [CrossRef] [PubMed]
- Pinedo Montoya, S.K. Caracterización Fisicoquímica y Organoléptica de Variedades Comerciales de Arándano y Otras Especies Del Genero Vaccinium. Rev. Científica UNTRM Cienc. Nat. Ing. 2018, 1, 52–58. [Google Scholar] [CrossRef]
- Forney, C.F.; Kalt, W.; Jordan, M.A.; Vinqvist-Tymchuk, M.R.; Fillmore, S.A.E. Blueberry and Cranberry Fruit Composition during Development. J. Berry Res. 2012, 2, 169–177. [Google Scholar] [CrossRef]
- Zhang, J.; Yang, Y.; Lv, R.; Zhan, K.; Chang, X.; Zhang, C. Sugar Reduction Process of Purple Sweet Potato Concentrated Juice by Microbial Fermentation for Improved Performance of Natural Pigments. Biochem. Eng. J. 2023, 191, 108781. [Google Scholar] [CrossRef]
- Martín, J.; Díaz-Montaña, E.J.; Asuero, A.G. Recovery of Anthocyanins Using Membrane Technologies: A Review. Crit. Rev. Anal. Chem. 2018, 48, 143–175. [Google Scholar] [CrossRef] [PubMed]
- Sabanci, S.; Icier, F. Enhancement of the Performance of Sour Cherry Juice Concentration Process in Vacuum Evaporator by Assisting Ohmic Heating Source. Food Bioprod. Process. 2020, 122, 269–279. [Google Scholar] [CrossRef]
- Miyawaki, O.; Inakuma, T. Development of Progressive Freeze Concentration and Its Application: A Review. Food Bioprocess Technol. 2021, 14, 39–51. [Google Scholar] [CrossRef]
- Sandate-Flores, L.; Rodríguez-Rodríguez, J.; Velázquez, G.; Mayolo-Deloisa, K.; Rito-Palomares, M.; Torres, J.A.; Parra-Saldívar, R. Low-Sugar Content Betaxanthins Extracts from Yellow Pitaya (Stenocereus pruinosus). Food Bioprod. Process. 2020, 121, 178–185. [Google Scholar] [CrossRef]
- Rodríguez-Herrera, V.V.; García-Cruz, L.; Valle-Guadarrama, S. Aqueous Two-Phase Extraction: A Non-Thermal Technique to Separate and Concentrate Betalains from Bougainvillea Glabra Choisy Bracts. Ind. Crops Prod. 2023, 193, 116245. [Google Scholar] [CrossRef]
- Rosa, P.A.J.; Ferreira, I.F.; Azevedo, A.M.; Aires-Barros, M.R. Aqueous Two-Phase Systems: A Viable Platform in the Manufacturing of Biopharmaceuticals. J. Chromatogr. A 2010, 1217, 2296–2305. [Google Scholar] [CrossRef]
- García-Cruz, L.; Valle-Guadarrama, S.; Soto-Hernández, R.M.; Guerra-Ramírez, D.; Zuleta-Prada, H.; Martínez-Damián, M.T.; Ramírez-Valencia, Y.D. Separation of Pitaya (Stenocereus pruinosus) Betaxanthins, Betacyanins, and Soluble Phenols Through Multistage Aqueous Two-Phase Systems. Food Bioprocess Technol. 2021, 14, 1791–1804. [Google Scholar] [CrossRef]
- Rodríguez-Salazar, N.; Valle-Guadarrama, S. Separation of Phenolic Compounds from Roselle (Hibiscus sabdariffa) Calyces with Aqueous Two-Phase Extraction Based on Sodium Citrate and Polyethylene Glycol or Acetone. Sep. Sci. Technol. 2020, 55, 2313–2324. [Google Scholar] [CrossRef]
- Pimentel, J.G.; Bicalho, S.F.; Gandolfi, O.R.R.; Verissimo, L.A.A.; Castro, S.d.S.; Souza, E.A.; Veloso, C.M.; Fontan, R.d.C.I.; Sampaio, V.S.; Bonomo, R.C.F. Fluid Phase Equilibria Evaluation of Salting-out Effect in the Liquid e Liquid Equilibrium of Aqueous Two-Phase Systems Composed of 2-Propanol and Na2SO4/MgSO4 at Different Temperatures. Fluid Phase Equilibria 2017, 450, 184–193. [Google Scholar] [CrossRef]
- Jiménez-Velázquez, P.; Valle-Guadarrama, S.; Alia-Tejacal, I.; Salinas-Moreno, Y.; García-Cruz, L.; Pérez-López, A.; Guerra-Ramírez, D. Separation of Bioactive Compounds from Epicarp of ‘Hass’ Avocado Fruit through Aqueous Two-Phase Systems. Food Bioprod. Process. 2020, 123, 238–250. [Google Scholar] [CrossRef]
- Banipal, T.S.; Kaur, H.; Kaur, A.; Banipal, P.K. Effect of Tartarate and Citrate Based Food Additives on the Micellar Properties of Sodium Dodecylsulfate for Prospective Use as Food Emulsifier. Food Chem. 2016, 190, 599–606. [Google Scholar] [CrossRef] [PubMed]
- FAO/WHO CODEX Alimentarius. Norma General Para Los Aditivos Alimentarios. Codex Stan 192-1995 Adoptado En 1995. Revisión 1997, 1999, 2001, 2003, 2004, 2005, 2006, 2007, 2008, 2009, 2010, 2011, 2012, 2013, 2014, 2015, 2016, 2017, 2018, 2019. 1995. Available online: https://www.fao.org/gsfaonline/docs/CXS_192s.pdf (accessed on 19 November 2024).
- Hamzehzadeh, S.; Zafarani-Moattar, M.T. Phase Separation in Aqueous Solutions of Polypropylene Glycol and Sodium Citrate: Effects of Temperature and PH. Fluid Phase Equilibria 2015, 385, 37–47. [Google Scholar] [CrossRef]
- Lee, J.; Durst, R.W.; E Wrolstad, R.; Collaborators; Eisele, T.; Giusti, M.M.; Hofsommer, H.; Koswig, S.; A Krueger, D.; Kupina, S.; et al. Determination of Total Monomeric Anthocyanin Pigment Content of Fruit Juices, Beverages, Natural Colorants, and Wines by the PH Differential Method: Collaborative Study. J. AOAC Int. 2005, 88, 1269–1278. [Google Scholar]
- Merchuk, J.C.; Andrews, B.A.; Asenjo, J.A. Aqueous Two-Phase Systems for Protein Separation Studies on Phase Inversion. J. Chromatogr. B 1998, 711, 285–293. [Google Scholar] [CrossRef]
- Hernández-Rodríguez, G.; Valle-Guadarrama, S.; Guerra-Ramírez, D.; Domínguez-Puerto, R.; López-Cruz, I.L. Anthocyanins of Ardisia spp. Fruits Separated with PH Driven-Aqueous Biphasic Systems. Sep. Sci. Technol. 2025, 60, 426–437. [Google Scholar] [CrossRef]
- Williamson, J.C. Liquid–Liquid Demonstrations: Phase Equilibria and the Lever Rule. J. Chem. Educ. 2021, 98, 2356–2363. [Google Scholar] [CrossRef]
- Singleton, V.L.; Rossi, J.J.A. Colorimetry of Total Phenolics with Phosphomolybdic-Phosphotungstic Acid Reagents. Am. J. Enol. Vitic. 1965, 16, 144–158. [Google Scholar]
- Nowotny, A. Carbohydrate Determination by Phenol-Sulfuric Acid. In Basic Exercises in Immunochemistry; Springer: Berlin/Heidelberg, Germany, 1979; pp. 171–173. [Google Scholar]
- Benzie, I.F.F.; Strain, J.J. The Ferric Reducing Ability of Plasma (FRAP) as a Measure of “Antioxidant Power”: The FRAP Assay. Anal. Biochem. 1996, 239, 70–76. [Google Scholar] [CrossRef] [PubMed]
- SPSS, I. Sigma Plot 2000 User’s Guide; SPSS Inc.: Chicago, IL, USA, 2000. [Google Scholar]
- Valle-Guadarrama, S.; Saucedo-Veloz, C.; Peña-Valdivia, C.B.; Corrales-García, J.J.E.; Chávez-Franco, S.H.; Espinosa-Solares, T. Skin Permeance and Internal Gas Composition in `Hass’ Avocado (Persea americana Mill.) Fruits. Food Sci. Technol. Int. 2002, 8, 365–373. [Google Scholar] [CrossRef]
- Taiz, L.; Zeiger, E. Plant Physiologys, 4th ed.; Sinauer Associates Inc.: Sunderland, MA, USA, 2006. [Google Scholar]
- Nthimole, C.T.; Kaseke, T.; Fawole, O.A. Exploring the Extraction and Application of Anthocyanins in Food Systems. Processes 2024, 12, 2444. [Google Scholar] [CrossRef]
- McGuire, R.G. Reporting of Objective Color Measurements. HortScience 1992, 27, 1254–1255. [Google Scholar] [CrossRef]
Disclaimer/Publisher’s Note: The statements, opinions and data contained in all publications are solely those of the individual author(s) and contributor(s) and not of MDPI and/or the editor(s). MDPI and/or the editor(s) disclaim responsibility for any injury to people or property resulting from any ideas, methods, instructions or products referred to in the content. |
© 2025 by the authors. Licensee MDPI, Basel, Switzerland. This article is an open access article distributed under the terms and conditions of the Creative Commons Attribution (CC BY) license (https://creativecommons.org/licenses/by/4.0/).