
A Novel Triethylammonium Tetrafluoroborate Electrolyte for Enhanced Supercapacitor Performance over a Wide Temperature Range


Abstract
1. Introduction
2. Materials and Methods
3. Results
3.1. Characterisation of Activated Carbon
3.1.1. Surface Area and Pore Size Distribution
3.1.2. Particle Size Distribution
3.1.3. FTIR Analysis
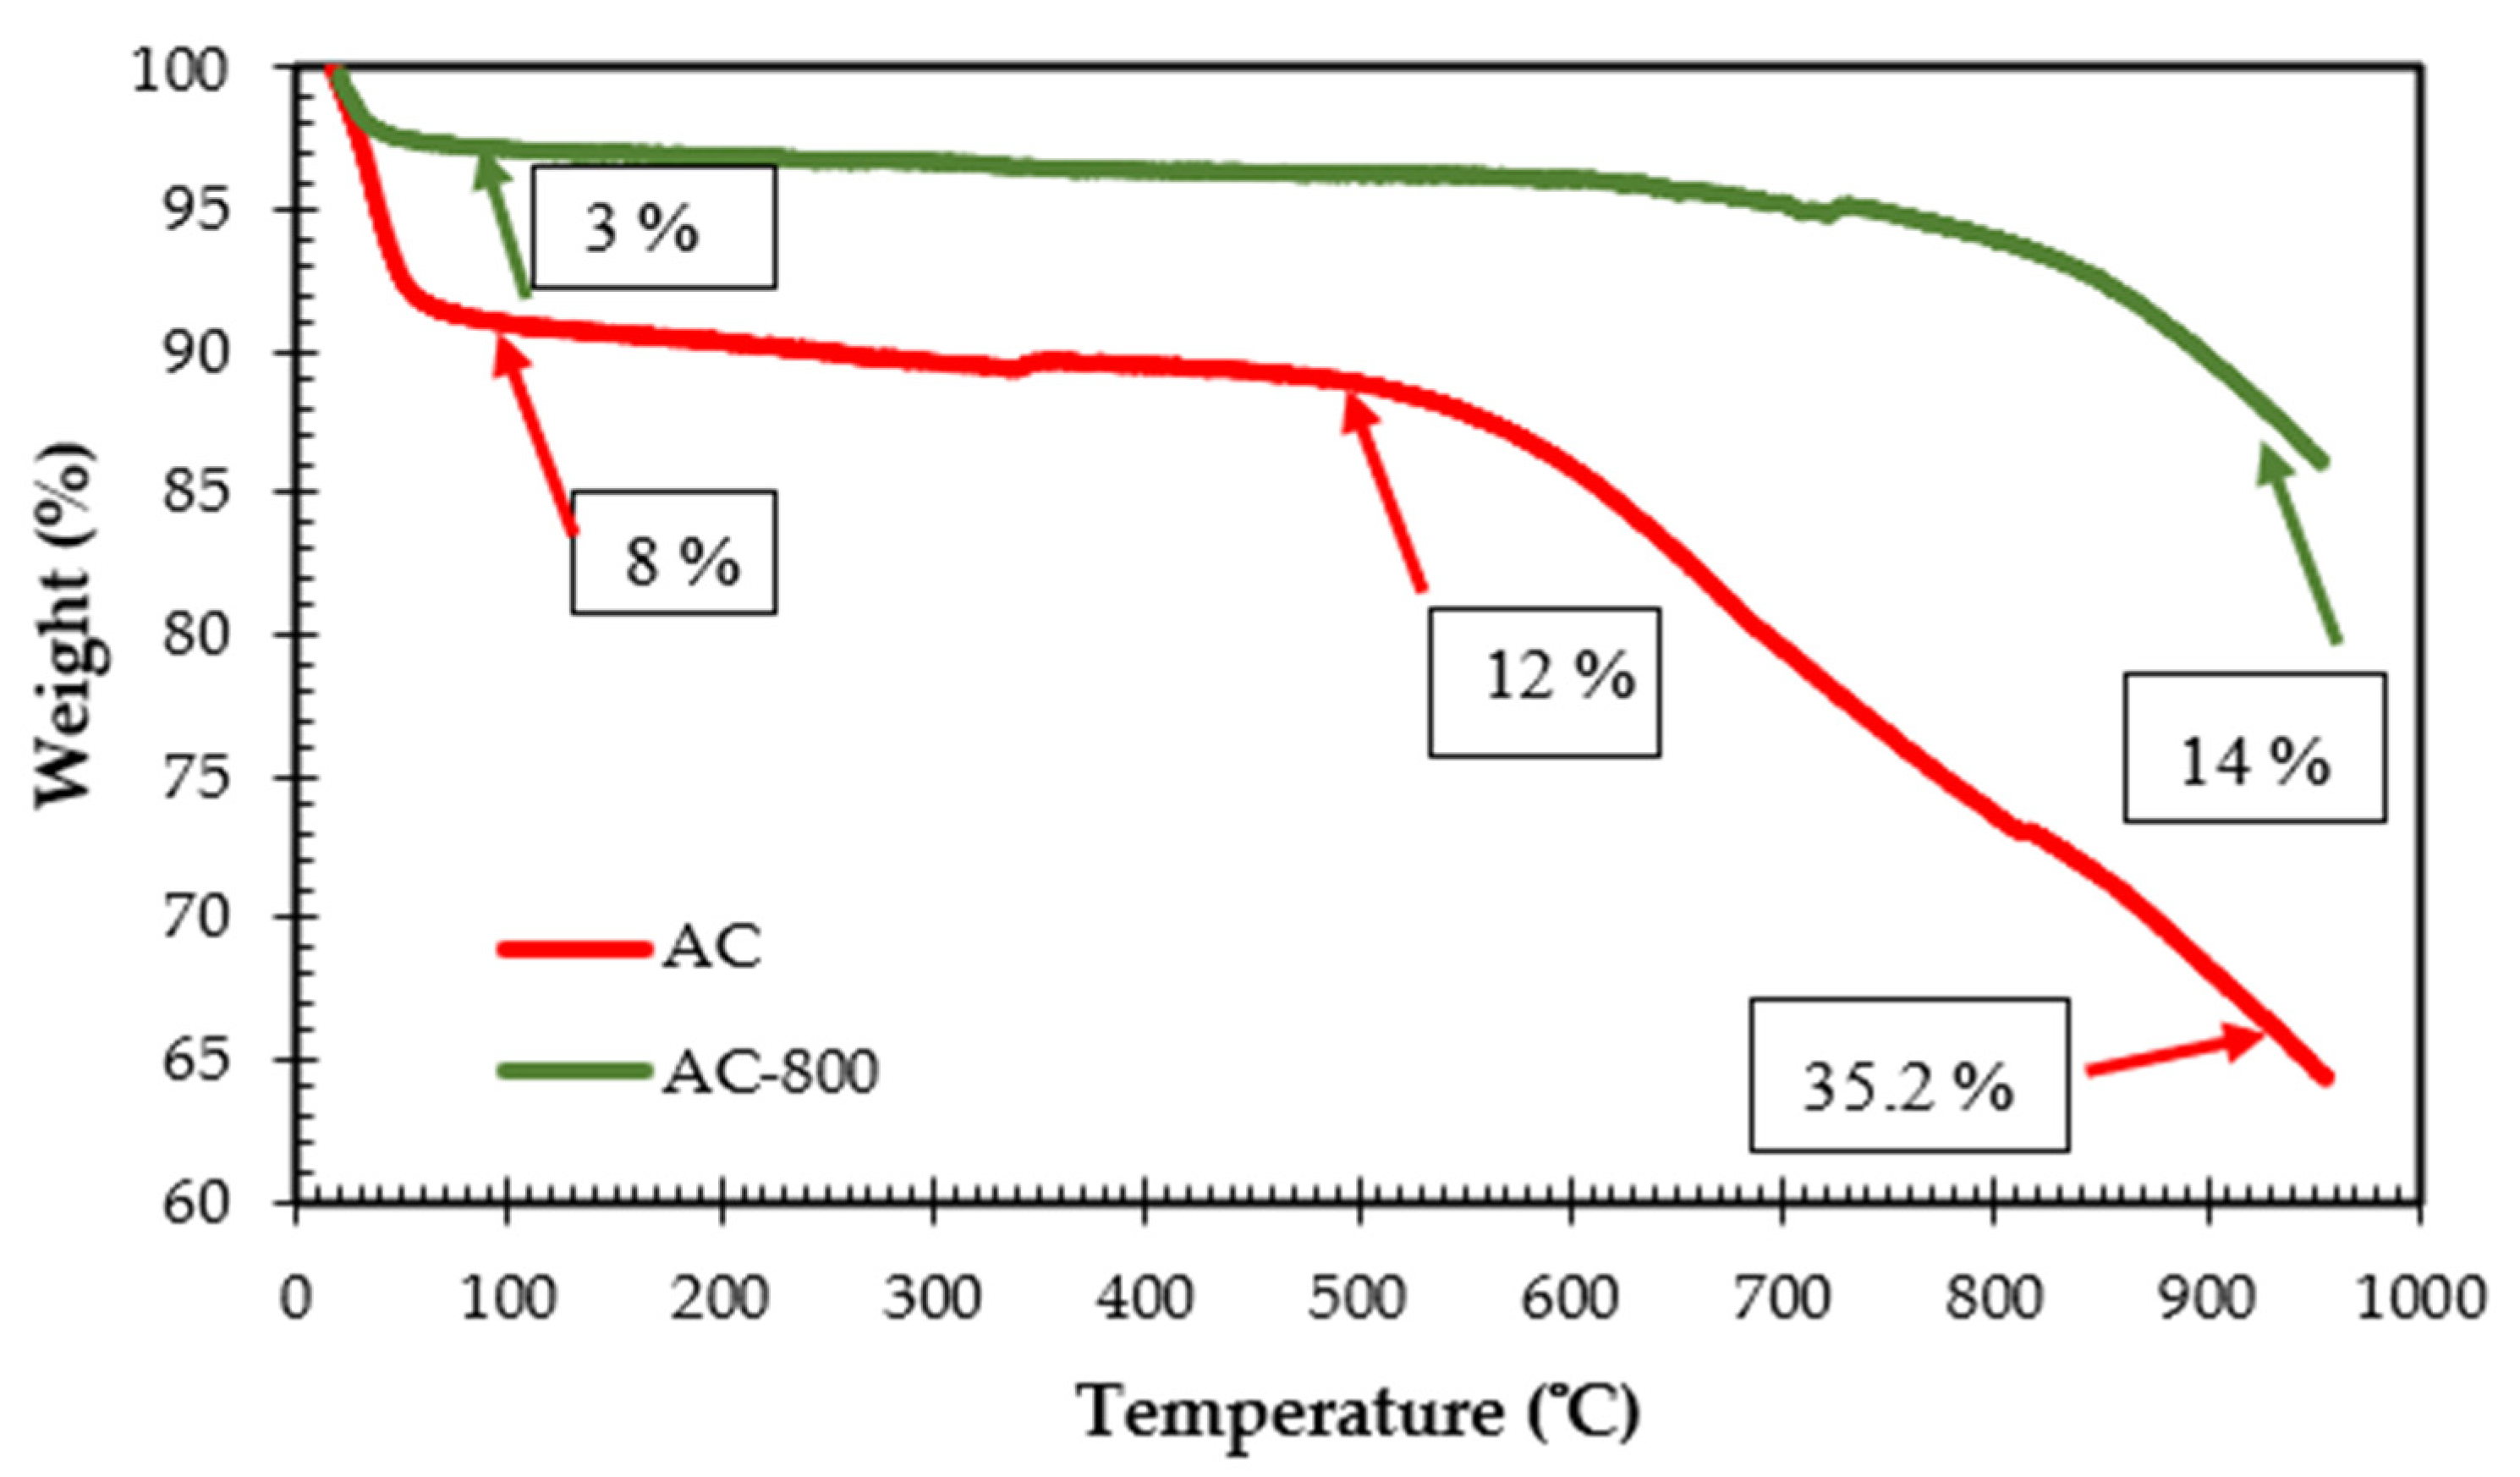
3.1.4. TGA
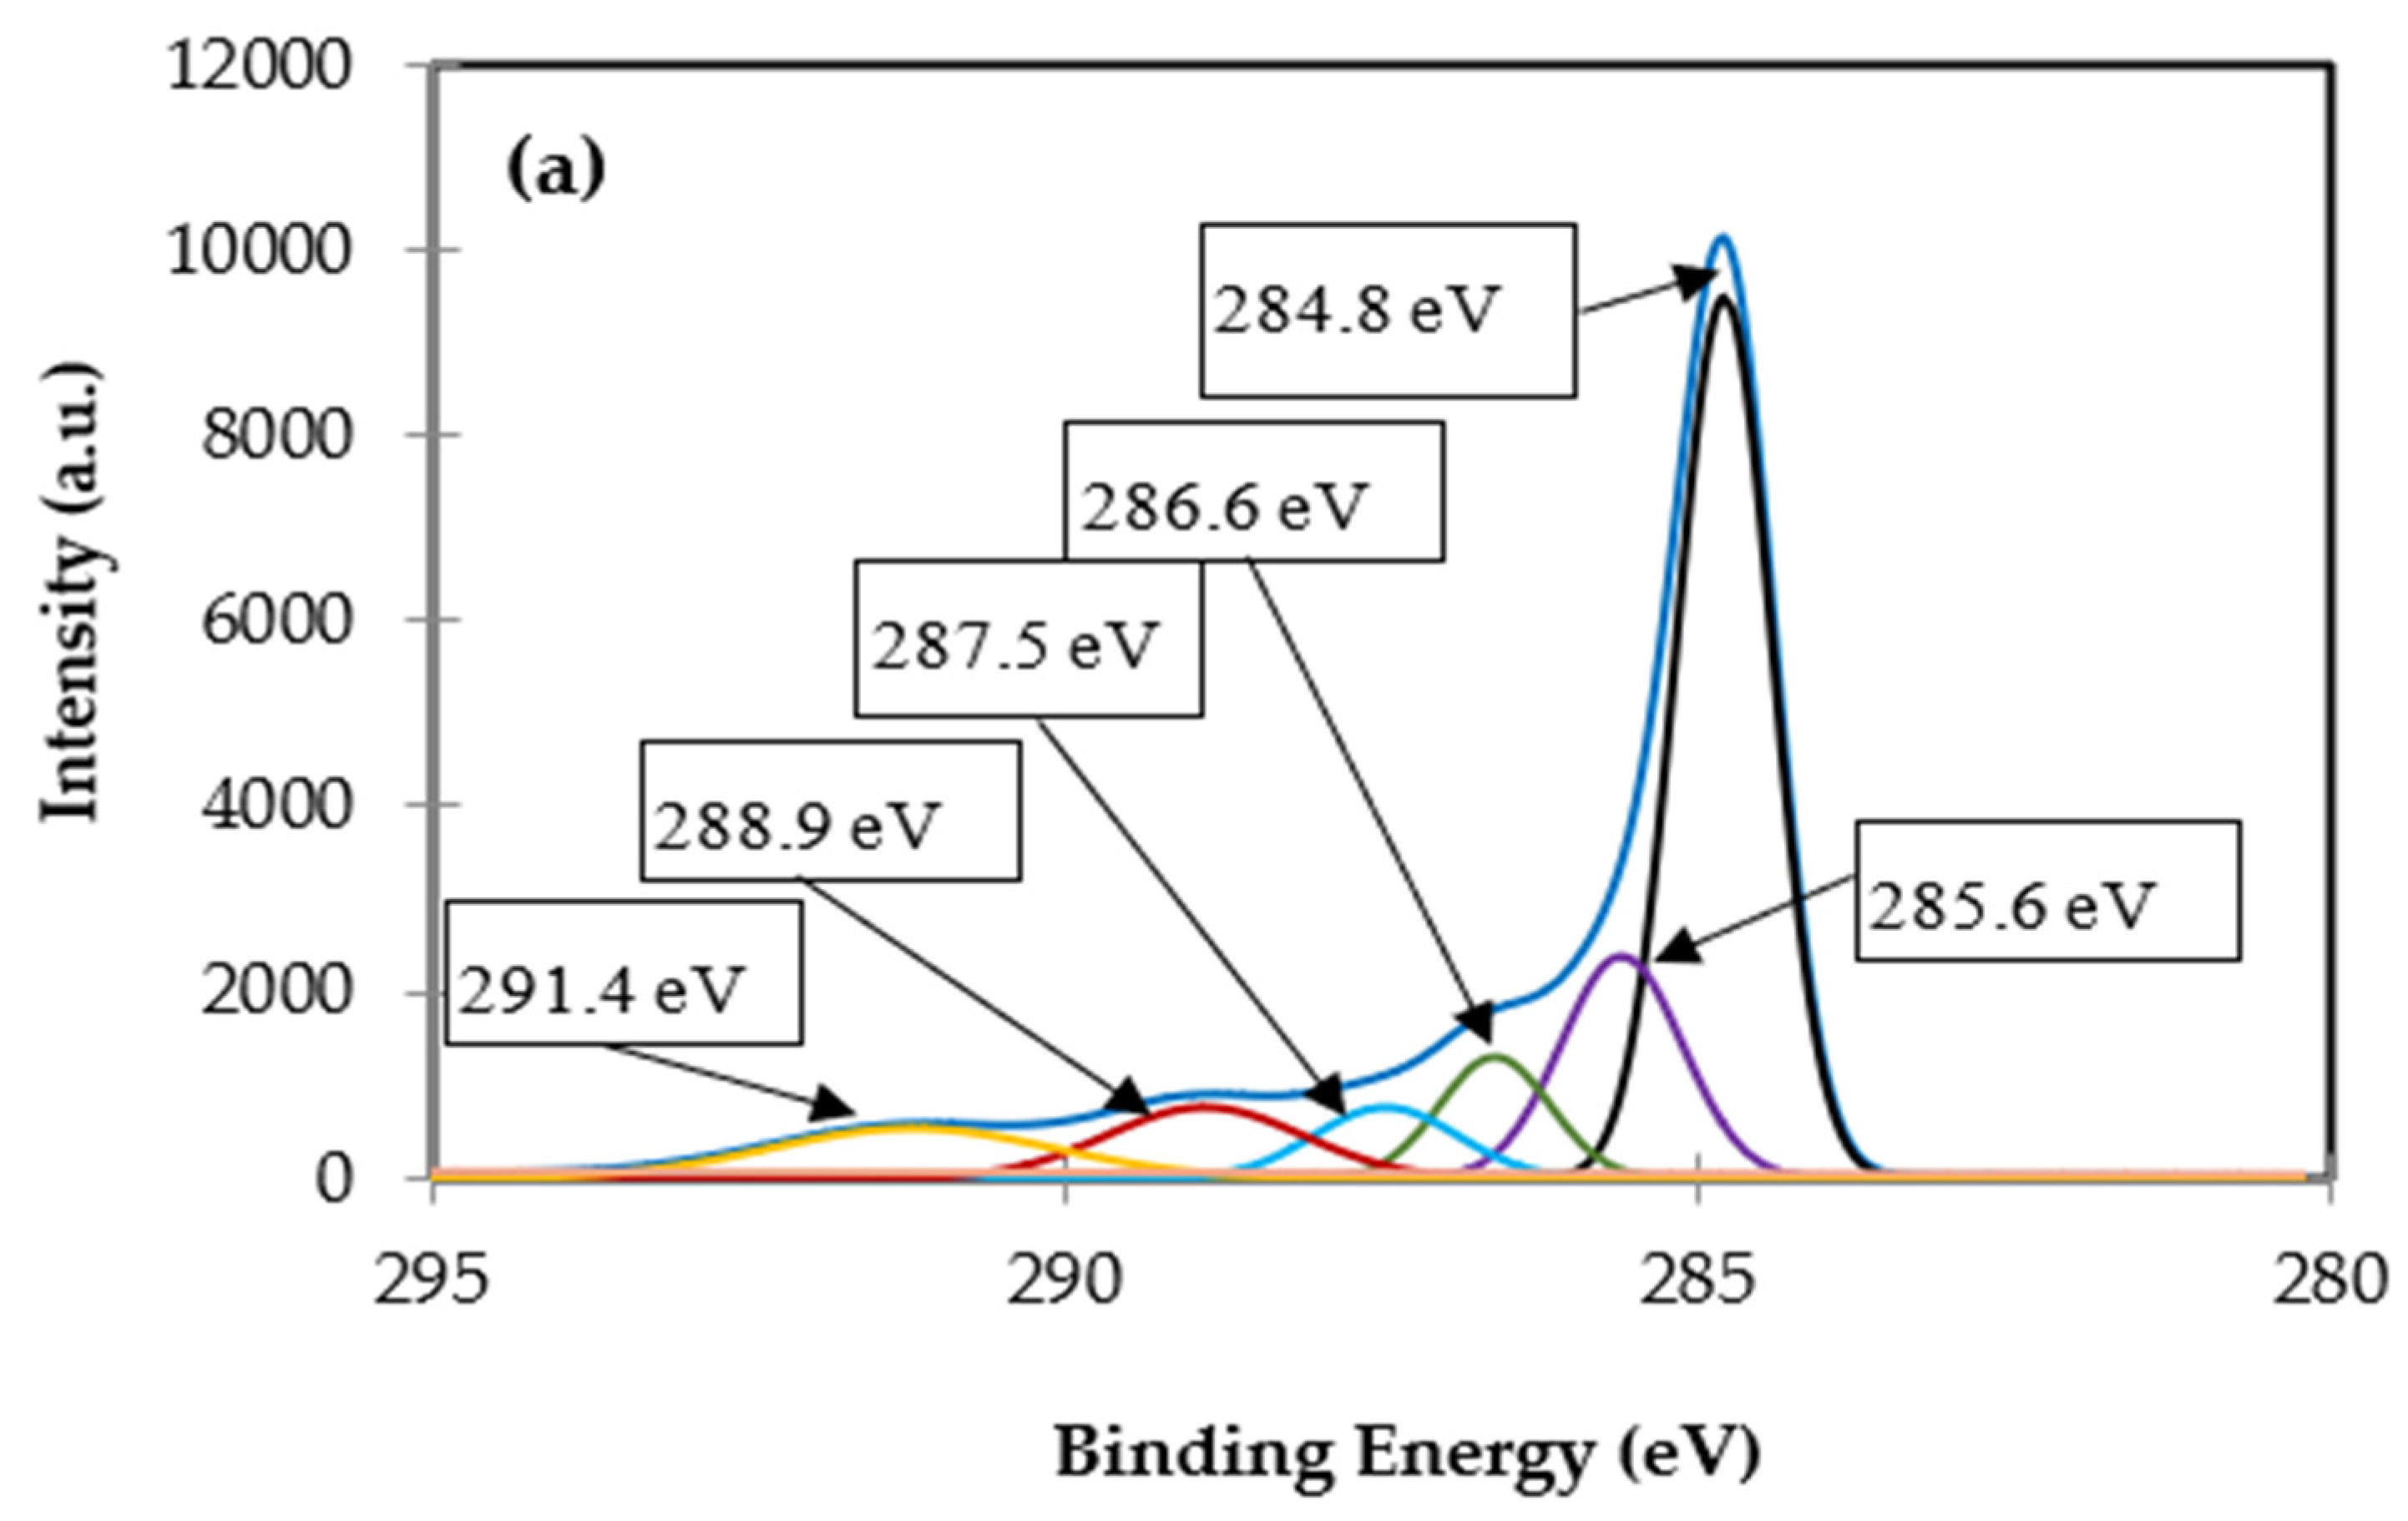
3.1.5. XPS Analysis
3.2. Electrochemical Tests
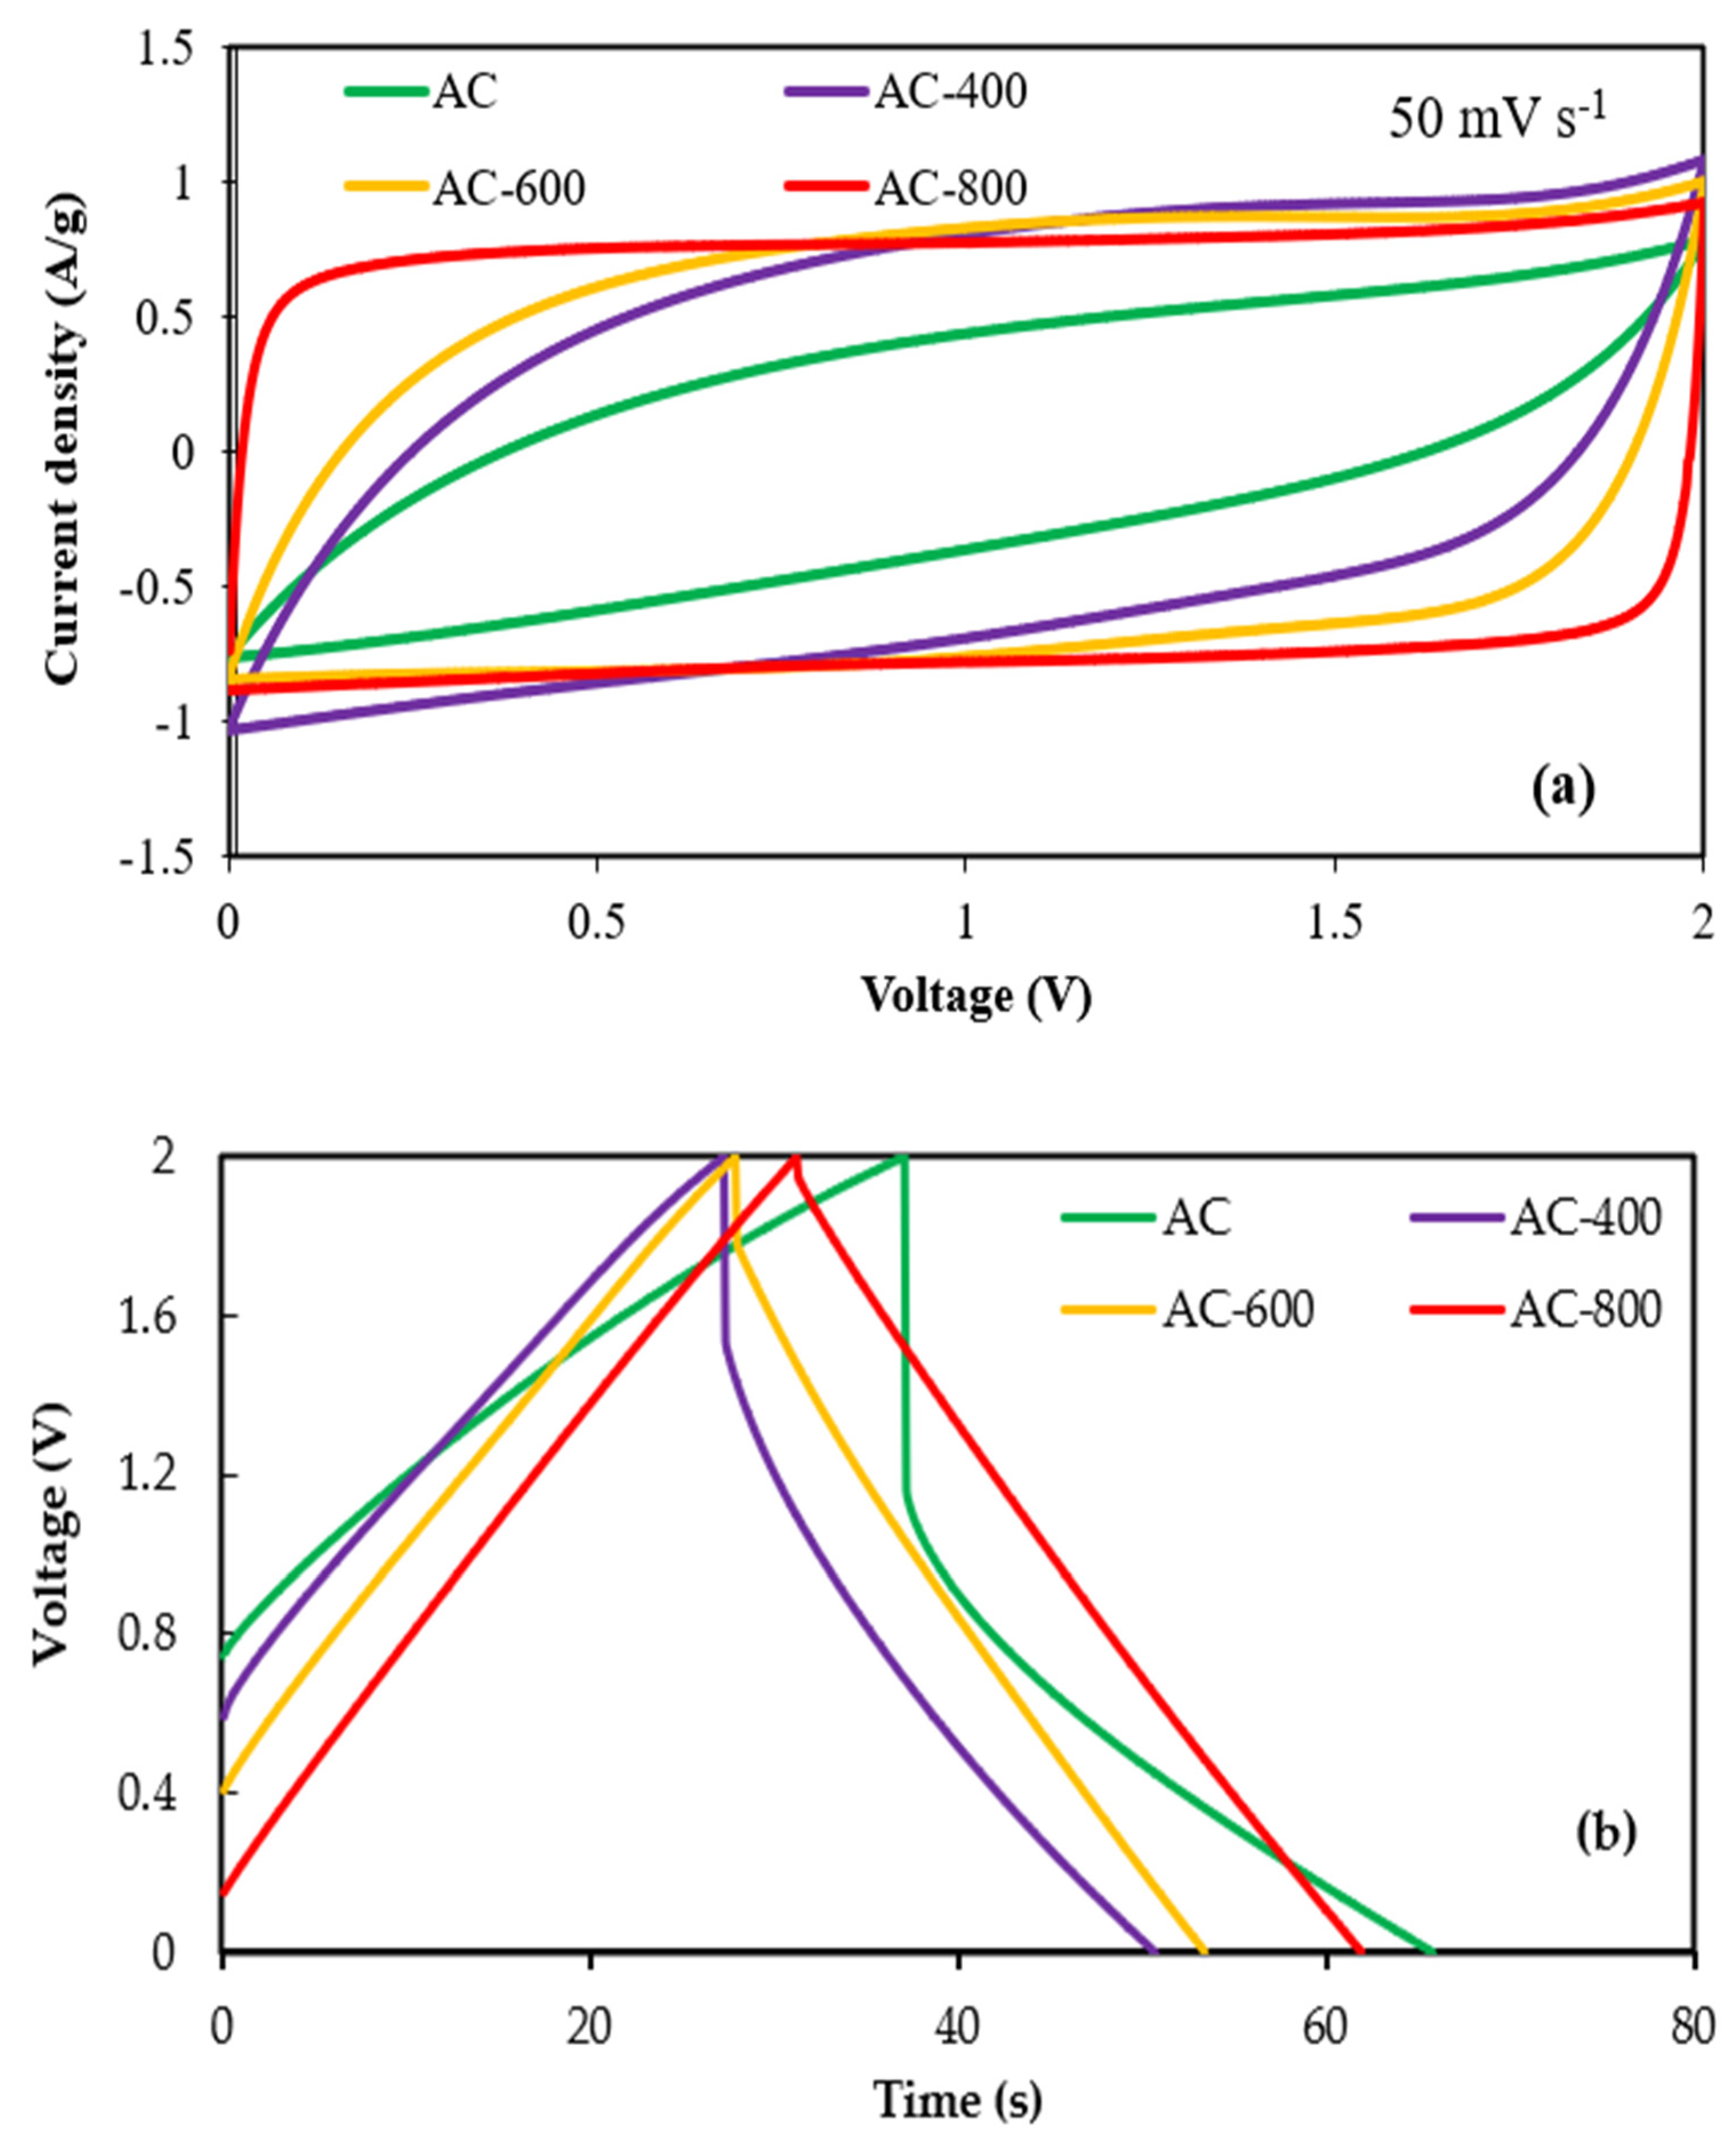
3.2.1. Effects of Heat Treatment
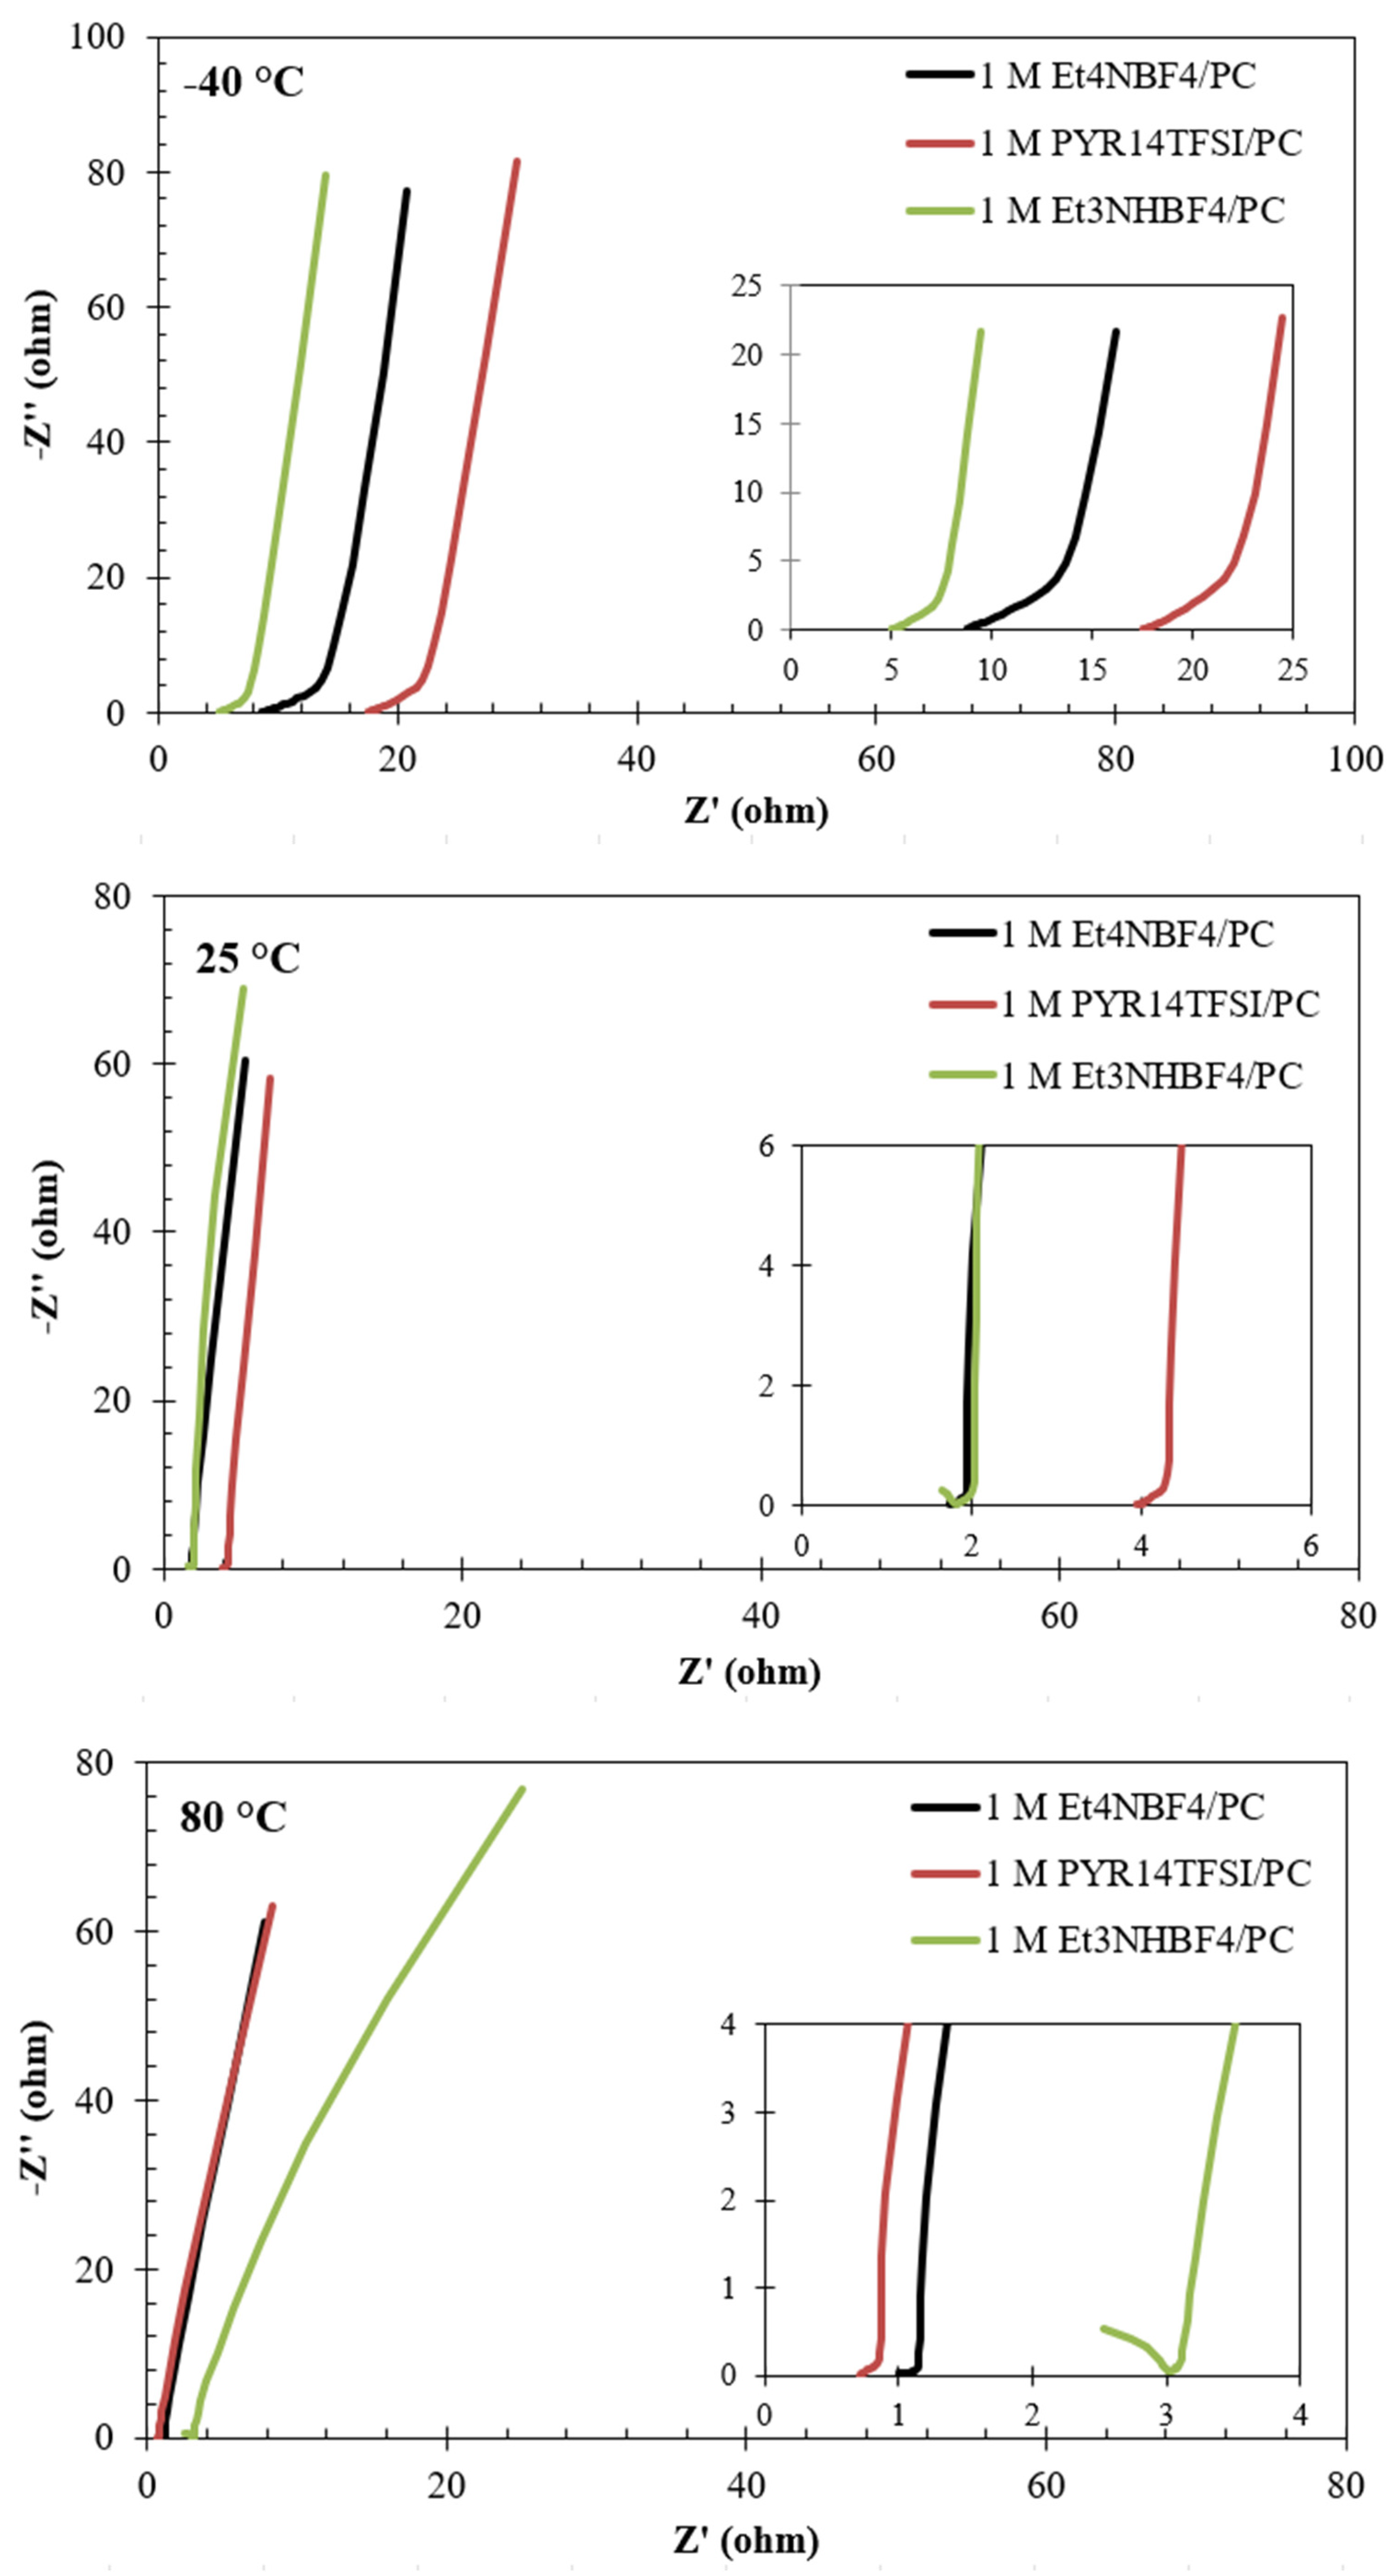
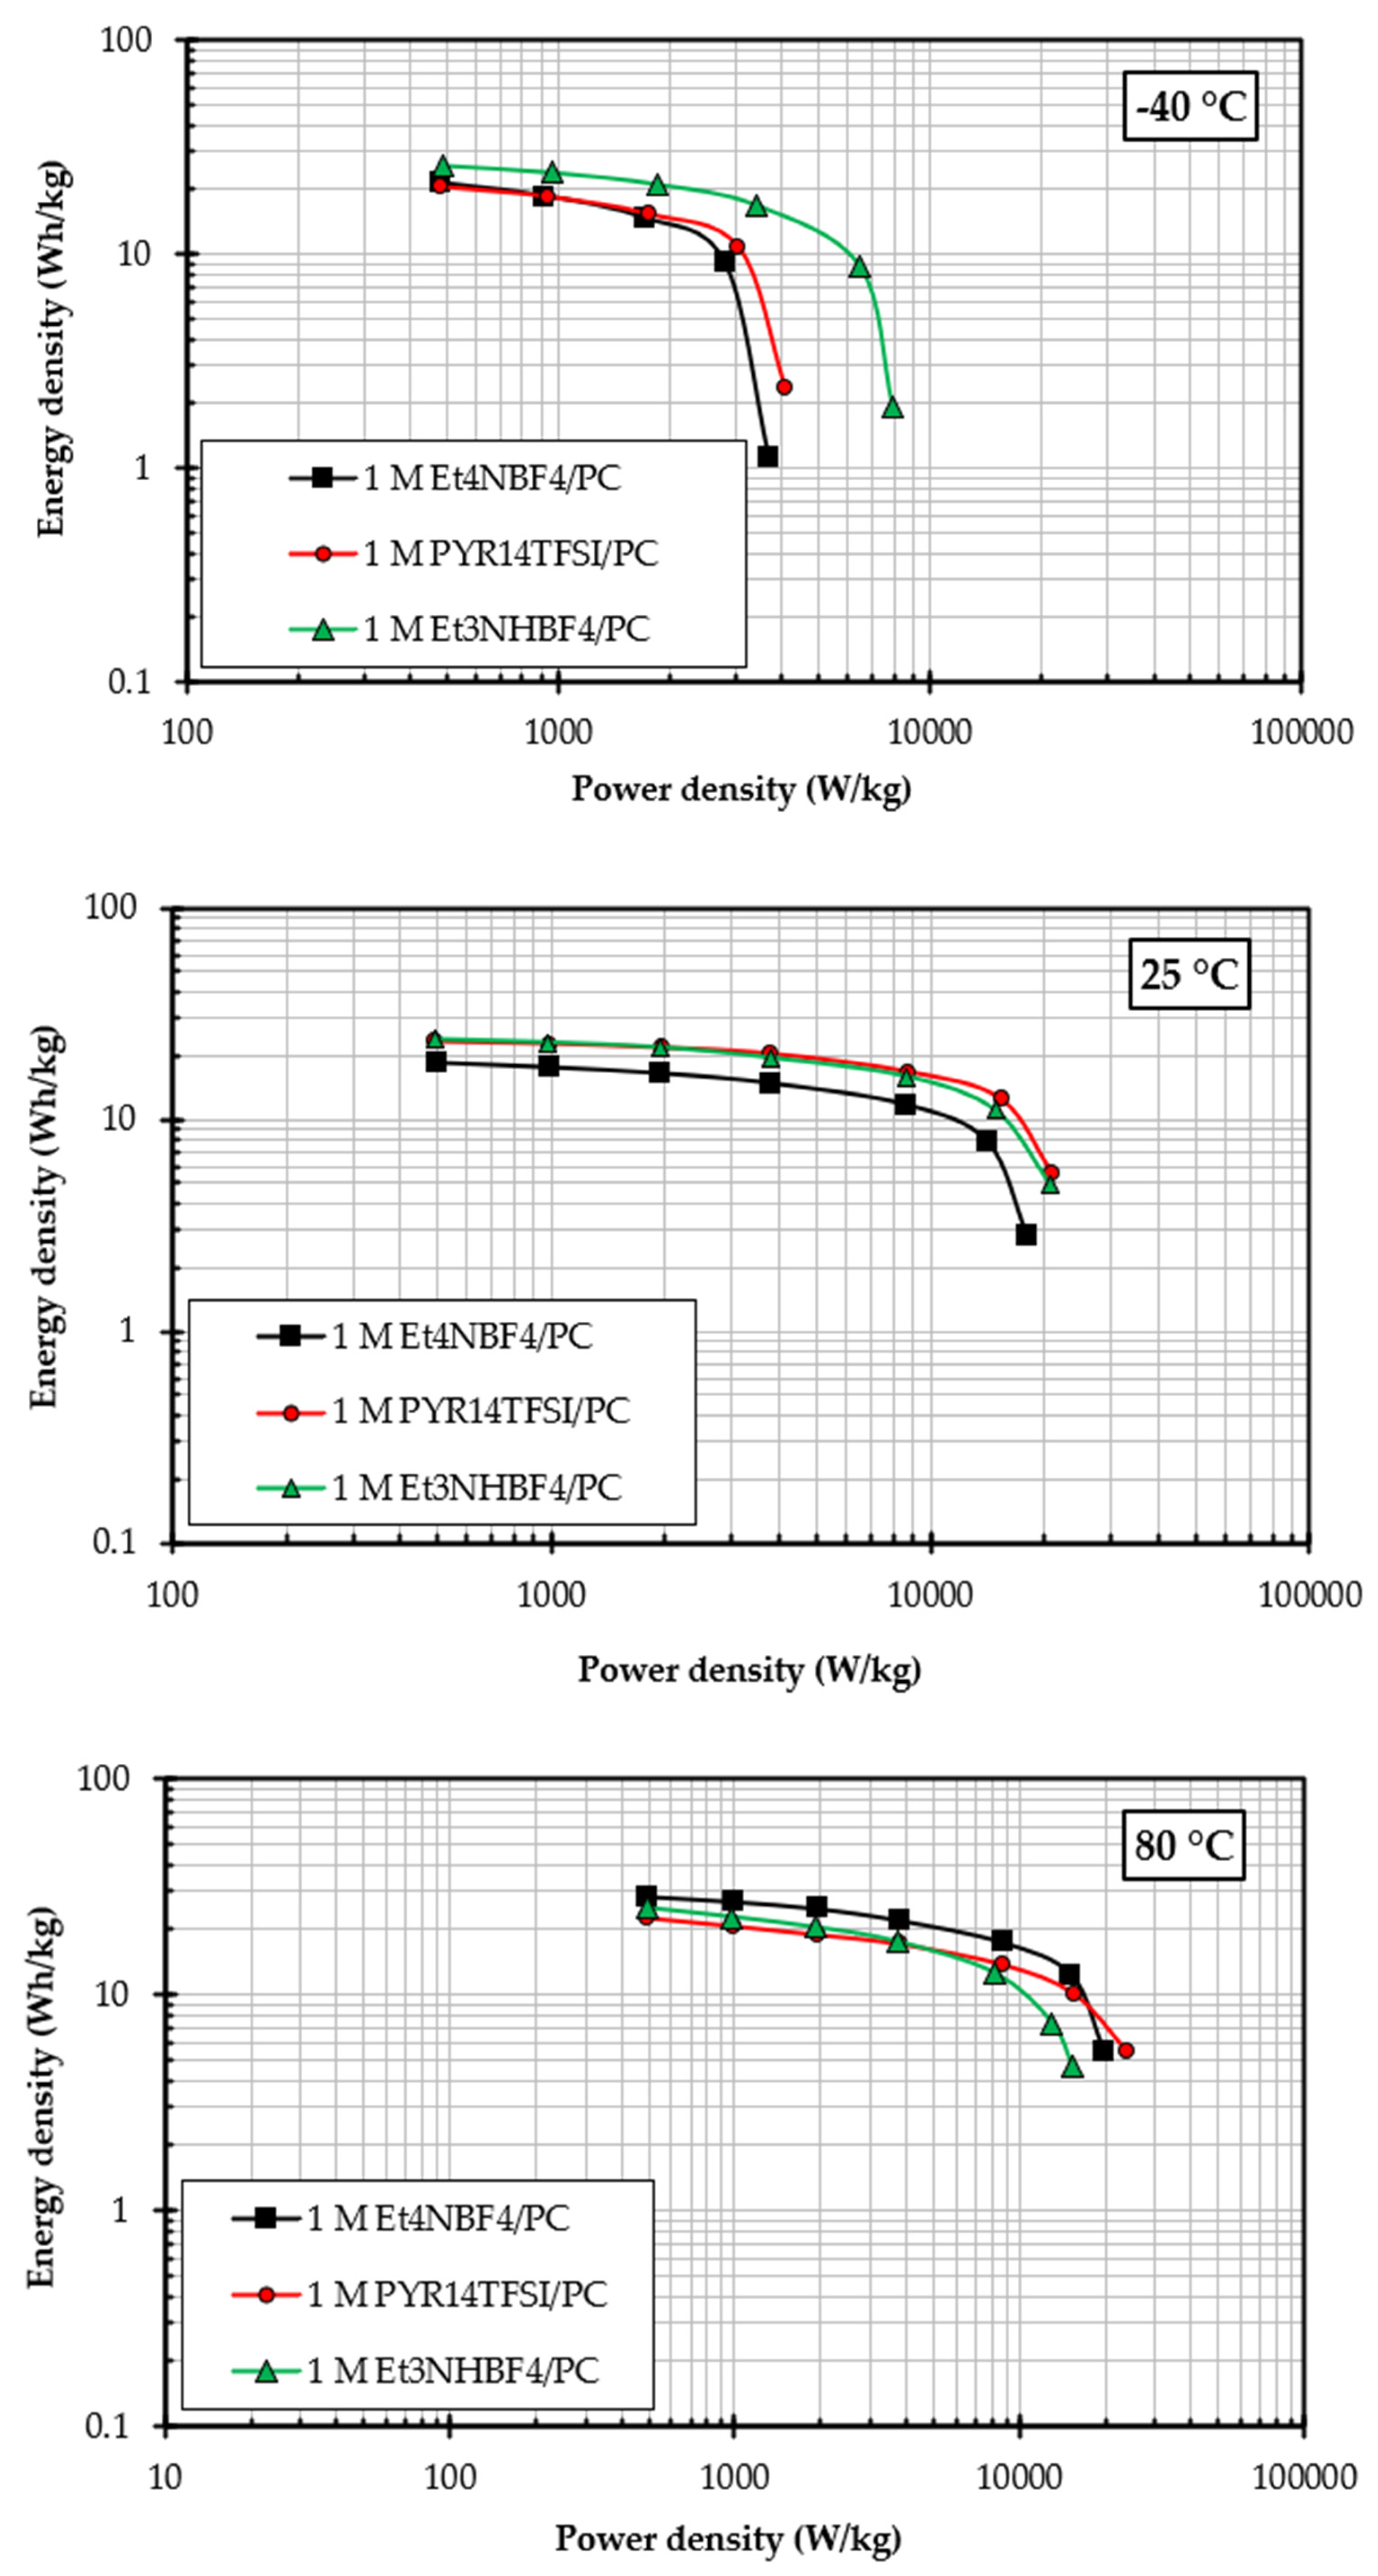
3.2.2. Electrolyte Performance at −40 °C, 25 °C, and 80 °C
4. Discussion
Supplementary Materials
Author Contributions
Funding
Data Availability Statement
Acknowledgments
Conflicts of Interest
References
- Lin, R.; Taberna, P.L.; Fantini, S.; Presser, V.; Pérez, C.R.; Malbosc, F.; Rupesinghe, N.L.; Teo, K.B.K.; Gogotsi, Y.; Simon, P. Capacitive energy storage from −50 to 100 °C using an ionic liquid electrolyte. J. Phys. Chem. Lett. 2011, 2, 2396–2401. [Google Scholar] [CrossRef]
- An, K.H.; Kim, W.S.; Park, Y.S.; Moon, J.M.; Bae, D.J.; Lim, S.C.; Lee, Y.S.; Lee, Y.H. Electrochemical properties of high-power supercapacitors using single-walled carbon nanotube electrodes. Adv. Funct. Mater. 2001, 11, 387–392. [Google Scholar] [CrossRef]
- Simon, P.; Gogotsi, Y. Materials for electrochemical capacitors. Nanosci. Technol. 2010, 10, 806–818. [Google Scholar] [CrossRef]
- Conte, M. Supercapacitors technical requirements for new applications. Fuel Cells 2010, 10, 806–818. [Google Scholar] [CrossRef]
- CGuajardo, I.G.; Martínez, J.A.Z.; Pérez, R.B.; Pavón, L.A.L.; Porto, R.L. Synthesis of Hureaulite Mn5(H2O)4(PO3OH)2(PO4)2 with an open 3D network structure as electrode material for electrochemical capacitors. Processes 2024, 12, 1622. [Google Scholar] [CrossRef]
- Miller, J.R.; Burke, A.F. Electrochemical capacitors: Challenges and opportunities for real-world applications. Electrochem. Soc. Interface 2008, 17, 53. [Google Scholar] [CrossRef]
- Karaman, C.; Bayram, E.; Karaman, O.; Aktaş, Z. Preparation of high surface area nitrogen doped graphene for the assessment of morphologic properties and nitrogen content impacts on supercapacitors. J. Electroanal. Chem. 2020, 868, 114197. [Google Scholar] [CrossRef]
- Karaman, C.; Aktaş, Z.; Bayram, E.; Karaman, O.; Kızıl, Ç. Correlation between the molecular structure of reducing agent and pH of graphene oxide dispersion on the formation of 3D-graphene networks. ECS J. Solid State Sci. Technol. 2020, 9, 071003. [Google Scholar] [CrossRef]
- Jayalakshmi, M.; Balasubramanian, K. Simple capacitors to supercapacitors an overview. Int. J. Electrochem. Sci. 2008, 3, 1196–1217. [Google Scholar] [CrossRef]
- Boulon, L.; Hissel, D.; Bouscayrol, A.; Pape, O.; Pera, M.C. Simulation model of a military HEV with a highly redundant architecture. IEEE Trans. Veh. Technol. 2010, 59, 2654–2663. [Google Scholar] [CrossRef]
- Pasquier, A.D.; Plitz, I.; Menocal, S.; Amatucci, G. A comparative study of Li-ion battery, supercapacitor and nonaqueous asymmetric hybrid devices for automotive applications. J. Power Sources 2003, 115, 171–178. [Google Scholar] [CrossRef]
- Rafik, F.; Gualous, H.; Gallay, R.; Crausaz, A.; Berthon, A. Supercapacitors characterization for hybrid vehicle applications. In Proceedings of the 2006 CES/IEEE 5th International Power Electronics and Motion Control Conference, Shanghai, China, 14–16 August 2006; Volume 3, pp. 1–5. [Google Scholar] [CrossRef]
- Kang, J.; Jayaram, S.H.; Rawlins, J.; Wen, J. Characterization of thermal behaviors of electrochemical double layer capacitors (EDLCs) with aqueous and organic electrolytes. Electrochim. Acta 2014, 144, 200–210. [Google Scholar] [CrossRef]
- Dash, R.; Chmiola, J.; Yushin, G.; Gogotsi, Y.; Laudisio, G.; Singer, J.; Fischer, J.; Kucheyev, S. Titanium carbide derived nanoporous carbon for energy-related applications. Carbon 2006, 44, 2489–2497. [Google Scholar] [CrossRef]
- Dzubiella, J.; Hansen, J.P. Electric-field-controlled water and ion permeation of a hydrophobic nanopore. J. Chem. Phys. 2005, 122, 234706. [Google Scholar] [CrossRef] [PubMed]
- Yaglikci, S.; Gokce, Y.; Yagmur, E.; Banford, A.; Aktas, Z. Does high sulphur coal have the potential to produce high performance-low cost supercapacitors? Surf. Interfaces 2021, 22, 100899. [Google Scholar] [CrossRef]
- Yaglikci, S.; Gokce, Y.; Yagmur, E.; Aktas, Z. The performance of sulphur doped activated carbon supercapacitors prepared from waste tea. Environ. Technol. 2020, 41, 36–48. [Google Scholar] [CrossRef]
- Inal, I.I.G.; Holmes, S.M.; Yagmur, E.; Ermumcu, N.; Banford, A.; Aktas, Z. The supercapacitor performance of hierarchical porous activated carbon electrodes synthesised from demineralised (waste) cumin plant by microwave pretreatment. J. Ind. Eng. Chem. 2018, 61, 124–132. [Google Scholar] [CrossRef]
- Inal, I.I.G.; Aktas, Z. Enhancing the performance of activated carbon based scalable supercapacitors by heat treatment. Appl. Surf. Sci. 2020, 514, 145895. [Google Scholar] [CrossRef]
- Wang, C.; Guo, L.; Li, H.; Wang, Y.; Weng, J.; Wu, L. Preparation of simple ammonium ionic liquids and their application in the cracking of dialkoxypropanes. Green Chem. 2006, 8, 603–607. [Google Scholar] [CrossRef]
- Chen, H.; Di, J.; Jin, Y.; Chen, M.; Tian, J.; Li, Q. Active carbon wrapped carbon nanotube buckypaper for the electrode of electrochemical supercapacitors. J. Power Sources 2013, 237, 325–331. [Google Scholar] [CrossRef]
- Zhong, C.; Deng, Y.; Hu, W.; Qiao, J.; Zhang, L.; Zhang, J. A review of electrolyte materials and compositions for electrochemical supercapacitors. Chem. Soc. Rev. 2015, 44, 7484–7539. [Google Scholar] [CrossRef]
- Bhat, T.S.; Patil, P.S.; Rakhi, R.B. Recent trends in electrolytes for supercapacitors. J. Energy Storage 2022, 50, 104222. [Google Scholar]
- Dagousset, L.; Pognon, G.; Nguyen, G.T.M.; Vidal, F.; Jus, S.; Aubert, P.H. Electrochemical characterisations and ageing of ionic liquid/γ-butyrolactone mixtures as electrolytes for supercapacitor applications over a wide temperature range. J. Power Sources 2017, 359, 242–249. [Google Scholar] [CrossRef]
- Pan, S.; Yao, M.; Zhang, J.; Li, B.; Xing, C.; Song, X.; Su, P.; Zhang, H. Recognition of ionic liquids as high-voltage electrolytes for supercapacitors. Front. Chem. 2020, 8, 261. [Google Scholar] [CrossRef]
- Armand, M.; Endres, F.; MacFarlane, D.R.; Ohno, H.; Scrosati, B. Ionic-liquid materials for the electrochemical challenges of the future. Nat. Mater. 2009, 8, 621–629. [Google Scholar] [CrossRef]
- Maton, C.; De Vos, N.; Stevens, C.V. Ionic liquid thermal stabilities: Decomposition mechanisms and analysis tools. Chem. Soc. Rev. 2013, 42, 5963–5977. [Google Scholar] [CrossRef] [PubMed]
- Galiński, M.; Lewandowski, A.; Stępniak, I. Ionic liquids as electrolytes. Electrochim. Acta 2006, 51, 5567–5580. [Google Scholar] [CrossRef]
- Anouti, M.; Timperman, L. A pyrrolidinium nitrate protic ionic liquid-based electrolyte for very low-temperature electrical double-layer capacitors. Phys. Chem. Chem. Phys. 2013, 15, 6539–6548. [Google Scholar] [CrossRef]
- Hapiot, P.; Lagrost, C. Electrochemical reactivity in room-temperature ionic liquids. Chem. Rev. 2008, 108, 2238–2264. [Google Scholar] [CrossRef]
- Zhang, L.; Tsay, K.; Bock, C.; Zhang, J. Ionic liquids as electrolytes for non-aqueous solutions electrochemical supercapacitors in a temperature range of 20 °C–80 °C. J. Power Sources 2016, 324, 615–624. [Google Scholar] [CrossRef]
- Jarosik, A.; Krajewski, S.R.; Lewandowski, A.; Radzimski, P. Conductivity of ionic liquids in mixtures. J. Mol. Liq. 2006, 123, 43–50. [Google Scholar] [CrossRef]
- Leyva-García, S.; Lozano-Castelló, D.; Morallón, E.; Vogl, T.; Schütter, C.; Passerini, S.; Balducci, A.; Cazorla-Amorós, D. Electrochemical performance of a superporous activated carbon in ionic liquid-based electrolytes. J. Power Sources 2016, 336, 419–426. [Google Scholar] [CrossRef]
- Ruiz, V.; Huynh, T.; Sivakkumar, S.R.; Pandolfo, A.G. Ionic liquid–solvent mixtures as supercapacitor electrolytes for extreme temperature operation. RSC Adv. 2012, 2, 5591–5598. [Google Scholar] [CrossRef]
- Pohlmann, S.; Ramirez-Castro, C.; Balducci, A. The influence of conductive salt ion selection on EDLC electrolyte characteristics and carbon-electrolyte interaction. J. Electrochem. Soc. 2015, 162, A5020–A5030. [Google Scholar] [CrossRef]
- Thommes, M.; Kaneko, K.; Neimark, A.V.; Olivier, J.P.; Rodriguez-Reinoso, F.; Rouquerol, J.; Sing, K.S.W. Physisorption of gases, with special reference to the evaluation of surface area and pore size distribution (IUPAC Technical Report). Pure Appl. Chem. 2015, 87, 1051–1069. [Google Scholar] [CrossRef]
- Zielke, U.; Hüttinger, K.J.; Hoffman, W.P. Surface-oxidized carbon fibers: I. Surface structure and chemistry. Carbon 1996, 34, 983–998. [Google Scholar] [CrossRef]
- Puziy, A.M.; Poddubnaya, O.I.; Martínez-Alonso, A.; Suárez-García, F.; Tascón, J.M. Surface chemistry of phosphorus-containing carbons of lignocellulosic origin. Carbon 2005, 43, 2857–2868. [Google Scholar] [CrossRef]
- Lladó, J.; Lao-Luque, C.; Ruiz, B.; Fuente, E.; Solé-Sardans, M.; Dorado, A.D. Role of activated carbon properties in atrazine and paracetamol adsorption equilibrium and kinetics. Process Saf. Environ. Prot. 2015, 95, 51–59. [Google Scholar] [CrossRef]
- Yagmur, E.; Tunc, M.S.; Banford, A.; Aktas, Z. Preparation of activated carbon from autohydrolysed mixed southern hardwood. J. Anal. Appl. Pyrolysis 2013, 104, 470–478. [Google Scholar] [CrossRef]
- Qiu, C.; Jiang, L.; Gao, Y.; Sheng, L. Effects of oxygen-containing functional groups on carbon materials in supercapacitors: A review. Mater. Des. 2023, 230, 111952. [Google Scholar] [CrossRef]
- Oglou, R.C.; Gokce, Y.; Yagmur, E.; Ghobadi, T.G.U.; Aktas, Z. Highly stable Megalopolis lignite based N and S self-doped hierarchically porous activated carbons for high performance supercapacitors and ash content effects on performance. J. Energy Storage 2022, 46, 103817. [Google Scholar] [CrossRef]
- Gökçe, Y. Waste jean derived self N-containing activated carbon as a potential electrode material for supercapacitors. Turk. J. Chem. 2023, 47, 789–800. [Google Scholar] [CrossRef]
- Jagiello, J.; Thommes, M. Comparison of DFT characterization methods based on N2, Ar, CO2 and H2 adsorption applied to carbons with various pore size distributions. Carbon 2024, 42, 1227–1232. [Google Scholar] [CrossRef]
- Barrett, E.P.; Joyner, L.G.; Halenda, P.P. The determination of pore volume and area distributions in porous substances I. Computations from nitrogen isotherms. J. Am. Chem. Soc. 1951, 73, 373–380. [Google Scholar] [CrossRef]
- Aziz, S.B.; Dannoun, E.M.; Abdulwahid, R.T.; Kadir, M.F.; Nofal, M.M.; Al-Saeedi, S.I.; Murad, A.R. The study of ion transport parameters in MC-based electrolyte membranes using EIS and their applications for EDLC devices. Membranes 2022, 12, 139. [Google Scholar] [CrossRef] [PubMed]
- Ma, K.; Zhang, C.; Woodward, C.E.; Wang, X. Bridging the gap between macroscopic electrochemical measurements and microscopic molecular dynamic simulations: Porous carbon supercapacitor with ionic liquids. Electrochim. Acta 2018, 289, 29–38. [Google Scholar] [CrossRef]
- Lu, Y.; Zhang, S.; Yin, J.; Bai, C.; Zhang, J.; Li, Y.; Yang, Y.; Ge, Z.; Zhang, M.; Wei, L.; et al. Mesoporous activated carbon materials with ultrahigh mesopore volume and effective specific surface area for high performance supercapacitors. Carbon 2017, 124, 64–71. [Google Scholar] [CrossRef]
- Suárez, L.; Barranco, V.; Centeno, T.A. Impact of carbon pores size on ionic liquid based-supercapacitor performance. J. Colloid Interface Sci. 2021, 588, 705–712. [Google Scholar] [CrossRef]
- Mei, B.A.; Munteshari, O.; Lau, J.; Dunn, B.; Pilon, L. Physical interpretations of Nyquist plots for EDLC electrodes and devices. J. Phys. Chem. C 2018, 122, 194–206. [Google Scholar] [CrossRef]


| Sample | BET Surface Area (m2/g) | Vtotal (cm3/g, P/P0 ≈ 0.99) | Vmicro (NLDFT) (cm3/g) | Vmeso (cm3/g) | Micropore Fraction (%) | Mesopore Fraction (%) |
|---|---|---|---|---|---|---|
| AC | 1539 | 1.527 | 0.467 | 1.060 | 30.58 | 69.42 |
| AC-400 | 1538 | 1.555 | 0.463 | 1.092 | 29.78 | 70.22 |
| AC-600 | 1502 | 1.515 | 0.451 | 1.064 | 29.77 | 70.23 |
| AC-800 | 1362 | 1.375 | 0.424 | 0.951 | 30.84 | 69.16 |
| Sample ID | Atomic, % | |||
|---|---|---|---|---|
| C | O | P | O/C | |
| AC | 89.2 | 9.8 | 1.0 | 0.11 |
| AC-800 | 94.2 | 4.9 | 0.9 | 0.05 |
Disclaimer/Publisher’s Note: The statements, opinions and data contained in all publications are solely those of the individual author(s) and contributor(s) and not of MDPI and/or the editor(s). MDPI and/or the editor(s) disclaim responsibility for any injury to people or property resulting from any ideas, methods, instructions or products referred to in the content. |
© 2025 by the authors. Licensee MDPI, Basel, Switzerland. This article is an open access article distributed under the terms and conditions of the Creative Commons Attribution (CC BY) license (https://creativecommons.org/licenses/by/4.0/).
Share and Cite
Yurttas, E.; Gokce, Y.; Semerci, N.I.; Yagmur, E.; Aktas, Z. A Novel Triethylammonium Tetrafluoroborate Electrolyte for Enhanced Supercapacitor Performance over a Wide Temperature Range. Processes 2025, 13, 1057. https://doi.org/10.3390/pr13041057
Yurttas E, Gokce Y, Semerci NI, Yagmur E, Aktas Z. A Novel Triethylammonium Tetrafluoroborate Electrolyte for Enhanced Supercapacitor Performance over a Wide Temperature Range. Processes. 2025; 13(4):1057. https://doi.org/10.3390/pr13041057
Chicago/Turabian StyleYurttas, Ezgi, Yavuz Gokce, Nazife Isik Semerci, Emine Yagmur, and Zeki Aktas. 2025. "A Novel Triethylammonium Tetrafluoroborate Electrolyte for Enhanced Supercapacitor Performance over a Wide Temperature Range" Processes 13, no. 4: 1057. https://doi.org/10.3390/pr13041057
APA StyleYurttas, E., Gokce, Y., Semerci, N. I., Yagmur, E., & Aktas, Z. (2025). A Novel Triethylammonium Tetrafluoroborate Electrolyte for Enhanced Supercapacitor Performance over a Wide Temperature Range. Processes, 13(4), 1057. https://doi.org/10.3390/pr13041057