Abstract
This study investigates the activation mechanisms of hydrogen peroxide (H2O2) using iron-activated carbon (Fe2+/H2O2/AC) for the efficient degradation of amoxicillin (AM) in wastewater. The system achieved a high degradation efficiency of 90% under alkaline conditions (pH 9), with singlet oxygen (1O2) and hydroxyl radicals (•OH) identified as the dominant reactive species through scavenger experiments. High-performance liquid chromatography–mass spectrometry (HPLC-MS) analysis revealed degradation by-products and proposed reaction pathways, including the loss of amine groups, ring-opening oxidation, and bond cleavage. The structural and morphological properties of Fe2+/H2O2/AC were characterized using X-ray diffraction (XRD), scanning electron microscopy (SEM), and Brunauer–Emmett–Teller (BET) analysis. The BET surface area of Fe2+/H2O2/AC was determined to be 128.36 m2/g, with a mesoporous structure facilitating efficient mass transfer and adsorption. The system was systematically evaluated under varying conditions, including H2O2 concentration (25–250 mg/L), catalyst dosage (0.05–1.0 mg/L), and pH (3–10). Kinetic analysis revealed that the degradation process follows pseudo-second-order kinetics (R2 = 0.966), while adsorption isotherms were best described by the Langmuir model (R2 = 0.98). Ecotoxicity tests indicated that the degradation products are less harmful to aquatic organisms. The system demonstrated excellent stability over three consecutive cycles, highlighting its potential for long-term application in treating pharmaceutical-contaminated wastewater.
1. Introduction
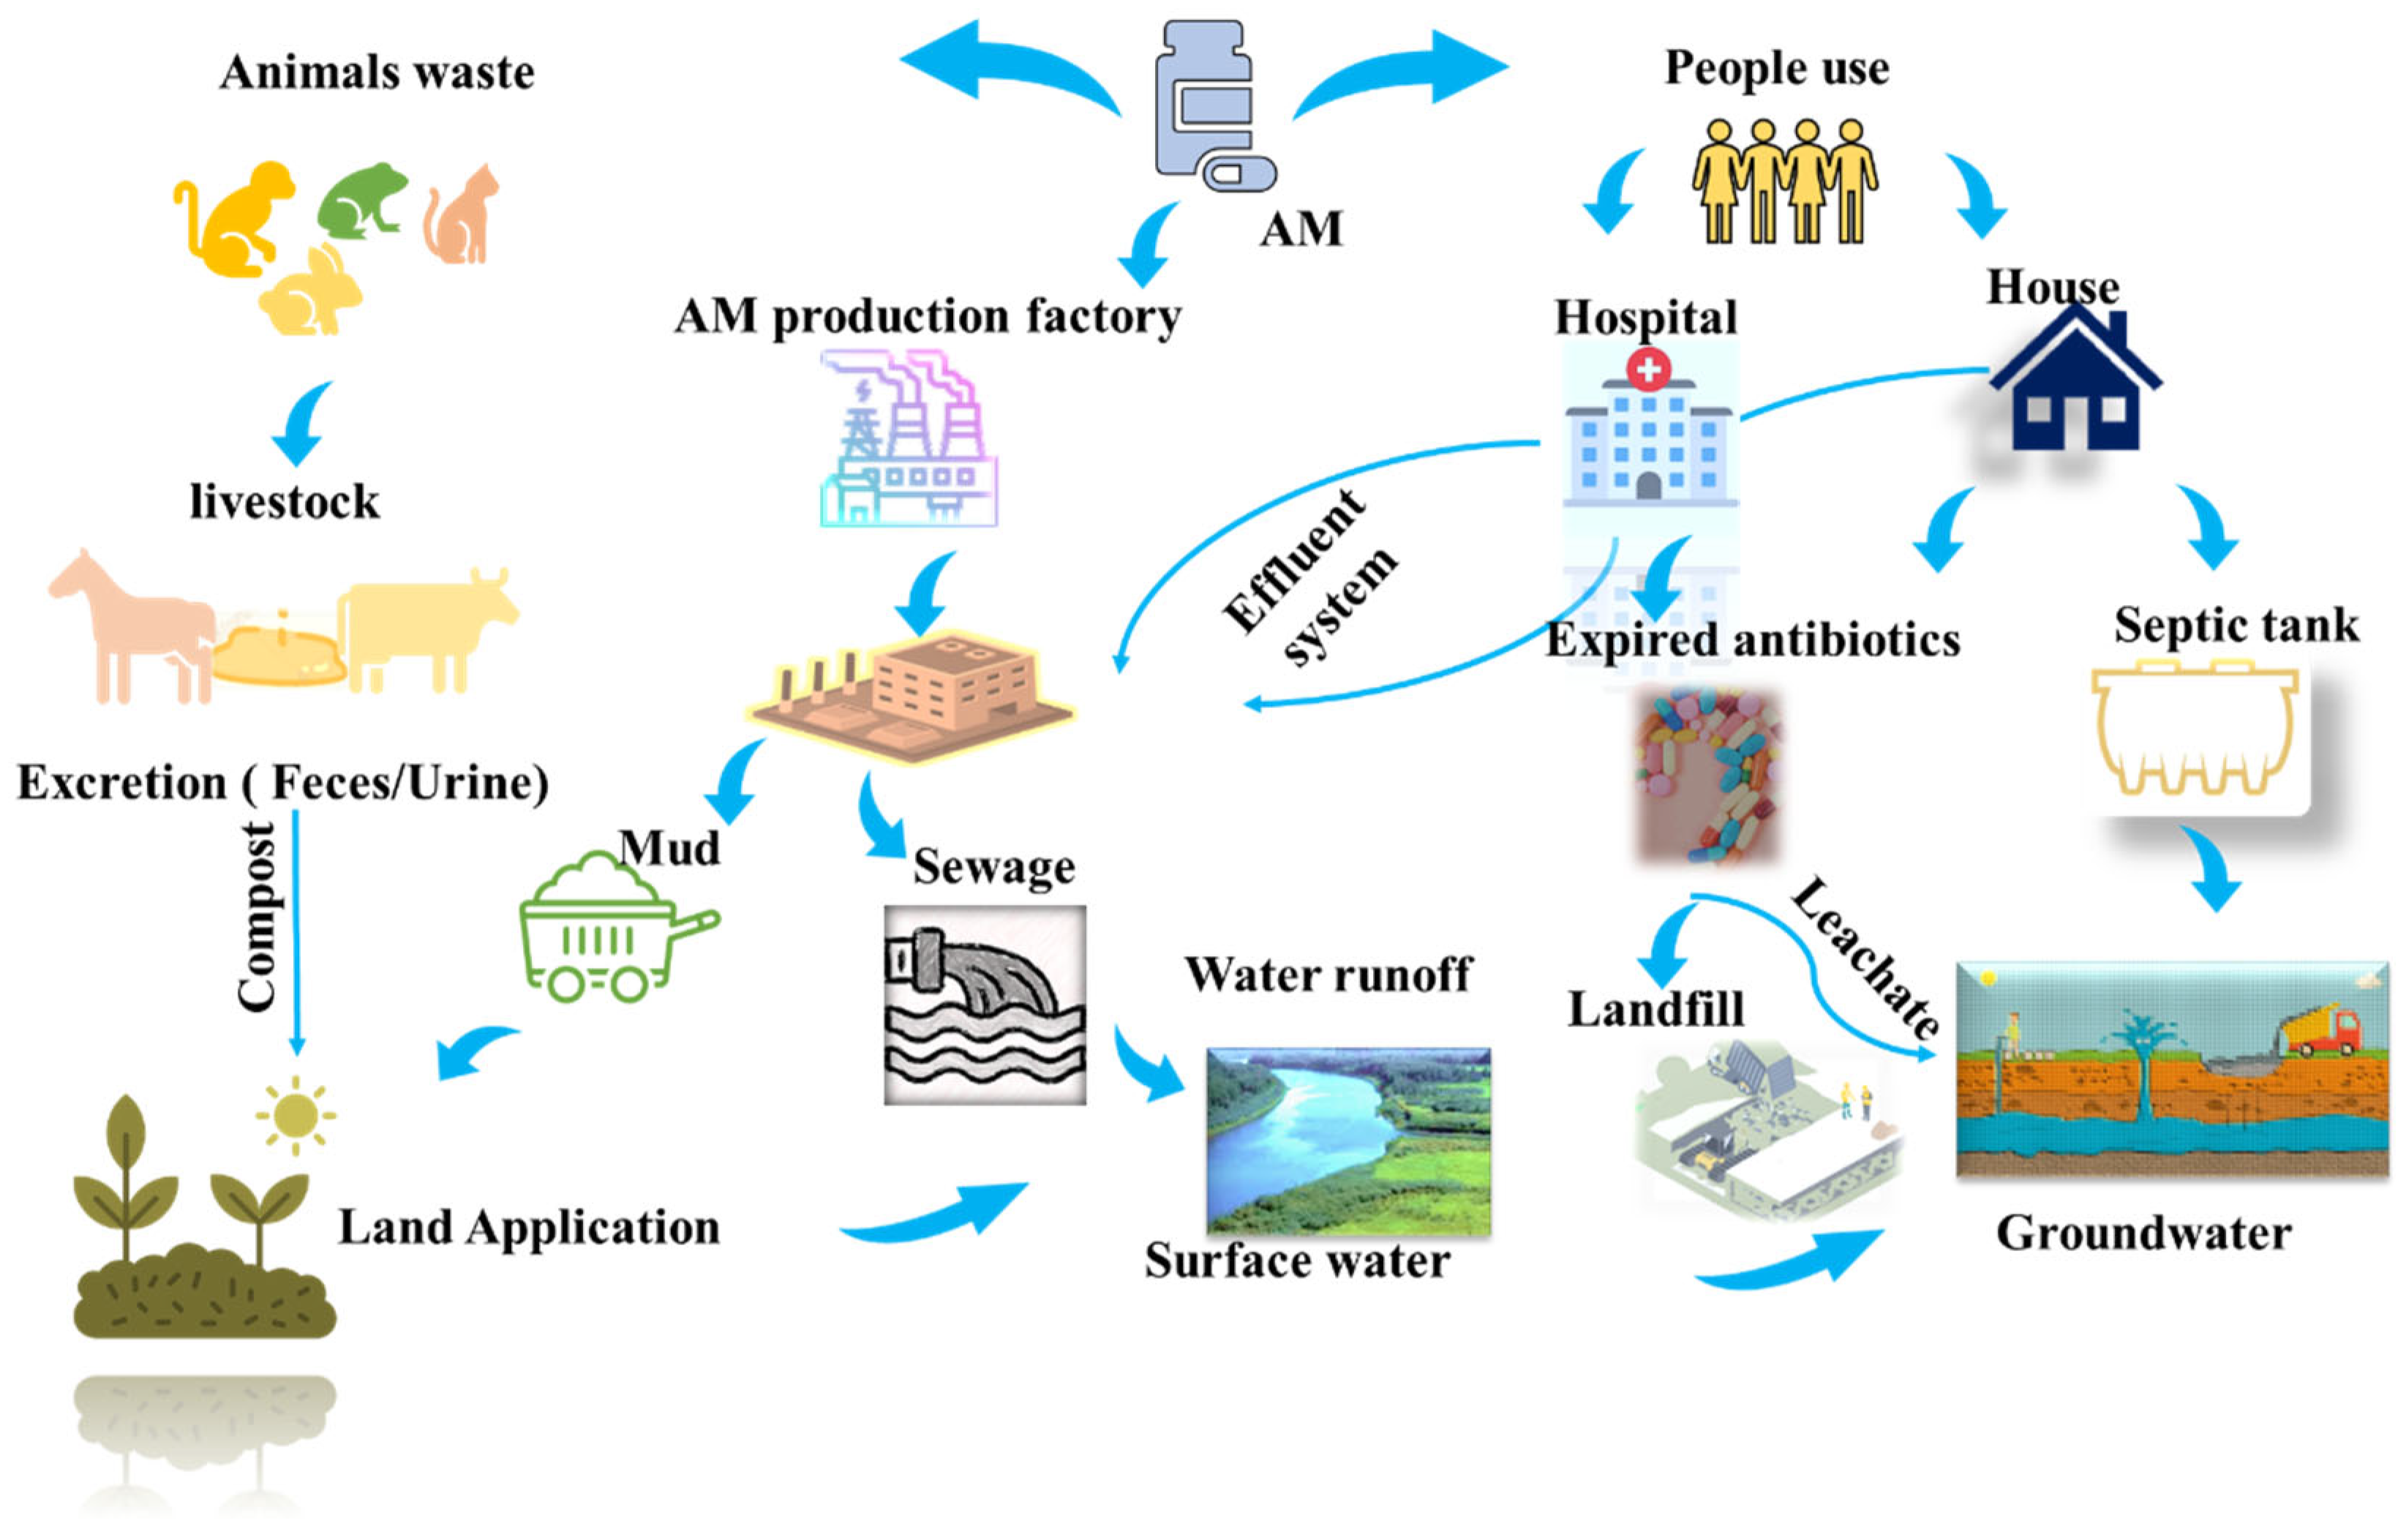
Antibiotic contamination in water systems has emerged as a significant environmental concern. These compounds are detected in effluents at trace concentrations ranging from 100 ng L−1 to 10 μg L−1, while significantly higher levels of 100 to 500 mg L−1 are observed in hospital and industrial wastewater [1]. The presence of antibiotics in the environment is particularly concerning as they act as chemotherapeutic agents that suppress microbial growth, potentially disrupting ecological balance and accelerating the development of bacterial resistance [2]. Amoxicillin (AM), a widely used β-lactam antibiotic, demonstrates broad-spectrum activity against both Gram-positive and Gram-negative bacteria. Its extensive global use makes it an ideal model compound for investigating environmental impacts. After oral administration, only 10–20% of AM is absorbed by the human body, while the remainder is excreted in metabolized and unmetabolized forms through urine and feces, resulting in its direct release into the environment [3]. Antibiotics, including AM, enter the environment through pharmaceutical industries, livestock waste, and wastewater discharge, as depicted in Figure 1. Previous studies highlight the concentrations of antibiotics in aquatic environments. For example, AM concentrations in surface water have been reported to reach up to 48 mg/L, while hospital wastewater has shown AM concentrations ranging from 7.7 to 28 mg/L. These findings underscore the pervasive presence of antibiotics in environmental matrices, raising serious ecological and public health concerns [4]. Mousavi et al. and Zhao et al. studied AM removal from water and wastewater systems at concentrations of 2 to 5 mg/L [5,6]. Moreover, previous studies have indicated that many antibiotics, including AM, are non-biodegradable and persist through conventional wastewater treatment processes, highlighting the urgent need for advanced and effective treatment technologies.
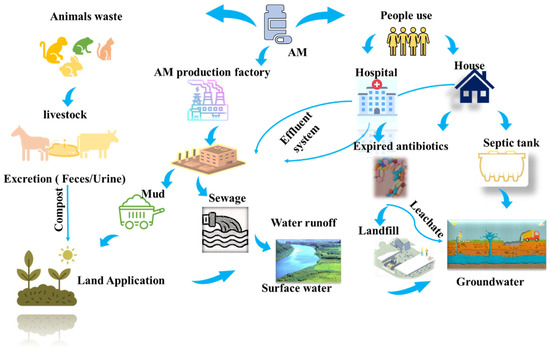
Figure 1.
The sources of amoxicillin (AM) in the environment.
Various methods have been employed for antibiotic removal from wastewater, including ultrafiltration [7], adsorption [8], advanced oxidation processes (AOPs) [9], and biodegradation [10]. Among these, AOPs have demonstrated superior removal efficiency [11]. AOPs encompass a diverse range of techniques, including photocatalysis, sonolysis, UV/H2O2, ozonation, electrochemical oxidation, and Fenton-based processes, all of which generate highly reactive hydroxyl radicals (•OH) [12]. These radicals effectively mineralize pollutants into water and carbon dioxide. Heterogeneous Fenton or Fenton-like processes using solid catalysts have received particular attention due to their effectiveness across a wider pH range than traditional Fenton processes. In conventional Fenton reactions, ferrous ions (Fe2+) activate hydrogen peroxide (H2O2) in solution, facilitating efficient oxidation for the degradation of contaminants such as cyanides [13], phenols [14], organic dyes [15], and various pharmaceutical compounds. However, traditional Fenton reagents are limited to a narrow pH range (3–5). At higher pH levels, •OH generation is suppressed, and Fe3+ precipitates as hydroxide [16].
Fenton oxidation involves the interaction between iron species and H2O2, where H2O2 acts as a strong oxidant [17]. Previous studies have identified cost-effective catalysts, including sulfides, halides, metal oxides, carbides, and hydroxides [18,19]. Among these, activated carbon (AC) has gained recognition as an environmentally friendly adsorbent for antibiotic removal from wastewater. AC serves not only as an adsorbent but also as a solid catalyst or catalyst support in catalytic wet peroxide oxidation processes [20]. The effectiveness of activated carbon is due to its large surface area, diverse functional groups, and highly porous structure. The activation of H2O2 by carbon is a common method for degrading pollutants and regenerating the carbon material [21]. This activation process generates various radicals, including •OH and superoxide radical anions (•OOH/O2•−), which contribute to the decomposition of pollutants [22]. However, its efficiency and the exact mechanisms of •OH generation in the AC/H2O2 system remain unclear. In particular, no studies have systematically compared the performance of both activated carbons modified with ferrous ions in activating hydrogen peroxide for AM removal.
This research gap is critical as it limits our understanding of the efficiency, mechanisms, and optimization of these methods. The innovation of this study lies in its advanced activation method, which provides a comprehensive analysis of AM degradation efficiency using Fenton-based processes. The study examines critical factors influencing antibiotic degradation, such as catalyst concentration, pH, humic acid concentration, and H2O2 dosage. Specifically, this research investigates the activation mechanisms of H2O2 by Fe2+/AC to generate reactive radicals for AM degradation. The study Systematically evaluates the effects of hydrogen peroxide concentration (25–250 mg/L), catalyst dosage (0.05–1.0 mg/L), and pH levels (3–10) on degradation efficiency. Our findings highlight the synergistic roles of •OH and singlet oxygen (1O2) in the degradation process. Furthermore, liquid chromatography coupled with high-resolution mass spectrometry (LC-HRMS) was employed to elucidate the degradation pathways of AM. The prepared catalysts were characterized using a range of advanced techniques, including X-ray diffraction (XRD), scanning electron microscopy (SEM), and high-resolution transmission electron microscopy (HRTEM) used to investigate the nanostructure and crystallinity of the materials, Fourier transform infrared spectroscopy (FTIR), and X-ray photoelectron spectroscopy (XPS). Additionally, kinetic studies were conducted to determine the reaction rates and evaluate the stability of the catalysts over multiple cycles of AM degradation.
2. Materials and Methods
2.1. Determination of Amoxicillin Concentration
The concentration of AM was determined using a high-performance liquid chromatography–mass spectrometer (HPLC-MS, Agilent 1100 Series) equipped with a micro-vacuum degasser, a quaternary pump, a diode array detector (200–800 nm range), and an autosampler for precise sample injection. Data were recorded using ChemStation software (LC-2030). The separation was achieved on a Welch Ultimate® Plus C18 RP-16 amide column (4.6 mm × 250 mm, 5 µm particle size). AM was eluted using a gradient of acetonitrile (solvent A, ≥99.9% purity) and acetate buffer (solvent B, ≥99.9% purity), starting with 5% solvent B for 10 min, followed by a linear increase to 53% solvent B. The flow rate was set at 1.0 mL/min, and AM samples were injected in 40 μL aliquots. The detection wavelength was set to 254 nm, where AM showed its maximum absorbance. The retention time was found to be 6.7 ± 0.34 min, which is consistent with previous reports using similar column setups [23].
2.2. Materials
Amoxicillin (C16H19N3O5, molecular weight: 365.4 g/mol, density: 1.6 ± 0.1 g/cm3, purity >98.0%), obtained from Kosar Pharmaceutical Company, was used in this study. Radical scavengers, including tert-butyl alcohol (≥99.0% purity), L-tryptophan (98% purity), and p-benzoquinone (99% purity), sourced from Macklin Company, were used in the study to neutralize the free radicals. A 1000 mg/L (1000 ppm) stock solution of AM was prepared by dissolving 1 g of the antibiotic in distilled water with the mass measured using a Mettler Toledo digital balance. The solution was prepared fresh daily to prevent degradation or loss of volatiles. Hydrogen peroxide (30% purity) was purchased from Sinopharm Company, China. The pH of the solution was measured using a Seven Compact Duo pH meter (Mettler Toledo, Columbus, OH, USA) and adjusted the pH with HCl or NaOH (98.0% purity, Aladdin, Shanghai, China). Double-distilled water (Milli-Q, Millipore Co., Ltd., Columbus, OH, USA) was used to prepare all working solutions.
2.3. Preparation of Adsorbent
The activated carbon was prepared using the pyrolysis method, which involved heating carbonaceous material at high temperatures in an inert atmosphere. To prepare the adsorbent, 5 g of carbon was immersed in a 25 mL solution of FeSO4·7H2O and stirred for 1 h using a DF101S magnetic stirrer (Shanghai Lichen, Shanghai, China). The mixture was then filtered, and the solid material was oven-dried at 105 °C for 24 h. The dried sample was placed in a tube furnace (SXW-3.6-11, Shanghai Shiyan Electric, Shanghai, China) and heated to 800 °C for 4 h to activate the material. The final catalyst was then stored in sealed bottles at room temperature for further use in experiments.
2.4. Characterization
The morphologies of the samples were analyzed using SEM (FEI Corporation, Hillsboro, OR, USA). HRTEM was performed using a TALOS F200S (FEI Corporation, USA) to further investigate the nanostructure and crystallinity of the materials. XRD patterns were recorded using a D8 ADVANCE diffractometer (Bruker AG, Billerica, MA, USA). FT-IR spectra were obtained using a Regulus 8100 spectrometer (Thermo Fisher, Mundelein, IL, USA). The BET surface areas were determined by N2 adsorption–desorption measurements at 77 K using a Micromeritics ASAP 2460 analyzer. XPS analysis was conducted using an ESCALAB 250Xi (Thermo Fisher, USA) to examine the surface chemical composition and bonding states.
2.5. Catalytic Activity of Fe@AC
The catalytic activity of Fe@AC in a Fenton-like oxidation reaction was evaluated under various experimental conditions, including H2O2 concentration (25, 50, 100, 200, and 250 mg/L), catalyst dosage (0.05, 0.1, 0.25, 0.50, and 1.0 g/L), solution pH values (3, 5, 7, 9, and 10), and initial AM concentration (10, 20, 40, and 60 mg/L). AM degradation by the Fe@AC catalyst was carried out by adding 1.0 g/L of Fe@AC to glass Erlenmeyer flasks, followed by 200 mL of solution containing 0.06 g/L AM. The pH was adjusted to 9 through the dropwise addition of 0.1 M hydrochloric acid or sodium hydroxide (98.0% purity) solutions, with stirring. H2O2 was then added to achieve a concentration of 50 mg/L. The statistical variability in degradation activity under each experimental condition was quantified using the standard deviation, calculated from three repeated trials for each condition. These error bars reflect the inherent variability in degradation activity, providing insight into the uncertainty in catalytic performance across different concentrations, catalyst dosages, and pH values.
2.6. Radical Quenching and Free Radical Capture
Reactive radicals in the catalyst system were identified through quenching and electron paramagnetic resonance (EPR) experiments, where hydrogen peroxide was used to generate these radicals. Hydrogen peroxide was activated by ferrous ions from the catalyst material. A free radical quenching agent was used in the experiments to identify the radicals involved in the Fenton reaction. Tert-butanol is commonly used as a quenching agent for OH, benzoquinone is used for quinone radicals (•Q), and L-tryptophan is employed to capture superoxide anions (•O2⁻) and singlet oxygen (1O2).
3. Results
3.1. Characterization of Fe@AC
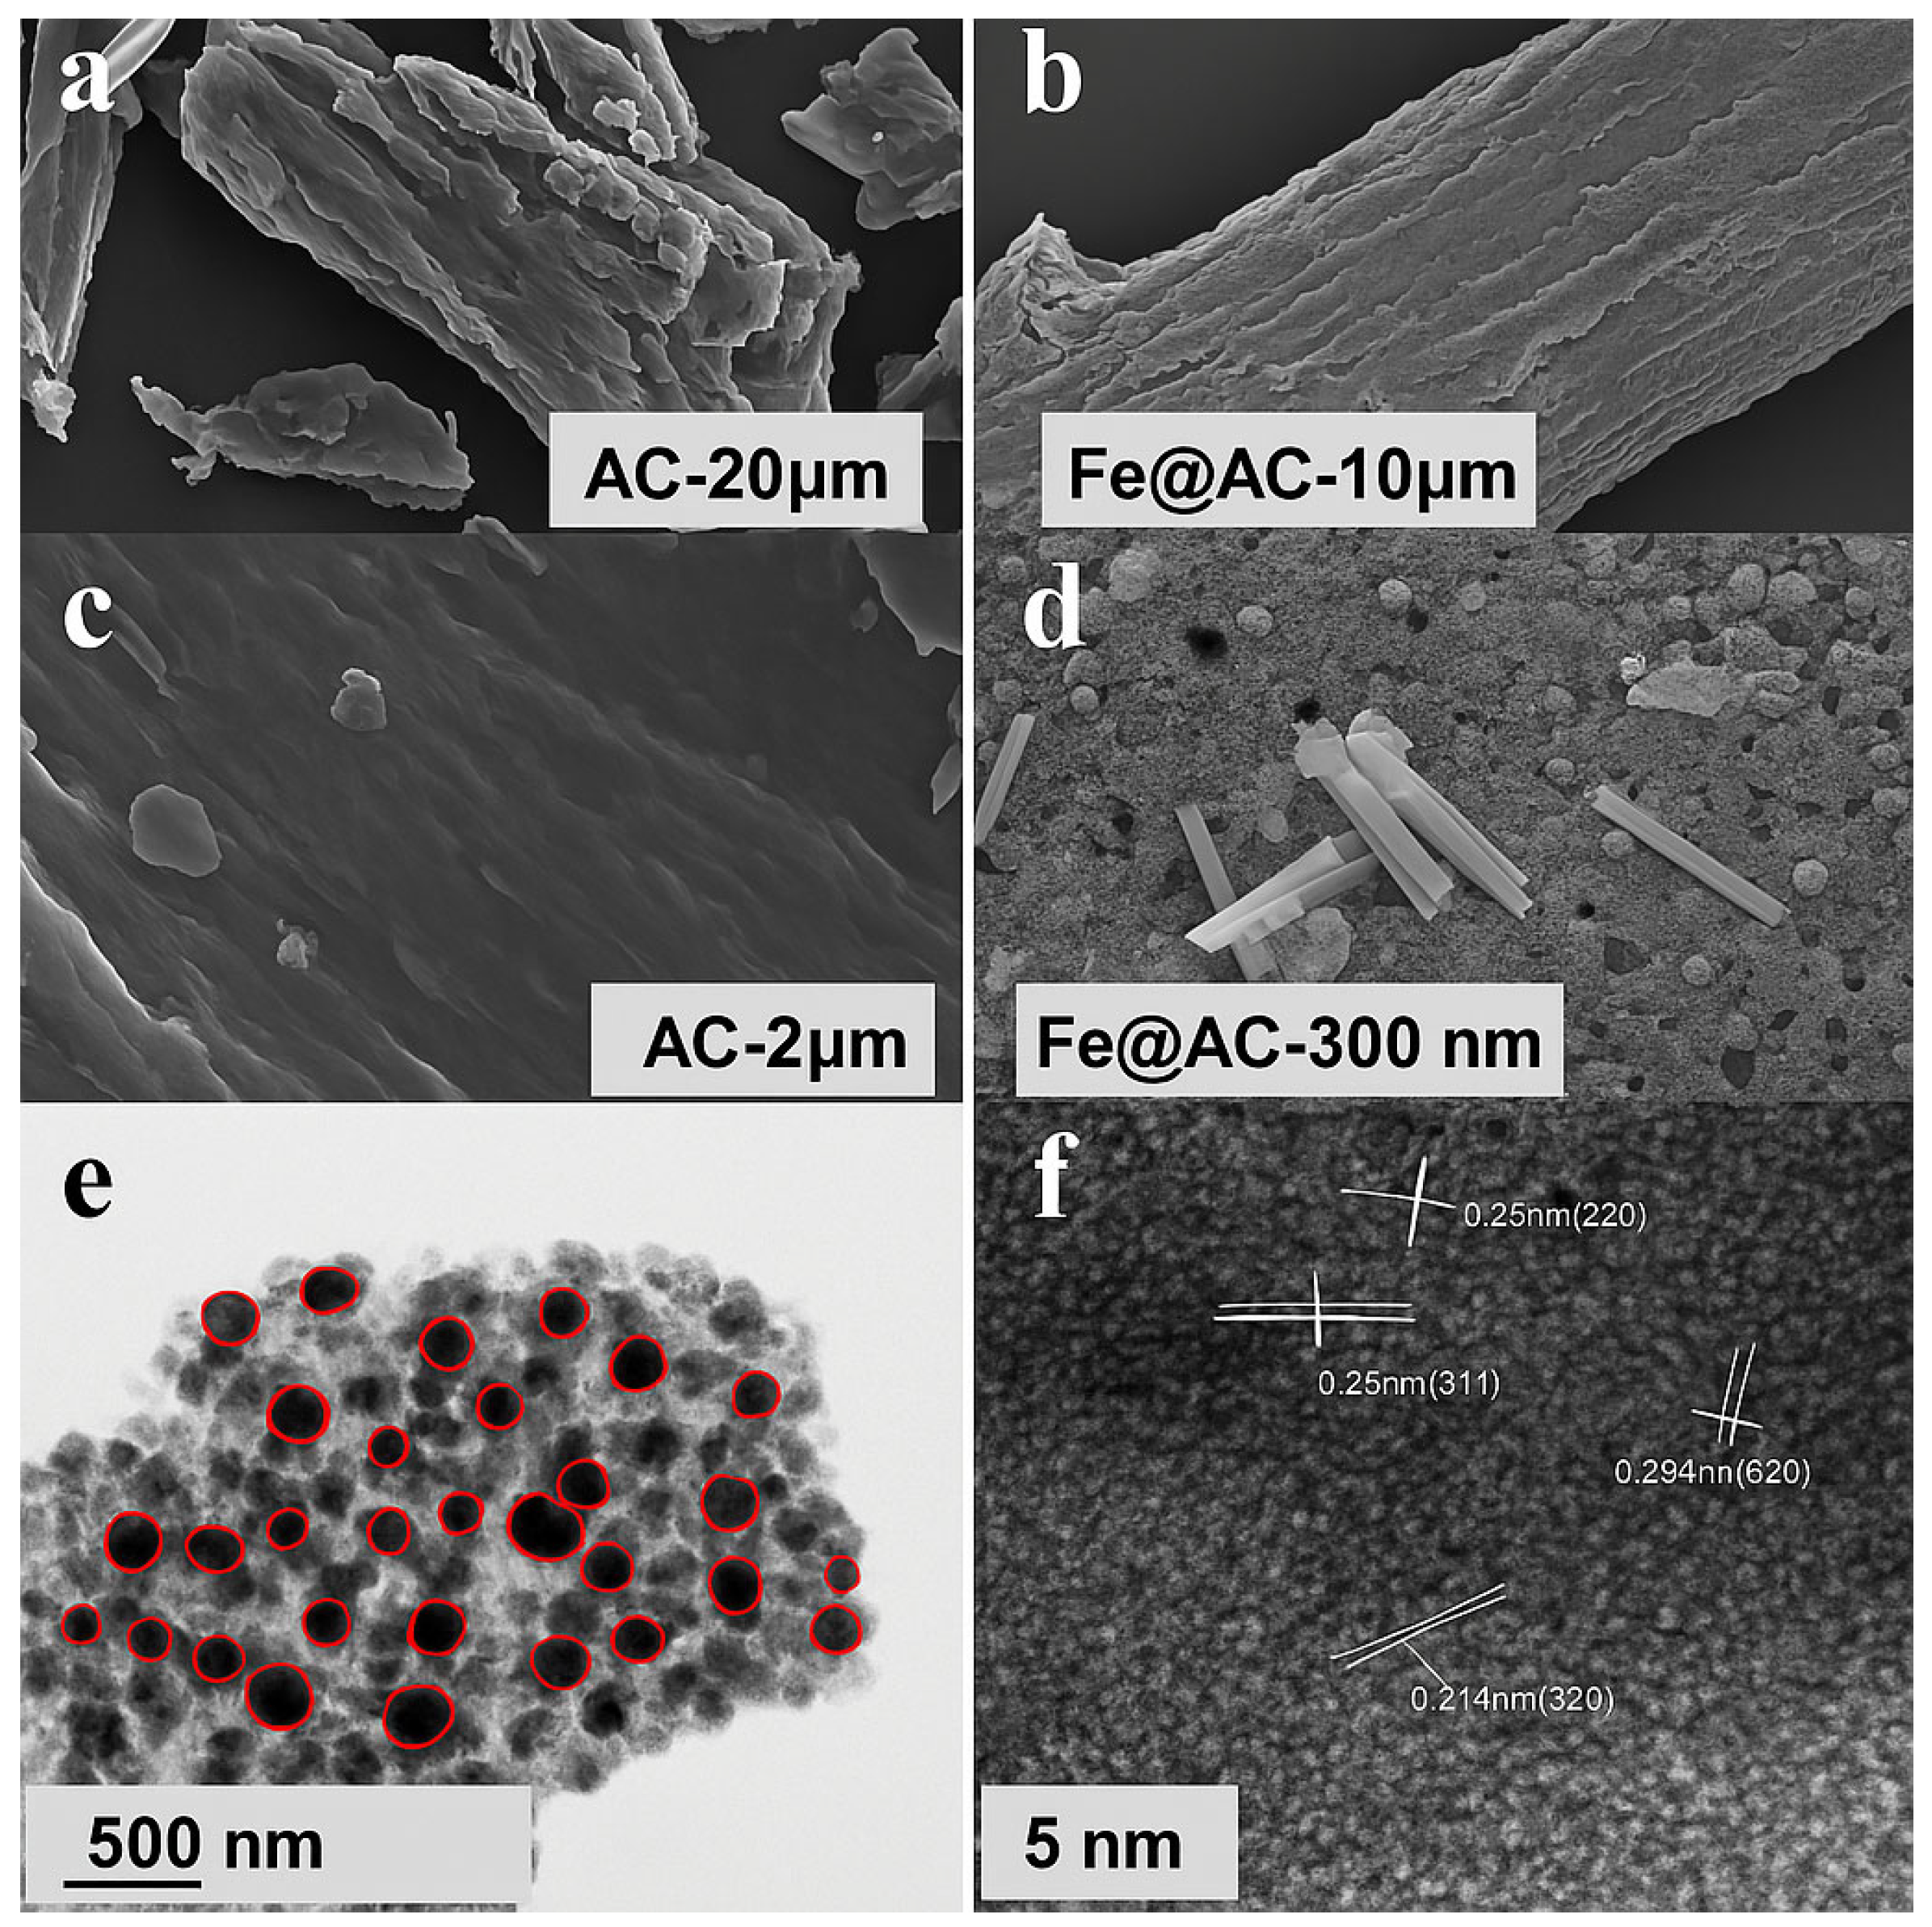
The microstructure of AC and Fe@AC was analyzed using SEM. Transmission Electron Microscopy (TEM) and High-Resolution Transmission Electron Microscopy (HRTEM) were employed to investigate the dispersion of the loaded substance within the biomass-derived carbon pores, enabling visualization of nanoparticle distribution within these pores. The characterization results are presented in Figure 2. AC exhibits a layered structure with hollow pore channels and stacked biomass-derived carbon layers (Figure 2b), forming a porous framework ideal for hosting iron-containing species. Comparative SEM images (Figure 2c,d) reveal stark morphological differences: the pristine AC surface is smooth, whereas Fe@AC displays uniformly dispersed nanoparticles (10–500 nm diameter) on its surface and within pores. This confirms successful iron incorporation during FeSO4 impregnation, which is critical for enhancing catalytic activity. TEM and HRTEM provided further insights into the spatial distribution and crystallinity of the loaded material. HRTEM analysis (Figure 2f) identifies lattice spacings of 0.215 nm, 0.25 nm, and 0.304 nm, corresponding to the (320) plane of hematite (α-Fe2O3), the (311) plane of magnetite (Fe3O4), and the (220) plane of iron carbide (Fe3C), respectively. The spacing of 0.244 nm, initially assigned to metallic Fe (110), likely arises from interfacial Fe3C or strained oxide phases. These findings suggest that Fe3C mediates the interface between carbon and iron/iron oxide phases. The main structure of Fe@AC consists of carbon coated with Fe and FeO, with an Fe3C layer connecting them.
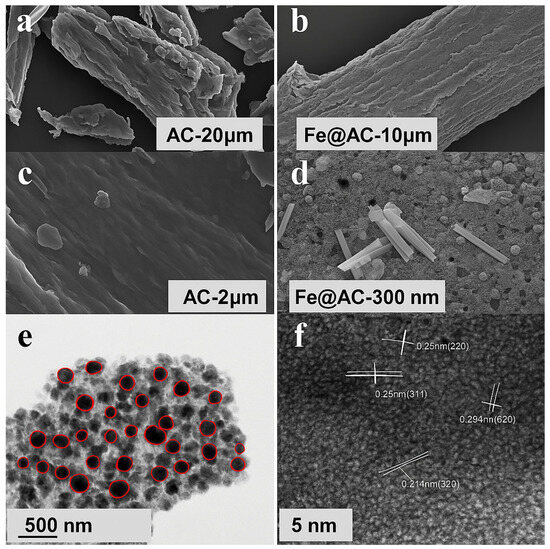
Figure 2.
Scanning electron microscopy images of (a,c) AC and (b,d) Fe@AC; (e) TEM and (f) HRTEM images of Fe@AC with the red circles in highlighting individual iron-based particles, which are well-dispersed throughout the carbon support.
Further characterization was performed using spectroscopic techniques. Figure 3 shows the FTIR spectra of AC and Fe@AC. Fe@AC exhibits absorption bands at 3452 cm⁻1 (O–H stretching), 2885 cm⁻1 (C–H stretching), 966 cm⁻1 (C–O stretching), and 570 cm⁻1 (Fe–O vibrations) [24,25]. The peak at 570 cm−1 further confirms the presence of iron oxides [26,27].
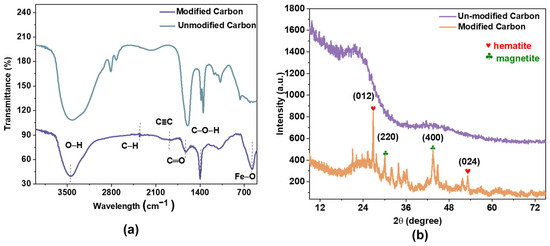
Figure 3.
(a) Fourier transformation infrared and (b) X-ray diffraction of AC and Fe@AC.
The crystalline structure was confirmed by XRD analysis. XRD analysis (Figure 4) confirms hematite (α-Fe2O3, JCPDS 33-0664) and magnetite (Fe3O4, JCPDS 19-0629) as dominant phases in Fe@AC. Peaks at 26.8°, 32.1°, 33.8°, and 51.7° correspond to the (012) and (104) planes of α-Fe2O3 and the (220) and (311) planes of Fe3O4. The peak at 26.8° may also arise from graphitic carbon (002 plane) in the AC substrate [28].
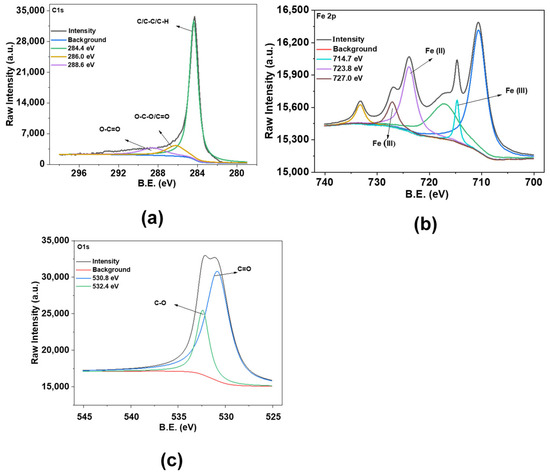
Figure 4.
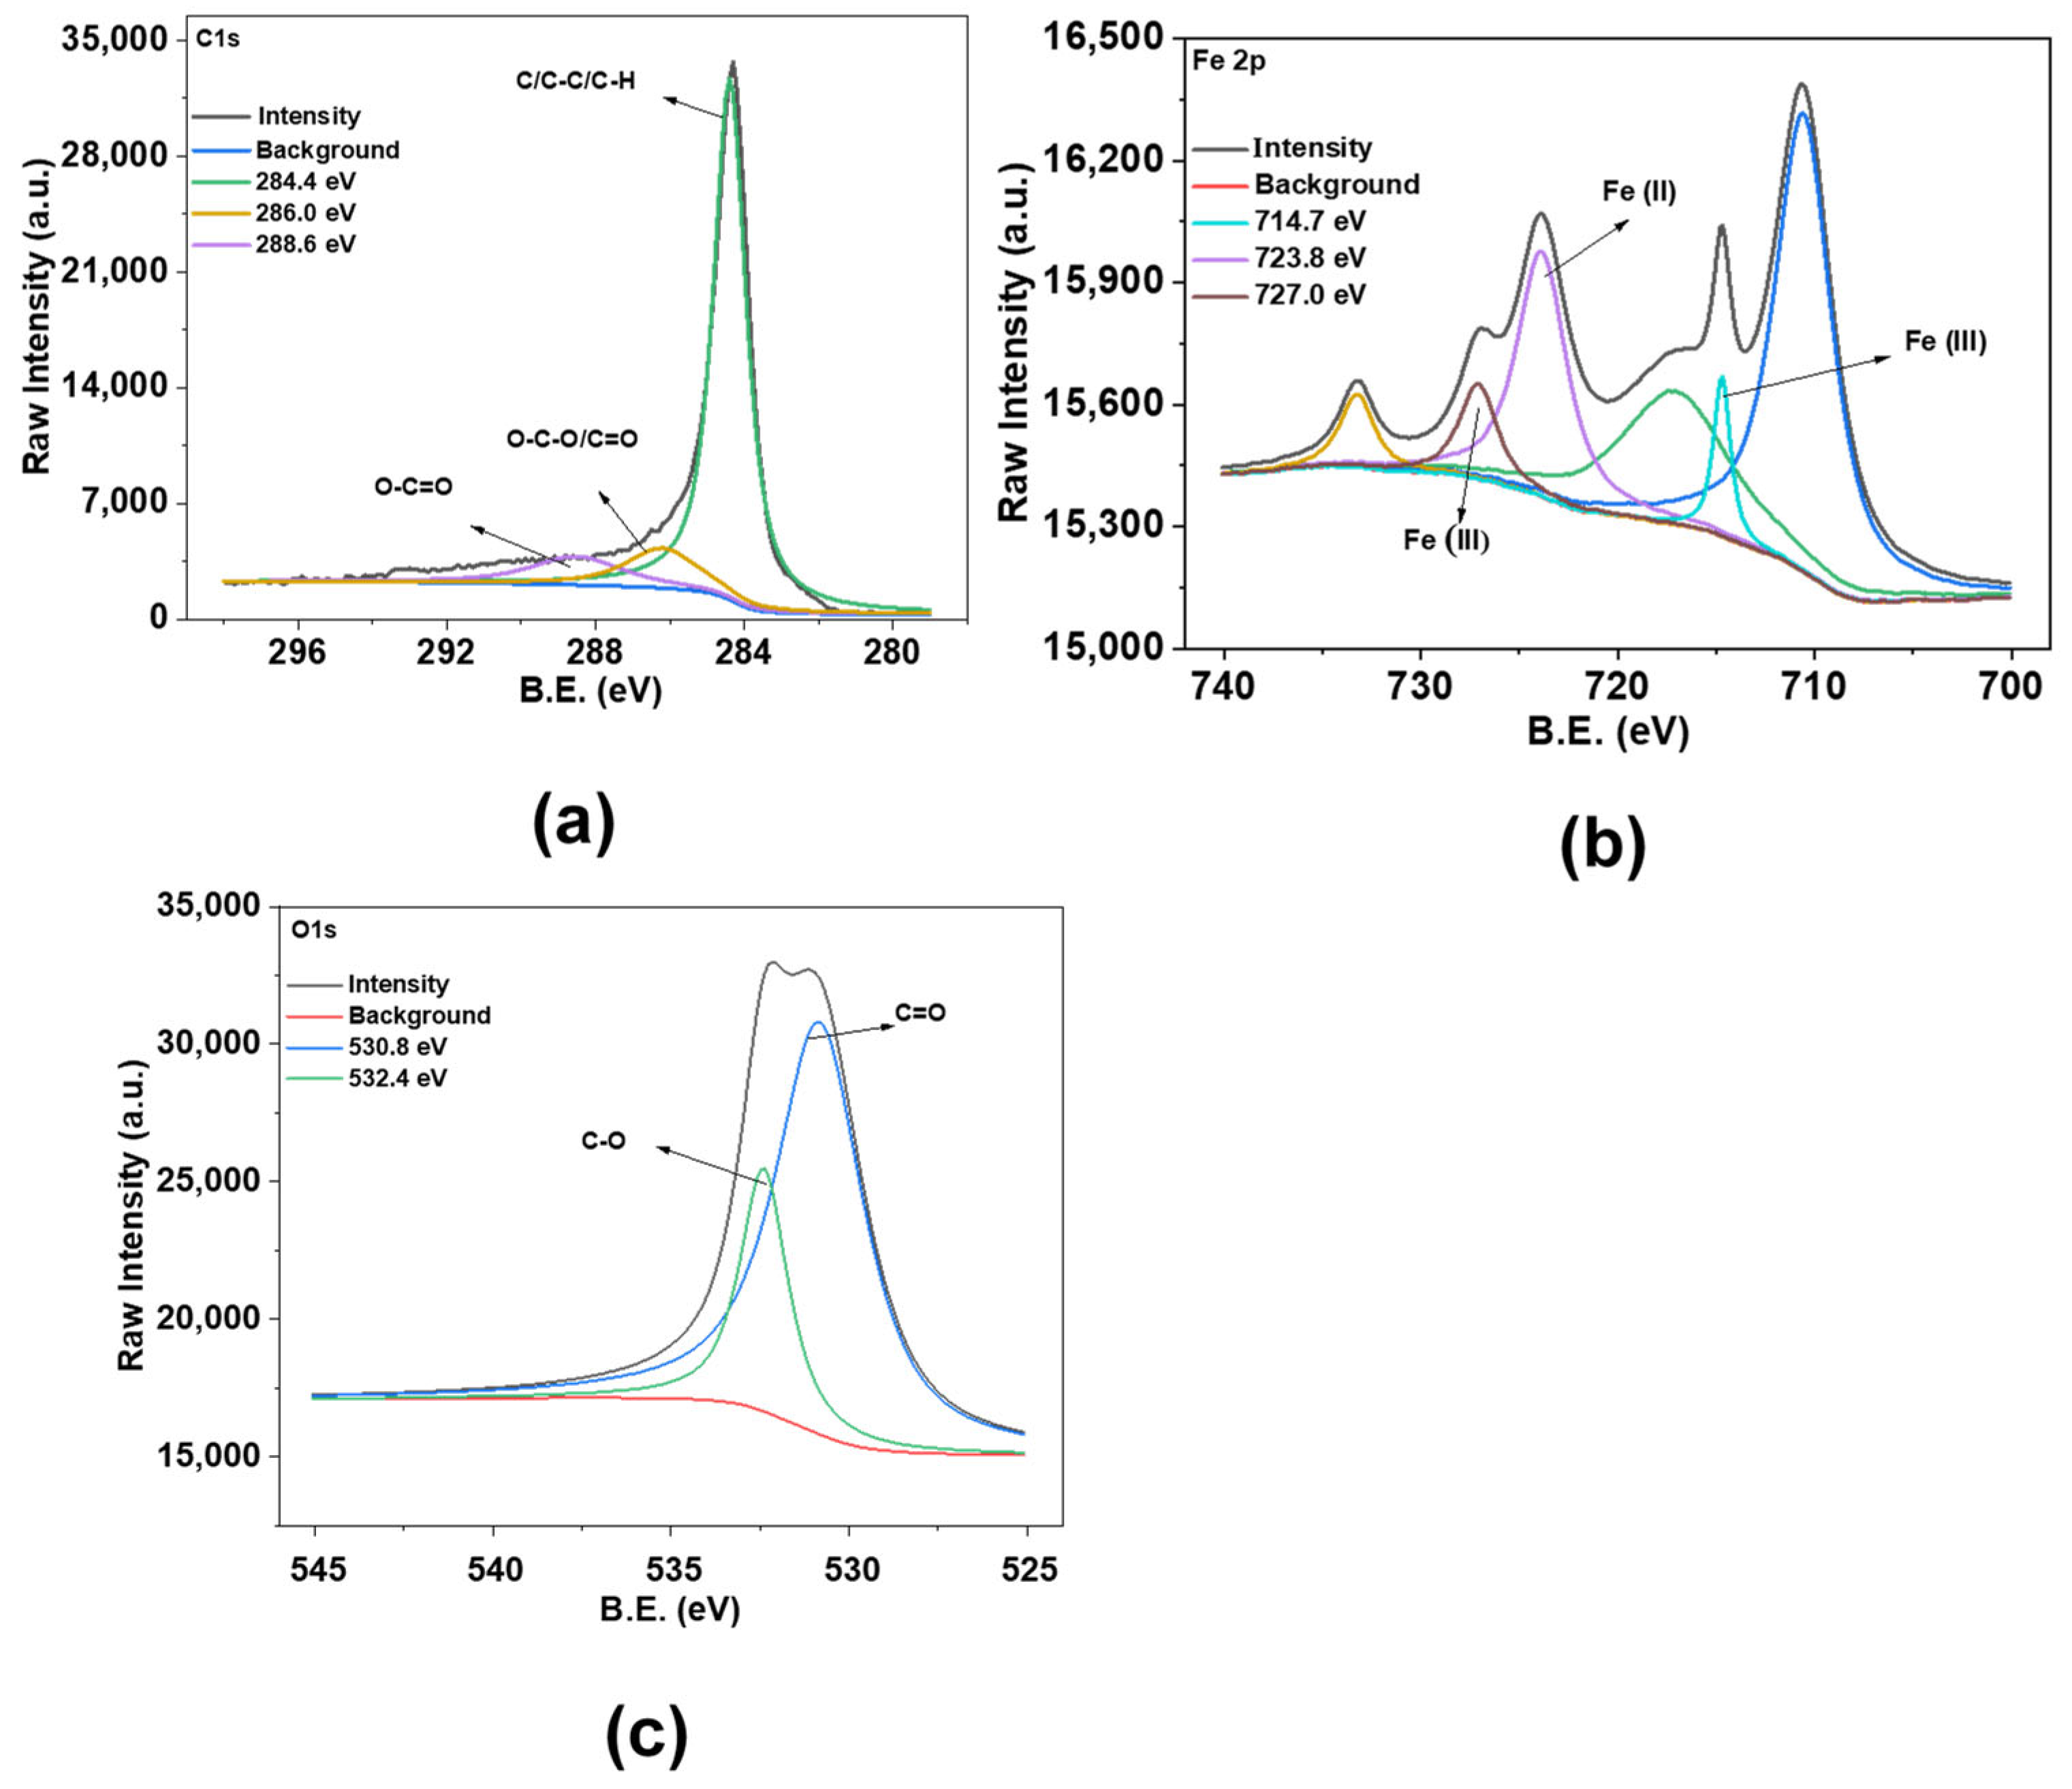
X-ray photoelectron spectroscopy analysis of Fe@AC (a) carbon; (b) iron; and (c) oxygen.
Surface chemical composition was analyzed using XPS. In the XPS spectra of Fe@AC (Figure 4), C1s peaks at 284.4 eV, 286.0 eV, and 288.6 eV suggest the presence of C–C, C–O, and C=O bonding, indicating identical carbon structures. The Fe 2p spectrum exhibits peaks at 710.5 eV (Fe2+ 2p3/2) and 723.8 eV (Fe2+ 2p1/2), alongside contributions at 714.7 eV (Fe3+ 2p3/2) and 727.0 eV (Fe3+ 2p1/2), indicative of mixed Fe2+/Fe3+ states in Fe3O4 [29]. Fe@AC presents O1s peaks at higher energies of 530.8 eV and 532.4 eV, suggesting potential differences in oxygen interactions [30].
3.2. Morphological and Crystallographic Analyses
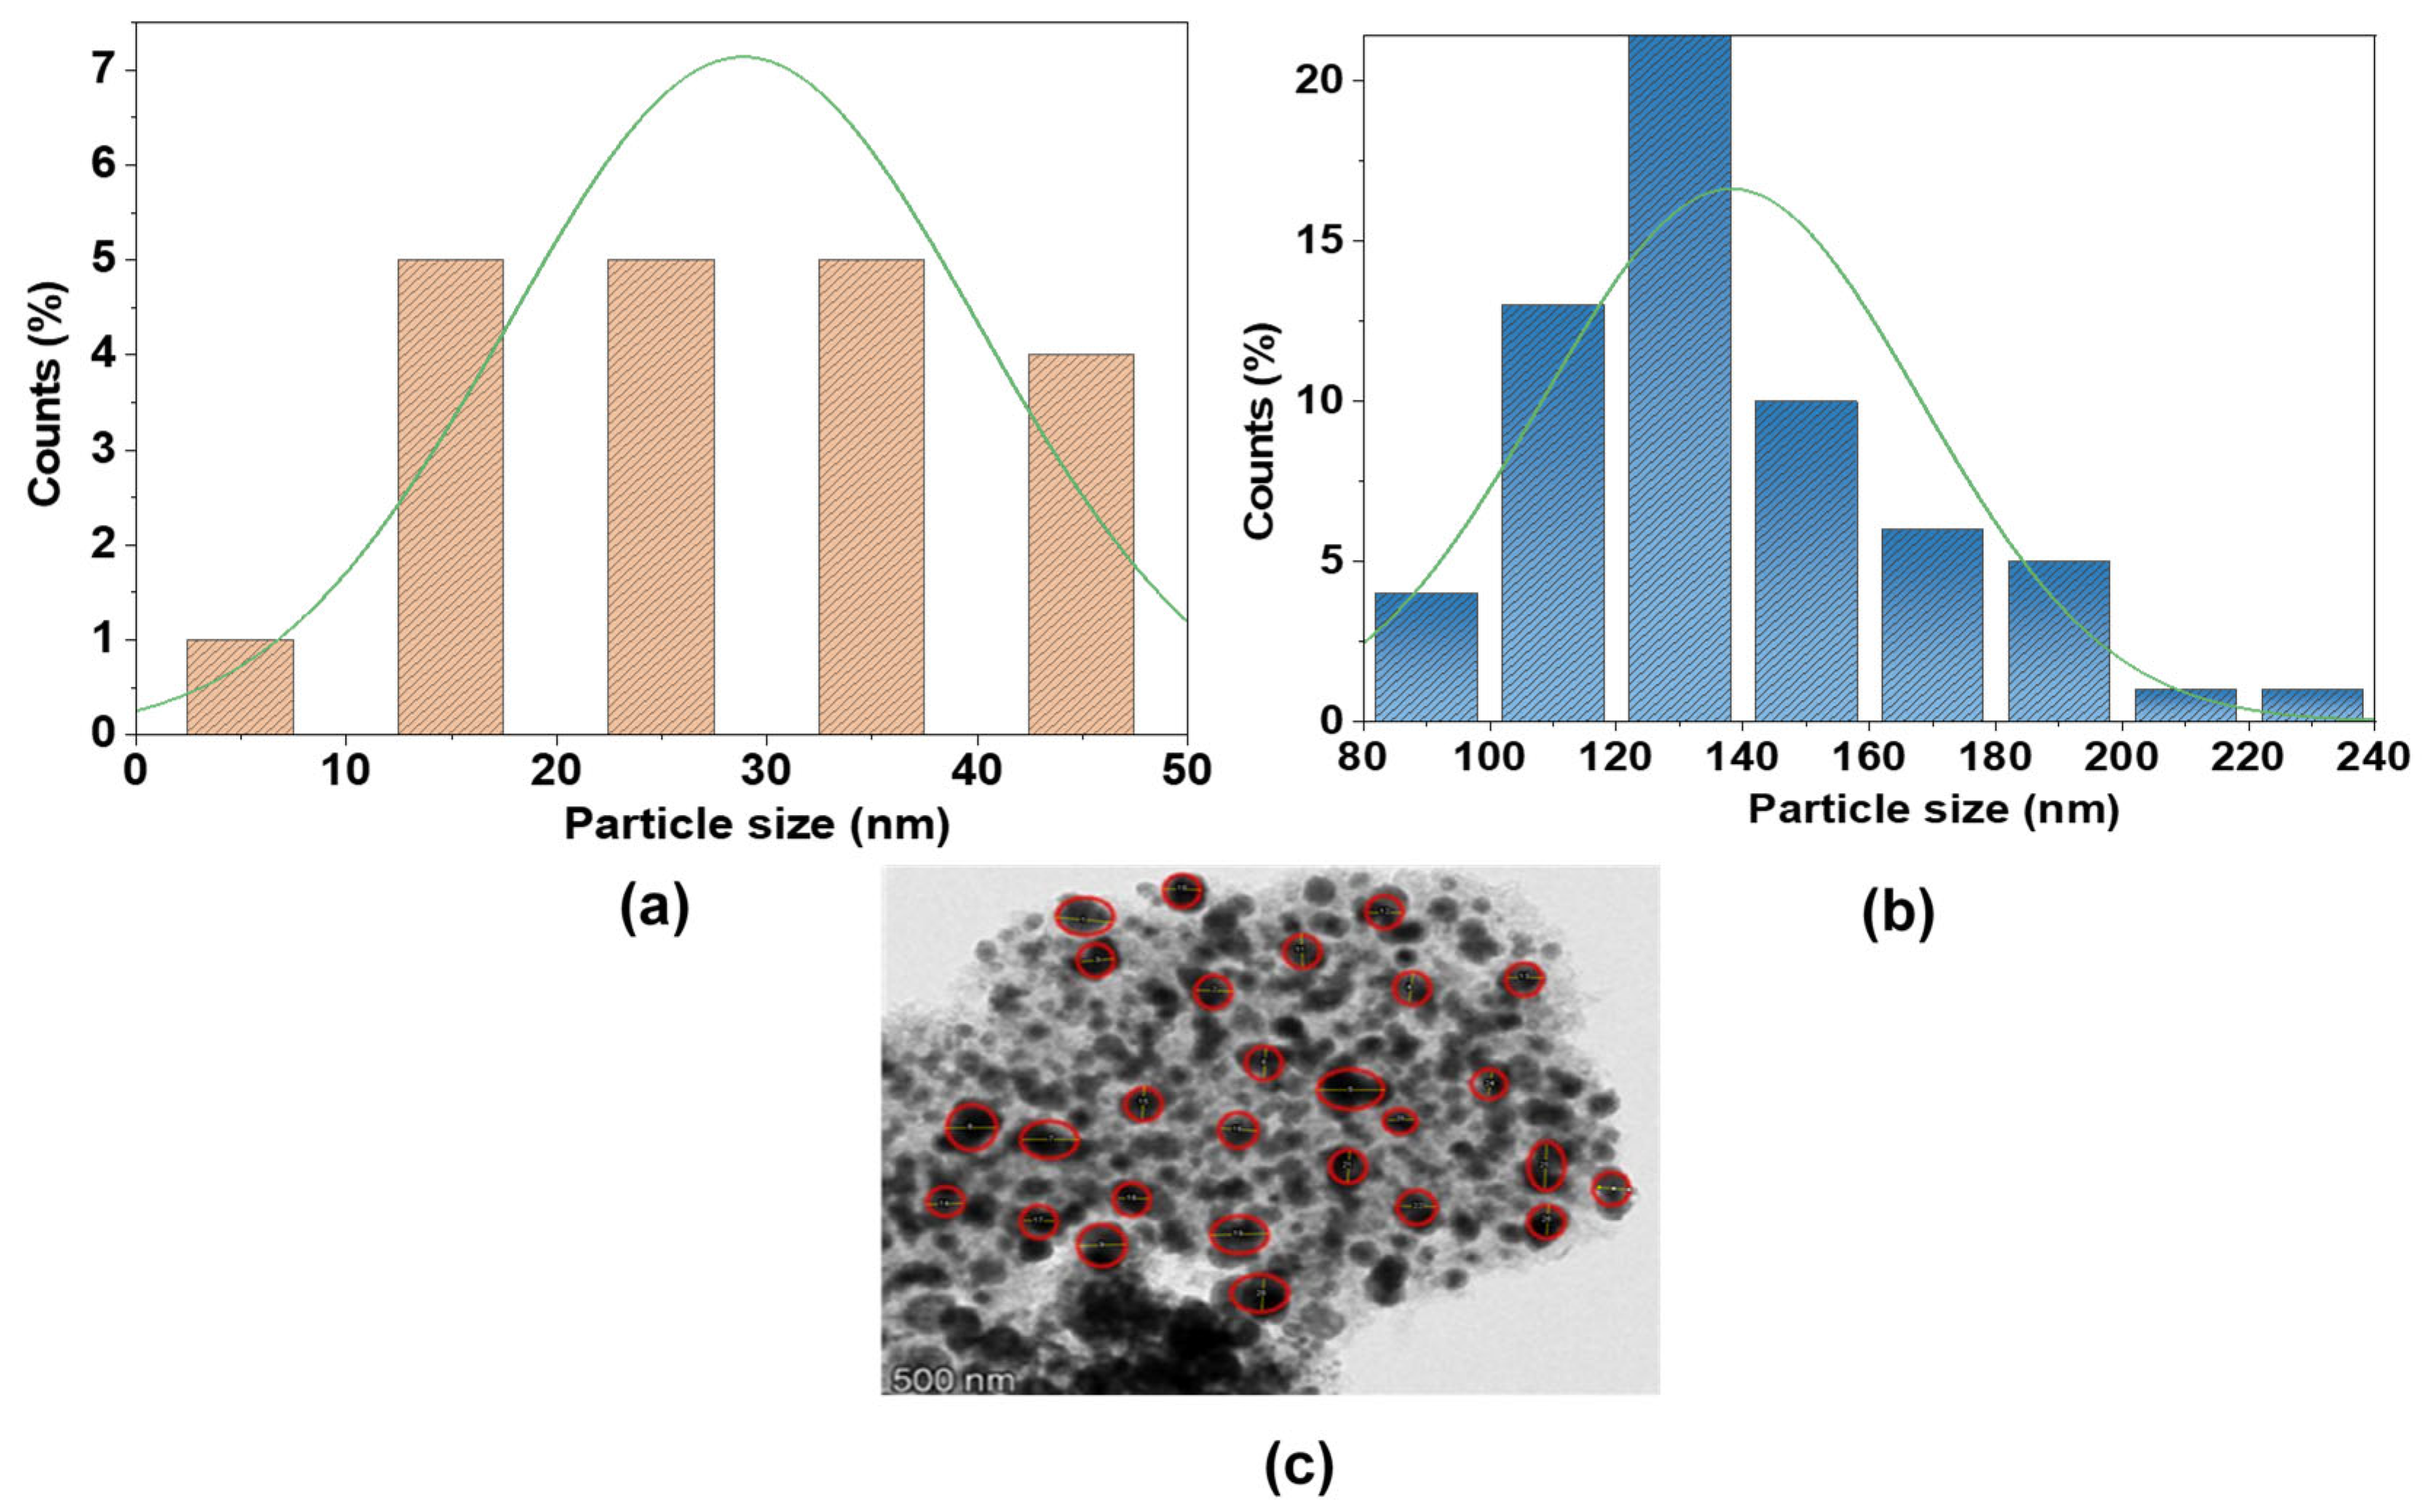
Particle size distributions (Figure 5) and XRD analyses (Tables S1 and S2) elucidate structural differences between AC and Fe@AC. For Fe@AC, the significantly larger mean particle size of 138 nm (Figure 5b) aligns with XRD-identified magnetite (Fe3O4) and hematite (α-Fe2O3) phases (Table S1). The prominent magnetite (220) peak at 30.38° (JCPDS 19-0629) and hematite (024) peak at 35.82° (JCPDS 33-0664) suggest these oxides drive particle agglomeration. Conversely, AC exhibits a smaller mean particle size (28.87 nm, Figure 5a), consistent with its turbostratic carbon structure (Table S2), characterized by disordered graphitic layers with d-spacing (3.39–4.04 Å) that enhance surface area and reactivity. This integration of crystallographic and morphological analyses not only clarifies structure-property relationships but also advances the design of carbon-supported composites for catalytic or adsorptive applications.

Figure 5.
Particle size histograms deduced from the SEM images for (a) AC; (b,c) Fe@AC.
3.3. Brunauer–Emmett–Teller
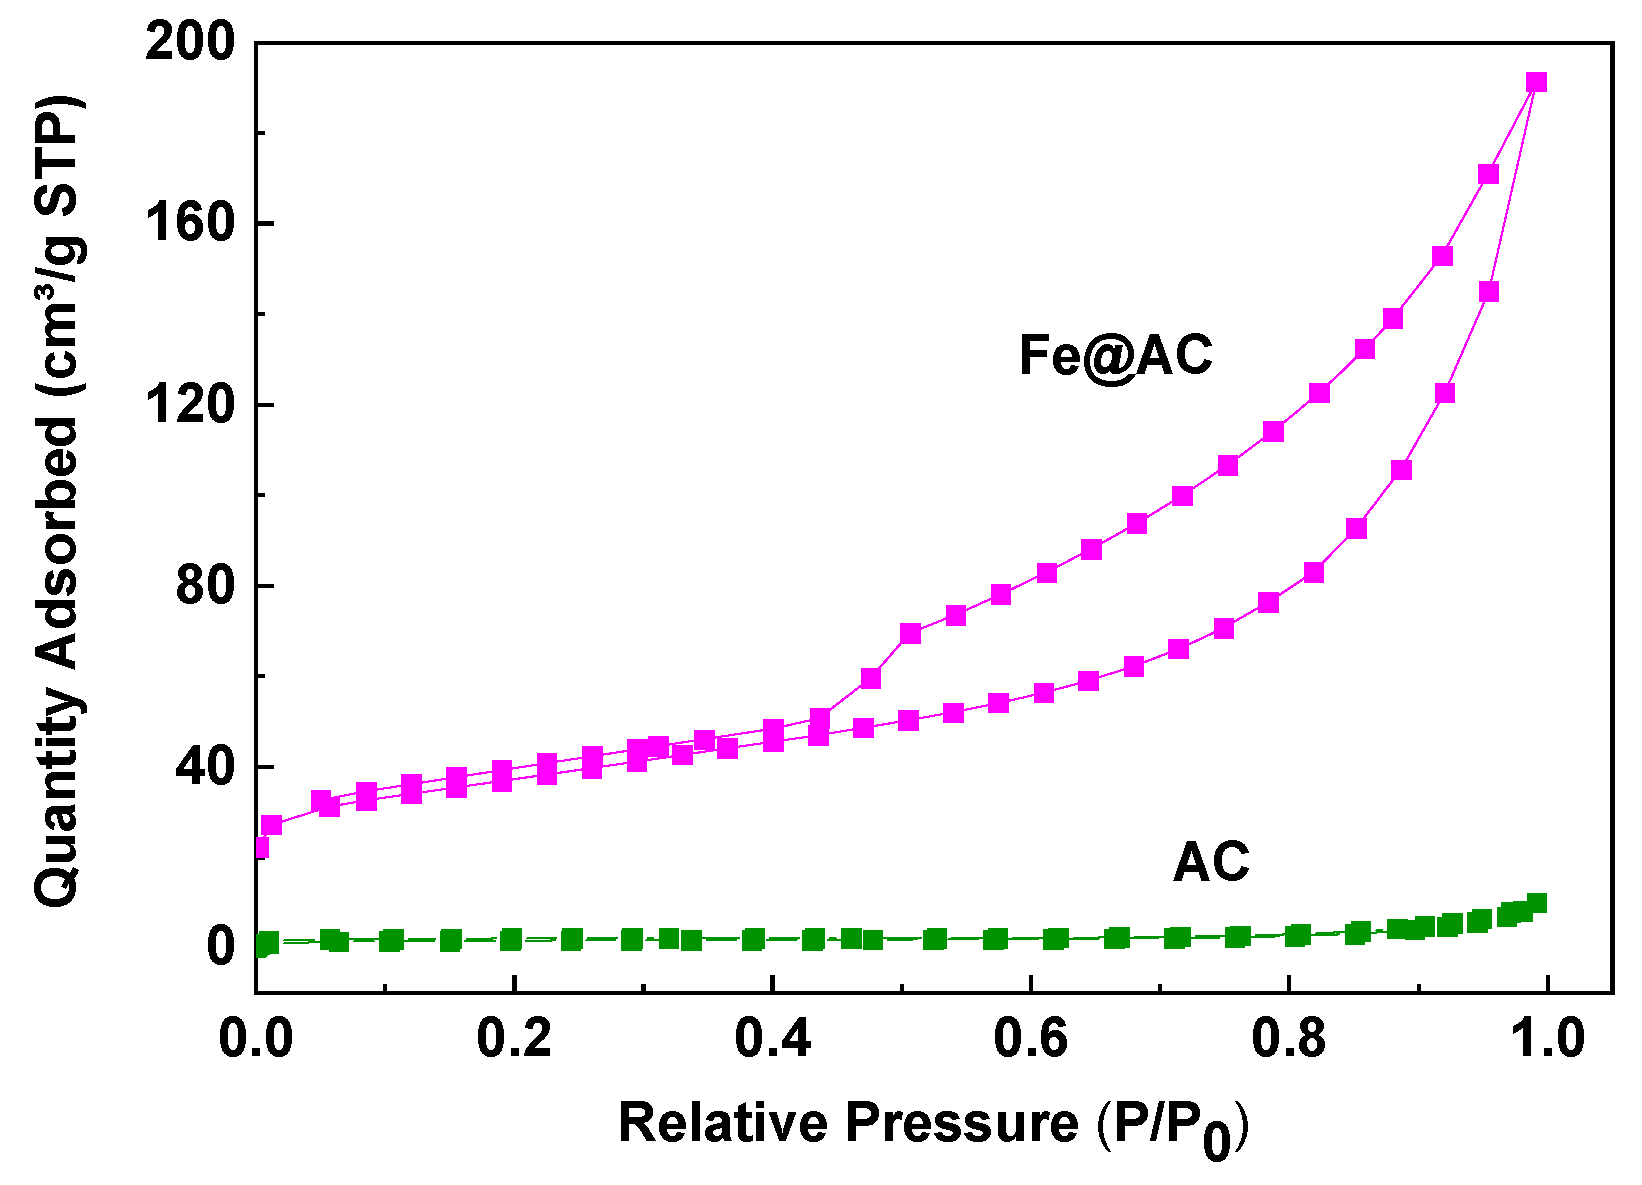
As shown in Figure 6, the N2 adsorption/desorption isotherms of AC and Fe@AC are presented. The isotherm for AC corresponds to Type I, indicating a microporous structure, with a specific surface area of 146.15 m2/g. In contrast, Fe@AC exhibits a Type IV isotherm, which resembles Type II isotherms at low relative pressures. At higher relative pressures (P/P0 > 0.5), Fe@AC exhibits capillary condensation, resulting in a hysteresis loop, which is characteristic of mesoporous materials. This type of isotherm corresponds to a mesoporous structure, which facilitates the adsorption of larger molecules like AM due to its larger pore size. The BET surface area of Fe@AC is 128.36 m2/g, lower than AC (146.15 m2/g). This decrease is likely due to the filling or blockage of micropores in AC by Fe and its oxides, which occupy much of the pore volume and reduce the average pore diameter. Additionally, the carbon in thin sheets may wrap around the spherical Fe and its oxides, further reducing the surface area. The BET data are presented in Table 1. The mesoporous structure of Fe@AC enhances the adsorption of larger molecules like AM by providing larger pores and better mass transfer. The incorporation of iron into the activated carbon matrix introduces additional active sites for adsorption and catalytic degradation, compensating for the reduced surface area. These findings demonstrate that the mesoporous structure and iron modification of Fe@AC significantly enhance its effectiveness for AM removal from wastewater.

Figure 6.
The Brunauer–Emmett–Teller surface area analysis of the unmodified (AC) and iron-modified (Fe@AC) carbon.

Table 1.
The Brunauer–Emmett–Teller data of unmodified and iron-modified carbon.
4. Discussion
4.1. Parameters
4.1.1. Effect of H2O2
The effect of H2O2 concentration was investigated by varying the concentrations (25, 50, 100, 200, and 250 mg/L), at a constant Fe@AC concentration of 1.0 mg/L and pH 9.0. An increase in H2O2 concentration from 25 mg/L to 250 mg/L initially enhanced the rate of AM degradation, as shown in Figure 7a. The initial H2O2 concentration significantly affects AM degradation, as it is directly related to the generation of •OH and •OOH radicals in the Fenton-like oxidation reaction with Fe@AC. For Fe@AC with H2O2 concentrations ranging from 25 mg/L to 250 mg/L, the AM degradation rate decreased from 85% at 25 mg/L to 68% at 250 mg/L. At initial H2O2 concentrations of 25 and 50 mg/L, AM was completely removed from the solution within 25 min. The degradation rate of organic pollutants generally increases with H2O2 concentration until the threshold is reached. However, when the H2O2 concentration exceeds a critical threshold, the degradation rate decreases due to the scavenging effect of excess H2O2. Many researchers have reported similar findings [31,32,33,34].
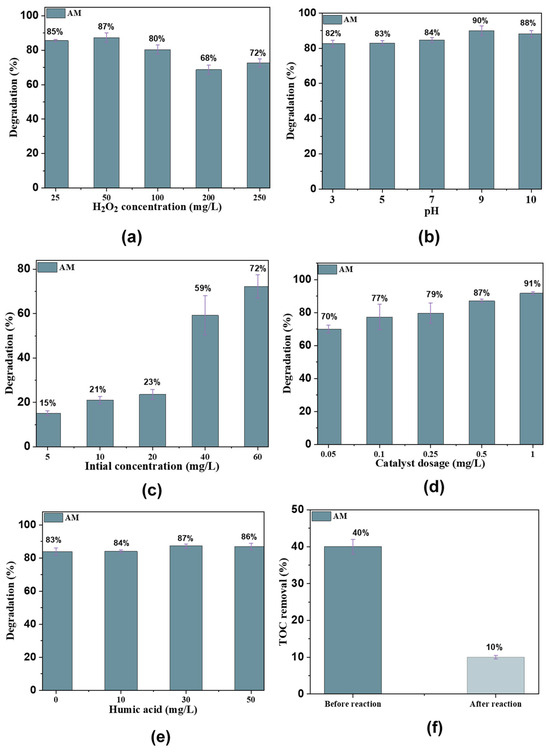
Figure 7.
(a) The effect of H2O2 concentration; (b) pH solution; (c) catalyst dosage; (d) antibiotic concentration; (e) humic acid; and (f) TOC removal in the Fe2+/H2O2/AC system.
4.1.2. Effect of pH
The effect of initial pH on AM degradation by the Fe@AC/H2O2 is shown in Figure 7b. In this study, pH was varied between 3 and 10. The maximum degradation efficiency of AM, approximately 90% within 25 min, was observed at pH 9. This sharp rise indicates a significant improvement in reaction conditions, leading to a much higher rate of degradation. At pH 10, the efficiency slightly decreases to 85%. which could be attributed to the precipitation of iron species or reduced stability of reactive oxygen species under highly alkaline conditions. In contrast, at pH 3, the degradation efficiency was relatively low at 82%, likely due to the suppression of •OH generation and the instability of Fe2+ in highly acidic environments. The observed pH dependence can be explained by considering the pKa values of AM and their influence on the degradation process. AM has three pKa values: pKa1 ≈ 2.4 (carboxylic acid group), pKa2 ≈ 7.4 (amine group), and pKa3 ≈ 9.6 (phenolic group). At pH 9, AM predominantly exists in its anionic form due to the deprotonation of the carboxylic acid group (pKa1) and the amine group (pKa2). This anionic form promotes stronger electrostatic interactions with the positively charged Fe2+ species or the AC surface, facilitating better adsorption and subsequent oxidation. Additionally, the higher pH favors the Fenton-like reaction by maintaining Fe2+ stability and enhancing •OH generation, which drives the degradation process [23,35,36].
At lower pH 3 values, AM may exist in a zwitterionic form, where the carboxylic acid group is protonated (neutral) and the amine group is positively charged. This zwitterionic form hinders adsorption on the catalyst surface due to weaker electrostatic interactions, resulting in lower degradation efficiency. Furthermore, at very low pH, the Fenton reaction is less efficient due to the instability of Fe2+ and reduced •OH generation [37,38].
4.1.3. Effect of Antibiotic Dosage
The effect of AM concentration on degradation was evaluated over a range of 5, 10, 20, 40, and 60 mg/L, using a Fe@AC dosage of 1.0 g/L, an H2O2 concentration of 25 mg/L, and a pH of 9 (Figure 7c). The degradation rate of AM by Fe@AC increased to 15, 21, 23, 59, and 72% as the AM concentrations increased to 10, 20, 40, and 60 mg/L, respectively. This trend suggests that higher AM concentrations facilitate more effective degradation, likely due to increased interactions between AM molecules and •OH.
The abrupt increase in degradation rate from 20 mg/L to 40 mg/L can be attributed to several factors. At lower AM concentrations (5–20 mg/L), the availability of AM molecules is limited, and the •OH generated by the Fenton-like reaction may not be fully utilized, resulting in lower degradation rates. However, as the AM concentration increases to 40 mg/L and beyond, the number of AM molecules available for interaction with •OH radicals increases significantly. This higher concentration of AM molecules enhances the probability of collisions between AM and •OH radicals, leading to a more efficient degradation process. Additionally, at higher AM concentrations, the adsorption of AM onto the Fe@AC surface may increase due to the higher driving force for mass transfer. This improved adsorption facilitates closer proximity between AM molecules and the reactive sites on the catalyst surface, further enhancing the degradation efficiency. The observed trend aligns with previous studies, which have reported similar concentration-dependent behavior in Fenton-like systems [39,40].
4.1.4. Effect of Catalyst Dosage
The degradation of AM by Fe@AC was investigated at dosages ranging from 0.05 to 1.0 g/L to determine the optimum Fe@AC dosage in a Fenton-like oxidation reaction. The degradation rate of AM at Fe@AC dosages of 0.05, 0.1, 0.25, 0.50, and 1.0 g/L was 70, 77, 79, 87, and 91%, respectively (Figure 7d), with a reaction time of 25 min. AM removal efficiency reached 91% when the catalyst dosage increased from 0.05 to 1.0 g/L. Notably, a higher catalyst amount provided more surface area for the degradation. Increased contact between the pollutant and catalyst led to enhanced degradation efficiency. Another possible reason for this phenomenon is the increase in the number of active sites on the catalyst surface. This enhancement also results from the increased FeO quantities on the surface of the adsorbent, leading to more reactive components [41,42].
4.1.5. Effect of Humic Acid and TOC
Humic acid (HA) significantly influences AM removal efficiency by Fe@AC. In the absence of HA, Fe@AC exhibits a high removal rate (90%) for AM, as shown in Figure 7e. However, increasing HA concentration reduces AM removal efficiency, reaching 60% at 20 mg/L due to competitive adsorption. The presence of HA slows adsorption rates by blocking active sites and influencing electrostatic interactions [43]. Total organic carbon (TOC) was initially 100% before the reaction started. After adding modified carbon and hydrogen peroxide, TOC decreased from 40% to 10% within 25 min (Figure 7f).
Table 2 lists iron-based materials for degradation efficiency and stability of various activation systems for antibiotic degradation using hydrogen peroxide, along with catalysts and conditions. Iron (Fe2+/Fe3+) plays a critical role in these systems by catalyzing the Fenton and Fenton-like reactions, which generate •OH and 1O2 radicals for the degradation of AM. The presence of iron also enhances the stability and reusability of the activation systems, as demonstrated by the number of stable cycles.
Table 2.
Various activation systems for AM degradation using hydrogen peroxide with catalyst conditions.
4.1.6. Iron Content in Fe@AC
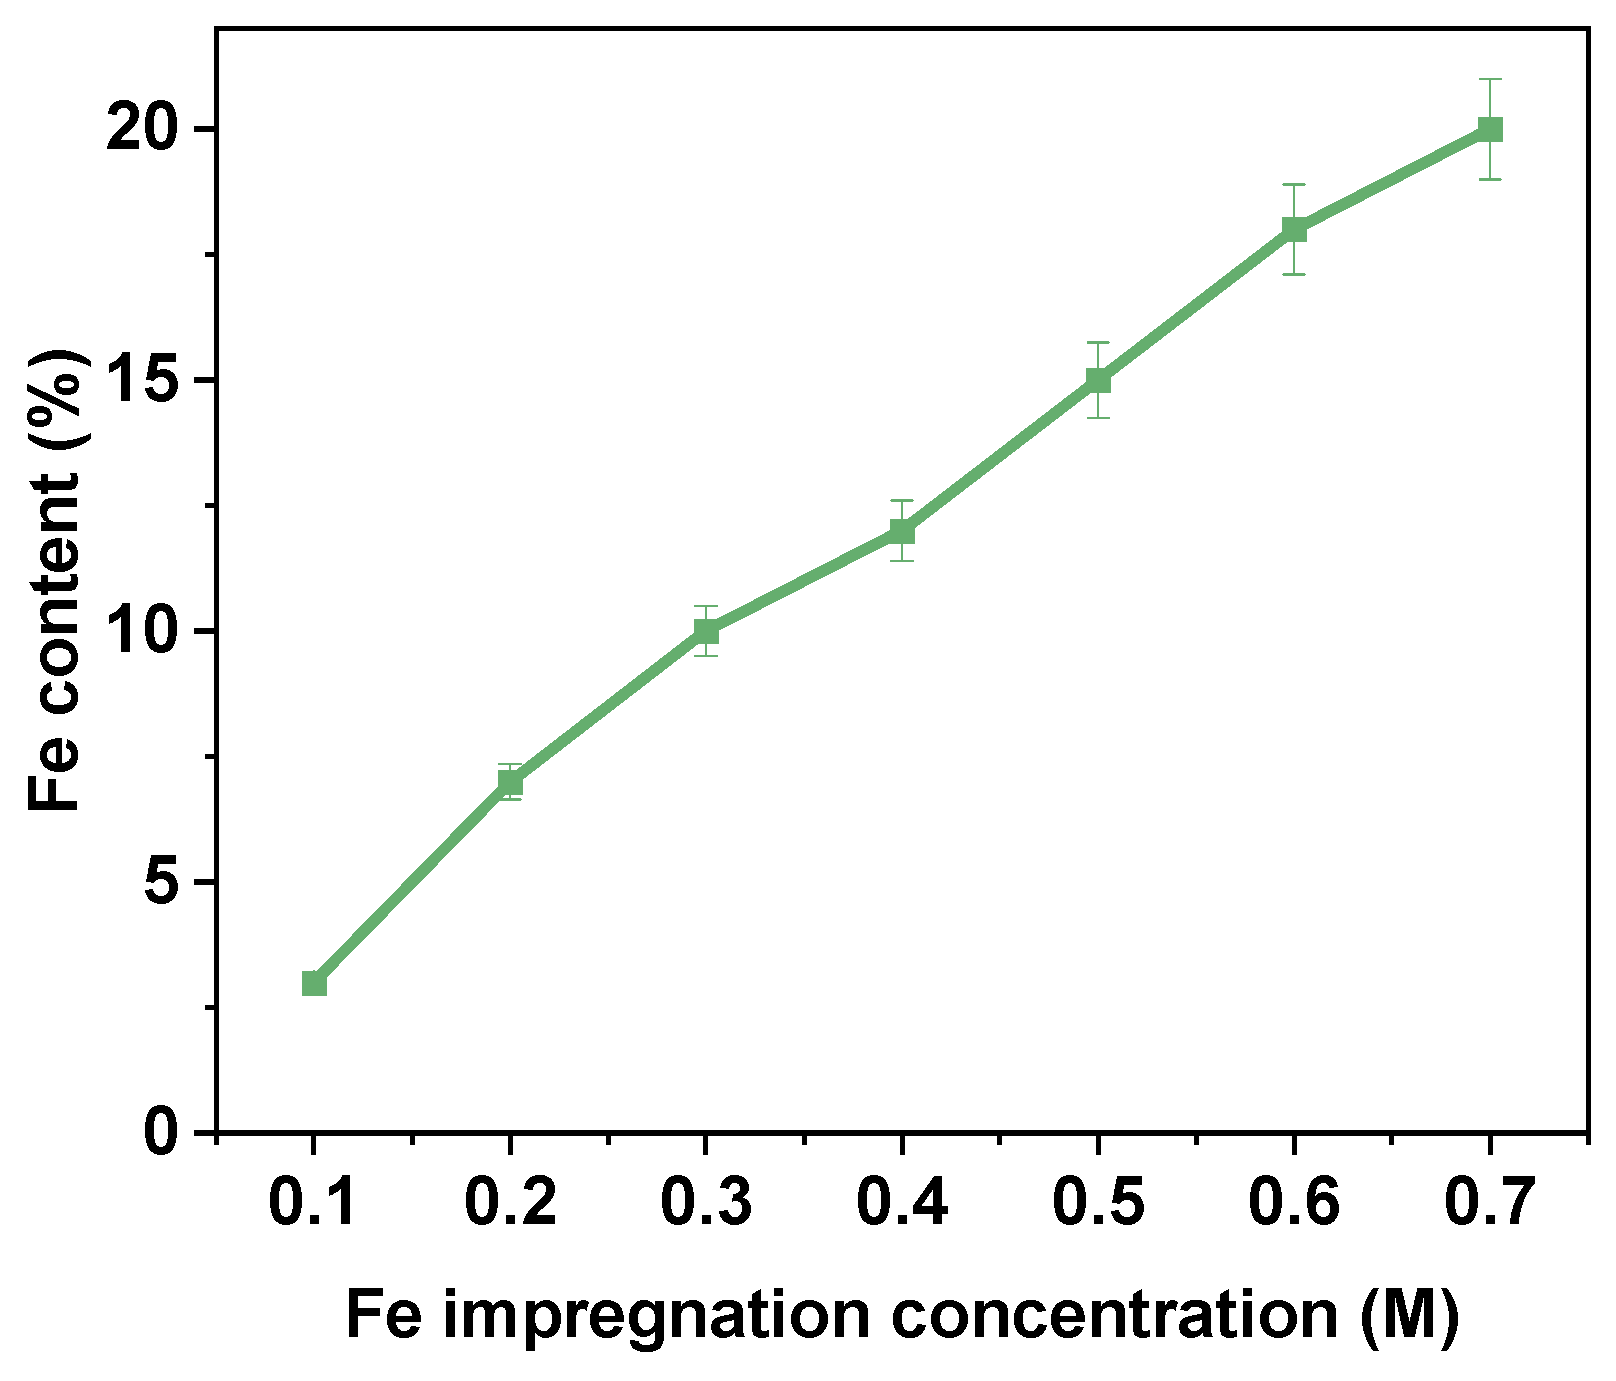
The Fe2+ impregnation efficiency and catalytic activity of Fe@AC were systematically evaluated over a range of Fe2+ impregnation concentrations from 0.1 M to 0.7 M. As depicted in Figure 8, the Fe2+ content in Fe@AC increased with higher impregnation concentrations, reaching a maximum of approximately 20% at 0.7 M. The Fe2+ content showed a clear positive correlation with impregnation concentration, suggesting that higher Fe concentrations enhance the uptake by activated carbon. At lower concentrations of 0.1 M to 0.3 M, the increase in Fe2+ content was gradual, rising from approximately 5% to 10%. However, beyond 0.3 M, the Fe2+ content increased at a faster rate, indicating a more efficient uptake of Fe2+ ions into the Fe@AC structure. The maximum Fe2+ content was observed at 0.7 M, where Fe@AC reached approximately 20%, indicating a high capacity for Fe2+ absorption even at higher concentrations. The data indicate that Fe@AC exhibits a significant capacity for iron adsorption, likely due to its large surface area and porous structure, which enable it to adsorb substantial amounts of iron ions during the impregnation process. This trend is important for applications where metal impregnation onto carbon-based materials improves catalytic performance. A higher Fe2+ content significantly enhances the catalyst’s activity. Overall, the results indicate that Fe@AC efficiently absorbs Fe2+ across a wide range of impregnation concentrations, with Fe2+ content continuing to rise to 0.7 M. The data suggests that further increases in Fe2+ concentration beyond 0.7 M may not significantly increase Fe2+ content, likely due to saturation of available adsorption sites on the activated carbon surface.
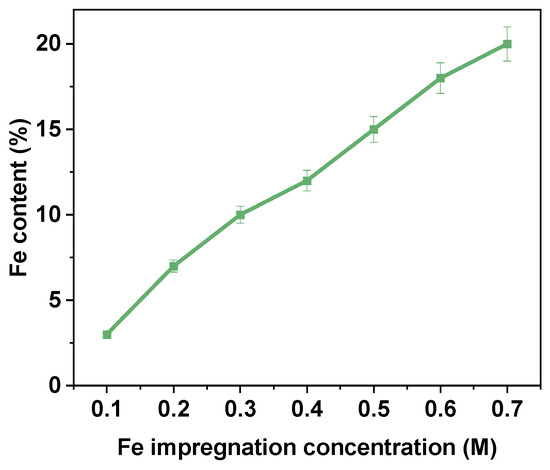
Figure 8.
The iron content of Fe@AC.
4.1.7. Adsorption Isotherms
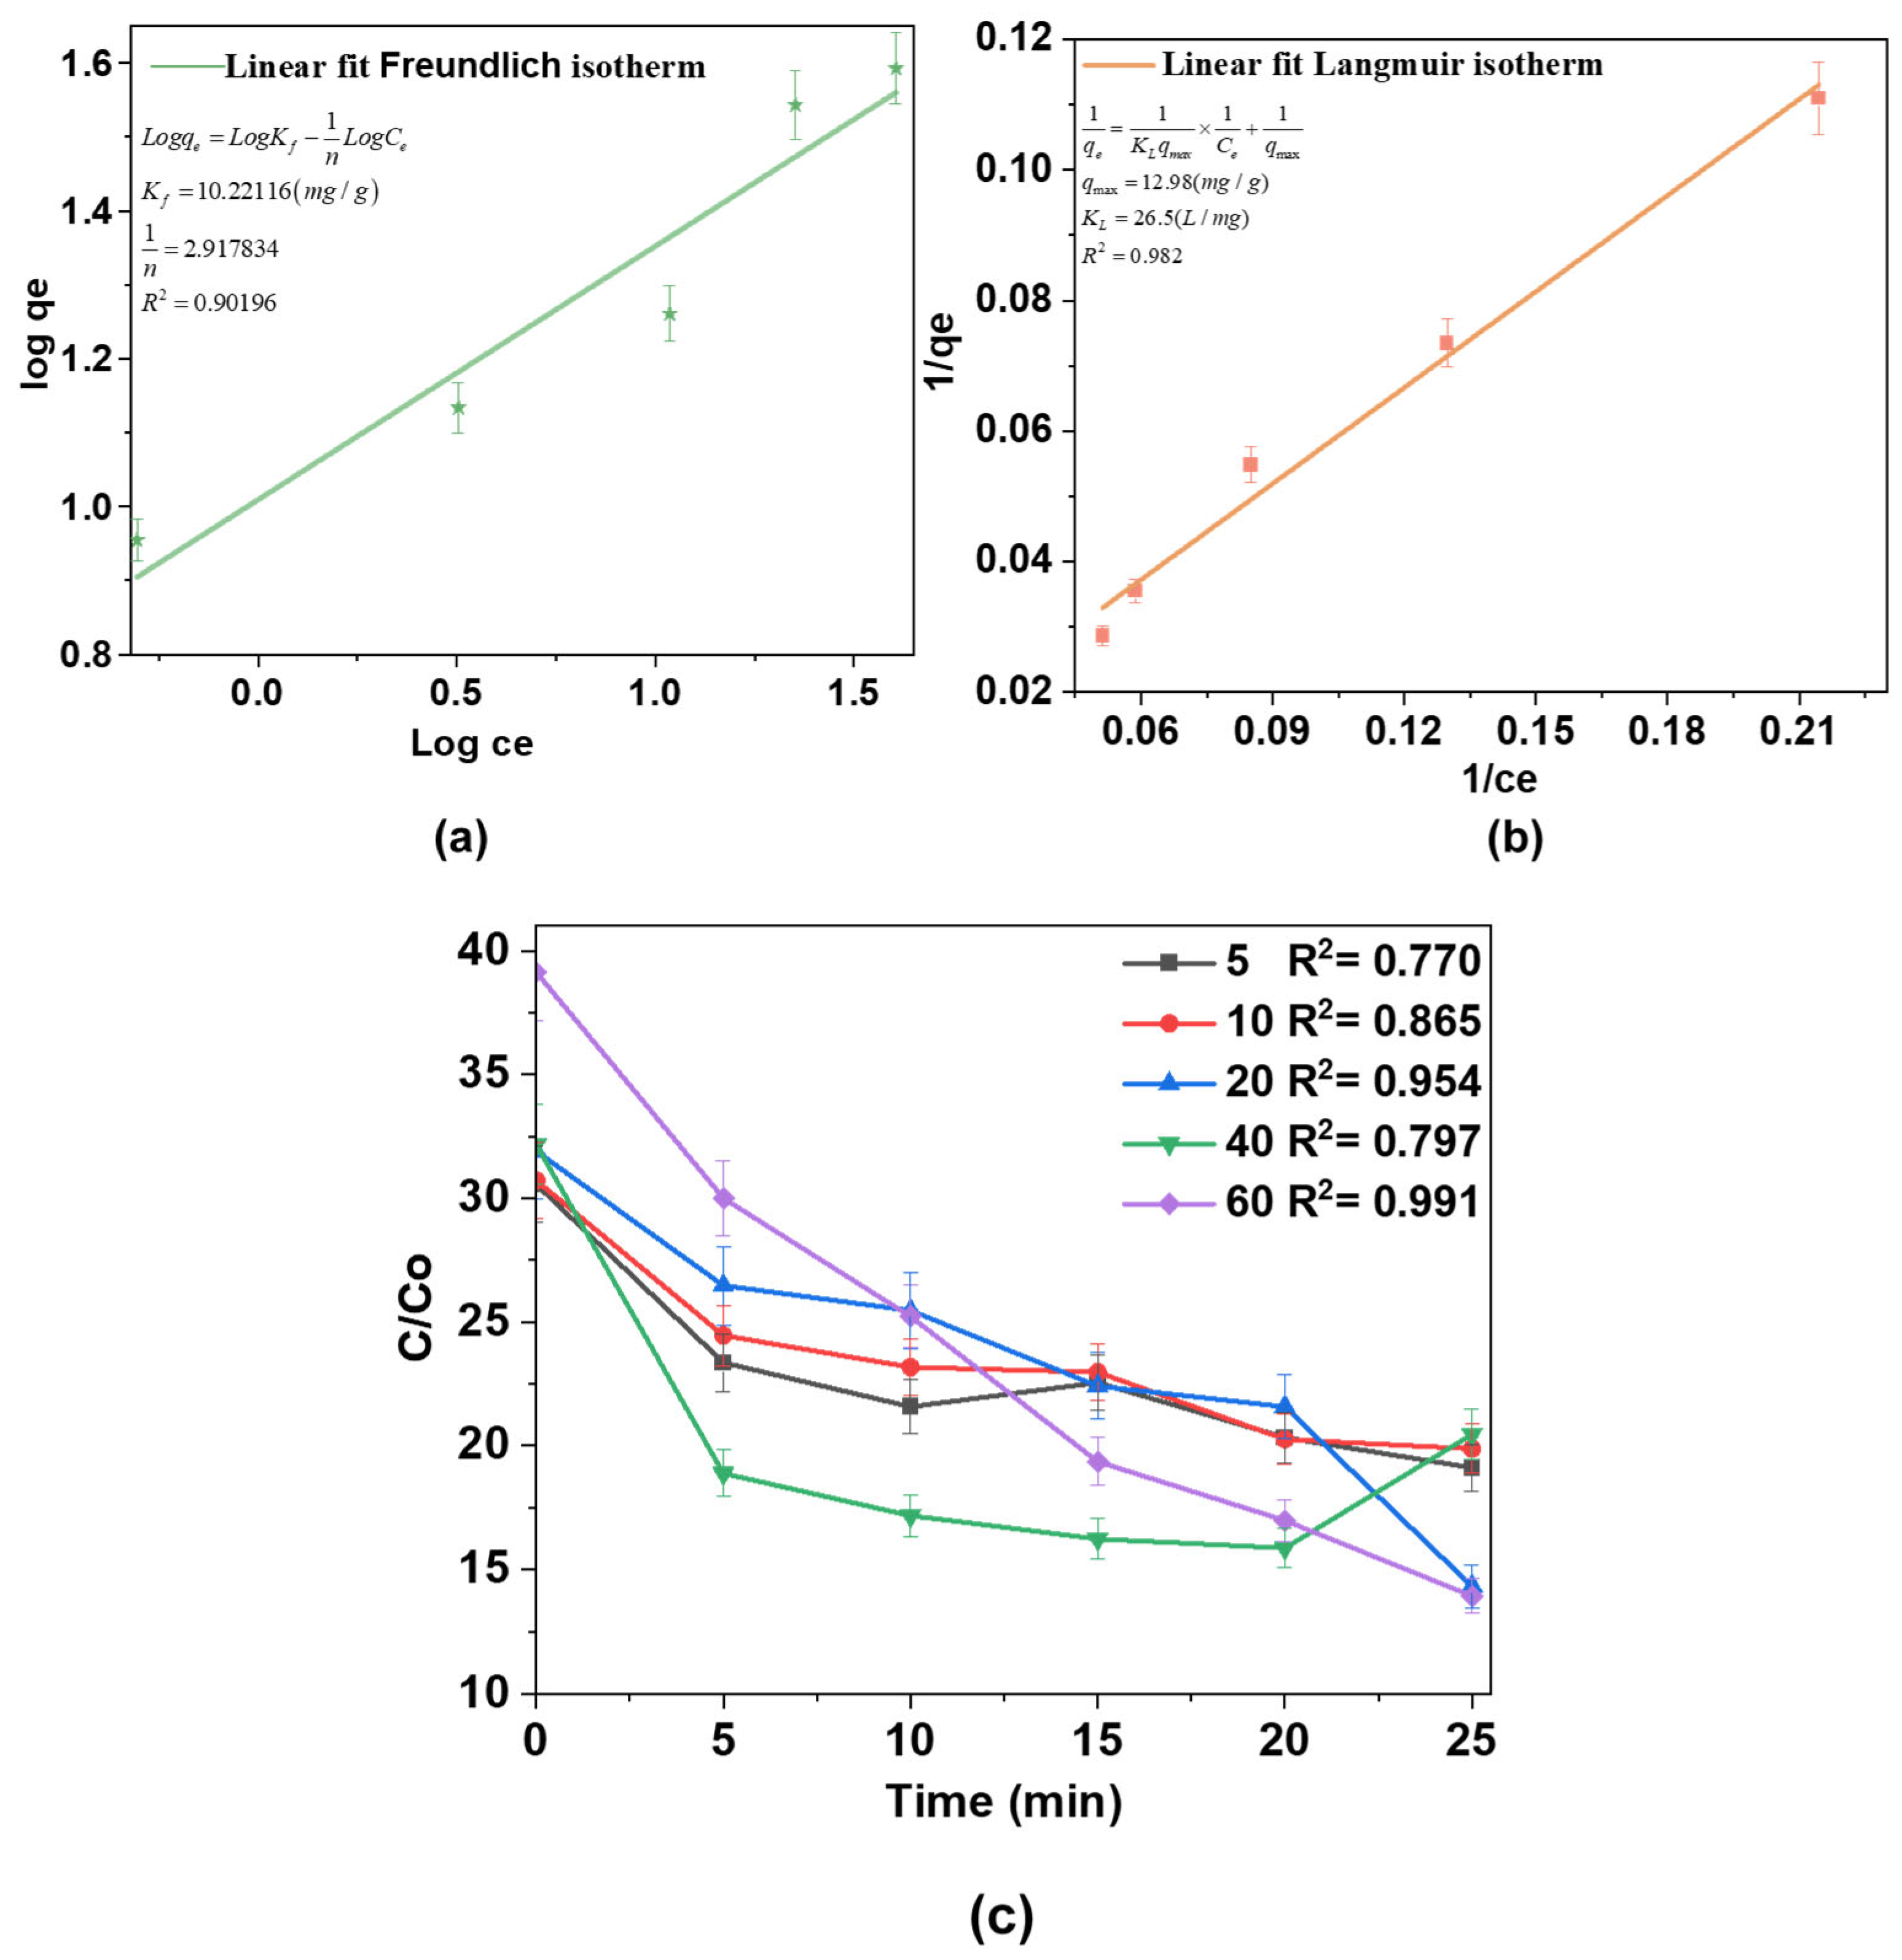
Adsorption equilibrium studies were conducted to better understand the adsorption process using isotherm models. The equilibrium data were fitted to the Freundlich and Langmuir isotherm models, as depicted in Figure 9a,b, respectively. The isotherm parameters extracted from these models provide key insights into the adsorption mechanisms and behavior. The Freundlich isotherm (Figure 9a) is an empirical model describing multilayer adsorption on heterogeneous surfaces. Kf represents the adsorption capacity, and 1/n is a measure of adsorption intensity and surface heterogeneity. The obtained 1/n value (2.917) exceeds 1, suggesting unfavorable adsorption under the tested conditions. This deviation may arise from competitive adsorption or saturation effects. The high correlation coefficient (R2 = 0.90196) suggests a good fit, indicating that surface heterogeneity and multilayer adsorption significantly contribute to the adsorption process.
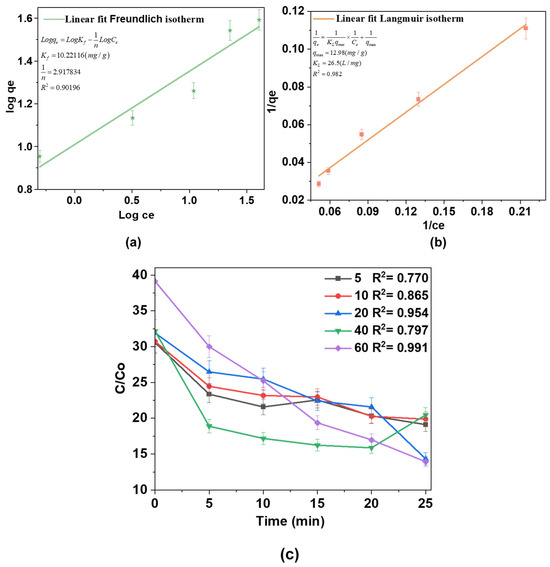
Figure 9.
(a) Freundlich isotherm plot; (b) Langmuir isotherm linearization; (c) pseudo-second-order kinetic plots for AM degradation at different concentrations over time.
The Langmuir isotherm (Figure 9b) assumes monolayer adsorption on a homogeneous surface with a limited number of identical sites. qmax represents the maximum monolayer adsorption capacity, and KL is the Langmuir constant related to adsorption energy. The calculated qmax is 12.98 mg/g, and KL = 26.5 L/mg indicates a strong affinity of the adsorbate for the adsorbent. The relatively high R2 = 0.982 confirms a reasonable fit of the Langmuir model. A comparison of the two models suggests that both multilayer and monolayer adsorption mechanisms contribute to the process, with the Langmuir model offering a better fit to the experimental data. This indicates that monolayer adsorption plays a significant role, confirming a strong interaction between the adsorbate and adsorbent.
Furthermore, Figure 9c illustrates the degradation kinetics of the substance at different concentrations over time. The x-axis shows the elapsed time in minutes, while the y-axis shows the concentration ratio (C/C0), where C is the initial concentration at time t and C0 is the final concentration. The data reveal that the degradation follows pseudo-second-order kinetics, as evidenced by the linear nature of the curves for all concentrations and the high R2 values (ranging from 0.78561 to 0.95737), indicating a strong fit to the model. Notably, the rate of degradation is more pronounced at higher concentrations. The curves for 40 mg/L and 60 mg/L exhibit steeper slopes, signifying faster degradation compared to lower concentrations (5 mg/L and 10 mg/L), which show a slower decline in concentration over time.
4.1.8. Adsorption Kinetics
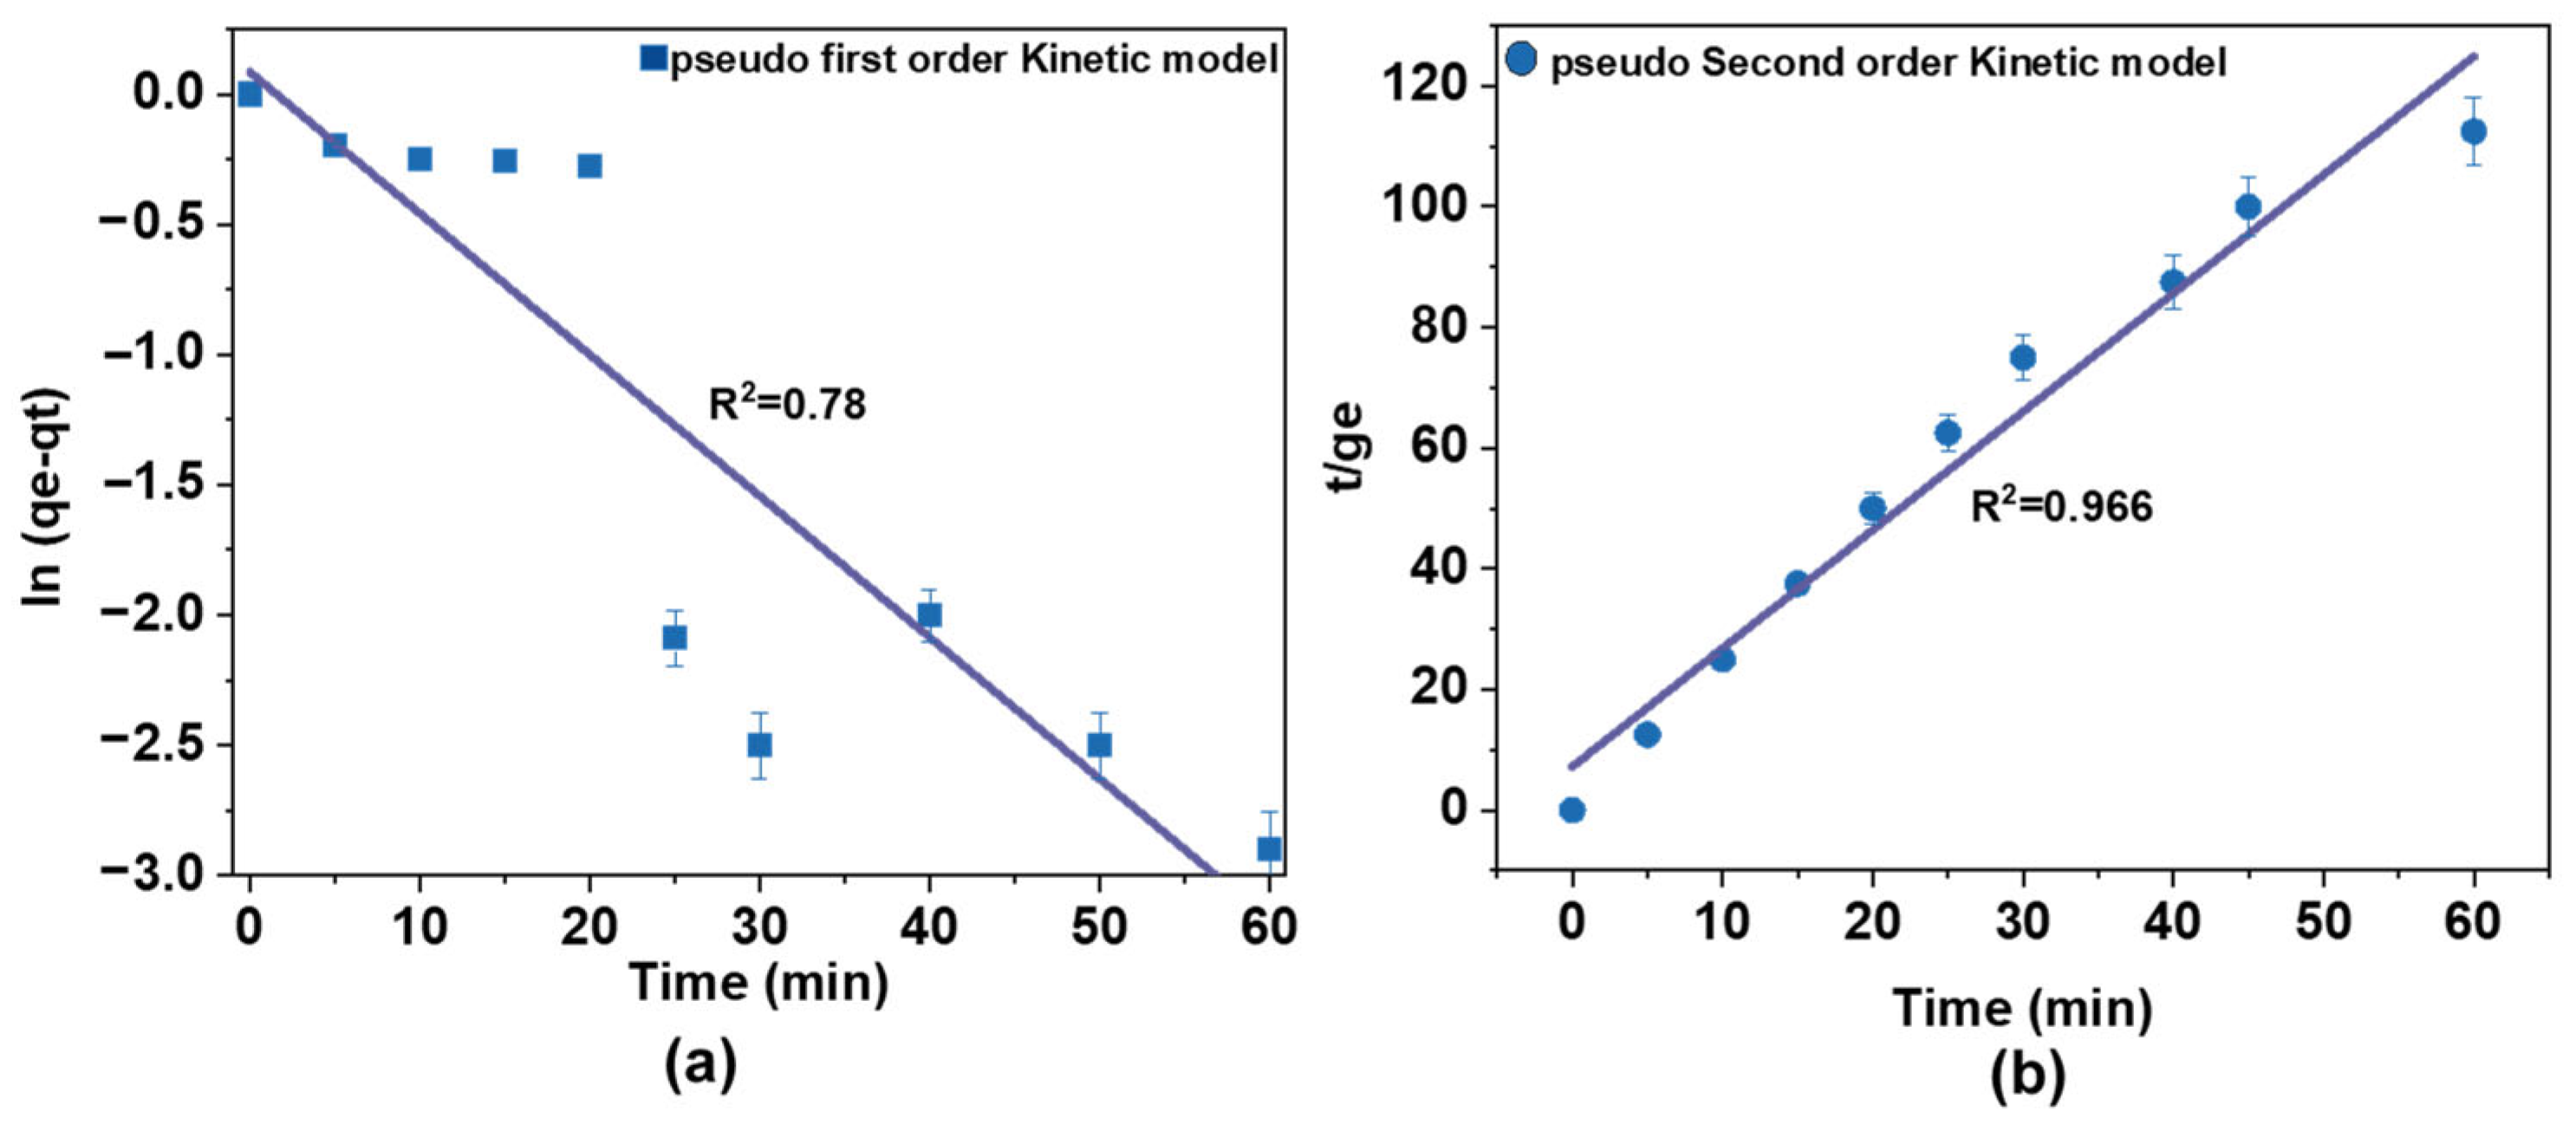
The adsorption kinetics of AM on Fe@AC were investigated, as presented in Figure 10a,b. The experimental data were fitted to pseudo-first-order and pseudo-second-order kinetic models to quantify the sorption rates. Experiments used a 60 mg/L AM solution with 50 mg/L H2O2 at pH 9. The catalyst dosage was 1.0 g in 200 mL of the antibiotic solution, and the reaction proceeded for 60 min. Kinetic model parameters are summarized in Table 3.

Figure 10.
Adsorption kinetics of (a) pseudo-first-order kinetic and (b) pseudo-second-order kinetic mode of AM by Fe2+/AC/H2O2.
Table 3.
Kinetic model parameters for sorption of AM by Fe@AC.
The pseudo-first-order and pseudo-second-order models are described by Equations (1) and (2).
where qt (mg/g) and qe (mg/g) are the sorption amounts of AM at time t (h) at equilibrium, respectively; k1 (h−1) and k2 (g·mg−1·h−1) are rate constants for pseudo-first-order and pseudo-second-order models.
For AM sorption onto Fe@AC, the R2 value for the pseudo-second-order model (0.99) was higher than that of the pseudo-first-order model (0.78). This indicates a better fit for the pseudo-second-order model, suggesting that chemical sorption may be the rate-controlling step. The higher R2 value reflects a more accurate fit to the data, supporting the conclusion that the sorption process is governed by chemical interactions rather than simple physical adsorption.
4.2. Mechanism of AM Degradations
4.2.1. Confirmation of Radical Formation and Their Involvement in the Removal of AM
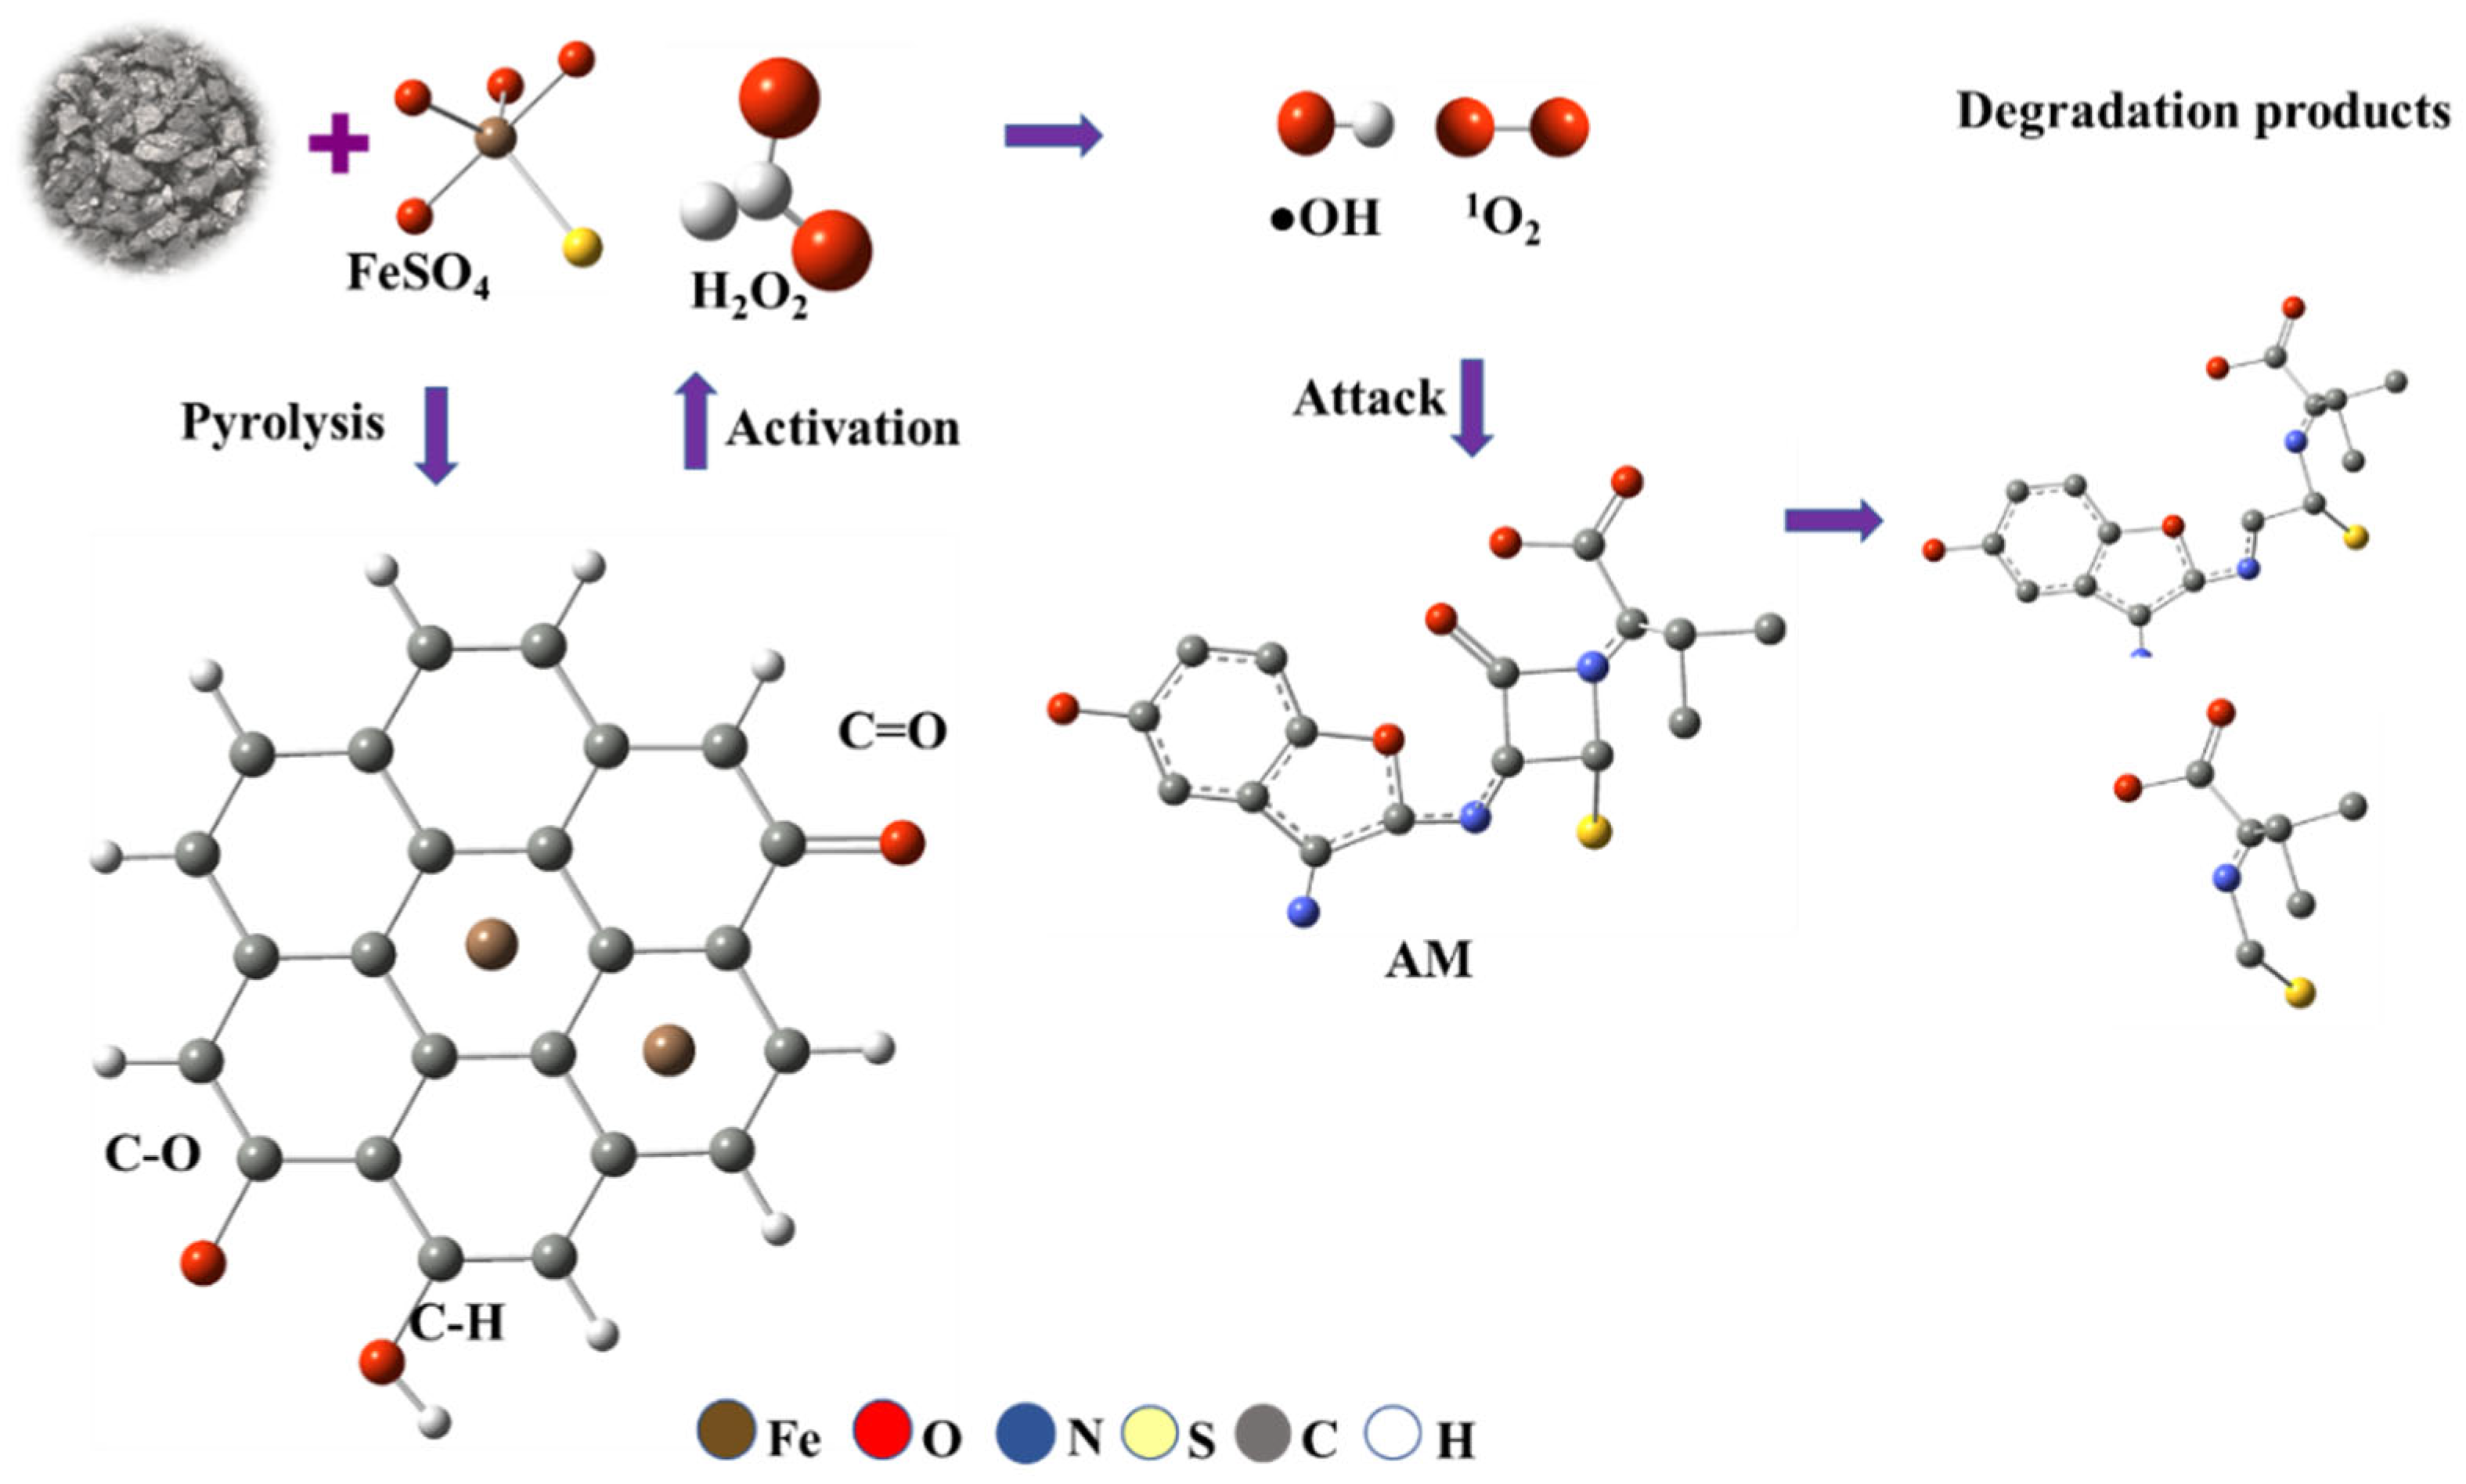
The Fe(II)-modified carbon plays a major role in the degradation of AM through a Fenton-like reaction mechanism where Fe(II) presents as Fe2+ ions or FeO clusters within the biochar matrix activates hydrogen peroxide to generate reactive species. In this system, Fe(II) species (primarily FeO clusters within the biochar matrix) activate H2O2. This process generates •OH and 1O2, both of which exhibit high oxidative potential for pollutant degradation (Figure 11).

Figure 11.
Possible pathways for the generation of ROS and degradation of AM in an iron-modified carbon/Fenton-like system.
Upon interaction with the biochar matrix, FeSO4 (iron (II) sulphate) undergoes pyrolysis, converting to active Fe(II) species embedded within the biochar structure. The subsequent Fe(II)-catalyzed activation of H2O2 yields highly reactive oxidative species, driving oxidative cleavage and structural decomposition of AM molecules. The degradation process involves oxidative fragmentation, producing intermediate species such as aldehydes or ketones, and ultimately forming low-molecular-weight products.
The efficiency of the Fe@AC/H2O2 system in AM degradation is pH-dependent. Under alkaline conditions (pH 9), Fe(II) oxidizes to Fe(III) and precipitates as Fe(OH)3; however, these colloids facilitate surface-mediated non-radical (1O2) pathways, enhancing AM degradation. Conversely, under acidic conditions, soluble Fe(II) drives classical Fenton pathways, generating •OH but with lower overall efficiency.
4.2.2. Identification of Reactive Radicals and Free Radicals in AM Degradation Systems
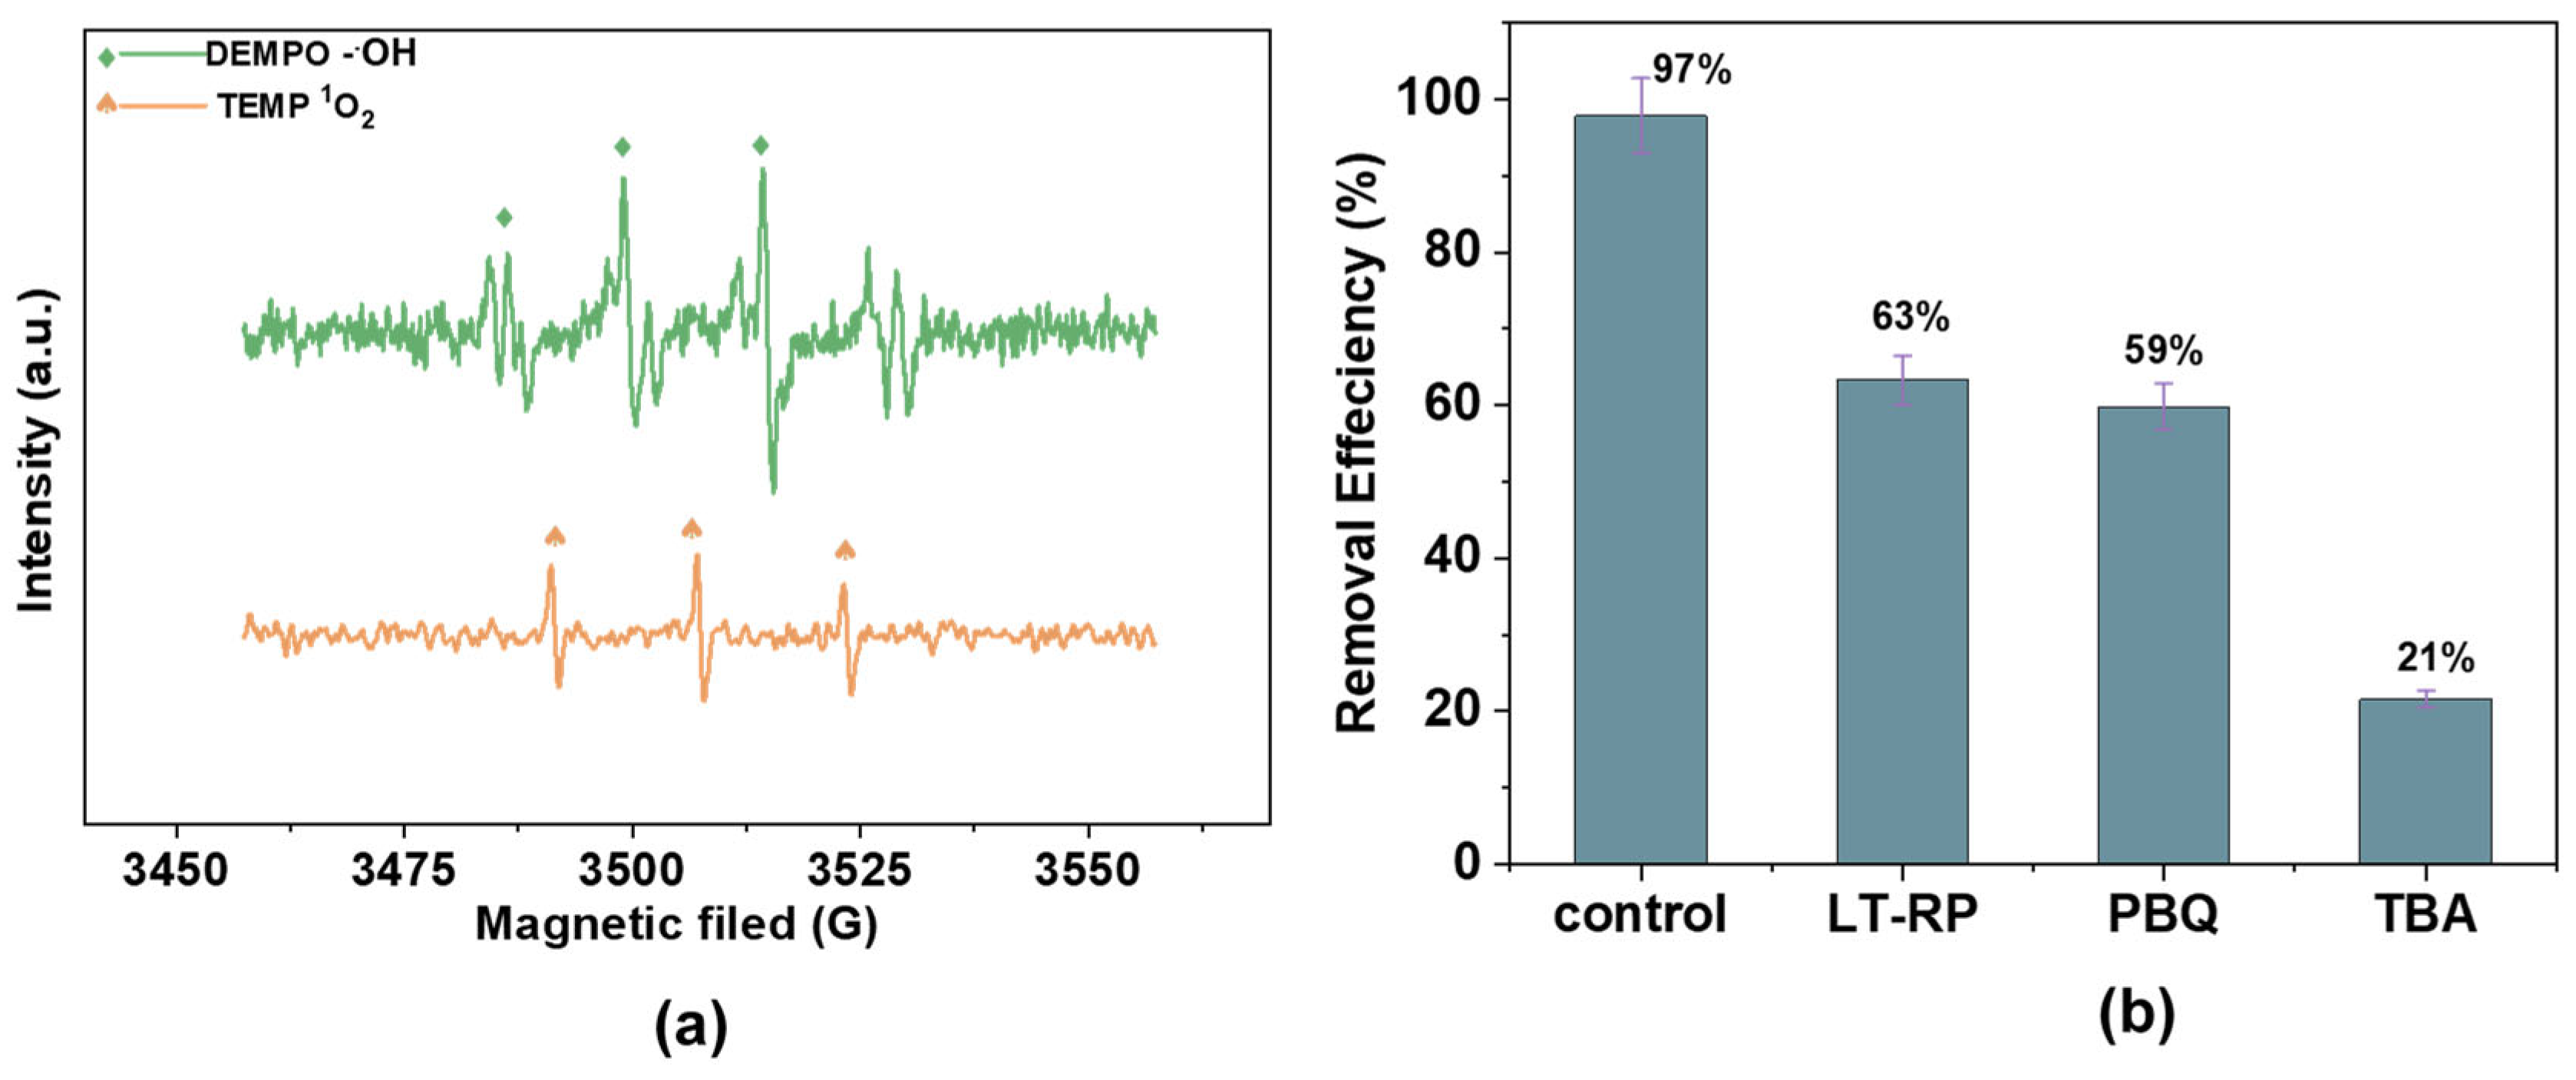
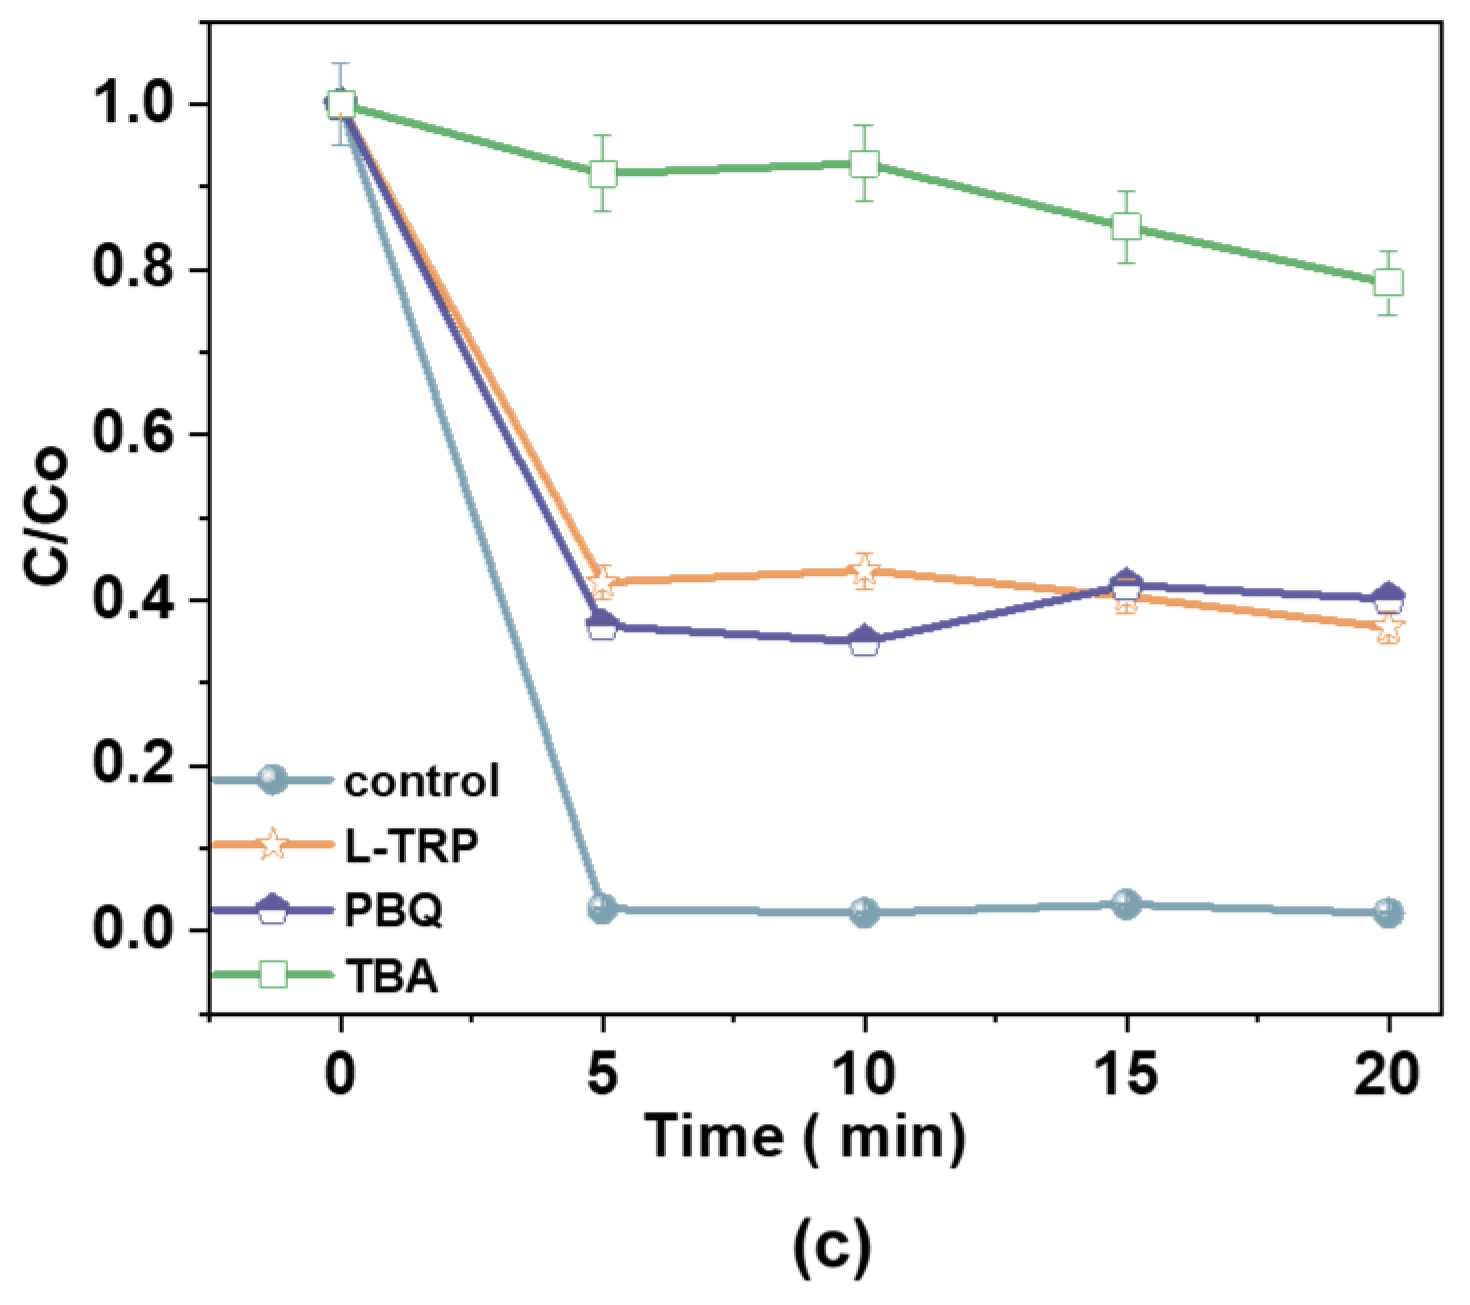
The identification of reactive oxygen species (ROS) plays a crucial role in understanding the mechanisms of AM degradation in AOPs. The Fe2+/H2O2/AC system relies on radicals, such as •OH and 1O2, which enhance the degradation through distinct roles in ROS formation and activity (Figure 12a). Electron paramagnetic resonance (EPR) studies corroborate these findings by identifying the specific radicals generated in the system [48]. EPR results for the Fe2+/H2O2/AC system confirm the presence of both 1O2 and •OH radicals (Figure 12b,c). Radical scavengers quenched these species, significantly reducing the degradation efficiency and confirming their critical role in the process.

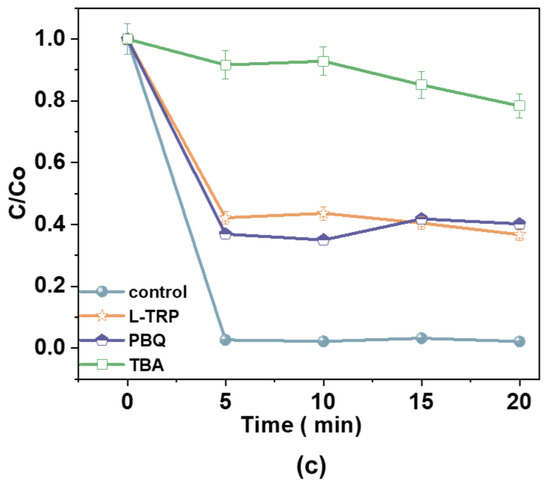
Figure 12.
EPR spectra of (a) DMPO-•OH and TEMP-1O2; (b) radical scavengers (L-tryptophan, p-benzoquinone, and tert-butyl alcohol) on radical generation [100 mM], hydrogen peroxide (H2O2) [25 mg/L], catalyst dosage [1.0 g/L], and antibiotic dosage [60 mg/L]; and (c) the effect of reactive radical scavengers over time.
Scavenger experiments further identified reactive species in the Fe2+/H2O2/AC system. L-tryptophan (L-TRP) was used to quench •OH, while p-benzoquinone (PBQ) and tert-butyl alcohol (TBA) were employed to scavenge 1O2 and other radicals, respectively. The removal efficiencies for the control, L-TRP, PBQ, and TBA were 97%, 63%, 54%, and 21%, respectively, confirming the pivotal roles of •OH and 1O2 in the degradation mechanism. The coexistence of •OH and 1O2 was further confirmed using TEMP-1O2, a probe specific to singlet oxygen, which detected substantial 1O2 activity in the catalytic system. Thus, the Fe2+/H2O2/AC system achieves effective pollutant degradation through the synergistic action of •OH and 1O2.
4.2.3. Degradation Pathway of AM by Fe2+/H2O2/AC
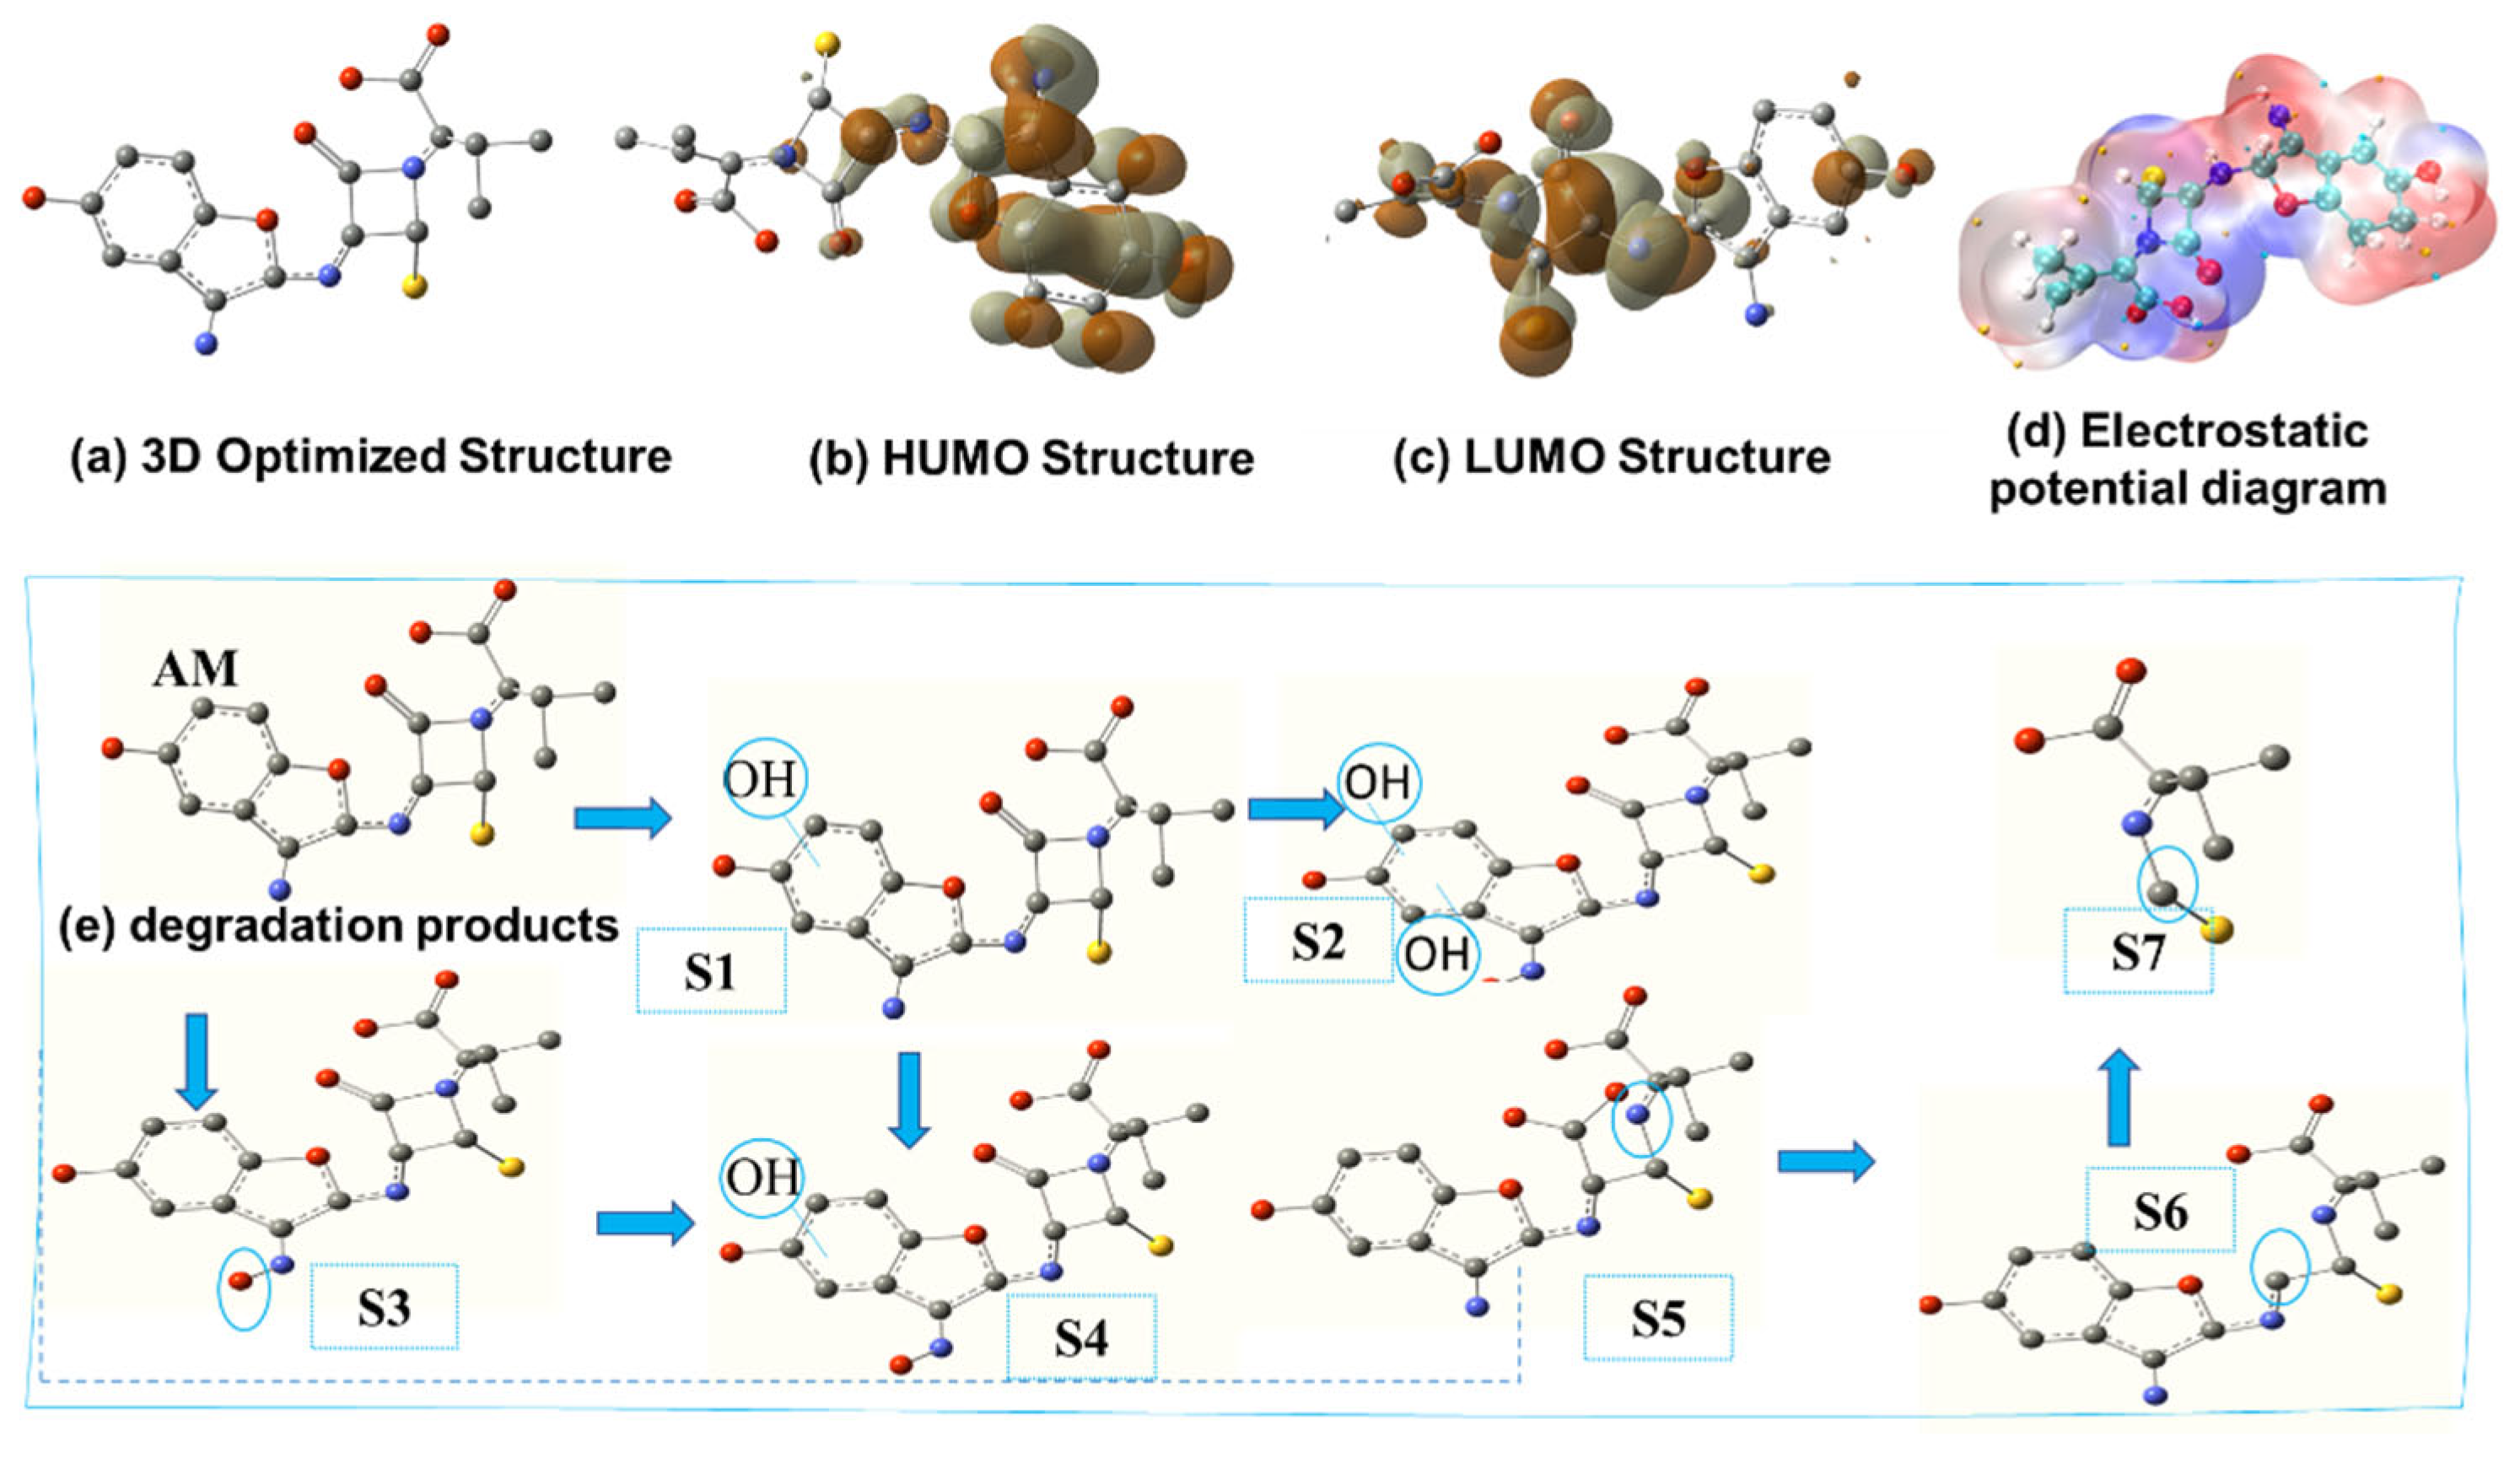
Quantum chemical calculations were conducted to gain a deeper understanding of the reactivity of AM, providing insights into the susceptibility of specific molecular regions. Figure 13 depicts the electron distribution across AM, highlighting areas of high and low electron density. Density functional theory (DFT) analysis, performed using Gaussian 09W (version 9.5), revealed the stable molecular geometries and electron density distributions of AM, providing a comparative basis for understanding its reactivity [49]. The 3D-optimized structures (Figure 13a) show the most stable molecular conformations. The highest occupied molecular orbital (HOMO) and lowest unoccupied molecular orbital (LUMO) display electron density distributions, identifying regions most susceptible to electrophilic or nucleophilic attacks (Figure 13b,c). Electrostatic potential diagrams (Figure 13d) visualize charge distribution, with red regions indicating negative potential and blue regions denoting positive potential. Figure 13e illustrates the degradation products of AM, where •OH radicals act as primary oxidizers, initiating degradation into specific intermediates. The proposed intermediate structures and degradation pathways are detailed degradation schemes. AM undergoes transformation mechanisms, such as hydroxylation, β-lactam ring cleavage, and molecular fragmentation. These pathways involve the loss of amine groups [50], ring-opening [51], oxidation of functional groups, and cleavage of bonds linking the pentagonal and hexagonal rings [52]. The sequential formation of intermediates (S2–S6) leads to smaller, more polar by-products (S7), as shown in the degradation scheme.
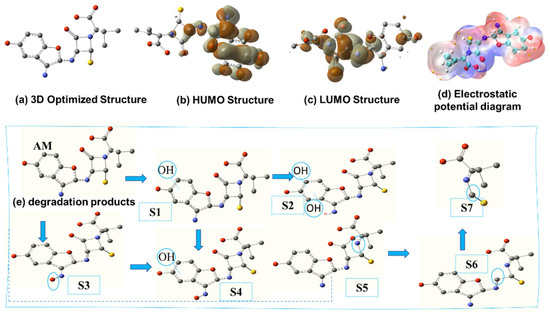
Figure 13.
Density functional theory (DFT) calculation for AM: (a) the geometrically optimal structure; (b) highest occupied molecular orbital (HOMO); (c) lowest unoccupied molecular orbital (LUMO); (d) electrostatic potential distribution (ESP); and (e) degradation products.
4.3. Ecotoxicity Analysis
The ECOSAR software (version 2.2) was employed to predict the ecotoxicological effects of AM and its degradation products on aquatic life, including green algae, fish, and daphnids as shown in (Figure 14). Chronic toxicity (ChV) and acute toxicity (LC50/EC50) values for AM and its degradation products were evaluated according to the Globally Harmonized System (GHS) classification and labeling of chemicals. As presented in Table 4, the ECOSAR predicted ecotoxicity and indicated varying toxicity levels of AM and its degradation products across the tested organisms. For AM, acute toxicity values were 2420 mg/L (fish), 260 mg/L (daphnids), and 265 mg/L (green algae). Chronic toxicity values for AM were 1550 mg/L (fish), 19.2 mg/L (daphnids), and 81.2 mg/L (green algae) (Table S6). These predictions suggest that AM and its degradation exhibit relatively low toxicity to aquatic organisms under the modeled conditions.
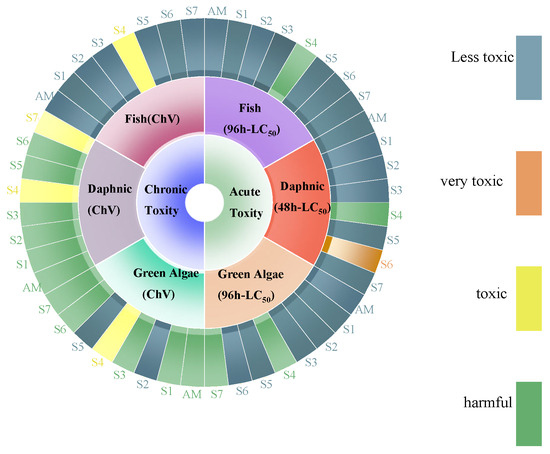
Figure 14.
Toxicity evolution of AM during degradation.
Table 4.
Classification of Chv and acute according to GHS classification [53].
4.4. Stability and Reusability of Catalyst
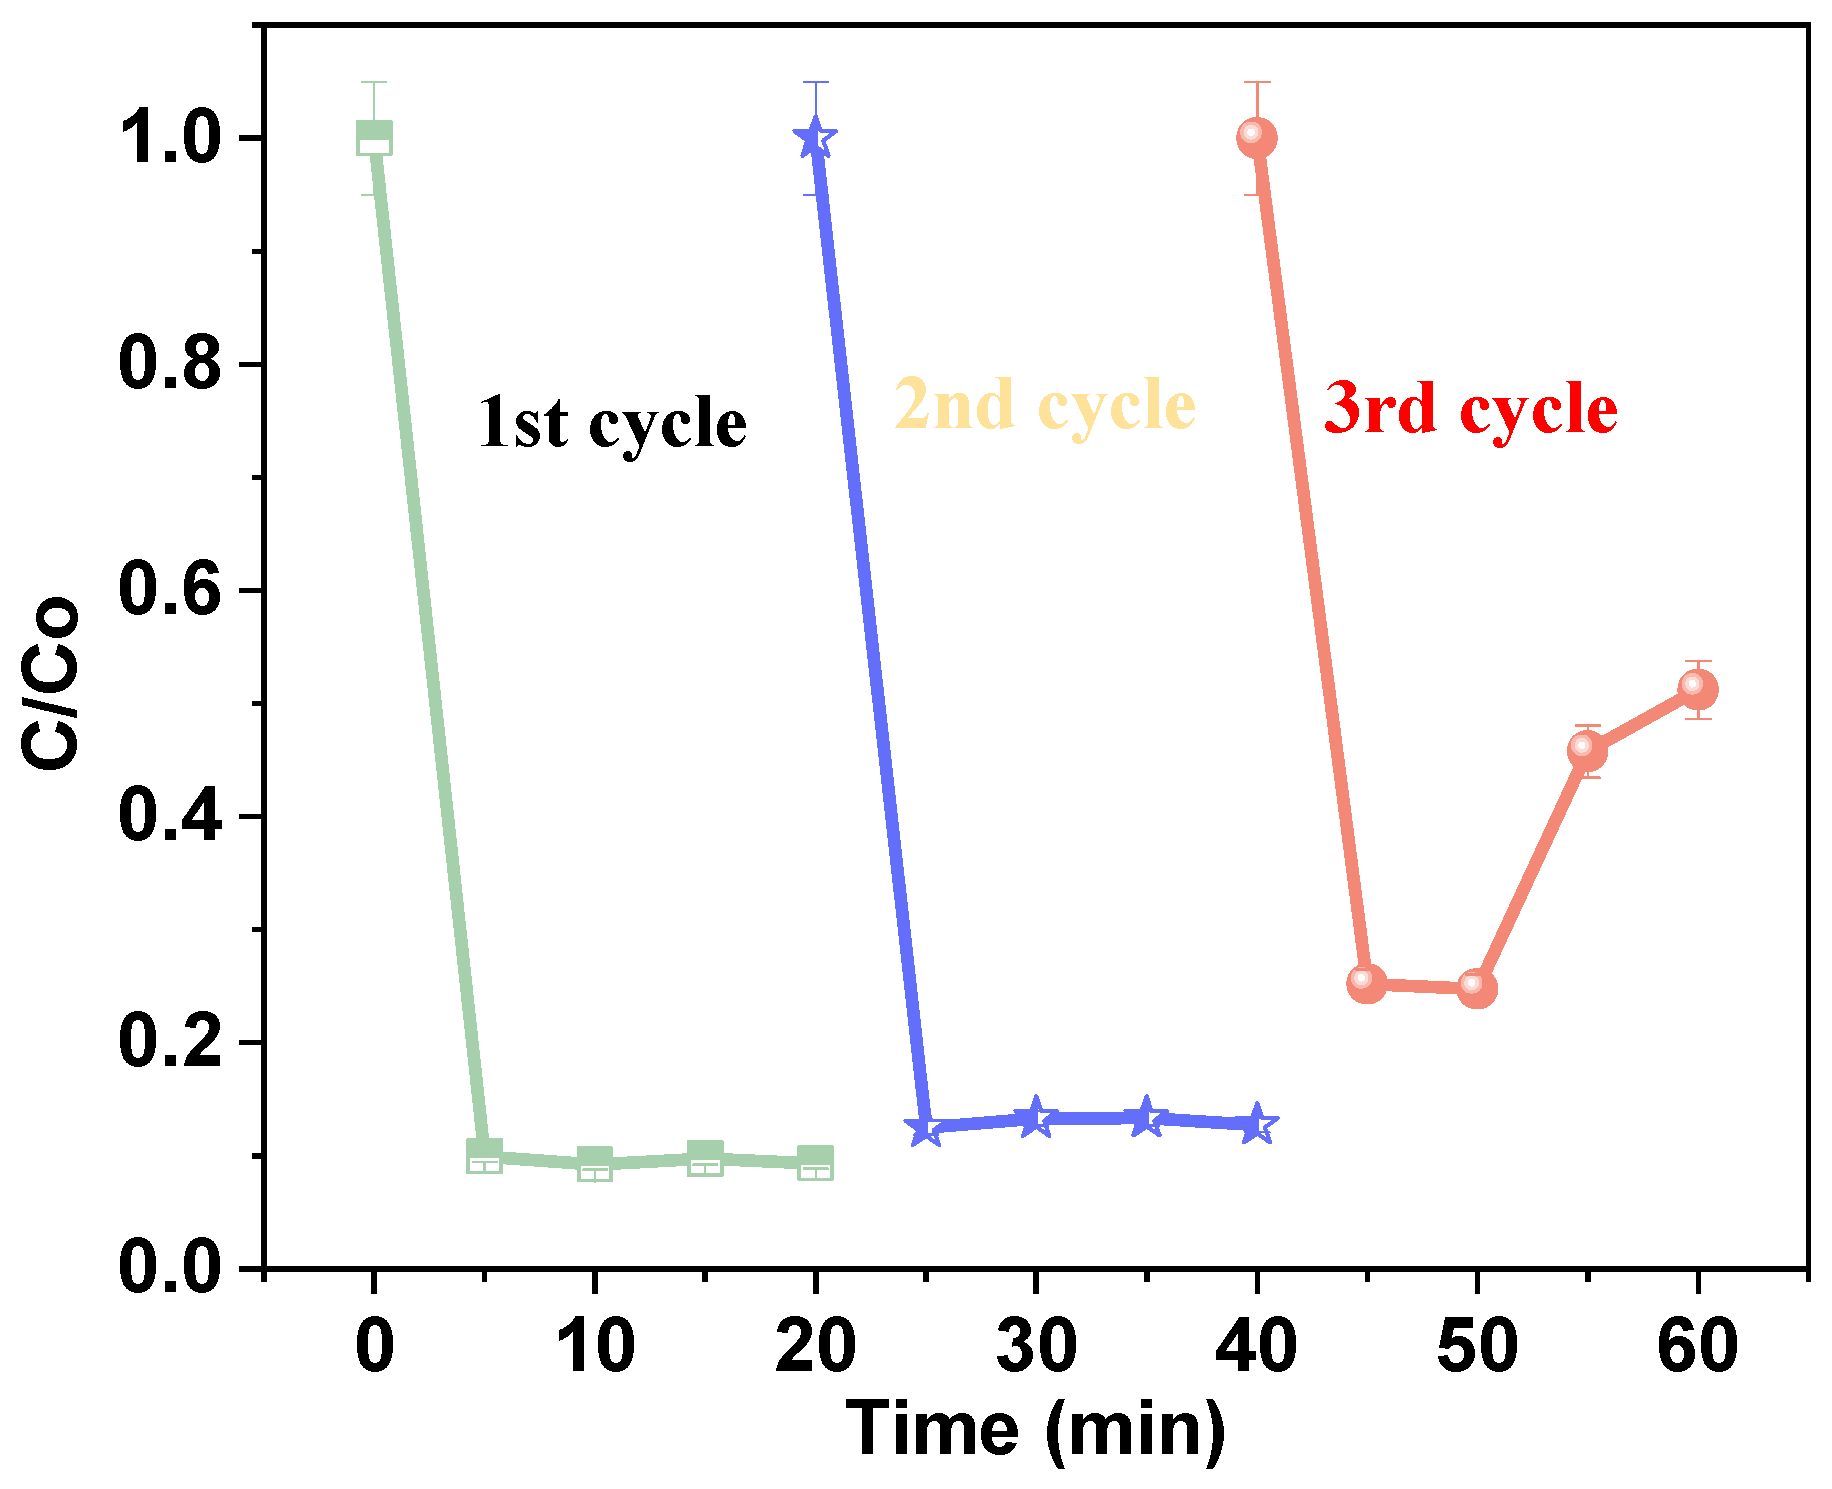
Stability is one of the most important parameters for evaluating the catalyst. As illustrated in Figure 15, cycling experiments for the Fenton degradation of AM were conducted using a 60 mg/L AM stock solution prepared in water, followed by the addition of 25 mg/L hydrogen peroxide. The total solution volume was 200 mL, and the pH was maintained at 9. After each cycle, the catalyst was washed with ethanol and deionized water three times, then dried at 60 °C in an oven for 24 h. Without changing other conditions, the collected catalyst was used for the next experimental cycles.

Figure 15.
Stability tests for the removal of AM hydrogen peroxide [25 mg/L], catalyst dosage [1.0 g/L], antibiotic dosage [60 mg/L], and pH [9].
The observed removal efficiencies for each cycle were 48%, 87%, and 90%, respectively, after 25 min. These results demonstrate high removal efficiency across successive cycles. The observed improvement in performance suggests that the Fe@AC catalytic system with hydrogen peroxide not only exhibits strong adsorption capacity for AM but also enhances degradation efficiency over multiple cycles. This enhancement is likely due to the activation of hydrogen peroxide, which facilitates more efficient degradation in subsequent cycles. In summary, the analyses of the cycling experiments demonstrated that the catalyst can be reused after simple treatment, with very stable catalytic performance and good repeatability.
5. Conclusions
This study demonstrates the effective degradation of AM in wastewater using an Fe2+/H2O2/AC system, achieving 90% efficiency under alkaline conditions (pH 9). The process is driven by reactive oxygen species (•OH and 1O2), with degradation pathways amine group loss, ring-opening oxidation, and bond cleavage confirmed by HPLC-MS analysis. Kinetic studies revealed that the pseudo-second-order model (R2 = 0.99) provided a significantly better fit than the pseudo-first-order model (R2 = 0.78), indicating that chemical sorption governs the rate-controlling step. This mechanistic insight aligns with the system’s high degradation efficiency and underscores the role of surface-active sites in the adsorption-driven oxidation process. Ecotoxicity assessments (via ECOSAR) confirmed that the resulting by-products are less harmful to aquatic organisms, highlighting the system’s environmental safety. The catalyst’s mesoporous structure (128.36 m2/g surface area) facilitates efficient mass transfer and adsorption, while its stability over three consecutive cycles with no significant loss in performance underscores its potential for long-term wastewater treatment applications.
Future research should focus on optimizing the system for large-scale industrial use, addressing challenges such as cost-effectiveness and catalyst recovery. Integrating renewable energy sources could further enhance sustainability by reducing energy consumption. Long-term environmental impact assessments are critical to evaluate by-product accumulation and ecosystem effects. Combining this system with other advanced oxidation processes may broaden its applicability to diverse contaminants. Beyond technical advancements, this work underscores the urgency of developing energy-efficient solutions to combat pharmaceutical pollution. By elucidating the interplay between adsorption kinetics and oxidation mechanisms in iron-activated carbon systems, this study lays a foundation for innovations in water treatment, contributing to global efforts to protect aquatic ecosystems and public health. The Fe2+/H2O2/AC system represents a scalable and sustainable approach, poised to inspire further research and practical implementation in environmental remediation.
Supplementary Materials
The following supporting information can be downloaded at: https://www.mdpi.com/article/10.3390/pr13041054/s1, Figure S1: Fe@AC preparation. Figure S2. SEM image and EDS of Fe@AC; Table S1: XRD peak analysis of Fe@AC sample. Table S2. XRD peak analysis of AC sample. Table S3. Different concertation and energy consumption of antibiotics in wastewater. Table S4. Reagents and materials. Table S5. Experimental instruments. Table S6. The toxicity analysis, data points were classified based on the globally harmonized system (GHS) of classification and labelling of chemicals.
Author Contributions
Writing—original draft, S.; writing—review and editing, J.A.G.; software, J.S.; supervision, funding acquisition, C.L.; data curation, Z.H.; methodology, J.Y. All authors have read and agreed to the published version of the manuscript.
Funding
The article was sponsored by the National Natural Science Foundation of China (Project No. 52442006) and the Project Sponsored by the Science and Technology Commission of Shanghai Municipality (Project No. 24DZ2306400).
Data Availability Statement
The original contributions presented in this study are included in the article. Further inquiries can be directed to the corresponding author.
Conflicts of Interest
The authors declare that they have no known competing financial interests or personal relationships that could have appeared to influence the work reported in this paper.
References
- Maged, A.; Kharbish, S.; Ismael, I.S.; Bhatnagar, A. Characterization of Activated Bentonite Clay Mineral and the Mechanisms Underlying Its Sorption for Ciprofloxacin from Aqueous Solution. Environ. Sci. Pollut. Res. 2020, 27, 32980–32997. [Google Scholar] [CrossRef] [PubMed]
- Bhattacharya, P.; Mukherjee, D.; Dey, S.; Ghosh, S.; Banerjee, S. Development and Performance Evaluation of a Novel CuO/TiO2 Ceramic Ultrafiltration Membrane for Ciprofloxacin Removal. Mater. Chem. Phys. 2019, 229, 106–116. [Google Scholar] [CrossRef]
- Yu, J.; Kang, Y.; Yin, W.; Fan, J.; Guo, Z. Removal of Antibiotics from Aqueous Solutions by a Carbon Adsorbent Derived from Protein-Waste-Doped Biomass. ACS Omega 2020, 5, 19187–19193. [Google Scholar] [CrossRef]
- Githinji, L.J.M.; Musey, M.K.; Ankumah, R.O. Evaluation of the Fate of Ciprofloxacin and Amoxicillin in Domestic Wastewater. Water. Air. Soil Pollut. 2011, 219, 191–201. [Google Scholar] [CrossRef]
- Zha, S.X.; Zhou, Y.; Jin, X.; Chen, Z. The Removal of Amoxicillin from Wastewater Using Organobentonite. J. Environ. Manag. 2013, 129, 569–576. [Google Scholar] [CrossRef]
- Ghauch, A.; Baydoun, H.; Dermesropian, P. Degradation of Aqueous Carbamazepine in Ultrasonic/Fe0/H2O2 Systems. Chem. Eng. J. 2011, 172, 18–27. [Google Scholar] [CrossRef]
- Yin, F.; Lin, S.; Zhou, X.; Dong, H.; Zhan, Y. Fate of Antibiotics during Membrane Separation Followed by Physical-Chemical Treatment Processes. Sci. Total Environ. 2021, 759, 143520. [Google Scholar] [CrossRef]
- Chandrasekaran, A.; Patra, C.; Narayanasamy, S.; Subbiah, S. Adsorptive Removal of Ciprofloxacin and Amoxicillin from Single and Binary Aqueous Systems Using Acid-Activated Carbon from Prosopis Juliflora. Environ. Res. 2020, 188, 109825. [Google Scholar] [CrossRef] [PubMed]
- Akbari, M.Z.; Xu, Y.; Lu, Z.; Peng, L. Review of Antibiotics Treatment by Advance Oxidation Processes. Environ. Adv. 2021, 5, 100111. [Google Scholar] [CrossRef]
- Khellaf, N.; Djelal, H.; Amrane, A.; Cabrol, A. Biostimulation to Improve the Dye Biodegradation of Organic Dyes by Activated Sludge. J. Chem. Health Risks 2018, 7, 247–258. [Google Scholar]
- Petit, A.S.; Pennifold, R.C.R.; Harvey, J.N. Electronic Structure and Formation of Simple Ferryloxo Complexes: Mechanism of the Fenton Reaction. Inorg. Chem. 2014, 53, 6473–6481. [Google Scholar] [CrossRef] [PubMed]
- Freire, D.M.; Beeri, D.; Pota, K.; Johnston, H.M.; Palacios, P.; Pierce, B.S.; Sherman, B.D.; Green, K.N. Hydrogen Peroxide Disproportionation with Manganese Macrocyclic Complexes of Cyclen and Pyclen. Inorg. Chem. Front. 2020, 7, 1573–1582. [Google Scholar] [CrossRef] [PubMed]
- Zhao, X.; Wang, H.; Chen, F.; Mao, R.; Liu, H.; Qu, J. Efficient Treatment of an Electroplating Wastewater Containing Heavy Metal Ions, Cyanide, and Organics by H2O2 Oxidation Followed by the Anodic Fenton Process. Water Sci. Technol. 2013, 68, 1329–1335. [Google Scholar] [CrossRef]
- Brillas, E.; Garcia-Segura, S. Benchmarking Recent Advances and Innovative Technology Approaches of Fenton, Photo-Fenton, Electro-Fenton, and Related Processes: A Review on the Relevance of Phenol as Model Molecule. Sep. Purif. Technol. 2020, 237, 116337. [Google Scholar] [CrossRef]
- Nidheesh, P.V.; Gandhimathi, R.; Ramesh, S.T. Degradation of Dyes from Aqueous Solution by Fenton Processes: A Review. Environ. Sci. Pollut. Res. 2013, 20, 2099–2132. [Google Scholar] [CrossRef]
- Zhu, Y.; Zhu, R.; Xi, Y.; Zhu, J.; Zhu, G.; He, H. Strategies for Enhancing the Heterogeneous Fenton Catalytic Reactivity: A Review. Appl. Catal. B Environ. 2019, 255, 117739. [Google Scholar] [CrossRef]
- Wang, S.; Wang, J. Trimethoprim Degradation by Fenton and Fe(II)-Activated Persulfate Processes. Chemosphere 2018, 191, 97–105. [Google Scholar] [CrossRef]
- Singh, P.; Mohan, B.; Madaan, V.; Ranga, R.; Kumari, P.; Kumar, S.; Bhankar, V.; Kumar, P.; Kumar, K. Nanomaterials Photocatalytic Activities for Waste Water Treatment: A Review; Springer: Berlin/Heidelberg, Germany, 2022; Volume 29, ISBN 5362481064137. [Google Scholar]
- Porcu, S.; Secci, F.; Ricci, P.C. Advances in Hybrid Composites for Photocatalytic Applications: A Review. Molecules 2022, 27, 6828. [Google Scholar] [CrossRef]
- Santos, V.P.; Pereira, M.F.R.; Faria, P.C.C.; Órfão, J.J.M. Decolourisation of Dye Solutions by Oxidation with H2O2 in the Presence of Modified Activated Carbons. J. Hazard. Mater. 2009, 162, 736–742. [Google Scholar] [CrossRef]
- Georgi, A.; Kopinke, F.D. Interaction of Adsorption and Catalytic Reactions in Water Decontamination Processes: Part I. Oxidation of Organic Contaminants with Hydrogen Peroxide Catalyzed by Activated Carbon. Appl. Catal. B Environ. 2005, 58, 9–18. [Google Scholar] [CrossRef]
- Kan, E.; Huling, S.G. Effects of Temperature and Acidic Pre-Treatment on Fenton-Driven Oxidation of MTBE-Spent Granular Activated Carbon. Environ. Sci. Technol. 2009, 43, 1493–1499. [Google Scholar] [CrossRef] [PubMed]
- Mirizadeh, S.; Solisio, C.; Converti, A.; Casazza, A.A. Efficient Removal of Tetracycline, Ciprofloxacin, and Amoxicillin by Novel Magnetic Chitosan/Microalgae Biocomposites. Sep. Purif. Technol. 2024, 329, 125115. [Google Scholar] [CrossRef]
- Gurav, R.; Bhatia, S.K.; Choi, T.R.; Park, Y.L.; Park, J.Y.; Han, Y.H.; Vyavahare, G.; Jadhav, J.; Song, H.S.; Yang, P.; et al. Treatment of Furazolidone Contaminated Water Using Banana Pseudostem Biochar Engineered with Facile Synthesized Magnetic Nanocomposites. Bioresour. Technol. 2020, 297, 122472. [Google Scholar] [CrossRef] [PubMed]
- Thi Mong Thy, L.; Tan Tai, L.; Duy Hai, N.; Quang Cong, C.; Minh Dat, N.; Ngoc Trinh, D.; Truong Son, N.; Thi Yen Oanh, D.; Thanh Phong, M.; Huu Hieu, N. Comparison of In-Situ and Ex-Situ Methods for Synthesis of Iron Magnetic Nanoparticles-Doped Graphene Oxide: Characterization, Adsorption Capacity, and Fenton Catalytic Efficiency. FlatChem 2022, 33, 100365. [Google Scholar] [CrossRef]
- Zhou, Y.; Cao, S.; Xi, C.; Li, X.; Zhang, L.; Wang, G.; Chen, Z. A Novel Fe3O4/Graphene Oxide/Citrus Peel-Derived Bio-Char Based Nanocomposite with Enhanced Adsorption Affinity and Sensitivity of Ciprofloxacin and Sparfloxacin. Bioresour. Technol. 2019, 292, 121951. [Google Scholar] [CrossRef]
- Xiunan, C.; Ling, T.; Meifei, C.; Yijun, L.; Wei, W.; Junhao, L.; Yanjuan, Z.; Gan, T.; Huayu, H.; Zuqiang, H. Construction of a C-Decorated and Cu-Doped (Fe,Cu)S/CuFe2O4 Solid Solution for Photo-Fenton Degradation of Hydrophobic Organic Contaminant: Enhanced Electron Transfer and Adsorption Capacity. Chemosphere 2022, 296, 134005. [Google Scholar] [CrossRef]
- Shaofeng, Z.; Wei, W.; Xiangheng, X.; Juan, Z.; Feng, R. Jiang Changzhong Preparation and Characterization of Spindle-like Fe3O4 Mesoporous Nanoparticles. Nanoscale Res. Lett. 2011, 6, 89–97. [Google Scholar]
- Chenakin, S.; Kruse, N. XPS Characterization of Transition Metal Oxalates. Appl. Surf. Sci. 2020, 515, 146041. [Google Scholar] [CrossRef]
- Peng, W.; Li, H.; Liu, Y.; Song, S. A Review on Heavy Metal Ions Adsorption from Water by Graphene Oxide and Its Composites. J. Mol. Liq. 2017, 230, 496–504. [Google Scholar] [CrossRef]
- Gopinath, A.; Pisharody, L.; Popat, A.; Nidheesh, P.V. Supported Catalysts for Heterogeneous Electro-Fenton Processes: Recent Trends and Future Directions. Curr. Opin. Solid State Mater. Sci. 2022, 26, 100981. [Google Scholar] [CrossRef]
- Ahmad, M.; Rajapaksha, A.U.; Lim, J.E.; Zhang, M.; Bolan, N.; Mohan, D.; Vithanage, M.; Lee, S.S.; Ok, Y.S. Biochar as a Sorbent for Contaminant Management in Soil and Water: A Review. Chemosphere 2014, 99, 19–33. [Google Scholar] [CrossRef] [PubMed]
- García-Galán, M.J.; Díaz-Cruz, S.; Barceló, D. Multiresidue Trace Analysis of Sulfonamide Antibiotics and Their Metabolites in Soils and Sewage Sludge by Pressurized Liquid Extraction Followed by Liquid Chromatography–Electrospray-Quadrupole Linear Ion Trap Mass Spectrometry. J. Chromatogr. A 2013, 1275, 32–40. [Google Scholar] [CrossRef]
- Herney-Ramirez, J.; Vicente, M.A.; Madeira, L.M. Heterogeneous Photo-Fenton Oxidation with Pillared Clay-Based Catalysts for Wastewater Treatment: A Review. Appl. Catal. B Environ. 2010, 98, 10–26. [Google Scholar] [CrossRef]
- Liang, H.; Liu, R.; An, X.; Hu, C.; Zhang, X.; Liu, H. Bimetal-Organic Frameworks with Coordinatively Unsaturated Metal Sites for Highly Efficient Fenton-like Catalysis. Chem. Eng. J. 2021, 414, 128669. [Google Scholar] [CrossRef]
- Ricky, R.; Chiampo, F.; Shanthakumar, S. Efficacy of Ciprofloxacin and Amoxicillin Removal and the Effect on the Biochemical Composition of Chlorella Vulgaris. Bioengineering 2022, 9, 134. [Google Scholar] [CrossRef]
- Pezoti, O.; Cazetta, A.L.; Bedin, K.C.; Souza, L.S.; Martins, A.C.; Silva, T.L.; Santos Júnior, O.O.; Visentainer, J.V.; Almeida, V.C. NaOH-Activated Carbon of High Surface Area Produced from Guava Seeds as a High-Efficiency Adsorbent for Amoxicillin Removal: Kinetic, Isotherm and Thermodynamic Studies. Chem. Eng. J. 2016, 288, 778–788. [Google Scholar] [CrossRef]
- Shokri, A.; Fard, M.S. A Critical Review in Fenton-like Approach for the Removal of Pollutants in the Aqueous Environment. Environ. Chall. 2022, 7, 100534. [Google Scholar] [CrossRef]
- Yahia, B.; Faouzi, S.; Ahmed, C.; Lounis, S.; Mohamed, T. A New Hybrid Process for Amoxicillin Elimination by Combination of Adsorption and Photocatalysis on (CuO/AC) under Solar Irradiation. J. Mol. Struct. 2022, 1261, 132769. [Google Scholar] [CrossRef]
- Xie, W.; Huang, Z.; Zhou, F.; Li, Y.; Bi, X.; Bian, Q.; Sun, S. Heterogeneous Fenton-like Degradation of Amoxicillin Using MOF-Derived Fe0 Embedded in Mesoporous Carbon as an Effective Catalyst. J. Clean. Prod. 2021, 313, 127754. [Google Scholar] [CrossRef]
- Xiang, Y.; Xu, Z.; Wei, Y.; Zhou, Y.; Yang, X.; Yang, Y.; Yang, J.; Zhang, J.; Luo, L.; Zhou, Z. Carbon-Based Materials as Adsorbent for Antibiotics Removal: Mechanisms and Influencing Factors. J. Environ. Manag. 2019, 237, 128–138. [Google Scholar] [CrossRef]
- Jorfi, S.; Pourfadakari, S.; Kakavandi, B. A New Approach in Sono-Photocatalytic Degradation of Recalcitrant Textile Wastewater Using MgO@Zeolite Nanostructure under UVA Irradiation. Chem. Eng. J. 2018, 343, 95–107. [Google Scholar] [CrossRef]
- Tufail, A.; Price, W.E.; Hai, F.I. A Critical Review on Advanced Oxidation Processes for the Removal of Trace Organic Contaminants: A Voyage from Individual to Integrated Processes. Chemosphere 2020, 260, 127460. [Google Scholar] [CrossRef] [PubMed]
- Elmolla, E.S.; Chaudhuri, M. Photocatalytic Degradation of Amoxicillin, Ampicillin and Cloxacillin Antibiotics in Aqueous Solution Using UV/TiO2 and UV/H2O2/TiO2 Photocatalysis. Desalination 2010, 252, 46–52. [Google Scholar] [CrossRef]
- Jiang, T.; Wang, B.; Gao, B.; Cheng, N.; Feng, Q.; Chen, M.; Wang, S. Degradation of Organic Pollutants from Water by Biochar-Assisted Advanced Oxidation Processes: Mechanisms and Applications. J. Hazard. Mater. 2023, 442, 130075. [Google Scholar] [CrossRef]
- Song, J.; Zhu, L.; Yu, S.; Li, G.; Wang, D. The Synergistic Effect of Adsorption and Fenton Oxidation for Organic Pollutants in Water Remediation: An Overview. RSC Adv. 2024, 14, 33489–33511. [Google Scholar] [CrossRef] [PubMed]
- Park, J.H.; Wang, J.J.; Seo, D.C. Comparison of Catalytic Activity for Treating Recalcitrant Organic Pollutant in Heterogeneous Fenton Oxidation with Iron-Impregnated Biochar and Activated Carbon. J. Water Process Eng. 2021, 42, 102141. [Google Scholar] [CrossRef]
- Chen, M.; Dai, Y.; Guo, J.; Yang, H.; Liu, D.; Zhai, Y. Solvothermal Synthesis of Biochar@ZnFe2O4/BiOBr Z-Scheme Heterojunction for Efficient Photocatalytic Ciprofloxacin Degradation under Visible Light. Appl. Surf. Sci. 2019, 493, 1361–1367. [Google Scholar] [CrossRef]
- Dou, M.; Wang, J.; Ma, Z.; Gao, B.; Huang, X. Origins of Selective Differential Oxidation of β-Lactam Antibiotics with Different Structure in an Efficient Visible-Light Driving Mesoporous g-C3N4 Activated Persulfate Synergistic Mechanism. J. Hazard. Mater. 2022, 426, 128111. [Google Scholar] [CrossRef]
- de Carvalho, C.B.; Rosa, I.R.; Del Vecchio, P.; Dávila, I.V.J.; Nunes, K.G.P.; Marcilio, N.R.; Féris, L.A. Degradation of Ampicillin by Combined Process: Adsorption and Fenton Reaction. Environ. Technol. Innov. 2022, 26, 102365. [Google Scholar] [CrossRef]
- Zhang, X.; Zhu, G.; Xiao, B.; Geng, J.; Yang, Y.; Wang, D.; Li, J.; Wang, J.; Zhu, Y. Iron-Based Resin Heterogeneous Photo-Self-Fenton System for Efficient Photocatalytic Degradation of Antibiotic Wastewater. Sep. Purif. Technol. 2024, 330, 125338. [Google Scholar] [CrossRef]
- Kgoetlana, C.M.; Malinga, S.P.; Dlamini, L.N. Photocatalytic Degradation of Chlorpyrifos with Mn-Wo3/Sns2 Heterostructure. Catalysts 2020, 10, 699. [Google Scholar] [CrossRef]
- Pratiwi, W.Z.; Hadiyanto, H.; Widayat, W.; Baihaqi, R.A. Response Surface Optimization of Ciprofloxacin Degradation Using UV/O3 Oxidation Process. Results Eng. 2024, 24, 103299. [Google Scholar] [CrossRef]


Disclaimer/Publisher’s Note: The statements, opinions and data contained in all publications are solely those of the individual author(s) and contributor(s) and not of MDPI and/or the editor(s). MDPI and/or the editor(s) disclaim responsibility for any injury to people or property resulting from any ideas, methods, instructions or products referred to in the content. |
© 2025 by the authors. Licensee MDPI, Basel, Switzerland. This article is an open access article distributed under the terms and conditions of the Creative Commons Attribution (CC BY) license (https://creativecommons.org/licenses/by/4.0/).