Abstract
This study assesses the sustainability of bioethanol production from multiple agricultural feedstocks, including corn stover, wheat straw, and rice husk, using a life cycle assessment (LCA) method. The process focuses on converting lignocellulose biomass into bioethanol through advanced biotechnology, enriching energy security and supporting sustainable development in Pakistan. The process includes various stages of feedstock utilization, including cultivation, harvesting, transportation, preprocessing, and conversion, eventually yielding 1 kg of bioethanol with different inventories for each of the three feedstocks. A comparative analysis of the three feedstocks reveals that the wheat straw showed the highest environmental impacts, while rice husk exhibits the least environmental impacts and emerges as a more sustainable and viable option for bioethanol production. The economic assessment revealed the feasibility of bioethanol production, achieving a daily revenue of $9600 and a monthly income of $211,200, based on 22 working days in a single 8 h shift. The total initial capital investment cost was estimated at $478,515, while operational costs were calculated at $225,921. The external cost of the plant was evaluated at $14.23. Transitioning from grid-mix to renewable energy, such as photovoltaic systems, showed a reduction among three feedstocks. Therefore, bioethanol production not only addresses waste management challenges but also contributes to waste-to-energy conversion and renewable energy generation, aligning with public health goals and sustainable development. The findings highlight the potential of bioethanol production as a strategic solution to manage agricultural waste sustainably and reduce greenhouse gas emissions.
1. Introduction
Bioenergy is one of the most plenteous resources on earth and has been consumed as a source of power for centuries. Current biomass technologies, combined with the potential of biomass energy, present a sustainable solution to address energy challenges, mainly in developing countries. These technologies also offer an effective means to manage and use the massive amounts of waste produced daily in urban and rural areas. The availability of agricultural waste residues is influenced by the crop-to-residue yield ratio, with almost 38% of total crop residues, and MSW collection achieves about 60% efficiency. Agricultural residues and processed MSW are key contributors to biofuel production and renewable sources of electricity, helping to bridge the energy demand–supply gap. Also, biofuels are extensively used for domestic purposes in the form of heating and cooking in rural communities and supporting sustainable energy solutions [1]. Currently, a critical global challenge is how to reduce the emission of greenhouse gases to mitigate climate change and sustain the growth of the economy. This can be achieved by supporting new renewable energy sources like geothermal energy, solar energy, and biomass-based energy, including bioethanol, biodiesel, and bio-hydrogen. Fossil fuel prices are rising very rapidly due to day-by-day increases in the demand for energy and the reduction of conventional energy sources. Thus, there is a need to find an alternative source of energy that satisfies the criteria of sustainable development and not only improves the economy but also supports the environment [2].
While biomass is considered a promising sustainable energy source due to projected availability and relatively low cost in the global energy market, not all biomass-based energies are equally sustainable. Its consumption addresses critical challenges in power generation, including climate change and global warming, and offers multiple benefits. Biomass can be used either directly by the process of combustion or gasification or indirectly by converting it into biofuels like bioethanol [3]. The substitution of fossil fuels with biofuels like bioethanol offers a sustainable solution to address critical challenges like the depletion of non-renewable resources, increasing fossil fuel prices, and the significant environmental concerns of using petroleum-based transportation fuels. Evolving towards renewable energy resources, eco-friendly biofuels generated from biomass can support developing countries in mitigating these issues efficiently [4].
Developing countries like Pakistan, which have been using bioenergy for years, rely heavily on biomass waste as their main energy resource [5]. The country has substantial potential for the production of bioenergy, specifically in rural regions that have abundant biomass resources. This could help increase the share of renewable energy in the country’s energy mix from the existing 1% to a projected 5% by 2030, fostering a more sustainable energy future [6]. Also, Pakistan is now implementing some projects that focus on electric power generation to address the gap in energy supply–demand as an essential potential of biomass production. Industries are increasingly using crop residues to produce biofuels, biodiesel, and bioethanol through advanced biochemical and thermochemical conversion processes, enabling effective use of green energy [7]. The abundance of crops in Pakistan, as outlined in Supplementary Materials Table S1, highlights the significant biomass potential available for energy generation. Pakistan’s government has accepted initiatives to start additional biomass energy plants and modernize renewable energy policies for the country’s wide-ranging biomass resources [8]. In addition, the Intergovernmental Panel on Climate Change (IPCC) has underlined the areas of agriculture and land use, in addition to transportation, as major providers of global greenhouse gas emissions [9]. Although agricultural yields have increased to feed a growing global population, an increase in agricultural waste has inappropriately accompanied this. In adopting cleaner fuels, the transportation sector needs enhancement sectors, like aviation, which still lag in this transition [10].
Lignocellulose materials are an encouraging and environmentally friendly alternative to fossil fuels in the production of bioethanol. Advanced technologies for bioethanol production from lignocellulose biomass have gained significant attention as a sustainable approach that avoids competing with other food crops and animal feed. A variety of lignocellulose agricultural biomass waste is readily available for this purpose, including rice husk, timber species, wheat straw, corn stover, sugarcane bagasse and others [11]. This agricultural byproduct feedstock is highly suitable for the production of bioethanol and plays an essential role in enhancing environmental sustainability. Thus, all three feedstocks have a substantial role in the production of bioethanol as the largest renewable energy resource, providing key advantages over fossil fuels and reducing greenhouse gas emissions. Wheat straw, corn stover, and rice husk are widely available options, and 60% of the crops’ feedstock is mostly abundant [12].
Because of the agricultural-based economy, Pakistan relies heavily on biomass energy and has a huge potential to produce bioenergy. Biomass energy accounts for approximately 50% of the country’s energy mix, mainly in the form of agricultural waste [13]. Pakistan’s bioenergy potential is significant, with estimates suggesting that the country could produce up to 30 million tons of biomass energy per annum [14]. Moreover, the main sources to produce biomass energy are agricultural waste, forestry waste, and municipal solid waste [15]. Lignocellulosic biomass is a promising feedstock for bioenergy production. However, its utilization poses several challenges. One of the primary challenges is the resistance of lignocellulosic biomass, which makes it difficult to break down into fermentable sugars [16]. Effective and advanced pretreatment methods are required to overcome this challenge, which can be energy intensive and costly. The process of enzymatic hydrolysis is also very slow and ineffective, which reduces biofuel yields [17]. On the other hand, despite the potential, the country’s bioenergy sector faces several challenges, including a lack of infrastructure and technology, limited investment and funding, inefficient energy conversion processes, and competing demands for biomass resources [18].
Biofuels, specifically bioethanol, have shown themselves to be a practical solution in both the agricultural and transportation sectors for mitigating carbon emissions. In China, a comprehensive life cycle assessment study was evaluated for bioethanol production from several agricultural feedstocks, highlighting the co-production of high-value byproducts like xylose and lignin [19]. In India, the bioenergy potential of utilizing this agriculture feedstock to produce biofuels, such as bio-oil, bioethanol and biodiesel, reduces GHG emissions and reliance on fossil fuels [20]. Furthermore, in Poland, there is a dire need to develop a low-carbon economy by promoting renewable energy and the wider use of biofuels, reducing carbon dioxide and GHG emissions [21]. However, this study significantly contributes to the development of sustainable bioethanol production from multiple agricultural feedstocks, enhancing energy security and mitigating climate change. The novelty of the present study lies in the comparative analysis of wheat straw, corn stover, and rice husk as feedstocks, identifying optimal conversion pathways and conditions. It provides new insights into the environmental and economic feasibility of bioethanol production from diverse agricultural feedstocks.
The study uses a cradle-to-gate approach to assess the environmental impacts of three different feedstocks. Because of their significant contribution to lignocellulose biomass, a comparative study is conducted to evaluate the environmental performance of corn stover, wheat straw, and rice husk. By using advanced technologies and scientific methods, the bioethanol plant benefits, practical applications, and feasibility are carefully assessed as a substitution for conventional methods [22]. In compliance with ISO 14040 and 14044 standards [23], this study used the life cycle assessment method as a reliable tool for assessing environmental impacts. It is a systematic approach that facilitates the estimation of products and services by performing sensitivity and Monte Carlo analysis as well as environmental impacts while assessing the economic sustainability of all stages of production in supply chains and ensuring environmental sustainability [24,25]. The LCA framework helps to identify the environmental and economic advantages and disadvantages of products, technologies, and policies, providing a comprehensive approach to decision-making [26].
This study presents a novel comparative life cycle assessment LCA of bioethanol production from three prominent agricultural waste feedstocks: corn stover, wheat straw, and rice husk. Although previous studies have considered bioethanol production from these feedstocks, this research differentiates itself by incorporating a comprehensive techno-economic assessment within the context of Pakistan, considering factors, such as feedstock availability, transportation logistics, and local market dynamics. The primary objectives of this study were (1) to quantify the environmental impacts associated with bioethanol production from each feedstock using LCA methodology, (2) to analytically calculate life cycle inventory data based on functional unit, (3) to develop a complete production model and process plan, (4) to conduct a detailed techno-economic analysis and project feasibility assessment, and (5) to provide valuable insights for policymakers and industry stakeholders in developing a sustainable bioenergy roadmap for the country.
2. Materials and Methods
2.1. Biomass Waste Characterization
Pakistan has many biomass resources, primarily derived from agricultural waste. This includes crop residues like rice straw, wheat straw, corn stalks, and cotton stalks, constituting a significant portion of the country’s biomass supply. The country produces an estimated 230 billion tons of biomass annually, with 12–15 million tons lessened by crop residues alone [27]. Moreover, current estimates place agricultural waste, which includes both agro-industrial byproducts and lignocellulose materials, at around 20,494 and 5271 million tons, respectively [4]. Notably, a substantial 44 million hectares of land is committed to agriculture within the country. Furthermore, these biomass resources present the potential for conversion into biofuels, including bioethanol and biodiesel, through the utilization of waste-to-energy technology.
Corn stover, wheat straw and rice husk are abundant lignocellulose biomass feedstock and globally cultivated crops and have the potential to produce bioethanol in large amounts. The International Energy Agency (IEA) estimates that bioethanol production from agricultural residues can reduce greenhouse gas emissions by up to 70% compared to fossil fuels [28]. In terms of biomass potential, it is estimated that corn stover and wheat straw produce up to 1.5 billion metric tons of biomass per year [29]. However, it is also estimated that rice husk produces up to 200 million metric tons of biomass per year in Asia [30]. Moreover, bioethanol production from these feedstocks reduces emissions and water and air pollution, which are linked with conventional agricultural practices [31].
The composition of crop distribution in Pakistan reveals that wheat dominates at 42% of the share, followed by cotton at 14%. Rice, sugarcane, and maize each contribute 4% to the agricultural landscape. This analysis also shows the composition of fertilizer consumption, with wheat and cotton being the primary consumers, accounting for approximately 45% and 23% of total fertilizer usage, respectively. Other crops, including pulses (5%), fodder crops (9%), oilseeds (6%), and miscellaneous categories (4%), also contribute to the agricultural sector [32].
2.2. Technological Framework for the Proposed Project
Figure 1 shows the selected feedstocks, including corn stover, wheat straw, and rice husk, and their corresponding pathways as sustainable feedstocks for bioethanol production. The production process comprises five main product stages. It starts with cultivation, where raw feedstock is grown under controlled agricultural management practices. This stage involves substantial inputs, such as energy, water, fertilizers, and pesticides, all of which influence the environmental impact of bioethanol production. Air emissions of nitrogen oxides, ammonia, and nitrous oxide were estimated due to fertilizer input, whereas nitrogen losses and heavy metal emissions to the groundwater were also presumed [33]. However, air emissions linked with pre-harvest fields were also obtained from [34]. Therefore, efficient cultivation methods can mitigate greenhouse gas emissions and energy consumption, particularly using organic fertilizers. After cultivation, the feedstock undergoes harvesting, a process that involves collecting and preparing it for further processing. For feedstocks like wheat straw, corn stover, and rice husk, this stage primarily involves collecting the non-edible portions of the crop left behind after grain harvesting. During harvesting, the key concerns include minimizing energy use and reducing material loss [35]. Once harvested, the feedstock is delivered to a storage facility where it is preprocessed.
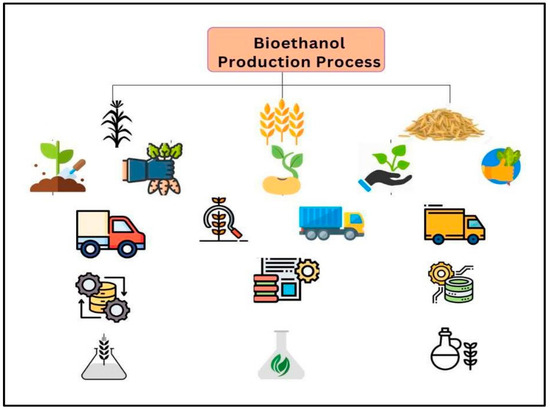
Figure 1.
Selected agriculture feedstock for bioethanol production.
Transportation plays a critical role because its mode significantly impacts energy use and emissions. Fuel-efficient transport methods can reduce the environmental footprint. Typically, agricultural residues serve as the source of feedstock, making transportation logistics even more critical to ensure timely delivery and prevent spoilage and material degradation. Therefore, when the feedstock is transported to a storage facility, it goes through preprocessing. Preprocessing usually involves drying, shredding, bailing, cutting or grinding the biomass to ensure uniform size and quality, which facilitates the conversion process [36]. Finally, the conversion process converts the prepared feedstock into bioethanol. This stage further includes chemicals, enzymes and microbial treatments according to the feedstock’s composition. Pretreatment is vital for lignocellulose materials, such as corn stover, wheat straw, and rice husk, to convert them into fermentable sugars. Moreover, advanced technologies, such as pretreatment and enzymatic hydrolysis, increase the efficiency of conversion while minimizing energy consumption and byproduct generation [37]. The following feedstocks describe each biofuel source.
Corn stover is a byproduct of the production of corn, and 31.5% of the harvested corn finishes up in the stover. After corn separation, the obtained stover is transported to the storage facility, where it is dried and baled, and then the stover goes into the biorefinery facility for biochemical conversion to ethanol [38]. Similarly, the production of wheat straw requires fertilization and the harvesting process. After going through these processes, it is baled and transported to a storage facility where it is dried, ground, and stored. Then, from the storage facility, the wheat straw is transported to a biorefinery facility for its biochemical conversion to produce bioethanol. This biochemical conversion process is similar to corn stover, and for conversions, diluted acid, pretreatment, enzymatic hydrolysis, and fermentation are the main processes [38]. However, rice husk is a byproduct of rice milling and presents unique challenges due to its high silica content. Rice husk is readily available from milling facilities as separation from rice bypasses field collection. After rice husk is collected from milling facilities, it is transported to a biorefinery facility for biochemical conversion to produce bioethanol. Due to its higher silica content, rice husk necessitates additional steps to improve its conversion efficiency compared to corn stover and wheat straw. While these feedstocks are not cultivated directly for the production of bioethanol, they all signify sustainable byproducts to ensure resource efficiency and marginal land-use expansion [39].
2.3. Life Cycle Assessment (LCA)
The ISO 14040 and 14044 standards [23,40] accurately outline Life Cycle Assessment, a widely recognized framework for assessing environmental impacts. This research employed LCA methodology, using the GaBi software (Version 10.0.0.71), to evaluate environmental impacts. Building upon the several phases of LCA, this framework highlights four interdependent phases. The first is the goal and scope definition phase. This phase clearly defines the objectives and conceptualization of the study, as well as the identification of needs and drivers. The second phase of LCA is life cycle inventory (LCI), and it covers modeling of data, data quality control and checks. It encompasses all the inventory data collected throughout the lifecycle process. The third phase of LCA is the life cycle impact assessment (LCIA) method, which calculates numerous environmental factors, such as air emissions and impacts on soil and water. Lastly, the fourth phase covers the interpretation process that shows the product innovation opportunities, measures project feasibility, and encourages sustainability while reducing environmental impacts. Therefore, these four phases of LCA are used in this study, and the environmental impacts were evaluated by using ReCiPe 2016 method by using GaBi software and improving the environmental performance of the biorefinery facility system.
2.4. Goal and Scope Definition
The study focuses on assessing the sustainability of bioethanol production using three different agricultural feedstocks, corn stover, wheat straw, and rice husk, and performing a comparative life cycle assessment. The purpose is to evaluate the environmental impacts of each feedstock throughout its complete life cycle and evaluate the feedstock that offers the most environmentally favorable option for bioethanol production [37]. Thus, the study scope incorporates all the essential stages of production, starting from initial cultivation to the final conversion process, to ensuring a detailed evaluation of all environmental impact categories. The study focuses on sustainable bioethanol production to decrease dependence on fossil fuels and move towards a circular economy.
2.5. Functional Unit and System Boundary
“1 kg of bioethanol” is used as a functional unit in this study along with the system boundary of “cradle-to-gate” to access the whole process and ensure a detailed environmental impact assessment among the three feedstocks. Data collection includes foreground data covering primary raw materials, operating materials, utility consumption, fertilizers, pesticides, diesel, and electricity, as well as background data that include emissions to air, water, and soil. The system boundaries contain all stages, starting from biomass cultivation, harvesting, and transportation to preprocessing and conversion into bioethanol. Figure 2 shows the production process of bioethanol with a cradle-to-gate system boundary. This comprehensive framework allows for a complete assessment of inputs and outputs throughout the bioethanol production lifecycle process, providing insights into the process’s environmental and economic performance.
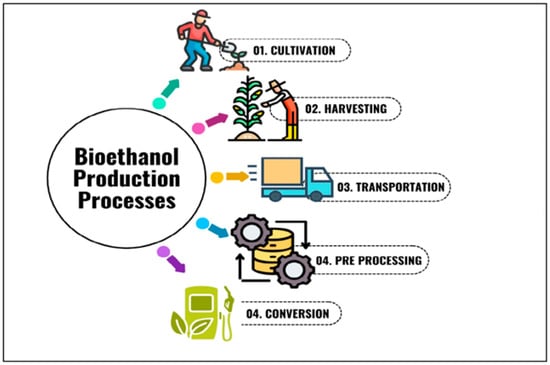
Figure 2.
Bioethanol production process of three agriculture feedstock.
2.6. Life Cycle Inventory (LCI)
The most dominant challenge in conducting LCA lies in ensuring the precision and reliability of data collected from both field sources and published literature. The success of the LCA depends critically on the accuracy of the LCI and its particular validation. In this study, foreground data related to local solid waste management systems and waste processing facility operations were collected directly from significant sources. On the other hand, background data were sourced from published literature, World Bank reports, and online websites. The developed model effectively signifies the interconnectedness of various processes, with inputs and outputs complexly linked across each stage.
Table 1 presents the LCI data, outlining resource inputs entering the system from the environment and material outputs exiting the system at each stage. This structured approach ensures a complete and balanced inventory for a thorough environmental assessment.

Table 1.
Inventory analysis of three feedstocks [41].
2.7. Life Cycle Impact Assessment (LCIA)
This research employed GaBi LCA software (version 10.0.0.71) to evaluate the environmental impacts related to the production of bioethanol. The ReCiPe 2016 Midpoint (H) v1.1 methodology was particularly selected for impact assessment, which is known as the most widely accepted framework within the LCA field [27]. Moreover, building upon earlier methodologies like CML and Ecoindicator 99, the ReCiPe 2016 (H) incorporates a comprehensive dataset and provides a standardized methodology for evaluating environmental impacts through 18 distinct impact categories. For a reliable assessment of the bioethanol production process, a systematic approach is used based on a standardized framework and a complete database to ensure the results that showed the highest criteria of LCA methodology [42]. The impact categories are further divided into three major areas of concern: human health, ecosystem quality and resource depletion [43]. The study performed overall environmental impacts by classifying these results into further stages like characterization, normalization, and weighting, in which characterization assigned different units to each impact category, and all categories had different units of identification. However, normalization changes all these units into a single metric unit for direct analysis and comparisons of all impacts. Normalized results are represented in three primary areas in which human health is represented as Disability Adjusted Life Years (DALYs), ecosystem quality is measured by species loss per year, and resource depletion is measured in economic terms. This systematic method ensures detailed, accurate and comprehensive environmental impact assessment results [44]. Other techniques of LCA were used to estimate reliable environmental impacts, like hotspot identification sensitivity analysis, to determine the most impactful stages within the whole production system. To evaluate environmental benefits, scenario modelling was performed as an alternate electricity source from photovoltaic solar instead of grid-mix electricity to mitigate environmental impacts. For the environmental impact assessment, GaBi Software was employed, while Microsoft Excel enabled formulation, data processing, and calculations. However, Wondershare EdrawMax and Microsoft Visio were used for the graphical representation and visualization of data, containing diagrams and charts. The final draft of the current study was prepared using Microsoft Word.
2.8. Uncertainty Analysis
An uncertainty analysis was performed using sensitivity analysis and Monte Carlo analysis to check the robustness of the results. A sensitivity analysis of the three agricultural feedstocks was performed using the major parameter of electricity. To identify the environmental and economic performance of the three feedstocks, the parameter was adjusted by a 10% increase and a 10% decrease in the system. The contributions of increasing or decreasing analysis allow the operational variability of the selected impact categories and the indicator’s performance. Moreover, the Monte Carlo analysis was also performed with a 10% increase and a 10% decrease in the major parameters of these three agriculture feedstocks.
2.9. Techno-Economic Assessment
To develop a robust basis for the bioethanol production system, a techno-economic analysis (TEA) was performed. This analysis elaborates on the standard characteristics and specifications of required equipment represented in published methodologies [45]. Key features guide the valuation of critical production system parameters, such as efficiency, operational lifecycle, and energy consumption. These parameters were determined by carefully assessing key process variables, including flow rates of materials, feedstock quantities, and energy demands. Additionally, the analysis covered the life cycle cost assessment method and cost–benefit analysis. The TEA methodology used in this study was modified from relevant literature studies [46].
2.9.1. Life Cycle Cost Assessment (LCC)
In this study, LCC and LCA shared a common scope, including both functional unit and system boundaries. The LCC was additionally divided into two components: Internal Cost (IC) and External Cost (EC). IC characterizes the conventional costs linked with bioethanol production, while EC covers potential costs primarily attributed to direct and indirect emissions throughout the life cycle stages [47]. Reducing the total LCC can foster a mutually beneficial relationship, benefiting both producers and the public interest. The LCC was considered by using Equation (1).
LC = IC + EC
Internal costs covered two types of costs: initial capital investment cost (ICI) and operational cost. Initial capital investment (ICI) costs included equipment and construction costs [47]. Operational cost contained maintenance cost (Cm), labor cost (Cl), utility cost (Cu), raw material cost (Cr) and transportation cost (Ctr). The LCC was calculated by using Equation (2).
IC = Cm + Cl + Cu + Cr + Ctr
Cr and Cu are calculated based on the data in Table 2, in which raw materials and utility prices were taken from the relevant literature. Additionally, the external cost represents the minimal damage cost, indicating society’s desire to avoid the environmental harm resulting from emissions. In this study, the EC was assessed using a simplified equation as outlined in Equation (3).
Table 2.
Midpoint assessment results of three feedstocks.
In Equation (3), Ck denotes the coefficient of the EC related to each emission type, including CO2, SO2, CH4, PM, NOx, CO, and NMVOC. These coefficients were derived from the present literature [48]. Ek, lc represents the amount of emission k produced throughout the life cycle, which was determined using the GaBi database and software [42].
2.9.2. Cost–Benefit Analysis (CBA)
To calculate the economic feasibility of project, a cost–benefit analysis is performed. It provides a detailed understanding of economic performance. The essential economic indicators of this process include net annual revenues, net present values, return on investment, and payback period (NAR, NPV, ROI, and PB, respectively). However, NAR is calculated by using Equation (4), while the other indicators, including NPV, ROI and PB, are calculated with Equations (5), (6) and (7), respectively.
NAR = (Annual Sales) − (Annual Investment)
When a project’s NPV is positive, it shows that the resulting project is economically feasible, and if the ROI is greater than 2.0, it shows the reliability of the project. Thus, the project is economically sustainable if the PB falls within a range of less than five years [49]. Figure S1 shows the framework of techno-economic analysis.
3. Results
3.1. Environmental Impact Assessment of Bioethanol Production Using LCIA
The bioethanol production process can be divided into three main stages, and each stage arises from different locations from initial cultivation to growing, harvesting, and being transported to the conversion facility. The second stage covers the preprocessing phase in which the feedstock is ground, shredded and dried, and in the last stage, it is converted into bioethanol [41]. The study provides a comparative assessment of bioethanol production from wheat straw, corn stover, and rice husk to evaluate the process’s sustainability. This comparison provides valuable insights to improve bioethanol yields, as well as the potential of reducing waste of each feedstock and transitioning towards eco-friendly alternative options. To assess environmental impact assessment, software GaBi with the ReCiPe 2016 Midpoint (H) methodology is used as a key tool for data analysis that allows the study to detect environmental impacts across 18 different categories that highlight potential opportunities for improvement. During the project’s entire lifecycle, a detailed and extensive database of GaBi is used to evaluate environmental performance [50]. Moreover, to ensure the accuracy of the project assessment, other assessments were also calculated, including midpoint assessment, normalization, hotspot identification, endpoint assessment, scenario modelling, and sensitivity analysis [51].
3.2. Midpoint Impact Assessment of Three Feedstocks in Bioethanol Production
To assess the environmental impacts of bioethanol production, the ReCiPe 2016 Midpoint (H) database methodology is used for impact assessment across various impact categories due to its comprehensive and standardized framework. Moreover, for a detailed evaluation of environmental impacts, each category is defined by its specific unit of measurement. The midpoint environmental impacts for corn stover, wheat straw and rice husk are represented in Table 2.
As Table 2 shows, the positive numbers show that there is an increase in environmental burdens, whereas the negative numbers, and vice versa, show a decrease in environmental impacts and encouraging sustainability [10].
The midpoint results showed global warming potential (GWP) as an important concern, particularly for wheat straw because it has a higher contribution of 142 kg CO2 eq. in all 18 categories of the three feedstocks. Meanwhile, corn stover contributes 43.5 kg CO2 eq., a moderate contribution, and rice husk has the lowest emission of GWP of about 24.7 kg CO2 eq. These environmental outcomes are linked with the same classification of human health, ecosystem quality and resource depletion. Remarkably, the three feedstocks collectively presented the highest GWP values compared to all other impact categories. The primary drivers of GWP are emissions related to fossil fuels and grid-mix electricity, which contribute more than half of the total GWP. The key contributors to this impact comprise greenhouse gases, such as CO2, CH4, and N2O, which show the most substantial environmental impact among the numerous emissions. This substantial contribution highlights the importance of mitigating greenhouse gas emissions in the bioethanol production process.
Other prominent impact categories for the comparative analysis comprise terrestrial ecotoxicity, fossil depletion, and human toxicity (non-cancer). For terrestrial ecotoxicity, wheat straw has a value of 126 kg 1,4-DB eq., significantly greater than corn stover at 38.7 kg 1,4-DB eq. and rice husk at −811 kg 1,4-DB eq. Similarly, wheat straw exhibits the highest fossil depletion at 34.3 kg oil equivalent, compared to 10.5 kg for corn stover and 5.94 kg for rice husk. The trend of human toxicity (non-cancer) is similar, with wheat straw exhibiting the highest level at 13.5 kg 1,4-DB eq., followed by corn stover at 4.14 kg 1,4-DB eq. and rice husk at −4.05 kg 1,4-DB eq. Additionally, the comparative midpoint analysis discloses that land use and terrestrial acidification are among the moderately impactful categories. Wheat straw has the most significant impact on land use potential, with a value of 2.99 annual crop eq.⋅yr, followed by corn stover at 0.914 annual crop eq.⋅yr and rice husk at 0.517 annual crop eq.⋅yr. For terrestrial acidification, wheat straw again leads with 1.29 kg SO2 eq., whereas corn stover and rice husk show lower impacts of 0.394 kg SO2 eq. and 0.223 kg SO2 eq., respectively. In contrast, rice husk consistently shows minimal contributions, with negligible impacts in several categories due to its negative or very low values. These results highlight that rice husk contributes the least to the overall environmental burden, while wheat straw appears to have the most impact among the three feedstocks.
3.3. Normalized Midpoint Impact Assessment Results
Table 3 presents the midpoint impact categories that were further transformed into normalized results to find the hotspot areas of impact. This study used the ReCiPe 2016 V1.1 midpoint (H) method, excluding biogenic carbon effects and integrating person-equivalent weighting factors. Every impact category has a diverse equivalence factor and rate, which were taken from the published literature. Midpoint results were further multiplied with related factors to obtain normalized midpoint results. Among the three feedstocks, wheat straw showed the highest environmental impact in all categories. Specifically, the highest contribution for wheat straw came from fossil depletion 0.0348831, photochemical ozone formation was second with 0.0295785, and global warming (climate change) was third with 0.01775. Likewise, for the feedstocks corn stover fossil depletion, photochemical ozone formation and climate change contribute 0.0106785, 0.00907074, and 0.0054375, respectively. For the rice husk feedstock, fossil depletion contributes 0.00604098, photochemical ozone formation produces 0.005138208, and climate change contributes 0.0030875, showing substantially lower contributions that may be negligible. In contrast, the remaining impact categories for all three feedstocks, including corn stover, wheat straw, and rice husk, exhibit very low emissions in the normalized results. These results revealed that wheat straw has remarkable environmental impacts in certain categories. The overall environmental footprint of all three feedstocks is relatively small in other areas.
Table 3.
Normalized results (Person Equivalent) of each feedstock.
3.4. Endpoint Assessment Results of Bioethanol Production Process
The damage classification method evaluated the overall environmental impact. This involved the grouping of effect categories into three extensive categories: human health, ecosystem degradation, and resource depletion. To ensure reliable analysis, each category was normalized and allocated a single-unit metric. Additionally, the analysis delves deeper into the significant projections within each of these groups to uncover their specific impacts. Table 4 discusses the results, providing a comprehensive overview of all the environmental impacts.
Table 4.
Endpoint assessment results of each feedstock for bioethanol production.
According to Table 4, resource depletion appeared as the most critical impact category among three feedstocks, with fossil depletion ($2.45) a larger contributor in wheat straw, while metal depletion contributed a smaller portion ($0.0144). The human health category revealed moderate exposure to the feedstock wheat straw, with a total impact score of 4.29 × 10⁻⁴ DALY. Climate change (0.000132 DALY) and the formation of fine particulate matter (0.000293 DALY) significantly contributed to this impact category of feedstock. However, the environmental impacts of the feedstock wheat straw in ecosystem degradation were marginal, with an overall impact score of 7.71 × 10⁻⁷ species per year, making it comparatively insignificant. The remaining two feedstocks, corn stover and rice husk, showed less environmental impact than wheat straw. Corn stover had moderate impacts on all three groups, including resource depletion, human health, and ecosystem degradation, with an overall impact score of $0.75342, 1.31 × 10⁻⁴ DALY, and 2.36 × 10⁻⁷ species. yr, respectively. Additionally, the third feedstock, rice husk, showed negligible environmental impacts among these three groups and the remaining categories were also supposed to be insignificant and excluded from further consideration. This grouping provides a clear understanding of the major areas of environmental concern, underlining resource depletion as the most critical area among the three feedstocks for targeted mitigation efforts.
3.5. Hotspot Identification of Bioethanol Production Process
A comparative analysis was directed to locate the most impactful stages within the bioethanol production system across three feedstocks. Figure S2 explains the percentage contribution of each stage to the overall environmental impacts among two feedstocks. Figure 3 illustrates the percentage contribution of each stage of wheat straw and its overall environmental impacts, highlighting the stage with the highest environmental impacts.
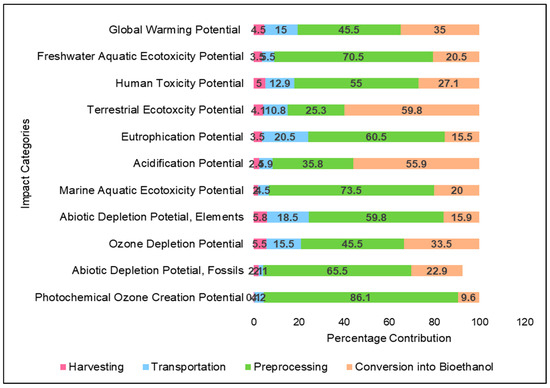
Figure 3.
Hotspot identification of feedstock wheat straw to produce bioethanol.
Remarkably, grid-mix electricity composed of 80% non-renewable and 20% renewable energy sources significantly affects the environmental footprint of bioethanol production. This study provides critical insights into the key hotspots within the bioethanol production system, guiding efforts to reduce environmental impacts. Specific contributions of the feedstock wheat straw in the preprocessing stage of producing bioethanol include photochemical ozone depletion potential (86.1%) and all other three processing stages (13.9%), making a one hundred percent contribution to this category. In marine ecotoxicity, the preprocessing stage is a higher contributor at (73.5%), other processing stages contribute (26.5%), fossil depletion potential in preprocessing contributes (65.5%), and other stages contribute (34.5%) in this impact category. For the conversion process, the main contributors are terrestrial ecotoxicity potential (59.8%) and the other processes contribute (40.2%), acidification potential in the conversion process shows (55.9%), and the other processes contribute (40.2%). The global warming potential has (35%), ozone depletion potential (33.5%), and human toxicity potential (27.1%) as higher contributors in the conversion process stage. Likewise, the transportation process plays a substantial role, contributing 20.5% to eutrophication potential and 18.5% to abiotic depletion potential. In contrast, the harvesting stage has a negligible impact and can largely be ignored in the overall assessment.
3.6. Uncertainty Analysis Results
3.6.1. Sensitivity Analysis
Sensitivity analysis was conducted to calculate the variability of LCIA results and improve the reliability of the current study. The analysis focused on identifying how changes in key parameters impact the overall LCIA outcomes [52]. The independent variable, signifying variations in key parameters, was adjusted by a coefficient of 10%. However, the corresponding dependent variable expressed by both changing values (increase or decrease in the current scenario) and percentage rates (increase or decrease in percentage) was the resulting change in LCIA outcomes. Table 5 provides a detailed summary of the most significant impacts, showcasing the variations in LCIA results.
Table 5.
Sensitivity Analysis for the feedstock for bioethanol production.
Therefore, Table 5 clearly states that if the reduction value of grid-mix electricity consumption reduces to 10%, stratospheric ozone depletion potential for wheat straw, corn stover, and rice husk (2.16%, 3.23%, 1.59%, respectively), terrestrial acidification for corn stover, wheat straw, and rice husk (1.32%, 2.38%, 0.740%, respectively), land use (1.30%, 2.04%, 0.74%, respectively), human toxicity (non-cancer) for three feedstocks (1.31% corn stover, 2.72% wheat straw, rice husk 1.25%), and fine particulate matter formation for wheat straw, corn stover and rice husk (2.19%, 1.32%, 0.74%, respectively) were identified as key impact categories. However, other impact categories showed lower uncertainty, and these key areas revealed significant variability through the three feedstocks. Remarkably, rice husk showed the least impact on changes in electricity use, whereas these variations most significantly impacted the overall environmental burdens.
3.6.2. Monte Carlo Analysis
To evaluate the data variability related to bioethanol production, Monte Carlo analysis was performed. This probabilistic method simulates the inconsistency of 18 impact categories and key parameters to evaluate the range of potential outcomes. Table 6 presents the base values, averages, SD, 10% and 90% results of uncertainty analysis of the bioethanol production process for the feedstock wheat straw. In contrast, the uncertainty analysis of corn stover and rice husk is shown in Tables S3 and S4, respectively, in the Supplementary Materials.
Table 6.
Uncertainty analysis of the impact categories of wheat straw for the bioethanol production process.
3.7. Scenario-Based Assessment of Bioethanol Production from Three Feedstocks
The base case scenario modelling estimated the environmental impacts by varying the main contributing factors. The primary contributor to environmental degradation is grid-mix electricity, which derives 80% from non-renewable sources, such as petroleum, natural gas, furnace oil and coal, and only 20% from renewable sources [53]. Table 7 indicates the potential benefits of substituting grid-mix electricity with photovoltaic (solar) energy. This replacement significantly reduced the environmental impact across various categories among three feedstocks.
Table 7.
Current scenario versus proposed scenario models for each feedstock of bioethanol production process.
Corn stover, among all feedstocks, shows considerable changes. The changes in key impact values are climate change reduced from 43.5 kg CO2 eq. to 33 kg CO2 eq., terrestrial ectoxicity reduced from 38.7 kg 1,4-DB eq. to 29.3 kg 1,4-DB eq., fossil depletion reduced from 10.5 kg oil eq. to 7.94 kg oil eq., and human toxicity (non-cancer) decreased from 4.14 kg 1,4-DB eq. to 3.13 kg 1,4-DB eq. Moreover, wheat straw showed changes in climate change from 142 kg CO2 eq. to 140 kg CO2 eq., terrestrial ecotoxicity reduced from 126 kg 1,4-DB eq. to 124 kg 1,4-DB eq., fossil depletion from 34.3 kg oil eq. to 33.6 kg oil eq., and land use 2.99 annual crop eq.·y to 2.93 annual crop eq.·y. However, corn stover and wheat straw generally showed a decrease in environmental impact values when substituted with photovoltaic solar cells. At the same time, rice husk indicated an increase in some categories after replacement, such as climate change increases from 24.7 kg CO2 eq. to 33.3 kg CO2 eq., fossil depletion increases from 5.94 kg oil eq. to 8.02 kg oil eq., and terrestrial acidification increases from 0.223 kg SO2 eq. to 0.301 kg SO2 eq. However, all other impact categories for rice husk showed a reduction in overall impacts. The analysis revealed that transitioning from grid-mix electricity to photovoltaic energy significantly reduced environmental impacts across multiple categories for all feedstocks, particularly for corn stover and wheat straw. However, minor increases were observed in some impact categories for certain impact categories of rice husk. However, the overall trend indicates a significant decrease in the environmental burden. Table S2 provides detailed scenario-based results for all the feedstocks, which further illustrate the impacts of this energy transition, promoting sustainability and decreasing ecological burdens.
3.8. Techno-Economic Analysis of Bioethanol Production Process
To evaluate the data variability related to bioethanol production, Monte Carlo analysis was performed. This probabilistic method simulates the inconsistency of 18 impact categories and key parameters to evaluate the range of potential outcomes. Table 8 presents the base values, averages, SD, 10% and 90% results of uncertainty analysis of the bioethanol production process for the feedstock wheat straw. The economic assessment results show the feasibility of bioethanol production plants from different agricultural feedstock. LCC assessment analysis conducted in this study included both internal and external costs. Equation (2) was used to calculate the internal cost; by using this Equation, the internal cost was evaluated as $225,921. Furthermore, the initial capital investment cost was calculated as $478,515, including the equipment’s purchasing cost of $257,522 [53] and the construction cost of $220,993 (NEPRA). The operational costs, including maintenance cost, raw material, transportation, labor, and utility costs, were calculated as ($16,748), ($53,202), ($39,266), ($51,812), and ($64,893), respectively. Table 8 shows the calculation of internal and operational costs.
Table 8.
Data for the calculation of internal costs.
Table 9 shows the topmost environmental impact emissions that were recorded, including carbon dioxide (CO2), sulfur dioxide (SO2), nitrogen oxides (NOx), particulate matter (PM), carbon monoxide (CO), methane (CH4), and Non-methane volatile organic compound (NMVOC). These emissions collectively added to a total external cost of $14.23. However, the LCC was calculated by using Equation (1) as $225,935.
Table 9.
Life cycle emissions, external co-efficient cost, and external cost.
To understand the economic feasibility of the bioethanol plant, total income generation was also evaluated. This involved calculating the revenue generated at fluctuating production levels, considering factors such as ethanol production capacity and the dominant market price. The total income generation by the bioethanol production plant was $9600 for a single day in a shift of eight working hours. Likewise, monthly income generation was considered as $211,200 with 22 working days in eight-hour shifts a day. The yearly income generation by the bioethanol plant was $2,534,400. The income produced by the bioethanol production plant is shown in Table 10.
Table 10.
Income generation from the bioethanol production plant.
The economic indicators used in calculating the cost–benefit analysis also show a potential asset for the production of bioethanol from different feedstocks to decrease waste and produce energy in a significant amount. NAR was calculated using Equation (4); at the beginning of the three years, the NAR feasible score was considered $2,308,478. Likewise, the NPV was calculated as $781,194. This assessment shows an ROI of 4.8%, and the PB of the initial capital investment was 2 years. A comprehensive assessment for 20 years assumed a 10% discounting factor and a 5% inflation rate [57].
4. Discussion
4.1. Comparative Analysis with Existing Studies and Recent Innovations in Bioethanol Production Technologies
This study provides significant importance to the increasing research on WTE technologies by comprehensively evaluating the environmental and economic benefits of the bioethanol production process. Table 11 provides a comparative table of different studies on producing bioethanol with different feedstock types and assessment methods.
Table 11.
Comparative Study of different studies of producing bioethanol.
To enhance economic feasibility, the feedstock corn stover highlights the importance of optimizing production process parameters [63]. Moreover, this study’s techno-economic analysis highlights the cost–effectiveness of the whole process and collectively shows the importance of selecting suitable feedstocks to ensure the sustainability and economic feasibility of the bioethanol production process. By combining LCA with TEA, the proposed study fills a critical gap in the literature and provides actionable insights into the production process to achieve sustainability within the circular economy framework [47]. The recent innovations primarily focused on using second-generation biomass feedstock for bioethanol production processes like lignocellulose biomass through advanced pretreatment methods, improved enzymatic hydrolysis, and advanced fermentation techniques. Furthermore, recent technologies also utilize third and fourth-generation feedstocks like algae to enhance efficiency, aiming to reduce dependency on food crops and improve sustainability [64]. These innovations address feedstock variability challenges and improve overall process environmental performance and efficiency.
4.2. Current Challenges and Policy Suggestions
Bioethanol production from lignocellulose biomass, especially rice husk, offers a promising solution for sustainable waste and energy development in Pakistan. However, numerous challenges hinder its extensive adoption. These include technological limitations, such as inefficient harvesting practices, often depending on conventional methods, contributing to crop residue losses and increasing energy consumption. Due to inefficient management practices and a lack of modern machinery, post-harvest losses occurred in large amounts because the overuse of agrochemicals and pesticides can decrease crop quality and soil degradation. Therefore, in rural areas, the lack of proper infrastructure increases energy consumption and contributes to higher transportation costs. Addressing these issues demands sustainable agriculture practices and implementation of these measures to refine the overall production process and enhance sustainability in a country.
To overcome all these challenges, policy measures must be adopted to enhance waste-to-energy technologies and promote the biofuel market with financial incentives. Pakistan can improve its capacity for sustainable bioethanol production by accepting these strategies and advancements in life cycle assessment tools like GaBi software (Version 10.0.0.71)and SimaPro software (Craft 10.1) that enable more accurate environmental, economic, and social impact assessment for the integration of a bio-based circular economy. With the help of subsidies and incentives from the government and with public awareness of these waste-to-energy conversion technologies from different feedstocks, Pakistan has the potential to face future challenges and move towards a greener future. The results provide valuable insights into the underlying environmental forces, which are presented in a clear and comprehensible manner. The research highlights the viability and benefits of combining techno-economic and environmental assessments, producing a scientific approach that balances multiple priorities. By combining these findings into agricultural practices and policy initiatives, this study can support the growth of a sustainable and economical bioethanol industry in Pakistan by promoting the long-term sustainability of agricultural systems.
To promote waste-to-energy conversion technologies in Pakistan, the government should implement a complete and comprehensive policy framework that contains financial incentives, infrastructure development, and feedstock management. Subsidies and tax exceptions on production plant equipment can attract and minimize the initial cost of investments for producers. Policies to ensure the efficient collection, storage, and transportation of agricultural feedstock, specifically the selected feedstocks, are critical to address. Moreover, funding for research and development (R&D) in advanced biofuel technologies can improve production efficiency and local conditions. In addition, integrating waste into energy technologies in Pakistan reduces dependence on fossil fuels and improves the country’s renewable energy strategy. Funding sustainability standards and feedstock management policies will also encourage environment-friendly production practices without compromising agricultural feedstock. Public awareness campaigns directing farmers and industries can highlight the economic and environmental benefits. Partnerships with international stakeholders can bring technical expertise and attract foreign investments as well. Thus, export-enabling policies can help Pakistan tap into global biofuel markets, generating additional revenue and strengthening the country’s position in the renewable energy sector.
4.3. Sustainability Implications
Sustainability implications for bioethanol production facilities from agriculture feedstock are different in environmental, social, and economic dimensions. The bioethanol production process utilizes agricultural waste, reducing greenhouse gas emissions, and is generally considered a more sustainable option than using various food crops [65]. Using these lignocellulose materials, which are usually discarded, not only provides a renewable energy source but also contributes to environmental conservation by addressing waste management challenges [66]. The production of bioethanol generates economic revenue through the use of biofuels in transportation as an alternative to gasoline. It also reduces societal costs by using low-cost raw materials with lower production costs, does not compete with food markets, mitigates climate change, and enhances energy supply security.
Utilizing bioethanol from these feedstocks provides some significant social benefits that are further aligned with sustainable development goals. Converting this agricultural waste into bioethanol encourages efficient waste management, decreases environmental pollution, and contributes to cleaner communities. In addition, this conversion process also promotes rural development by enhancing local economies by creating job opportunities in biomass waste collection, processing, and distribution and supports social equity [67]. According to recently developed technologies, biological pretreatment is one of the most critical methods for treating lignocellulose material to produce bioethanol and making the process and technology competitive with other conventional energy sources, enhancing energy security and thereby reducing dependence on fossil fuels while mitigating environmental pollution [64].
Bioethanol production from agriculture feedstocks directly linked SDG 7, SDG 8, SDG 9, and SDG 12. By converting this feedstock into a renewable energy resource, dependency on fossil fuel decreases, and this process promotes access to affordable and clean energy, supporting SDG 7. Moreover, the bioethanol industry also encourages job creation through biomass collection, distribution, and processing, which supports SDG 8 by stimulating economic growth and providing decent work opportunities. However, using agriculture feedstock by repurposing waste materials exemplifies responsible consumption for bioethanol production and directly aligns with SDG 12, which is responsible consumption and production. Therefore, bioethanol production also serves as a cleaner alternative to conventional fuels, reducing greenhouse gasses to combat climate change linked with SDG 13 climate action. By integrating these practices, this study supports environmental sustainability and economic and social well-being and also contributes to achieving these SDGs.
4.4. Practical Implications of This Study
The adoption of bioethanol in the local energy sector can have substantial practical implications. For instance, the use of bioethanol as a transportation fuel can reduce greenhouse gas emissions and improve air quality, contributing to a cleaner environment. Furthermore, bioethanol production can create new economic opportunities for local farmers and communities, inspiring rural development and reducing poverty. Likewise, the integration of bioethanol into the existing energy infrastructure can enhance energy security and reduce dependence on imported fossil fuels, thereby improving the country’s overall energy self-reliance.
The outcomes of this research are useful and bridge the gap between scientific analysis and real-world applications. This study assesses the techno-economic and environmental sustainability of bioethanol production from these three feedstocks: corn stover, wheat straw, and rice husk. The sustainability assessment incorporates the technical, economic, and environmental pillars, providing a holistic approach to producing bioethanol. Through comprehensive LCA, scenario modelling, sensitivity analysis, and Monte Carlo analysis, this research quantifies the environmental impacts of bioethanol production, highlighting areas of feedstock for improvement. Furthermore, the assessment of energy consumption, cost estimation, and technical modelling offer valuable insights for the sustainable development of bioethanol production facilities. The study covers sustainable agricultural feedstock management, waste-to-energy enterprises, biofuel facility development, environmental management, and resource efficiency. It helps as a guideline for stakeholders and policymakers, helping in the achievement of Sustainable Development Goals, such as SDG7 (Affordable and clean energy), SDG 8 (Decent Work and Economic Growth), SDG12 (Responsible consumption and production), and SDG13 (Climate Action). By providing a framework to address environmental challenges and influence agricultural feedstock effectively, this research validates the feasibility and integrity of bioethanol production as a sustainable solution. The results highlight bioethanol’s potential to support renewable energy targets, drive economic growth, and encourage environmental sustainability, offering a strategic triple-benefit opportunity for Pakistan.
4.5. Study Limitations
There are several limits linked with producing bioethanol in Pakistan using feedstocks such as corn stover, wheat straw, and rice husk. The scarcity of corn stover, rice husk, and wheat straw stems from their difficult applications, such as fodder, fuel, and mulching. For lignocellulose bioethanol production, the country has limited access to advanced technologies. Seasonal fluctuations and region-specific production of crops cause different variations in supply and negative effects on soil fertility from the removal of residues, mainly wheat straw. High costs of transportation and storage due to the bulky nature of these feedstocks, as well as the high cost of preprocessing steps like drying, shredding and grinding. High production costs and competition with other fossil fuels present market challenges. Lack of government incentives, subsidies, and supportive policies for waste-to-energy conversion technologies.
Bioenergy production also faces key limitations, including feedstock competition with food production, high processing costs, and challenges regarding collection, transportation, and storage, which make large-scale adoption difficult, especially in developing countries. The current study overcomes these issues by using agricultural waste feedstock for bioethanol production, avoiding competition with food crops. Through LCA and TEA, the study showed that rice husk-based bioethanol offers higher efficiency, lower costs, and reduced emissions compared to conventional bioenergy sources. This approach enhances waste utilization, economic feasibility, and environmental sustainability, making bioethanol a more practical renewable energy solution.
5. Conclusions
The study calculated the sustainability of producing bioethanol from three agricultural byproduct feedstocks, corn stover, wheat straw, and rice husk, using 1 kg of bioethanol as the functional unit. The key sustainability indicators, comprising techno-economic and environmental impacts, were evaluated. The environmental analysis highlighted that wheat straw had the highest mid-point contributions, with significant impacts on Global Warming Potential (142 kg CO2 eq.), Terrestrial Ecotoxicity (126 kg 1,4-DB eq.), Fossil Depletion (34.3 kg oil eq.), Human Toxicity Non-Cancer (13.5 kg 1,4-DB eq.), and Land Use (2.99 annual crop eq.·yr) as compared to the other two feedstocks. However, corn stover was identified as a moderate contributor to these impacts. Among the three feedstocks, rice husk emerges as the most environmentally favorable option, contributing minimal emissions and impacts, making it the most environmentally favorable option for bioethanol production in Pakistan. The techno-economic analysis revealed the technological and economic feasibility of the process, taking into account critical factors like energy usage, equipment cost, labor requirements, and operational circumstances. Annually, the bioethanol plant produced an income of $2,534,400. Moreover, the life cycle cost of the bioethanol plant was analyzed, showing an initial capital investment of $478,515 and ongoing internal costs of $225,921. Environmental emissions were linked to an external cost of $14.23. However, the total life cycle cost amounted to $225,935, representing that the bioethanol production plant is both environmentally sustainable and economically viable. From an economic standpoint, bioethanol production offers a significant opportunity to generate substantial income and serves as a viable alternative to fossil fuels. To further enhance the sustainability of bioethanol production, future research should focus on improving feedstock efficiency and exploring integration opportunities with other renewable energy sources by utilizing agricultural wastes. Additionally, optimizing conversion technologies and supply chain logistics can help reduce environmental impacts and economic costs. By addressing these areas, the bioethanol industry can move towards a more sustainable, cleaner and greener future.
Supplementary Materials
The following supporting information can be downloaded at: https://www.mdpi.com/article/10.3390/pr13041027/s1, Figure S1: Techno-economic analysis of bioethanol production process; Figure S2: Hotspot identification representing two feedstock’s; Table S1: Potential of harvesting residues of crops [68]; Table S2: Scenario Modelling (midpoint) results of each feedstock; Table S3: Uncertainty analysis of the impact categories of corn stover for the bioethanol production process; Table S4: Uncertainty analysis of the impact categories of rice husk for the bioethanol production process. References [4,68,69,70,71] are cited in the Supplementary Materials.
Author Contributions
Conceptualization, K.S.; methodology, K.S.; software, K.S.; validation, K.S.; writing—original draft preparation, K.S.; writing—review and editing, K.S.; visualization, K.S.; investigation, M.R.; project administration, K.S.; data curation, A.-S.N.; supervision, A.-S.N. All authors have read and agreed to the published version of the manuscript.
Funding
This research received no external funding.
Data Availability Statement
All the data have been used in the manuscript, and literature references are provided in the reference list.
Conflicts of Interest
The authors declare no conflicts of interest.
References
- Tareen, W.; Anjum, Z.; Yasin, N.; Siddiqui, L.; Farhat, I.; Malik, S.A.; Mekhilef, S.; Seyedmahmoudian, M.; Horan, B.; Darwish, M.; et al. The Prospective Non-Conventional Alternate and Renewable Energy Sources in Pakistan—A Focus on Biomass Energy for Power Generation, Transportation, and Industrial Fuel. Energies 2018, 11, 2431. [Google Scholar] [CrossRef]
- Buchner, B.; Clark, A.; Falconer, A.; Macquarie, R.; Meattle, C.; Tolentino, R.; Wetherbee, C. Global Landscape of Climate Finance 2019. Clim. Policy Initiat. 2019, 32, 1–38. [Google Scholar]
- Johansson, V.; Lehtveer, M.; Göransson, L. Biomass in the electricity system: A complement to variable renewables or a source of negative emissions? Energy 2019, 168, 532–541. [Google Scholar] [CrossRef]
- Becerra-Pérez, L.A.; Tyner, W.E.; García-Paez, B. Cellulosic Ethanol in Mexico: An Appraisal as Industrial Feedstock. In Advances in Renewable Energy Engineering; Digambar, N.P., Ed.; Akinik Publications: New Delhi, India, 2019; Volume 1, ISBN 978-93-5335-557-9. [Google Scholar]
- Imran, M.; Zahid, A.; Mouneer, S.; Özçatalbaş, O.; Ul Haq, S.; Shahbaz, P.; Murtaza, M.R. Relationship between household dynamics, biomass consumption, and carbon emissions in Pakistan. Sustainability 2022, 14, 6762. [Google Scholar] [CrossRef]
- NREL. Biomass Sites in Pakistan; National Renewable Energy Laboratory: Golden, CO, USA, 2018.
- Karthikeyan, O.P.; Mehariya, S.; Wong, J.W.C. Bio-refining of food waste for fuel and value products. Energy Procedia 2017, 136, 14–21. [Google Scholar] [CrossRef]
- Adams, P.; Bridgwater, T.; Lea-Langton, A.; Ross, A.; Watson, I. Biomass Conversion Technologies. In Greenhouse Gases Balances of Bioenergy Systems; Academic Press: Cambridge, MA, USA, 2018; pp. 107–139. [Google Scholar]
- Shukla, P.R.; Skea, J.; Reisinger, A.; Slade, R.; Fradera, R.; Pathak, M.; Vyas, P. Climate Change 2022 Mitigation of Climate Change Working Group III Contribution to the Sixth Assessment Report of the Intergovernmental Panel on Climate Change Summary for Policymakers Edited by, 2022. Available online: www.ipcc.ch (accessed on 19 September 2022).
- Babu, S.; Rathore, S.S.; Singh, R.; Kumar, S.; Singh, V.K.; Yadav, S.K.; Wani, O.A. Exploring agricultural waste biomass for energy, food and feed production and pollution mitigation: A review. Bioresour. Technol. 2022, 360, 127566. [Google Scholar] [CrossRef]
- Singh, R.; Shukla, A.; Tiwari, S.; Srivastava, M. A review on delignification of lignocellulosic biomass for enhancement of ethanol production potential. Renew. Sustain. Energy Rev. 2014, 32, 713–728. [Google Scholar] [CrossRef]
- Zhao, L.; Chang, S.; Wang, H.; Zhang, X.; Ou, X.; Wang, B.; Wu, M. Long-term projections of liquid biofuels in China: Uncertainties and potential benefits. Energy 2015, 83, 37e54. [Google Scholar] [CrossRef]
- IEA. Energy Access Outlook 2020: Analyzing the Pathways to Universal Access; IEA: Paris, France, 2020. [Google Scholar]
- NEPRA. Renewable Energy Policy 2019; NEPRA: Islamabad, Pakistan, 2019. [Google Scholar]
- Khan, S.; Nisar, A.; Wu, B.; Zhu, Q.L.; Wang, Y.W.; Hu, G.Q.; He, M.X. Bioenergy production in Pakistan: Potential, progress, and prospect. Sci. Total Environ. 2022, 814, 152872. [Google Scholar]
- Liu, T.; Miao, P.; Shi, Y.; Tang KH, D.; Yap, P.S. Recent advances, current issues and future prospects of bioenergy production: A review. Sci. Total Environ. 2022, 810, 152181. [Google Scholar]
- Benti, N.E.; Gurmesa, G.S.; Argaw, T.; Aneseyee, A.B.; Gunta, S.; Kassahun, G.B.; Asfaw, A.A. The current status, challenges and prospects of using biomass energy in Ethiopia. Biotechnol. Biofuels 2021, 14, 1–24. [Google Scholar]
- Falfushynska, H. Advancements and prospects in algal biofuel production: A comprehensive review. Phycology 2024, 4, 548–575. [Google Scholar] [CrossRef]
- Yin, T.; Huhe, T.; Li, X.; Wang, Q.; Lei, T.; Zhou, Z. Research on Life Cycle Assessment and Performance Comparison of Bioethanol Production from Various Biomass Feedstocks. Sustainability 2024, 16, 1788. [Google Scholar] [CrossRef]
- Venkatramanan, V.; Shah, S.; Prasad, S.; Singh, A.; Prasad, R. Assessment of bioenergy generation potential of agricultural crop residues in India. Circ. Econ. Sustain. 2021, 1, 1335–1348. [Google Scholar] [CrossRef]
- Piwowar, A.; Dzikuć, M. Bioethanol production in Poland in the context of sustainable development-current status and future prospects. Energies 2022, 15, 2582. [Google Scholar] [CrossRef]
- Kargbo, H.; Harris, J.S.; Phan, A.N. “Drop-in” fuel production from biomass: Critical review on techno-economic feasibility and sustainability. Renew. Sustain. Energy Rev. 2021, 135, 110168. [Google Scholar]
- ISO 14040; Environmental Management—Life Cycle Assessment—Principles and Framework; International Standard. International Organization for Standardization: Geneva, Switzerland, 2006.
- Halim, S.A.; Mohd, N.A.; Razali, N.A. A comparative assessment of biofuel products from rice husk and oil palm empty fruit bunch obtained from conventional and microwave pyrolysis. J. Taiwan Inst. Chem. Eng. 2022, 134, 104305. [Google Scholar]
- Collotta, M.; Champagne, P.; Tomasoni, G.; Alberti, M.; Busi, L.; Mabee, W. Critical indicators of sustainability for biofuels: An analysis through a life cycle sustainability assessment perspective. Renew. Sustain. Energy Rev. 2019, 115, 109358. [Google Scholar]
- Pandit, S.; Yadav, N.; Sharma, P.; Prakash, A.; Kuila, A. Life cycle assessment and techno-economic analysis of nanotechnology-based wastewater treatment: Status, challenges and future prospectives. J. Taiwan Inst. Chem. Eng. 2024, 166, 105567. [Google Scholar]
- Ali, Y.; Sabir, M.; Afridi, S.; Ullah, Z. Pakistan’s circular bio-economy: Potential, opportunities and sustainable development. In Environment, Development and Sustainability; Springer: Berlin/Heidelberg, Germany, 2024; pp. 1–27. [Google Scholar]
- IEA. Bioenergy for Sustainable Development; IEA: Paris, France, 2022. [Google Scholar]
- Zhang, B.; Li, H.; Chen, L.; Fu, T.; Tang, B.; Hao, Y.; Peng, Y. Recent advances in the bioconversion of waste straw biomass with steam explosion technique: A comprehensive review. Processes 2022, 10, 1959. [Google Scholar] [CrossRef]
- Kordi, M.; Farrokhi, N.; Pech-Canul, M.I.; Ahmadikhah, A. Rice husk at a glance: From agro-industrial to modern applications. Rice Sci. 2024, 31, 14–32. [Google Scholar]
- IPCC. Climate Change 2021: Mitigation of Climate Change; IPCC: Geneva, Switzerland, 2021. [Google Scholar]
- Daniel, A.I.; Fadaka, A.O.; Gokul, A.; Bakare, O.O.; Aina, O.; Fisher, S.; Klein, A. Biofertilizer: The future of food security and food safety. Microorganisms 2022, 10, 1220. [Google Scholar] [CrossRef]
- Silalertruksa, T.; Gheewala, S.H. A comparative LCA of rice straw utilization for fuels and fertilizer in Thailand. Bioresour. Technol. 2013, 150, 412–419. [Google Scholar] [CrossRef]
- ADEME. Analyses de Cycle de Vie Appliquées aux Biocarburants de Première Génération Consommés en France; Direction Production et Energies Durables (DEPD): Paris, France, 2010. [Google Scholar]
- Delivand, M.K.; Barz, M.; Gheewala, S.H.; Sajjakulnukit, B. Environmental and socio-economic feasibility assessment of rice straw conversion to power and ethanol in Thailand. J. Clean. Prod. 2012, 37, 29–41. [Google Scholar] [CrossRef]
- Wang, L.; Littlewood, J.; Murphy, R.J. Environmental sustainability of bioethanol production from wheat straw in the UK. Renew. Sustain. Energy Rev. 2013, 28, 715–725. [Google Scholar] [CrossRef]
- Buchspies, B.; Kaltschmitt, M. Life cycle assessment of bioethanol from wheat and sugar beet discussing environmental impacts of multiple concepts of co-product processing in the context of the European Renewable Energy Directive context of the European Renewable Energy Directive. Biofuels 2016, 7, 141–153. [Google Scholar]
- Hsu, D.D.; Inman, D.; Heath, G.A.; Wolfrum, E.J.; Mann, M.K.; Aden, A. Life cycle environmental impacts of selected US ethanol production and use pathways in 2022. Environ. Sci. Technol. 2022, 44, 5289–5297. [Google Scholar] [CrossRef]
- Malik, K.; Capareda, S.C.; Kamboj, B.R.; Malik, S.; Singh, K.; Arya, S.; Bishnoi, D.K. Biofuels Production: A Review on Sustainable Alternatives to Traditional Fuels and Energy Sources. Fuels 2024, 5, 157–175. [Google Scholar] [CrossRef]
- ISO 14044:2006; Environmental Management—Life Cycle Assessment—Requirements and Guidelines. ISO: Geneva, Switzerland, 2006.
- Shakelly, N.; Pérez-Cardona, J.R.; Deng, S.; Maani, T.; Li, Z.; Sutherland, J.W. Comparative life cycle assessment of bioethanol production from different generations of biomass and waste feedstocks. Procedia CIRP 2023, 116, 630–635. [Google Scholar] [CrossRef]
- Thinkstep AG. GaBi LCA Databases. 2020. Available online: https://www.gabi-software.com/international/databases/gabi-data-search/ (accessed on 25 November 2024).
- Zhang, F.; Wang, Q.; Hong, J.; Chen, W.; Qi, C.; Ye, L. Life cycle assessment of diammonium-and monoammonium-phosphate fertilizer production in China. J. Clean. Prod. 2017, 141, 1087–1094. [Google Scholar]
- Aribi, S.; Jday, M.R.; Hajjaji, N. Life cycle assessment of di-ammonium phosphate (DAP) fertilizer production in Tunisia. In Recent Advances in Environmental Science from the Euro-Mediterranean and Surrounding Regions; Springer International Publishing AG: Berlin/Heidelberg, Germany, 2018; pp. 359–362. [Google Scholar]
- Basha, J.S.; Jafary, T.; Vasudevan, R.; Bahadur, J.K.; Al Ajmi, M.; Al Neyadi, A.; Soudagar, M.E.M.; Mujtaba, M.; Hussain, A.; Ahmed, W.; et al. Potential of Utilization of Renewable Energy Technologies in Gulf Countries. Sustainability 2021, 13, 10261. [Google Scholar] [CrossRef]
- Lv, J.X.; Gu, F.; Zhang, W.J.; Guo, J.F. Life cycle assessment and life cycle costing of sanitary ware manufacturing: A case study in China. J. Clean. Prod. 2019, 238, 117938. [Google Scholar] [CrossRef]
- Zhou, H.R.; Qian, Y.; Kraslawski, A.; Yang, Q.C.; Yang, S.Y. Lifecycle assessment of alternative liquid fuels production in China. Energy 2017, 139, 507–522. [Google Scholar] [CrossRef]
- Pa, A.; Bi, X.T.; Sokhansanj, S. Evaluation of wood pellet application for residential heating British Columbia based on a streamlined life cycle analysis. Biomass Bioenergy 2013, 49, 109–122. [Google Scholar]
- Al-Athamin, E.A.; Hemidat, S.; Al-Hamaiedeh, H.; Aljbour, S.H.; El-Hasan, T.; Nassour, A. A techno-economic analysis of sustainable material recovery facilities: The case of Al-Karak solid waste sorting plant, Jordan. Sustainability 2021, 13, 13043. [Google Scholar] [CrossRef]
- Huijbregts, M.A.; Steinmann, Z.J.; Elshout, P.M.; Stam, G.; Verones, F.; Vieira, M.; Van Zelm, R. ReCiPe2016: A harmonized life cycle impact assessment method at midpoint and endpoint level. Int. J. Life Cycle Assess. 2017, 22, 138–147. [Google Scholar] [CrossRef]
- Tao, M.; Zhang, X.; Wang, S.; Cao, W.; Jiang, Y. Life cycle assessment on lead–zinc ore mining and beneficiation in China. J. Clean. Prod. 2019, 237, 117833. [Google Scholar]
- Qudrat-Ullah, H. A review and analysis of renewable energy policies and CO2 emissions of Pakistan. Energy 2022, 238, 121849. [Google Scholar]
- Zhou, Y.; Xiao, C.Q.; Yang, S.; Yin, H.Q.; Yang, Z.Y.; Chi, R.A. Life cycle assessment of feed grade mono-dicalcium phosphate production in China, a case study. J. Clean. Prod. 2021, 290, 125182. [Google Scholar] [CrossRef]
- Farooq, A.; Bangviwat, A.; Gheewala, S.H. Life cycle cost analysis of ethanol production from sugarcane molasses for gasoline substitution as transportation fuel in Pakistan. J. Sustain. Energy Environ. 2020, 11, 49–59. [Google Scholar]
- Obiora, C. Optimal Cost of Production of Bioethanol: A Review. 2022. Available online: https://papers.ssrn.com/sol3/papers.cfm?abstract_id=4171036 (accessed on 25 March 2025).
- Ghani, H.U.; Gheewala, S.H. Comparative Life Cycle Assessment of Byproducts from Sugarcane Industry in Pakistan based on Biorefinery Concept. Biomass Convers. Biorefinery 2018, 8, 979–990. [Google Scholar] [CrossRef]
- Tyagi, V.K.; Kapoor, A.; Arora, P.; Banu, J.R.; Das, S.; Pipesh, S.; Kazmi, A.A. Mechanicalbiological treatment of municipal solid waste: Case study of 100 TPD Goa plant, India. J. Environ. Manag. 2021, 292, 112741. [Google Scholar] [CrossRef]
- Patel, K.; Singh, S.K. Environmental sustainability, energy efficiency and uncertainty analysis of agricultural residue-based bioethanol production: A comprehensive life cycle assessment study. Biomass Bioenergy 2024, 191, 107439. [Google Scholar]
- Aguilar-Sánchez, P.; Navarro-Pineda, F.S.; Sacramento-Rivero, J.C.; Barahona-Pérez, L.F. Lifecycle assessment of bioethanol production from sweet sorghum stalks cultivated in the state of Yucatan, Mexico. Clean. Technol. Environ. 2018, 20, 1685–1696. [Google Scholar] [CrossRef]
- Lyu, H.; Yang, S.; Zhang, J.; Feng, Y.; Geng, Z. Impacts of utilization patterns of cellulosic C5 sugar from cassava straw on bioethanol production through life cycle assessment. Bioresour. Technol. 2021, 323, 124586. [Google Scholar] [CrossRef]
- Maga, D.; Thonemann, N.; Hiebel, M.; Sebastião, D.; Lopes, T.F.; Fonseca, C.; Gírio, F. Comparative life cycle assessment of first- and second-generation ethanol from sugarcane in Brazil. Int. J. Life Cycle Assess. 2019, 24, 266–280. [Google Scholar]
- Soleymani Angili, T.; Grzesik, K.; Rödl, A.; Kaltschmitt, M. Life cycle assessment of bioethanol production: A review of feedstock, technology and methodology. Energies 2021, 14, 2939. [Google Scholar] [CrossRef]
- AbdElhafez, S.E.; Taha, T.; Mansy, A.E.; El-Desouky, E.; Abu-Saied, M.A.; Eltaher, K.; Ali, R.M. Experimental optimization with the emphasis on techno-economic analysis of production and purification of high value-added bioethanol from sustainable corn stover. Energies 2022, 15, 6131. [Google Scholar] [CrossRef]
- Joyia MA, K.; Ahmad, M.; Chen, Y.F.; Mustaqeem, M.; Ali, A.; Abbas, A.; Gondal, M.A. Trends and advances in sustainable bioethanol production technologies from first to fourth generation: A critical review. Energy Convers. Manag. 2024, 321, 119037. [Google Scholar]
- Ali, F.; Dawood, A.; Hussain, A.; Alnasir, M.H.; Khan, M.A.; Butt, T.M.; Janjua, N.K.; Hamid, A. Discover Sustainability. In Fueling the Future: Biomass Applications for Green and Sustainable Energy; Springer Nature: Berlin/Heidelberg, Germany, 2024. [Google Scholar]
- Dahman, Y.; Syed, K.; Begum, S.; Roy, P.; Mohtasebi, B. Biofuels: Their characteristics and analysis. In Biomass, Biopolymer-Based Materials, and Bioenergy: Construction, Biomedical, and Other Industrial Applications; Elsevier: Amsterdam, The Netherlands, 2019; pp. 277–325. [Google Scholar]
- Yaverino-Gutiérrez, M.A.; Wong, A.Y.C.H.; Ibarra-Muñoz, L.A.; Chávez AC, F.; Sosa-Martínez, J.D.; Tagle-Pedroza, A.S.; Balagurusamy, N. Perspectives and progress in bioethanol processing and social economic impacts. Sustainability 2024, 16, 608. [Google Scholar] [CrossRef]
- The World Bank. Biomass Resource Mapping in Pakistan. June 2016. Available online: http://documents.worldbank.org/curated/en/104071469432331115/pdf/107200-REPLACEMENTPUBLIC-Pakistan-Biomass-Mapping-Final-Report-WB-ESMAP-June2016.pdf (accessed on 26 May 2018).
- Din, Z.U.; Zainal, Z. Biomass integrated gasification–SOFC systems: Technology overview. Renew. Sustain. Energy Rev. 2016, 53, 1356–1376. [Google Scholar] [CrossRef]
- Kan, T.; Strezov, V.; Evans, T.J. Lignocellulosic biomass pyrolysis: A review of product properties and effects of pyrolysis parameters. Renew. Sustain. Energy Rev. 2016, 57, 1126–1140. [Google Scholar] [CrossRef]
- Mubarak, M.U.; Zahir, M.; Ahmad, S.; Wakeel, A. Sugar beet yield and industrial sugar contents improved by potassium fertilization under scarce and adequate moisture conditions. J. Integr. Agric. 2016, 15, 2620–2626. [Google Scholar]


Disclaimer/Publisher’s Note: The statements, opinions and data contained in all publications are solely those of the individual author(s) and contributor(s) and not of MDPI and/or the editor(s). MDPI and/or the editor(s) disclaim responsibility for any injury to people or property resulting from any ideas, methods, instructions or products referred to in the content. |
© 2025 by the authors. Licensee MDPI, Basel, Switzerland. This article is an open access article distributed under the terms and conditions of the Creative Commons Attribution (CC BY) license (https://creativecommons.org/licenses/by/4.0/).