Abstract
Equipment operations during deepwater gas well production increase the risk of hydrate generation. In this paper, the density model of fluid changes caused by equipment operations during wellbore production is improved based on the temperature and pressure model of wellbore of deepwater gas wells. The risk area and rate of hydrate generation in the wellbore by equipment operation under production conditions are analysed. The roles of tool size, tool movement speed, and gas well production on the control of wellbore temperature and pressure were clarified. The results of the study found that tool size affects wellbore hydrate generation with a critical value. When the percentage of tool size is less than 50%, the larger the tool size is, the greater the extent of hydrate generation and deposition rate in the wellbore. After 50%, the larger the tool size, the smaller the hydrate generation range and deposition rate. The gas density in the wellbore does not change much under the condition of different movement speeds of tools of the same size. That is, the movement speed of the tool has almost no effect on the wellbore temperature and pressure fields and does not change the risk of hydrate generation. Production rate is another key factor in controlling hydrates. As the production rate increases, the fluid density in the wellbore gradually decreases, and the risk of hydrate generation decreases. And when the tool moves below the mudline, the wellbore temperature, pressure field, and wellbore hydrate generation rate become less affected by the tool size. The size of the tool mainly affects the hydrate generation risk in the wellbore above the mudline.
1. Introduction
Deepwater gas wells have a large production capacity, which can alleviate the problem of energy shortage [1]. However, its production cost is high, and if the equipment operation can be carried out during production, on the one hand, it can effectively reduce the loss caused by production stoppage. On the other hand, it can reduce the risk of wellbore fluid accumulation and pressure fluctuation caused by repeatedly switching on and off wells, which affects the production safety of gas wells [2].
Deepwater completion operation takes logging cable, wireline operation, and continuous tubing as the main operating equipment [3]. Among them, logging cables and steel wires, in addition to sampling, recovering downhole plugs, and unsealing packers in complex situations, need to be involved in shot hole depth correction, installing bridge plugs, recovering oil tree isolation casing, and installing oil tree tubing hangers. Equipment operations during deepwater gas well production affect, to some extent, the temperature, pressure, fluid flow rate, fluid density, and fluid components in the wellbore, which in turn affects the risk of hydrate formation and deposition [4,5,6]. The risk of hydrate generation and the rate of generation in gas-dominated systems containing free water is much faster than in oil-dominated systems [7]. Concerning highly productive gas wells, even under test operation conditions, the possibility of hydrate generation is much higher than normal working conditions when the test tubing column above the mudline is located in the watertight tubing in a deepwater cryogenic environment, and the fluid in the column is cooled down by a longer cryogenic seawater section [8,9]. Loop experiments have found that at high flow speeds, the entire contact area of a droplet in the gas phase is 4.75 times that of a liquid film, and the gas flow rate controls the number and size of droplets, raising the risk of hydrate generation [10]. Once hydrate is generated and deposited in large quantities, it will cause pipeline blockage, resulting in construction safety problems such as the inability of workover tools to be raised and put in properly, which will directly affect the production efficiency and production safety of gas wells [11,12,13].
At present, the study of hydrate deposition direction in a deepwater gas wellbore is mainly through thermodynamic methods, combined with hydrate generation conditions to judge its generation area [14,15,16]. The thermodynamic study of hydrate generation is to solve the three-phase problem of gas–water–hydrate based on phase equilibrium under different pressure and temperature conditions. When the hydrate-generating environment satisfies the hydrate phase equilibrium conditions, the environment where it is located is considered to be able to generate hydrate and the hydrate-generating region is determined. The conducted studies summarise a large number of phase equilibrium prediction methods, such as the empirical formula method [17], Katz’s method [18], and statistical thermodynamics method [19]. The empirical plate method and empirical formula method are simpler methods for calculating hydrate phase equilibrium conditions, relying on a large number of experimental results to establish the empirical hydrate phase equilibrium formulas and plates, but the experimental period is long, the applicable range is small, and the prediction accuracy is low.
In response to the above problems, statistical thermodynamic methods were studied and developed. Analytical models were constructed based on the conservation of chemical positions or fugacity of different components in each phase within the equilibrium system, such as the VdW-P model derived for single-phase gases based on the hydrate cell model and the isothermal adsorption theory of Langemühl gases [20]. Considering the non-stoichiometric nature of hydrate generation, statistical thermodynamics was used to derive the guest molecule fugacity equation, and the phase equilibrium condition model was established. The continuous development of computational models has improved the prediction accuracy of hydrate generation, with the research carried out in the area of hydrate generation with gas as the dominant system [21]. By considering the heat transfer between the gas and the surrounding environment, the hydrate layer growth model for gas flow in pipelines has been continuously developed [22]. The processes of hydrate formation and deposition in natural gas pipelines have been further revealed [23,24].
The above methods cannot directly analyse and predict the phase state and generation characteristics of wellbore hydrate under the equipment operating conditions during deepwater gas well production. Therefore, in this paper, the wellbore natural gas density model is re-corrected based on the tool operation of deepwater gas wells. The effects of different tool sizes, tool movement speeds, and gas well production rates on the dynamics of wellbore hydrate generation are analysed, providing theoretical support for accurate prediction of hydrate-generating regions.
2. Research Methodology
2.1. Heat Transfer Modelling for Deepwater Gas Well Operations
Before production in deepwater gas wells, there is a static gas and liquid column in the wellbore, and the fluid temperature is roughly the same as the ambient temperature. During the production period, the fluid in the wellbore is a gas–liquid two-phase mass flow, the gas and liquid in the formation continue to enter the wellbore, and the fluid continues to lift with the extraction process and continuously releases heat to the formation and seawater. The fluid flow in the wellbore gradually stabilises over a period of production. Obviously, the tool has little effect on the temperature field of the wellbore. Instead, the throttling effect of the tool in the wellbore affects the pressure of the fluid. In order to analyse its effect on the pressure field of the wellbore, we use the existing wellbore temperature and heat transfer model for deepwater gas wells. The fluid heat in the wellbore of the seawater section of the water–gas well is transferred to the annulus through the production tubing column, and then to the seawater through the watertight casing; the fluid heat in the wellbore of the formation section of the deepwater gas well is transferred to the annulus through the production tubing column, and then to the formation through the casing and the cement annulus. Boundary conditions: The initial condition is that the temperature at each initial point is equal to the original formation temperature at that point. The inner boundary temperature is equal to the temperature at the cement annulus interface, which is calculated from the heat given by Fourier’s theorem. The outer boundary temperature at infinity is considered equal to the original formation temperature.
2.1.1. Modelling of Fluid Heat Transfer in Pipe Columns
The fluid heat transfer model takes into account that the temperature around the wellbore is transient, i.e., the heat transfer is unstable, and the temperature versus time can be expressed by the following transient heat transfer differential equation:
where T is the stratum (or seawater) temperature function, °C; r is the distance from the centre of the column, m; and t is the time, s.
2.1.2. Stratigraphic Heat Transfer Modelling
Considering the unsteady heat transfer from the fluid in the wellbore to the formation, the heat loss exists only in the radial heat transfer process. The wellbore fluid temperature expression for the formation section can be derived by solving the equation for heat transfer from the wellbore fluid to the wellbore and the equation for heat transfer from the wellbore to the formation.
where To is the wellbore fluid temperature at the exit, °C; Tos is the formation temperature at the exit, °C; A is the heat transfer coefficient of the formation section, W/(m2·°C); Ze is the depth of the inlet section of the well, m; Zo is the depth of the outlet section of the well, m; g is the acceleration of gravity, m/s2; Cpm is the constant pressure-specific heat capacity of the fluid, J/(kg·°C); Cj is the Joule Thompson’s coefficient, °C/Pa; v is the lowering speed of the intervention operation tool, m/s; gs is the ground temperature gradient, °C/m; Te is the wellbore fluid temperature at the inlet, °C; Tes is the formation temperature at the inlet, °C; θ is the wellbore inclination angle, (°); and dp/dz is the pressure of the fluid microelementary section in the wellbore, MPa/m.
2.1.3. Modelling of Heat Transfer in Seawater Section
2.2. Wellbore Pressure Modelling for Deepwater Gas Well Operations
As the tool changes the cross-sectional area of the fluid flow in the wellbore, it leads to inconsistency of the fluid flow rate in the upper and lower sections of the tool. The downward and upward movements of the tool cause changes in the fluid flow velocity in the wellbore (Figure 1), which varies with the movement of the tool, as shown by the velocity change equation.
is the fluid flow rate in the wellbore, m/s; is the fluid mass flow rate, kg/s; is the fluid volume coefficient; vsp is the tool movement velocity, m/s; is the tubing column fluid density, kg/m3; d is the tubing inner diameter, m; and ds is the tool diameter, m.
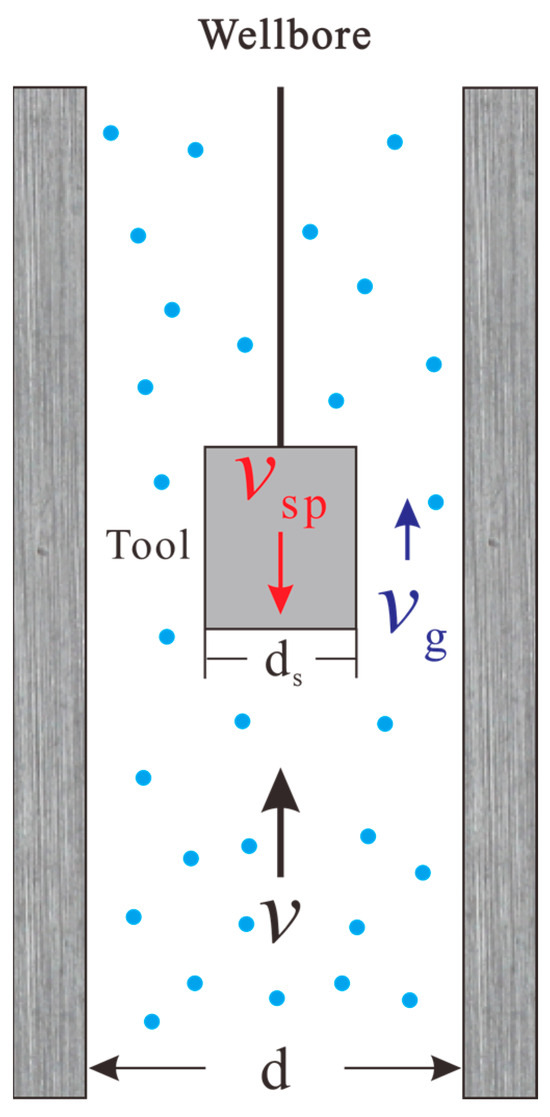
Figure 1.
Throttling patterns for downhole entry tools in deepwater gas wells.
In this way, the two-phase transient pressure calculation formula for the tool motion process during the production of deepwater gas wells is reconstructed, and the cross-section pressure on the tool is calculated as follows:
The tool lower section pressure is calculated as follows:
is the pressure of the fluid micrometric section in the wellbore, MPa/m; is the wellbore inclination angle, °; is the fluid density at the centre of the wellbore; and is the friction coefficient.
2.3. Wellbore Density Modelling for Deepwater Gas Well Operations
The tool in motion directly compresses the gas with which it is in contact. The nature of natural gas calculated using the ideal gas equation of state cannot reflect the effect of tool movement on the actual state of natural gas in the wellbore. It is easy to cause the calculated parameters to differ greatly from the actual values, which affects the prediction accuracy of hydrate generation and deposition. Therefore, this paper selected Hall and Yarborough based on the Starling-Carnahan equation of state [25]. The natural gas deviation coefficient is determined by fitting the Standing–Katz plate to complete the correction of natural gas density in the wellbore [26].
where the modified gas compression factor is calculated as shown in (5).
is the contrast density; is the contrast pressure; is the gas compression factor; and t is the inverse temperature.
The formula for calculating t is as follows:
Combining the corrected natural gas contrast density and the corrected gas compression factor gives the following formula:
The corrected contrast density needs to be solved using Newton’s iterative method.
The comparative density is in the initial value selection according to the empirical formula.
where the proposed comparison pressure and the proposed comparison temperature are calculated.
Based on the modified compression factor , calculate the gas density during the production period of the gas well.
where is the formation temperature, K; is the relative molecular mass of the mixed gas phase; and is the formation pressure, MPa. Meanwhile, in 2015, Amin et al. proposed a new correlation equation based on a large number of experimental data summaries to predict the generation temperature of gas hydrates as a function of pressure and specific gravity by using the van der Merwe matrix method [27].
The formulae for parameters a, b, c, and d are as follows:
where P is the pressure, MPa; is the relative density of natural gas, no factorisation; T is the hydrate generation temperature, °C; and A, B, C, D are the empirical parameters, no factorisation, and their values are shown in Table 1.

Table 1.
Values of parameters related to calculation formula.
Considering the high production rate of deepwater gas wells, this study simplifies the natural gas flow to the homogeneous flow of gas and liquid during the simulation of gas–liquid two-phase transient flow. Combined with the production conditions of deepwater gas wells, the numerical simulation of fluid density in the wellbore is completed by Matlab. In the actual production process of gas wells, the size of the inner diameter of the wellbore from the wellhead to the bottom of the well is inconsistent, but considering the many factors affecting it, this study is assuming that the size of the wellbore is consistent. The variation characteristics of gas density in the wellbore with tool size are further clarified. Tool size is expressed as a percentage of its cross-sectional area over the cross-sectional area of the wellbore, and the model parameters were established based on the observation and test data of a deepwater gas well in the South China Sea, as shown in Table 2.
Table 2.
Basic data related to deepwater gas wells (data from deepwater gas well observations in South China Sea).
3. Results and Discussion
We found from the numerical simulation results that the effective gas flow volume of the wellbore decreased and the fluid flow rate increased during the transport of the tool to the bottom of the well. The temperature and pressure environment in the wellbore is changed, causing changes in temperature and pressure (Figure 2). Among them, with the increase in tool size in the wellbore, the temperature field of the wellbore has little effect, and the pressure field changes with a larger magnitude, especially as the pressure perturbation above the mudline is obvious, which affects the risk of hydrate generation in the wellbore to a certain extent.
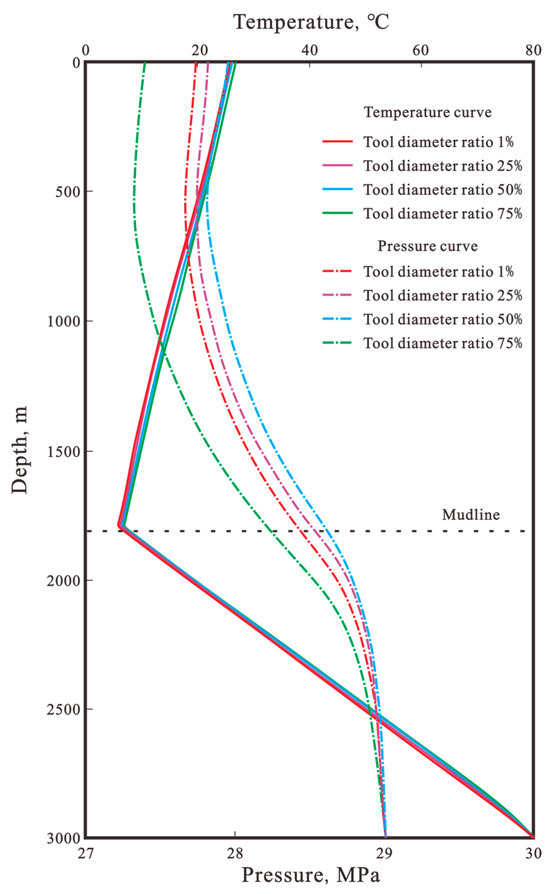
Figure 2.
Temperature and pressure curves of wellbore with different tool sizes.
3.1. Evaluation of Tool Effects on Wellbore Fluid Density
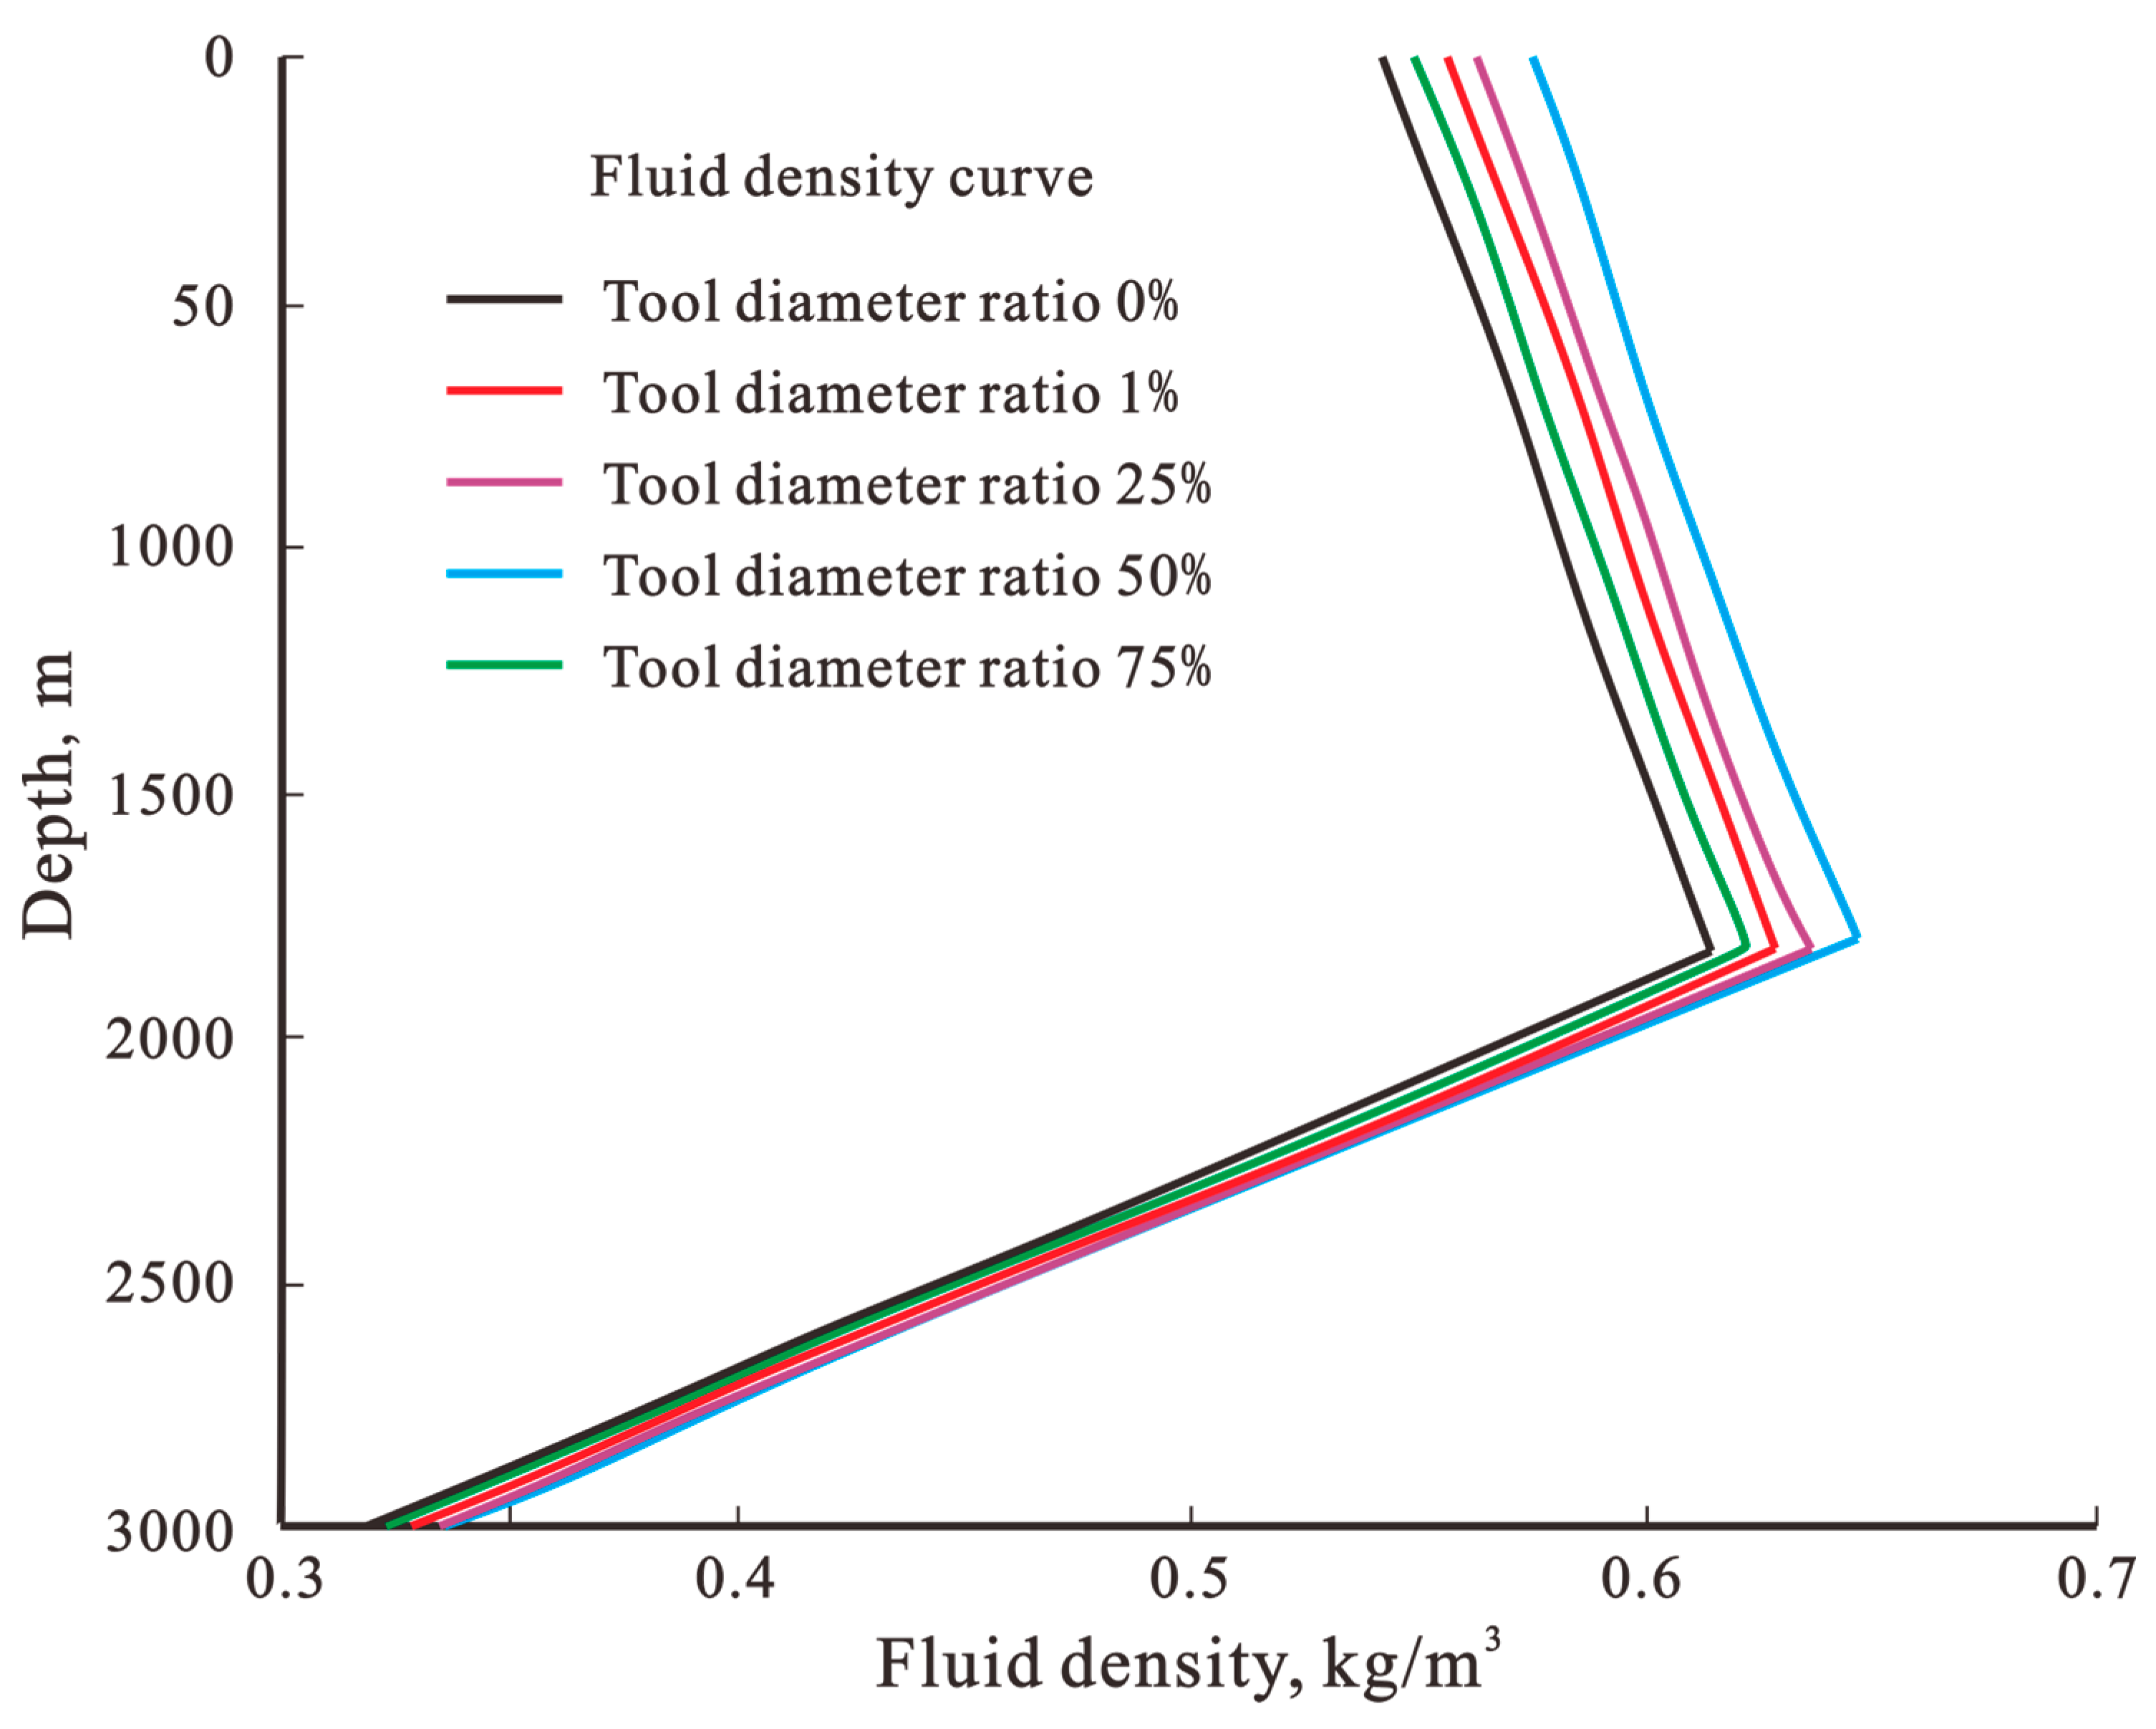
According to the numerical simulation results of the wellbore fluid density model, it is found that above the mudline, when the area of the tool is less than 50%, with the increase in the area of the tool in the wellbore, the fluid density of the wellbore gradually increases, and it is easier to generate hydrates in the wellbore; when the area of the tool is higher than 50%, with the increase in the area of the tool in the wellbore, the fluid density of the wellbore gradually decreases, and the ability of generating hydrates in the wellbore is relatively reduced (Figure 3).
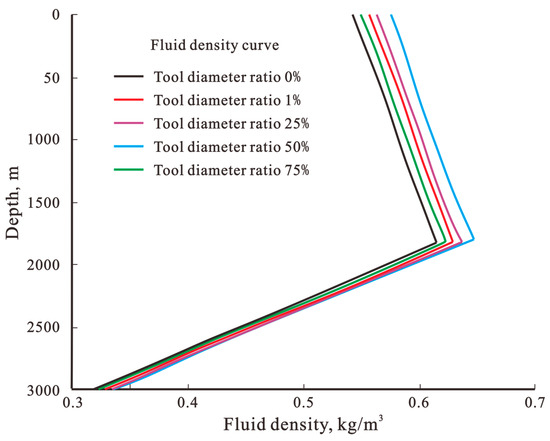
Figure 3.
Variation curve of fluid density with tool size in wellbore.
Below the mudline, the temperature gradually increases with depth and the fluid density in the wellbore gradually decreases. As the size of the operating tool in the wellbore changes, the fluid density shows the same pattern as above the mudline, but the overall change is not large. Therefore, the lowering of the tool during gas well production has a certain promotion effect on hydrate generation in the wellbore. However, the size increases to a certain degree, and the hydrate generation capacity is weakened.
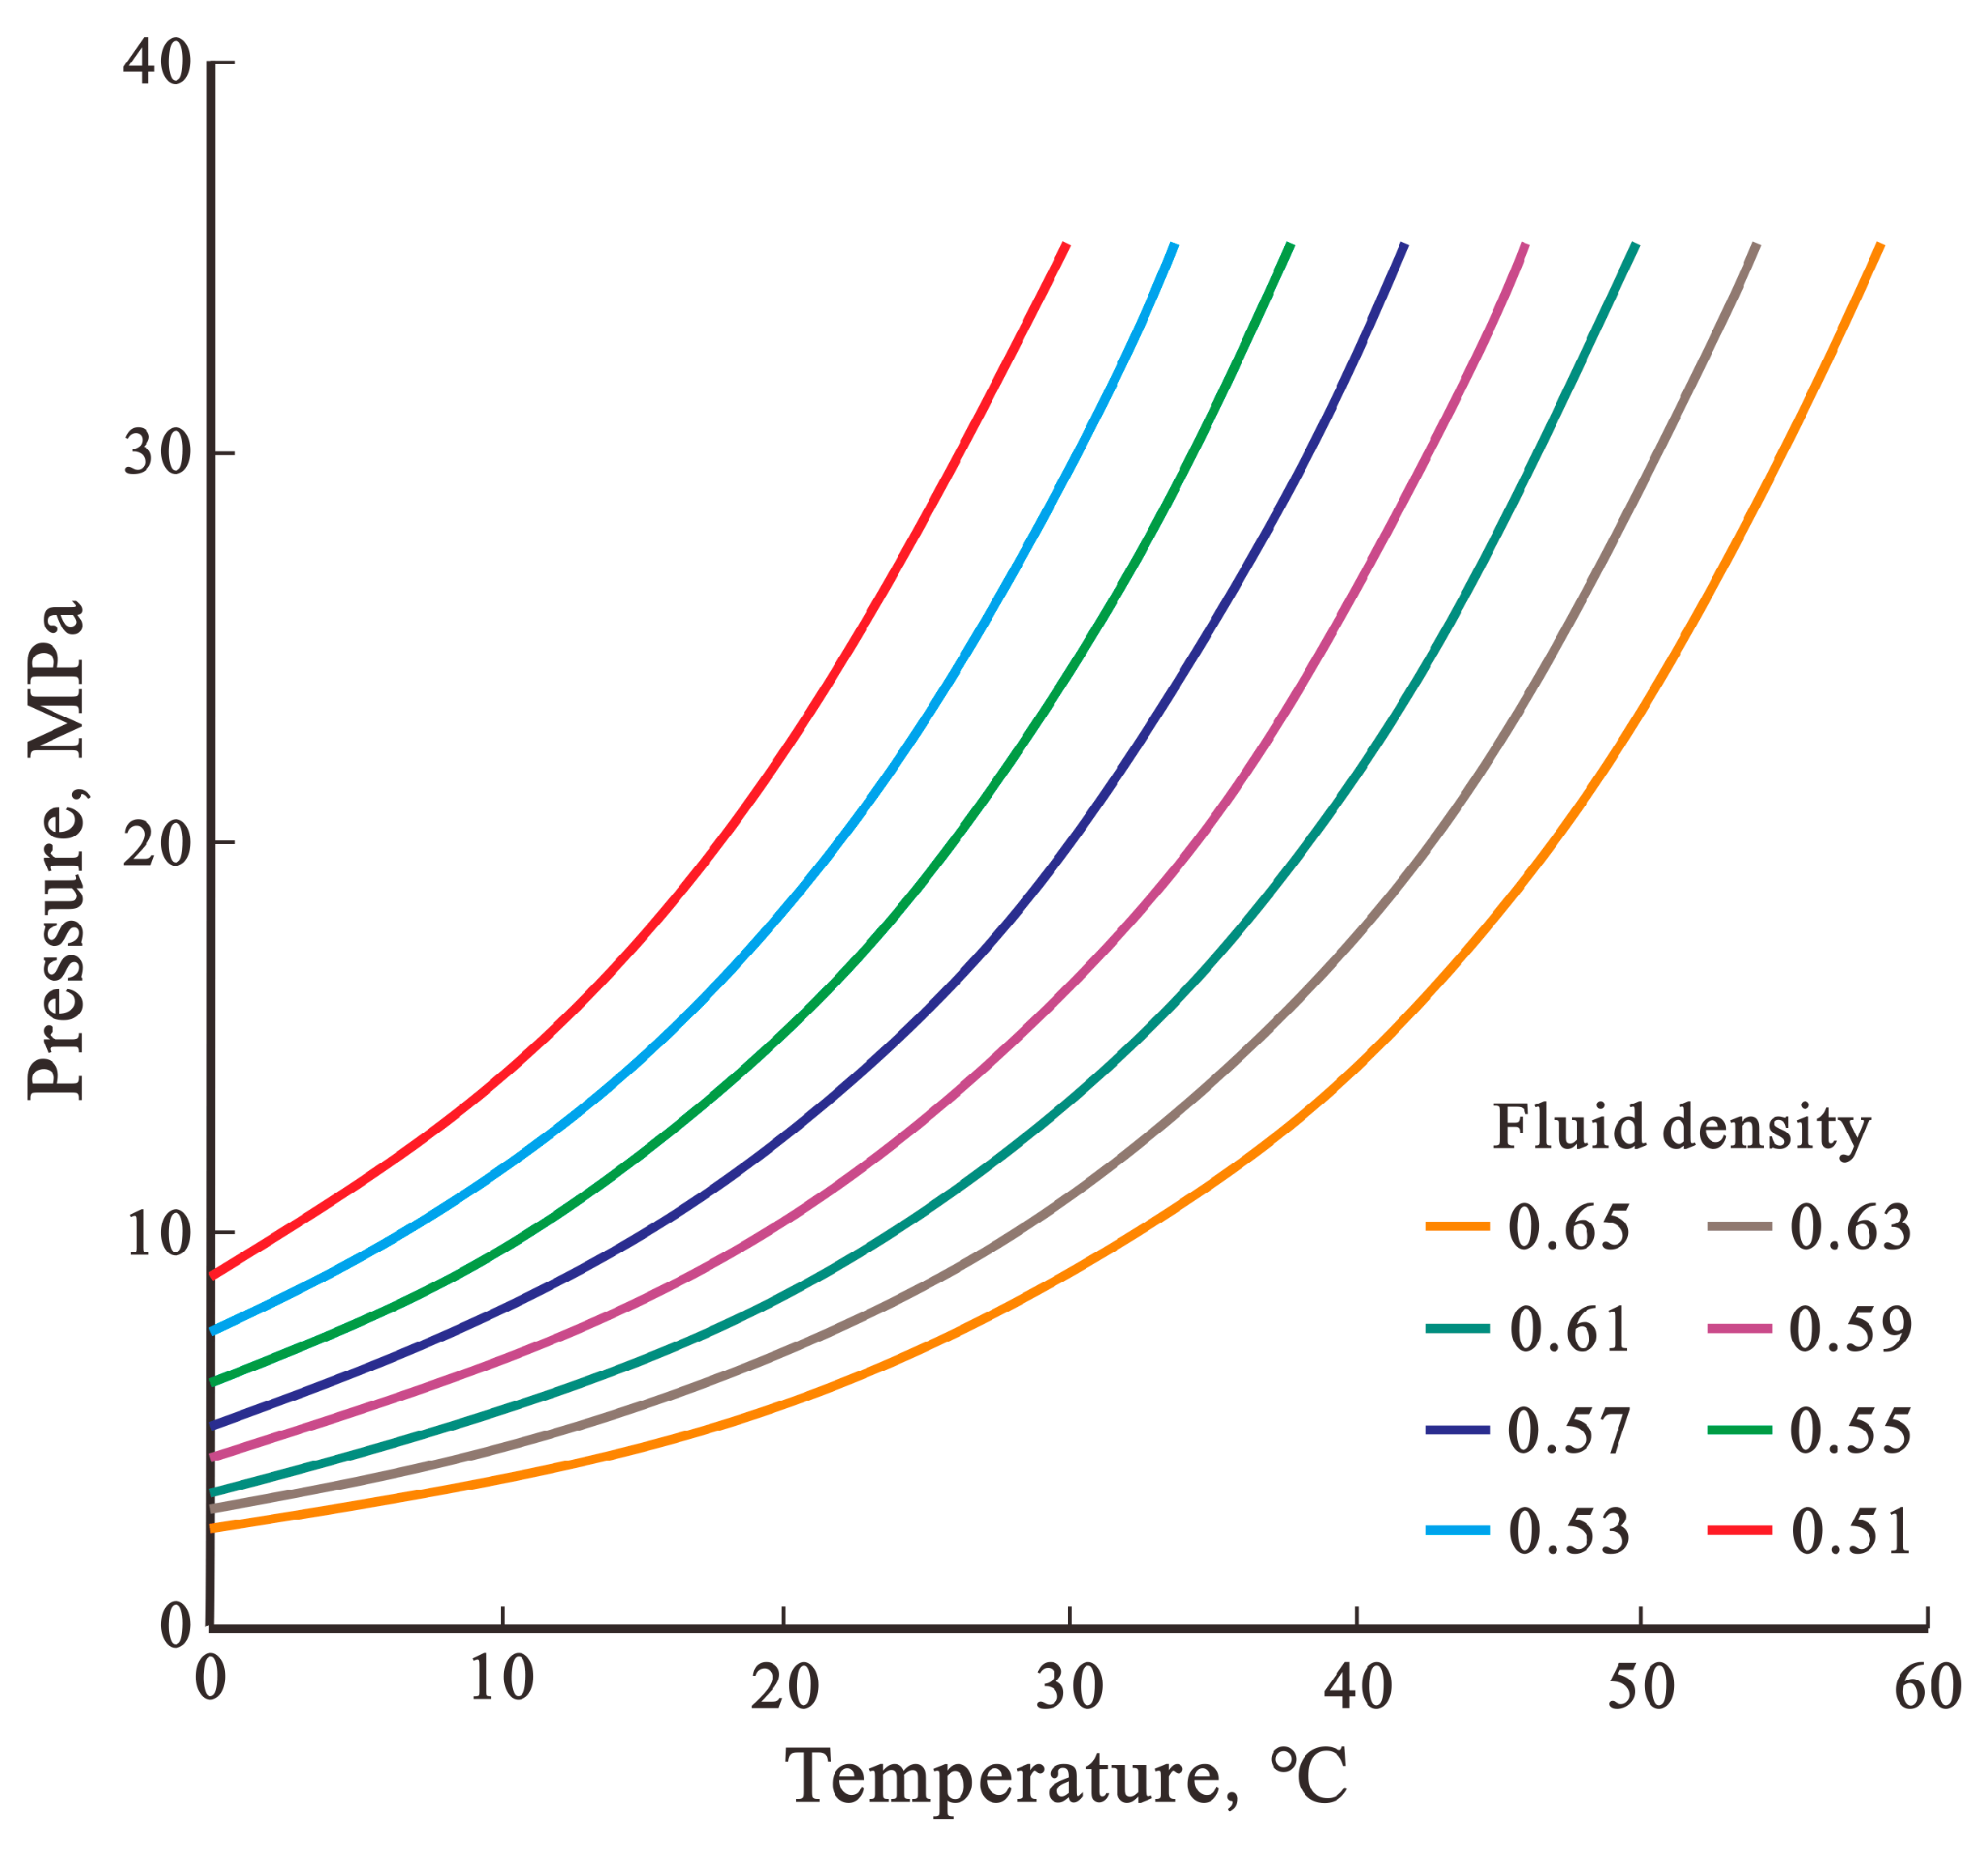
We recalculated the wellbore hydrate phase curve for different fluid densities (Figure 4). The left side of the phase curve shows the region of hydrate generation in the wellbore, and the pressure required for hydrate generation increases exponentially as a whole. As the density of gas and water two-phase flow in the tubing column gradually rises, the hydrate phase state gradually shifts to the right. It shows that under the same temperature condition, the pressure required for hydrate formation in the wellbore is smaller, and the denser fluid is more likely to generate hydrate.

Figure 4.
Variation in hydrate generation phase profile with fluid density.
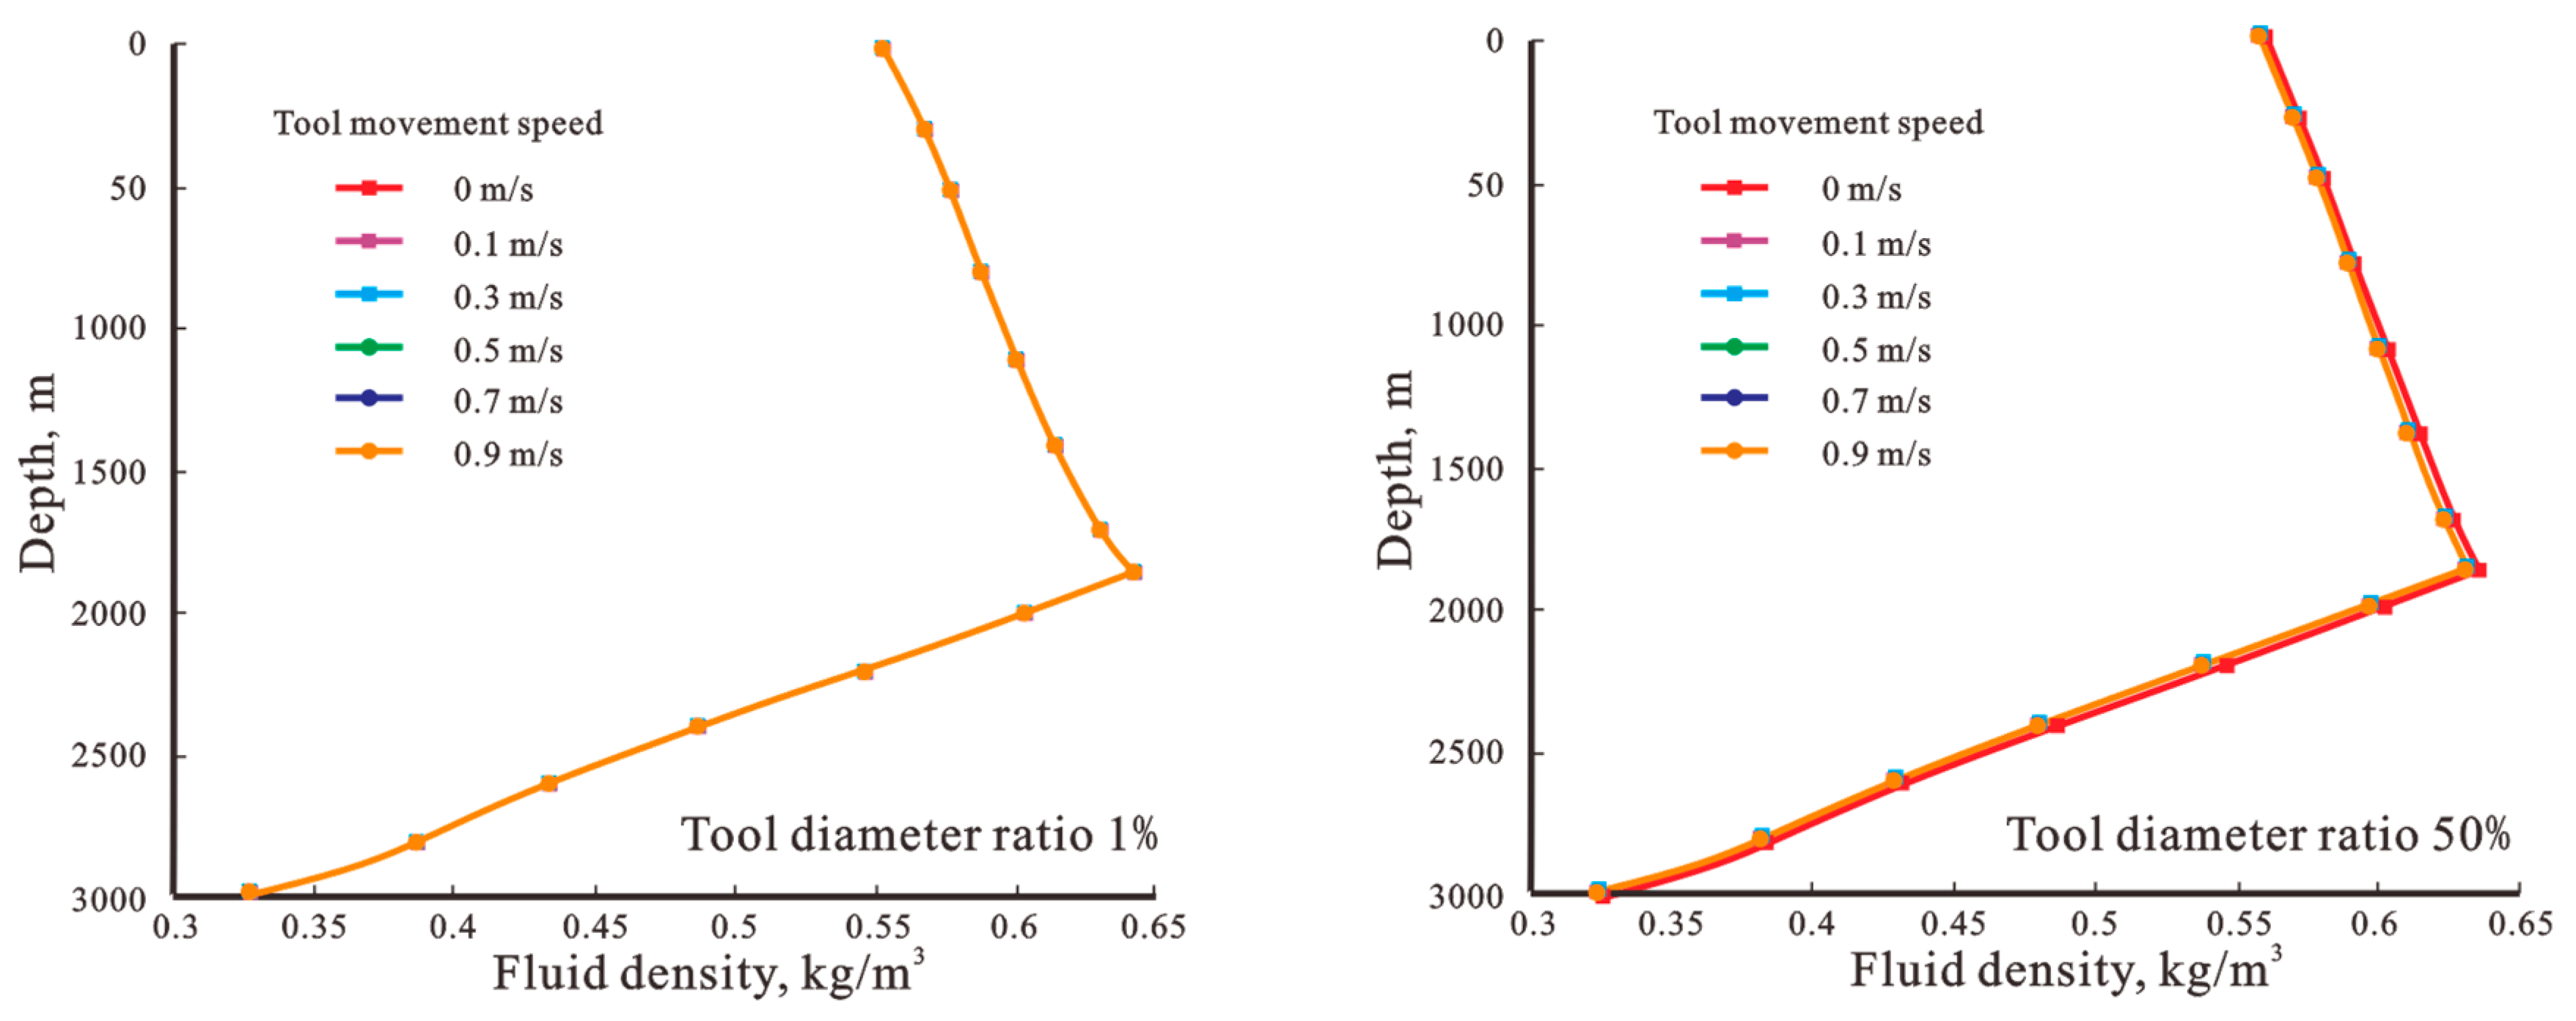
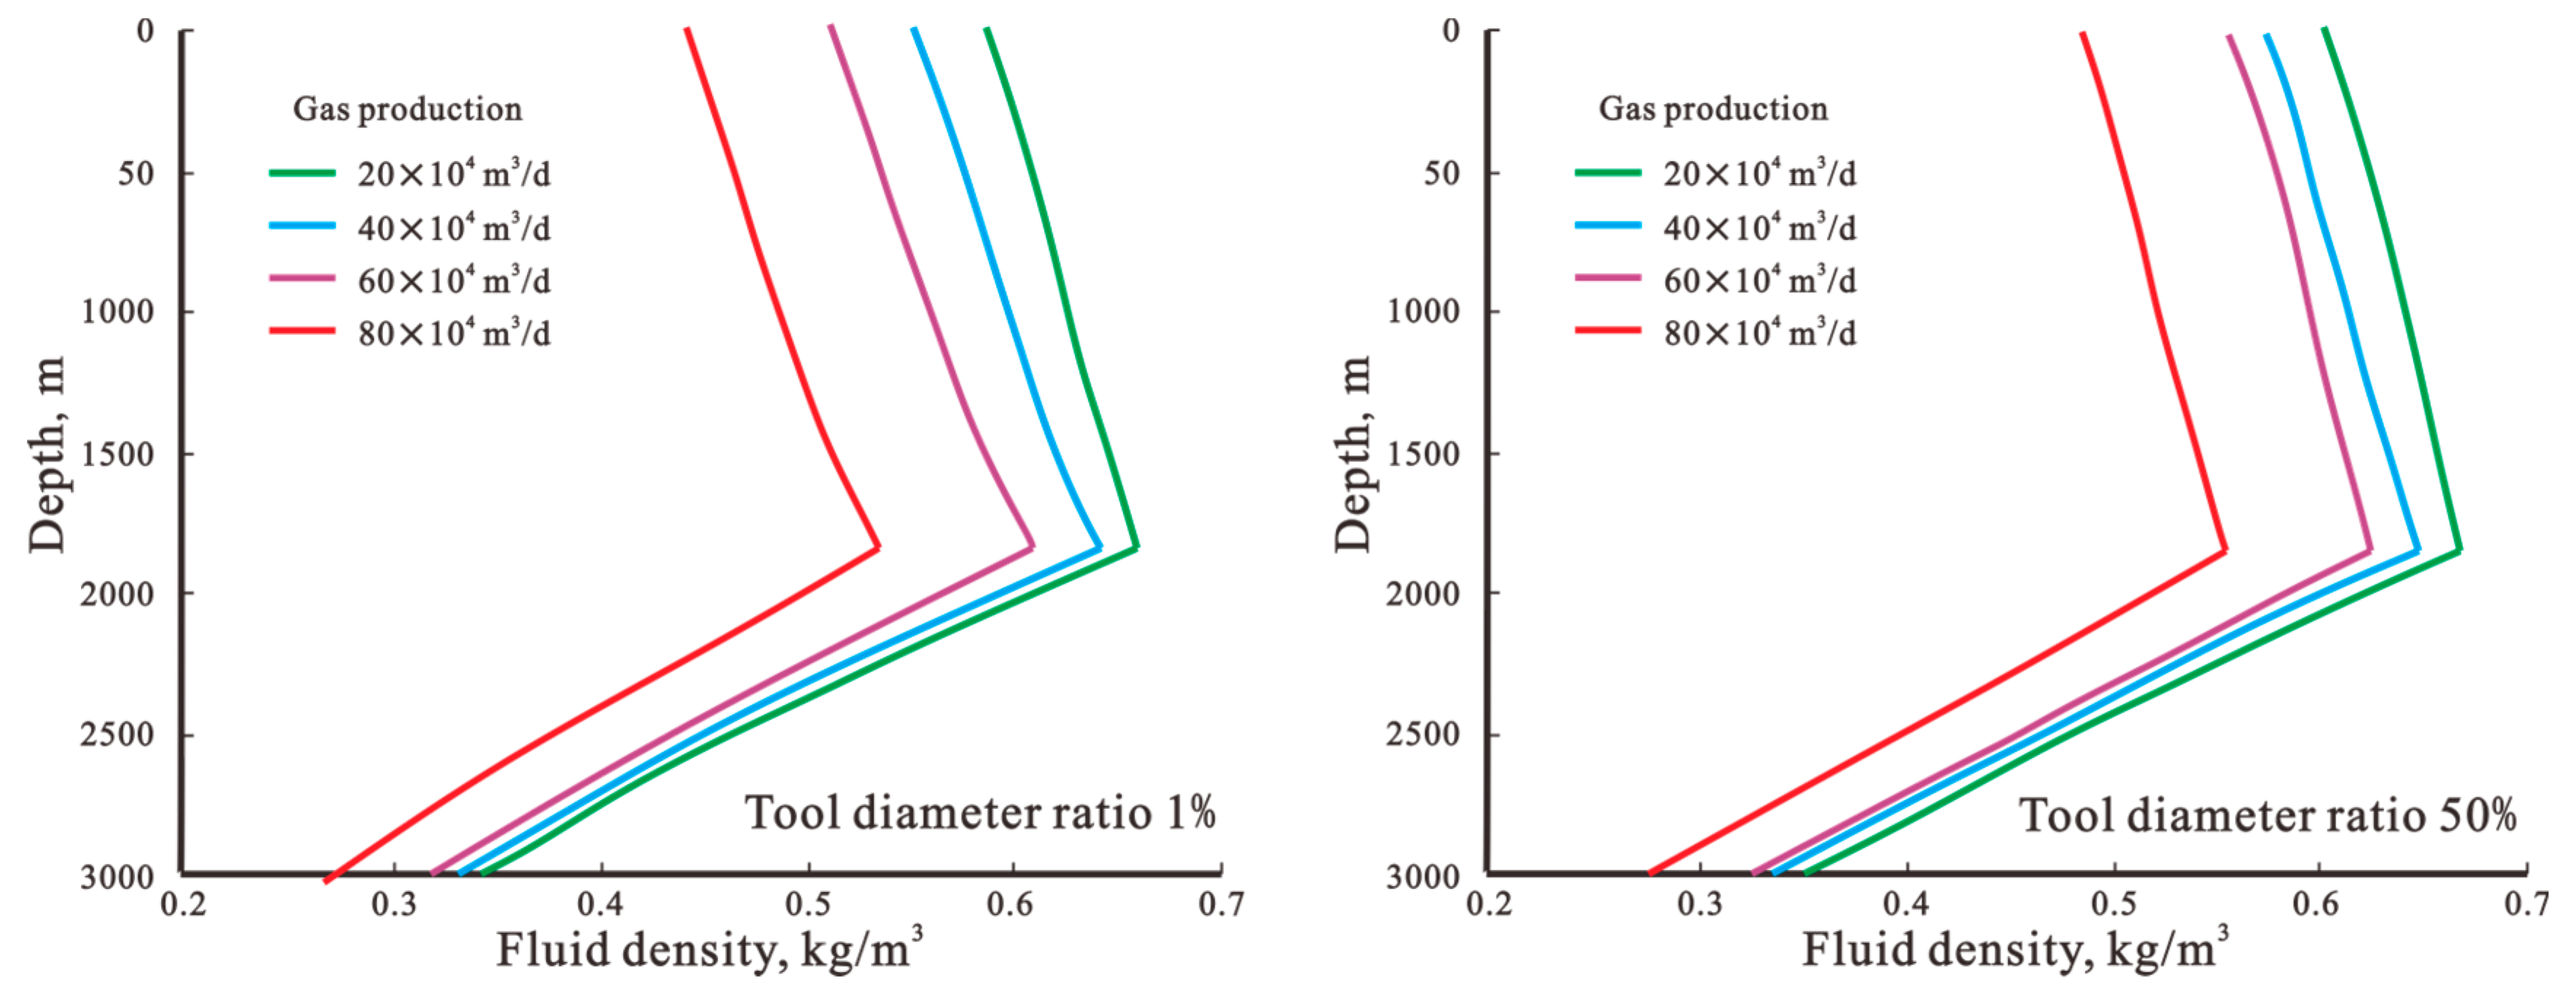
On the basis of this understanding, the variation in gas density in the wellbore with the tool movement speed was analysed by numerical calculation for tool size shares of 1% and 50%. It was found that the tool movement speed towards the bottom of the well has almost no effect on the wellbore temperature and pressure fields, and there is little difference in the gas density in the wellbore at different movement speeds (Figure 5). However, when the production rate is changed, the fluid density in the wellbore decreases gradually with the increase in production rate, inhibiting the generation of hydrates (Figure 6). This explains why the hydrate generation capacity decreases when the tool size is increased to a certain level (Figure 3). The greater the tool size, the greater the throttling effect of the gas is induced. After throttling the gas, the pressure becomes smaller, the volume increases, and the density decreases. At the same time, the flow rate of the gas increases after passing through the tool, and the hydrate generation and deposition capability at larger flow rates worsens.
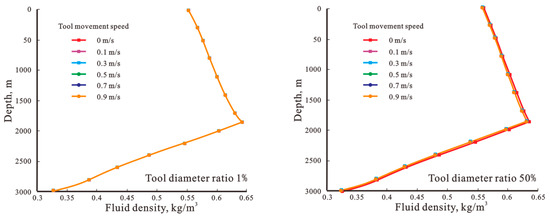
Figure 5.
Variation curve of fluid density in wellbore with downward tool entry velocity.
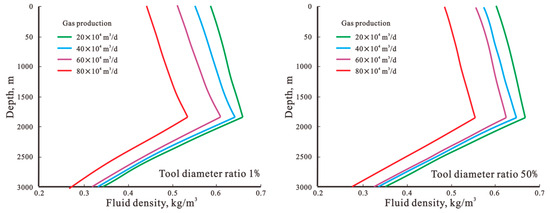
Figure 6.
Variation curves of gas density in wellbore with different production rates for different tool sizes.
3.2. Regional Forecast of Wellbore Hydrate Generation Risks
Based on the temperature and pressure expressions for hydrate phase equilibrium calculations corrected for the actual working conditions of tool operation in deepwater gas wells, carry out the graphical layout of phase curves for different production rates, depths of the tool in the wellbore, and tool sizes. Establish depth boundaries for hydrate production in the wellbore.
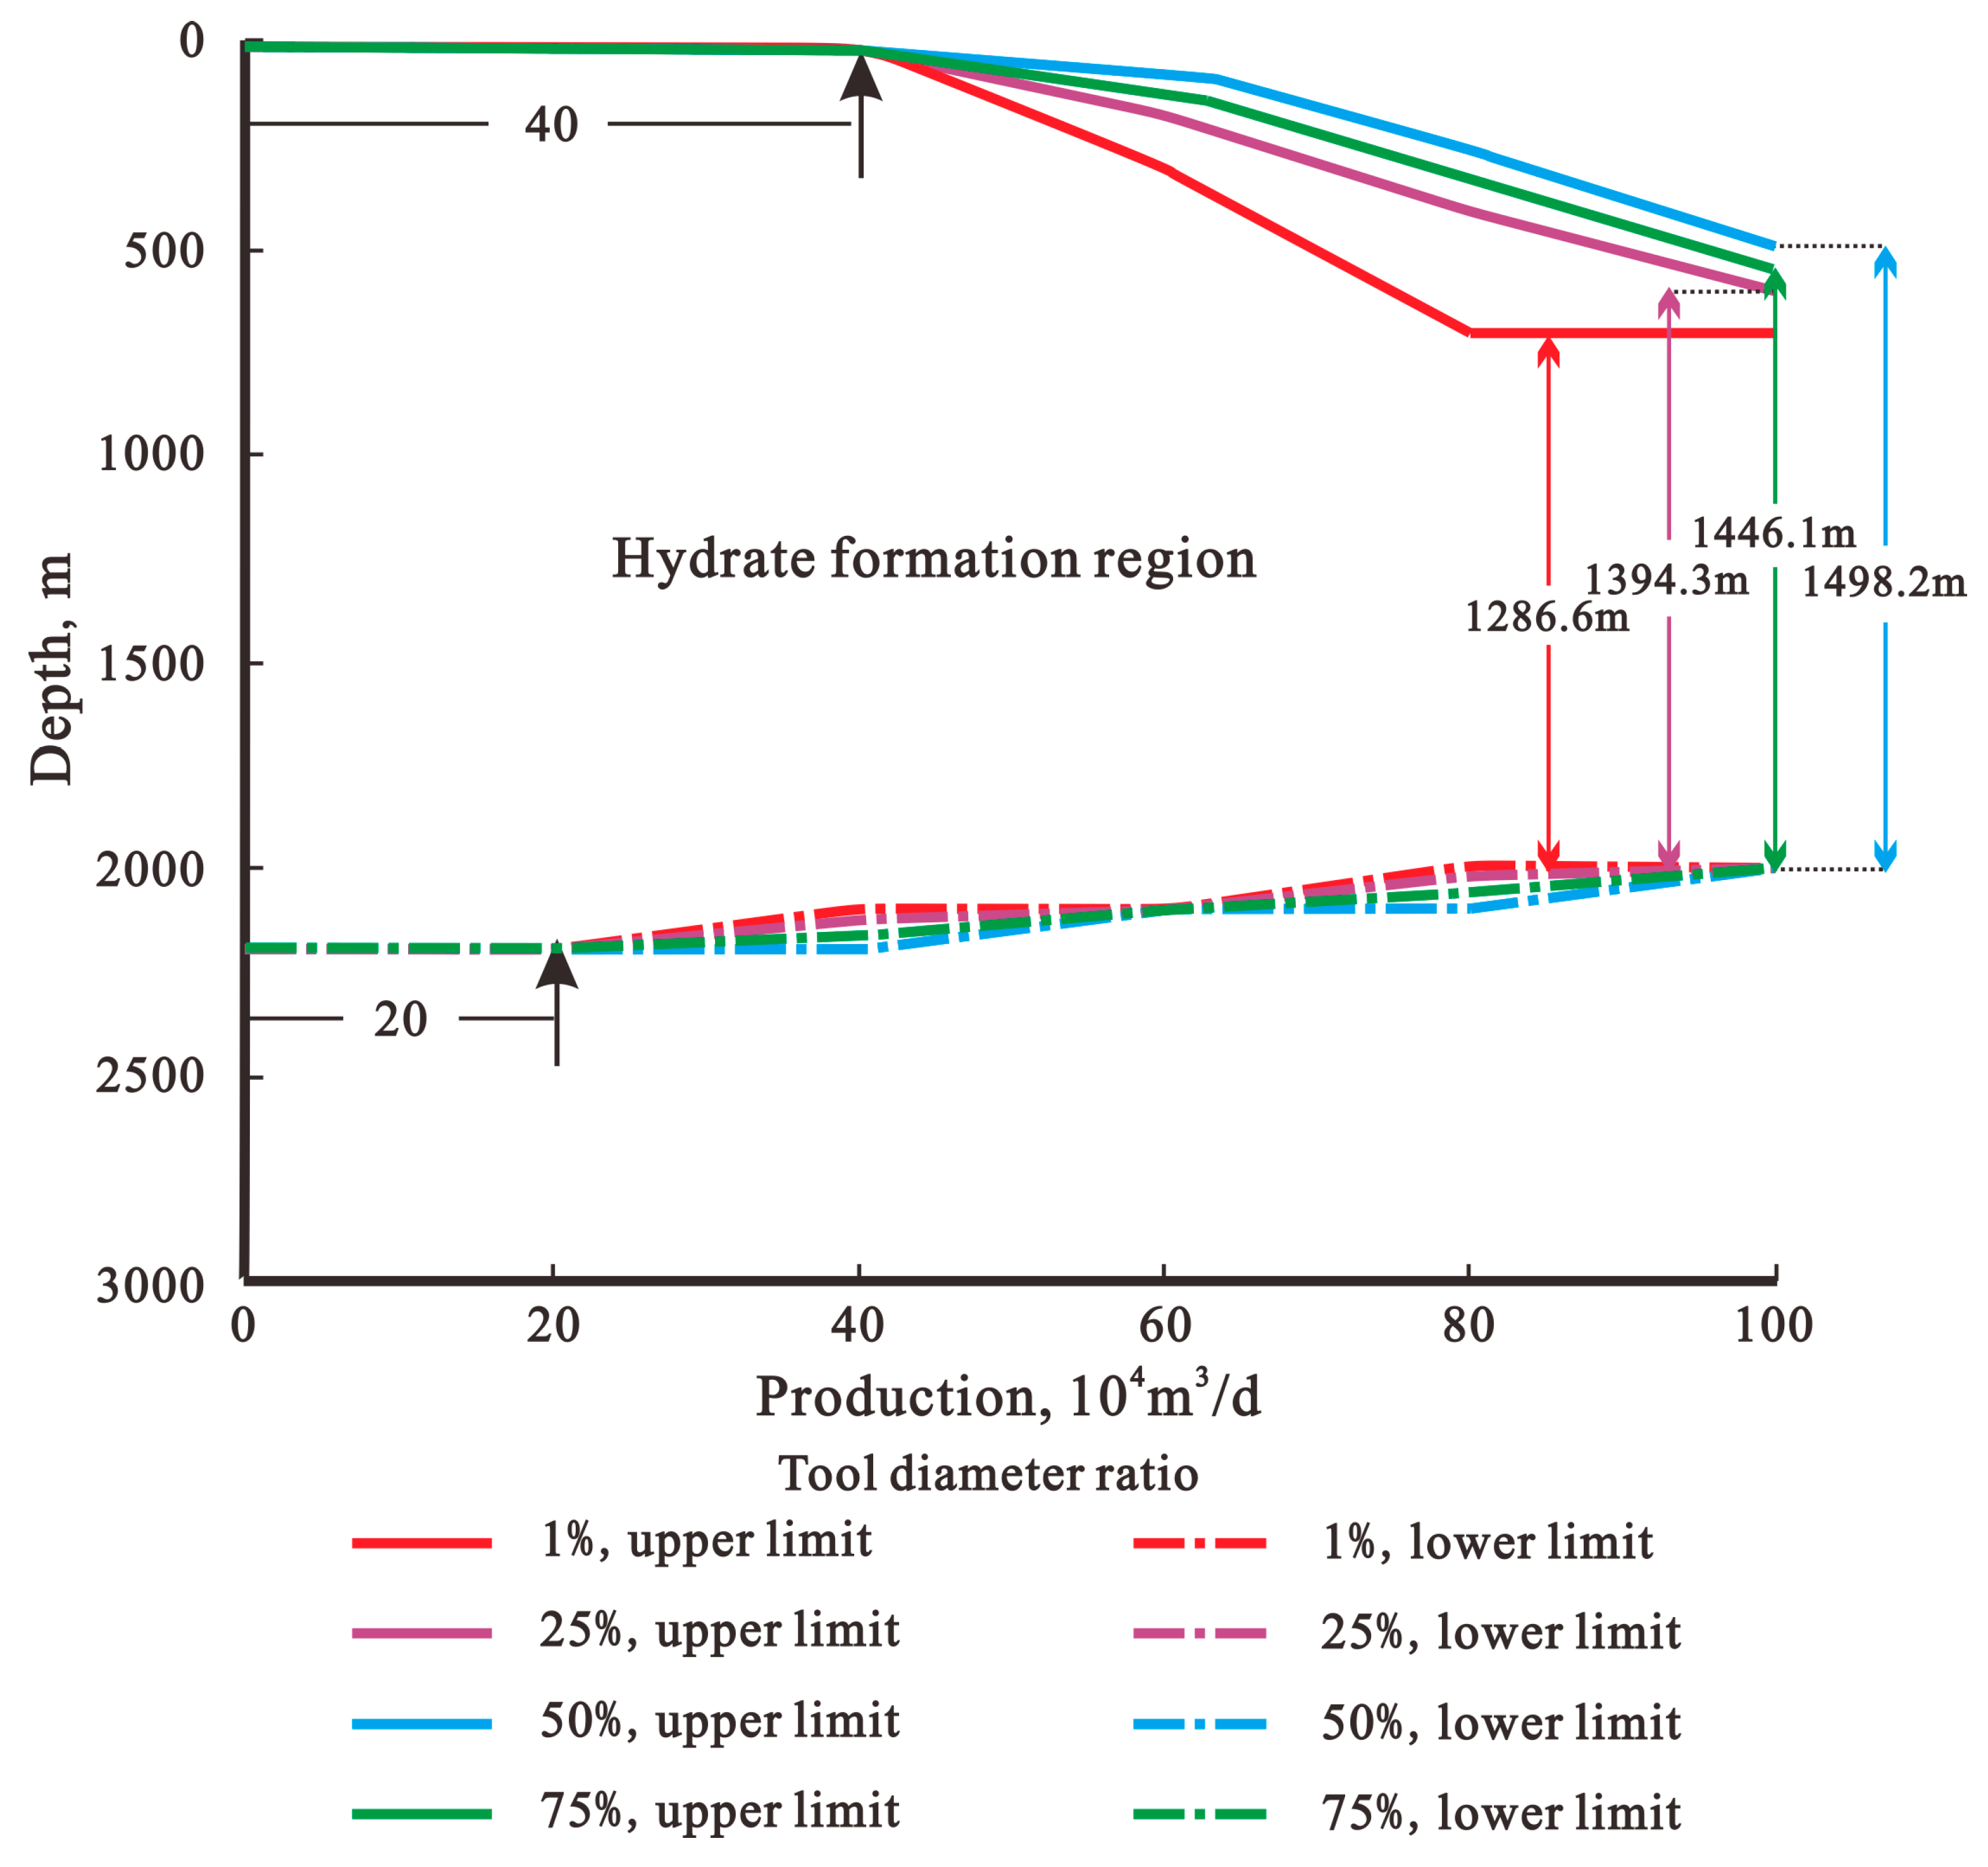
Since the tool movement velocity does not affect the hydrate generation. We selected a tool movement velocity of 0.5 m/s and analysed the upper and lower depth limits of hydrate deposition in the wellbore under different production conditions based on the phase curve plate. The effect of different tool sizes on the range of wellbore hydrate generation during gas well production was further determined. Under the conditions of different tool sizes, with the increase in gas well production, the lower inflexion point of the depth of wellbore hydrate deposition appeared at the gas well production rate of 20 × 104 m3/d. The upper inflexion point of the depth of the wellbore hydrate deposition appeared at the gas well production rate of 40 × 104 m3/d, and the range of the depth of hydrate deposition began to decrease substantially. The hydrate deposition range corresponds to the lowest wellbore length when the production rate reaches 100 × 104 m3/d. At 1% tool size, the minimum length of wellbore hydrate generation area is 1290.84 m; at 25% tool size, the minimum length of wellbore hydrate generation area is 1394.3 m; at 50% tool size, the minimum length of wellbore hydrate generation area is 1498.2 m; and at 70% tool size, the trend of wellbore hydrate generation is reversed, and the hydrate generation trend of the wellbore hydrate generation area is reversed compared to that at the 50% tool size. When the tool size is 50%, its hydrate generation area range decreases and the minimum length is 1446.1 m (Figure 7). It shows that under the same conditions, with the increase in tool size, it directly increases the risk of hydrate generation and magnifies the hydrate generation area. However, as the tool size increases to a certain level, i.e., after more than 50%, the risk of hydrate generation in the wellbore decreases and the generation area starts to shrink. This result is consistent with the understanding of the effect of tool size on fluid density and hydrate generation capacity.
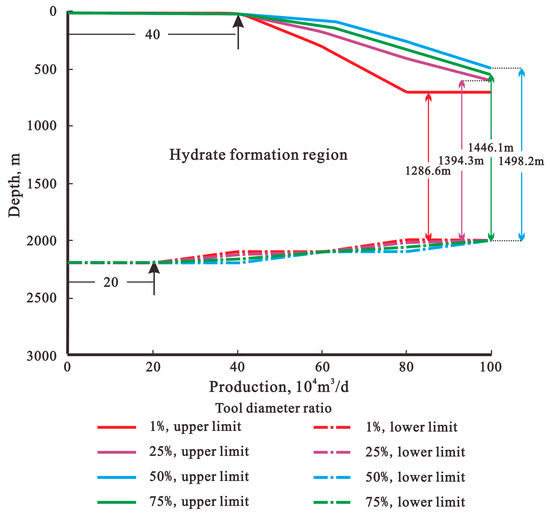
Figure 7.
Prediction of wellbore hydrate generation risk area by tool size share.
Since the production of deepwater gas wells is much higher than that of conventional gas wells, the increase in production leads to a decrease in the gas density in the well, i.e., a decrease in temperature and an increase in pressure in the wellbore. As shown by the simulation results of the hydrate generation risk area under 20 × 104 m3/d, 40 × 104 m3/d, 60 × 104 m3/d, 80 × 104 m3/d, and 100 × 104 m3/d production rates, the production rate has the most significant effect on the change in hydrate generation area. With the increase in yield, the hydrate generation region gradually converges to the mudline. Our numerical simulation process found that due to the high fluid temperature in the deepwater reservoir, the increase in production rate changes the lower limit of the depth of hydrate generation in the wellbore by a relatively small amount. Also, the higher the flow rate in the wellbore, the faster the gas flow rate. The less adequate the heat exchange between the fluid in the wellbore and the surrounding environment, the weaker the ability to reduce the temperature of the fluid in the wellbore, the lower the driving force of hydrate formation, and the significantly lower the rate of hydrate formation, leading to a significant reduction in the depth range of hydrate formation.
3.3. Prediction of Wellbore Hydrate Generation Rate
Combining the results and the understanding of the hydrate generation area prediction, we further analysed the hydrate deposition rate in the wellbore under different tool size conditions. This work was carried out based on the Turner hydrate generation kinetic model [28]. It is considered that the range of hydrate generation in the wellbore decreases after the production rate is higher than 40 × 104 m3/d. Therefore, the production rate of 40 × 104 m3/d and the tool movement speed of 0.5 m/s were selected as the production and operating conditions of the gas well. On the basis of the wellbore temperature and pressure model, the hydrate deposition rate model under deepwater gas well operation in deepwater wellbore was established.
where is the hydrate deposition rate, mm/min; is the effective tube diameter, mm; is the molar mass of hydrate, kg/mol; , is the kinetic parameter; is the kinetic parameter; and is the degree of subcooling, K.
The kinetic parameters were calculated from regressions of indoor experiments [29,30], with 2.608 × 10¹⁶ and 13,600.
The formula for subcooling is as follows:
where is the hydrate phase equilibrium temperature, K; and is the fluid temperature in the wellbore, K.
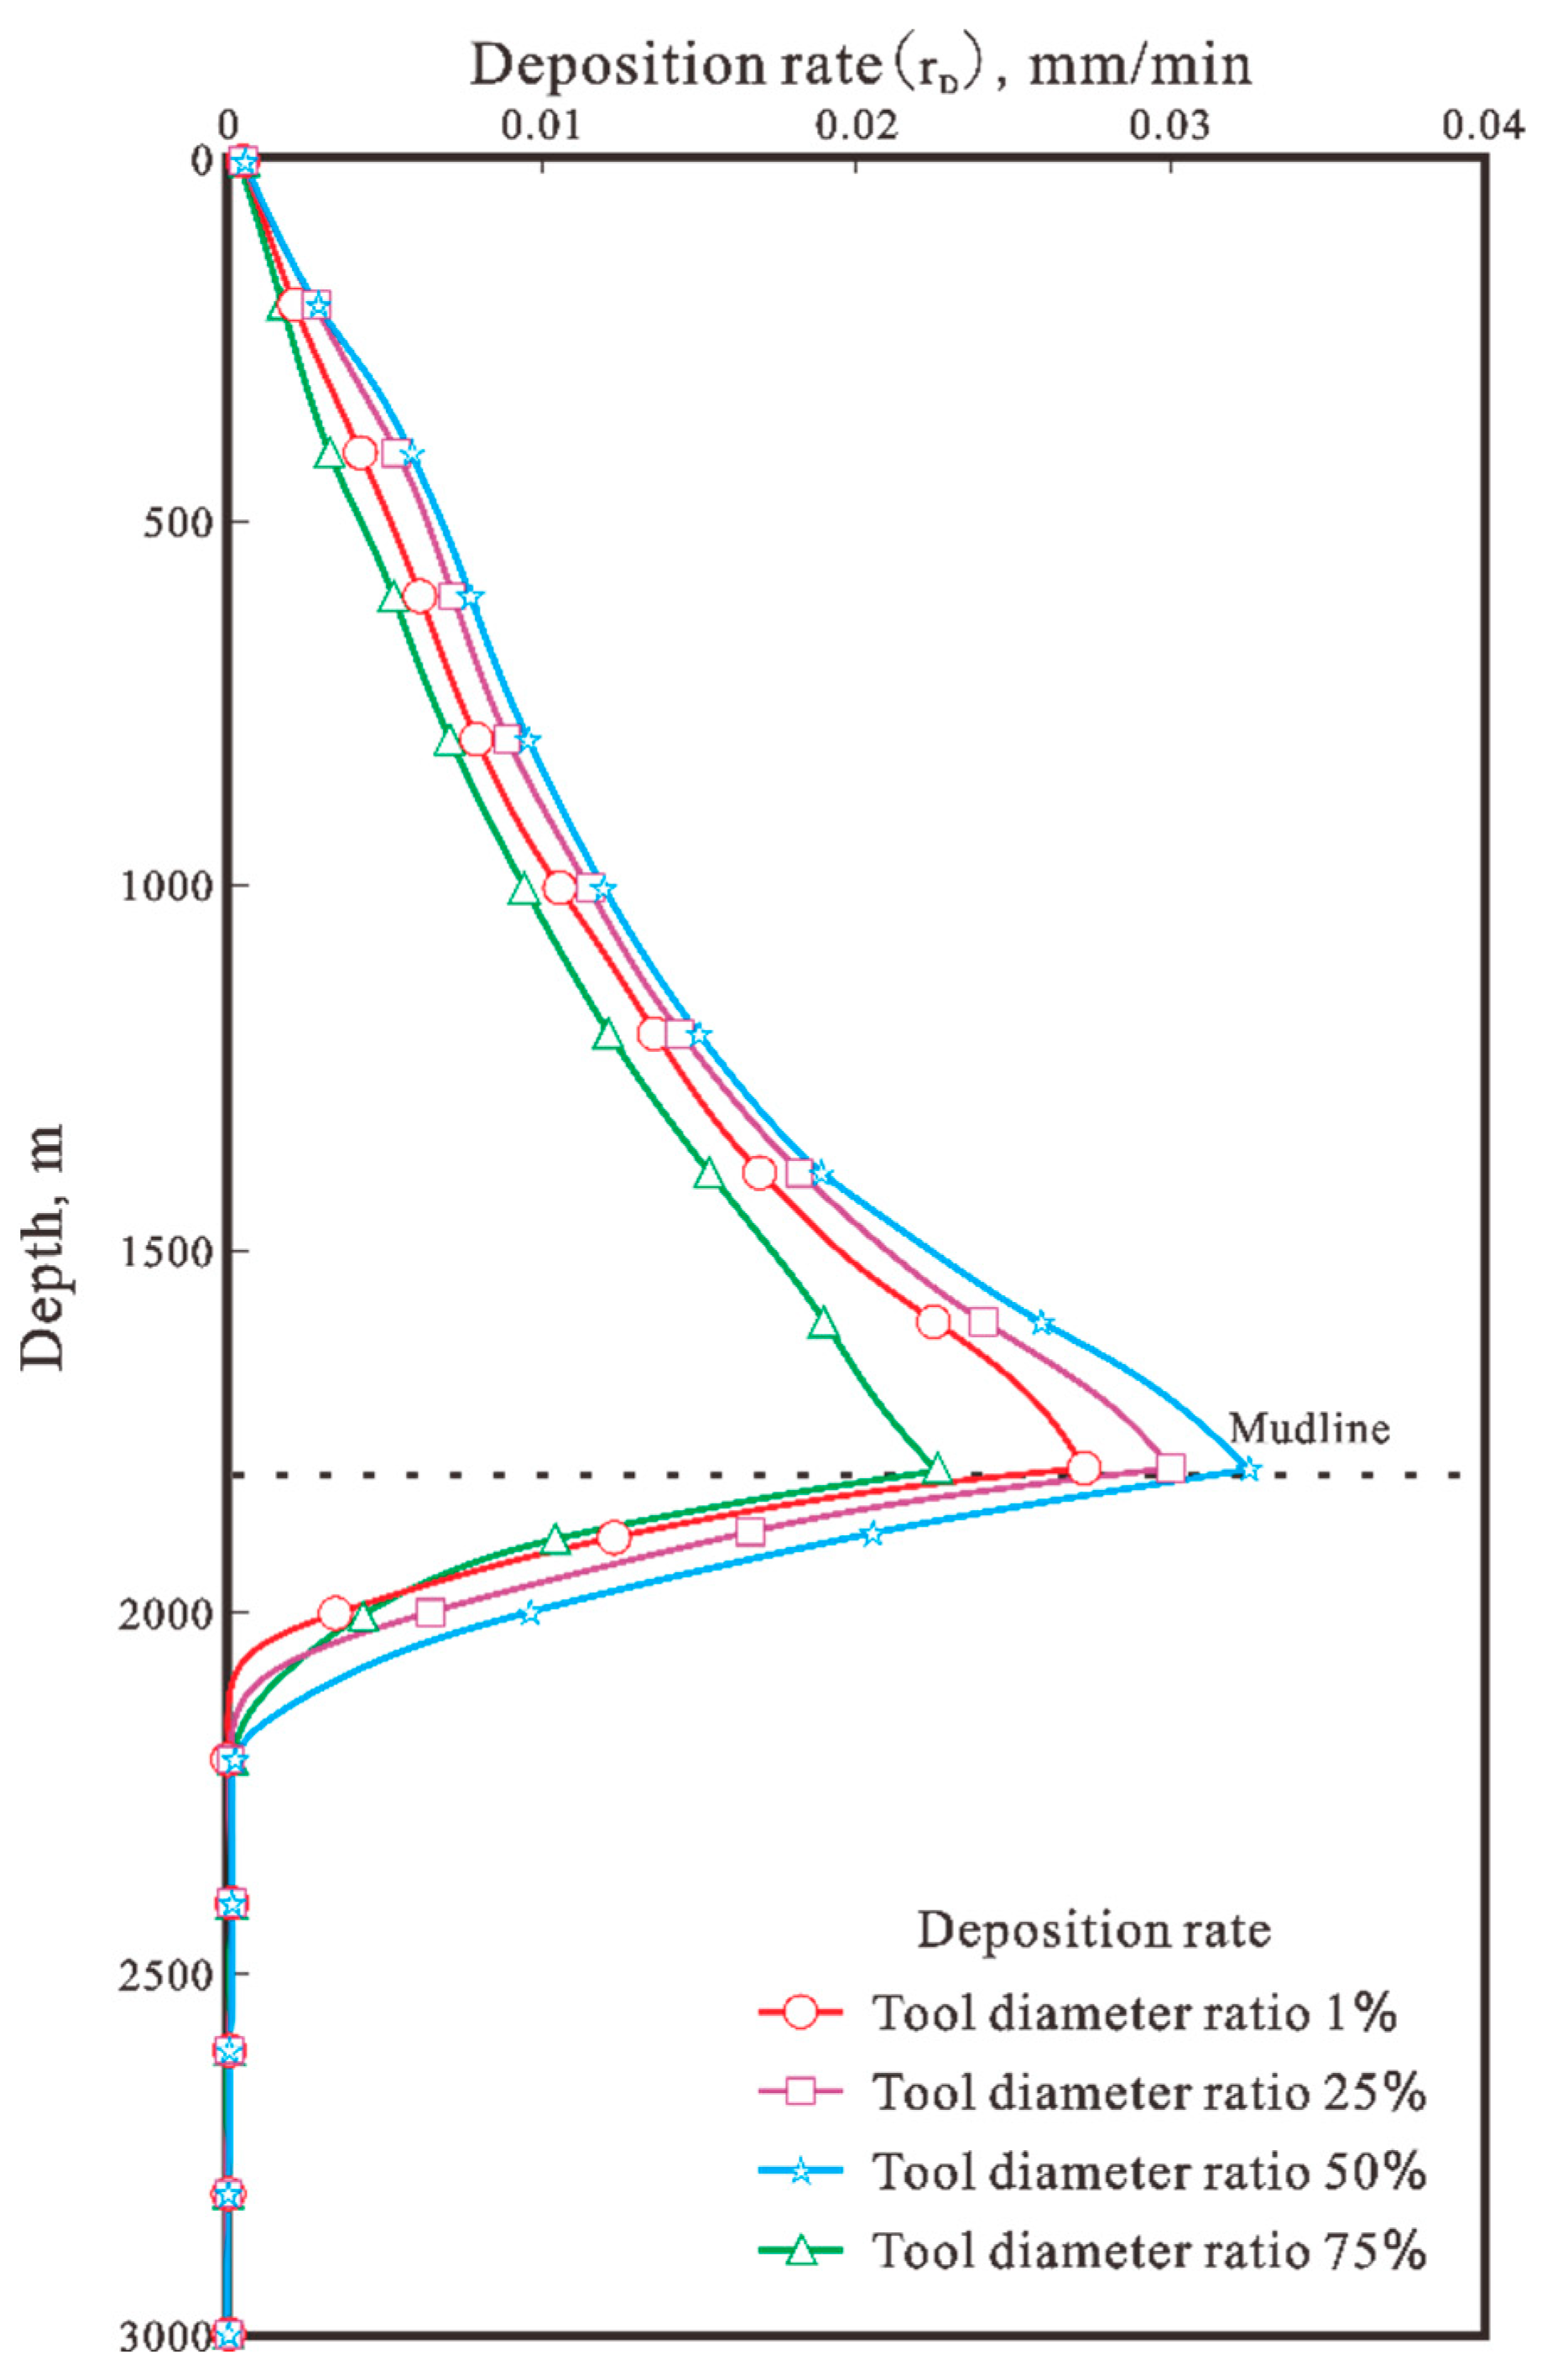
The deposition rate is more consistent with the pattern of modelling results in the generation risk area. The presence of operational tools increases the ability of wellbore hydrate generation. When the percentage of the tool size is less than 50%, the wellbore hydrate deposition rate accelerates with the tool size. The difference in hydrate deposition rate near the mudline was large, and the hydrate deposition rate increased by 10.14% and 8.38% for tool size percentage of 1–50%, respectively. However, when the tool size percentage exceeds 50%, the trend of hydrate generation wind in the wellbore changes. At this time, the range of hydrate generation in the wellbore began to decrease, and the hydrate deposition rate decreased by 30.65% after the tool size percentage grew from 50% to 75% (Figure 8).
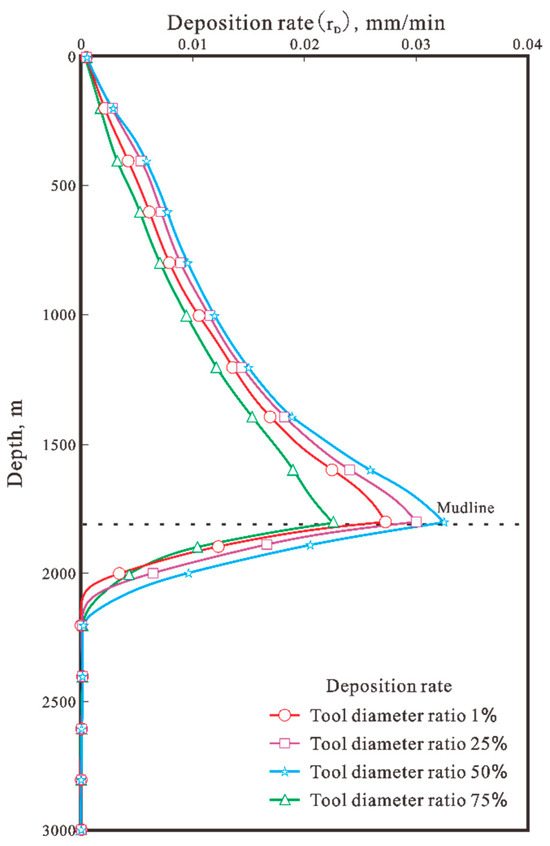
Figure 8.
Predicted results of different tool sizes for wellbore hydrate generation risk areas.
The above results show that equipment operation is carried out during the production of deepwater gas wells, and the gas well production rate or the wellbore fluid flow rate has the greatest degree of influence on the risk of hydrate generation in the wellbore. This is consistent with the previous findings that in high velocity gas flow, the liquid film is forced to move along the tubing wall by the gas flow resistance at its interface, and therefore part of the liquid film will be atomised by the high velocity flow, which affects hydrate generation [31]. The density model also proved that the methane hydrate phase curve gradually shifted to the right as the density of the gas and water two-phase flow inside the tube column gradually increased. Under the same temperature condition, the pressure required for methane hydrate formation is smaller, and the less dense fluid has a low risk of hydrate formation in the wellbore. At the same time, deepwater gas wells have high fluid temperatures at the bottom of the well, high pressures, and high base production capacities. In this case, even if the fluid velocity is further increased, its ability to change the lower limit of the hydrate-generating region is smaller.
In the pre-increase in tool size in the wellbore, the volume of fluid in the wellbore is compressed and the pressure increases, which promotes hydrate generation and the higher the rate of hydrate deposition. And as the tool size percentage exceeds 50%, the tool enhances the throttling effect of the fluid in the wellbore. At this time, the fluid pressure decreases significantly (Figure 2), and the fluid volume increases, making the flow rate increase after throttling. The increase in flow rate has a certain inhibitory effect on hydrates, so it reduces the range of hydrate generation in the wellbore, and the deposition rate is also reduced significantly.
4. Conclusions
1. Equipment operation during production of deepwater gas wells has little effect on the temperature field but directly affects the pressure field in the wellbore. The pressure in the wellbore increases with the diameter of the working tool from 1 to 50 per cent of the tool diameter. However, the pressure in the wellbore starts to decrease when the tool diameter exceeds 50%, and the decrease is larger above the mudline. The wellbore density model and the simulation results of hydrate generation area prediction for different tool sizes show the same characteristics. This is due to the fact that the throttling effect of the fluid in the wellbore increases significantly after the tool size in the wellbore exceeds 50%. At this time, the fluid’s gas volume increases while the pressure decreases, increasing the flow rate of the throttled fluid. Thus, the generation of the hydrate tool is inhibited. The range of hydrate generation in the wellbore is reduced, and the deposition rate is lowered.
2. Deepwater gas wells with high reservoir pressure have higher gas production rates. When the gas production rate exceeds 20 × 104 m3/d, the production rate of the gas well begins to inhibit the generation of hydrates in the wellbore. The faster the fluid flow rate in the wellbore, the less adequate the heat exchange between the fluid in the wellbore and the surrounding environment. This results in a weakened ability to reduce the temperature of the fluid in the wellbore, a reduced driving force for hydrate formation, and a significant reduction in the rate of hydrate formation, leading to a significant reduction in the depth range of hydrate formation. Due to the high fluid temperature in deepwater reservoirs, the increase in production rate changes the lower limit of the depth range of hydrate formation in the wellbore by a relatively small amount.
Author Contributions
Conceptualization, Y.L.; Methodology, D.W.; Validation, H.Z.; Formal Analysis, D.W.; Resources, F.Y.; Data Curation, B.G. and F.Y.; Writing—Original Draft, D.W.; Writing—Review and Editing, B.G. and Y.L.; Visualisation, H.Z.; Project Administration, Z.L.; Funding Acquisition, Y.L. All authors have read and agreed to the published version of the manuscript.
Funding
This research was funded by Daqing Guiding Science and Technology Plan Project (ZD-2024-16), the National Key Research and Development Program of China (2024YFC2814704), the Guiding Innovation Fund of Northeast Petroleum University (2023YDL-02), the Hainan province major science and technology project (ZDKJ2021025), the Natural Science Foundation of Hainan Province (521MS0793), and the Guided Innovation Fund of Northeast Petroleum University (15071202305).
Data Availability Statement
The original contributions presented in this study are included in the article. Further inquiries can be directed to the corresponding author.
Acknowledgments
The authors gratefully acknowledge the anonymous reviewers for their insightful feedback which significantly improved the quality of this work.
Conflicts of Interest
Author Fahao Yu was employed by the Bohai Oilfield Research Institute of CNOOC Ltd. The remaining authors declare that the research was conducted in the absence of any commercial or financial relationships that could be construed as a potential conflict of interest.
References
- Li, Q.; Li, Q.; Cao, H.; Wu, J.; Wang, F.; Wang, Y. The Crack Propagation Behaviour of CO2 Fracturing Fluid in Unconventional Low Permeability Reservoirs: Factor Analysis and Mechanism Revelation. Processes 2025, 13, 159. [Google Scholar] [CrossRef]
- Aman, Z.M.; Di Lorenzo, M.; Kozielski, K.; Koh, C.A.; Warrier, P.; Johns, M.L.; May, E.F. Hydrate formation and deposition in a gas-dominant flowloop: Initial studies of the effect of velocity and subcooling. J. Nat. Gas Sci. Eng. 2016, 35, 1490–1498. [Google Scholar]
- Andreussi, P.; Asali, J.C.; Hanratty, T.J. Initiation of roll waves in gas-liquid flows. AIChE J. 1985, 31, 119–126. [Google Scholar]
- Arrieta, V.V.; Torralba, A.O.; Hernandez, P.C.; García, E.R.; Maia, C.T.; Guajardo, M. Case History: Lessons Learned from Retrieval of Coiled Tubing Stuck by Massive Hydrate Plug When Well Testing in an Ultradeepwater Gas Well in Mexico. SPE Prod. Oper. 2011, 26, 337–342. [Google Scholar]
- Standing, M.B. Volumetric and Phase Behavior of Oil Field Hydrocarbon Systems; Society of Petroleum Engineers: Dallas, TX, USA, 1977; pp. 121–122. [Google Scholar]
- Bondarev, É.A.; Gabysheva, L.N.; Kanibolotskii, M.A. Simulation of the formation of hydrates during gas flow in tubes. Fluid Dyn. 1982, 17, 740–746. [Google Scholar]
- Bozorgian, A. Methods of Predicting Hydrates Formation. Adv. J. Sci. Eng. 2020, 1, 34–39. [Google Scholar]
- Di Lorenzo, M.; Aman, Z.M.; Kozielski, K.; Norris, B.W.E.; Johns, M.L.; May, E.F. Underinhibited Hydrate Formation and Transport Investigated Using a Single-Pass Gas-Dominant Flowloop. Energy Fuels 2014, 28, 7274–7284. [Google Scholar]
- Englezos, P.; Kalogerakis, N.; Dholabhai, P.D.; Bishnoi, P.R. Kinetics of formation of methane and ethane gas hydrates. Chem. Eng. Sci. 1987, 42, 2647–2658. [Google Scholar]
- Hall, K.; Yarborough, L. A new equation of state for Z-factor calculations. Oil Gas J. 1973, 71, 82–92. [Google Scholar]
- Li, J.; Gao, Y.; Zheng, Q.; Sun, B.; Li, G. Hydrate formation prediction in deepwater gas well testing. Oil Drill. Prod. Technol. 2012, 34, 77–80. (In Chinese) [Google Scholar]
- Li, X.-S.; Liu, Y.; Zeng, Z.-Y.; Chen, Z.; Li, G.; Wu, H.-J. Equilibrium Hydrate Formation Conditions for the Mixtures of Methane + Ionic Liquids + Water. J. Chem. Eng. Data 2010, 56, 119–123. [Google Scholar]
- Li, Z.; Xie, R.; Wu, Y.; Yuan, J. Progress and prospect of CNOOC’s oil and gas well drilling and completion technologies. Nat. Gas Ind. B 2022, 9, 209–217. [Google Scholar]
- Liu, W.; Hu, J.; Li, X.; Sun, F.; Sun, Z.; Zhou, Y. Research on evaluation method of wellbore hydrate blocking degree during deepwater gas well testing. J. Nat. Gas Sci. Eng. 2018, 59, 168–182. [Google Scholar] [CrossRef]
- Maekawa, T. Equilibrium conditions for gas hydrates of methane and ethane mixtures in pure water and sodium chloride solution. Geochem. J. 2001, 35, 59–66. [Google Scholar]
- Munck, J.; Skjold-Jørgensen, S.; Rasmussen, P. Computations of the formation of gas hydrates. Chem. Eng. Sci. 1988, 43, 2661–2672. [Google Scholar] [CrossRef]
- Sloan, E.D.; Koh, C.A. Clathrate Hydrates of Natural Gases, 3rd ed.; CRC Press: Boca Raton, FL, USA, 2007. [Google Scholar]
- Sloan, E.D. A changing hydrate paradigm—From apprehension to avoidance to risk management. Fluid Phase Equilibria 2005, 228–229, 67–74. [Google Scholar] [CrossRef]
- Sohn, Y.H.; Kim, J.; Shin, K.; Chang, D.; Seo, Y.; Aman, Z.M.; May, E.F. Hydrate plug formation risk with varying watercut and inhibitor concentrations. Chem. Eng. Sci. 2015, 126, 711–718. [Google Scholar]
- Suo, Y.; Dong, M.; Fu, X.; He, W.; Pan, Z. Experimental and numerical simulation research on hot dry rock wellbore stability under different cooling methods. Geothermics 2024, 119, 102977. [Google Scholar]
- Suo, Y.; Guan, W.; Dong, M.; Zhang, R.; Wang, K.; He, W.; Fu, X.; Pan, Z.; Guo, B. Study on the heat extraction patterns of fractured hot dry rock reservoirs. Appl. Therm. Eng. 2025, 262, 125286. [Google Scholar]
- Swinkels, W.J.A.M.; Drenth, R.J.J. Thermal Reservoir Simulation Model of Production From Naturally Occurring Gas Hydrate Accumulations. SPE Reserv. Eval. Eng. 2000, 3, 559–566. [Google Scholar]
- Turner, D.; Boxall, J.; Yang, S.; Kleehamer, D.; Koh, C.; Miller, K.; Sloan, E.D.; Xu, Z.; Matthews, P.; Talley, L. Development of a hydrate kinetic model and its incorporation into the OLGA2000-R transient multi-phase flow simulator. In Proceedings of the 5th International Conference on Gas Hydrates, Trondheim, Norway, 13–16 June 2005. [Google Scholar]
- Vysniauskas, A.; Bishnoi, P.R. A kinetic study of methane hydrate formation. Chem. Eng. Sci. 1983, 38, 1061–1072. [Google Scholar] [CrossRef]
- van der Waals, J.H.; Platteeuw, J.C. Clathrate Solutions. In Advances in Chemical Physics; Wiley: Hoboken, NJ, USA, 2007. [Google Scholar]
- Wang, Z.-Y.; Sun, B.-J.; Wang, X.-R.; Zhang, Z.-N. Prediction of natural gas hydrate formation region in wellbore during deep-water gas well testing. J. Hydrodyn. 2014, 26, 568–576. [Google Scholar] [CrossRef]
- Amin, J.S.; Bahadori, A.; Mohamadi, E.; Nia, B.H. Predicting natural gas hydrate formation temperature using Le-venberg-Marquardt algorithm. Pet. Sci. Technol. 2015, 33, 1038–1044. [Google Scholar] [CrossRef]
- Wang, Z.; Zhang, J.; Sun, B.; Chen, L.; Zhao, Y.; Fu, W. A new hydrate deposition prediction model for gas-dominated systems with free water. Chem. Eng. Sci. 2017, 163, 145–154. [Google Scholar] [CrossRef]
- Wang, Z.; Zhao, Y.; Sun, B.; Chen, L.; Zhang, J.; Wang, X. Modeling of Hydrate Blockage in Gas-Dominated Systems. Energy Fuels 2016, 30, 4653–4666. [Google Scholar] [CrossRef]
- Wang, Z.; Zhang, J.; Meng, W.; Sun, B.; Sun, J.; Wang, J.; Liu, D.; Wang, J. Formation, deposition characteristics and prevention methods of gas hydrates in deepwater gas wells. Acta Pet. Sin. 2021, 42, 776–790. (In Chinese) [Google Scholar]
- Zhang, Z.; Wang, J.; Li, Y.; Luo, M.; Zhang, C. Effects of instantaneous shut-in of high production gas well on fluid flow in tubing. Pet. Explor. Dev. 2020, 47, 642–650. [Google Scholar] [CrossRef]


Disclaimer/Publisher’s Note: The statements, opinions and data contained in all publications are solely those of the individual author(s) and contributor(s) and not of MDPI and/or the editor(s). MDPI and/or the editor(s) disclaim responsibility for any injury to people or property resulting from any ideas, methods, instructions or products referred to in the content. |
© 2025 by the authors. Licensee MDPI, Basel, Switzerland. This article is an open access article distributed under the terms and conditions of the Creative Commons Attribution (CC BY) license (https://creativecommons.org/licenses/by/4.0/).