Abstract
As oil resources continue to be depleted, traditional extraction technologies face significant challenges, and improving remaining oil recovery has become a critical issue in the development of low-permeability oil fields. The study first establishes a stratigraphic framework through a fine stratigraphic correlation of key wells, followed by a comprehensive characterization of the internal arrangement of sand bodies, with a detailed analysis of the distribution of interlayers and the complexity of sand body stacking patterns. Based on field data, including tracer monitoring and water absorption profiles, the distribution of remaining oil is predicted. The results reveal that sandy debris flow deposition plays a key role in the enrichment of remaining oil, particularly considering how its internal structure impacts reservoir connectivity and waterflood efficiency. The sedimentary pattern in the study area is dominated by debris flow deposition, with poor continuity of sand bodies; over 90% of individual sand bodies encountered during horizontal well drilling have a width of less than 60 m. Sand body stacking types are classified into overlapping, splicing, and isolated types, and different stacking types significantly influence reservoir waterflood efficiency and the distribution of remaining oil. The innovation of this study lies not only in the microstructural investigation of sandy debris flow but also in the comprehensive characterization of its strong heterogeneity. By analyzing the internal configuration of sand bodies, sedimentary microfacies, and physical property distributions, this study uncovers how these factors influence the distribution of remaining oil. This approach provides valuable insights for accurately predicting and enhancing remaining oil potential.
1. Introduction
With the advancement of the oil recovery process, most of the remaining oil in low-permeability reservoirs is gathered in dead-end or low-permeability pores [1,2,3,4]. If the reservoir is developed as a whole in a generalized manner, it is difficult to extract conventional water or gas drives from these tight reservoirs [5,6]. By studying the internal configuration of multi-level sandstone reservoirs and understanding their fluid distribution characteristics, it is possible to formulate more targeted development strategies, such as directional water injection or layered gas injection, or adopt more precise replacement methods to improve the recovery of remaining oil [7,8,9]. For example, some researchers conducted a reservoir characterization study of the Chang-6 reservoir of the Changqing Oilfield through core and logging data and classified the thick sandstone reservoir into four single-body-based oil layers, which facilitated the subsequent efficient development of each single-body-based oil layer [10,11]. In this context, high-resolution microresistivity image logs can effectively identify sedimentary structures and microfacies, providing valuable insights into reservoir heterogeneity and guiding the prediction of favorable zones for remaining oil recovery in low-permeability oilfields (e.g., Chang 7–3, Triassic Yanchang Formation, Ordos Basin) [12].
Sandy debris flows are usually produced by strong fluid action in water bodies (oceans and lakes), such as mudslides or floods [13]. They are called sandy debris flows because their clastic sediment particles are mostly gravel, with an uneven particle size distribution and fast deposition rate [14]. The outcrops of these flows usually exhibit distinct layering structures, such as massive bedding, cross-bedding, composite bedding, and common features like “mud clast gravel” structures, drainage structures, or deformational structures [15]. Therefore, sandy debris flow reservoirs generally have good pore structures and permeability but strong micro-homogeneity due to the spatially complex fluid environments [15]. A prior study concluded that gravity flow deposition is widely developed in study areas through core and outcrop observation and illustrated that sandy debris flow sand bodies are relatively good reservoirs [16]. Gravitational flow typically involves fluid turbulence, matrix strength, or a combination of both, which can vary along the length and width of the sediment bed [17] Gravitational flows influence reservoir development by controlling the distribution of sedimentary facies, shaping reservoir geometry, and inducing variations in porosity and permeability, which are critical for predicting reservoir quality and optimizing field development [18].
In reservoir geology research, previous researchers have focused on quantitatively analyzing reservoirs’ overall structural characteristics and physical parameters [19,20]. Moreover, in research on sandstone reservoirs, the majority of study results focus on sedimentary characteristics, reservoir classification, and their influence on oil and gas aggregation and transportation [21,22]. However, for sandy debris flows, as a specific type of sedimentary body, the complexity of their internal configurations is often ignored, resulting in the relevant research mainly staying at the macro description level [22]. Furthermore, the mechanism by which microstructural characteristics affect the distribution and flow of residual oil is not yet well understood [22]. Therefore, there is an urgent need to carry out a systematic microscopic study on the internal configuration of sandy debris flows to reveal the mechanism underlying their role in the enrichment and distribution of residual oil [22].
The purpose of this paper is to clarify the regional geologic depositional pattern of the study area by constructing a fine stratigraphic framework of the reservoir and then analyzing the micro-phase characteristics of sandy debris flow deposition. On this basis, the internal configuration of the sand body is systematically characterized, including the spatial spreading of the sedimentary units, the distribution of the compartmentalized interlayers, and the stacking relationship of the sand body and other key elements. Tracer and water absorption profile data are used to predict the potential distribution area of the remaining oil. Analyzing the coupling relationship between the internal configuration of a sandy debris flow and its fluid transport characteristics to reveal its controlling role and influencing mechanism on the distribution of remaining oil provides a scientific basis for improving the efficiency of remaining oil utilization and optimizing the development plan.
2. Field Background and Geological Setting
The HeShui (HS) Oilfield is located in the eastern part of Gansu Province, on the southwestern edge of the Ordos Basin. The Ordos Basin is one of the most important oil and gas basins in China, with abundant oil and natural gas resources. The region of the HS Oilfield belongs structurally to the southwestern slope zone of the basin and is influenced by regional tectonic movements, forming a complex fault system and sedimentary pattern. The geological structure of the area is complex and covers several tectonic units with faults, folds, and diverse sedimentary environments [23]. The stratigraphy of the area mainly consists of sedimentary rocks of the Paleozoic and Mesozoic eras, and the lithology is diversified, including sandstone, mudstone limestone, and other lithologies. The Chang-63 layer of the Prolongation Formation belongs to the upper part of the Permian Prolongation Formation, in which reservoir space mainly comprises fractures and pores, and the depositional type is an alternating stratigraphic structure of sandstone and mudstone, which reflects the hydrodynamic environmental changes of this layer in the depositional process [24]. The results of heavy mineral analysis indicate that the material source of the Chang-63 layer comes from the southwestern source area, and this feature reflects the characteristics of the central catchment area of the lake basin [25]. The multi-point supply in this area provides favorable geological conditions for the formation of large-scale debris flow deposits.
Currently, there are 483 oil wells in the area, including 132 directional wells and 351 horizontal wells. The average daily oil production is 1102.4 tons. Horizontal wells contribute the majority, with 1009.5 tons. The average daily oil production per well is 2.28 tons. Horizontal wells have a significantly higher production rate, at 2.89 tons, compared to directional wells, which produce 0.7 tons on average. The composite water cut is 42.4%, with the horizontal wells having a higher water cut (42.6%). The remaining recoverable oil recovery rate is 6.76%; the geological recovery rate and the recoverable oil recovery rate are 0.49% and 4.32%, respectively; and the geological recovery degree and recoverable recovery degree are 4.47% and 39.56%, respectively. There are 292 water injection wells in the work area, with a total daily water injection of 26.759 × 10⁶ m3. The average daily water injection per well is 112,000 m3. The cumulative injection/production ratio is 1.40, which indicates that the injection/production system is running well. This provides a solid foundation for further improving the recovery rate.
3. Materials and Methods
3.1. Methodological Framework
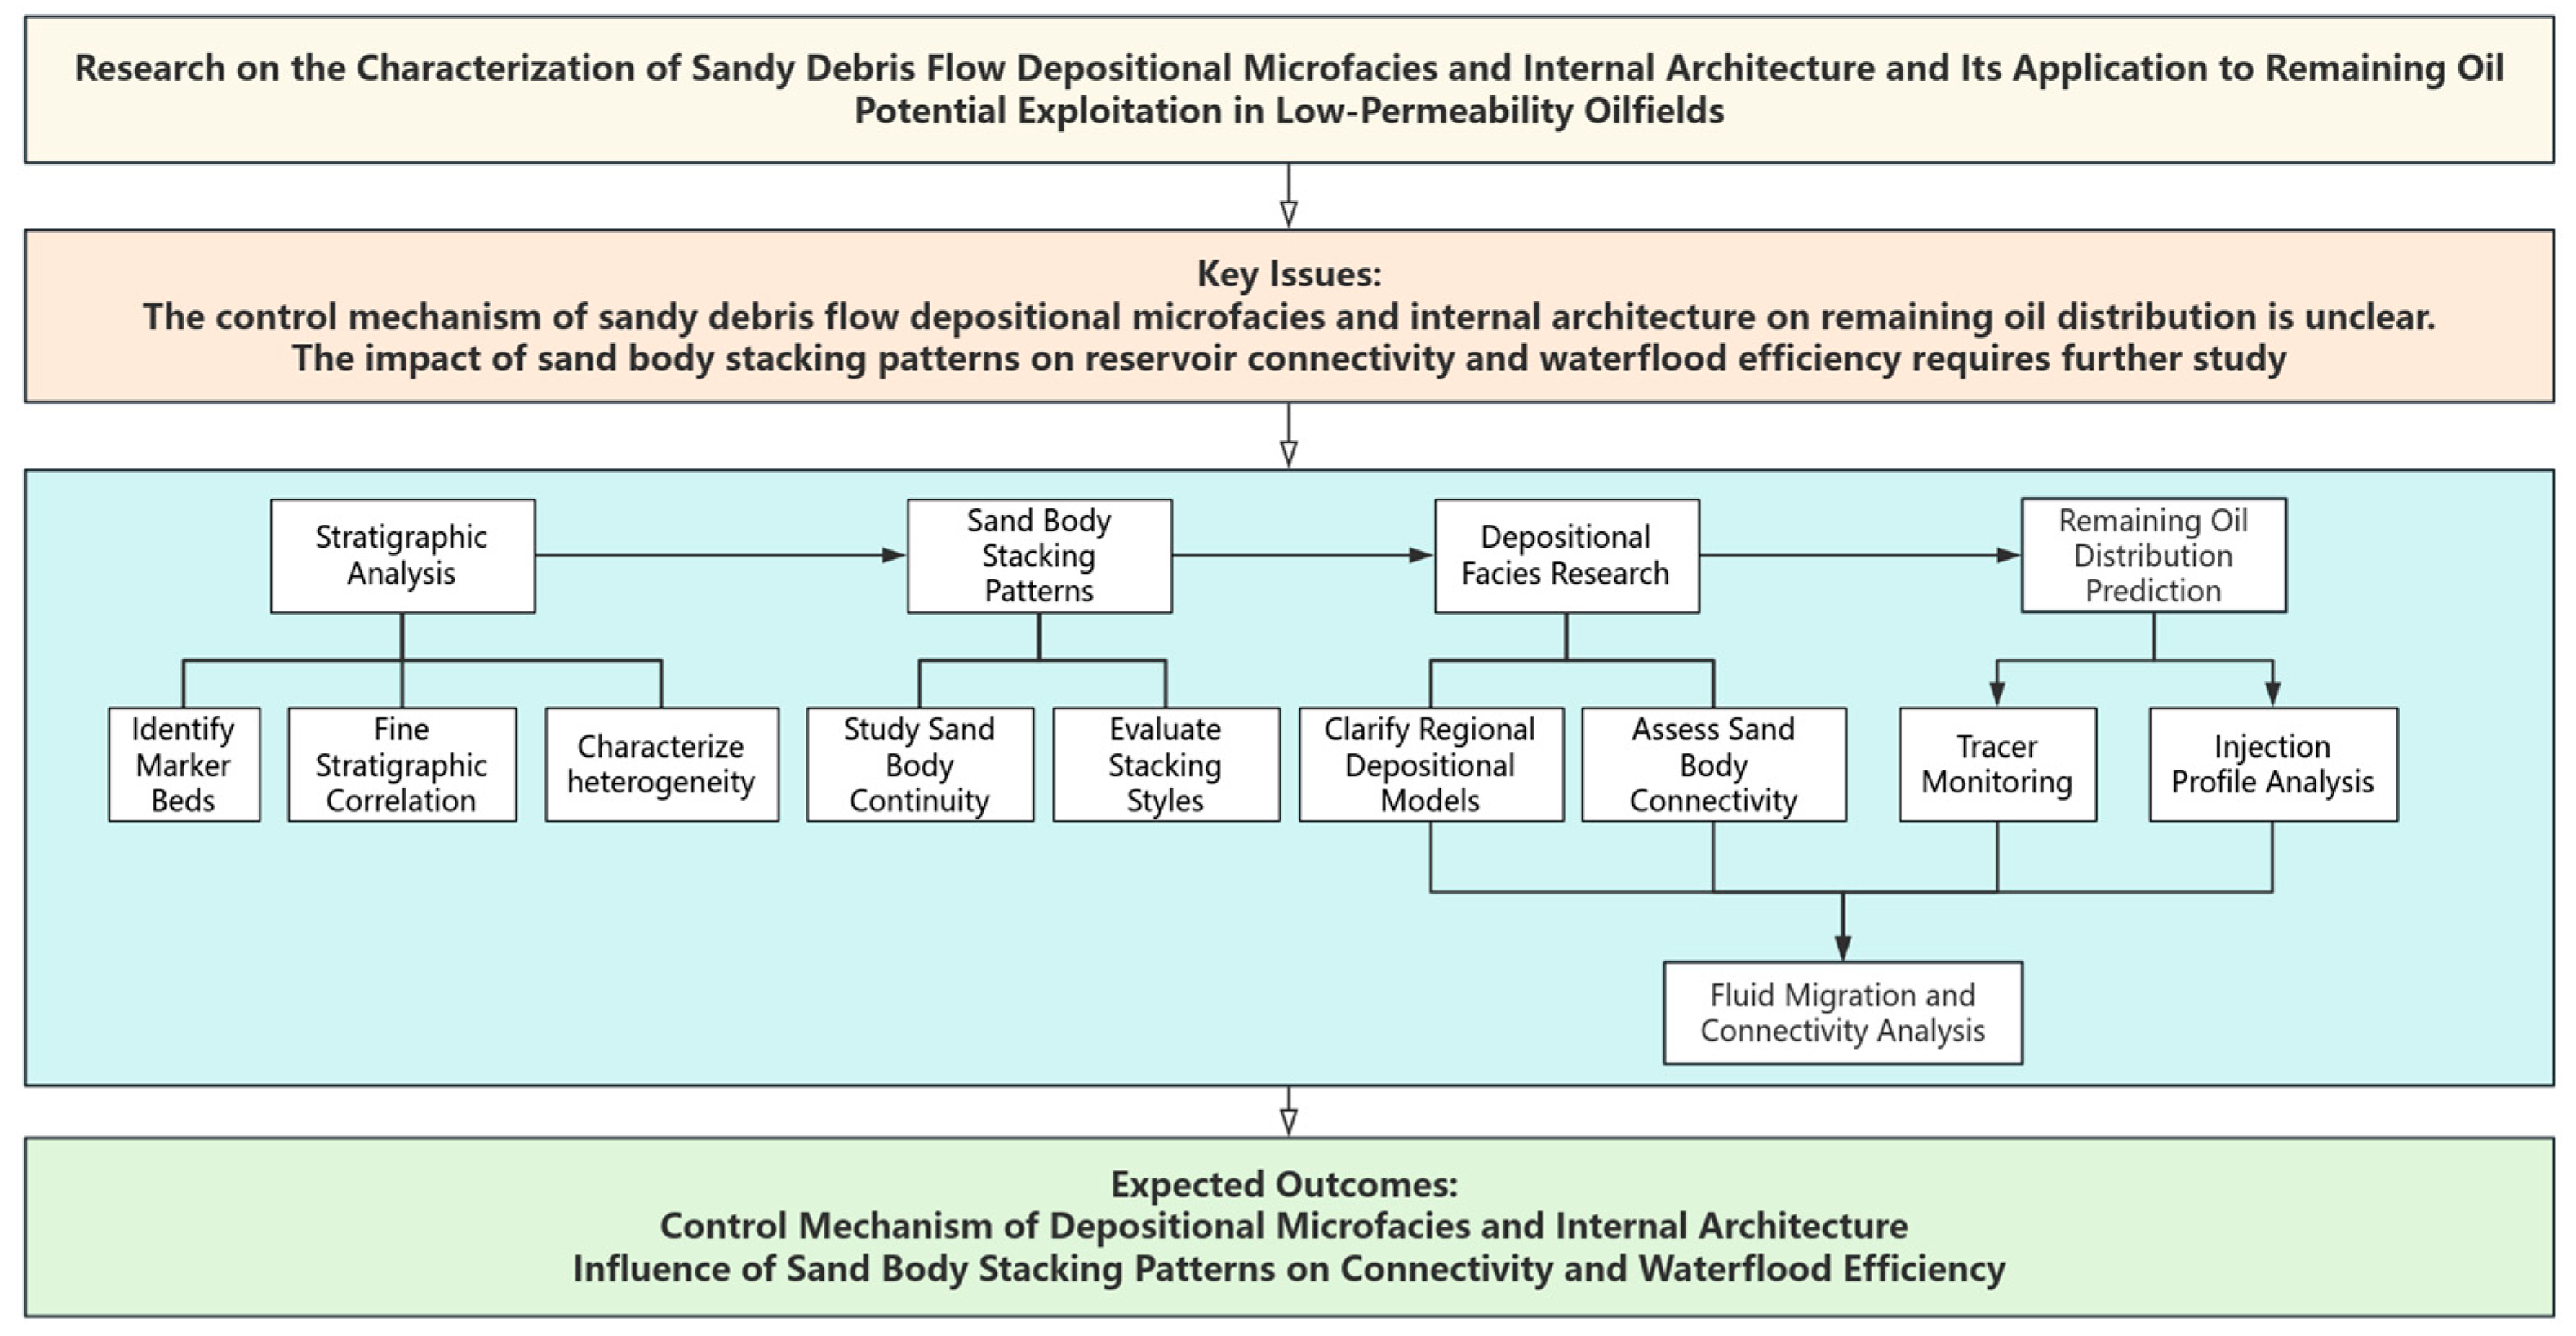
To explain the entire script process of this study, a comprehensive technical flowchart is presented in Figure 1. The workflow consists of four main modules: stratigraphic analysis, sand body stacking pattern analysis, depositional facies research, and remaining oil distribution prediction. Each module comprises multiple analytical tasks aimed at characterizing the depositional microfacies, evaluating sand body continuity, and predicting fluid migration and connectivity.
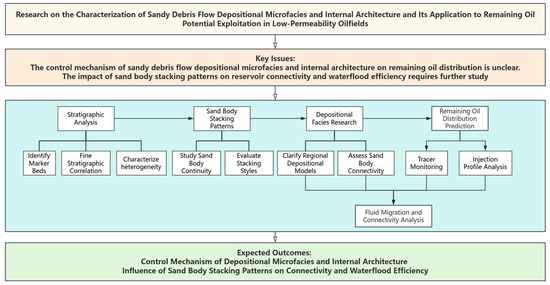
Figure 1.
Technical flowchart for this study.
The methodology involves a stepwise approach where marker beds are identified and fine stratigraphic correlations are established to characterize heterogeneity. Sand body stacking patterns are then analyzed to evaluate their continuity and stacking styles. Depositional facies models and sand body connectivity are clarified, which ultimately inform the prediction of remaining oil distribution and waterflood efficiency. Fluid migration and connectivity analysis further refine the understanding of reservoir dynamics, contributing to the expected outcomes of this study.
3.2. Stratigraphy Divisions
The Z211 area contains three small layers, namely, Chang-631, Chang-632, and Chang-633, with the thickness of the oil layer ranging from 7 to 12 m [26]. Among them, Chang-631 and Chang-632 are the main development targets. Since 2013, production has been built up using a well network method with a single set of small layers. Starting in 2020, a three-dimensional development mode was adopted with staggered layers between wells based on remaining oil recognition. As a result, annual oil production has reached 404,000 tons. The effective thickness of each small layer is 10.8 m (Chang-631), 12.2 m (Chang-632), and 7.0 m (Chang-633). The porosity values are 10.4%, 10.2%, and 11.2%, respectively. The permeability values are 0.24 mD for Chang-631, 0.22 mD for Chang-632, and 0.20 mD for Chang-633. These differences in physical properties between the small layers provide a basis for layered development.
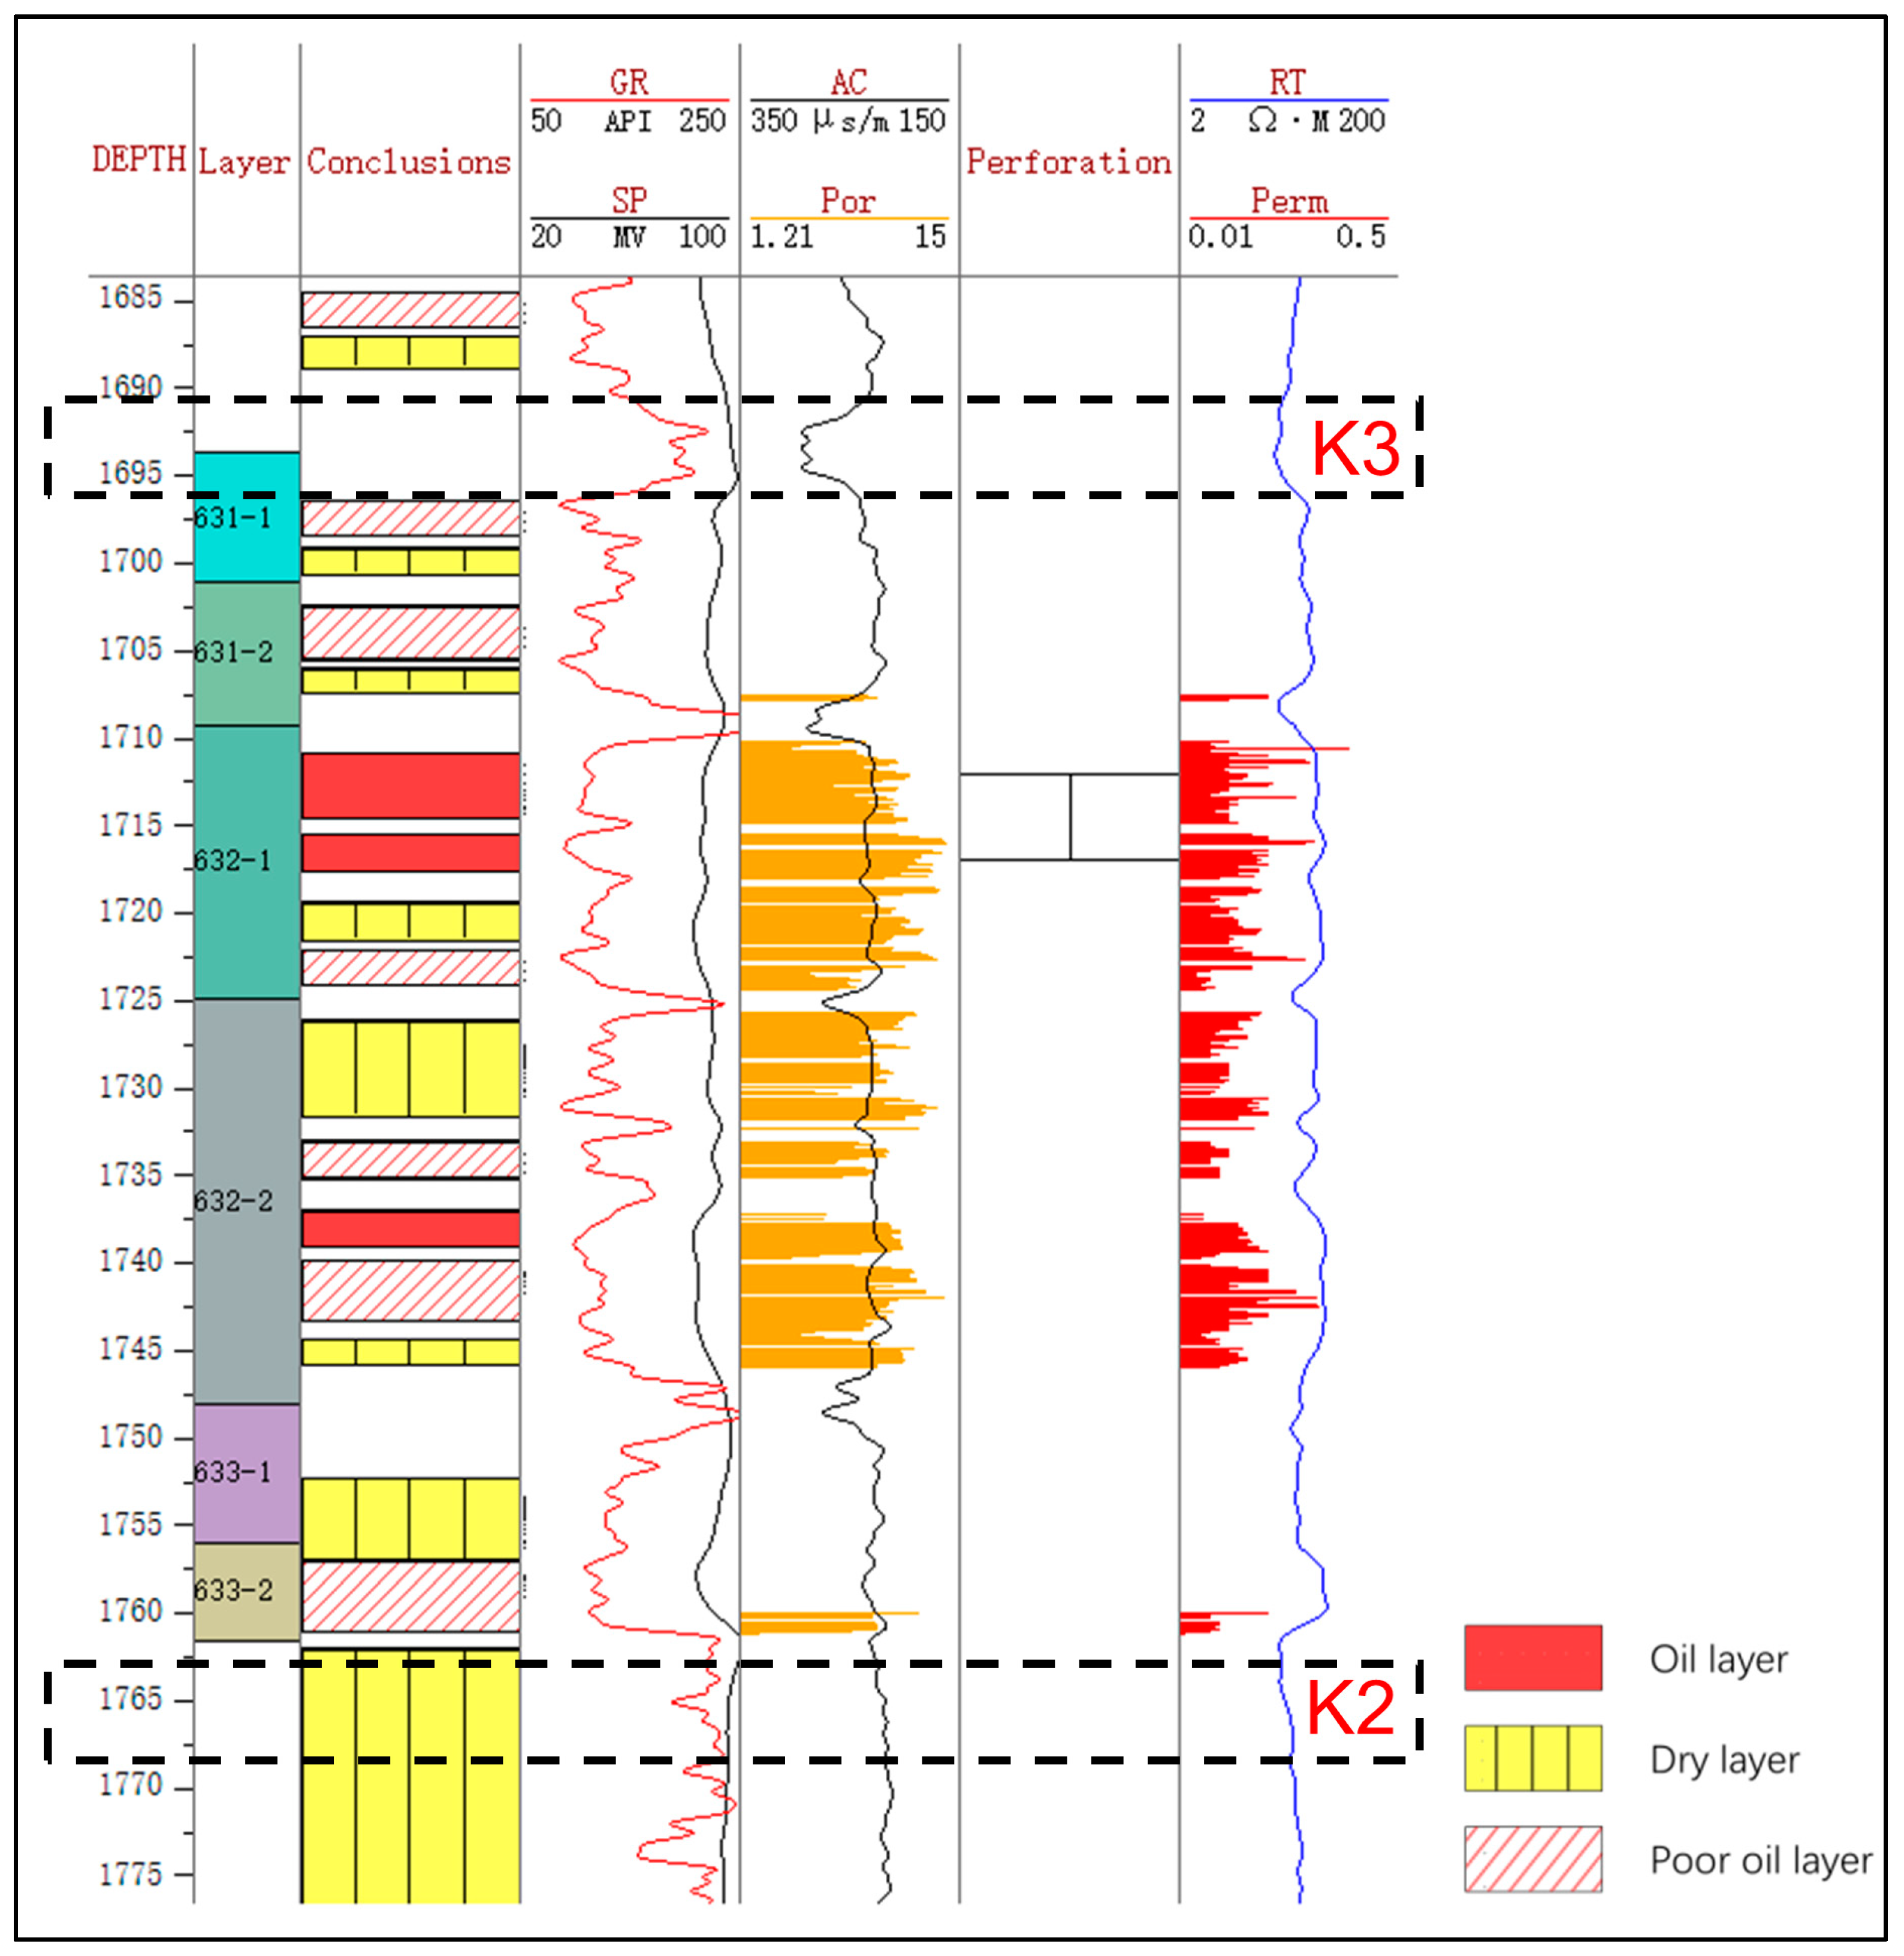
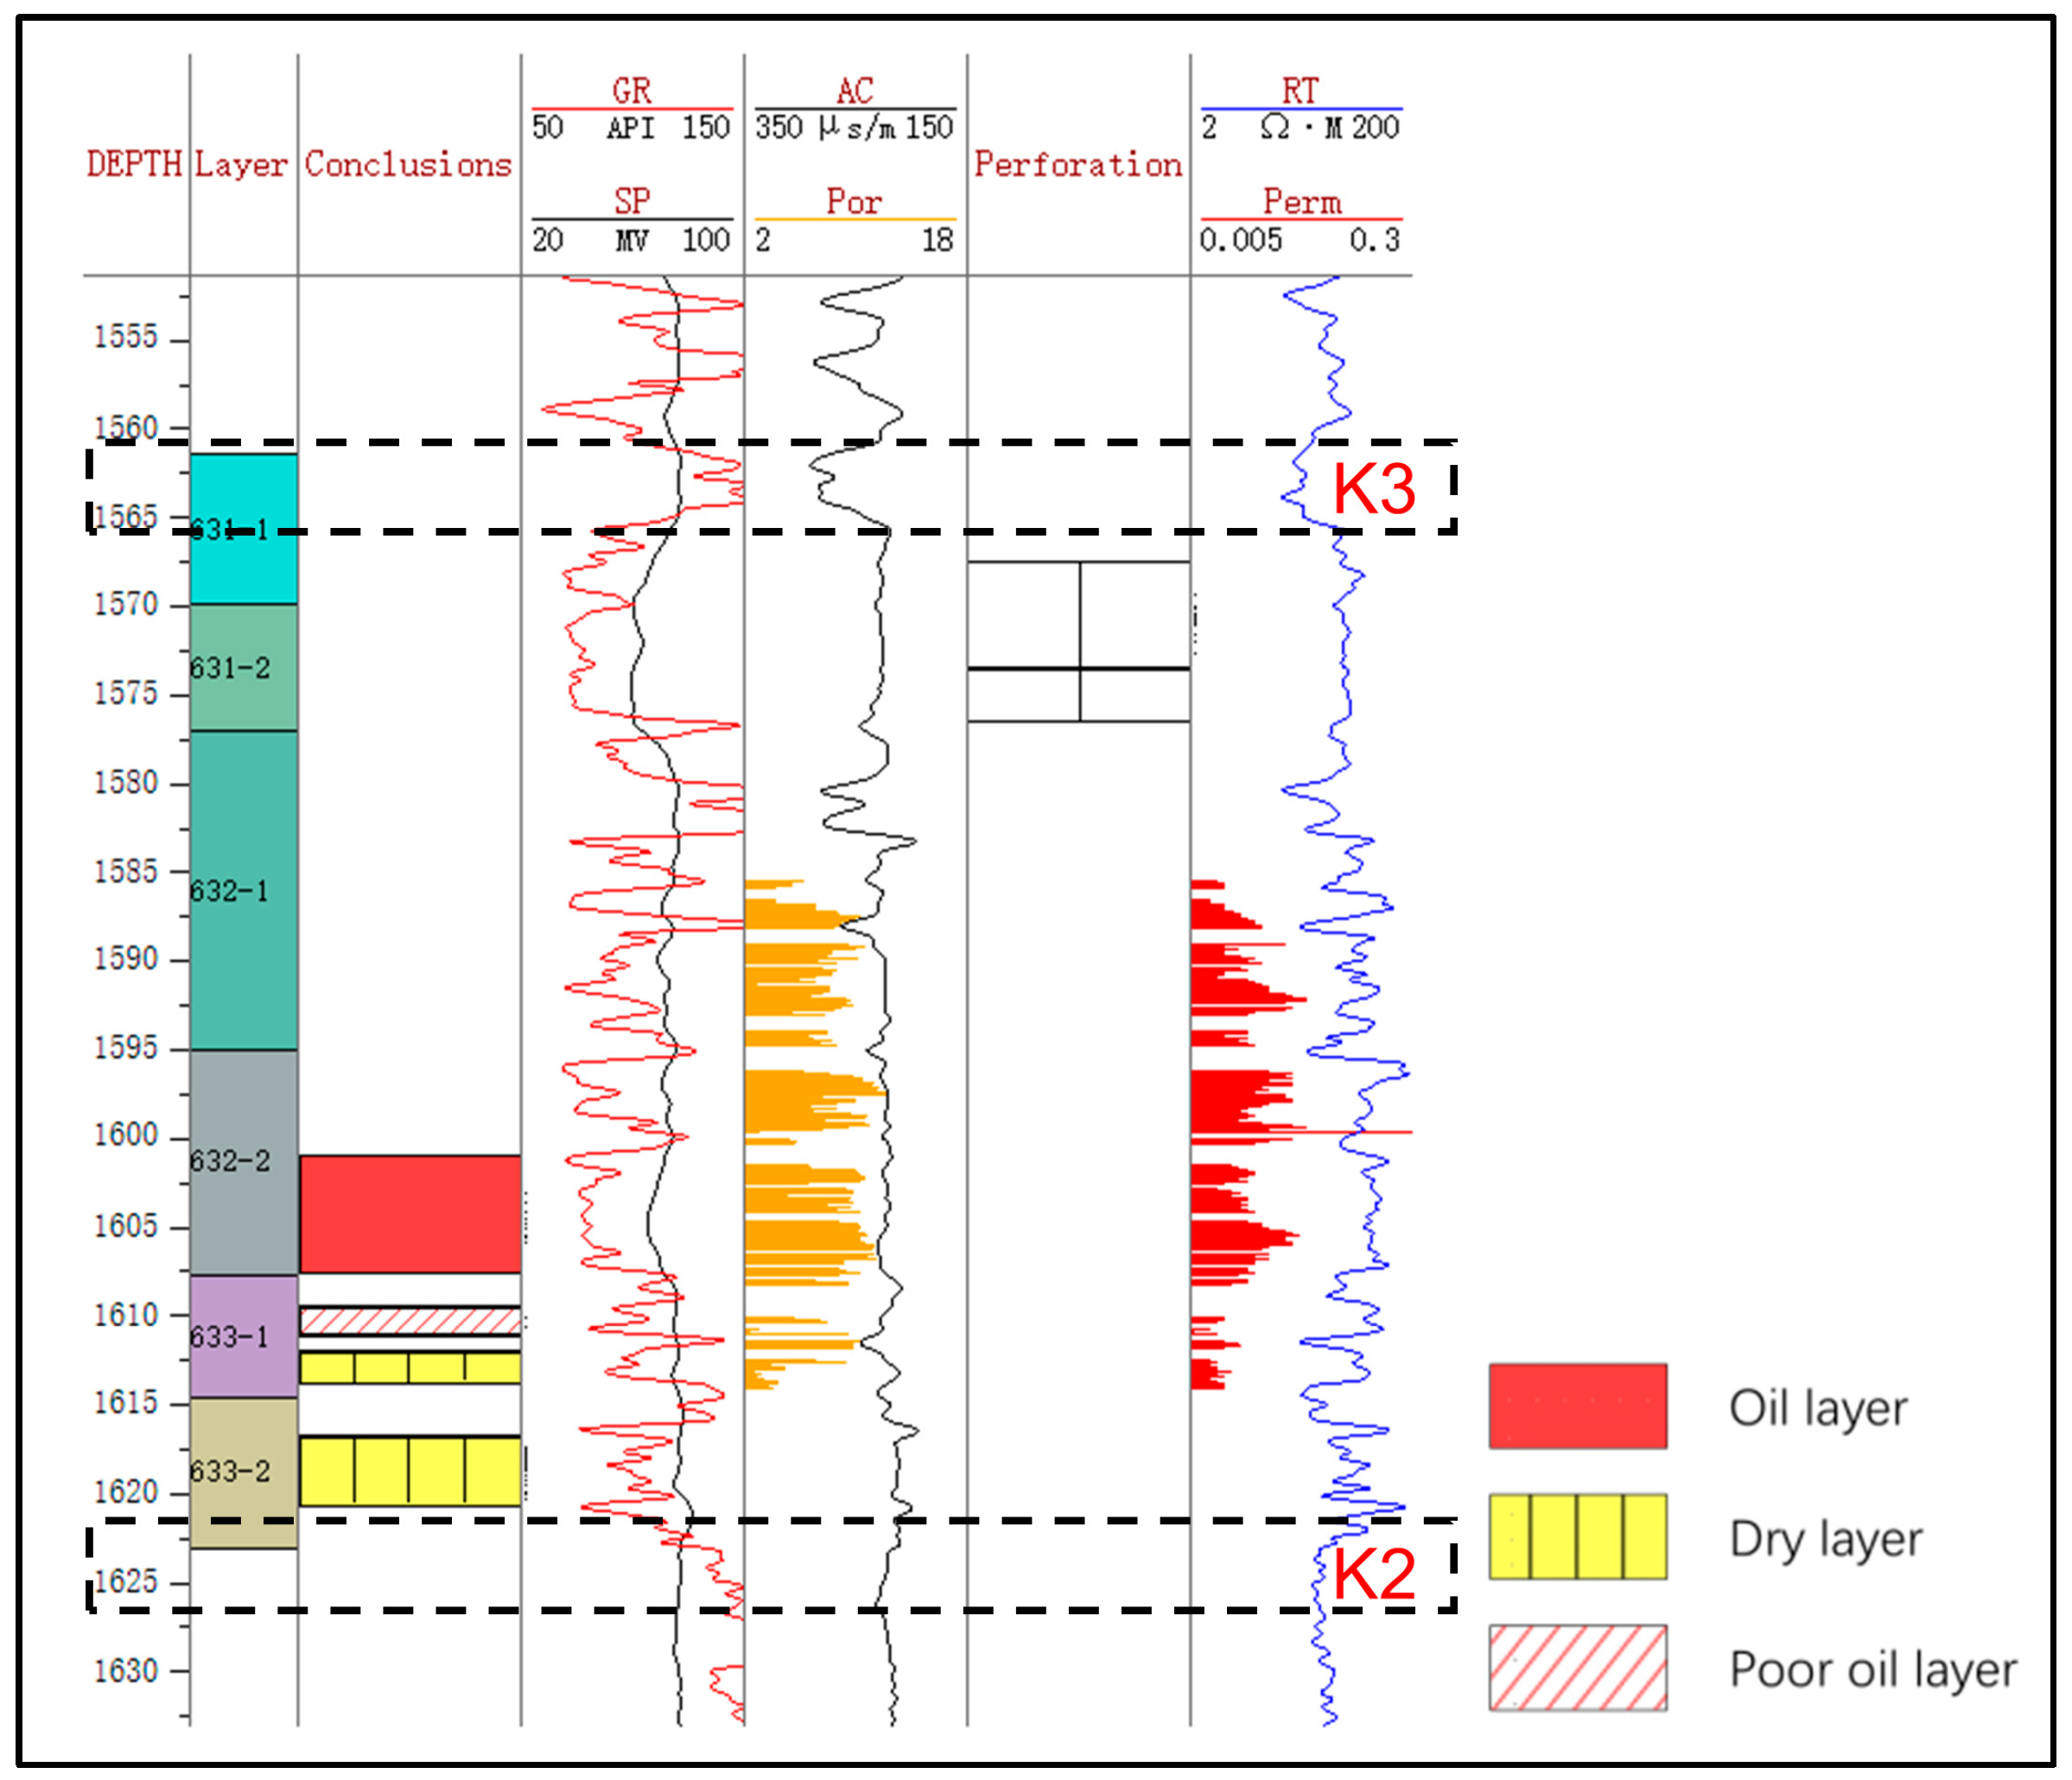
The coring well Z141 is selected as the standard well (Figure 2). Based on the logging response of the K3 and K2 marker layers (e.g., high gamma ray and low deep resistivity), the top and bottom boundaries of the three small layers of Chang-631, Chang-632, and Chang-633 are recognized [27,28]. Therefore, the six single sand layers of Chang-631–1, Chang-631–2, Chang-632–1, Chang-632–2, Chang-633–1, and Chang-633–2 are determined by adopting the principle of rotary comparison and hierarchical control [29]. The K3 marker layer is a relatively stable mudstone layer developed at a depth of about 1690 m with a thickness of about 4 m, characterized by high gamma, low resistance, low acoustics, and a slightly lower half-amplitude point of the gamma [30]. On the contrary, the K2 marker layer is a relatively stable mudstone layer. It is developed at a depth of about 1750 m and has a thickness of about 10 m. This layer is characterized by high gamma, low resistance, low acoustics, and relatively stable gamma. The upper part of the layer exhibits low resistance, low acoustic waves, and a relatively stable gamma logging curve [31]. Above K2 is the Chang-633–2 sandstone layer with obvious amplitude.
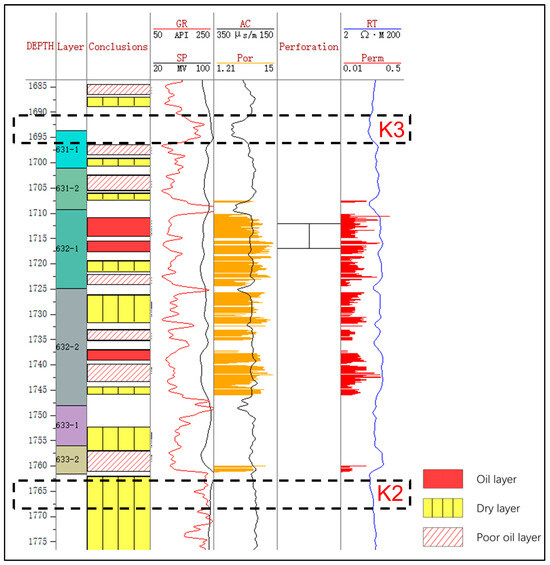
Figure 2.
Stratification of the key well Z141. The measured porosity and permeability are shown in orange and red bars, respectively. The K3 and K2 layers are identified to mark the top and bottom of the C63 oil layers. GR = gamma ray, API; RT = deep resistivity, Ω·m; SP = spontaneous potential, mV; AC = acoustic, μs/m; Por = porosity, %; Perm = permeability, mD.
For subsequent research, the core experimental data used are (partially) presented in Table 1.

Table 1.
Physical property experiments of Z141 well.
3.3. Sedimentary Analysis
There are few turbidities in the current sedimentary characteristics observed in the core, and mudstone debris, which is a sedimentary characteristic of debris flow, is more common in the work area. Based on the core facies markers and sand body spreading characteristics, combined with the latest research results and the actual geological characteristics of the work area [32,33], a sedimentary model of Chang-63 in the Z211 work area was re-established (Table 2). The material sources were mainly supplied from multiple points of the delta front edge, and this multi-source characteristic provides the diversity of regional sediments. By combining the previous research results and the core characteristics, a scheme for the division of sedimentary micro-phase was formulated. According to the differences in sediment thickness and physical properties, the debris flow deposits are further divided into the main body and the marginal parts [34,35].
Table 2.
Sedimentary microfacies division of the Z211 area.
3.4. Internal Configuration of Sand Bodies
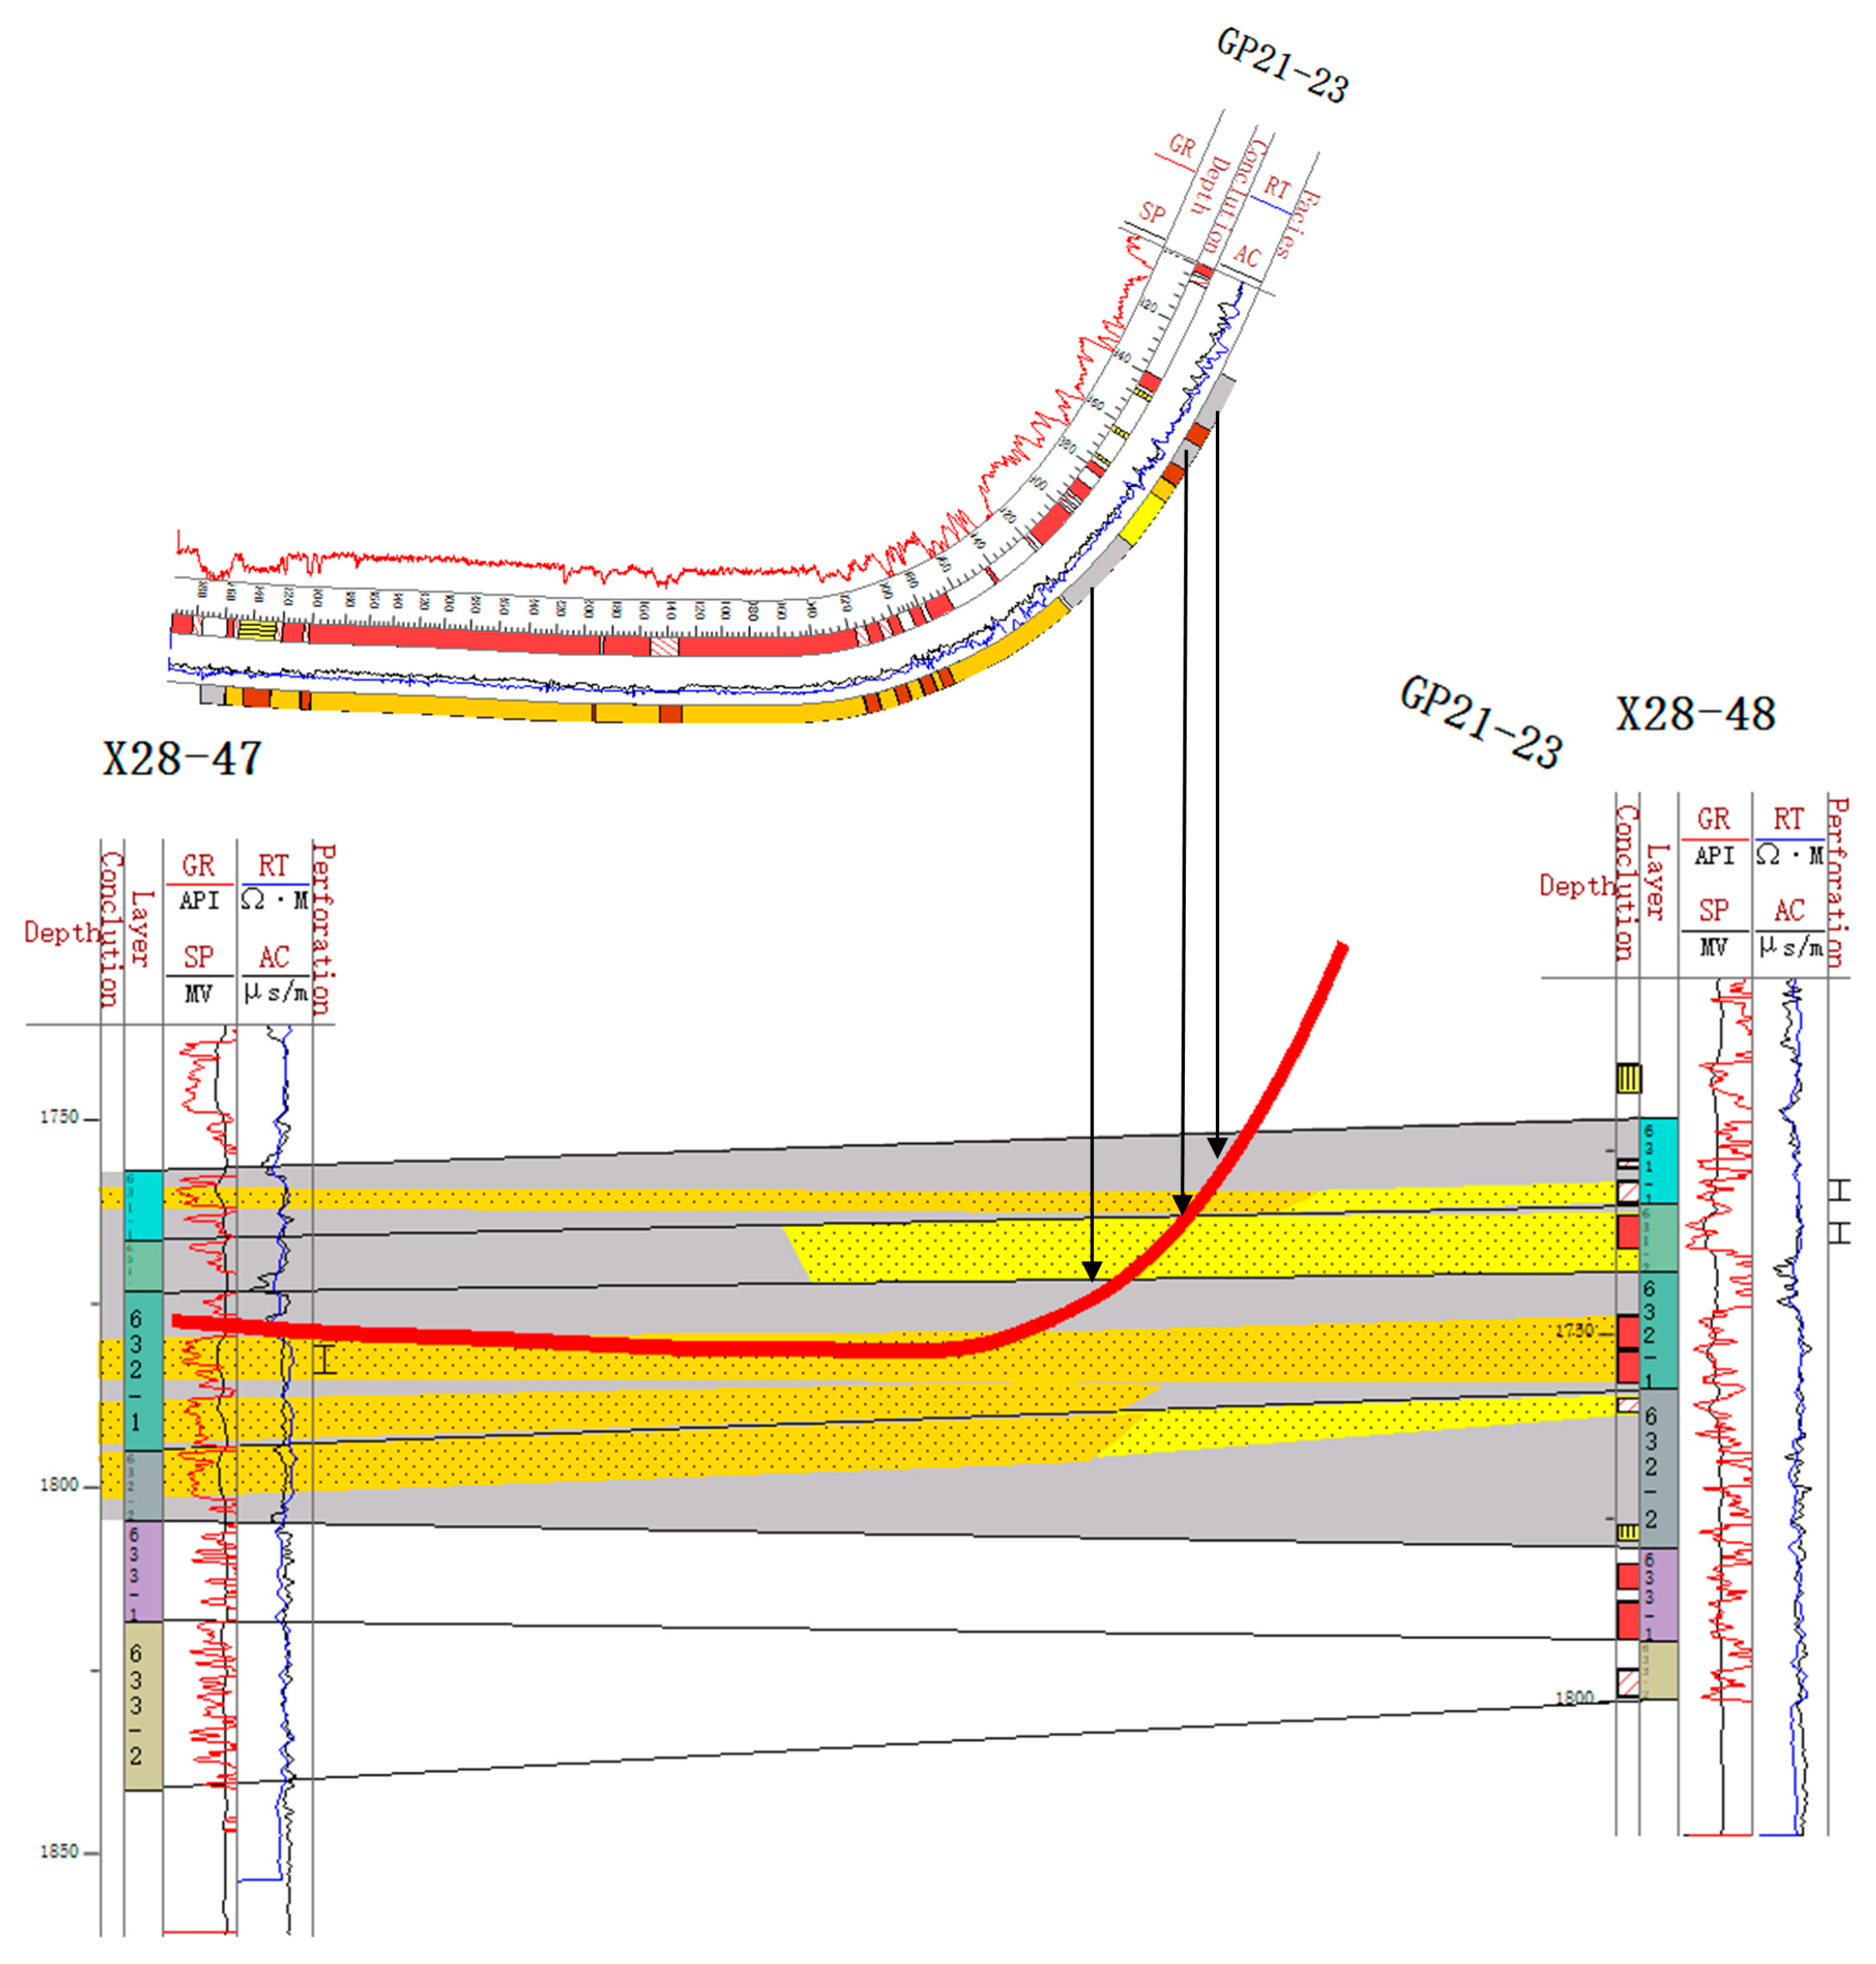
Based on the stratigraphic data of straight and deviated wells, the injection and production well groups were finely divided according to the borehole trajectories [36,37]. The well group combination mode of “two injection wells (deviated wells) with one production well (horizontal well)” was adopted, and the sand body profile was drawn (Figure 3) [38]. The locations of sand bodies encountered in the horizontal section were observed through the profile. The data on sand bodies encountered in the horizontal section of 85 horizontal wells in the work area were systematically obtained. This was performed by combining the drilling trajectory with the sand body distribution pattern. By finely dividing the strata into individual sand body configurations, the sedimentary micro-phase could be recognized. A single sand body profile was then created by combining this with the logging phase characteristics of a single well. This approach allowed for the construction of a spatial distribution model of the sand body [39]. By analyzing the distribution characteristics of sand bodies encountered during horizontal well drilling, three typical sand body stacking relationships are summarized.

Figure 3.
Sand body profile of GP21–23 well group. The red line represents the well path of GP21–23.
3.5. Remaining Oil Investigation
Tracer monitoring and water absorption profile information were utilized to predict the areas that failed to be effectively displaced after the water drive, aiming to reveal the potential distribution areas of the remaining oil [40,41]. The overall trend of fluid transportation was confirmed using sedimentary micro-phase planar maps, and fluid aggregation and retention at the junction of different sedimentary phases were revealed in combination with sedimentary micro-phase profiles. On this basis, the potential distribution areas of remaining oil were further verified, especially in the low-permeability areas and the places where the sedimentary phase changes are more complicated, as the fluids may be locally trapped or aggregated to form the remaining oil enrichment zone.
In this study, different tracers were used for each well with the aim of accurately tracking the flow paths of injected fluids. During waterflooding or gas injection processes, multiple wells may simultaneously inject fluids (such as water, gas, or chemicals) into the reservoir. In such cases, the injected fluids from different wells may interact, complicating the flow paths. The use of distinct tracers is essential to avoid data confusion. For instance, in two adjacent injection wells, fluorescein and bromide tracers were used. Due to the distinct response characteristics of these tracers, the concentrations detected in the production well allowed for the clear differentiation of the contributions from each injection well. By monitoring the changes in tracer concentration during the displacement process, it was possible to identify which injection well played a dominant role in the displacement, providing more accurate fluid flow data and optimizing the injection strategy. This application of tracers not only enables the effective identification of fluid flow paths but also offers valuable insights for subsequent reservoir management and production optimization, reducing the potential errors or confusion caused by fluid mixing and providing a clearer, more reliable basis for reservoir development and production.
Water absorption profile data processing and plotting involve collecting downhole data such as pressure and flow rate, followed by noise removal, smoothing, and normalization to eliminate measurement errors and noise, ensuring the accuracy and reliability of the data. The processed data are then used to analyze the water intake characteristics at different depths, identifying regions of uneven water distribution or potential injection zones. In this study, the water intake profile used was the depth–water intake curve. This curve correlates depth with the corresponding water intake, providing a clear representation of water absorption at various depths. By analyzing this curve, the waterflooding effectiveness at different depth intervals can be assessed, further guiding the optimization of water injection schemes and the adjustment of reservoir development strategies.
4. Results and Discussion
4.1. Fine Stratigraphic Framework Construction
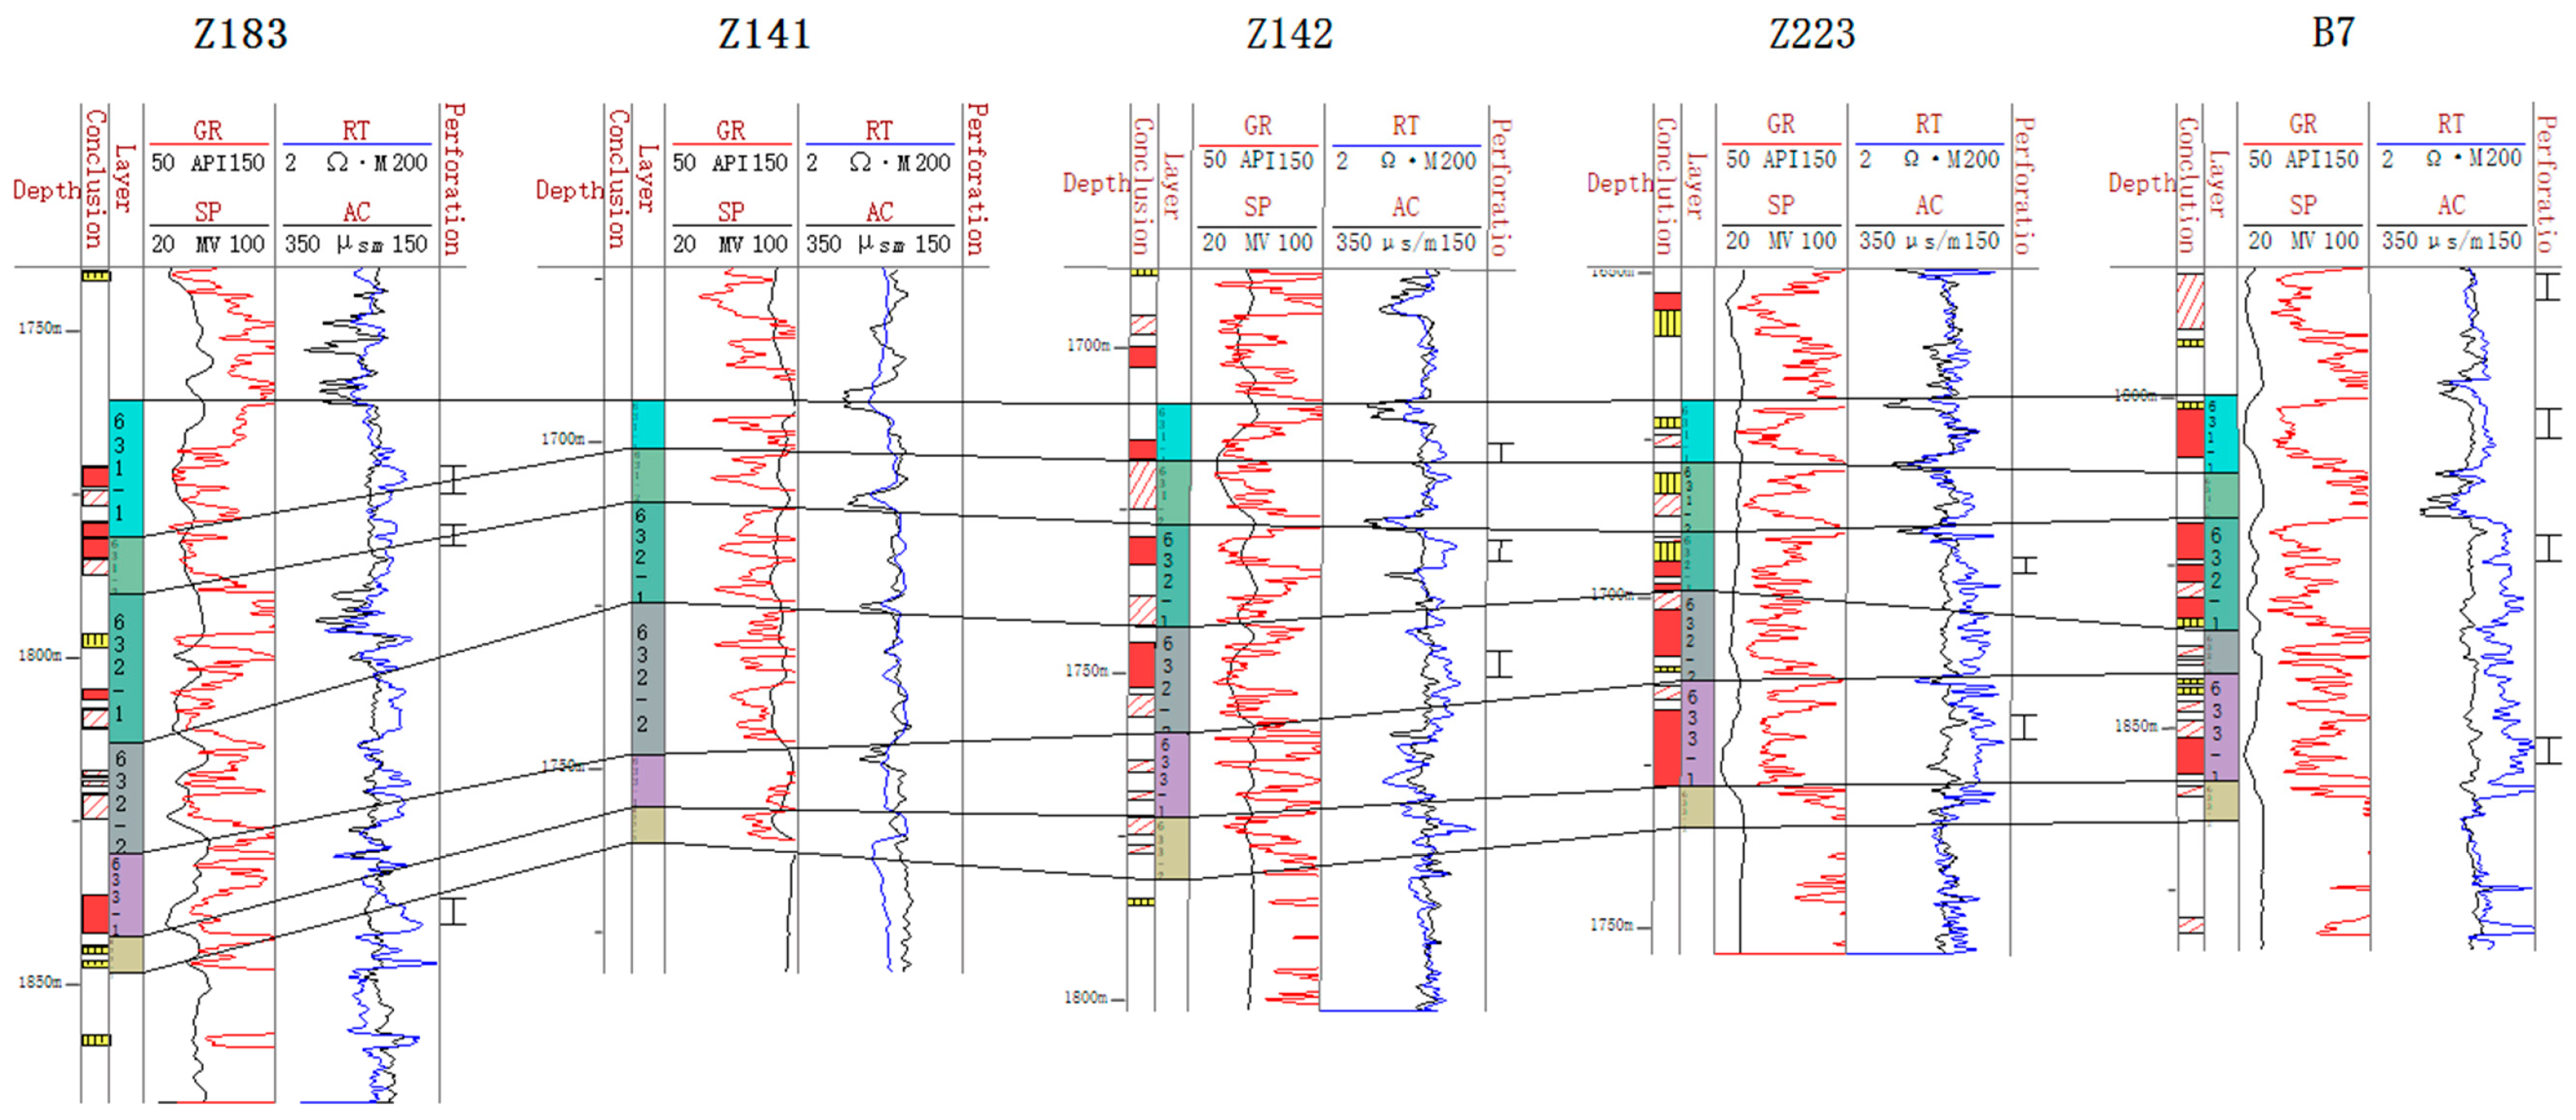
After the stratigraphic delineation of the standard wells was completed, five representative exploratory wells were selected as the focus wells (Figure 4). The gamma, sonic, and resistivity logging curves of these five wells show obvious amplitude changes, clear interlayer characteristics, and strong sand body rotation, while the thick mudstone development at the bottom of Chang-63 is clear. Taking these five exploratory wells as the key wells can provide an effective reference for the stratigraphic delineation of deviated wells in the whole region. The specific stratification method is as follows: take these five key wells as the benchmark, draw the horizontal and vertical profiles, make stratigraphic comparisons, and then gradually expand to the whole work area. This method can ensure the accurate stratigraphic delineation of the whole area and provide a scientific basis for the subsequent exploration work.
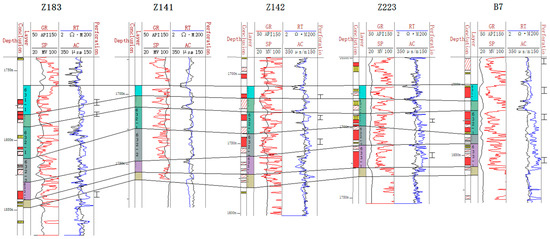
Figure 4.
Stratigraphic correlation diagram of key wells.
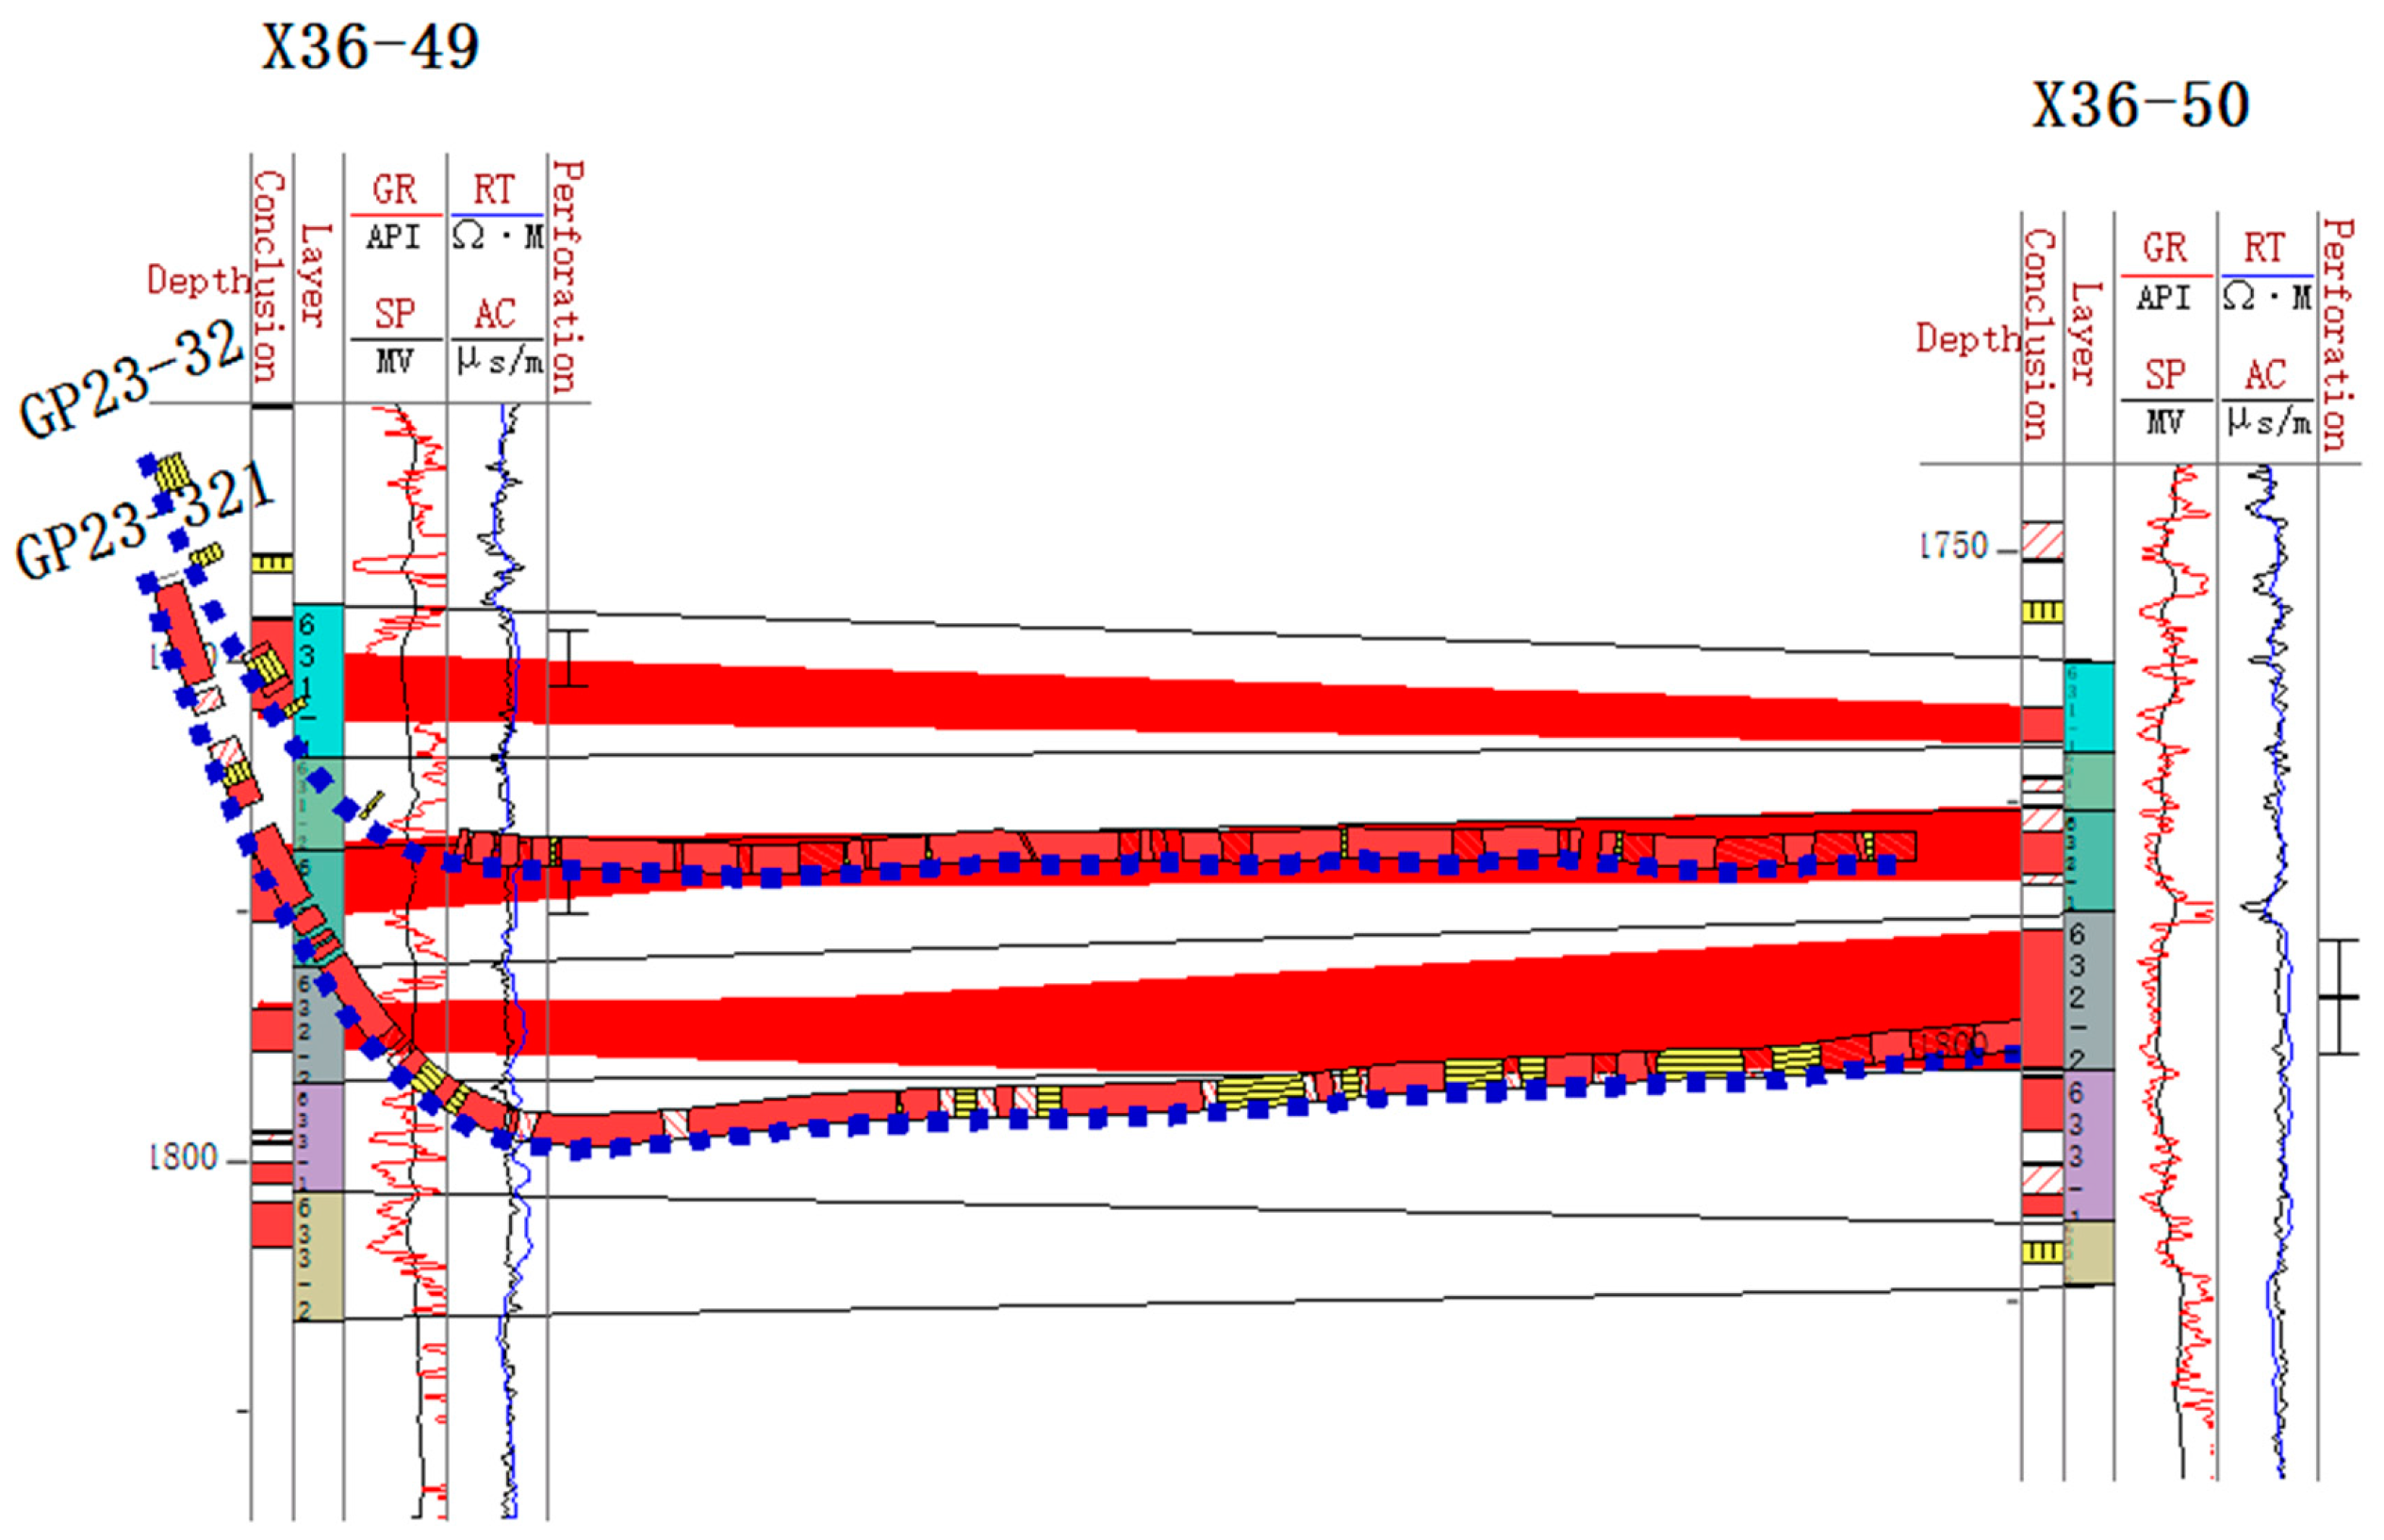
By combining the data from the injection and production well groups, the reservoir profile can be used to visualize the effectiveness of the water injection and determine whether it is reasonable for horizontal wells to penetrate layers (Figure 5). Taking the GP23–32 and GP23–321 horizontal wells as examples, these two wells are used as original and supplementary oil recovery wells, respectively, and their corresponding horizontal wells penetrate the target layers of Chang-632–1 and Chang-632–2. From the reservoir profile, it can be observed that the horizontal sections of these two wells accurately penetrate the target layers. At the same time, the corresponding deviated well-implemented injection measures for the target layers ensure that the -water injection and oil recovery layers are a match. This injection and recovery method based on refined well design significantly improves the matching of injection and recovery layers, effectively enhances injection and recovery efficiency, and provides a reliable geological and engineering basis for the efficient development of subsequent reservoirs. The construction of this fine stratigraphic framework provides the geological basis for the following sedimentary analysis.

Figure 5.
Reservoir profile with horizontal wells GP23–32 and GP23–321 and straight wells X36–49 and X36–50.
The reservoir exhibits significant heterogeneity, as demonstrated by the well log profiles of Z141 and X31-49, which reveal both interlayer and intralayer heterogeneity within the reservoir (Figure 2, Figure 6). These heterogeneities are prominently reflected in the variations in porosity and permeability, highlighting the complexity of the reservoir structure. For example, the measured porosity and permeability of Z141 cover the ranges of 2.42~14.2% and 0.017~0.389 mD, respectively.
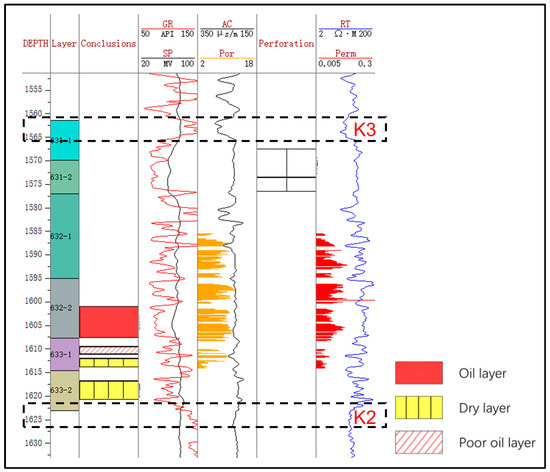
Figure 6.
Well log profile of the X31–49 well. The measured porosity and permeability are shown in orange and red bars, respectively. GR = gamma ray, API; RT = deep resistivity, Ω·m; SP = spontaneous potential, mV; AC = acoustic, μs/m; Por = porosity, %; Perm = permeability, mD.
Between 1550 m and 1570 m, the intervals exhibit both low porosity and permeability, suggesting poor storage and flow characteristics. These intervals likely correspond to tight or clay-rich formations, which are generally unfavorable for fluid extraction. In contrast, the zones between 1570 m and 1600 m display relatively high porosity but low permeability, indicating that although these layers may store fluids, their fluid flow capacity is limited. Therefore, enhanced recovery techniques may be required to improve production efficiency. From 1600 m to 1630 m, both porosity and permeability are comparatively high, suggesting that these layers have favorable storage and fluid flow properties and are likely the most productive intervals for hydrocarbon extraction.
4.2. Regional Geological Sedimentary Model
The results show that the deposition pattern of the Chang-63 layer in the Z211 engineering area is dominated by debris flow deposition, accompanied by a small amount of turbidity current deposition. This depositional mechanism reflects the complex hydrodynamic conditions and diversified depositional environment in the area. The thickness of the sand body in the work area varies significantly and lacks the “fill and fill” feature commonly found in watercourse deposition. The thickness variation in the sand body and its spreading characteristics show the discontinuity of the sand body along the direction of the material source, which is different from the typical continuous deposition sequence of watercourse foliation. Geometrically, the spreading of the sand body along the source direction shows a tongue-like structure. The formation of this tongue is mainly controlled by the gradual weakening of the energy of the debris flow, which leads to the forward extension and accumulation of sediments under the action of the gravity flow.
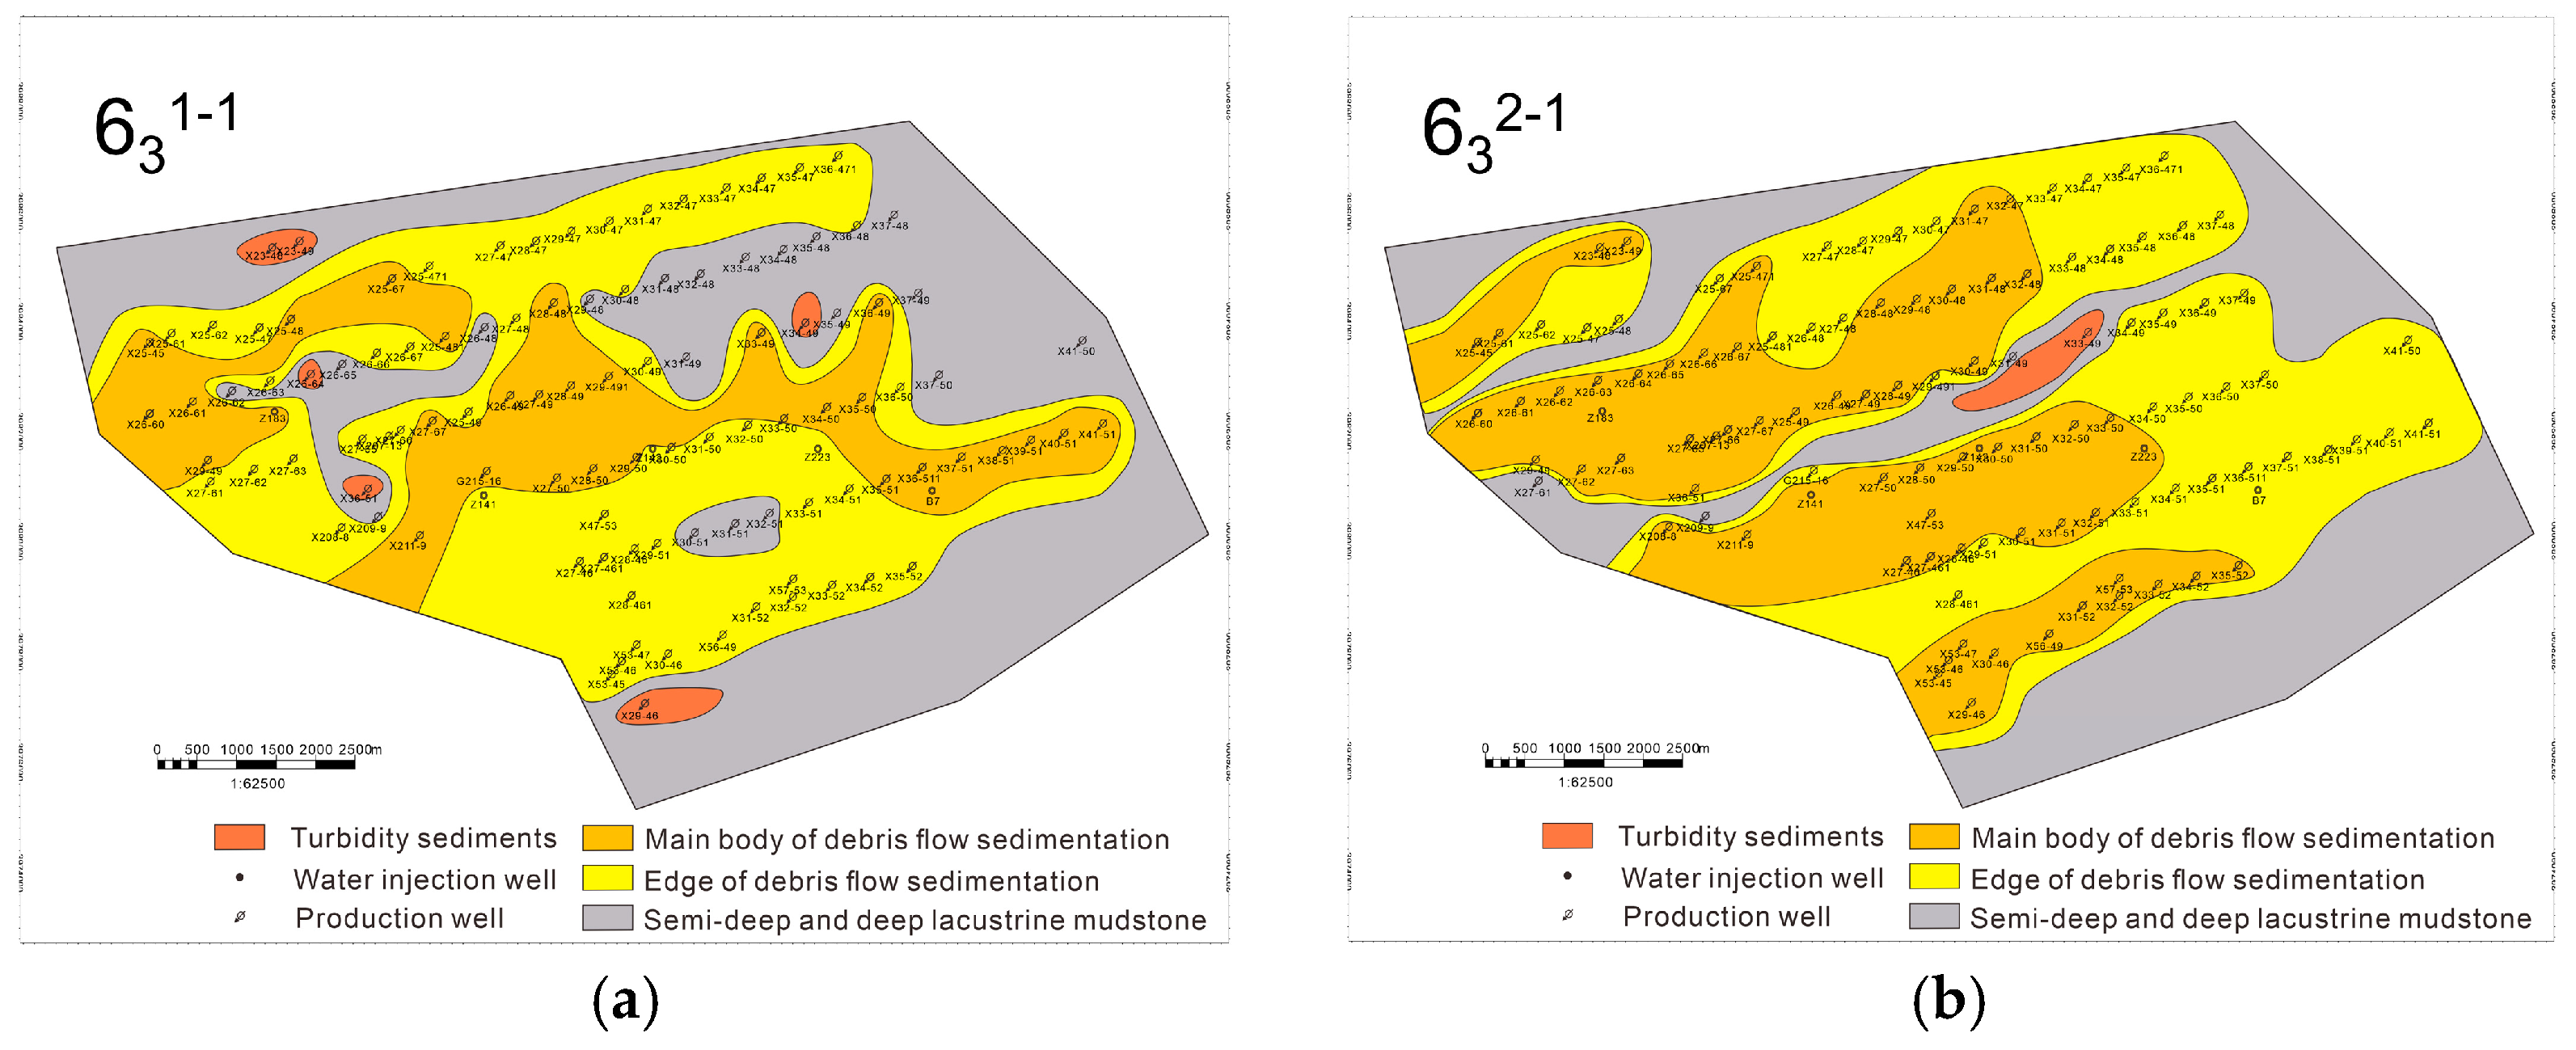
In addition, the spreading characteristics of the sand body show the longitudinal and transverse composite characteristics of multi-phase tongues, indicating that the region has experienced multiple depositional events, and each phase of deposition is superimposed based on the previous deposition, forming a complex sedimentary stratification structure. In terms of grain size characteristics, the sand body is mainly composed of fine sandstone, reflecting the smaller grain size of the sediments. This further suggests that the hydrodynamic conditions in the depositional environment are relatively mild and stable, providing favorable conditions for the continuous action of debris flow deposition. Based on the underwater gravity flow depositional model and sedimentary micro-phase delineation scheme, the Chang-63 layers were finely divided, and the planar sedimentary micro-phase of the subdivided minor layers was completed (Figure 7).

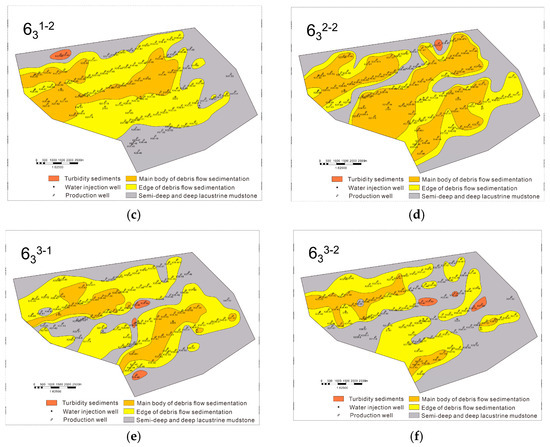
Figure 7.
Sedimentary microfacies plan of the Z211 area. (a) Chang-631–1; (b) Chang-631–2; (c) Chang-632–1; (d) Chang-632–2; (e) Chang-633–1; (f) Chang-633–2.
Five skeleton sections were selected, and their depositional micro-phase profiles were constructed to visually reproduce the gravity flow deposition pattern dominated by sandy debris flows (Figure 8). These patterns of sedimentary facies provide insights into the related internal characteristics of sandy debris flows.
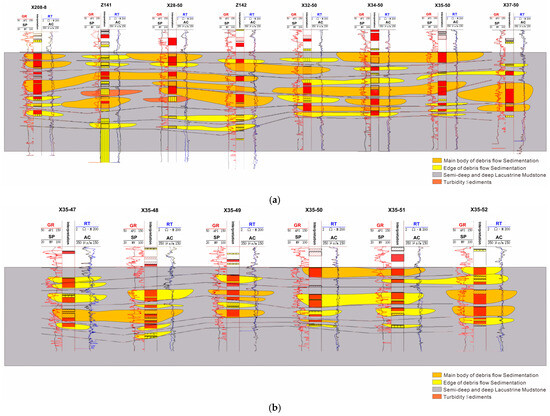
Figure 8.
Sedimentary microfacies profile of the Z211 area. (a) Along the sources; (b) perpendicular to the sources.
Based on the core analysis results of key wells and sedimentary facies features, it can be concluded that the Chang-632–1 layer outperforms the Chang-632–2 layer (Figure 2 and Figure 7). Specifically, the Chang-632–1 layer exhibits relatively homogeneous reservoir properties, indicating minimal lithological variation and more consistent porosity and permeability both vertically and laterally. This homogeneity facilitates better oil and gas storage and flow. Additionally, the Chang-632–1 layer demonstrates a more continuous distribution of sand bodies, suggesting better continuity of the sandstone layers, which provides a more stable reservoir space for oil and gas accumulation, thus enhancing its production potential and development prospects. In contrast, the Chang-632–2 layer is characterized by stronger heterogeneity, with less continuous sand bodies and greater variability in reservoir properties, which may introduce higher uncertainty and challenges during development. Therefore, in terms of reservoir characteristics, the Chang-632–1 layer is more valuable for development compared to the Chang-632–2 layer.
4.3. Internal Characteristics of Sandy Debris Flows
The statistical data on sand bodies encountered in 85 horizontal wells drilled in the horizontal section are shown in Table 3. The matching relationship between intercalations and perforated intervals is the main factor that influences the remaining oil distribution of a sand body [42]. Combined with the sand body thickness profile/plan in Section 3.2, it is noted that the continuity within the sand body layer in the work area is poor, and more than 90% of the single sand bodies encountered during horizontal well drilling have a width of less than 60 m. The table shows that the width of a single sand body is mainly less than 20 m for 66.68% of cases, and a single sand body larger than 220 m only accounts for 0.55% of cases. Most of the interlayer widths are less than 10 m, accounting for 61.02% of sand bodies, and compartments over 50 m account for 1.35%.
Table 3.
Single sand bodies and interlayers encountered during horizontal well drilling.
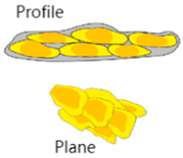
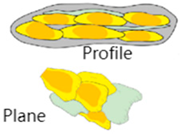
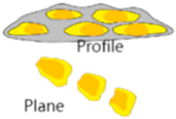
The contact relationship between two sand bodies can be used to categorize the sand bodies in the work area into three stacking types: overlapping, splicing, and isolation stacking. These stacking patterns are illustrated in Table 4.
Table 4.
Stacking types of sand bodies in the examined area.
Among the stacking type, overlapping sand body stacking is mainly developed in layers 631 and 632 and is the main sand body stacking type. Overlapping sand body stacking is more connected and can form an effective oil and gas transportation channel, which is favorable for development. Splicing sand body stacking, which is mainly developed in layer 632, is weakly connected and is a secondary sand body stacking style; isolation sand body stacking, which is mainly developed in layer 633, is non-contact and is disconnected and is a secondary sand body stacking type. Figure 9 shows these types of sand body stacking encountered during horizontal well drilling.
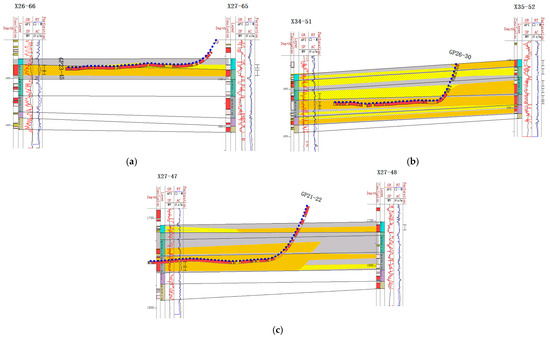
Figure 9.
Types of sand body stacking encountered during horizontal well drilling. (a) Overlapping; (b) splicing; (c) isolation.
The main sand stacking type in the work area is overlapping stacking, indicating that the Chang-63 layer is favorable for the extraction and storage of oil. The area has a high potential for oil resources, which is suitable for exploration and development. Meanwhile, 633 has two developed rotary or gyratory sets with good oil and gas display and various sand stacking styles and can be used as the main layer for development. The sand bodies’ internal characteristics provide a foundation for remaining oil analysis.
4.4. Internal Sand Body Configuration-Based Remaining Oil Distribution
Tracers can be used to track fluid transport paths and monitor fluid dynamics, and by observing the diffusion and retention of tracers in the reservoir, they can be used to reflect fluid flow patterns and oil-repellent effects inside the reservoir. The tracer flow not only reflects the permeability distribution of the reservoir but also can be used to judge the connectivity between wells and the flow advantage channel. Three type of tracers are witnessed here: element tracers, trace substance tracers, and chemical tracers were used to test 17 wells in the work area, and part of the test information is shown in Table 5. The monitoring results of the X26-49 injection well show that tracer breakthroughs were detected in four oil production wells around the well, which indicates that there is a high-permeability strip in the reservoir and that the water flows along the preferred channel (Table 6).
Table 5.
Tracer monitoring information of four wells.
Table 6.
Monitoring results of X26-49 water injection well.
The water absorption profile provides valuable insights into the permeability and fluid flow characteristics of the reservoir by monitoring the water absorption of each reservoir section during water injection [43]. This profile is closely correlated with remaining oil distribution, as higher water absorption typically indicates a more effective water drive, resulting in relatively low remaining oil in these layers.
The water absorption profile of the X26–65 injection well, as shown in Figure 10, reveals that water absorption is primarily concentrated in the Chang-6 layers. The water absorption zone spans from a depth of 1887.00 m to 1932.20 m, with a layer thicknesses ranging from 1.20 m to 2.40 m, divided into 11 sub-layers. The profile data indicate significant variation in water absorption across different layers, highlighting the heterogeneity of the reservoir. Some layers exhibit high permeability, facilitating preferential water flow along these zones, which form dominant water injection channels. Conversely, layers with low permeability act as potential remaining oil enrichment zones [44,45].
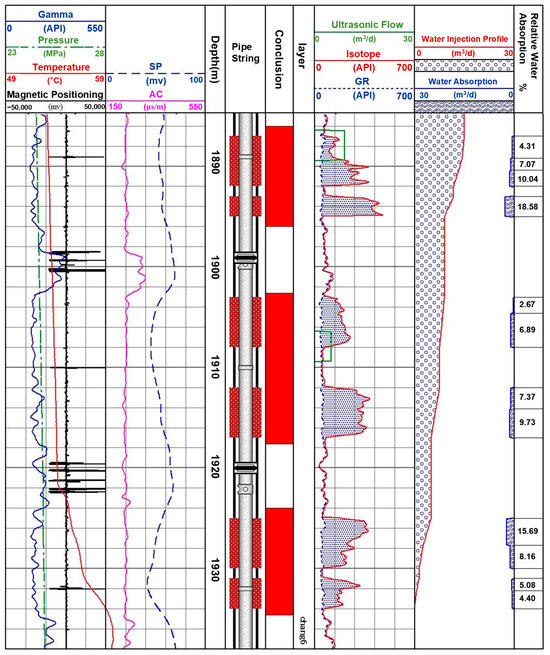
Figure 10.
Water injection absorption profile of well X26–65.
The sharp increase in water absorption along specific sections of the profile suggests the presence of high-permeability strips within the reservoir. Notably, the segments between 1925.00 m and 1927.70 m and 1930.00 m and 1932.20 m show substantial water absorption, indicating that water flow is preferentially directed into these high-permeability strips [46,47].
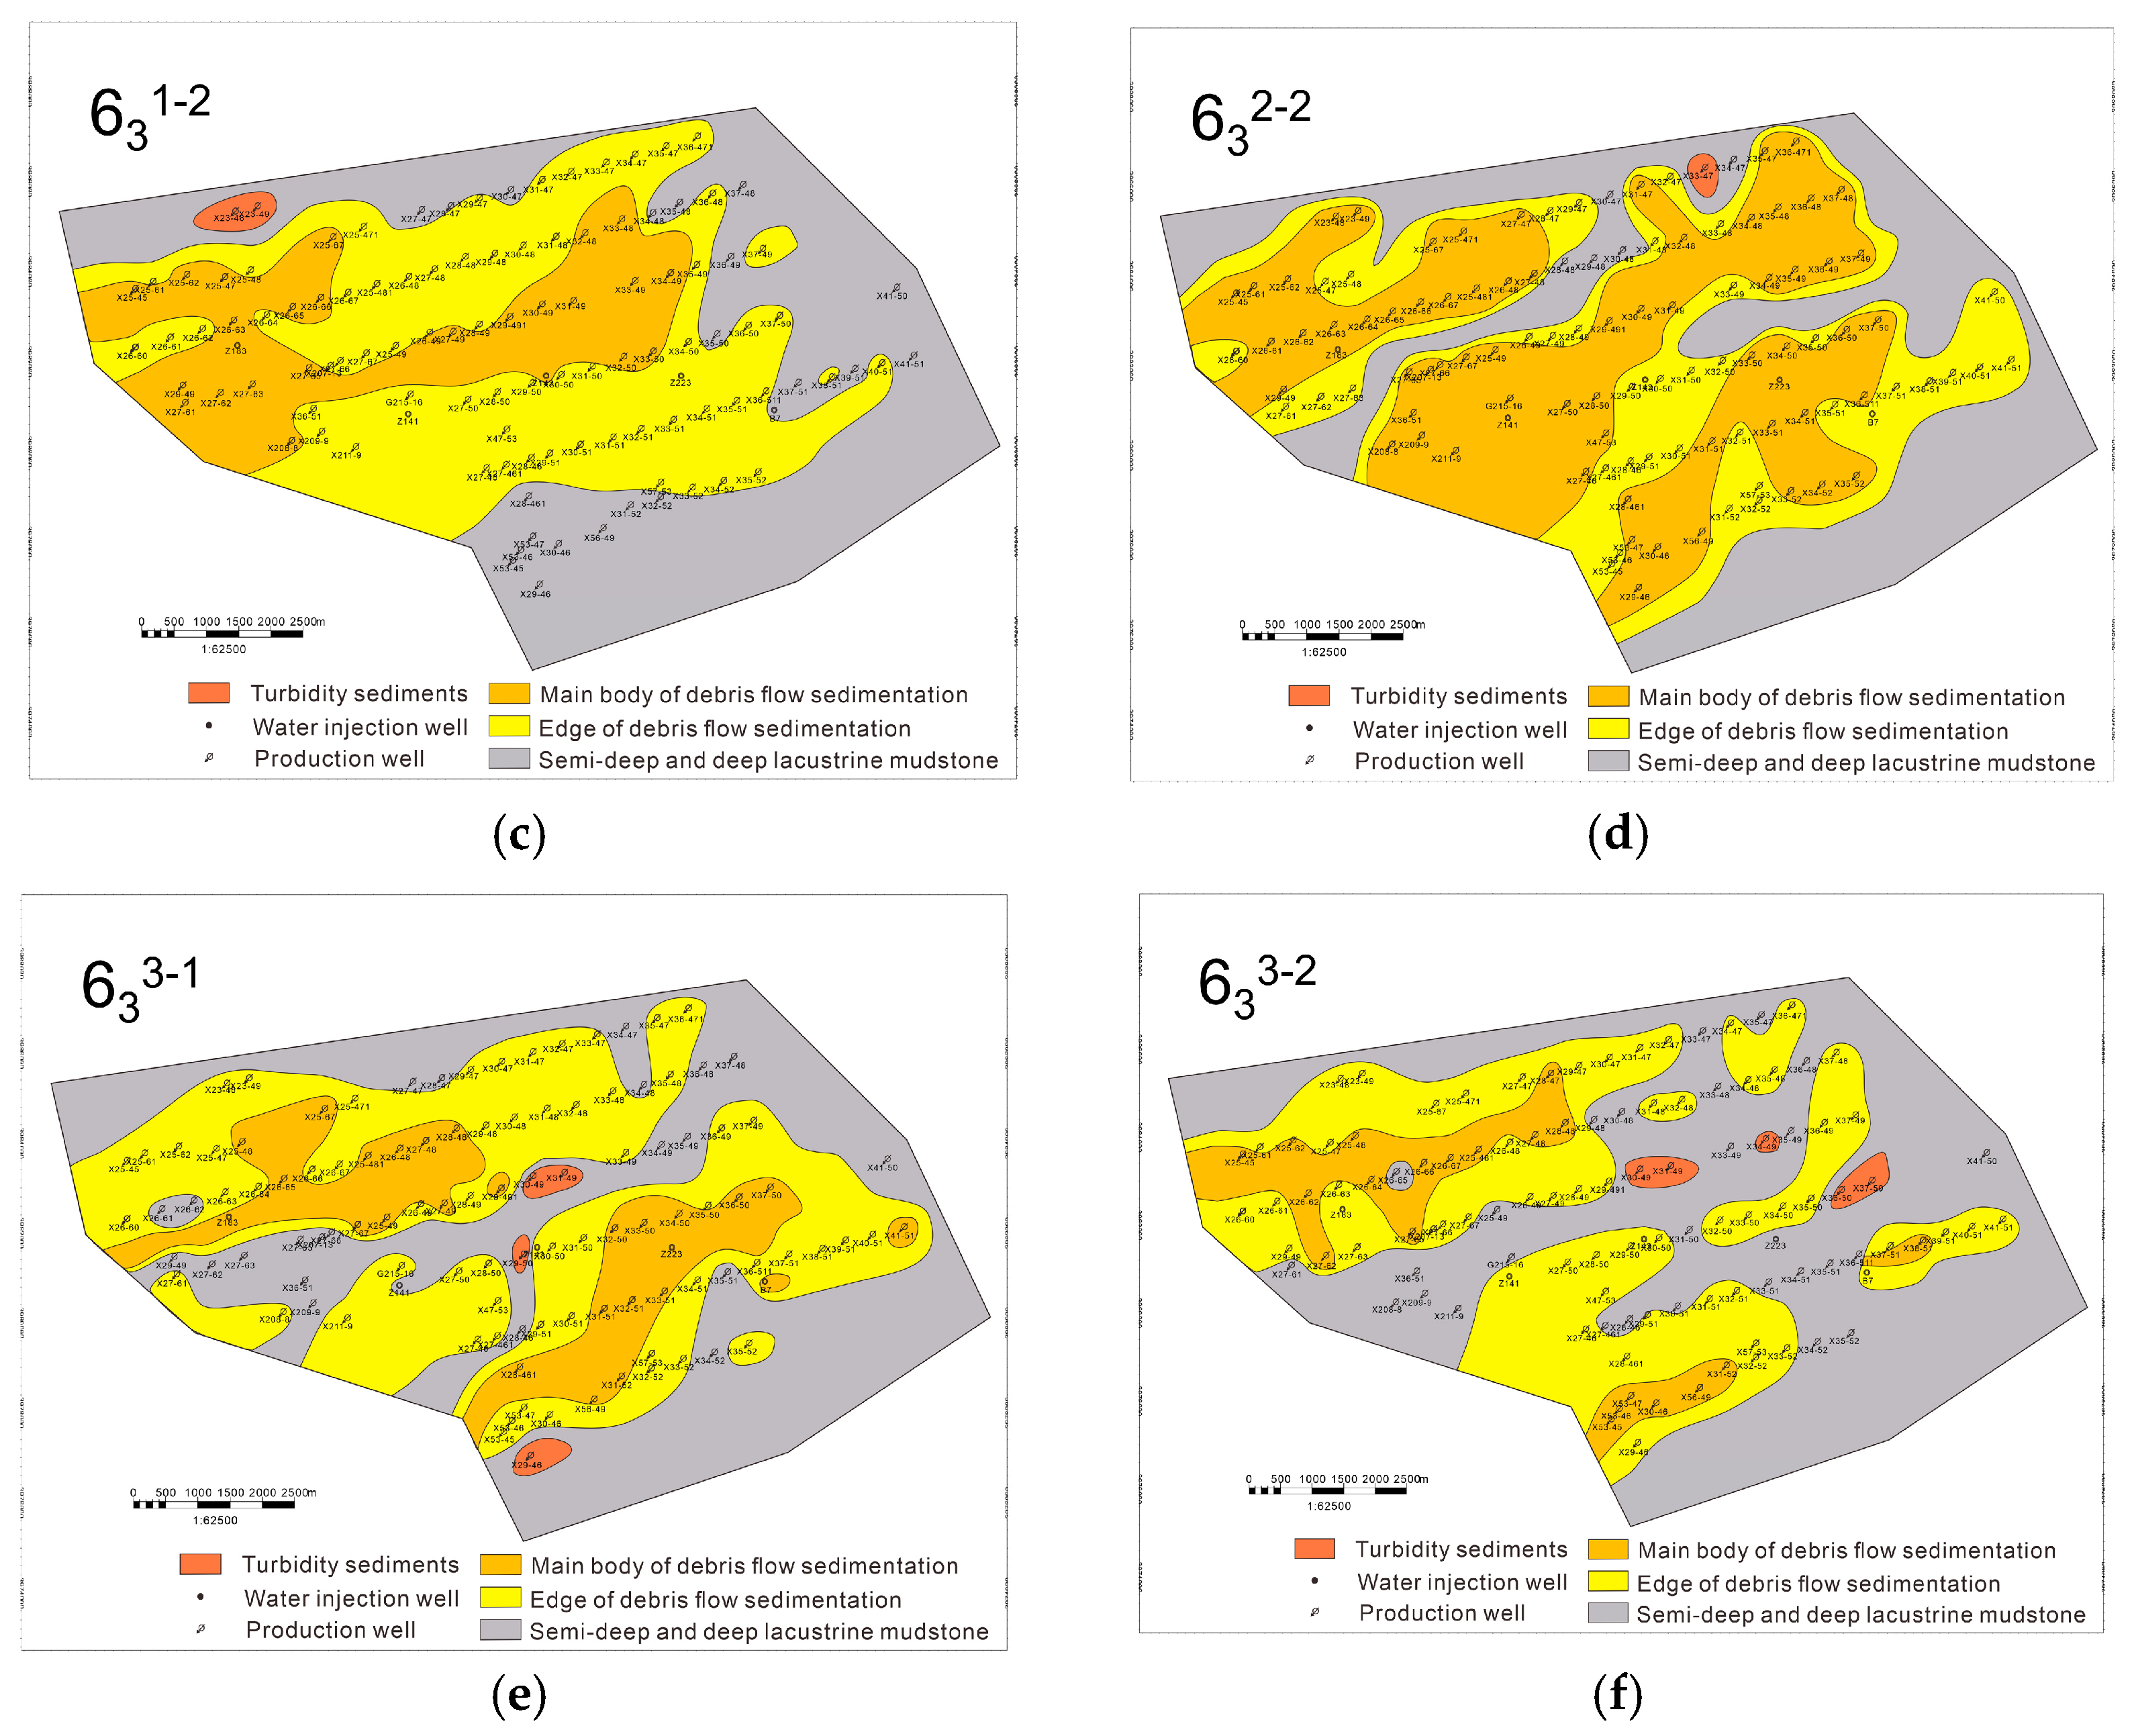
Water absorption profile logging was conducted on 73 injection wells in the study area, and by comparing with the layering data, the injection wells with stronger water absorption capacity and better permeability within each single sand layer were identified. Then, the high-permeability advantage channel area within the reservoir was circled. The flow of injected water in the reservoir is governed by sedimentary microfacies, which play a crucial role in determining the areal distribution of remaining oil [48]. On this basis, further analysis of the potential enrichment areas of remaining oil can be performed by combining low-permeability layers with weak or no water absorption capacity, which provides the basis for fine-tuning the water injection and development plan and remaining oil recovery [49,50]. The remaining oil distribution prediction of four single sand layers, 631–1, 631–2, 632–1, and 632–2, is shown in Figure 11a–d.
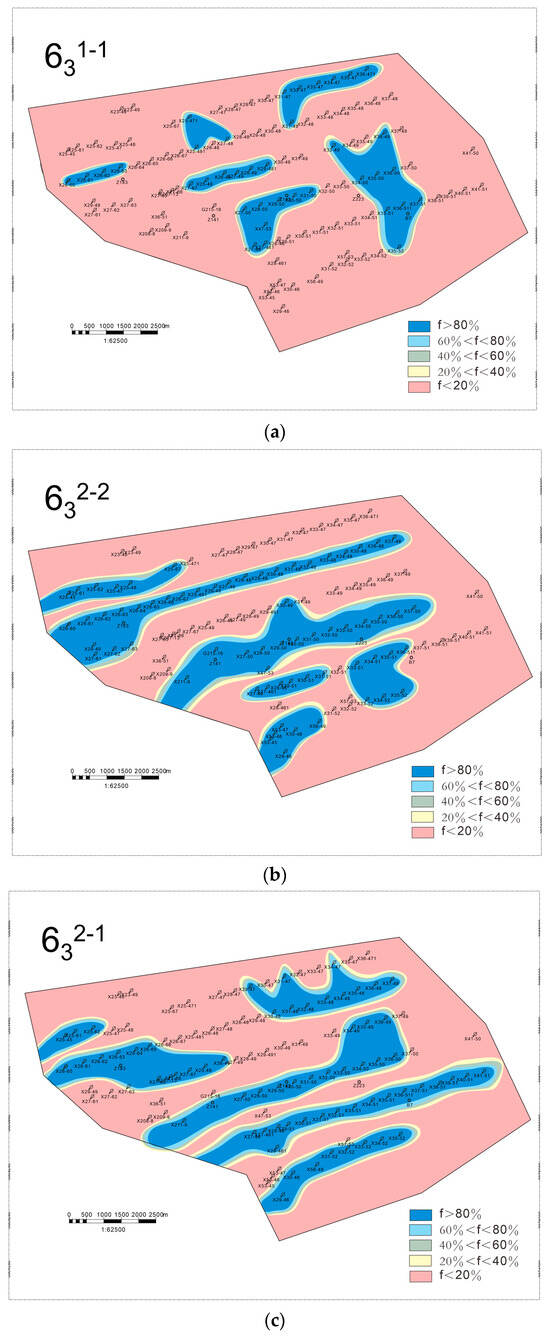

Figure 11.
Prediction of remaining oil distribution in the main oil production layer, where f represents the rate of water cut. (a) Chang-631–1; (b) Chang-631–2; (c) Chang-632–1; (d) Chang-632–2.
In tight, low-permeability sandstone, fluid flow behavior is primarily governed by the interplay of single sand bodies, calcareous barriers, and fractures [51], while remaining oil tends to accumulate at the margins of main and distributary channels due to lower sweep efficiency in these areas [52]. For the Chang-632–1 single sand layer, a correlation between water cut rates and depositional environments was observed. Areas with a high water cut (>80%) are primarily located within the main body of debris flow deposits, indicating that the water drive is stronger in the high-permeability reservoirs, where the remaining oil is relatively low. In contrast, areas with a low water cut (<20%) are predominantly found at the fringes of debris flow deposits, as well as in turbidite and deep lake mudstone deposits. This suggests that these regions have lower permeability, resulting in inefficient water displacement and the accumulation of remaining oil [53].
The main body of the debris flow deposits acts as the primary water injection channel. Due to long-term water injection, these high-permeability channels experience higher water cuts and deeper waterflooding. In contrast, the peripheral areas of debris flow deposits, as well as turbidite and deep lake mudstone deposits, exhibit poor permeability, making effective water drive penetration difficult and leading to the formation of remaining oil-rich zones. The remaining oil is predominantly distributed in strip-like and block-like patterns. Notably, the interfaces between low-permeability reservoirs and high-permeability channels are key zones for remaining oil enrichment. In conclusion, a strong coupling relationship between sedimentary facies and remaining oil distribution is evident, highlighting the significant influence of the depositional environment on fluid migration and oil retention [54,55].
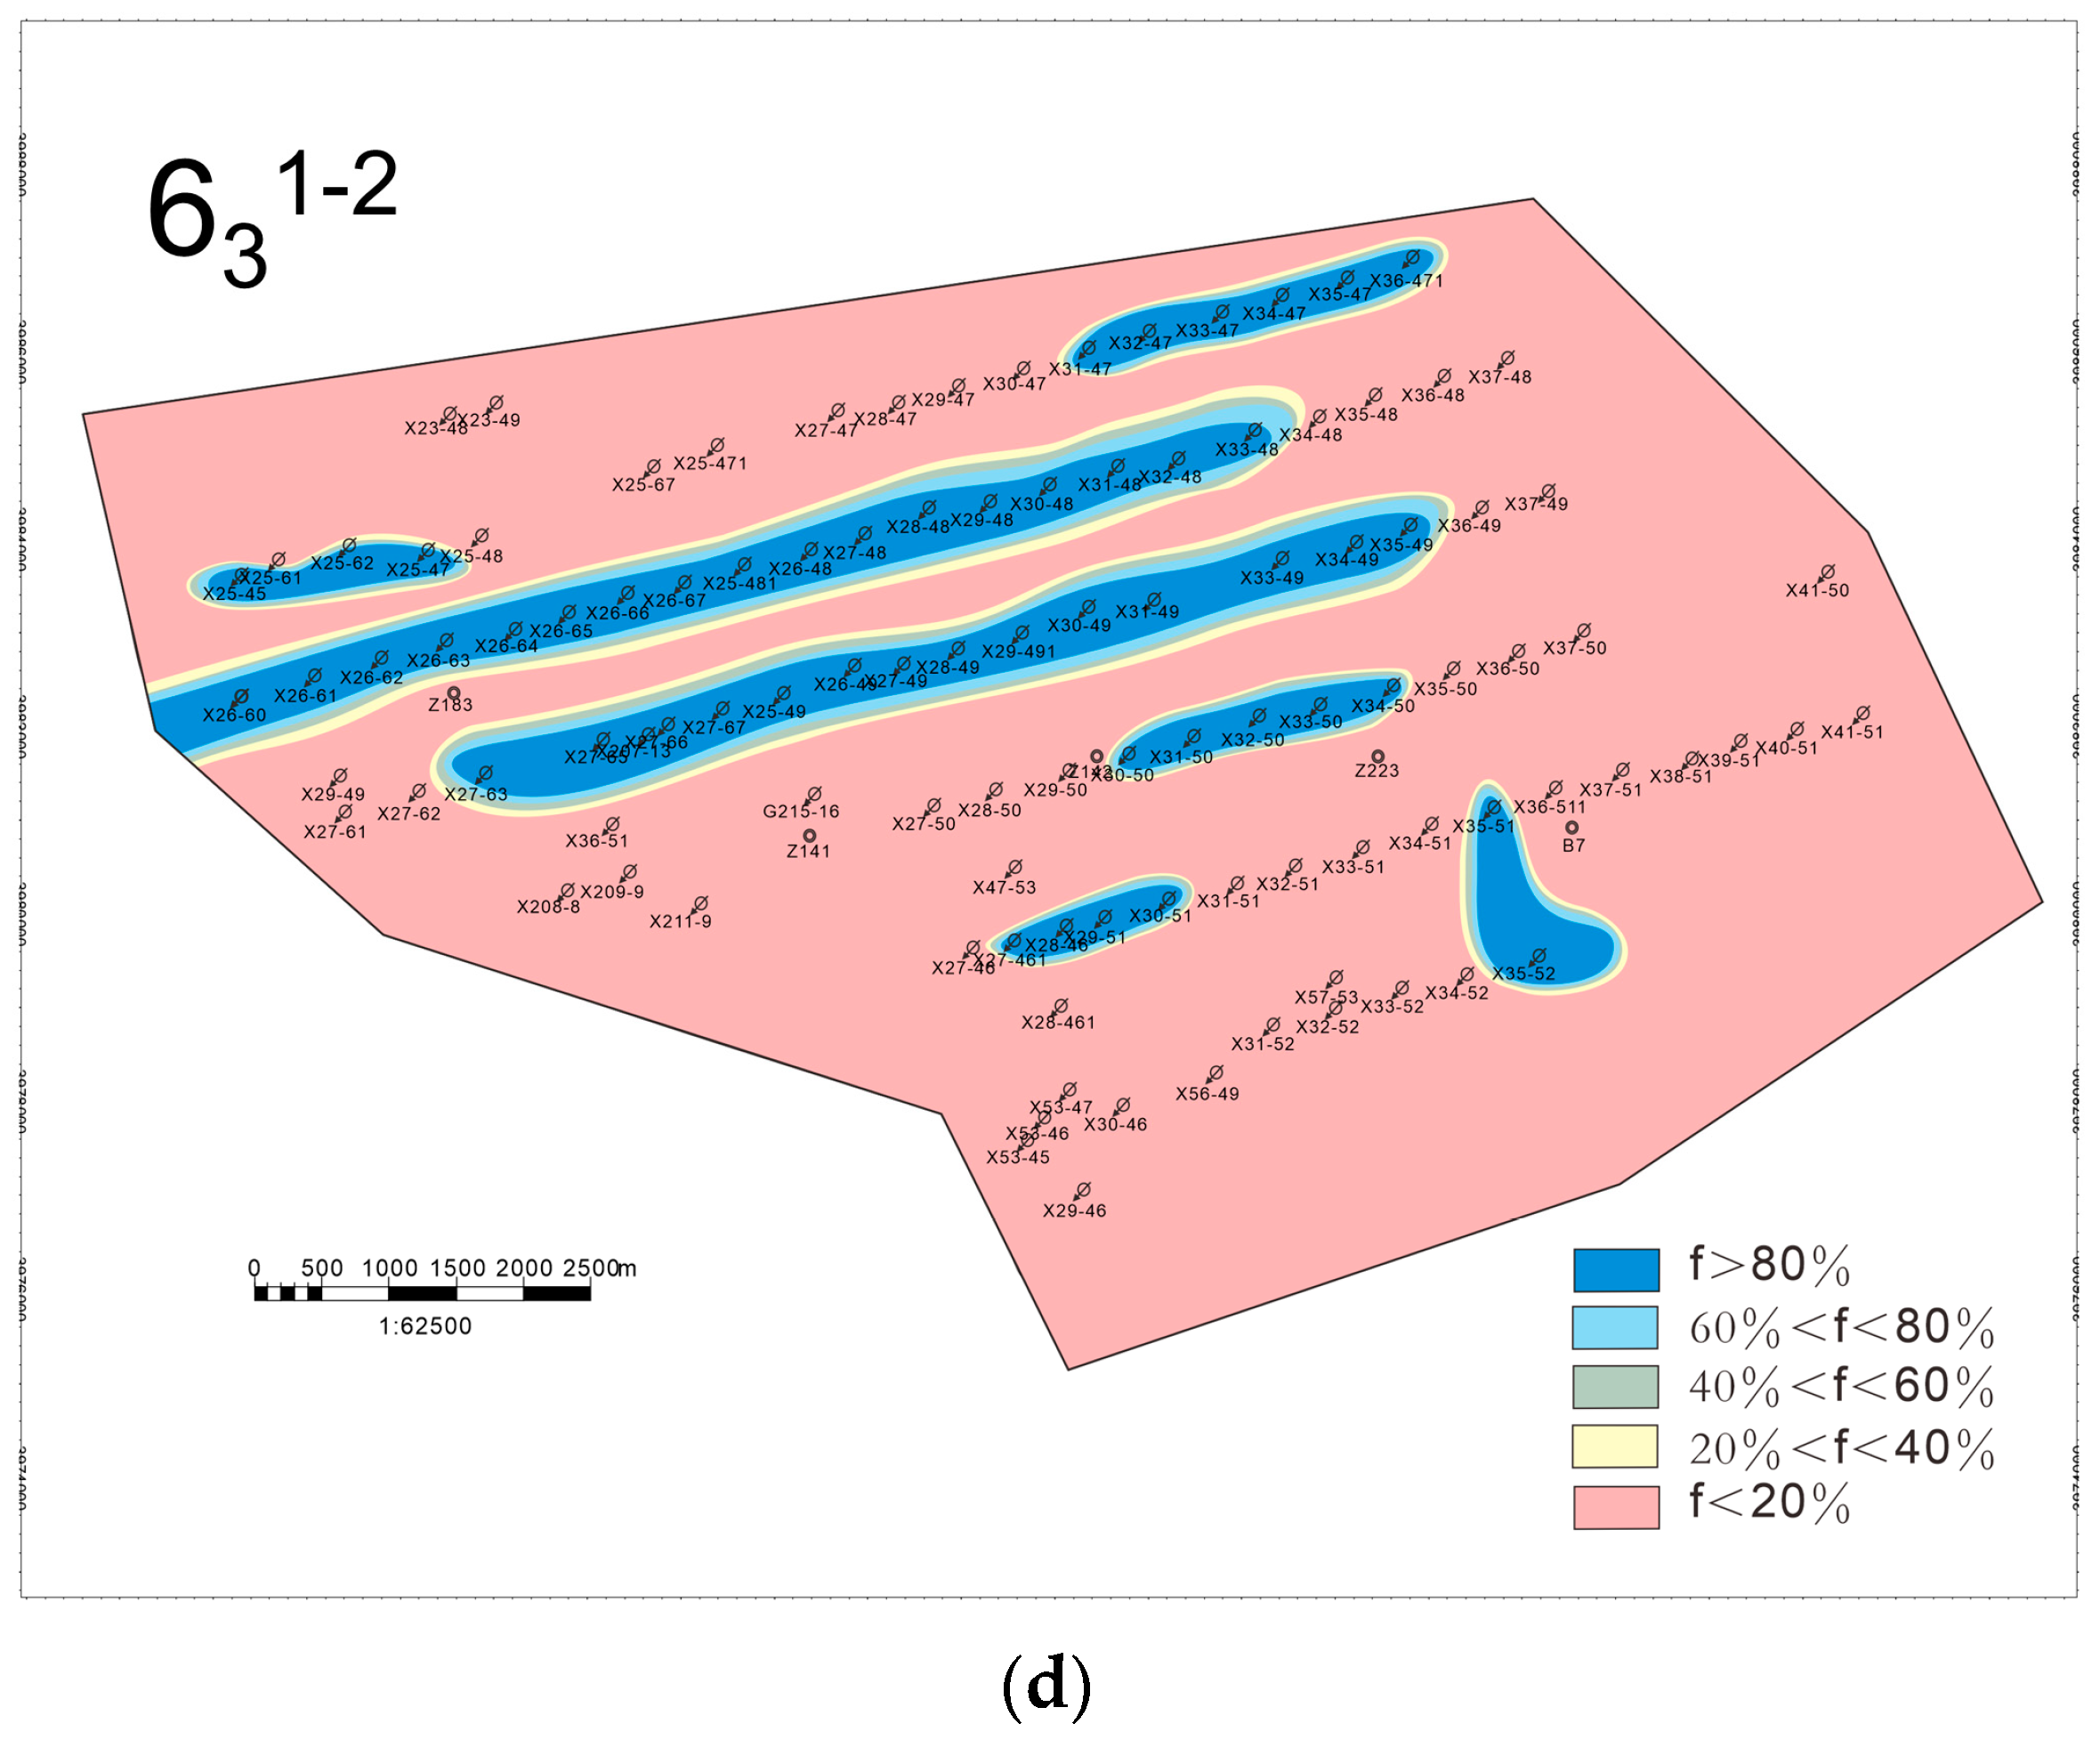
As mentioned in Section 4.3, unconnected or weakly connected sand stacking types, such as splicing and isolation sand stacks, are developed. In these types, the sand body connectivity is poor, and the effect of water injection for oil recovery is limited [56]. As shown in Figure 12, taking the 631–2 single sand layer as an example, the logging and interpretation results around the GP25–27 well group reveal clear differences in the sedimentary phases. The logging results of this horizontal well also show a dry layer, and the amplitude of the gamma logging curves is high, indicating the development of mud intercalation [57]. This is because the main body of the debris flow and the edge of the debris flow sedimentary phases show a splicing stack within this single sand layer, resulting in weakened reservoir connectivity [58,59]. Specifically, wells X31-50 and X32-51 belong to different water injection systems, where well X31-50 has a water cut of more than 80%, showing a stronger water repulsion effect, while well X32-51 has a significantly weaker water repulsion effect.
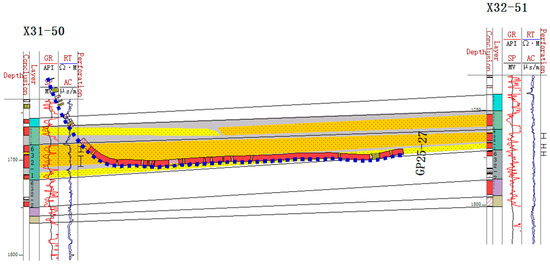
Figure 12.
Internal configuration of a sand body encountered during the drilling of the GP25–27 well.
It is worth noting that sand stacking has an important impact on reservoir connectivity and water drive efficiency, leading to the unevenness of the injection and production system in the work area and further exacerbating differences in the enrichment and distribution of remaining oil [60]. Therefore, in the subsequent development, fine-layered water injection and dissection measures should be taken for these weakly connected sands to improve the effect of water injection and development [61].
5. Conclusions
This study investigates the regional geological deposition patterns in the Z211 area by constructing a detailed stratigraphic framework for the reservoir and analyzing the micro-phase characteristics of sandy debris flow deposits. The distribution of remaining oil is predicted based on internal sand body configurations, constrained by tracer and water absorption profiles. The main findings are as follows: A fine stratigraphic comparison between standard and key wells enabled the completion of stratigraphic division, identifying six distinct sand layers: Chang-631–1, Chang-631–2, Chang-632–1, Chang-632–2, Chang-633–1, and Chang-633–2. The Chang-63 layer in the Z211 area is primarily characterized by debris flow deposition, with minor contributions from turbidity current deposition. A depositional micro-phase model and cross-section were constructed, visually illustrating the gravity-driven deposition pattern dominated by sandy debris flows. However, the continuity of sand bodies in the area is limited, with over 90% of sand bodies encountered in horizontal wells having widths of less than 60 m. These sand bodies exhibit three stacking types—overlapping, splicing, and isolated—that significantly influence reservoir connectivity. A further analysis of the relationship between sandy debris flow configurations and fluid migration patterns indicates that high-water-cut zones (>80%) are predominantly located within the main debris flow deposits. Additionally, the stacking patterns of sand bodies substantially impact both reservoir connectivity and waterflood efficiency.
The research contributes to a more refined understanding of the Z211 area’s reservoir characteristics. Although this study focuses on tight sandstone reservoirs formed by sandy debris flow deposition, the integrated geological reservoir study methods and procedures outlined in this paper—particularly those related to sand body internal configurations, heterogeneity, and remaining oil analysis—are applicable to a broader range of sedimentary basins, such as the Permian Basin in the United States. Furthermore, this research is based on field data from 107 deviated wells and 163 horizontal wells. As new horizontal well data become available, the heterogeneity model established in this study will be further refined, enabling dynamic reservoir characterization. This will provide a more accurate description of the subsurface reservoir properties and lay a reliable geological foundation for future adjustments in reservoir development strategies. Future work can focus on refining the predictive models for remaining oil distribution and enhancing waterflood efficiency by integrating more detailed geological, petrophysical, and fluid flow data. In particular, we are currently conducting core experiments and detailed numerical simulations, including mechanical testing and thin-section observations, to further investigate and strengthen our conclusions regarding the impact of sand particle arrangement on fluid distribution.
Author Contributions
X.A.: Conceptualization, Methodology, Investigation, Writing—original draft. Y.L.: Conceptualization, Methodology, Formal analysis, Writing—original draft. H.Y.: Methodology, Validation, Formal analysis. W.W.: Software, Formal analysis. G.H.: Methodology, Formal analysis, Writing—review & editing. H.L.: Investigation, Formal analysis. C.Z.: Validation, Formal analysis. X.L.: Formal analysis, Investigation. Z.P.: Validation, Formal analysis. C.G.: Software, Formal analysis. F.Y.: Software, Formal analysis. P.B.: Formal analysis, Investigation. Y.Z. (Yujie Zhang 1): Software, Investigation. X.Y.: Formal analysis. Y.Z. (Yujie Zhang 2): Investigation. All authors have read and agreed to the published version of the manuscript.
Funding
This research was supported by the National Engineering Laboratory for Exploration and Development of Low-Permeability Oil & Gas Fields Program “Research on time-varying fracture pattern and seepage mechanism of horizontal wells in ultra-low permeability reservoirs developed by water injection” (KFKT2024-08), the Science Foundation of China University of Petroleum, Beijing (No. 2462023BJRC001), and the China National Petroleum Corporation Science and Technology Program “Key Technology Research on Improving Water Drive in Low-Permeability/Tight Reservoirs” (2023ZZ17YJ01).
Data Availability Statement
The datasets used and/or analyzed during the current study are available from the corresponding author upon reasonable request.
Acknowledgments
We acknowledge the support from Muming Wang, Xiao Yang, and Wei Cao at the University of Calgary.
Conflicts of Interest
Authors Xiaoping An, Huanying Yang, ang Li, Chunhui Zhang and Xuejiao Lu were employed by the Exploration and Development Research Institute of PetroChina Changqing Oilfield Company. Author Wenchun Wan was employed by the Fifth Oil Recovery Plant, PetroChina Changqing Oilfield Company. The remaining authors declare that the research was conducted in the absence of any commercial or financial relationships that could be construed as a potential conflict of interest. The companies had no role in the design of the study; in the collection, analyses, or interpretation of data; in the writing of the manuscript, or in the decision to publish the results.
References
- Wang, Z.; Li, S.; Li, M.; Husein, M.M. Enhanced Oil Recovery and Carbon Sequestration in Low-Permeability Reservoirs: Comparative Analysis of CO2 and Oil-Based CO2 Foam. Fuel 2025, 381, 133319. [Google Scholar] [CrossRef]
- Lai, J.; Wang, G.; Wang, Z.; Chen, J.; Pang, X.; Wang, S.; Zhou, Z.; He, Z.; Qin, Z.; Fan, X. A Review on Pore Structure Characterization in Tight Sandstones. Earth-Sci. Rev. 2018, 177, 436–457. [Google Scholar] [CrossRef]
- Feng, J.; Shang, L.; Li, X.; Luo, P. 3D Numerical Simulation of Heterogeneous in Situ Stress Field in Low-Permeability Reservoirs. Pet. Sci. 2019, 16, 939–955. [Google Scholar] [CrossRef]
- Fan, T.; Song, X.; Wu, S.; Li, Q.; Wang, B.; Li, X.; Li, H.; Liu, H. A Mathematical Model and Numerical Simulation of Waterflood Induced Dynamic Fractures of Low Permeability Reservoirs. Pet. Explor. Dev. 2015, 42, 541–547. [Google Scholar] [CrossRef]
- Kang, W.-L.; Zhou, B.-B.; Issakhov, M.; Gabdullin, M. Advances in Enhanced Oil Recovery Technologies for Low Permeability Reservoirs. Pet. Sci. 2022, 19, 1622–1640. [Google Scholar] [CrossRef]
- Yuan, S.; Han, H.; Wang, H.; Luo, J.; Wang, Q.; Lei, Z.; Xi, C.; Li, J. Research Progress and Potential of New Enhanced Oil Recovery Methods in Oilfield Development. Pet. Explor. Dev. 2024, 51, 963–980. [Google Scholar] [CrossRef]
- Chenghua, O.; Xiaolu, W.; Chaochun, L.; Yan, H. Three-Dimensional Modelling of a Multi-Layer Sandstone Reservoir: The Sebei Gas Field, China. Acta Geol. Sin. 2016, 90, 209–221. [Google Scholar] [CrossRef]
- Qiao, J.; Zeng, J.; Jiang, S.; Feng, S.; Feng, X.; Guo, Z.; Teng, J. Heterogeneity of Reservoir Quality and Gas Accumulation in Tight Sandstone Reservoirs Revealed by Pore Structure Characterization and Physical Simulation. Fuel 2019, 253, 1300–1316. [Google Scholar] [CrossRef]
- Hui, G.; Chen, Z.; Wang, Y.; Zhang, D.; Gu, F. An Integrated Machine Learning-Based Approach to Identifying Controlling Factors of Unconventional Shale Productivity. Energy 2023, 266, 126512. [Google Scholar] [CrossRef]
- Gao, Z.; Shi, J.; Xie, Q.; Zhou, Y.; Zhou, S. Classification and Evaluation of Tight Sandstone Reservoirs Based on Diagenetic Facies: A Case Study on Chang 6 Reservoir in the Center-West Ordos Basin. J. Pet. Explor. Prod. Technol. 2022, 12, 1203–1216. [Google Scholar]
- Hui, G.; Chen, S.; Wang, Y.; Gu, F. The Effect of Hydraulic-Natural Fracture Networks on the Waterflooding Development in a Multilayer Tight Reservoir: Case Study. Geofluids 2021, 2021, 1–15. [Google Scholar]
- Hou, Y.T.; Wang, T.; Hu, X.F.; Yan, R.H.; Wang, D.L. Control and Import of Sedimentary Microfacies on Tight Oil Occurrence in the Chang 7-3 Member of the Triassic Yanchang Formation, Ordos Basin of China. In Proceedings of the SPE/AAPG/SEG Unconventional Resources Technology Conference, San Antonio, TX, USA, 1–3 August 2016. [Google Scholar] [CrossRef]
- Zhang, Z.; Tang, J.; Zhang, J.; Meng, S.; Li, J. Modeling of Scale-Dependent Perforation Geometrical Fracture Growth in Naturally Layered Media. Eng. Geol. 2024, 336, 107499. [Google Scholar]
- Li, A.; Yang, X.; Fan, C.; Ye, Q.; Wang, Z.; Li, M. Sandy Debris Flow Sedimentary Characteristics and Patterns in the Meishan Formation of Northern Lingshui Sag, Qiongdongnan Basin. J. Phys. Conf. Ser. 2020, 1549, 022009. [Google Scholar]
- Cao, Y.; Jin, J.; Liu, H.; Yang, T.; Liu, K.; Wang, Y.; Wang, J.; Liang, C. Deep-Water Gravity Flow Deposits in a Lacustrine Rift Basin and Their Oil and Gas Geological Significance in Eastern China. Pet. Explor. Dev. 2021, 48, 286–298. [Google Scholar]
- Sun, N.; Zhong, J.; Hao, B.; Ge, Y.; Swennen, R. Sedimentological and Diagenetic Control on the Reservoir Quality of Deep-Lacustrine Sedimentary Gravity Flow Sand Reservoirs of the Upper Triassic Yanchang Formation in Southern Ordos Basin, China. Mar. Pet. Geol. 2020, 112, 104050. [Google Scholar]
- Jon, R.; Basin, D.; Marco, F.; Thieblemont, A. Beds created by (mostly) sediment gravity flows. In Proceedings of the SEG/AAPG International Meeting for Applied Geoscience & Energy, Houston, TX, USA, 28 August–1 September 2022. [Google Scholar] [CrossRef]
- Palermo, D.; Galbiati, M.; Famiglietti, M.; Marchesini, M.; Mezzapesa, D.; Fonnesu, F. Insights into a New Super-Giant Gas Field—Sedimentology and Reservoir Modeling of the Coral Reservoir Complex, Offshore Northern Mozambique. In Proceedings of the Offshore Technology Conference-Asia, Kuala Lumpur, Malaysia, 25–28 March 2014. [Google Scholar] [CrossRef]
- Di, C.; Wei, Y.; Wang, K.; Deng, P.; Chen, B.; Shen, L.; Chen, Z. The Impact of Pressurization-Induced Decrease of Capillary Pressure and Residual Saturation on Geological Carbon Dioxide Storage. J. Clean. Prod. 2025, 486, 144573. [Google Scholar]
- Hui, G.; Chen, S.; He, Y.; Wang, H.; Gu, F. Machine Learning-Based Production Forecast for Shale Gas in Unconventional Reservoirs via Integration of Geological and Operational Factors. J. Nat. Gas Sci. Eng. 2021, 94, 104045. [Google Scholar]
- Tang, J.; Zhang, Z.; Xie, J.; Meng, S.; Xu, J.; Ehlig-Economides, C.; Liu, H. Re-Evaluation of CO2 Storage Capacity of Depleted Fractured-Vuggy Carbonate Reservoir. Innov. Energy 2024, 1, 100019. [Google Scholar]
- Hui, G.; Chen, Z.-X.; Lei, Z.-D.; Song, Z.-J.; Zhang, L.-Y.; Yu, X.-R.; Gu, F. A Synthetical Geoengineering Approach to Evaluate the Largest Hydraulic Fracturing-Induced Earthquake in the East Shale Basin, Alberta. Pet. Sci. 2023, 20, 460–473. [Google Scholar]
- Jiang, L.; Qiu, Z.; Wang, Q.; Guo, Y.; Wu, C.; Wu, Z.; Xue, Z. Joint Development and Tectonic Stress Field Evolution in the Southeastern Mesozoic Ordos Basin, West Part of North China. J. Asian Earth Sci. 2016, 127, 47–62. [Google Scholar]
- Yang, H.; Deng, X. Deposition of Yanchang Formation Deep-Water Sandstone under the Control of Tectonic Events in the Ordos Basin. Pet. Explor. Dev. 2013, 40, 549–557. [Google Scholar] [CrossRef]
- Yang, S.; Wang, Z.; Guo, Y.; Li, C.; Cai, J. Heavy Mineral Compositions of the Changjiang (Yangtze River) Sediments and Their Provenance-Tracing Implication. J. Asian Earth Sci. 2009, 35, 56–65. [Google Scholar] [CrossRef]
- Chen, J.; Wang, L.; Wang, C.; Yao, B.; Tian, Y.; Wu, Y.-S. Automatic Fracture Optimization for Shale Gas Reservoirs Based on Gradient Descent Method and Reservoir Simulation. Adv. Geo-Energy Res. 2021, 5, 191–201. [Google Scholar] [CrossRef]
- Zhang, Z.; Li, Z.; Deng, X.; Liao, J.; Zheng, X. Multi-Parameters Logging Identifying Method for Sand Body Architectures of Tight Sandstones: A Case from the Triassic Chang 9 Member, Longdong Area, Ordos Basin, NW China. J. Pet. Sci. Eng. 2022, 216, 110824. [Google Scholar]
- Hui, G.; Chen, Z.; Schultz, R.; Chen, S.; Song, Z.; Zhang, Z.; Song, Y.; Wang, H.; Wang, M.; Gu, F. Intricate Unconventional Fracture Networks Provide Fluid Diffusion Pathways to Reactivate Pre-Existing Faults in Unconventional Reservoirs. Energy 2023, 282, 128803. [Google Scholar] [CrossRef]
- Hui, G.; Chen, Z.; Chen, S.; Gu, F. Hydraulic Fracturing-Induced Seismicity Characterization through Coupled Modeling of Stress and Fracture-Fault Systems. Adv. Geo-Energy Res. 2022, 6, 269–270. [Google Scholar] [CrossRef]
- Anikin, O.V.; Derevyanko, V.K.; Bolotov, A.V.; Minkhanov, I.F.; Varfolomeev, M.A.; Konstantinovich, E.A.; Kadysheva, V.A. Gas Enhanced Oil Recovery Methods for Offshore Oilfields: Features, Implementation, Operational Status. Pet. Res. 2024, S2096249524001078, in process. [Google Scholar] [CrossRef]
- Lyu, Q.; Fu, J.; Luo, S.; Li, S.; Zhou, X.; Pu, Y.; Yan, H. Sedimentary Characteristics and Model of Gravity Flow Channel—Lobe Complex in a Depression Lake Basin: A Case Study of Chang 7 Member of Triassic Yanchang Formation in Southwestern Ordos Basin, NW China. Pet. Explor. Dev. 2022, 49, 1323–1338. [Google Scholar] [CrossRef]
- Chen, S.; Lei, J.; Liu, C.; Yao, J.; Li, Y.; Li, S.; Su, K.; Xiao, Z. Factors Controlling the Reservoir Accumulation of Triassic Chang 6 Member in Jiyuan-Wuqi Area, Ordos Basin, NW China. Pet. Explor. Dev. 2019, 46, 253–264. [Google Scholar] [CrossRef]
- Cao, L.; Jiang, F.; Chen, Z.; Gao, Y.; Huo, L.; Chen, D. Data-Driven Interpretable Machine Learning for Prediction of Porosity and Permeability of Tight Sandstone Reservoir. Adv. Geo-Energy Res. 2025, 16, 21–35. [Google Scholar] [CrossRef]
- Hu, W.; Wei, Y.; Bao, J. Development of the Theory and Technology for Low Permeability Reservoirs in China. Pet. Explor. Dev. 2018, 45, 685–697. [Google Scholar] [CrossRef]
- Dou, L.; Hou, J.; Liu, Y.; Zhang, L.; Song, S.; Wang, X. Sedimentary Infill of Shallow Water Deltaic Sand Bodies Controlled by Small-Scale Syndepositional Faults Related Paleogeomorphology: Insights from the Paleogene Shahejie Formation in the Dongying Depression, Bohai Bay Basin, Eastern China. Mar. Pet. Geol. 2020, 118, 104420. [Google Scholar]
- Bao, P.; Hui, G.; Hu, Y.; Song, R.; Chen, Z.; Zhang, K.; Pi, Z.; Li, Y.; Ge, C.; Yao, F.; et al. Comprehensive Characterization of Hydraulic Fracture Propagations and Prevention of Pre-Existing Fault Failure in Duvernay Shale Reservoirs. Eng. Fail. Anal. 2025, 173, 109461. [Google Scholar]
- Li, X.; Su, Y.; Guanglei, R. Research on Architecture of Multi-Type Sand Bodies inside Distributary Channel of Delta Plain: A Case Study in the Daniudi Gas Field, Ordos Basin. Arab. J. Geosci. 2022, 15, 1753. [Google Scholar]
- Hui, G.; Chen, S.; Gu, F. Strike-Slip Fault Reactivation Triggered by Hydraulic-Natural Fracture Propagation during Fracturing Stimulations near Clark Lake, Alberta. Energy Fuels 2024, 38, 18547–18555. [Google Scholar]
- Chen, H.X.; Zhang, L.M.; Zhang, S. Evolution of Debris Flow Properties and Physical Interactions in Debris-Flow Mixtures in the Wenchuan Earthquake Zone. Eng. Geol. 2014, 182, 136–147. [Google Scholar]
- Al-Qasim, A.; Kokal, S.; Hartvig, S.; Huseby, O. Subsurface Monitoring and Surveillance Using Inter-Well Gas Tracers. Upstream Oil Gas Technol. 2020, 3, 100006. [Google Scholar] [CrossRef]
- Yin, X.; Lu, S.; Wang, P.; Wang, Q.; Wang, W.; Yao, T. A Three-Dimensional High-Resolution Reservoir Model of the Eocene Shahejie Formation in Bohai Bay Basin, Integrating Stratigraphic Forward Modeling and Geostatistics. Mar. Pet. Geol. 2017, 82, 362–370. [Google Scholar]
- Jiang, X.; Wu, S.; Yu, D. Fluvial Reservoir Architecture Modeling and Remaining Oil Analysis. In Proceedings of the SPE Annual Technical Conference and Exhibition, Anaheim, CA, USA, 11–14 November 2007. [Google Scholar] [CrossRef]
- Feng, C.; Bao, Z.; Yang, L.; Si, X.; Xu, G.; Han, X. Reservoir Architecture and Remaining Oil Distribution of Deltaic Front Underwater Distributary Channel. Pet. Explor. Dev. 2014, 41, 358–364. [Google Scholar]
- Jian, Y.; Yajuan, Y.; Jinliang, D. Sedimentation during the Transgression Period in Late Triassic Yanchang Formation, Ordos Basin. Pet. Explor. Dev. 2010, 37, 181–187. [Google Scholar] [CrossRef]
- Yuan, Z.; Yang, B.; Yang, L.; Gu, W.; Chen, X.; Kang, B.; Li, C.; Zhang, H. Water-Cut Rising Mechanism and Optimized Water Injection Technology for Deepwater Turbidite Sandstone Oilfield: A Case Study of AKPO Oilfield in Niger Delta Basin, West Africa. Pet. Explor. Dev. 2018, 45, 302–311. [Google Scholar] [CrossRef]
- Liang, X.; Ge, Y.; Zeng, L.; Lyu, L.; Sun, Q.; Sun, Y.; Wang, X. Debris Flow Susceptibility Based on the Connectivity of Potential Material Sources in the Dadu River Basin. Eng. Geol. 2023, 312, 106947. [Google Scholar] [CrossRef]
- Liu, M.; Xiong, C. Diagenesis and Reservoir Quality of Deep-Lacustrine Sandy-Debris-Flow Tight Sandstones in Upper Triassic Yanchang Formation, Ordos Basin, China: Implications for Reservoir Heterogeneity and Hydrocarbon Accumulation. J. Pet. Sci. Eng. 2021, 202, 108548. [Google Scholar] [CrossRef]
- Qinglong, D.; Yongsheng, Z.; Yinyin, L.; Liting, Z. Study on Genetic Type and Potential Tapping Measures of the Remaining Oil in Multilayered and Heterogeneous Sandstone Reservoir. In Proceedings of the SPE Asia Pacific Improved Oil Recovery Conference, Kuala Lumpur, Malaysia, 25–26 October 1999. [Google Scholar] [CrossRef]
- Liu, J.-P.; Xian, B.-Z.; Tan, X.-F.; Wang, Z.; Wang, J.-H.; Luo, L.; Chen, P.; He, Y.-X.; Tian, R.-H.; Wu, Q.-R.; et al. Sub-Lacustrine Debrite System: Facies Architecture and Sediment Distribution Pattern. Pet. Sci. 2024, 22, 110–129. [Google Scholar] [CrossRef]
- Yin, X.; Huang, W.; Lu, S.; Wang, P.; Wang, W.; Xia, L.; Yao, T. The Connectivity of Reservoir Sand Bodies in the Liaoxi Sag, Bohai Bay Basin: Insights from Three-Dimensional Stratigraphic Forward Modeling. Mar. Pet. Geol. 2016, 77, 1081–1094. [Google Scholar] [CrossRef]
- Li, J.; Song, X.; Tian, C.; Wang, Y.; Xu, F.; Hui, G.; Wang, R. Single Sandbody Stacking Pattern, Calcareous Barrier and Fracture of Tight Low Permeability Oil Sandstone Reservoir and their Impact on Water-flooding—A Case Study of Ansai oil field, Ordos Basin, China. In Proceedings of the SPE Reservoir Characterisation and Simulation Conference and Exhibition, Abu Dhabi, United Arab Emerites, 14–16 September 2015. [Google Scholar] [CrossRef]
- Fu, H.; Bai, Z.; Guo, H.; Yang, K.; Guo, C.; Liu, M.; Liang, L.; Song, K. Remaining Oil Distribution Law and Development Potential Analysis after Polymer Flooding Based on Reservoir Architecture in Daqing Oilfield, China. Polymers 2023, 15, 2137. [Google Scholar] [CrossRef]
- Gao, Y.; Liu, Y.; Xu, Y.; Liu, B.; He, W.; Duan, H.; Chen, W.; Cheng, W.; Tian, W.; Fan, Y. Origin and Geological Significance of Residual Oil in High-Angle Joint Fissures: A Case Study of the Nadu Formation in Baise Basin, South China. Processes 2023, 11, 2850. [Google Scholar] [CrossRef]
- Pu, C.; Jing, C.; He, Y.; Gu, X.; Zhang, Z.; Wei, J. Multistage Interwell Chemical Tracing for Step-by-Step Profile Control of Water Channeling and Flooding of Fractured Ultra-Low Permeability Reservoirs. Pet. Explor. Dev. 2016, 43, 679–688. [Google Scholar] [CrossRef]
- Pakzad, R.; Wang, S.Y.; Sloan, S.W. Numerical Simulation of Hydraulic Fracturing in Low-/High-Permeability, Quasi-Brittle and Heterogeneous Rocks. Rock Mech. Rock Eng. 2018, 51, 1153–1171. [Google Scholar] [CrossRef]
- Qin, Y.; Yao, S.; Xiao, H.; Cao, J.; Hu, W.; Sun, L.; Tao, K.; Liu, X. Pore Structure and Connectivity of Tight Sandstone Reservoirs in Petroleum Basins: A Review and Application of New Methodologies to the Late Triassic Ordos Basin, China. Mar. Pet. Geol. 2021, 129, 105084. [Google Scholar] [CrossRef]
- Wei, K.; Qin, Z.; Wang, C.; Zhang, Z.; Su, K.; Wang, G.; Zhu, Y.; Huang, Y.; Zhang, X.; Meng, L. Response Characteristics and Novel Understandings of Dual Induction Logging of Horizontal Wells in Fractured Reservoirs. J. Appl. Geophys. 2024, 225, 105393. [Google Scholar]
- Hürlimann, M.; Coviello, V.; Bel, C.; Guo, X.; Berti, M.; Graf, C.; Hübl, J.; Miyata, S.; Smith, J.B.; Yin, H.-Y. Debris-Flow Monitoring and Warning: Review and Examples. Earth-Sci. Rev. 2019, 199, 102981. [Google Scholar]
- Vicari, H.; Ng, C.W.W.; Nordal, S.; Thakur, V.; De Silva, W.A.R.K.; Liu, H.; Choi, C.E. The Effects of Upstream Flexible Barrier on the Debris Flow Entrainment and Impact Dynamics on a Terminal Barrier. Can. Geotech. J. 2022, 59, 1007–1019. [Google Scholar] [CrossRef]
- Jensen, J.L.; Flaig, P.P.; Hattori, K.E. The Effects of Facies Variability and Bioturbation Intensity on Permeability in a Mixed Siliciclastic–Carbonate Core from the Upper Strawn Group, Katz Field, Eastern Shelf of the Permian Basin, Texas, USA. Geosciences 2024, 14, 339. [Google Scholar] [CrossRef]
- Zhu, H.; Song, Y.; Lei, Z.; Tang, X. 4D-Stress Evolution of Tight Sandstone Reservoir during Horizontal Wells Injection and Production: A Case Study of Yuan 284 Block, Ordos Basin, NW China. Pet. Explor. Dev. 2022, 49, 156–169. [Google Scholar]


Disclaimer/Publisher’s Note: The statements, opinions and data contained in all publications are solely those of the individual author(s) and contributor(s) and not of MDPI and/or the editor(s). MDPI and/or the editor(s) disclaim responsibility for any injury to people or property resulting from any ideas, methods, instructions or products referred to in the content. |
© 2025 by the authors. Licensee MDPI, Basel, Switzerland. This article is an open access article distributed under the terms and conditions of the Creative Commons Attribution (CC BY) license (https://creativecommons.org/licenses/by/4.0/).