
Mechanism of Pore Structure Evolution in Tight Sandstone Subjected to ScCO2–H2O Treatment


Abstract
1. Introduction
2. Samples and Experiments
2.1. Samples’ Selection and Treatment
2.2. ScCO2–H2O Treatment
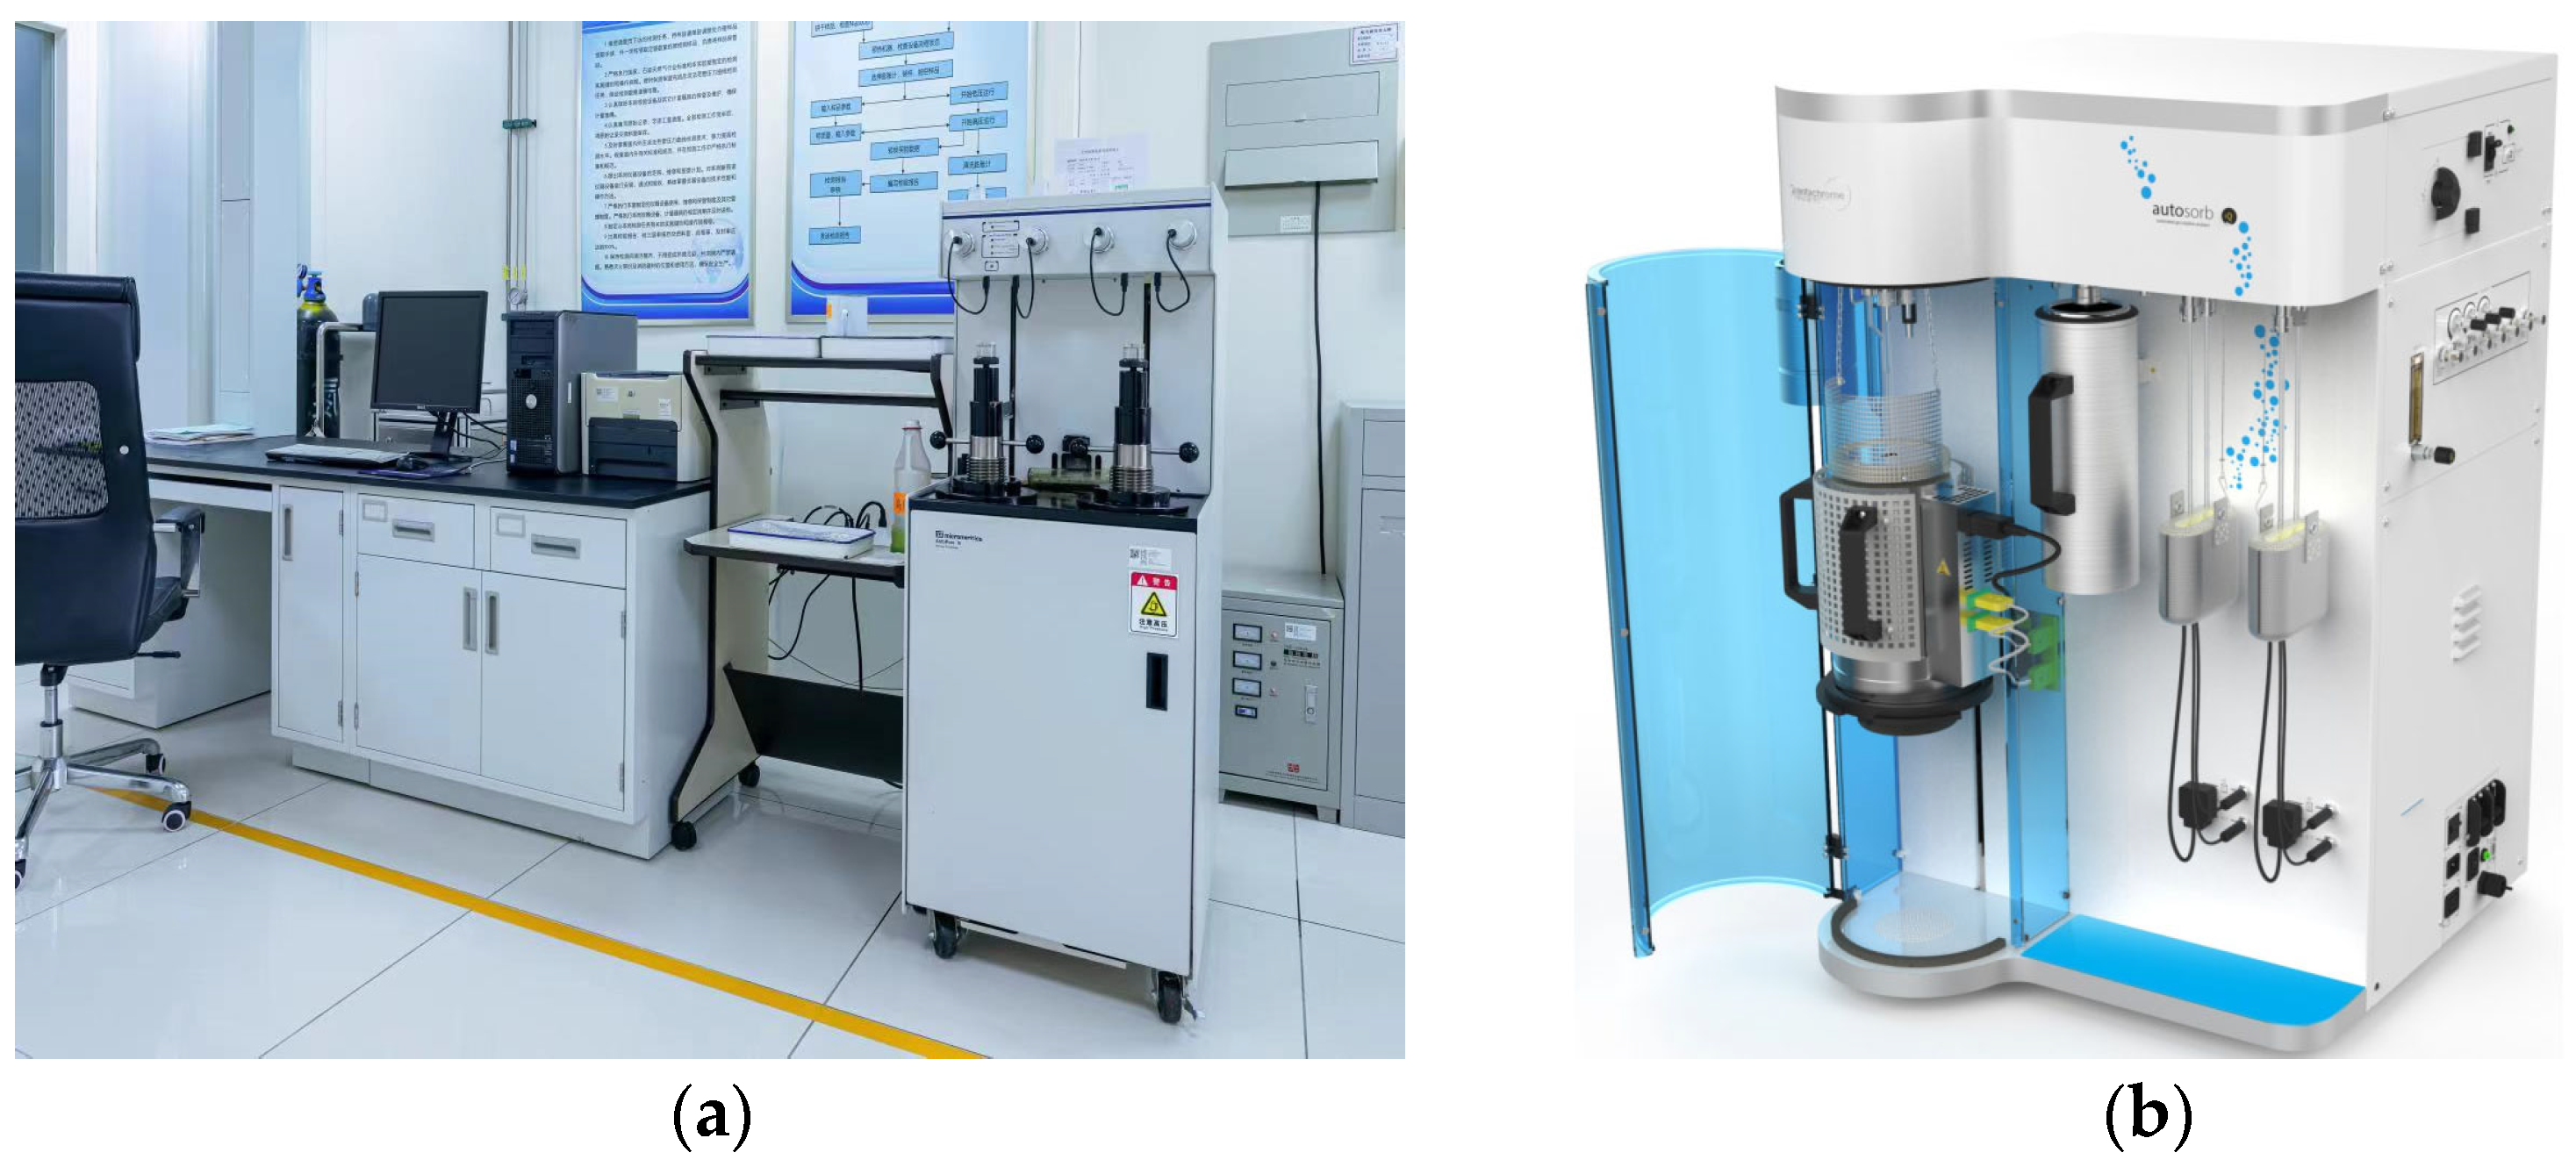
2.3. Mercury Intrusion Porosimetry
2.4. Low-Pressure Nitrogen Adsorption/Desorption
3. Results and Discussion
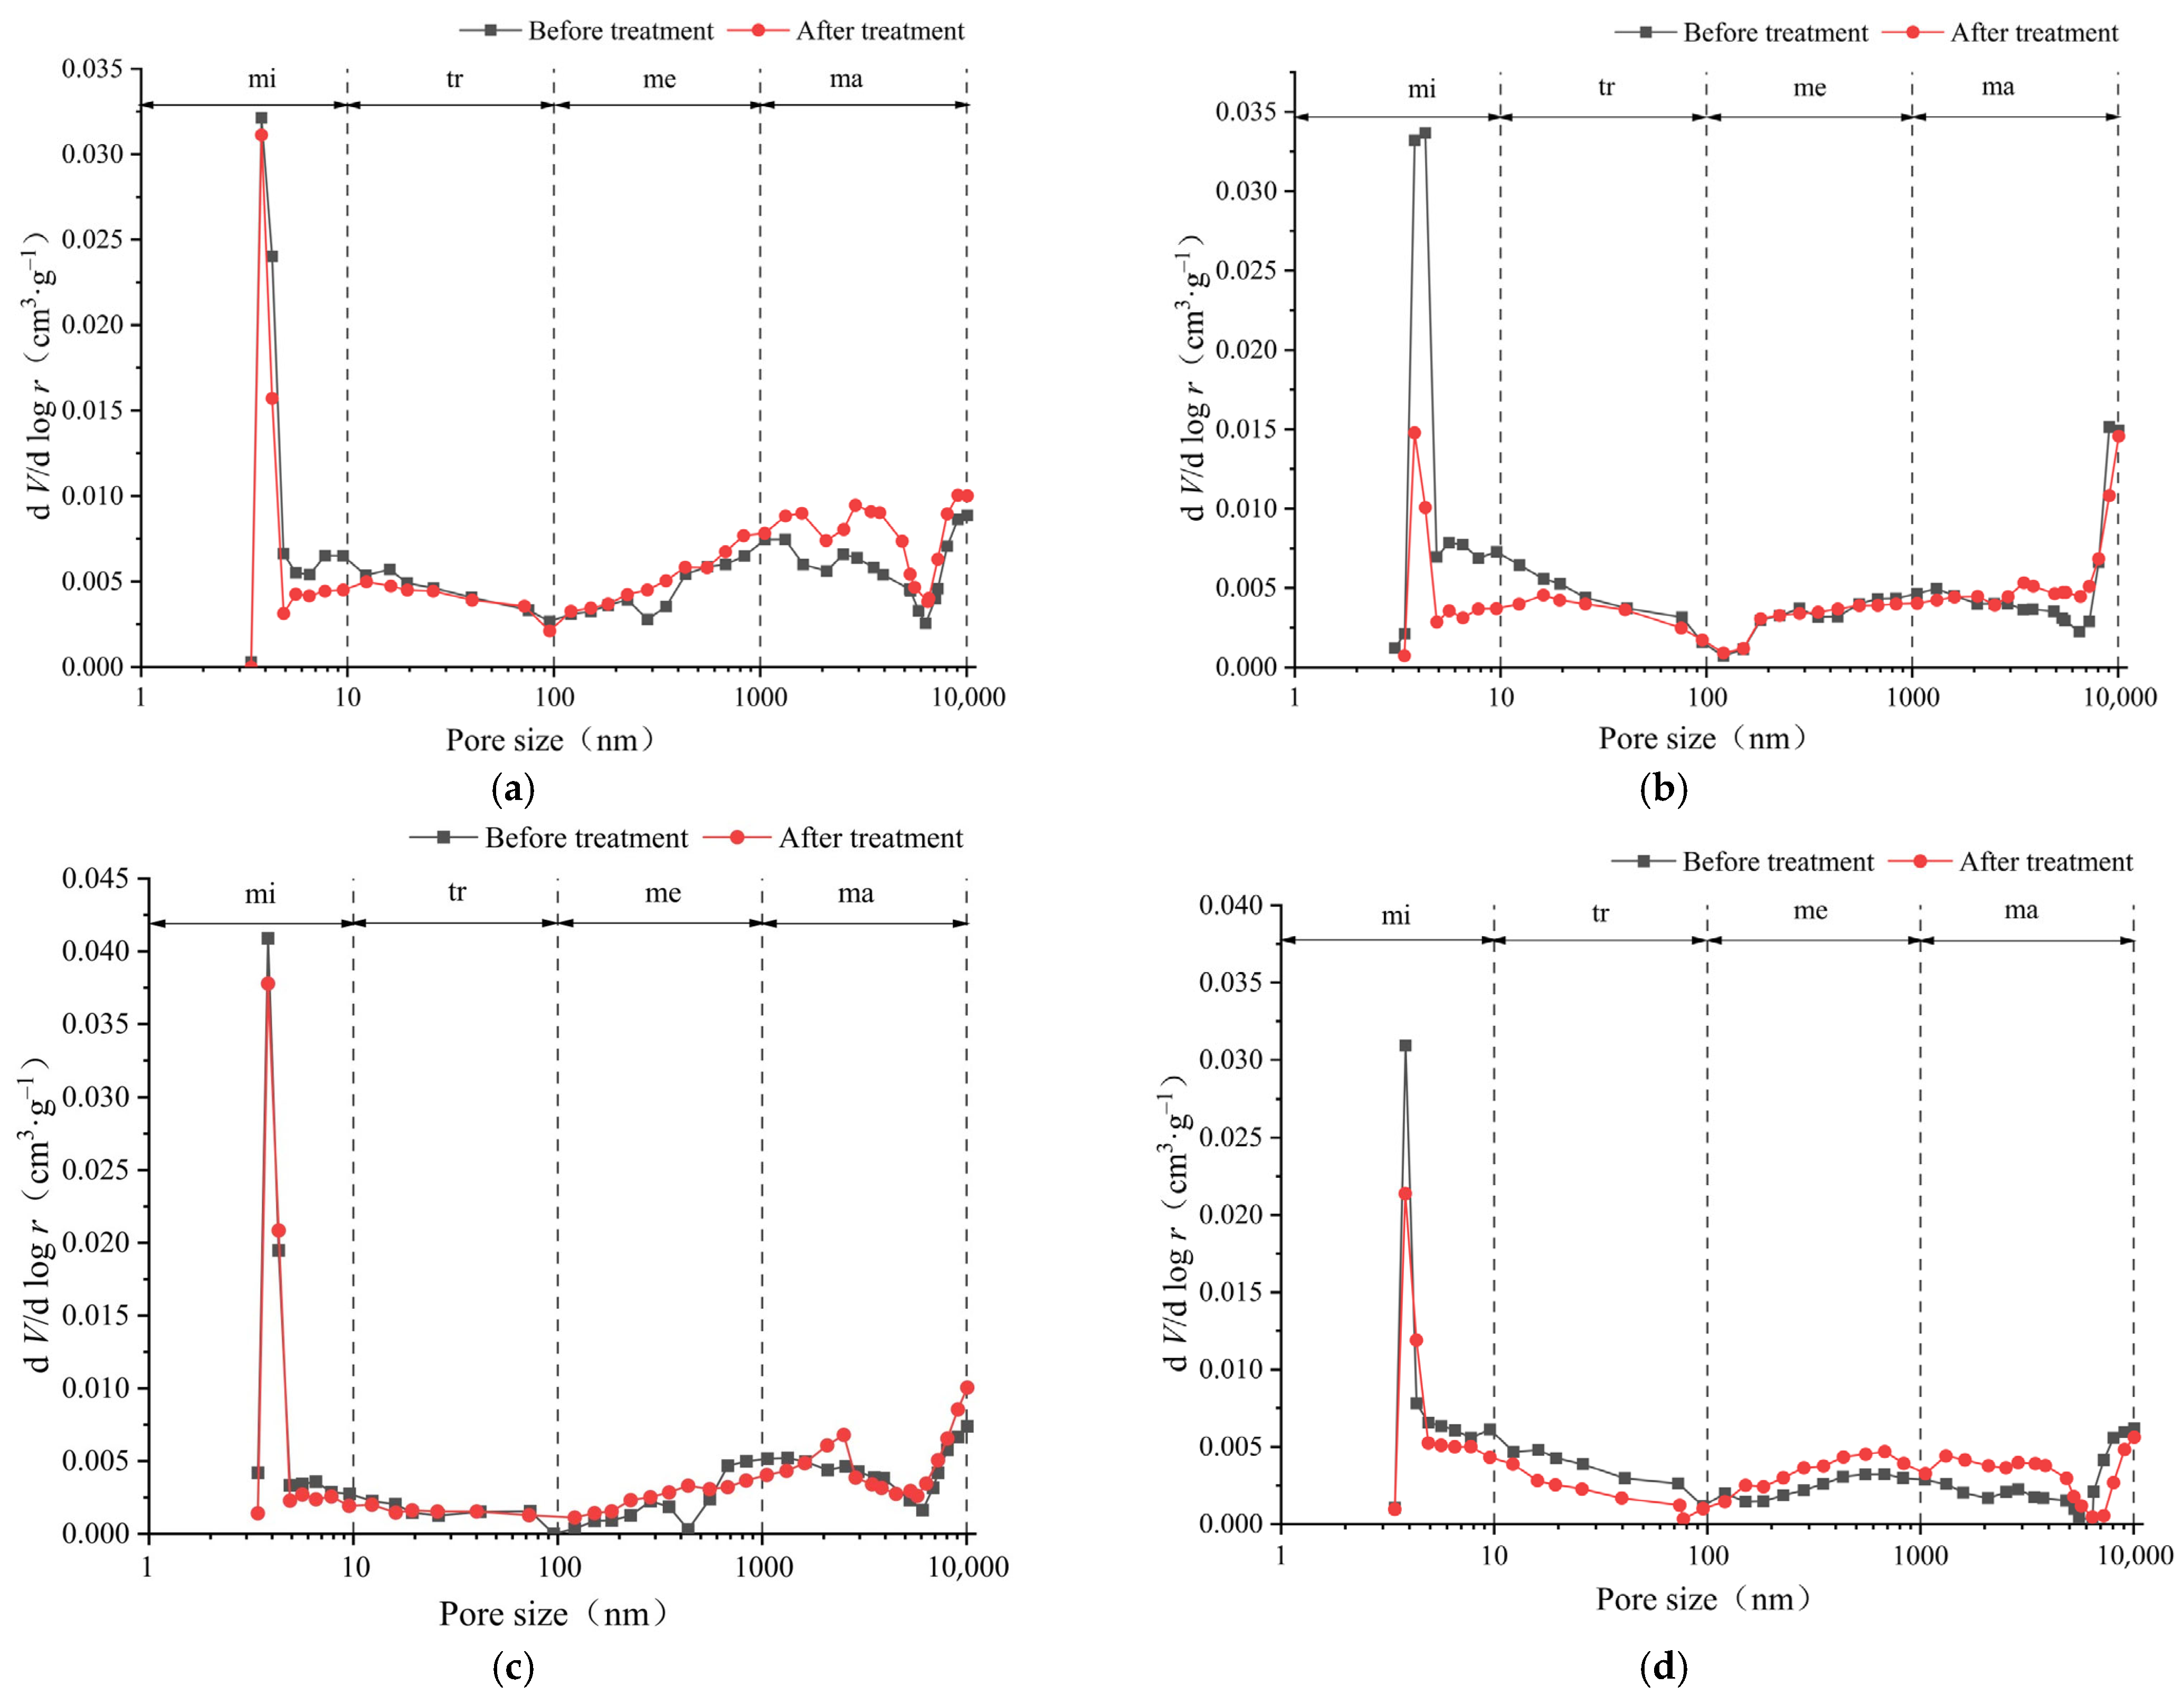
3.1. Pore Volume Distribution and Its Evolution
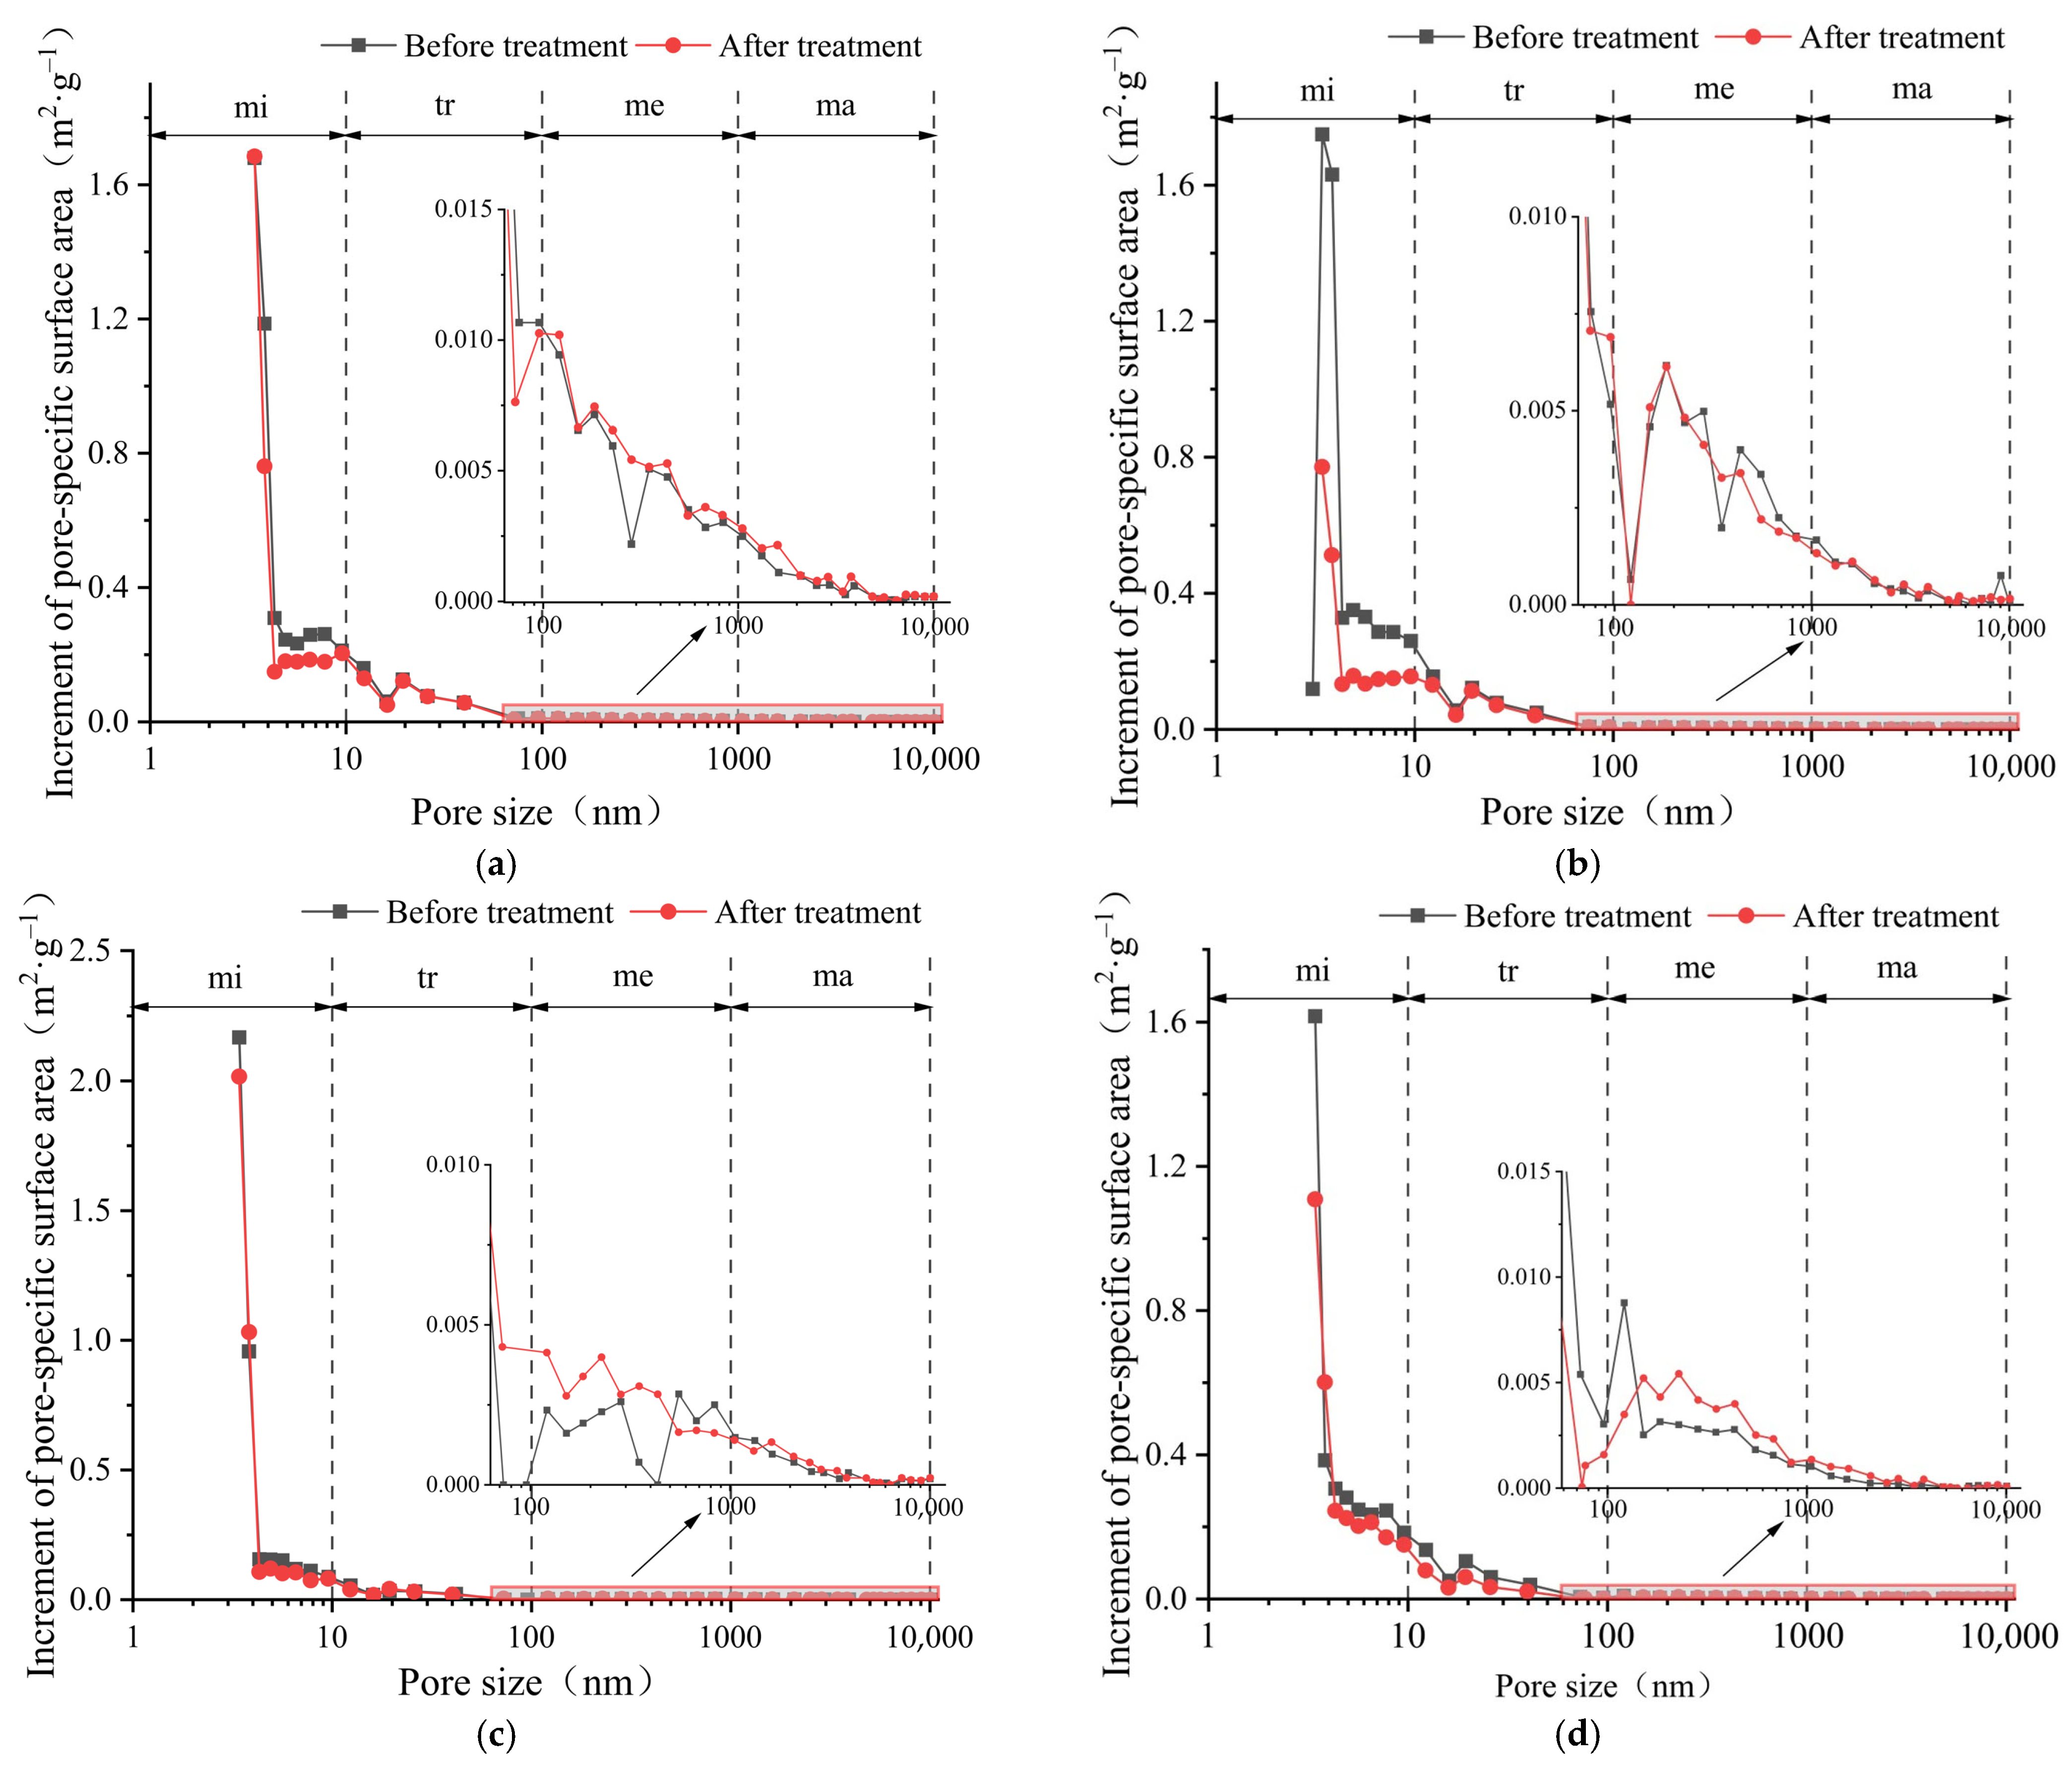
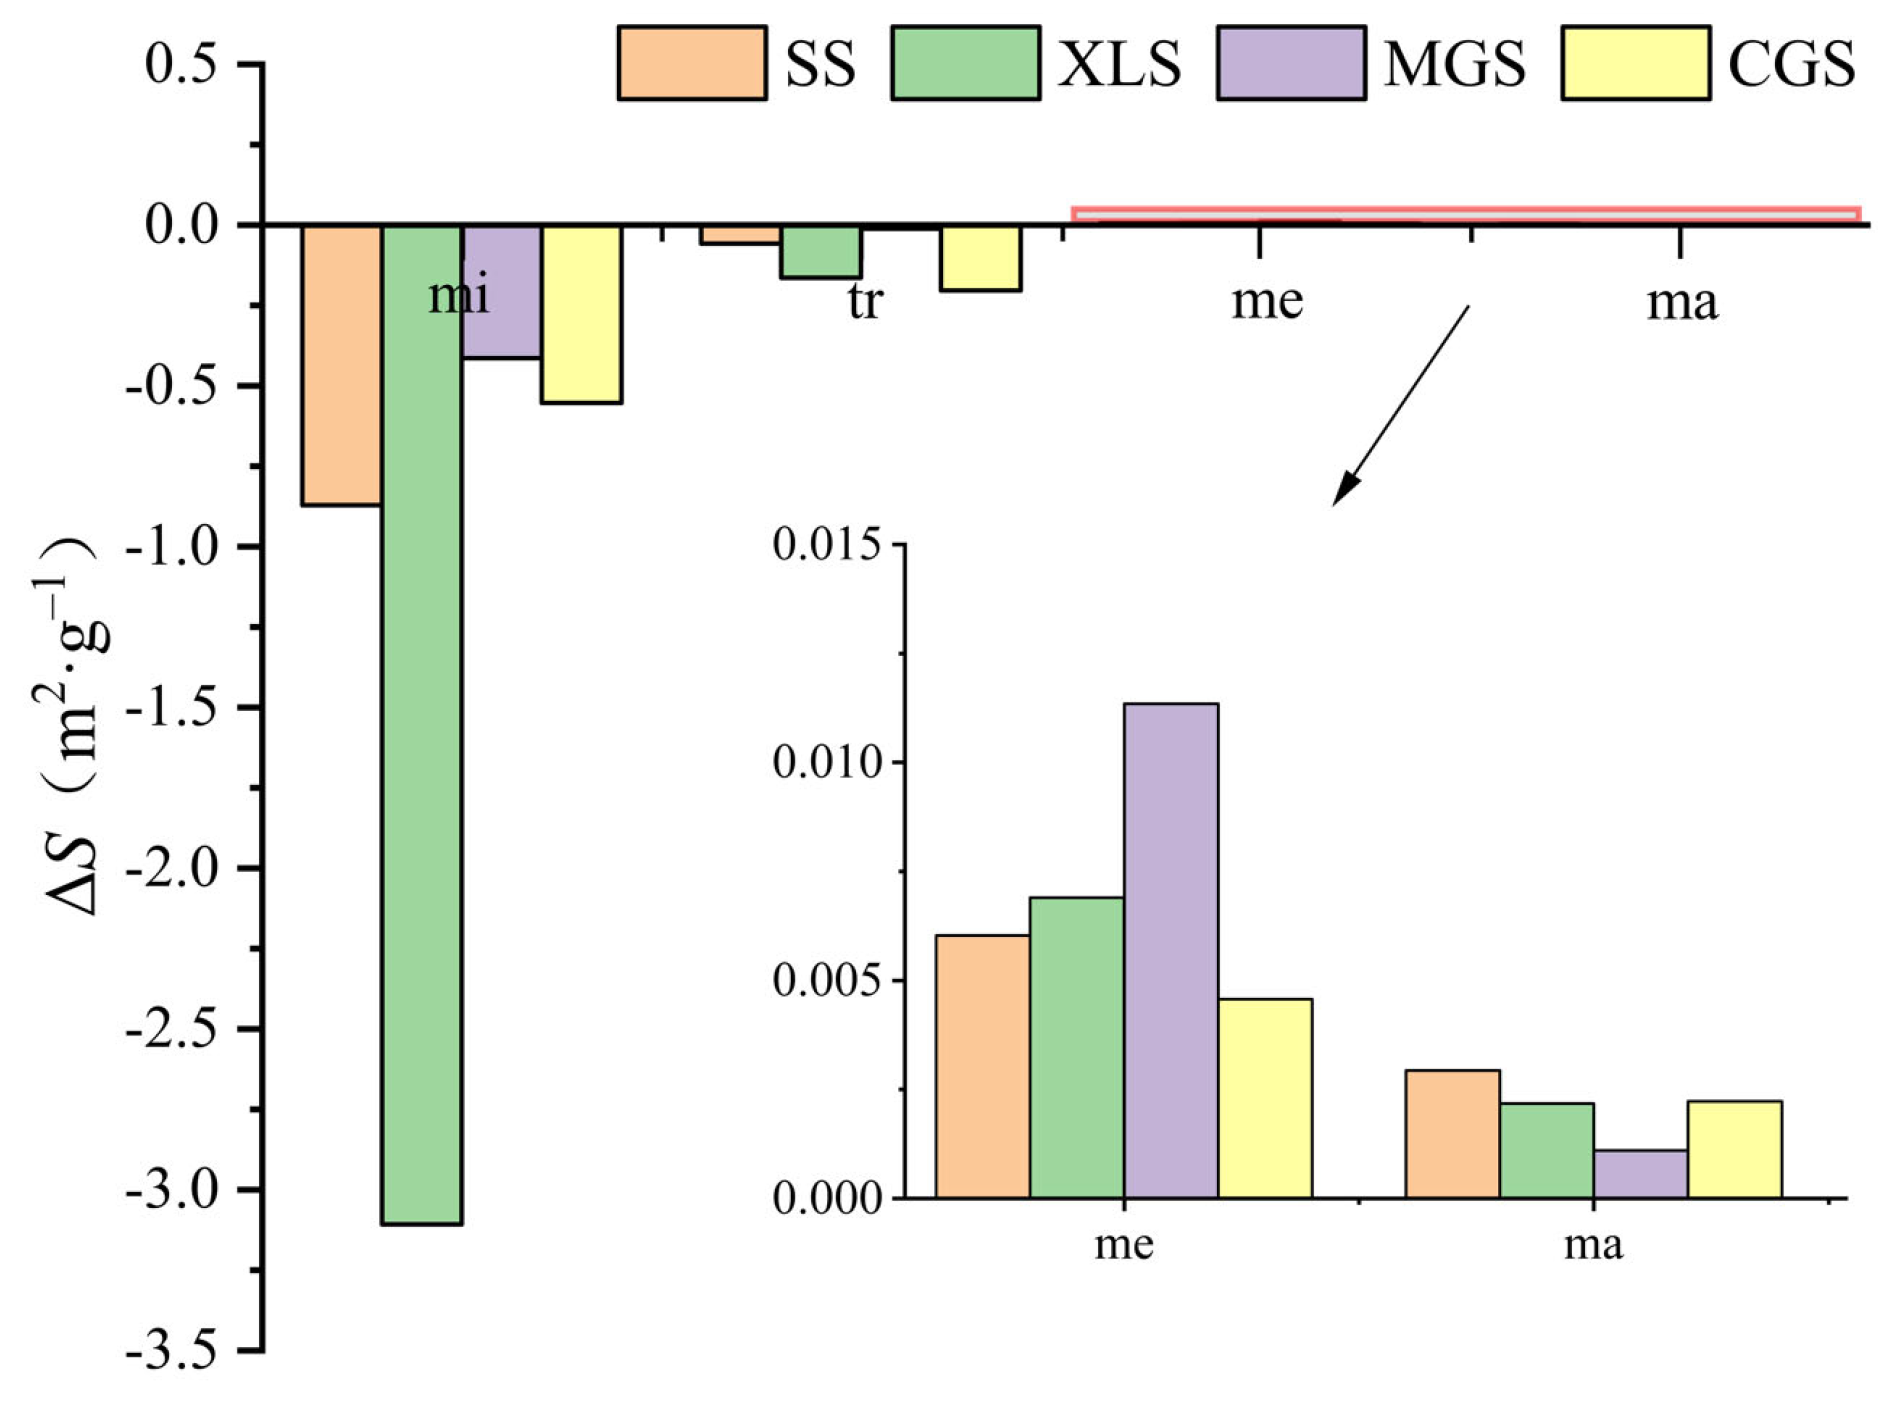
3.2. Pore-Specific Surface Area Distribution and Its Evolution
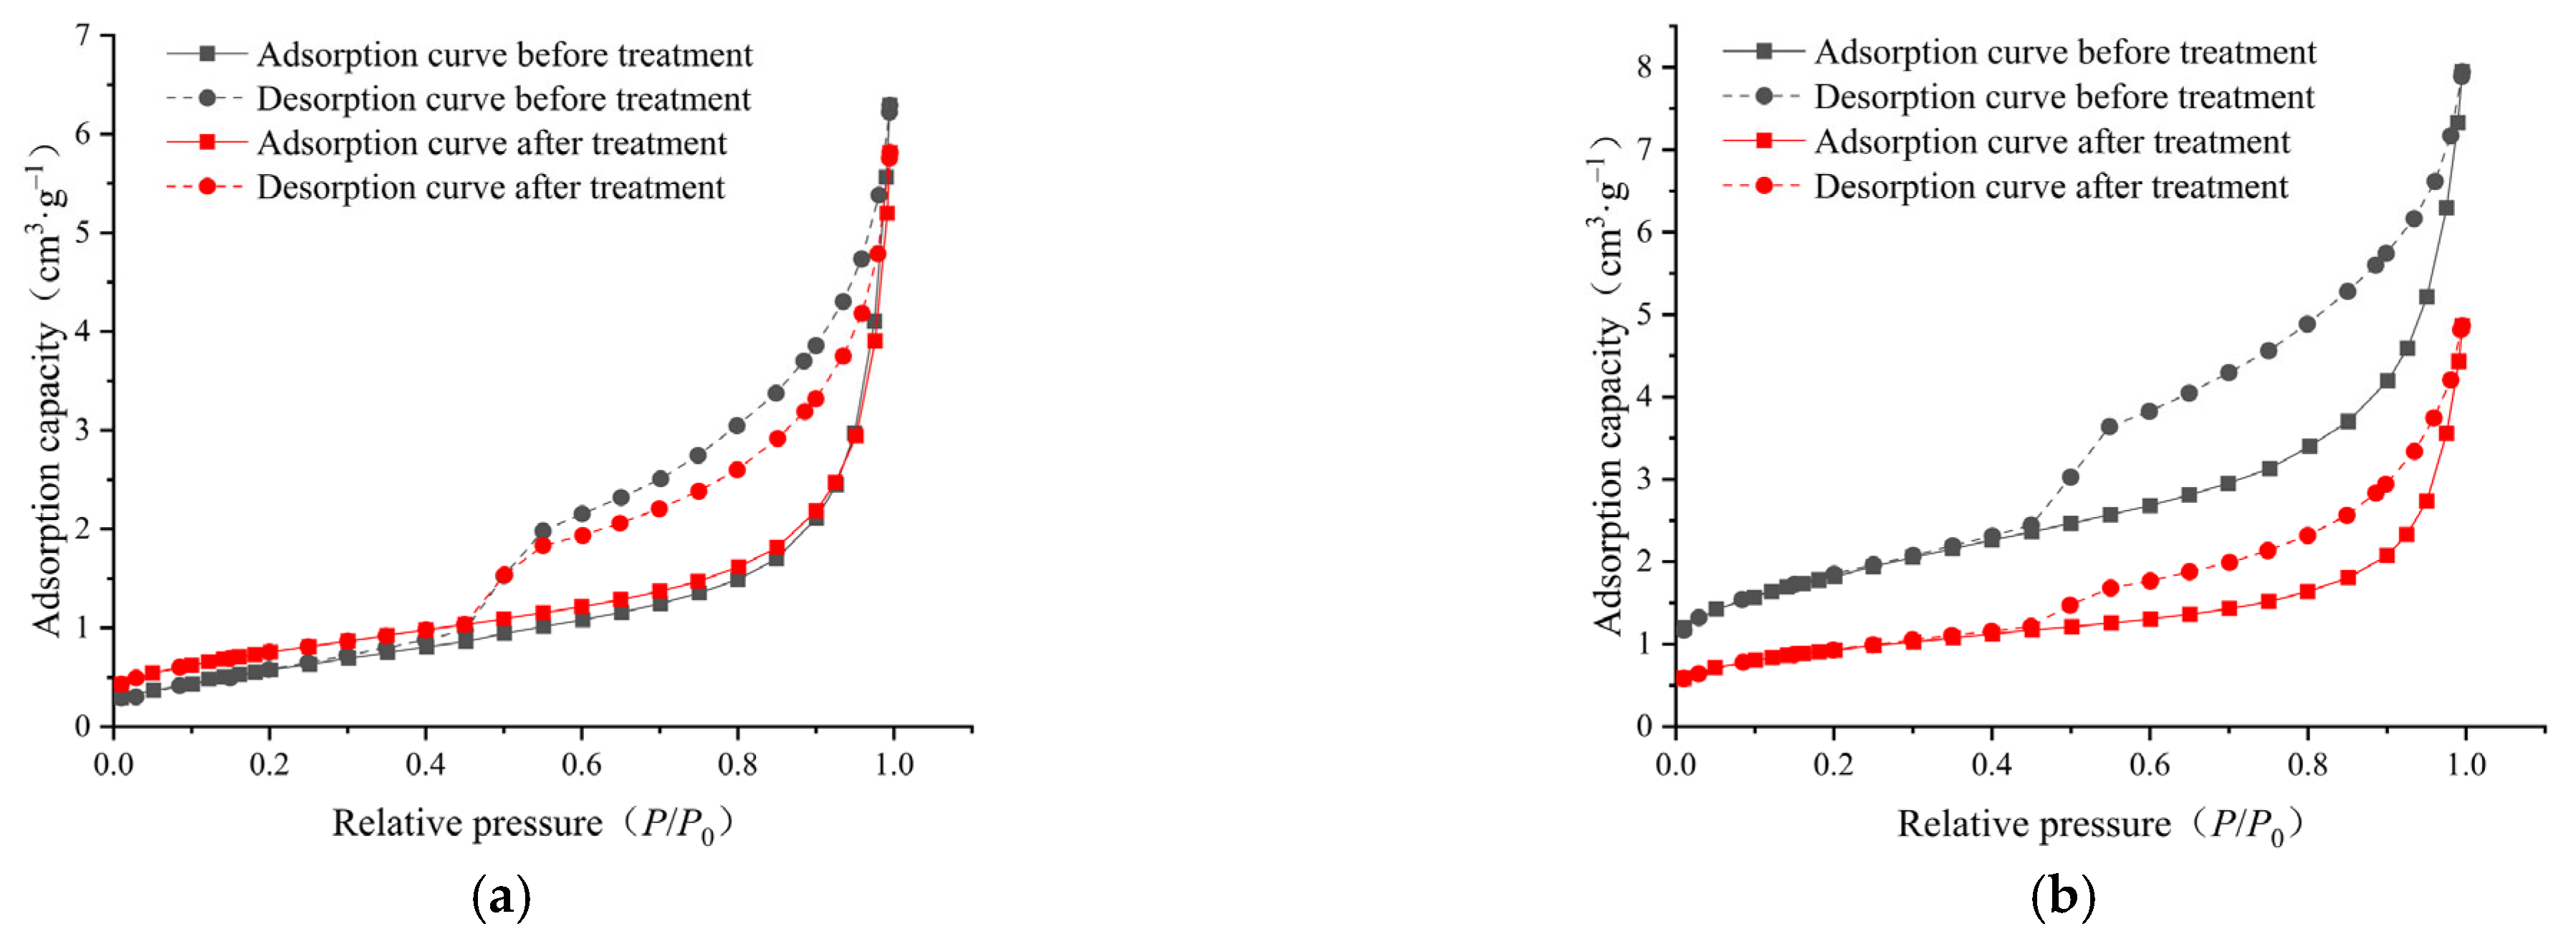
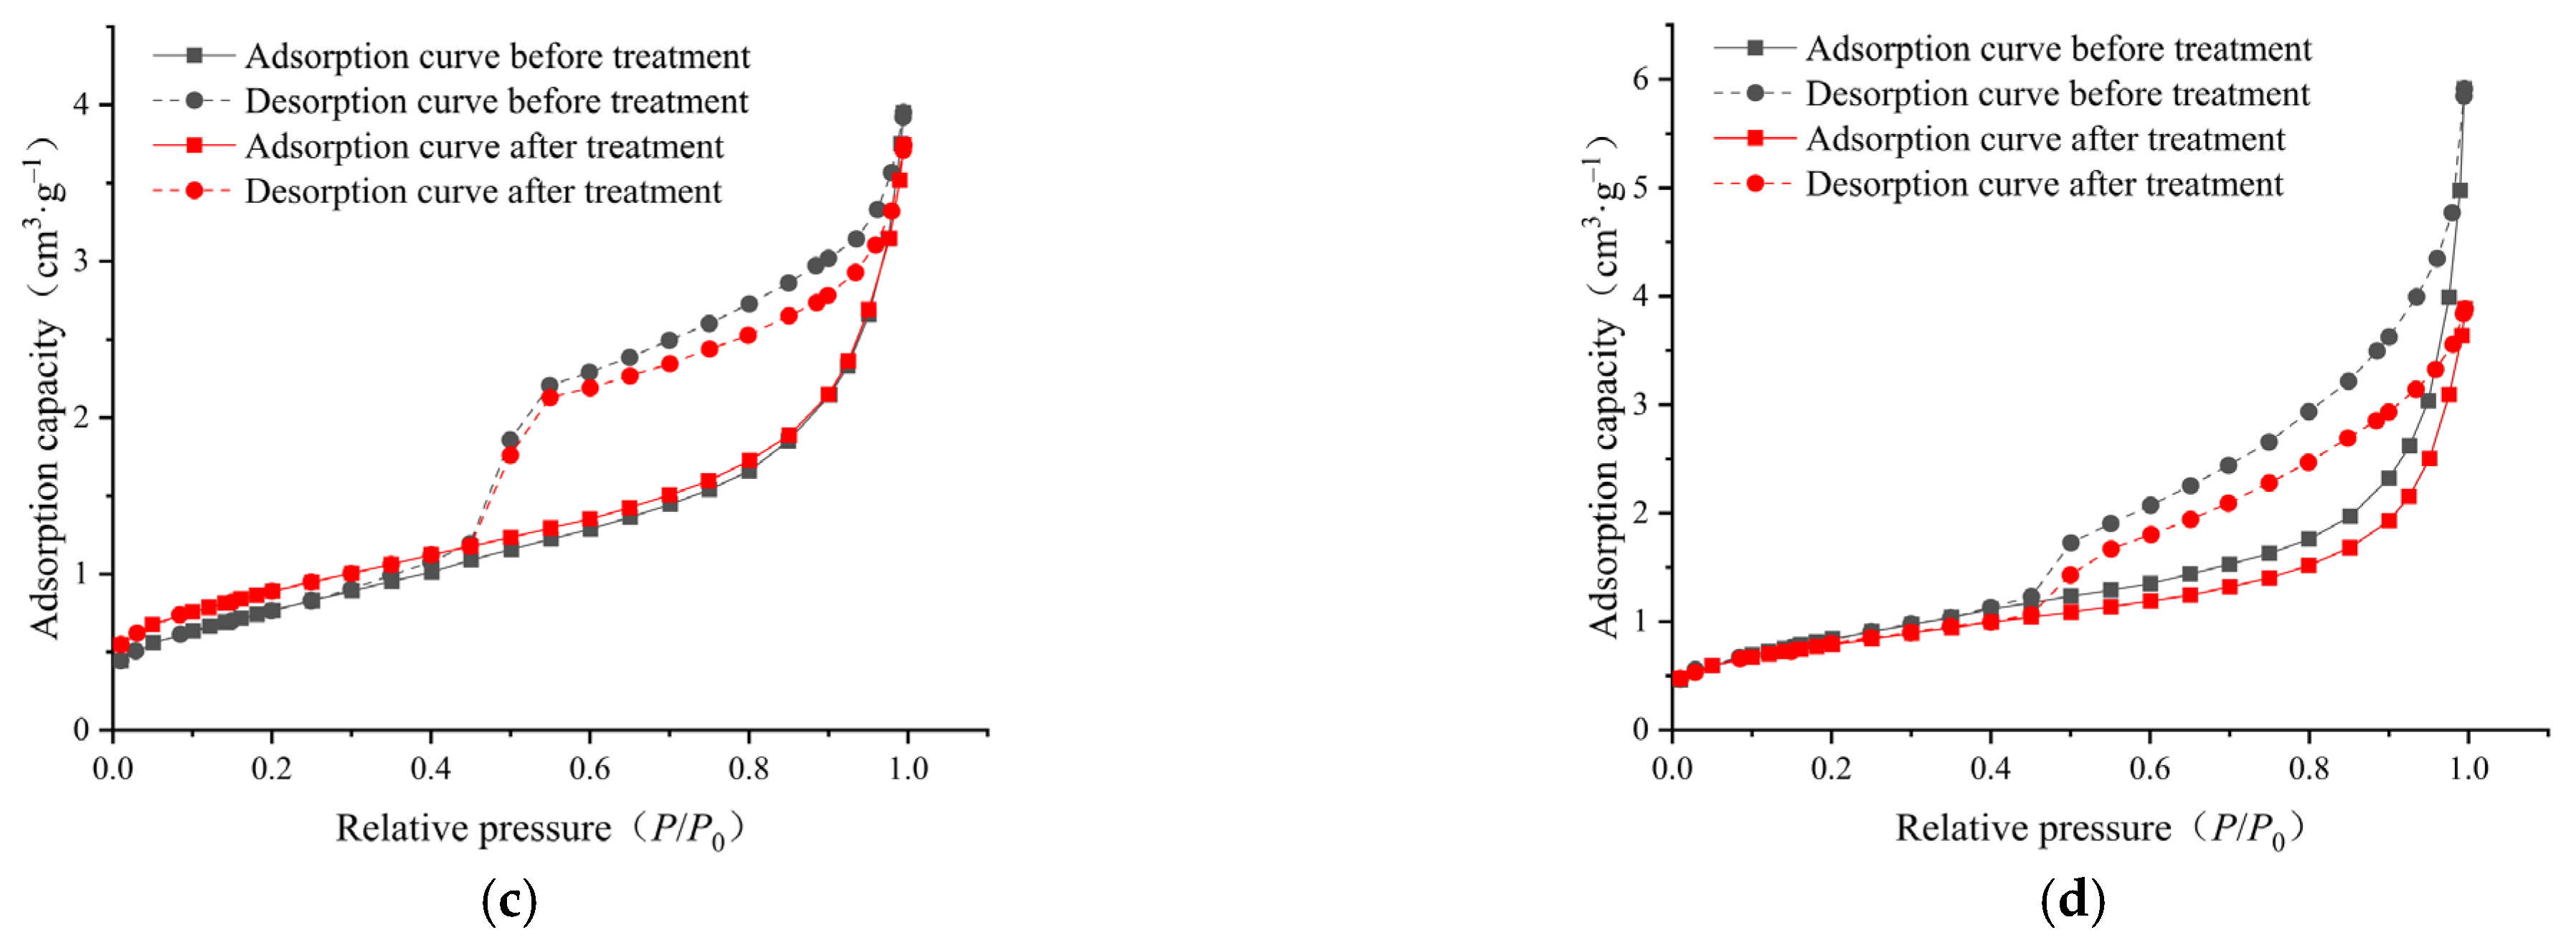
3.3. Pore Connectivity and Its Evolution
3.4. Mechanism of Pore Structure Evolution
4. Conclusions
- (1)
- The pore volume distributions of the tight sandstone samples used in the experiment were relatively uniform. The pore-specific surface areas of the samples were mainly concentrated in micropore and transitional pore, while the proportions of mesopores and macropores were minimal. After the ScCO2–H2O treatment, specifically, the pore volumes and specific surface areas in the micropores and transitional pores decreased, while those in the mesopores and macropores increased. Moreover, the trends of pore volumes and pore-specific surface areas were found to be similar.
- (2)
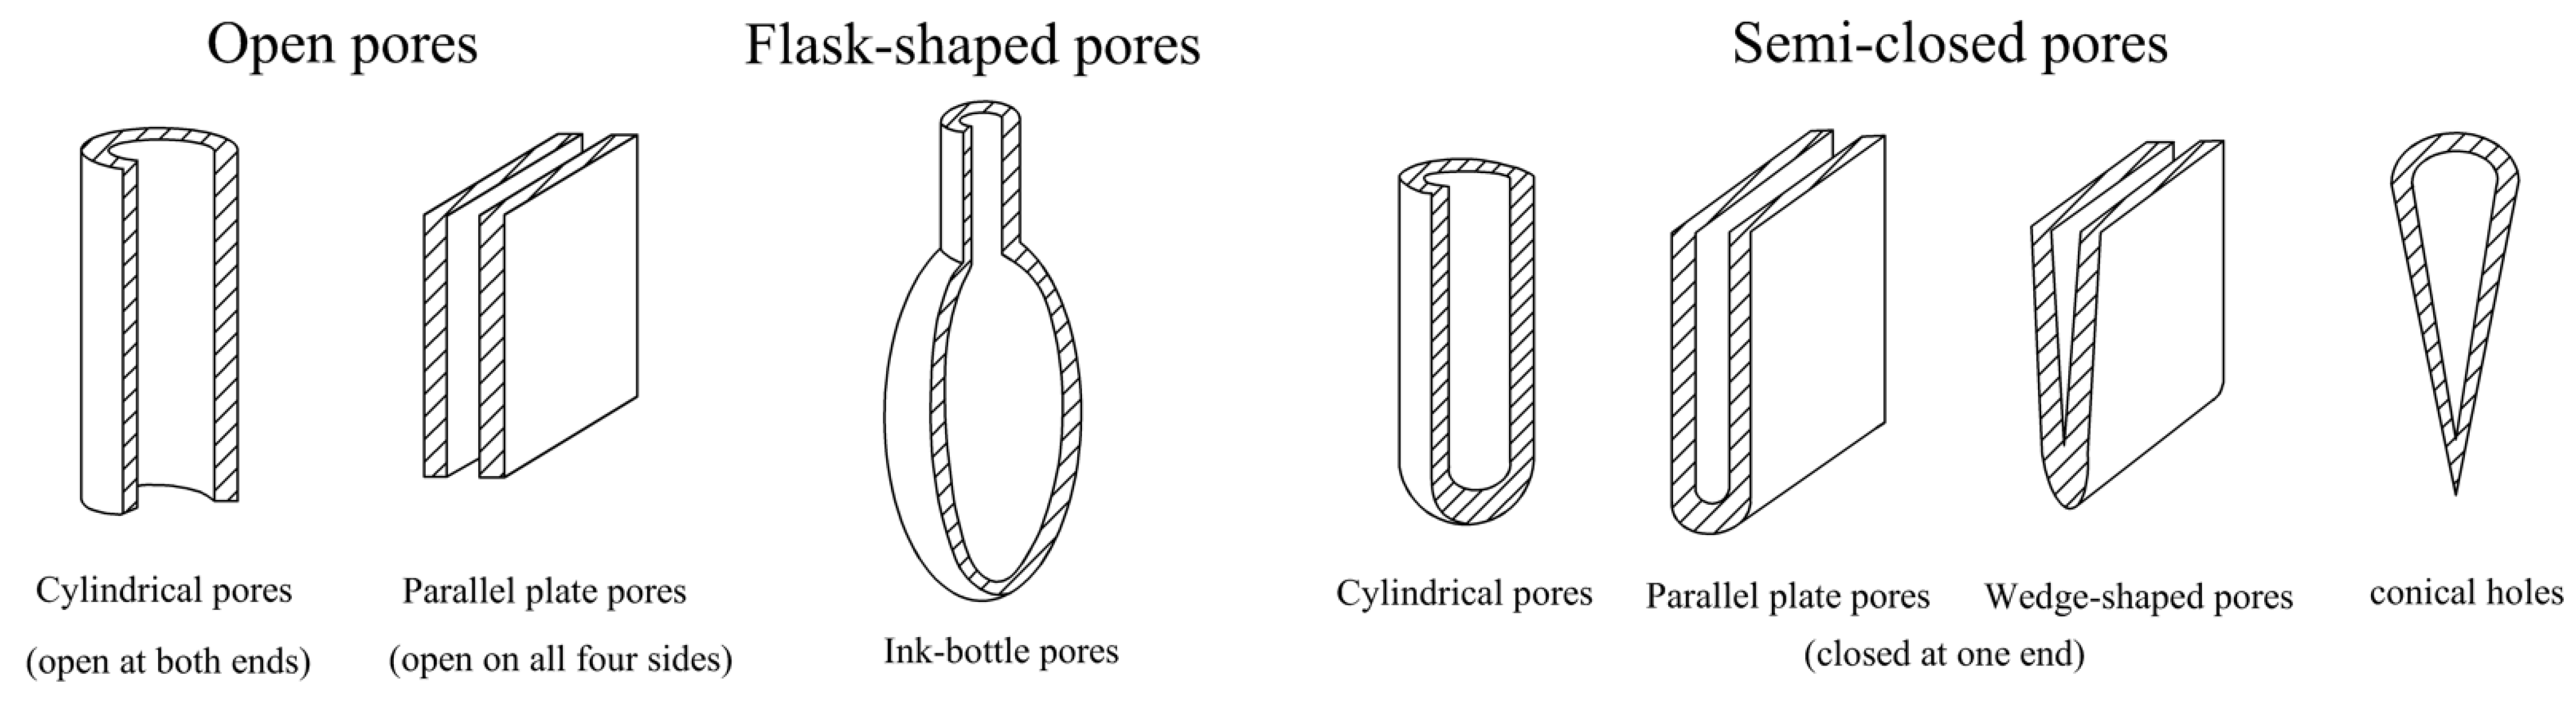
- In the micropores and transitional pores, the pores of the samples before and after ScCO2–H2O treatment were mainly open pores and ink-bottle-like fine-necked pores, and some semi-open pores were also present. After the ScCO2–H2O treatment, some of the pores changed from open pores and ink-bottle-shaped pores to semi-closed pores, and the pore morphology became narrower. Consequently, the pore connectivity might have also deteriorated.
- (3)
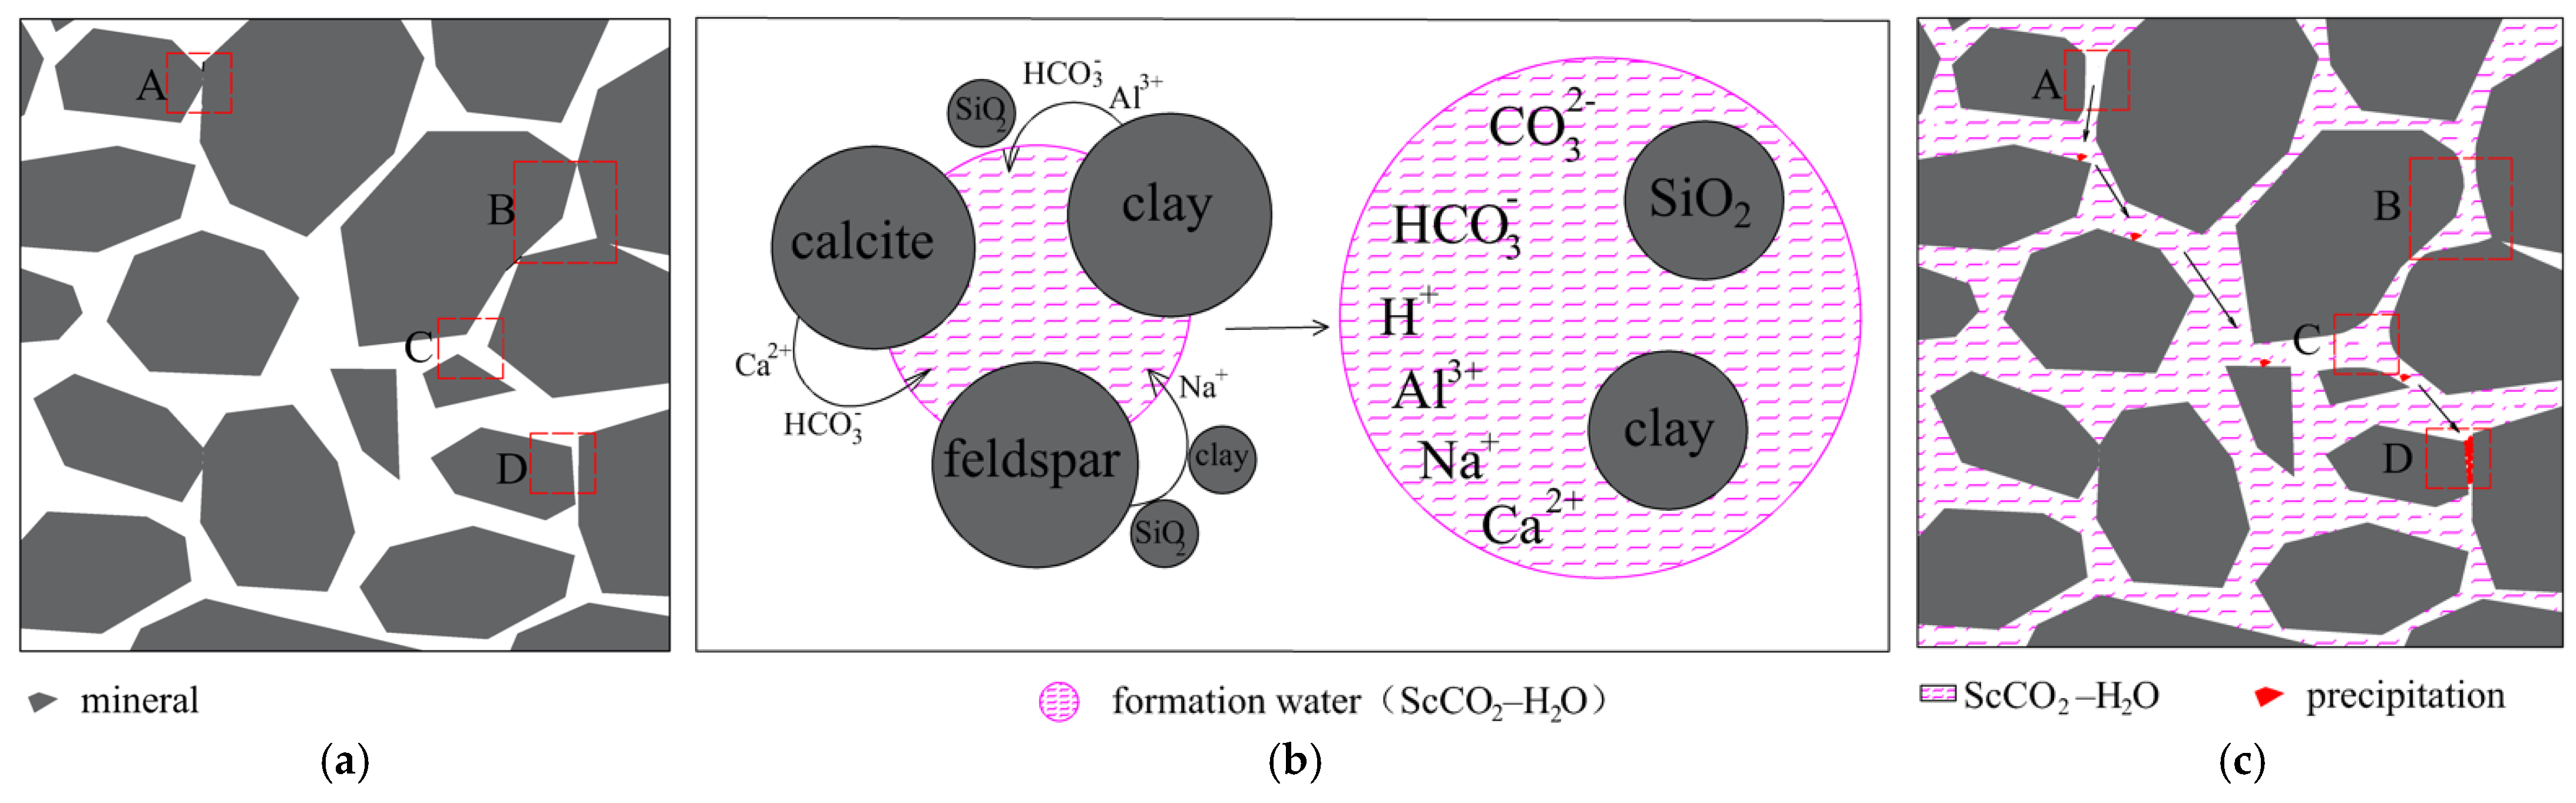
- A pore structure evolution model of ScCO2–H2O-treated tight sandstones was proposed. The evolution of the pore structure was a consequence of chemical reactions. The pore-expanding effect brought about by mineral dissolution and the precipitation effect of secondary minerals cooperate with each other and jointly play a controlling role in the pore structure evolution.
Author Contributions
Funding
Data Availability Statement
Acknowledgments
Conflicts of Interest
References
- Fawad, M.; Mondol, N.H. Monitoring geological storage of CO2 using a new rock physics model. Sci. Rep. 2022, 12, 297. [Google Scholar] [CrossRef]
- Jia, A.L.; Wei, Y.S.; Guo, Z.; Wang, G.T.; Meng, D.W.; Hang, S.Q. Current status and prospects of tight sandstone gas development in China. Nat. Gas Ind. 2022, 42, 83–92. [Google Scholar]
- Seyyedi, M.; Mahmud, H.K.B.; Verrall, M.; Giwelli, A. Pore Structure Changes Occur During CO2 Injection into Carbonate Reservoirs. Sci. Rep. 2020, 10, 3624. [Google Scholar] [CrossRef]
- Ma, R.S.; Tian, S.X.; Lin, H.Y.; Xu, S.Q.; Su, W.W.; Xie, H.F. Comparative study on gas adsorption characteristics of outburst hole tectonic coal and primary structure coal. Saf. Coal Mines 2021, 52, 16–21. [Google Scholar]
- Zeng, H.B.; Wang, F.R.; Luo, J.; Tao, T.; Wu, S.Q. Characterization of pore structure characteristics of inter-salt shale oil reservoirs in Qianjiang Sag based on low-temperature nitrogen adsorption and high-pressure mercury intrusion. Bull. Geol. Sci. Technol. 2021, 40, 242–252. [Google Scholar]
- Chen, J.; Zhou, G.Y.; Zhao, X.L.; He, C. Review of research methods for pore structure characteristics of reservoir rocks. Spec. Oil Gas Reserv. 2005, 12, 11–14+103. [Google Scholar]
- Liu, Z.Y.; Yuan, H.B. Characteristics of microscopic pore structure of Chang 6-2 oil layer group reservoir in Well Block 294 of Nanniwan Oil Production Plant. Inn. Mong. Petrochem. Ind. 2017, 43, 121–124. [Google Scholar]
- Barrett, E.P.; Joyner, L.G.; Halenda, P.P. The Determination of Pore Volume and Area Distributions in Porous Substances. I. Computations from Nitrogen Isotherms. J. Am. Chem. Soc. 1951, 73, 373–380. [Google Scholar] [CrossRef]
- Davidson, J.A. Mercury porosimetry studies II. The application of mercury porosimetry to porous polymer powders. Powder Technol. 1979, 23, 239–244. [Google Scholar] [CrossRef]
- Zheng, S.J.; Yao, Y.B.; Zhang, S.S.; Liu, Y.; Yang, J.H. Insights into Multifractal Characterization of Coals by Mercury Intrusion Porosimetry. Energies 2019, 12, 4743. [Google Scholar] [CrossRef]
- Xiao, L.Z. Nuclear Magnetic Resonance Imaging Logging and Rock Nuclear Magnetic Resonance and Its Applications; Science Press: Beijing, China, 1998; pp. 22–41. [Google Scholar]
- Gao, Q.Y.; Wang, X.; Gao, J.Y.; Yan, W.C. Analysis of Influencing Factors of Nuclear Magnetic Resonance Porosity of Tight Cores. Well Logging Technol. 2021, 45, 424–430. [Google Scholar]
- Li, N.N.; Liu, H.H.; Sang, S.X. Comparative study on pore size distribution in coal based on combined mercury intrusion-low temperature liquid nitrogen pore connection and nuclear magnetic resonance analysis. Saf. Coal Mines 2024, 55, 1–9. [Google Scholar]
- Xiao, N.; Li, S.; Lin, M.Q. Variation Characteristics of the Apparent Morphology and Permeability of Rocks after the Interaction of CO2-Water-Calcite. Sci. Technol. Eng. 2017, 17, 38–44. [Google Scholar]
- Yang, S.G.; Cai, M.Y.; Zhang, K.F.; Cao, D.D.; Zhao, X.L.; Liu, S.X. Research Progress and Prospect of the Influence of CO2-Water-Rock Interaction on the Physical Properties of CO2 Geological Storage Bodies. Pet. Geol. Recovery Effic. 2023, 30, 80–91. [Google Scholar]
- Li, F.S. Study on the Dissolution Mechanism during CO2 Geological Storage. China Univ. Geosci. 2019, 2, 69. [Google Scholar]
- Hou, L.H.; Yu, Z.C.; Luo, X.; Wu, S.T. Self-sealing of caprocks during CO2 geological sequestration. Energy 2022, 252, 124064. [Google Scholar] [CrossRef]
- Ren, L.; Yu, Z.H.; Zhao, J.Z.; Lin, R.; Wu, J.F.; Song, Y.; Xie, M.K. Influence of carbonate dissolution on flow characteristics of tight sandstone reservoirs: A case study of Chang 6 tight sandstone in Ordos Basin. Pet. Geol. Oilfield Dev. Daqing 2023, 42, 50–58. [Google Scholar]
- Ozotta, O.; Liu, K.; Gentzis, T.; Carvajal-Ortiz, H.; Liu, B.; Rafieepour, S.; Ostadhassan, M. Pore Structure Alteration of Organic-Rich Shale with Sc-CO2 Exposure: The Bakken Formation. Energy Fuels 2021, 35, 5074–5089. [Google Scholar] [CrossRef]
- Chen, R.; Zhang, Y.J.; Hu, K.P.; Tu, G.L.; Dou, T.Z. Changes in Physicochemical Properties of Coal and Their Mechanism Due to Supercritical CO2–H2O Treatment. Minerals 2023, 13, 1262. [Google Scholar] [CrossRef]
- Huang, H.; Sun, Q.; Geng, J.; Pan, Y.; Yang, D.; Zhang, L. Effects of CO2–water–rock cycling cycles on sandstone pore structure. Front. Energy Res. 2024, 12, 1485241. [Google Scholar] [CrossRef]
- Shi, X.; Xiao, C.Y.; Ni, H.J.; Gao, Q.; Han, L.; Xiao, D.S.; Jiang, S. Pore structure and pore size change for tight sandstone treated with supercritical CO2 fluid. Energy Rep. 2023, 9, 2286–2299. [Google Scholar] [CrossRef]
- Qi, L.L.; Zhou, X.Q.; Peng, X.S.; Wang, Z.F.; Dai, J.H. Study on pore structure of coking coal based on low temperature nitrogen adsorption and mercury intrusion method. Saf. Coal Mines 2022, 53, 1–6+13. [Google Scholar]
- Lowell, S.; Shields, J.E.; Thomas, M.A. Characterization of Porous Solids and Powders: Surface Area, Pore Size, and Density; Springer: Berlin/Heidelberg, Germany, 2004. [Google Scholar]
- Tang, Y.Z.; Wang, P.F.; Sao, Z.D. Mercury injection experiment and error analysis. Exp. Technol. Manag. 2015, 32, 50–54. [Google Scholar]
- Vanerp, S.T.; Martens, A.J. A standardization for BET fitting of adsorption isotherms. Microporous Mesoporous Mater. 2011, 145, 188–193. [Google Scholar] [CrossRef]
- Zhong, L.W.; Zhang, H.; Yuan, Z.R. Influence of Specific Surface Area and Pore Volume of Coal on Its Adsorption Capacity. Coal Geol. Explor. 2002, 30, 26–29. [Google Scholar]
- Hodot, B.B. Coal and Gas Outburst; Song, S.Z.; Wang, Y.A., Translators; Coal Industry Press: Beijing, China, 1966; pp. 27–30. [Google Scholar]
- Chen, R.; Qin, Y.; Wei, C.T. Pore structure and adsorption difference of vitrain by two-stage extraction with organic solvents. Nat. Gas Geosci. 2014, 25, 1103–1110. [Google Scholar]
- Chen, Y.L.; Qin, Y.; Tian, H.; Tang, J.X. Grain size effect of anthracite pore structure based on mercury intrusion porosimetry. Nat. Gas Geosci. 2015, 26, 1629–1639. [Google Scholar]
- Yang, M.; Liu, L.; Liu, J.J.; Mao, R.J.; Cai, P. Study on joint characterization of structure of middle-rank coal by nitrogen adsorption-mercury intrusion-NMR. Coal Sci. Technol. 2021, 49, 67–74. [Google Scholar]
- Feng, X.L.; Huang, W.H.; Ao, W.H.; Lu, X.X.; Liu, B.; Xu, Q.L. Application of Q-type Principal Factor Analysis in the Evaluation of Coal Reservoir Characteristics in the Southern Qinshui Basin. Coal Geol. China 2015, 27, 18–21+39. [Google Scholar]
- Thommes, M.; Kaneko, K.; Neimark, A.V.; Olivier, J.P.; Rodriguez-Reinoso, F.; Rouquerol, J.; Sing, K. Physisorption of gases, with special reference to the evaluation of surface area and pore size distribution (IUPAC Technical Report). Pure Appl. Chem. 2015, 87, 1051–1069. [Google Scholar] [CrossRef]
- Chen, P.; Tang, X.Y. The research on the adsorption of nitrogen in low temperature and micro-pore properties in coal. J. China Coal Soc. 2001, 26, 552–556. [Google Scholar]
- Li, X.Y.; Shao, Y.B.; Zhu, Y.Z.; Zou, M.J.; Xu, X.T. Fractal characteristics of coal rock pores based on low-temperature liquid nitrogen adsorption method. Sci. Technol. Eng. 2022, 22, 65–70. [Google Scholar]
- Li, W.; Li, J.; Hu, C.; Xiao, Q. Research on Pore-Fracture Characteristics and Adsorption Performance of Main Coal Seams in Lvjiatuo Coal Mine. Processes 2023, 11, 1700. [Google Scholar] [CrossRef]
- Zhang, D.X.; Song, J. Mechanisms for geological carbon sequestration. Procedia IUTAM 2014, 10, 19–27. [Google Scholar] [CrossRef]
- Meng, F.Q.; Li, C.B.; Liu, L.; Zhou, B.; Zhao, S.; Wang, L.J.; Yu, M.; Yu, Z.C. Experiment on the interaction of CO2-saline water-calcite. Geol. Sci. Technol. Inf. 2013, 32, 171–176. [Google Scholar]
- Tutolo, M.B.; Luhmann, J.A.; Kong, X.Z.; Saar, O.M.; Seyfried, E.W. CO2 sequestration in feldspar-rich sandstone: Coupled evolution of fluid chemistry, mineral reaction rates, and hydrogeochemical properties. Geochim. Cosmochim. Acta 2015, 160, 132–154. [Google Scholar] [CrossRef]
- Harvey, O.R.; Qafoku, N.P.; Cantrell, K.J.; Lee, G.; Amonette, J.E.; Brown, C.F. Geochemical implications of gas leakage associated with geologic CO2 storage: A qualitative review. Environ. Sci. Technol. 2013, 47, 23–36. [Google Scholar] [CrossRef]
- Cai, Y.D.; Liu, D.M.; Pan, Z.J.; Che, Y.; Liu, Z.H. Investigating the effects of seepage-pores and fractures on coal permeability by fractal analysis. Transp. Porous Media 2016, 111, 479–497. [Google Scholar] [CrossRef]


| Sample | Before/After Treatment | Pore Volume (cm3·g−1) | Ratio of Pore Volume (%) | |||||||
|---|---|---|---|---|---|---|---|---|---|---|
| Vmi | Vtr | Vme | Vma | Vt | Vmi/Vt | Vtr/Vt | Vme/Vt | Vma/Vt | ||
| SS | Before | 5.1 × 10⁻³ | 4.5 × 10⁻³ | 4.7 × 10⁻³ | 5.8 × 10⁻³ | 2.01 × 10⁻² | 25.46 | 22.34 | 23.22 | 28.98 |
| After | 4.0 × 10⁻³ | 4.2 × 10⁻³ | 5.3 × 10⁻³ | 7.9 × 10⁻³ | 2.14 × 10⁻² | 18.63 | 19.57 | 24.77 | 37.03 | |
| XLS | Before | 6.3 × 10⁻³ | 4.4 × 10⁻³ | 3.3 × 10⁻³ | 3.0 × 10⁻³ | 1.70 × 10⁻² | 37.03 | 25.92 | 19.32 | 17.73 |
| After | 2.6 × 10⁻³ | 3.6 × 10⁻³ | 3.2 × 10⁻³ | 4.7 × 10⁻³ | 1.41 × 10⁻² | 18.27 | 25.55 | 22.63 | 33.56 | |
| MGS | Before | 4.5 × 10⁻³ | 1.6 × 10⁻³ | 2.1 × 10⁻³ | 3.9 × 10⁻³ | 1.21 × 10⁻² | 37.23 | 12.82 | 17.71 | 32.24 |
| After | 4.0 × 10⁻³ | 1.5 × 10⁻³ | 2.6 × 10⁻³ | 4.4 × 10⁻³ | 1.25 × 10⁻² | 31.59 | 12.28 | 20.68 | 35.45 | |
| CGS | Before | 4.2 × 10⁻³ | 3.5 × 10⁻³ | 2.9 × 10⁻³ | 2.5 × 10⁻³ | 1.31 × 10⁻² | 32.30 | 26.68 | 22.26 | 18.76 |
| After | 3.5 × 10⁻³ | 2.0 × 10⁻³ | 3.6 × 10⁻³ | 3.3 × 10⁻³ | 1.24 × 10⁻² | 28.23 | 16.35 | 28.83 | 26.59 | |
| Sample | Before/After Treatment | Pore-Specific Surface Area (m2·g−1) | Ratio of Pore-Specific Surface Areas (%) | |||||||
|---|---|---|---|---|---|---|---|---|---|---|
| Smi | Str | Sme | Sma | St | Smi/St | Str/St | Sme/St | Sma/St | ||
| SS | Before | 4.1911 | 0.7051 | 0.0611 | 0.0092 | 4.9665 | 84.39 | 14.20 | 1.23 | 0.19 |
| After | 3.3197 | 0.6473 | 0.0672 | 0.0121 | 4.0463 | 82.04 | 16.00 | 1.66 | 0.30 | |
| XLS | Before | 5.1571 | 0.7273 | 0.0326 | 0.0044 | 5.9214 | 87.09 | 12.28 | 0.55 | 0.07 |
| After | 2.0492 | 0.5636 | 0.0395 | 0.0066 | 2.6589 | 77.07 | 21.20 | 1.49 | 0.25 | |
| MGS | Before | 4.0513 | 0.2487 | 0.0194 | 0.0065 | 4.3259 | 93.65 | 5.75 | 0.45 | 0.15 |
| After | 3.6375 | 0.2369 | 0.0307 | 0.0076 | 3.9127 | 92.97 | 6.05 | 0.79 | 0.19 | |
| CGS | Before | 3.3754 | 0.5812 | 0.0332 | 0.0033 | 3.9931 | 84.53 | 14.55 | 0.83 | 0.08 |
| After | 2.8221 | 0.3775 | 0.0378 | 0.0055 | 3.2429 | 87.03 | 11.64 | 1.16 | 0.17 | |
| Type | Chemical Reaction Equation | Reference |
|---|---|---|
| CO2 | CO2 + H2O → H2CO3 | [37] |
| H2CO3 → H+ + | [37] | |
| Calcite | CaCO3 + H+ → Ca2+ + | [38] |
| Siderite | FeCO3 + H+ → Fe2+ + | [38] |
| Albite | 2NaAlSi3O8 + H2O + 2H+ → Al2Si2O5(OH)4 + 4SiO2 + 2Na+ | [39] |
| Kaolinite | Al2Si2O5(OH)4 + 6H+ → 2Al3+ + 2SiO2 + 5H2O | [40] |
Disclaimer/Publisher’s Note: The statements, opinions and data contained in all publications are solely those of the individual author(s) and contributor(s) and not of MDPI and/or the editor(s). MDPI and/or the editor(s) disclaim responsibility for any injury to people or property resulting from any ideas, methods, instructions or products referred to in the content. |
© 2025 by the authors. Licensee MDPI, Basel, Switzerland. This article is an open access article distributed under the terms and conditions of the Creative Commons Attribution (CC BY) license (https://creativecommons.org/licenses/by/4.0/).
Share and Cite
Chen, R.; Dou, T.; Shi, X.; Lin, M.; Yang, Q. Mechanism of Pore Structure Evolution in Tight Sandstone Subjected to ScCO2–H2O Treatment. Processes 2025, 13, 896. https://doi.org/10.3390/pr13030896
Chen R, Dou T, Shi X, Lin M, Yang Q. Mechanism of Pore Structure Evolution in Tight Sandstone Subjected to ScCO2–H2O Treatment. Processes. 2025; 13(3):896. https://doi.org/10.3390/pr13030896
Chicago/Turabian StyleChen, Run, Tianzheng Dou, Xiaowei Shi, Meng Lin, and Qingbao Yang. 2025. "Mechanism of Pore Structure Evolution in Tight Sandstone Subjected to ScCO2–H2O Treatment" Processes 13, no. 3: 896. https://doi.org/10.3390/pr13030896
APA StyleChen, R., Dou, T., Shi, X., Lin, M., & Yang, Q. (2025). Mechanism of Pore Structure Evolution in Tight Sandstone Subjected to ScCO2–H2O Treatment. Processes, 13(3), 896. https://doi.org/10.3390/pr13030896