Article

Exploring Sustainable Mineralization Pathways: Multi-Factor Impacts on Microbial-Induced Carbonate Precipitation and Crystals Characteristics

by
Meng Xie
,
Junhui Zhang
,
Weiming Guan
*,
Guangming Shi
,
Fangcan Ji
,
Xichen Zhao
,
Xuewei Zhang
and
Xiaocheng Xia
School of Geology & Mining Engineering, Xinjiang University, Urumqi 830046, China
*
Author to whom correspondence should be addressed.
Processes 2025, 13(3), 711; https://doi.org/10.3390/pr13030711
Submission received: 8 December 2024 / Revised: 24 February 2025 / Accepted: 26 February 2025 / Published: 28 February 2025

Abstract

:
Microbial-induced calcium carbonate precipitation is an efficient and environmentally friendly soil stabilization technology. To explore the mineralization performance of carbonate precipitation, this study selects three factors, including the type of cementing solution (TCS), the cementing solution concentration (CSC), and the ratio of bacteria to cementing solution (B/C ratio), to investigate their effects on microbial mineralization. This study reveals the influence of each factor on the amount and rate of carbonate precipitation and analyzes the changes in the characteristics of carbonate precipitation crystals, such as the crystal diameter. The experimental results show that (1) the mineralization effect of magnesium ions and calcium ions results in higher precipitation amounts and rates than copper ions, with less environmental pollution. The concentration of the grout solution is positively correlated with the precipitation amount and negatively correlated with the precipitation rate, while the B/C ratio shows the opposite trend. (2) The crystal diameter of CaCO3 between crystals reduces as the B/C ratio decreases and the CSC increases. (3) The characteristics of MgCO3 crystals are mainly affected by the CSC. Both excessively high and low concentrations lead to an increase in crystal diameter. (4) The characteristics of CuCO3 crystals are relatively stable, with smaller crystal particles maintained at around 1 μm. This study can provide a reference for the reinforcement of different types of soils, offering optimal reinforcement solutions based on the required crystal size, carbonate generation amount, and generation rate. It reduces resource waste and unnecessary chemical use, providing a theoretical foundation for sustainable soil remediation and ecological construction.

Graphical Abstract

1. Introduction

Microbial-induced calcium carbonate precipitation (MICP) is a novel soil stabilization technology [1]. The principle of MICP is that through the metabolic activity of microorganisms, urease is produced, which can decompose urea to generate CO2 and NH3 ions [2,3]. The generated ammonia provides an alkaline environment, promoting the conversion of urea-derived carbon dioxide into carbonate ions. These carbonate ions combine with calcium, magnesium, and other ions to form precipitates [4,5]. The carbonate precipitates further promote the effects of particle cementation and pore filling, thereby improving the physical and mechanical properties of sandy soils [6]. Compared to traditional methods, microbial soil stabilization technology is more environmentally friendly, with a controllable reaction process, and offers better stabilization effects on the soil. This technology has significant implications for the restoration and reconstruction of ecological environments.
Research on the microbial-induced calcium carbonate precipitation (MICP) process has been carried out both domestically and internationally. In microbially induced calcite precipitation (MICP) experiments, bacteria capable of urease activity, which hydrolyze urea to release ammonia (NH3) and carbonate ions (CO32−), are typically employed. Commonly utilized species include Bacillus, Sporosarcina, and Streptococcus. Among these, Sporosarcina pasteurii is frequently selected due to its high urease activity, environmental adaptability, and superior precipitation efficiency and stability, making it a preferred choice for MICP applications. The precipitation process is influenced by various factors, including the bacterial solution concentration, pH, temperature, and type and concentration of the grout solution, among others [7,8,9,10]. The grout solution is one of the key factors in MICP experiments. Chen [11] found that when the grout solution contains calcium and magnesium ions in different molar ratios as additives, the amount and morphology of carbonate precipitates generated in the MICP reaction differ significantly, and the type of grout solution affects the mineralization process. Jiao [12] discovered that magnesium ions have a synergistic effect on microbial mineralization, which can increase bacterial activity to some extent. However, Li’s research found that under the same concentration of magnesium and calcium ions, the yield of magnesium carbonate was lower than that of calcium carbonate [13]. Moreover, the concentration of the grout solution also affects the mineralization efficiency. Studies have shown that moderate CSC can enhance urease activity, but when the concentration is too high, high concentrations of calcium ions inhibit bacterial urease activity, reducing the efficiency of calcium carbonate production [14,15,16]. In the reaction, bacteria provide nucleation sites for carbonate crystals and release large amounts of HCO3, CO32−, and OH ions by decomposing urea in the solution, providing the necessary ions and alkaline environment for carbonate formation. Therefore, the bacterial solution is also a key factor influencing the MICP experiment [17,18]. Luciani [19] found that higher bacterial solution concentrations led to increased calcium carbonate production and faster production rates, but the mineralization ability of individual bacteria decreased. Jarwar [20] studied the relationship between the bacterial solution concentration and the morphology of calcium carbonate crystals. They found that under low bacterial solution concentrations using Bacillus pasteurii to induce calcium carbonate, the crystals formed a more regular rhombohedral or cubic shape, while under high bacterial solution concentrations, the crystals were mostly spherical and exhibited agglomeration and overlap.
Currently, MICP technology is widely applied as a novel soil stabilization technology [21], and a unique microbial soil remediation theory and technology have been established [22,23]. However, the crystal size and characteristics of the carbonate precipitates induced by microorganisms are still not well understood, and no analysis has been conducted on selecting appropriate reaction conditions for different soil physico-chemical properties, which can lead to resource wastage and poor stabilization effects. Therefore, there is an urgent need to study the mineralization performance and crystal characteristics of microbial-induced carbonate precipitation under multiple factors.
In view of this, this study selects the TCS, CSC, and B/C ratio as key experimental factors to analyze the mechanisms by which each factor influences the amount and rate of precipitation. This study aims to determine the optimal reaction conditions for each TCS. Through microscopic observation, the sizes, gaps, and characteristics of the precipitate crystals are examined, and the effects of these factors on the crystal size and characteristics are investigated. This research addresses sustainability by leveraging the advantages of microbially induced carbonate precipitation (MICP) technology, which employs natural microorganisms, non-toxic chemicals, and mineral resources for soil reinforcement, thereby avoiding the environmental burden associated with traditional chemical methods. The reduction in resource waste and unnecessary chemical use, while improving the effectiveness of soil stabilization, simultaneously minimizes the impact on the environment and resources. The research results provide a theoretical foundation for sustainable soil remediation and ecological construction.

2. Materials and Methods

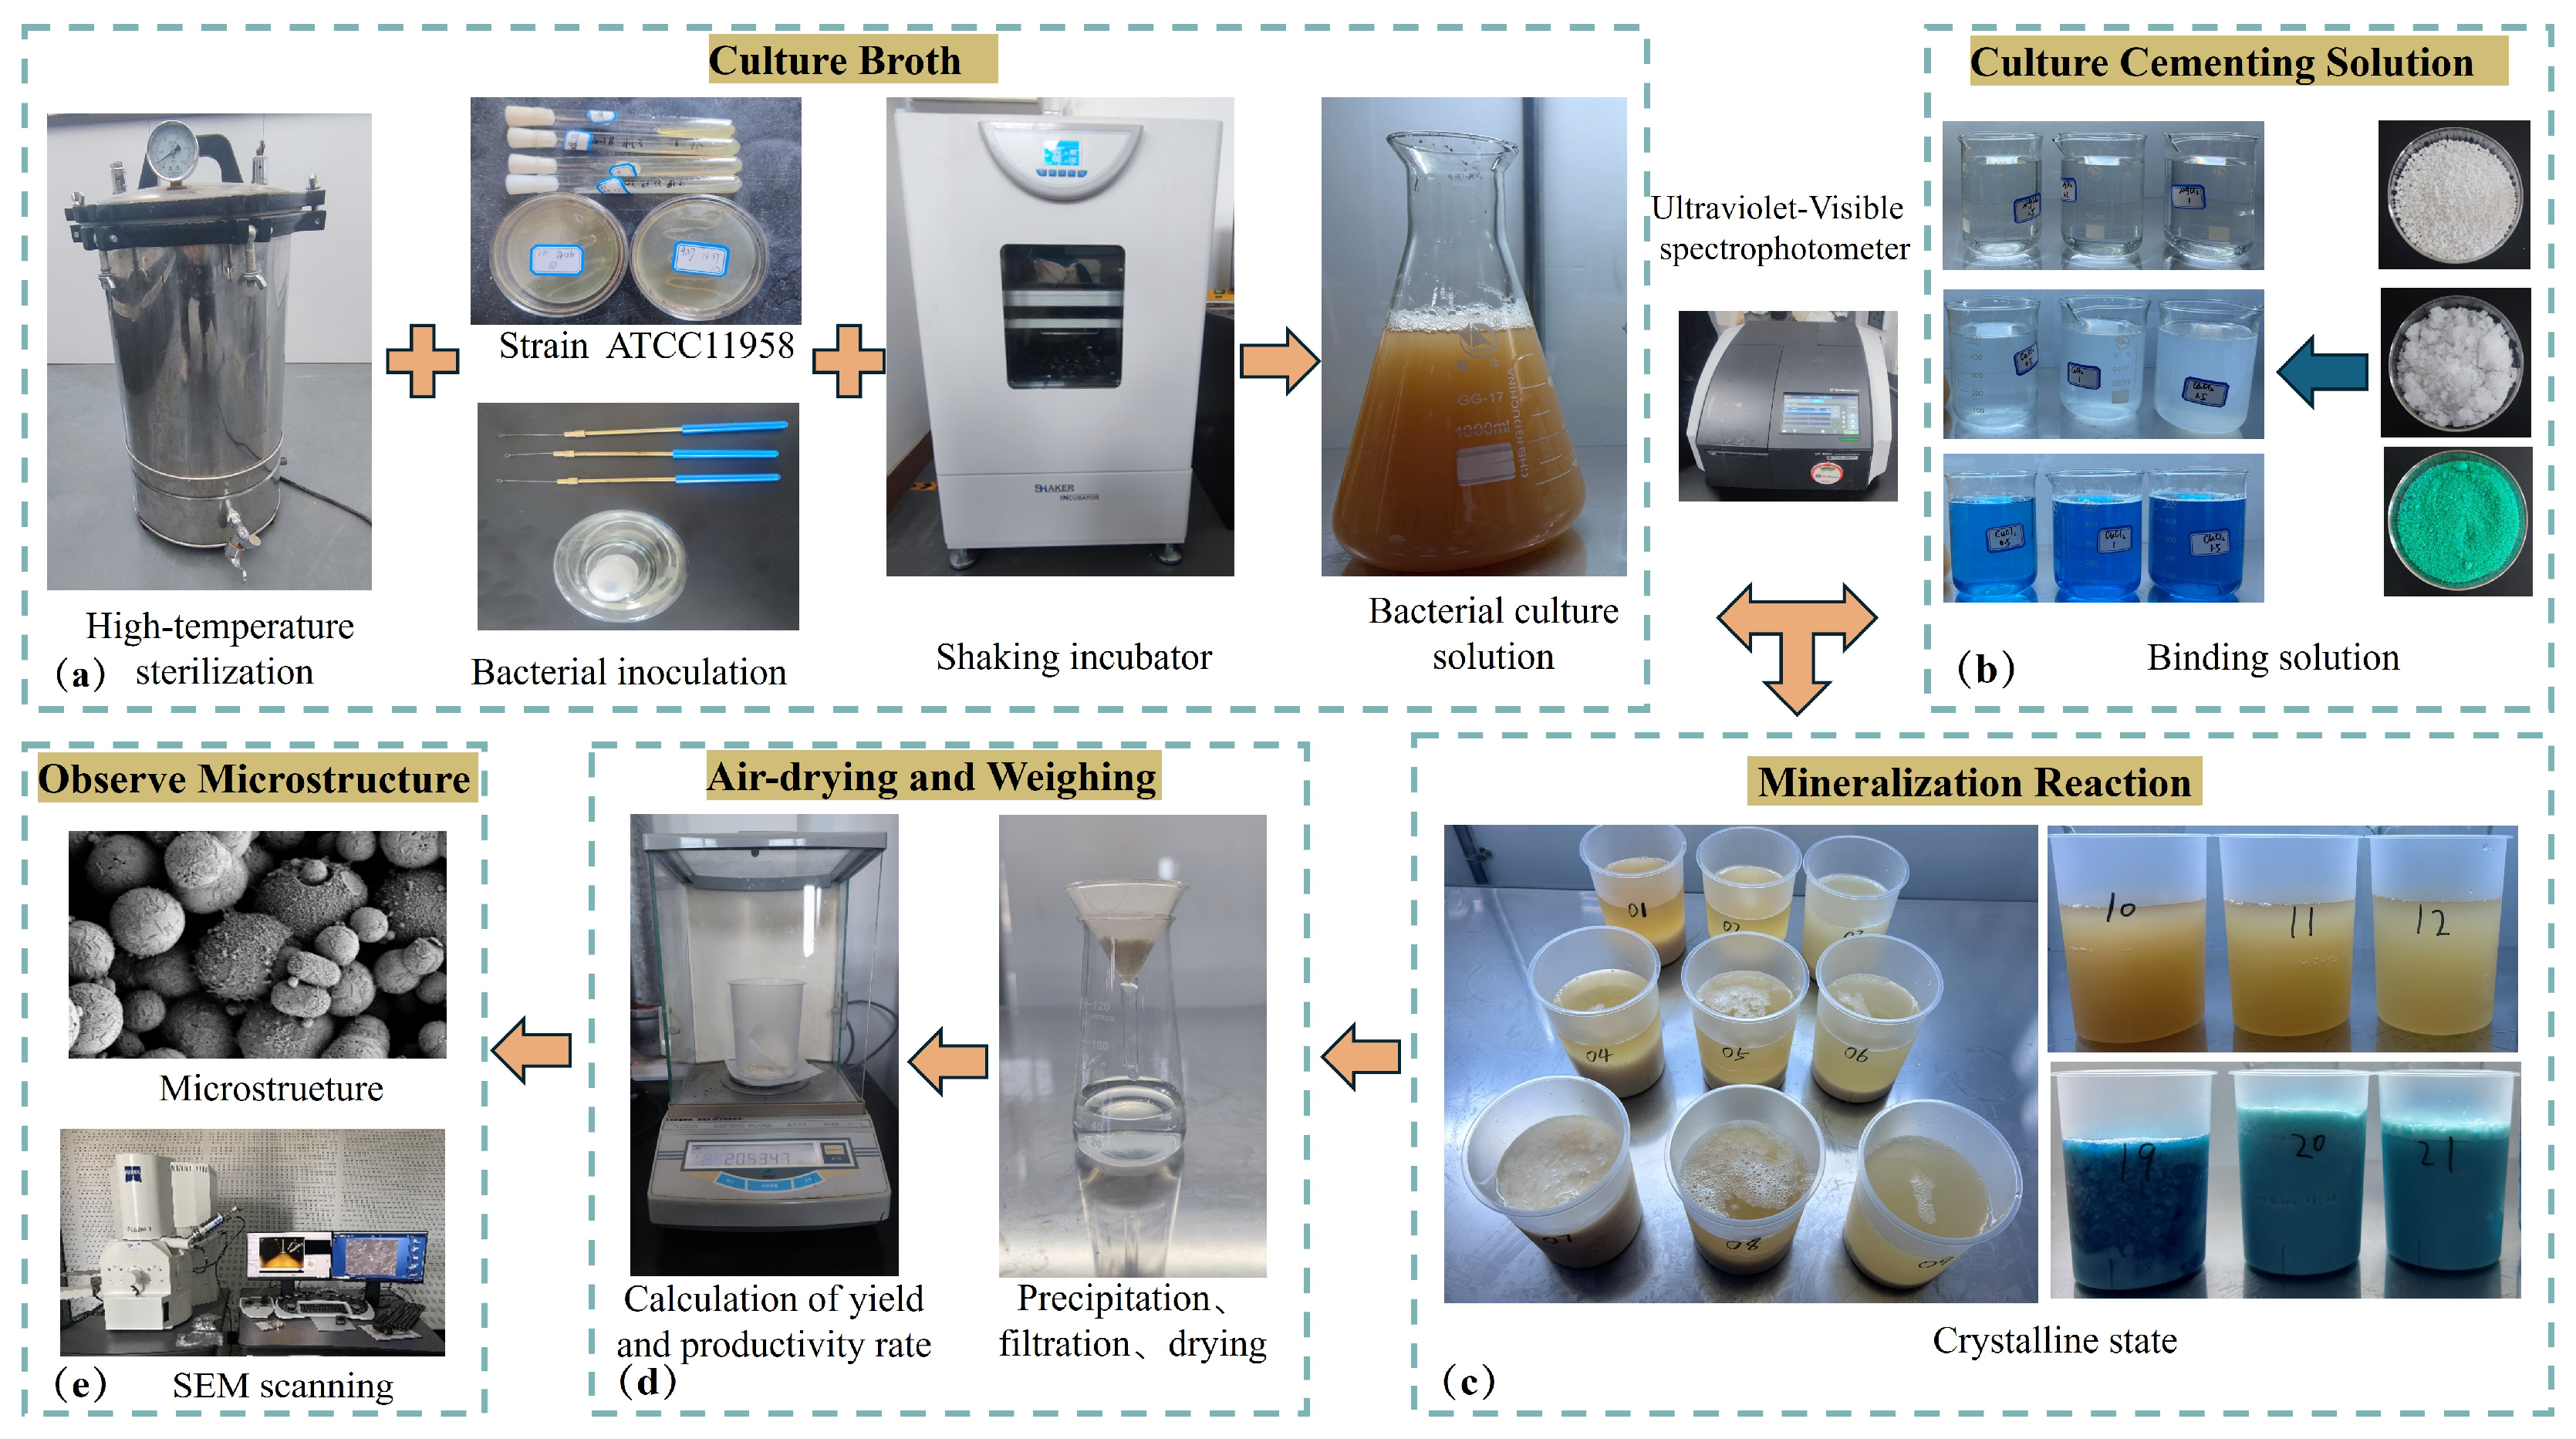
2.1. Preparation of Bacteria

The MICP mineralizing bacteria used in the experiment were Sporosarcina pasteurii, with strain number ATCC11958, purchased from the Guangdong Microbial Strain Preservation Center (Guangdong, China). Sporosarcina pasteurii is a chemolithoautotrophic, aerobic bacterium, with rod-shaped cells (2–3 μm in length) and an optimal growth temperature of 25–38 °C. It is alkaliphilic [24]. The screening culture medium contained urea (20 g/L), soybean peptone (5 g/L), casein peptone (15 g/L), and sodium chloride (5 g/L), which were sterilized by autoclaving at 120–125 °C for 20 min [25,26]. The bacteria were cultured in a shaking incubator at 30 °C and 180 rpm for 32 h. After cultivation, the bacterial concentration in the suspension was quantified by measuring the absorbance at 600 nm (OD600) using a UV-Vis spectrophotometer [27,28].
The grout solution for the bacteria was composed of urea, metal salts, and water. The grout solution significantly affects the amount, rate of precipitation, and microstructure of the mineralization products [29,30]. Magnesium ions (Mg2+), copper ions (Cu2+), and carbonate ions (CO32−) exhibit a strong affinity for binding, facilitating the precipitation process in microbially induced calcite precipitation (MICP) experiments. Therefore, these three ions were selected as components of the cementation solution in this study. The analytical-grade calcium chloride, magnesium chloride, copper chloride, and urea used in this experiment were all sourced from China National Pharmaceutical Group Corporation (Beijing, China). The water used in the experiment was purified water. The main instruments and equipment used in the experiment included a clean bench (Shanghai LiChen Instrument Technology Co., Ltd., Shanghai, China), a UV/Vis spectrophotometer (Shanghai YouKe Instrument Co., Ltd., Shanghai, China), a constant temperature shaker (Shanghai YiHeng Scientific Instrument Co., Ltd., Shanghai, China), and a vertical autoclave (Shanghai ShangPu Instrument Equipment Co., Ltd., Shanghai, China) [31,32].

2.2. Crystallization Principle

The carbonate ions generated during the hydrolysis process and the metal ions in the solution directly determine the yield of carbonate crystals [33,34]. Theoretically, the amount of CaCO3 produced is calculated based on the total amount of metal ions added during the experiment. Considering the influence of impurities on the actual mass of the carbonate product [35], the actual mass produced is compared with the theoretical mass. The theoretical yield of carbonate and the actual yield [36] are expressed by the following Equations (1) and (2):
m = C × V × Mr
Y = mactual/m
In the equation, m represents the theoretical yield of the carbonate, C denotes the molar concentration of the cementation solution, V is the volume of the cementation solution, Mr refers to the molar mass of the carbonate, Y is the actual yield of the carbonate, and m is the actual amount of the carbonate produced. The molar masses of CaCO3, MgCO3, and CuCO3 are 100.09 g/mol, 84.32 g/mol, and 123.56 g/mol, respectively.

2.3. Experimental Design

In this experiment, three variables—TCS, CSC, and B/C ratio—were selected to study the mineralization effect of Sporosarcina pasteurii. The experimental parameter ranges were determined based on previous research [37,38,39]. A three-factor, three-level experimental design was adopted, consisting of 27 groups in total.
Three types of TCSs were selected for the study: CaCl2, MgCl2, and CuCl2. The CSCs were set at 0.5 mol/L, 1.0 mol/L, and 1.5 mol/L. The total volume of bacterial solution and grout solution was 0.3 L, and the B/C ratio was set at 2:1, 1:1, and 1:2. The experimental design is shown in Table 1.
Nine experimental setups were designed for each of the three cementation solutions, CaCl2, MgCl2, and CuCl2, as detailed in Table 2. Each experimental condition was conducted in triplicate, and the average value of the results was used for analysis.
According to the design, the bacterial solution and grout solution were mixed, and the resulting mixture was placed in a reaction vessel to stand for 24 h. After that, the solution was filtered and air-dried, and the yield of the generated product was measured. Each experiment was repeated three times, and the average value was taken as the final data [40]. The experimental flowchart is shown in Figure 1.
Figure 1a illustrates the preparation of the bacterial culture. The medium is first sterilized at high temperature, followed by bacterial inoculation, and the culture is incubated under constant temperature and shaking to obtain the bacterial suspension. Figure 1b shows the preparation of the cementation solution, where the masses of CaCl2, MgCl2, and CuCl2 are measured, and cementation solutions with concentrations of 0.5 mol/L, 1.0 mol/L, and 1.5 mol/L are then prepared. Figure 1c depicts the MICP reaction process, where the experiments are conducted according to the experimental setup. Figure 1d outlines the procedure for calculating the amount of precipitate formed, which involves precipitation, filtration, drying, and subsequent weighing. Finally, Figure 1e presents the observation of the microstructure, where the precipitate samples are analyzed using scanning electron microscopy (SEM) and Energy Dispersive X-ray Spectroscopy (EDS) for a detailed microstructural analysis.

2.4. Microscopic Experimentation

The precipitate, after being measured and weighed, was sampled and gold-coated with a thickness of generally 1–2 cm. The XRD analysis was conducted using the Rigaku SmartLab SE (Tokyo, Japan), and the composition of the product was determined based on the XRD diffraction patterns. The microscopic morphology of the precipitates from each experimental setup was observed using a Zeiss Sigma 300 high-resolution field emission scanning electron microscope (SEM, Carl Zeiss AG, Oberkochen, Germany). The analysis focused on the crystal surface morphology and crystals size [41,42].

3. Results and Discussion

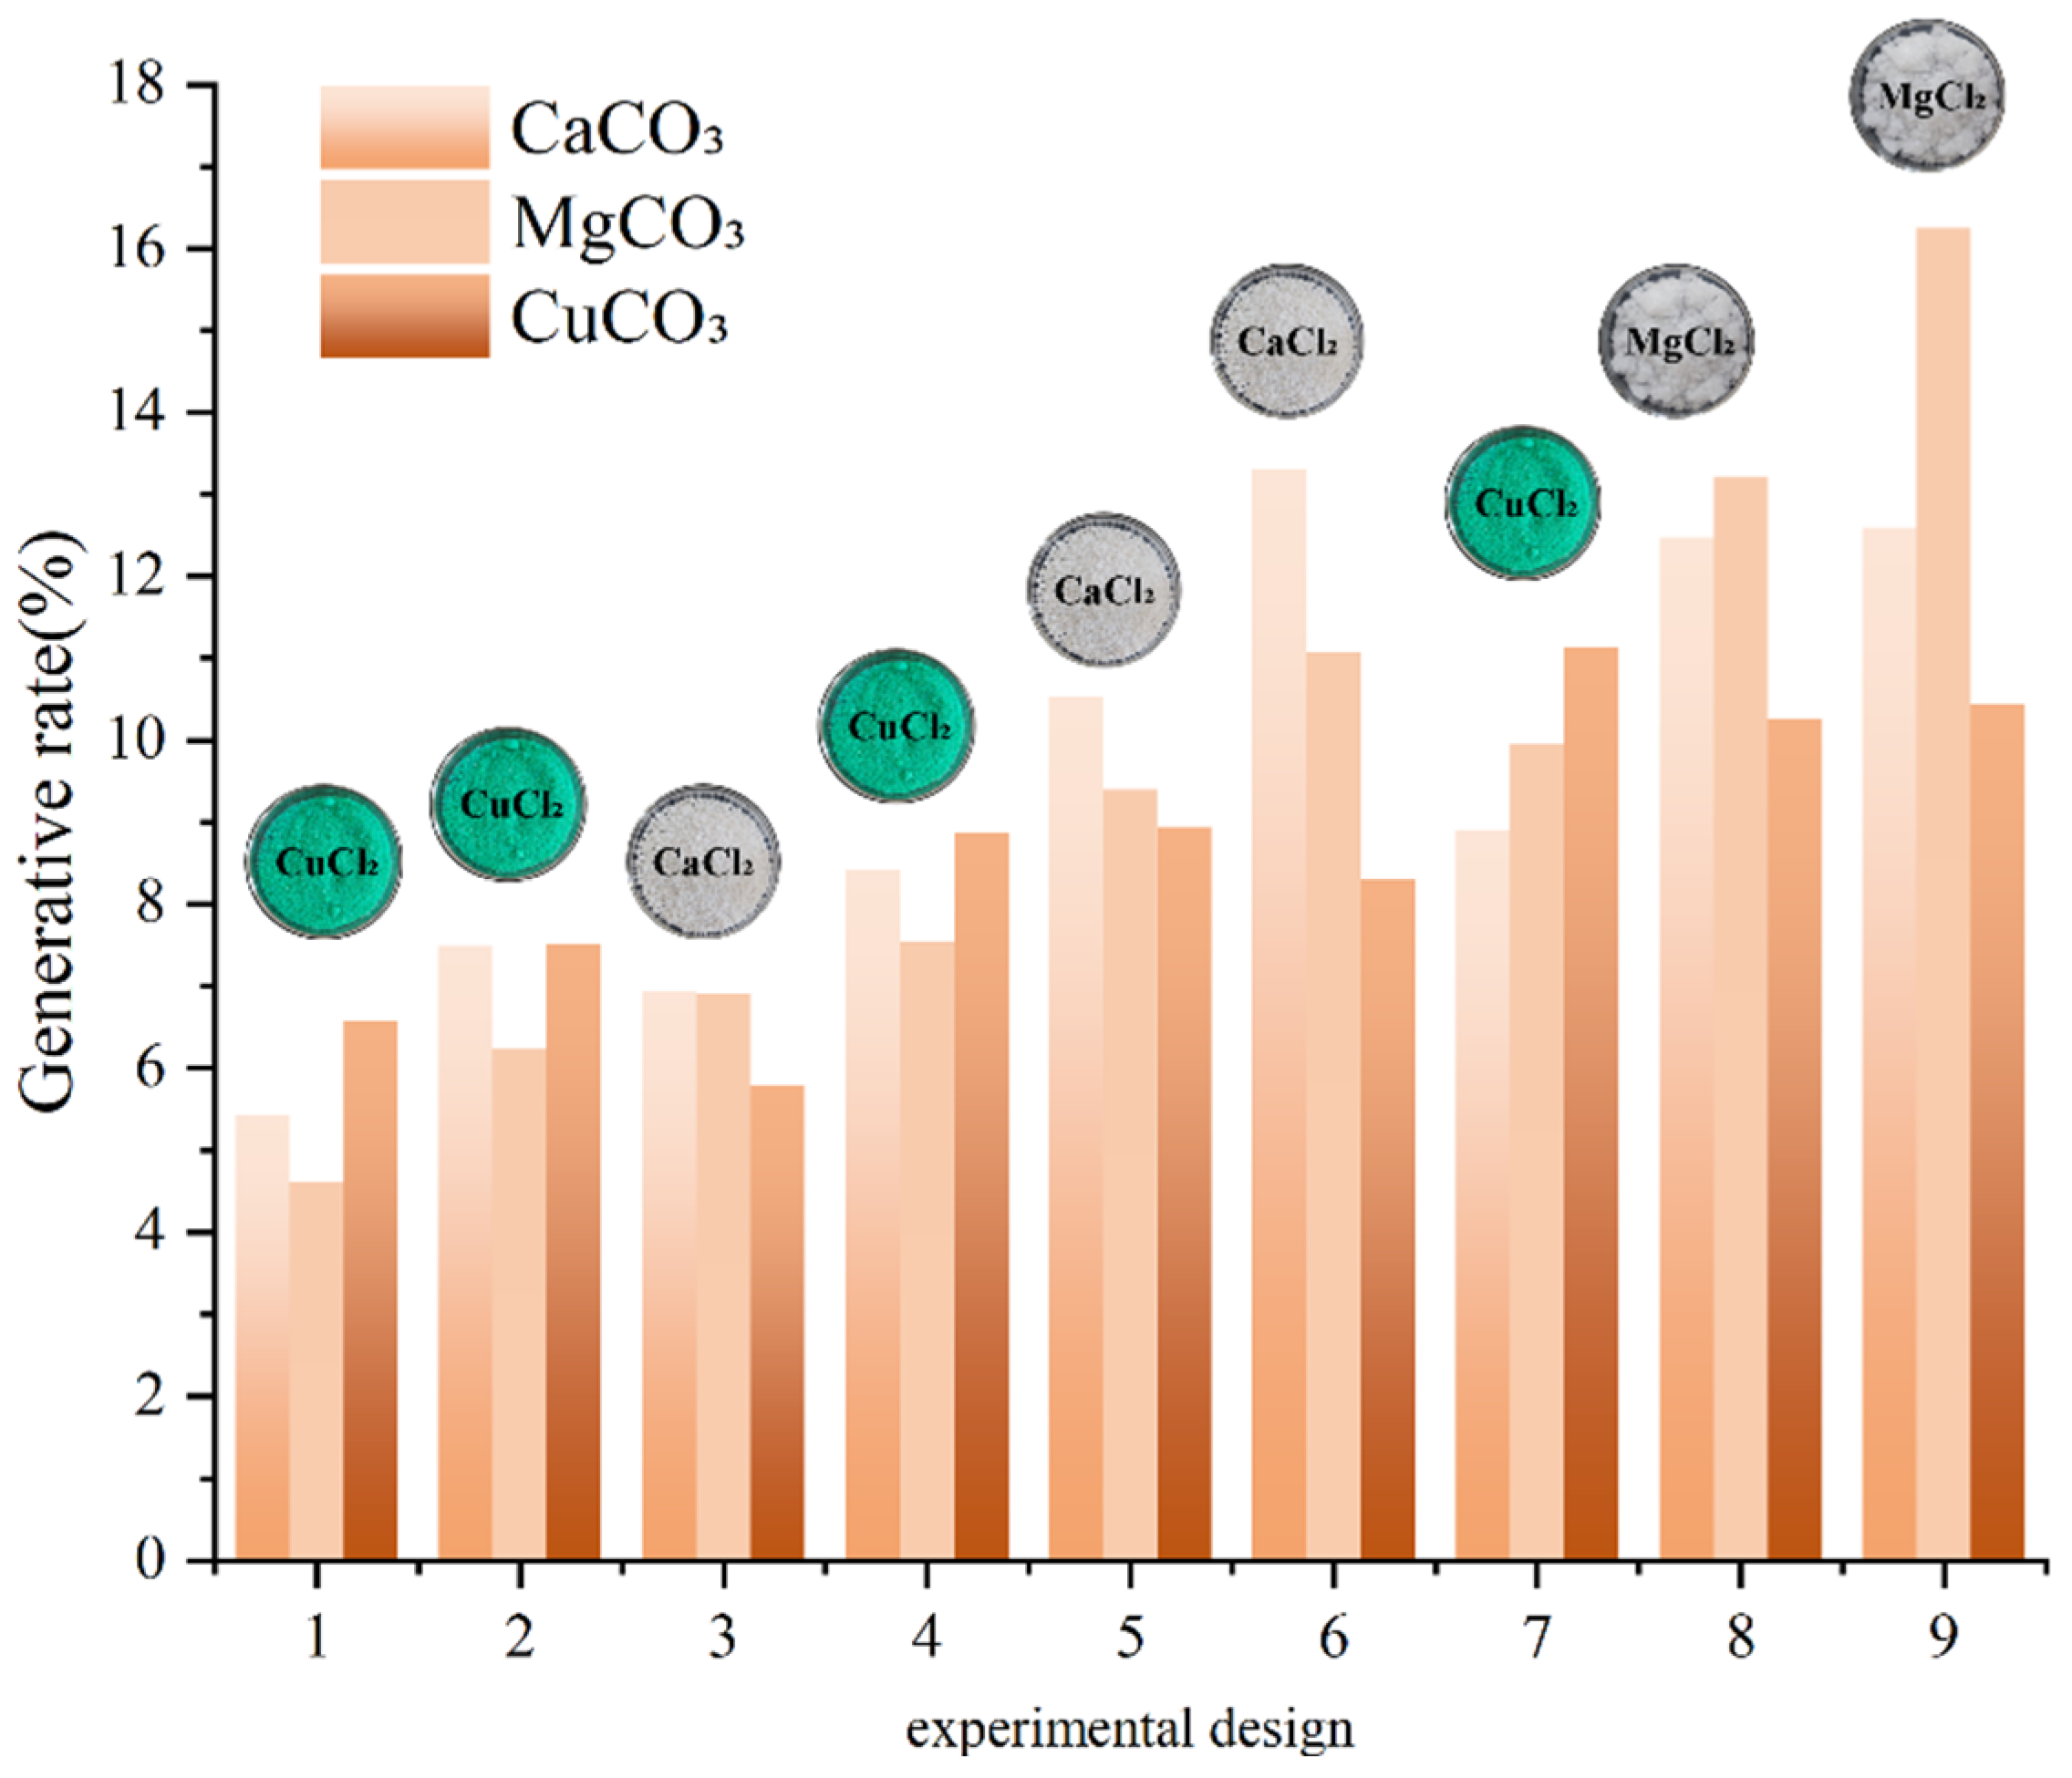
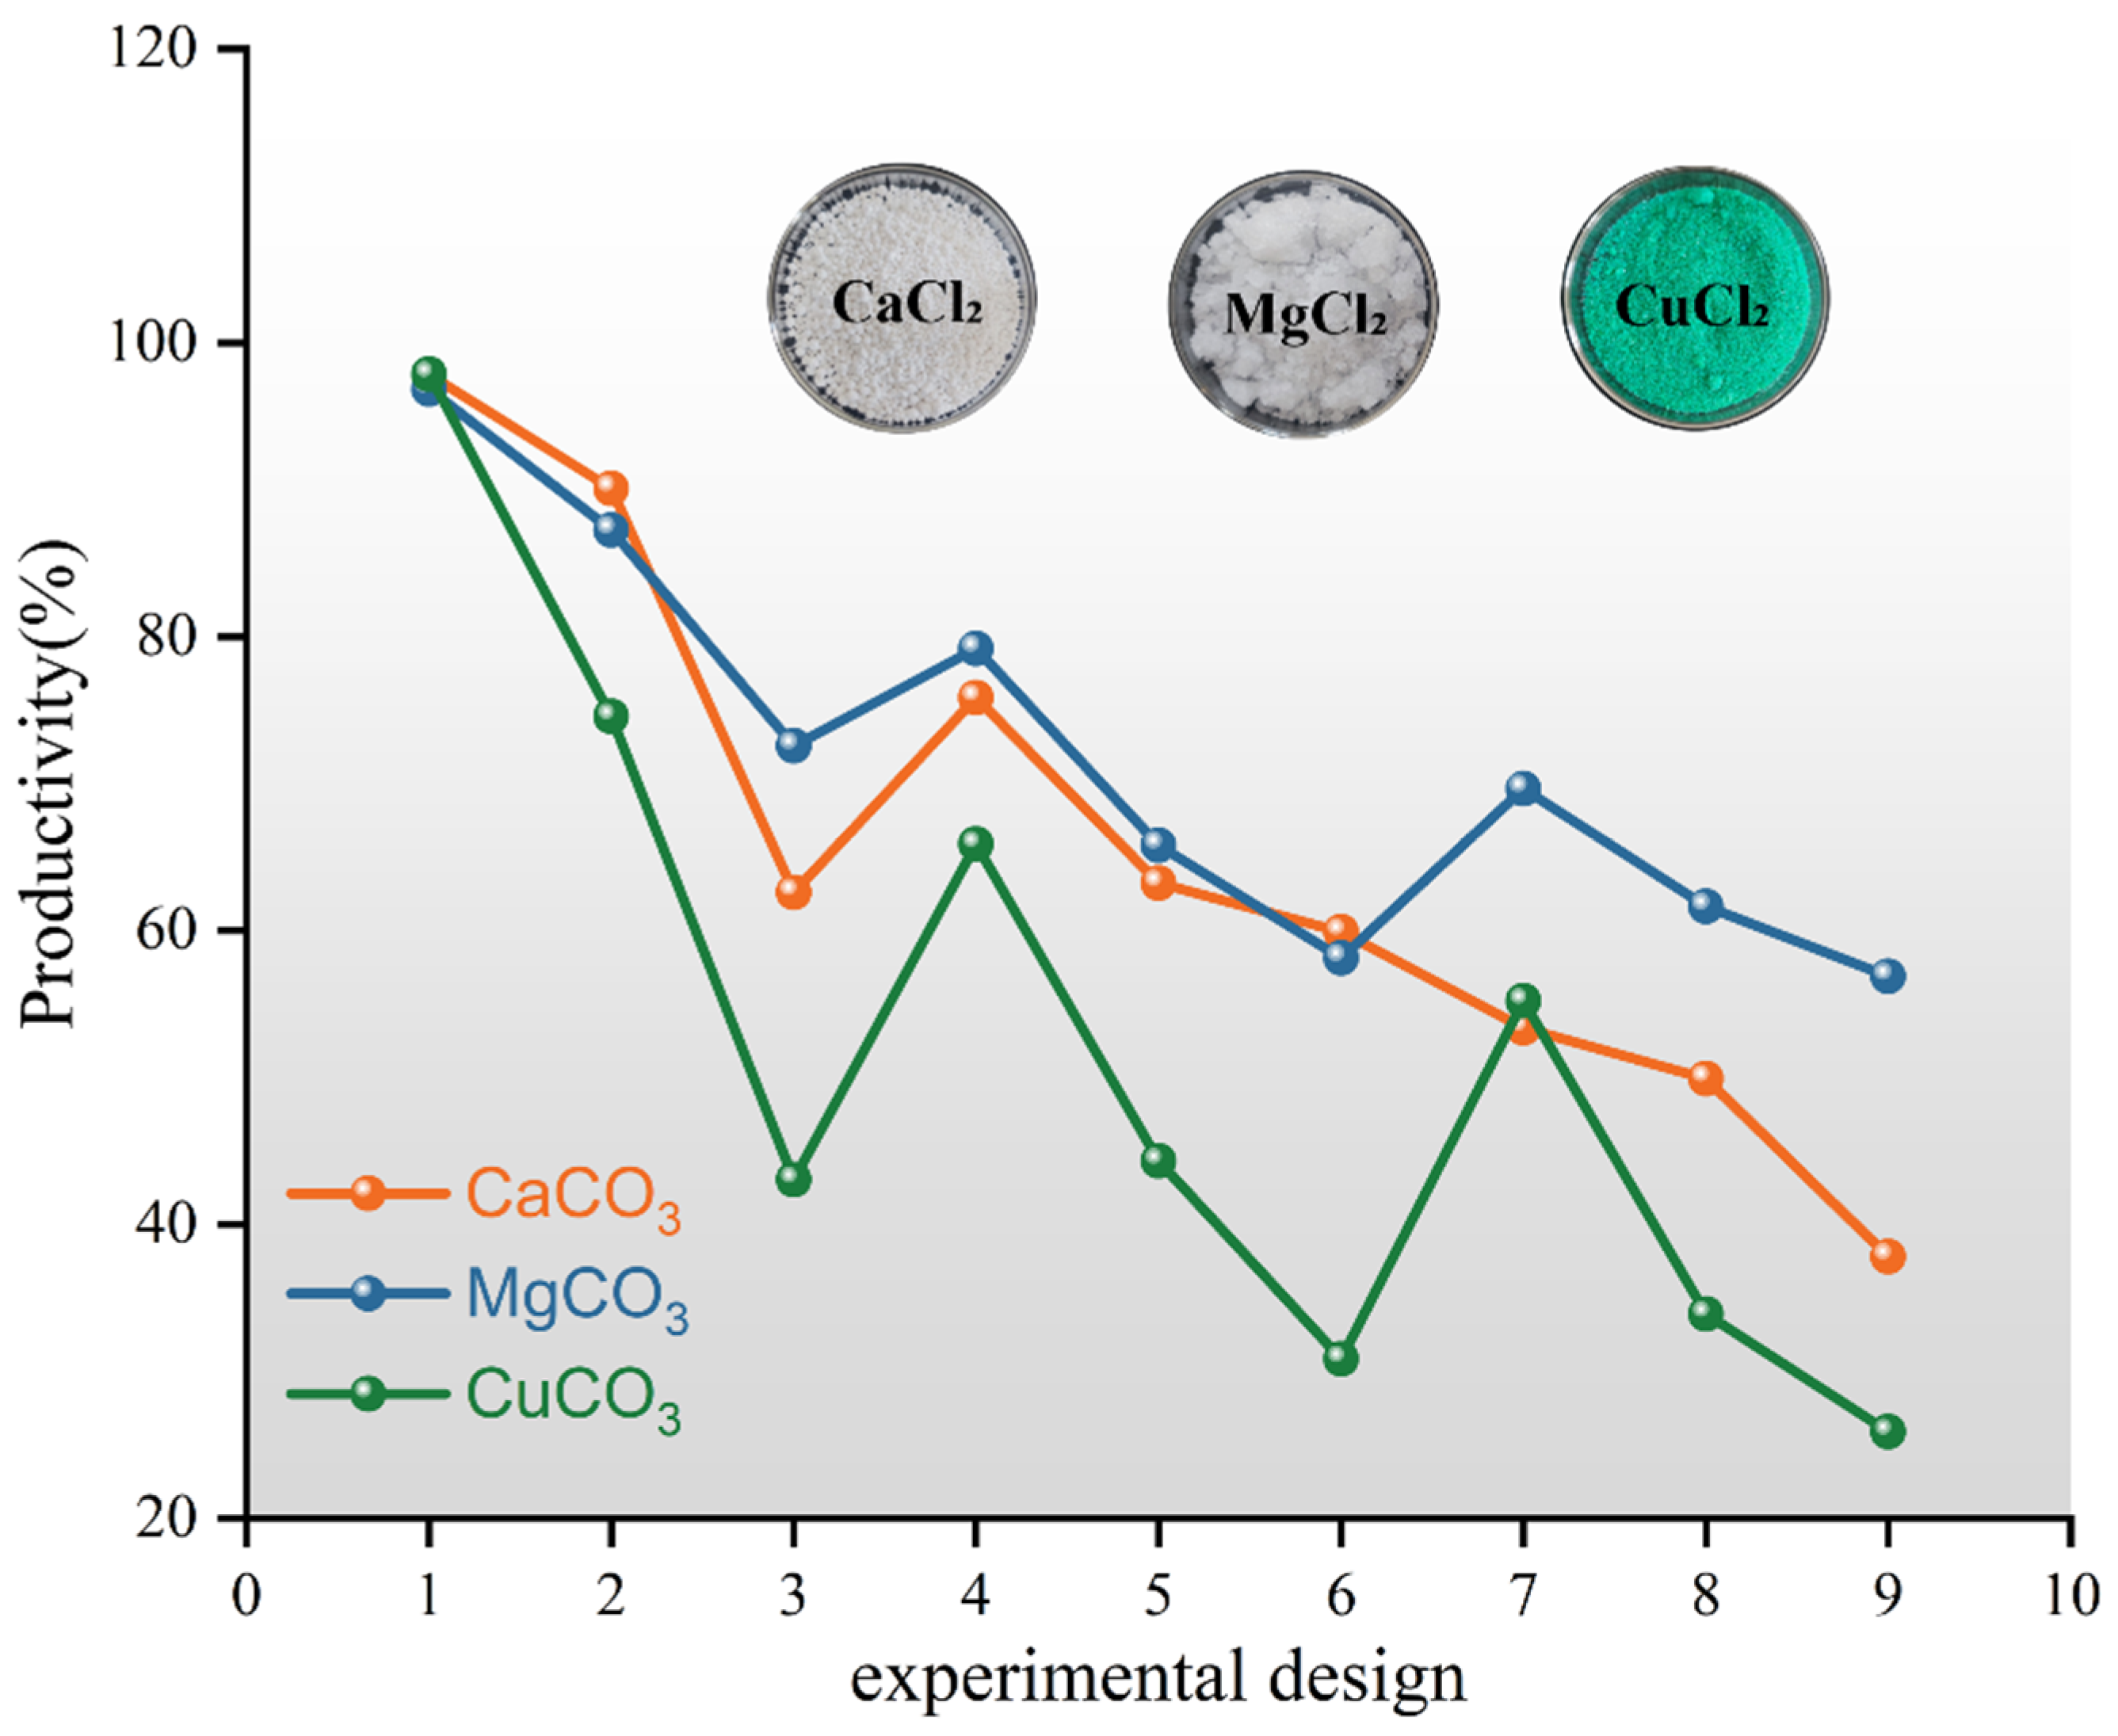
3.1. Precipitate Yield and Precipitation Rate

This study was conducted under experimental conditions of 30 °C and an initial pH of 8, following the experimental plan for microbial mineralization reactions. The mixed solution was allowed to stand for 24 h to ensure a full reaction. Afterward, the precipitate was filtered and collected, air-dried, and weighed to determine the amount of precipitate generated and calculate the yield. Due to factors such as bacterial activity and environmental influences, the actual yield was found to be lower than the theoretical yield.
To determine the composition of the precipitated product, an XRD analysis was performed. By comparing the XRD diffraction patterns with standard reference patterns, it was confirmed that the products of the TCS (CaCl2, MgCl2, and CuCl2) are CaCO3 (Figure 2a), MgCO3 (Figure 2b), and CuCO3 (Figure 2c).

3.1.1. Effect of Metal Source on Precipitation Rate

Under the same experimental conditions, the yield of CaCO3 and CuCO3 was relatively large when the CSC was low, while the yield of MgCO3 was smaller. As the CSC increased, the yield of CuCO3 started to be lower than that of CaCO3 and MgCO3. Under constant TCS conditions, the yield of CaCO3 and MgCO3 exhibited an increasing trend as the B/C ratio decreased, whereas the yield of CuCO3 showed a decreasing trend. The yields for each of the nine experimental setups, as outlined in Table 2, are presented in Figure 3.
The precipitation yields for the nine experimental setups, as shown in Table 2, are depicted in Figure 4. Under identical experimental conditions, MgCO3 exhibited the highest precipitation yield, followed by CaCO3, while CuCO3 demonstrated the lowest precipitation efficiency. It can be seen that as the CSC increases and the B/C ratio decreases, the yield rate of all three types of precipitates tends to decrease. Among them, CuCO3 experienced the fastest rate of decline, followed by CaCO3, and lastly MgCO3. From the changes in the yield rate, it can be concluded that CuCO3 is most affected by the CSC and B/C ratio, while CaCO3 and MgCO3 are less affected.
The differences in yield are primarily due to the molar masses of CaCO3, MgCO3, and CuCO3, which are 100.09, 84.32, and 123.56, respectively. Therefore, for the same amount of substance, the mass of CuCO3 precipitate is the largest. In the early stage, at a low CSC and high B/C ratio, the yields of CaCO3 and CuCO3 are greater than that of MgCO3, although their generation rates are similar. However, as the CSC increases and the B/C ratio decreases, the generation rate of MgCO3 becomes greater than that of the other two, resulting in the highest yield. Conversely, CuCO3 has the lowest yield and generation rate.
The variations in the generation rate are mainly due to the effects of metal ions in the grout solution on microbial activity. Mg2+ and Ca2+ have a relatively small impact on microbial metabolism, while Cu2+ is toxic and inhibits microbial growth and metabolic activity, thereby reducing the microbial ability to produce carbonate ions, which leads to differences in the precipitate yield. Moreover, the differences in TCS cause variations in the precipitation efficiency. Mg2+ forms a strong bond with CO32−, and the resulting MgCO3 precipitate is relatively stable; Ca2+ reacts quickly with CO32−, but CaCO3 crystals can form a dynamic equilibrium in the solution, affecting the generation rate; Cu2+ tends to form complexes with water or other ions, and its reaction with carbonate ions is slower, resulting in a lower yield and generation rate.
Thus, differences in the yield and generation rate of the three precipitates are observed. From the perspective of improving efficiency and reducing heavy metals to protect the environment, magnesium chloride (MgCl2) and calcium chloride (CaCl2) are more suitable as grout solutions for soil reinforcement technologies.

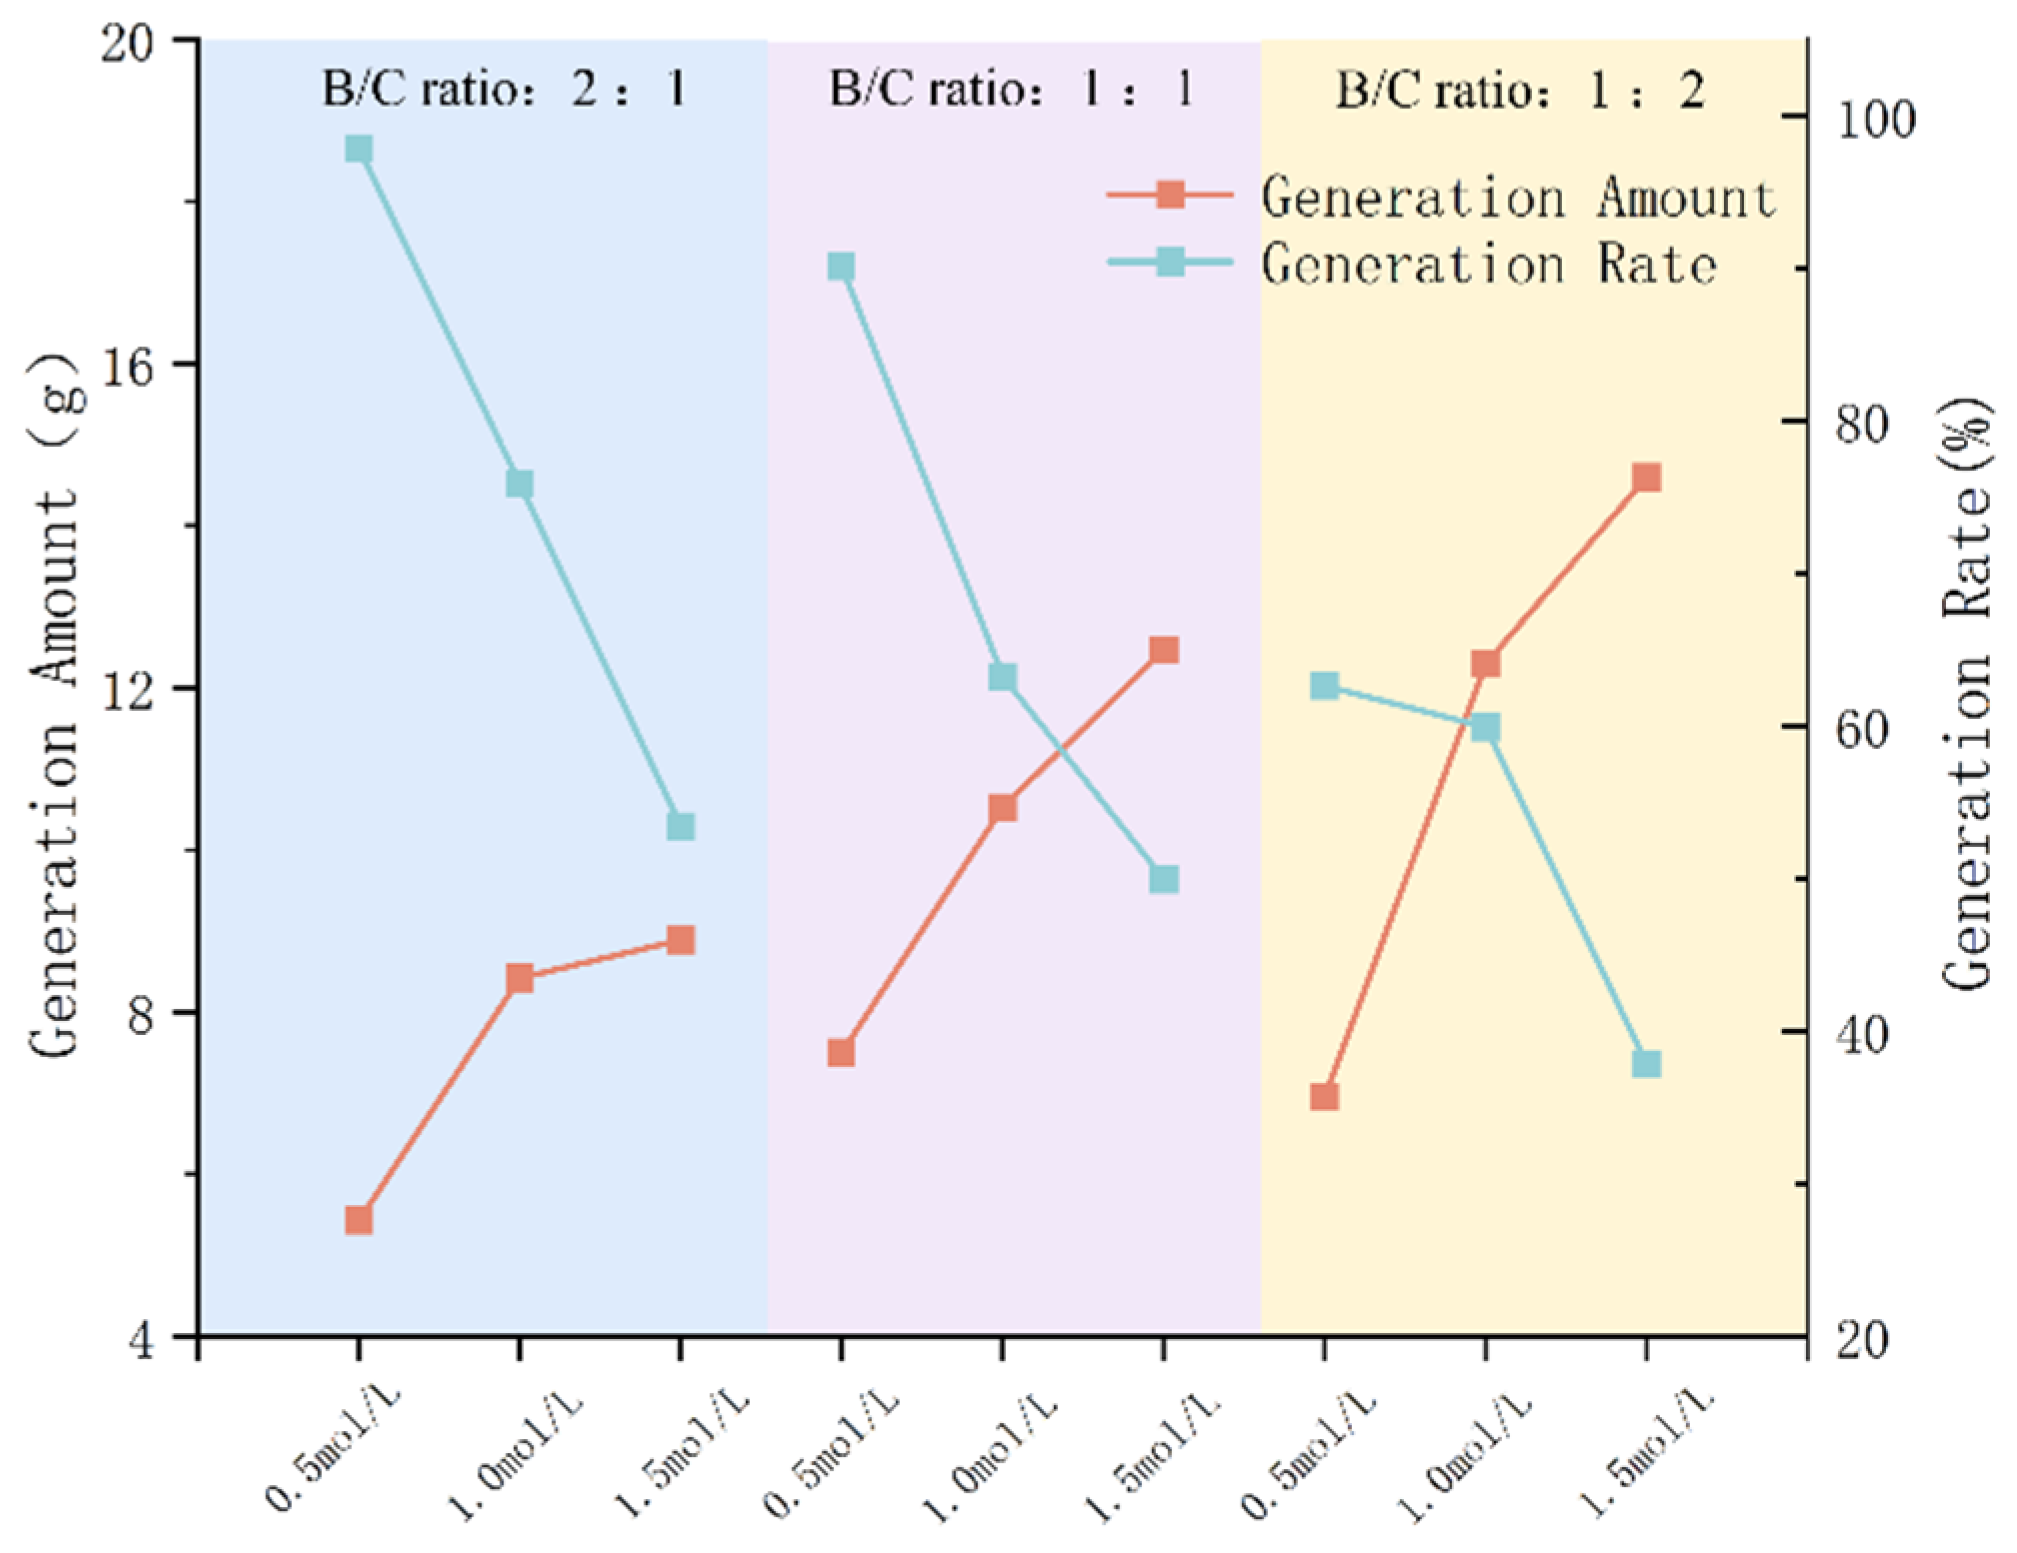
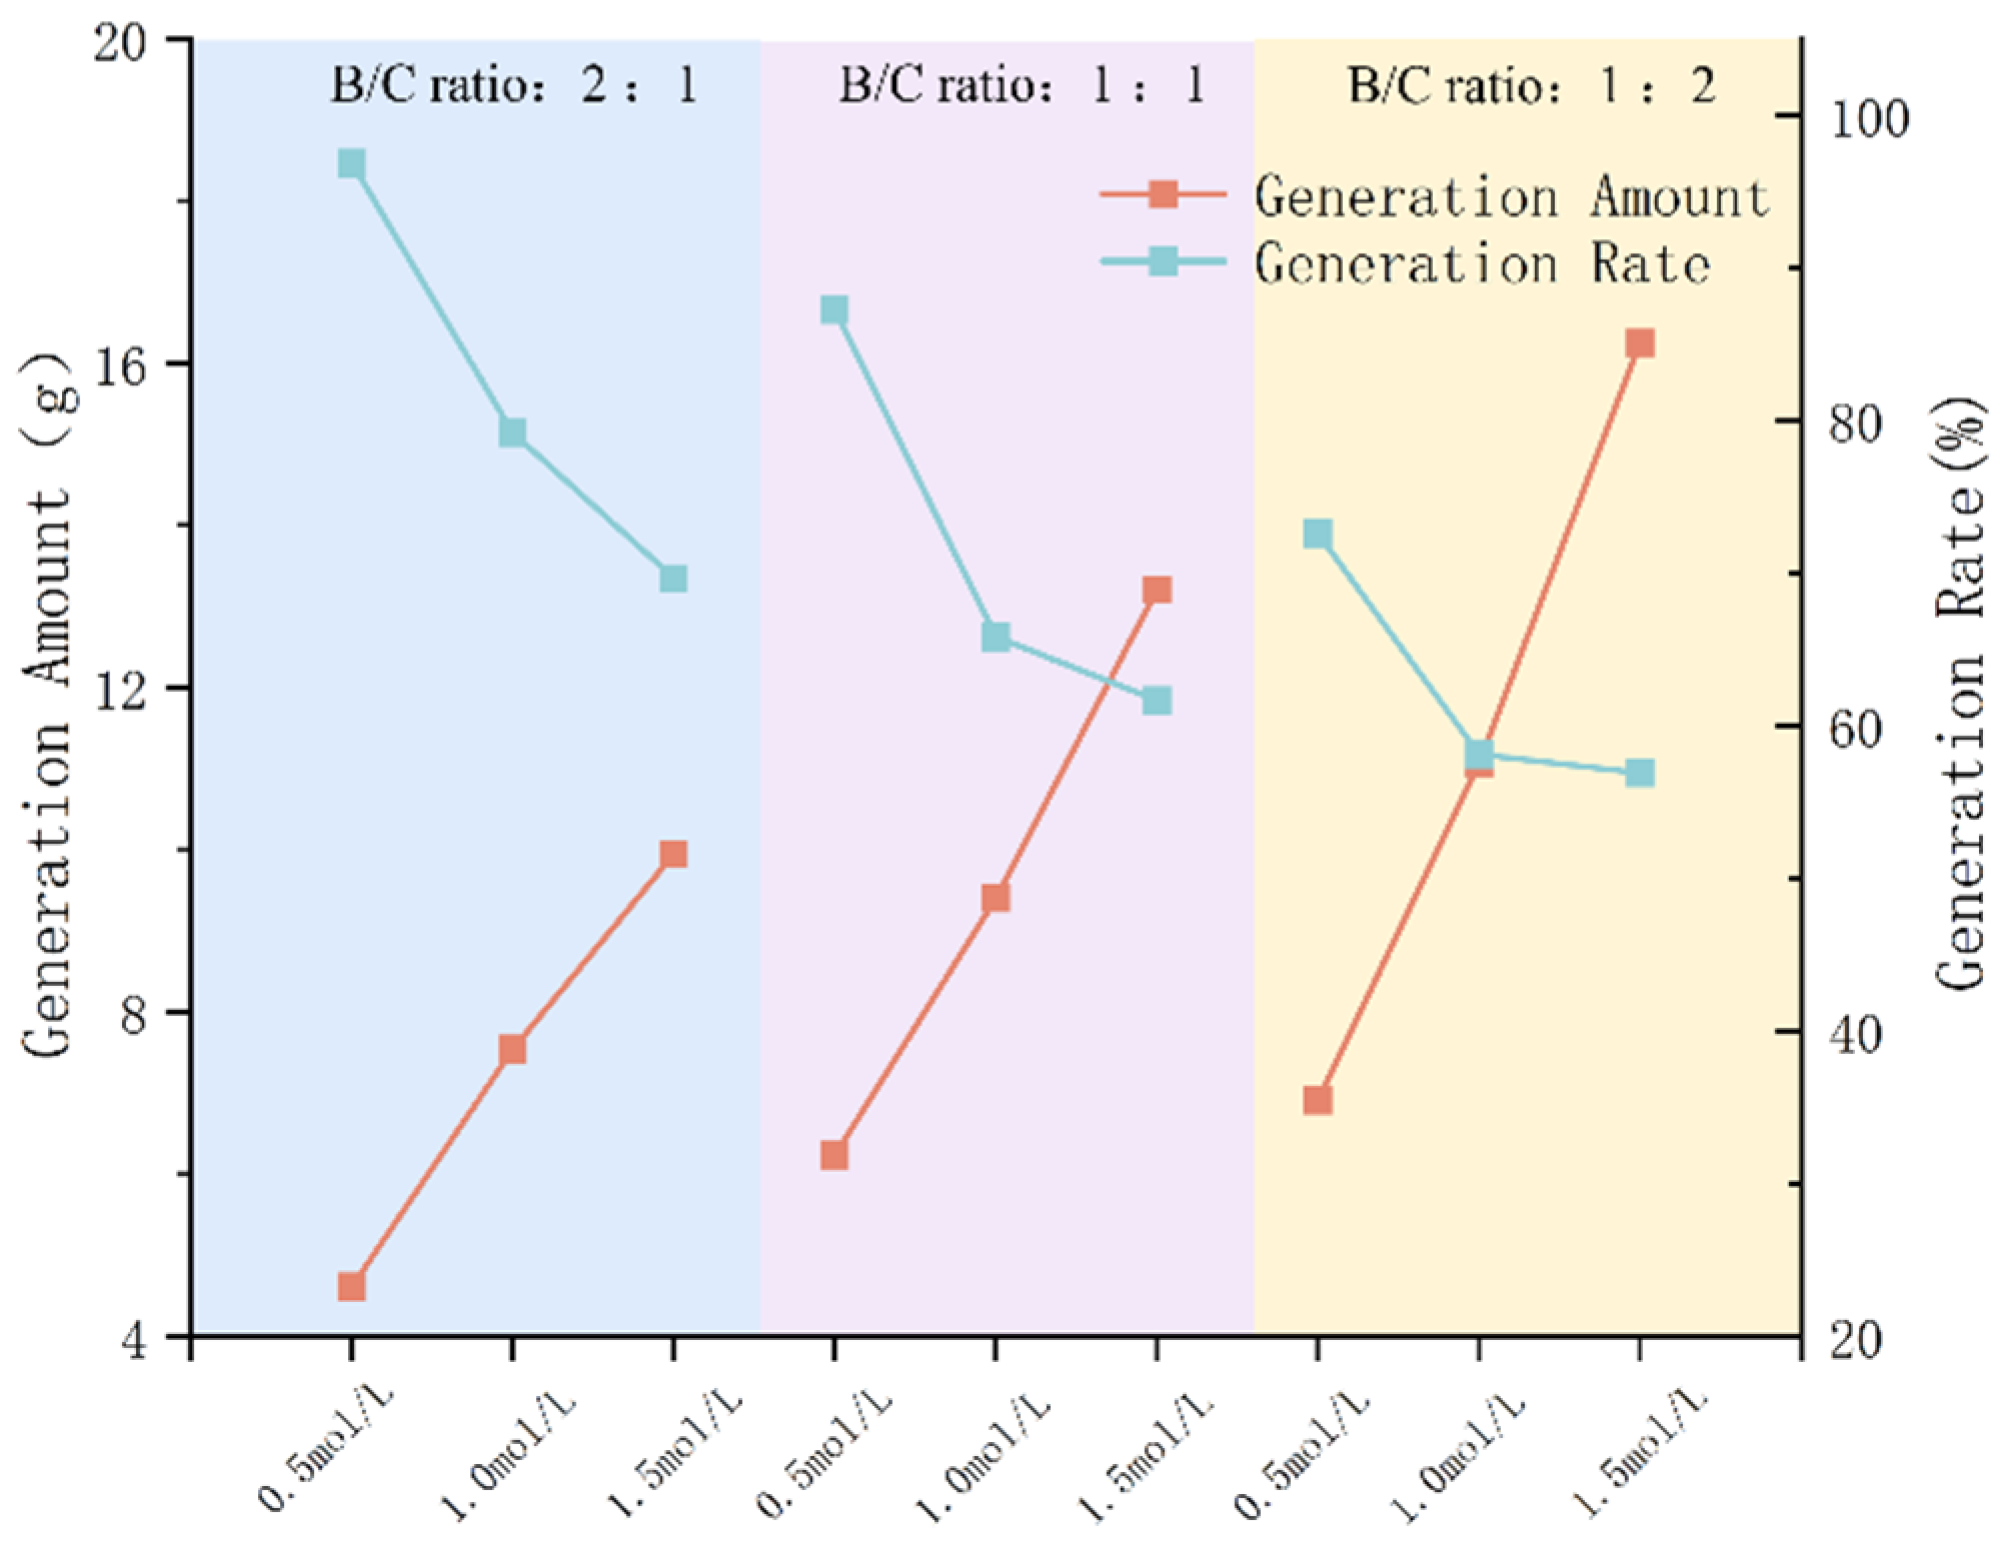
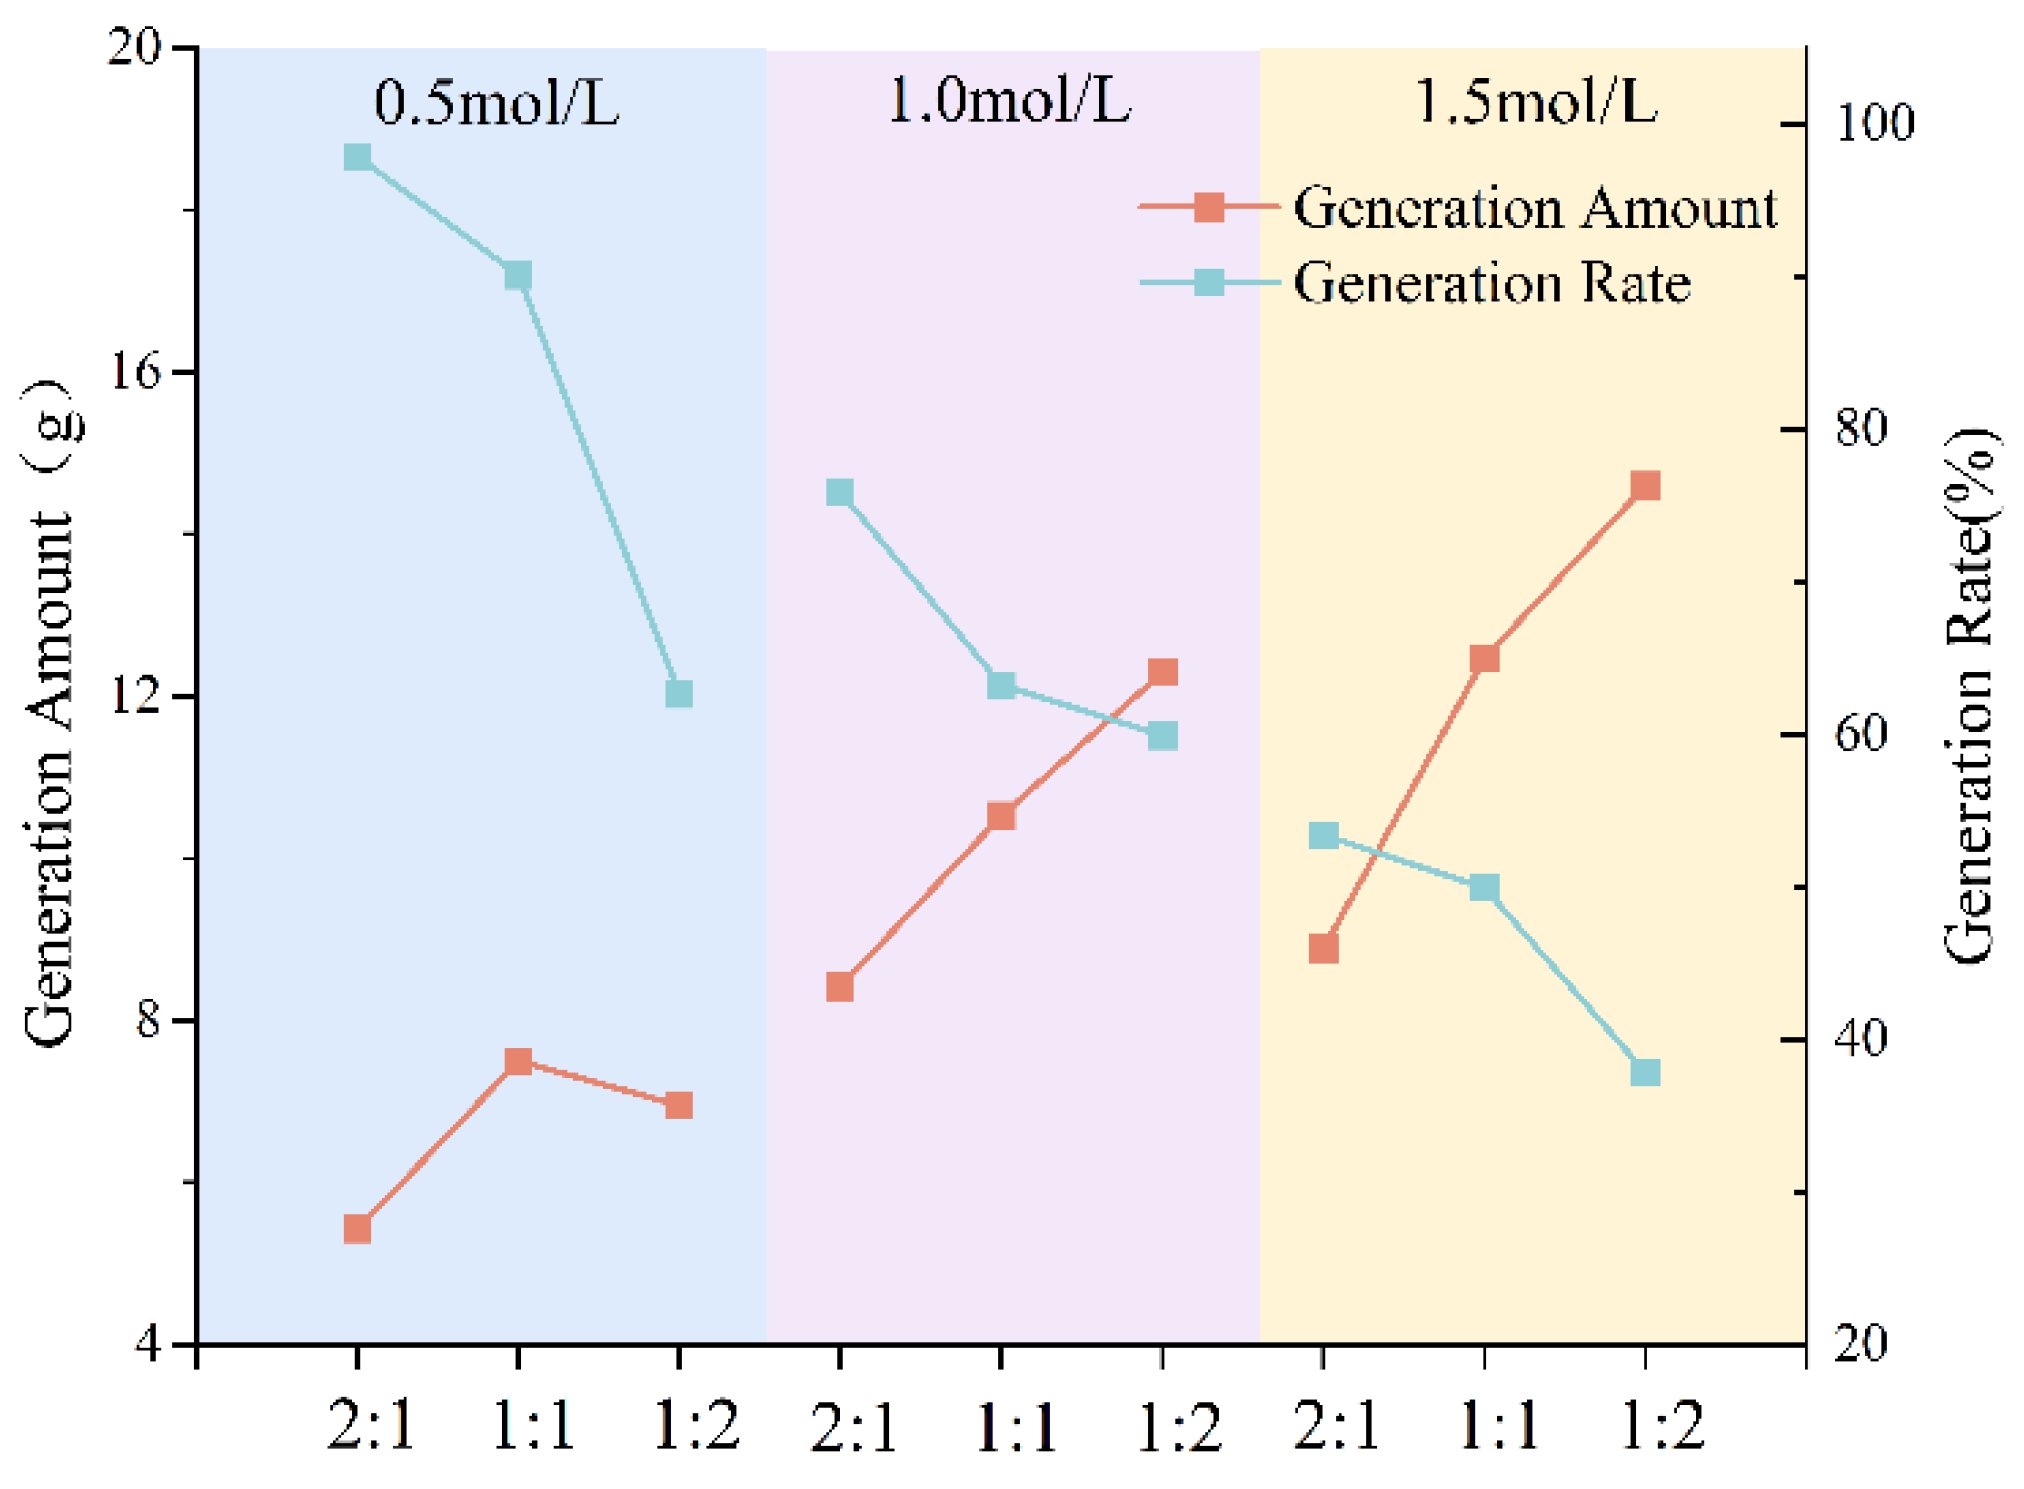
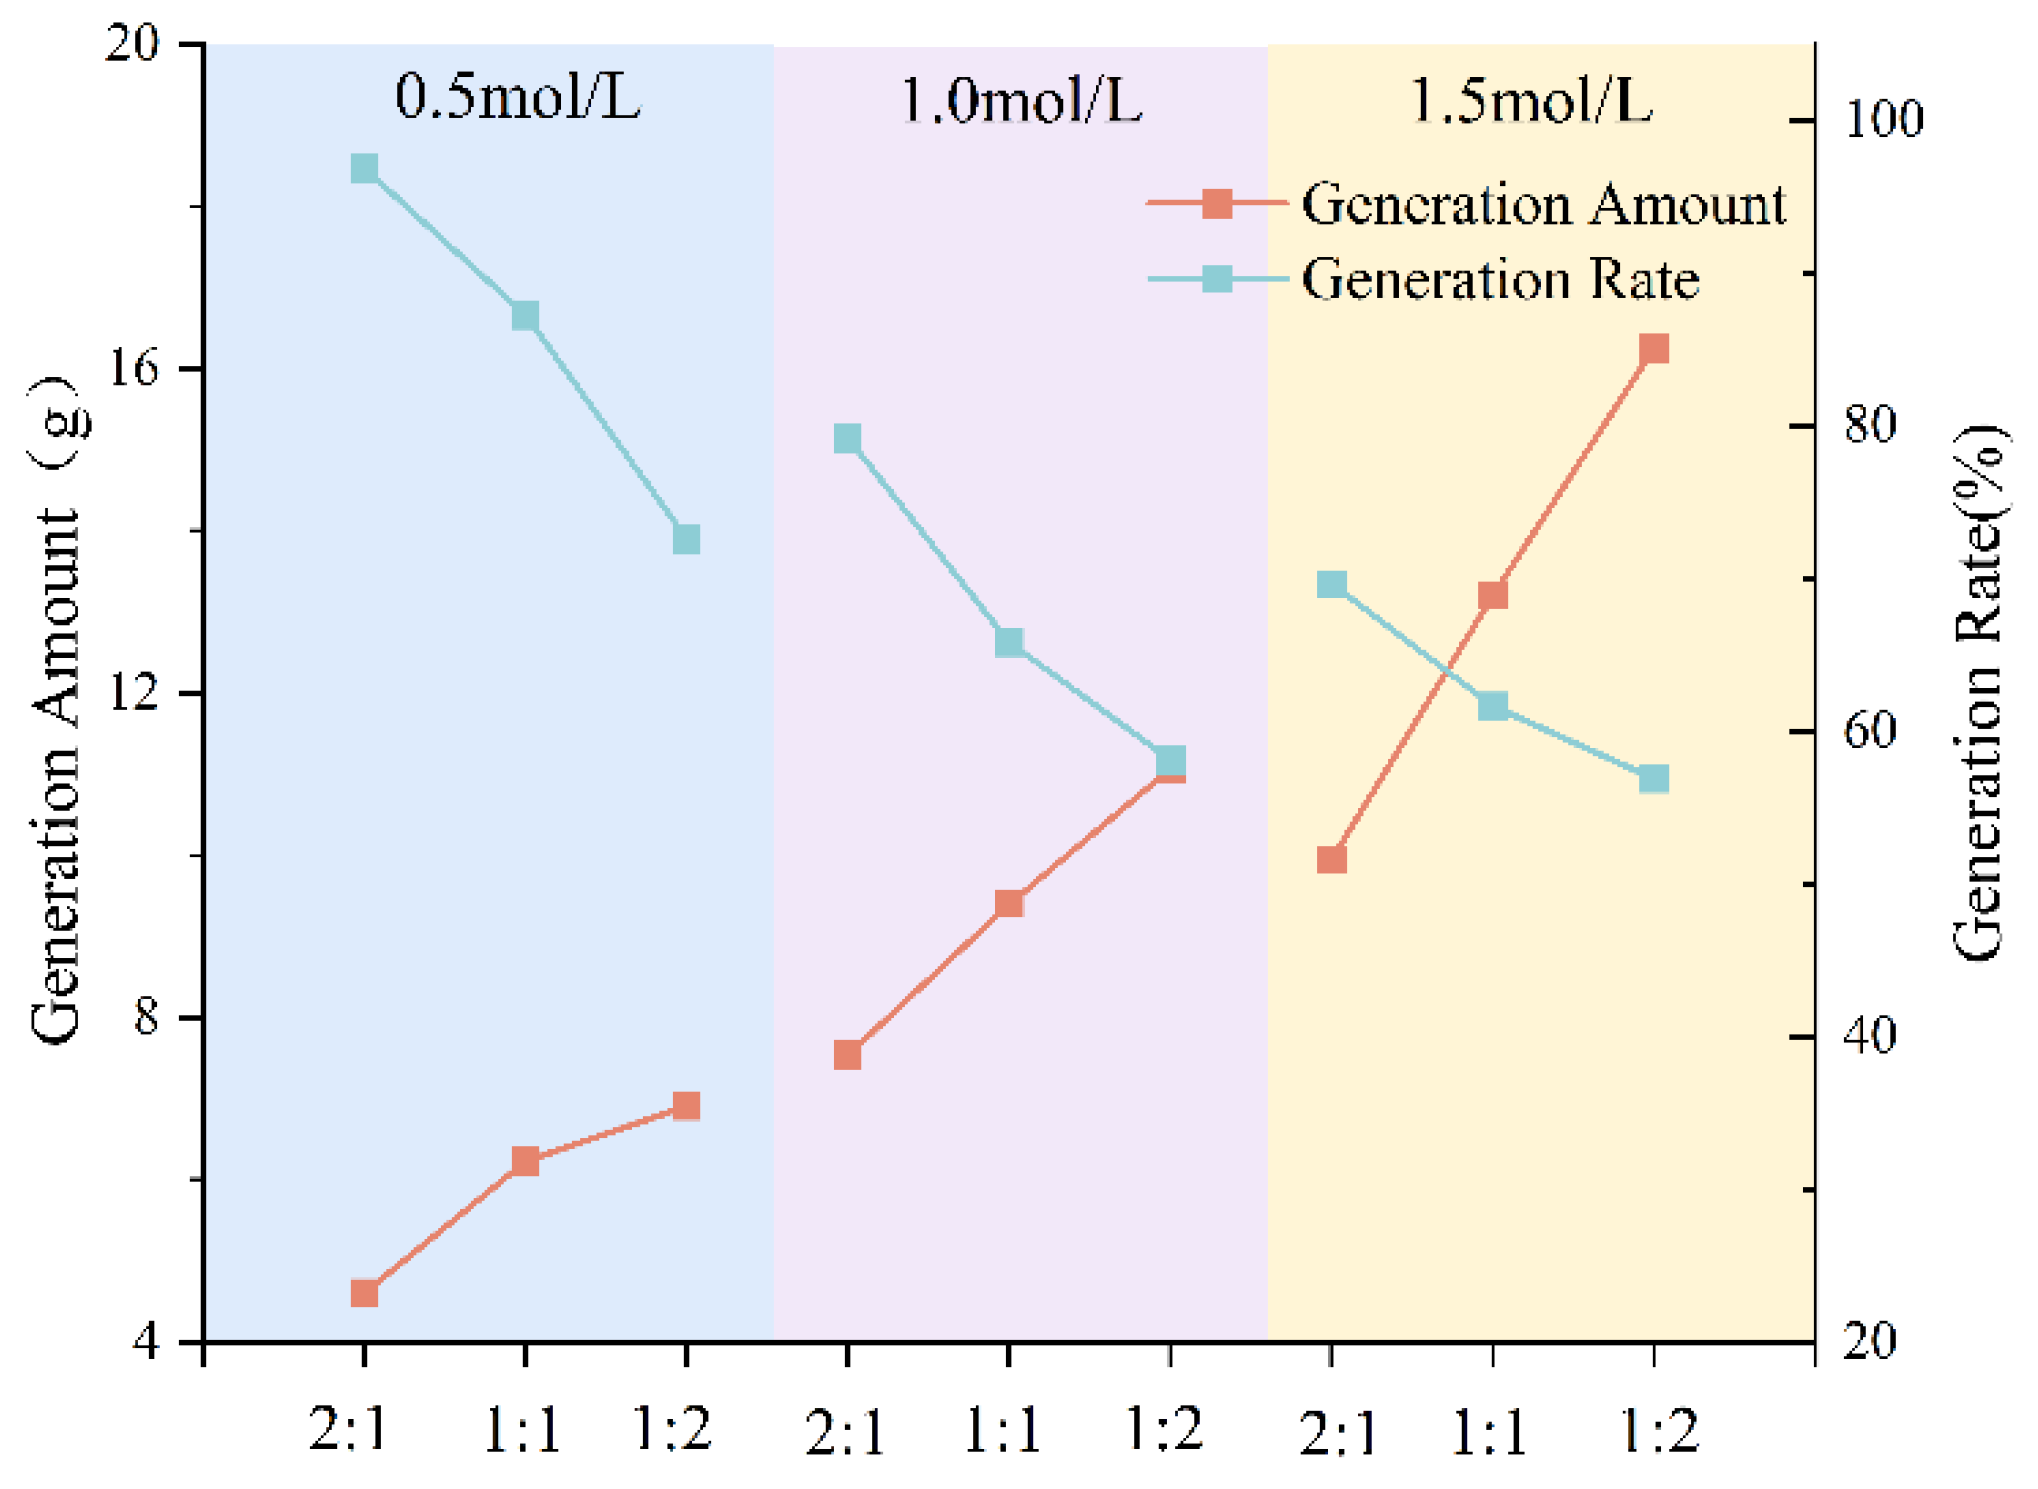
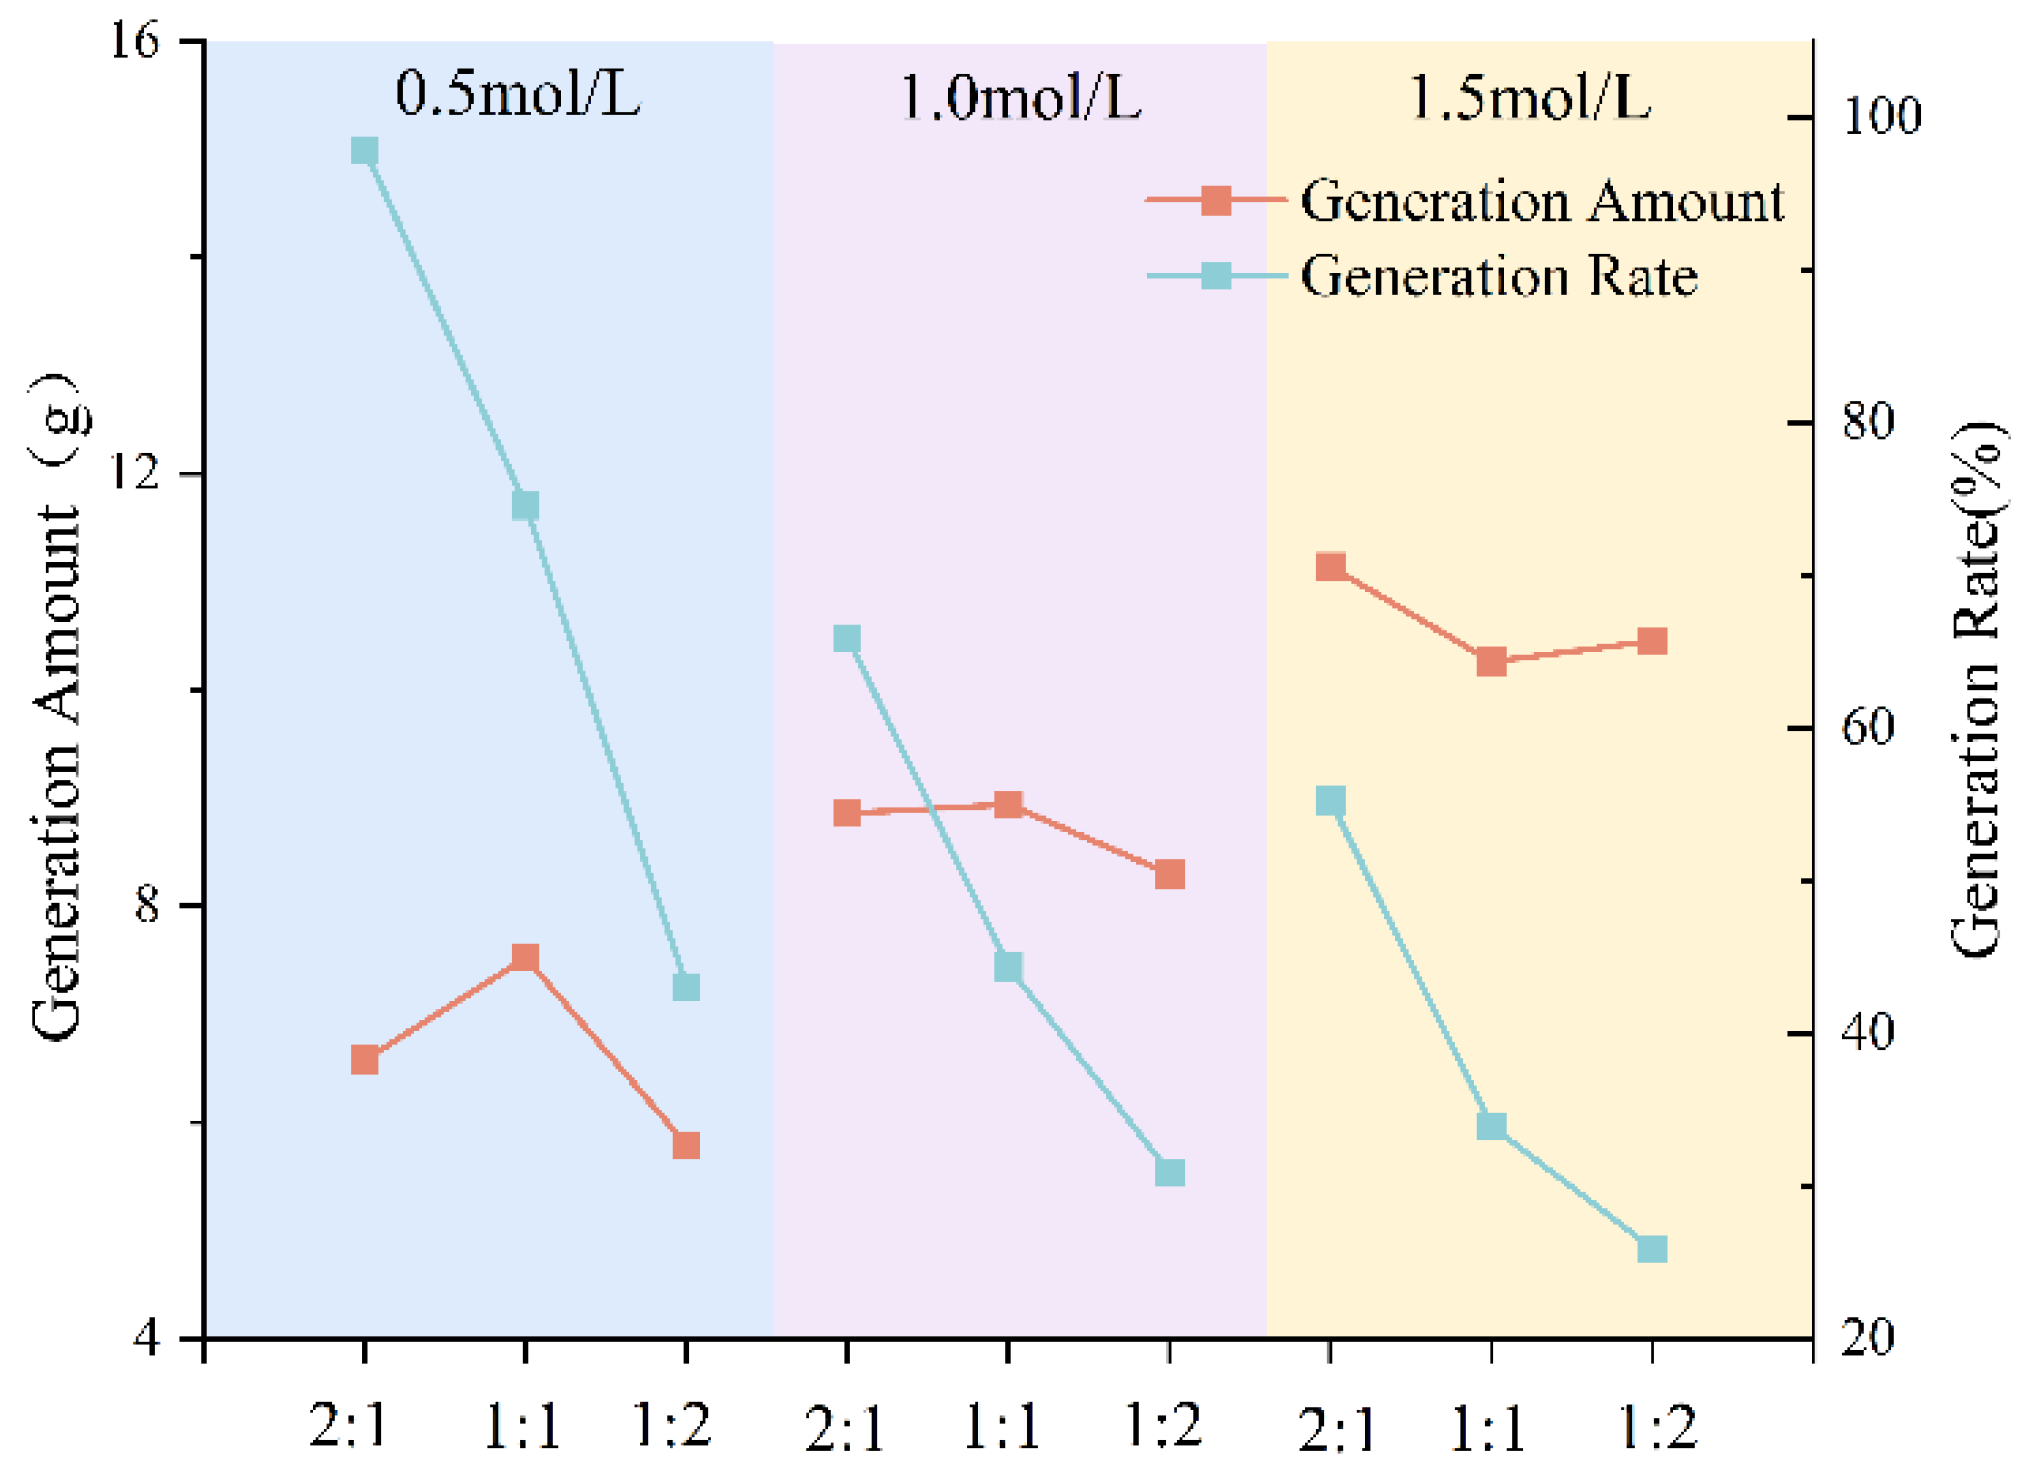
3.1.2. Effect of Grouting Solution Concentration on Precipitation Rate

The CSC solution has the same effect pattern on CaCO3 (Figure 5), MgCO3 (Figure 6), and CuCO3 (Figure 7). When the B/C ratio is constant, as the CSC increases, the amount of product also increases, but the rate of increase slows down. However, as the CSC increases, the yield starts to decrease, and the rate of decrease also slows down. At a high B/C ratio, the CSC has a significant impact on both yield and generation rate, while the effect diminishes as the B/C ratio decreases.
As the concentration of the grout solution increases, the concentration of metal cations and urea in the solution also increases, which leads to easier ion saturation in the solution. This also provides more ions, thereby promoting the formation of carbonate precipitates and resulting in more precipitates. However, the high ion concentration itself inhibits microbial metabolic activity, and it also increases the osmotic pressure of the solution, further suppressing microbial metabolism. This reduces the formation of carbonate ions, affecting the generation rate of carbonate ions and ultimately leading to a decrease in the precipitation rate.
In practical engineering applications, if the goal is to achieve optimal utilization, a CSC of 1.5 mol/L should be chosen, as it generates the most product, but the efficiency is low and may lead to waste. Therefore, if high utilization efficiency is desired, a CSC of 0.5 mol/L should be selected, as it maximizes the utilization efficiency of both bacteria and grout solution.

3.1.3. Impact of B/C Ratio on Precipitation Rate

The bacterium-to-grout ratio has the same effect on CaCO3 (Figure 8), MgCO3 (Figure 9), and CuCO3 (Figure 10). At the same CSC, as the bacterium-to-grout ratio decreases, the production quantity increases, while the production rate decreases. The effect of the bacterium-to-grout ratio is more significant at a lower CSC.
Similar to the effect of CSC, a smaller bacterium-to-grout ratio means a reduction in bacterial concentration in the solution, while the grout proportion increases, providing more metal cations. This promotes the formation of CaCO3 precipitation, leading to more precipitation. However, the lower microbial concentration negatively impacts the generation of carbonate ions, ultimately reducing the precipitation rate. When the CSC increases, it affects the concentration of metal ions in the solution, mitigating the impact of the lower bacterium-to-grout ratio. Therefore, the effect of the bacterium-to-grout ratio is more significant in environments with low CSCs.
For practical engineering applications, if the goal is to achieve the highest production, a 1:2 bacterium-to-grout ratio should be selected, as this results in the highest product yield, but the efficiency is low and waste is likely. To maximize resource utilization, a 2:1 bacterium-to-grout ratio should be chosen, as it achieves the highest precipitation rate and optimal resource use.

3.2. Microstructural Mechanistic Analysis

Different types of grout liquids, concentrations, and bacterium-to-grout ratios result in varying crystal sizes and characteristics. Large crystals are beneficial for cementing coarse-grained soils and improving the soil’s mechanical properties, while smaller crystals are more effective for cementing fine-grained soils and enhancing their impermeability. Additionally, spherical, elliptical, and irregular cubic crystal shapes can improve the bonding performance. In practical applications, different types of soil reinforcement require specific crystal sizes. To investigate the impact of grout liquid type, concentration, and bacterium-to-grout ratio on the size and characteristics of precipitate crystals, scanning electron microscopy (SEM) was used to study the dimensions and morphology of the precipitated crystals.

3.2.1. Crystal Morphology of Three Types of Precipitates

Analysis of the microbial mechanisms and microstructural characteristics of pre-cipitates in microbially induced calcium carbonate precipitation MICP experiments reveals the following key insights: High concentrations of the cementation solution can negatively affect microbial activity, leading to incomplete reactions. Therefore, the solution at a concentration of 0.5 mol/L and a bacterial-to-cement ratio of 2:1 was selected for the experiment. As shown in the figure, the crystallized CaCO3 precipitate (Figure 11a) undergoes crystal growth. During this process, the crystal tends to reduce its surface area to lower surface energy, and the spherical shape has the smallest surface-to-volume ratio. If the surrounding solution conditions, such as temperature, concentration, and pH, are maintained uniformly without external forces, the CaCO3 crystals spontaneously form spherical shapes (Figure 11b). The surface of the sphere is primarily composed of CaCO3 particles (Figure 11b) and bacteria (Figure 11d).
The figure below shows the MgCO3 crystal precipitate polymer (Figure 12a), where Mg2+ and CO32− ions form a hexagonal lattice. The crystals typically grow more easily along the c-axis direction. When the surrounding solution conditions, such as temperature, concentration, and pH, are maintained uniformly, columnar crystals are formed. The microorganisms in the precipitate are mainly distributed at the base of the columnar crystals, where the bacteria act as the central core (Figure 12b). The columnar crystals then extend symmetrically outward from the core (Figure 12c,d), with the polymer taking a spherical shape.
CuCO3 crystal precipitation is similar to CaCO3, with the crystal aggregates (Figure 13a) roughly spherical in shape. However, due to its lower yield, Cu2+ ions affect the activity of the bacteria, resulting in smaller crystal diameters. The crystals predominantly appear as irregular spherical particles (Figure 13b).

3.2.2. The Effect of CSC and B/C Ratio on CaCO3 Crystals

The diameter of CaCO3 crystals is distributed between 3 and 27 μm. The scanning electron microscopy (SEM) images of CaCO3 crystal precipitation under different grout liquid concentrations and B/C ratios are shown below. CaCO3 precipitation exhibits good conductivity, and under conditions of a low CSC and high B/C ratio, the size (Figure 14) features of the crystals can be clearly observed. As the CSC increases and the B/C ratio decreases, the crystal features gradually become blurred.
From Table 3, it can be observed that the maximum diameter of the CaCO3 crystals is 27 μm. Keeping the B/C ratio constant, as the grout liquid concentration increases, the crystal diameter decreases. When the grout liquid concentration is kept constant, as the B/C ratio decreases (with less bacterial liquid and more grout), the crystal diameter shows a decreasing trend.
Figure 14a–i show the SEM images of the precipitate crystals produced under the nine experimental conditions outlined in Table 2. The images indicate the diameters of CaCO3 crystals for each condition. Notably, a significant change in the average crystal diameter is observed across the experimental conditions, ranging from a maximum of 27 μm to a minimum of 3 μm. The changes in the microstructure of the crystals are more pronounced as the bacterial liquid concentration decreases and the cementation solution concentration increases.
The concentration of bacterial liquid and metal ions in the solution is influenced by both the grout liquid concentration and the B/C ratio. At lower grout liquid concentrations, fewer metal ions are present, and a higher B/C ratio promotes more effective microbial metabolism, enhancing bacterial activity. This allows sufficient time for CaCO3 crystals to grow into larger particles. As the grout liquid concentration increases and the B/C ratio decreases, the concentration of metal ions in the solution rises, accelerating the precipitation reaction. This leads to rapid nucleation rather than crystal growth, resulting in smaller crystal particles. Furthermore, the elevated cementation solution concentration inhibits bacterial activity.

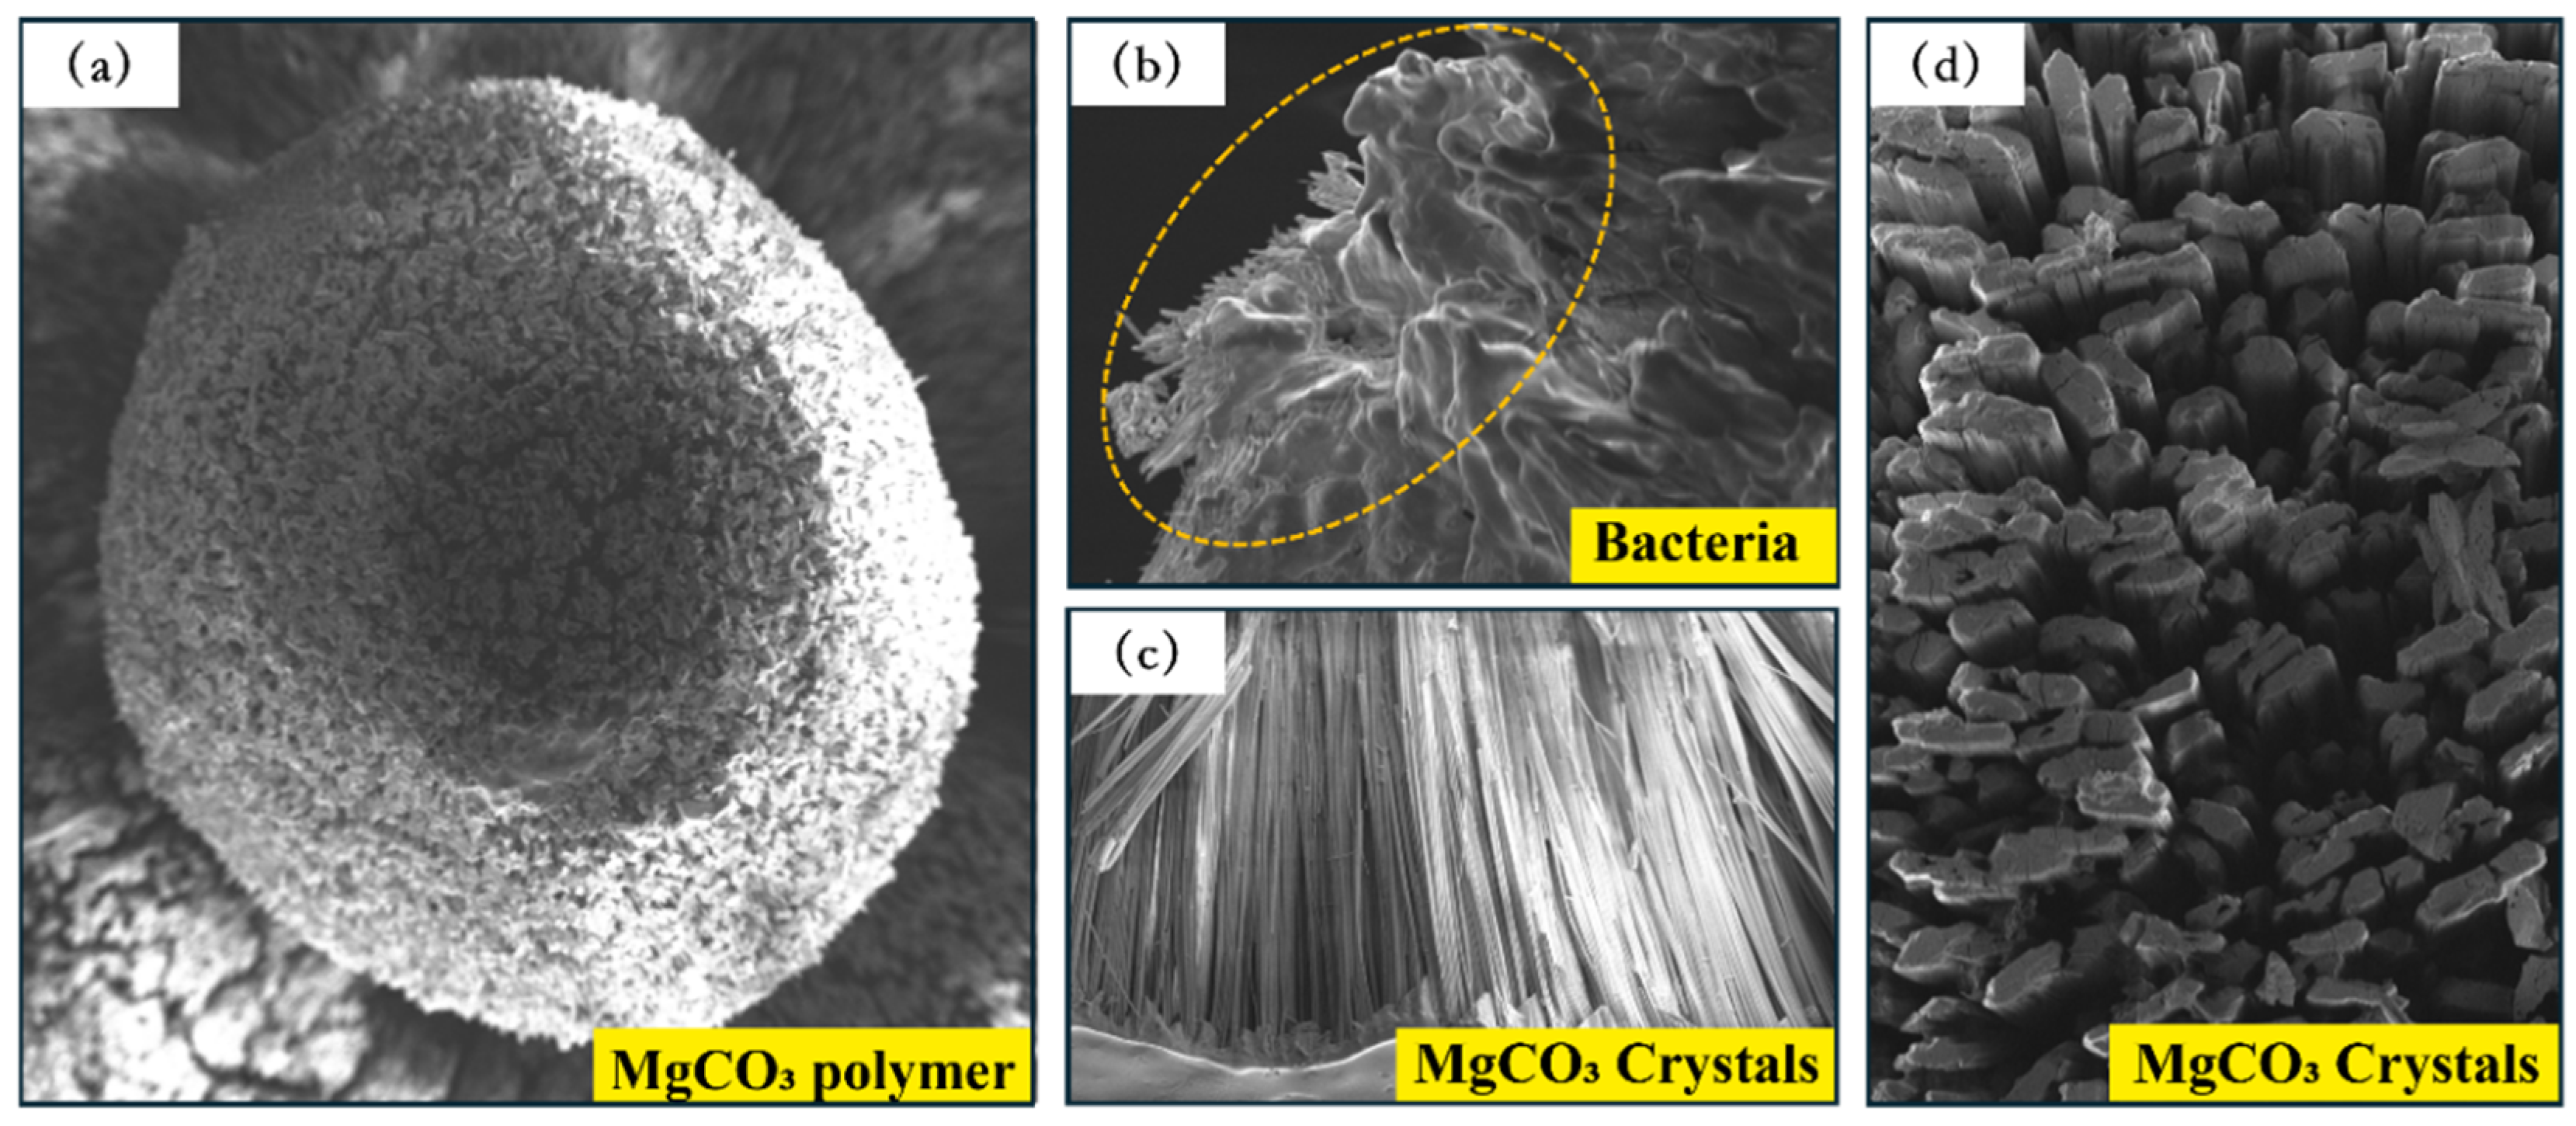
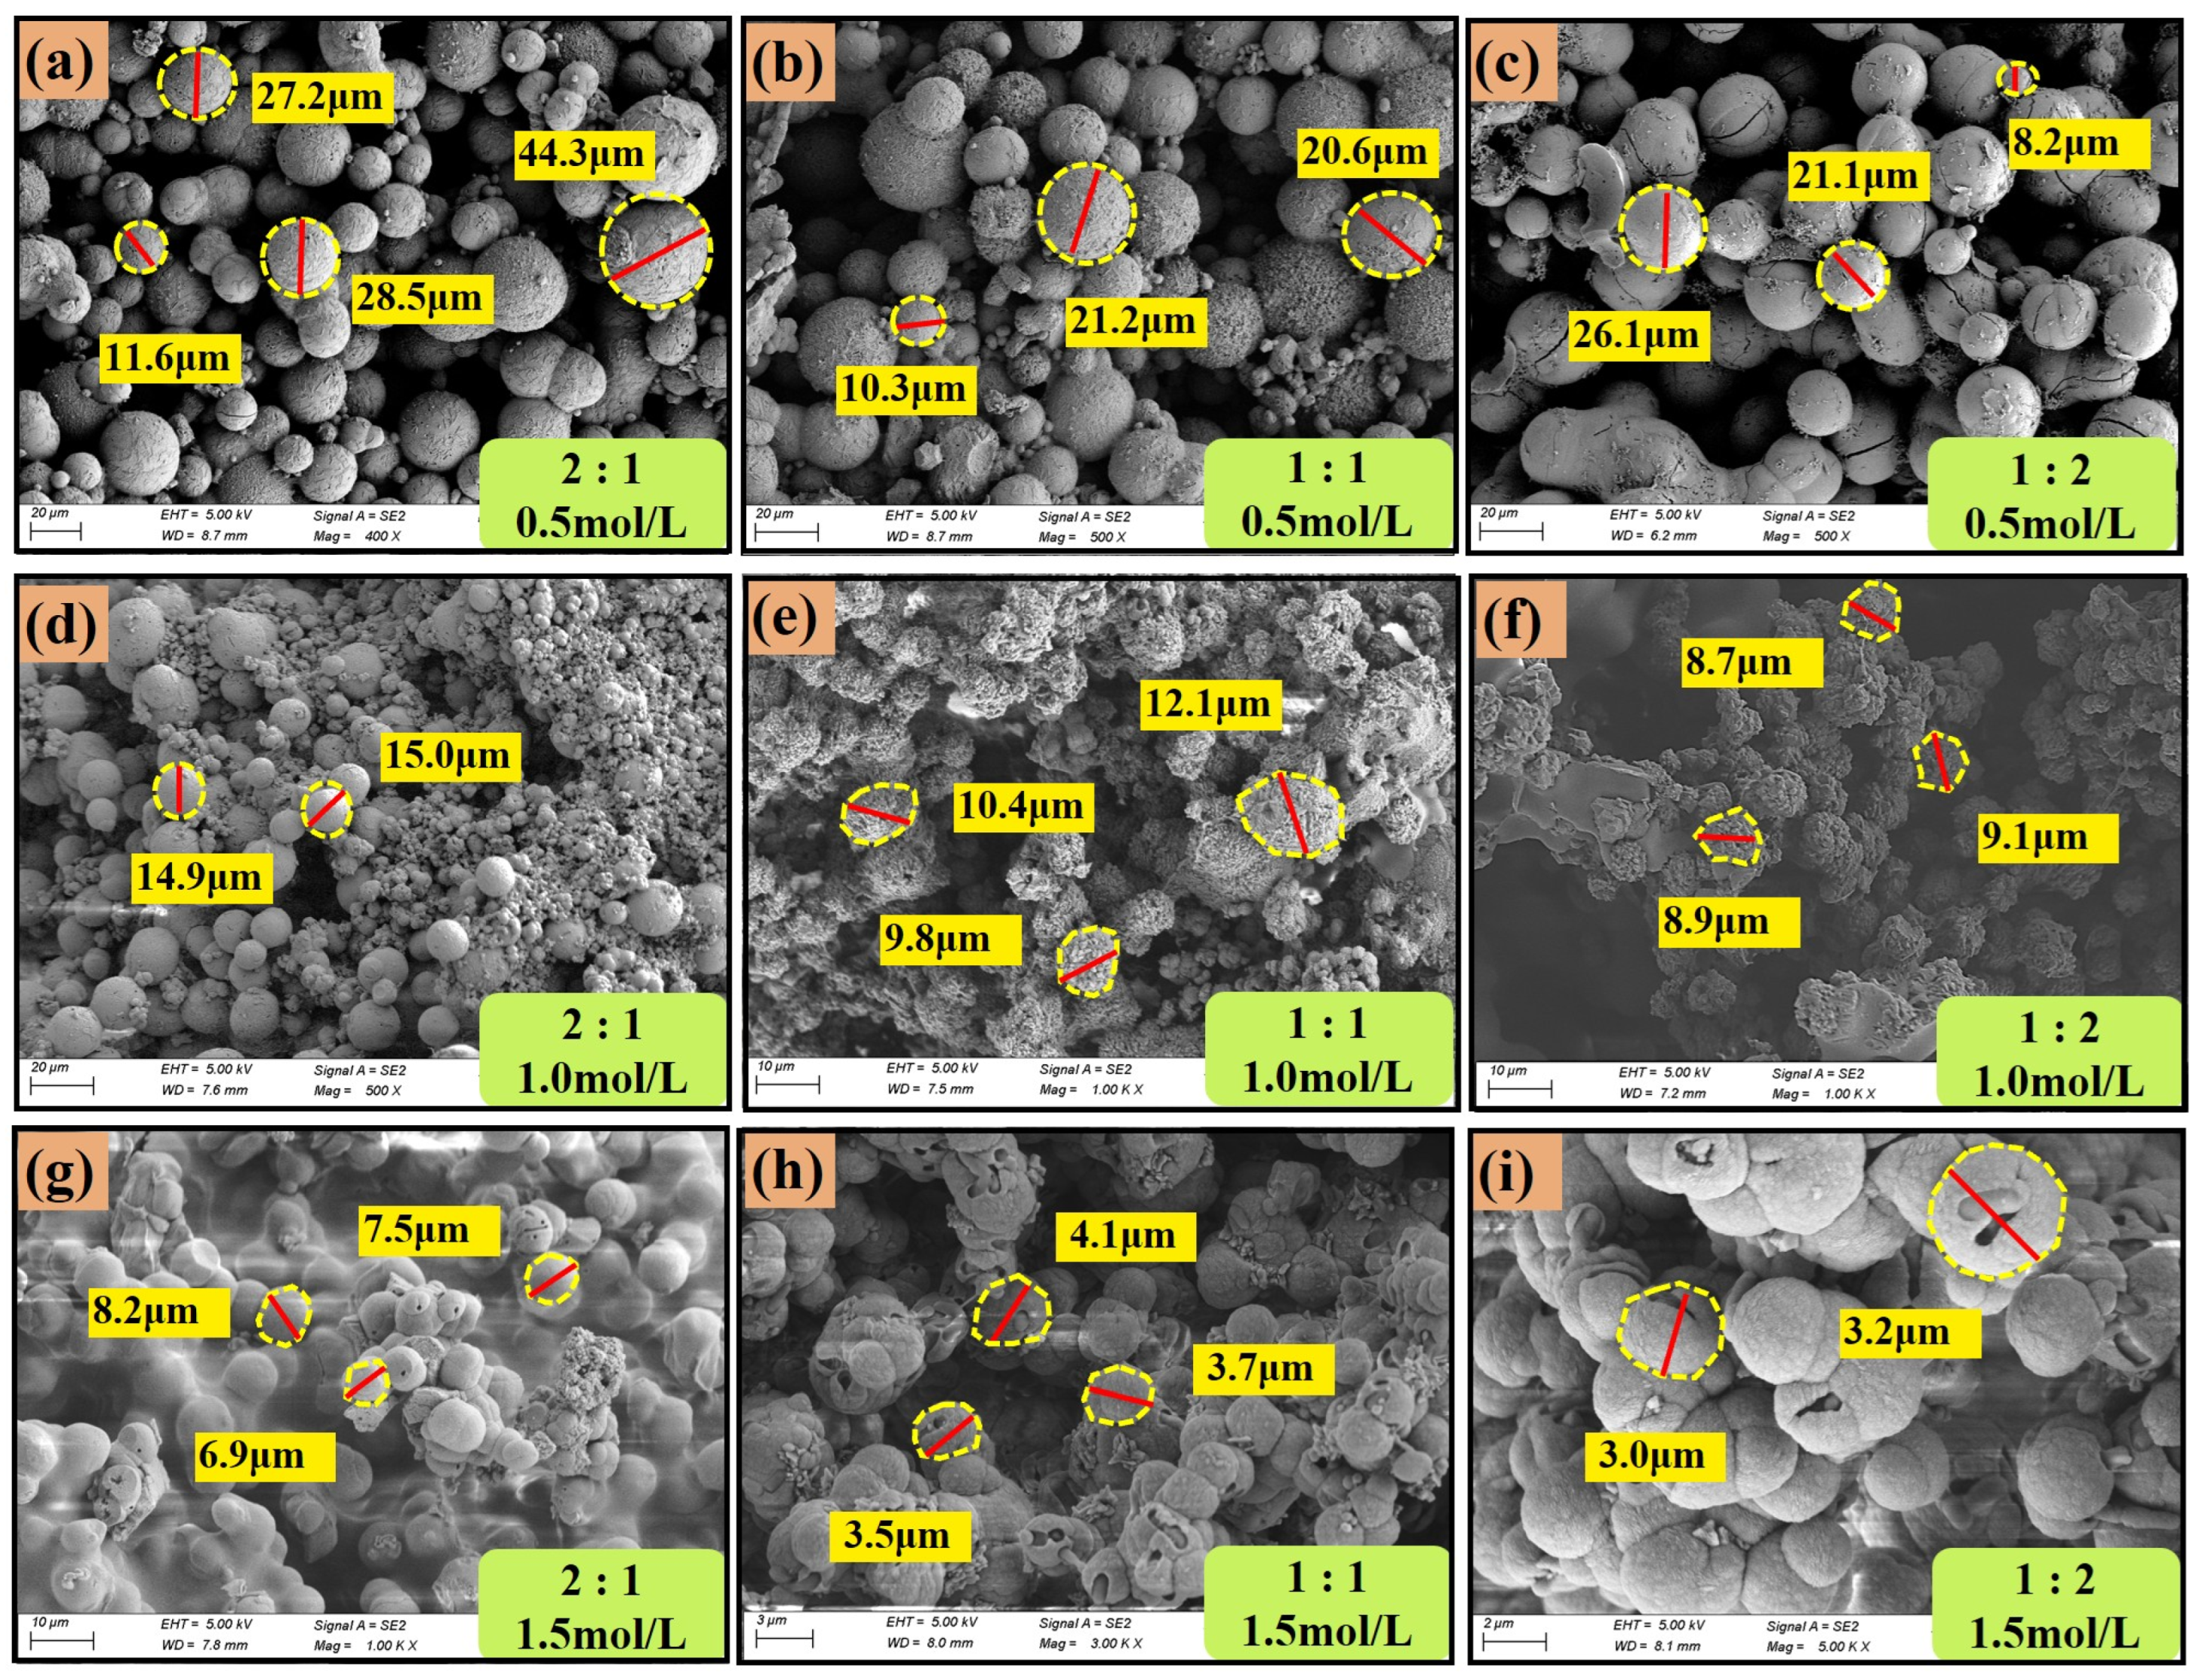
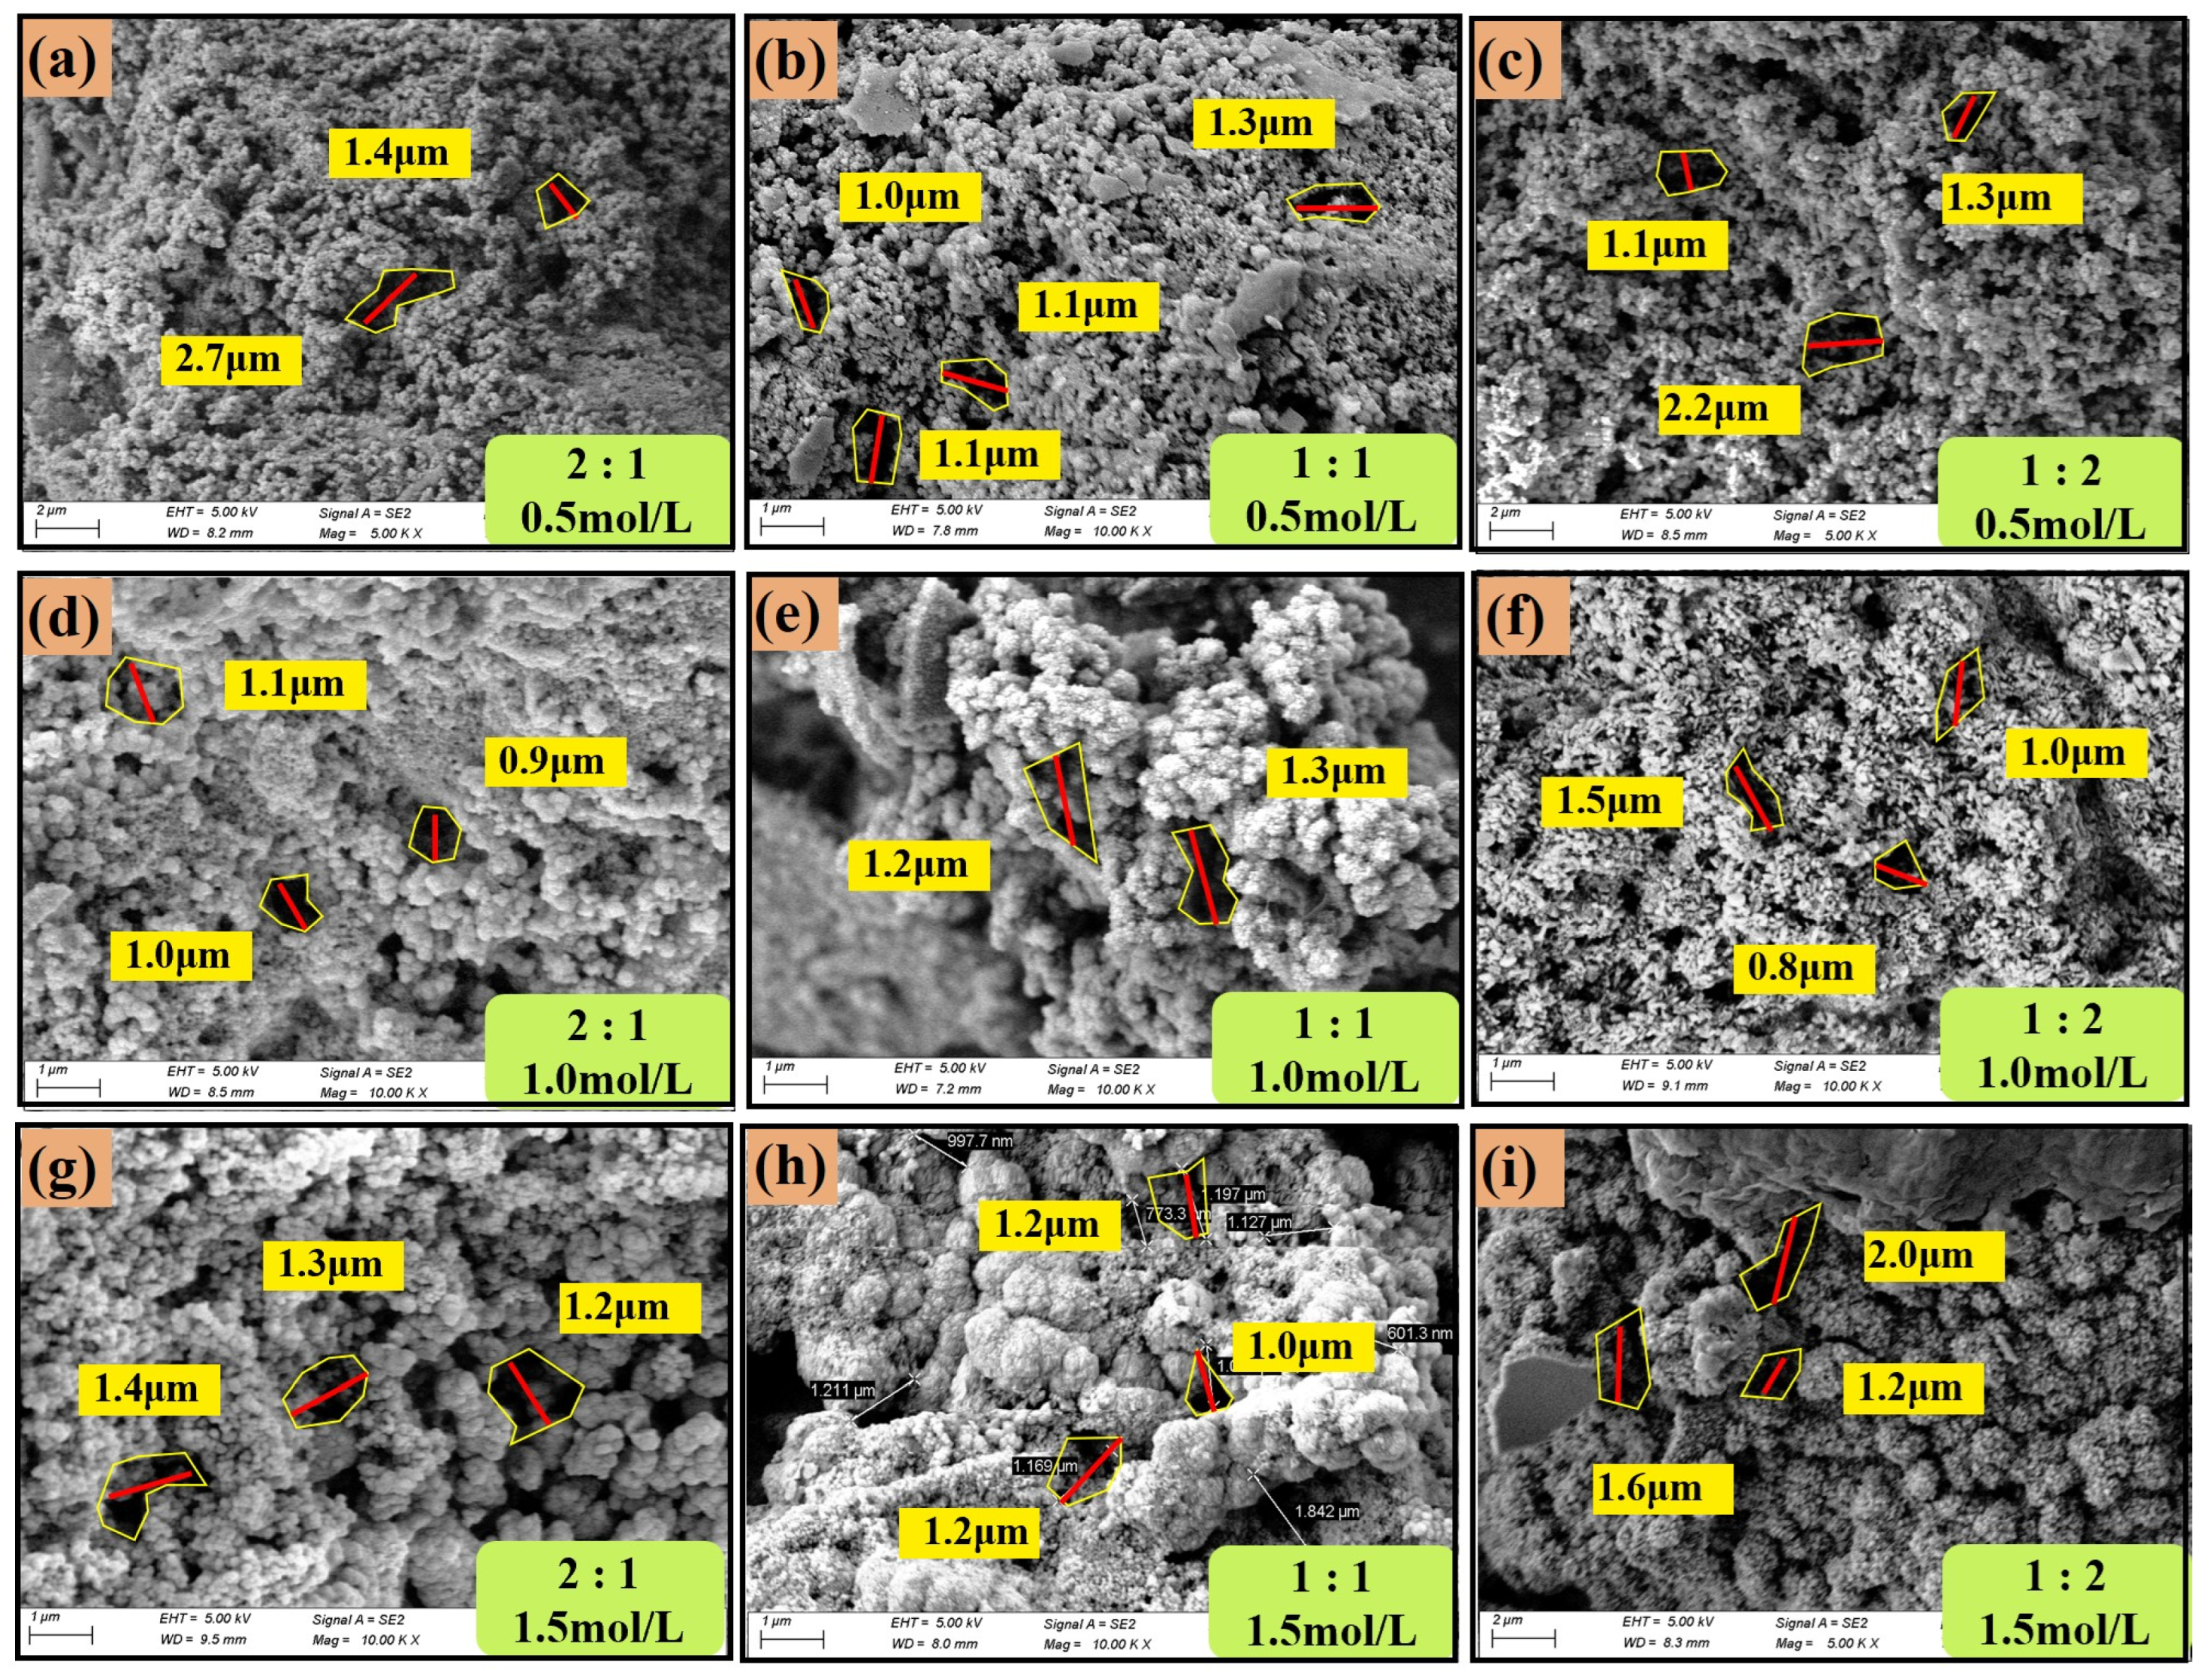
3.2.3. The Effect of CSC and B/C Ratio on MgCO3 Crystals

The diameter of MgCO3 crystals ranges from 5 to 30 μm. MgCO3 crystals are columnar, resulting in the relatively low conductivity of the samples. Figure 15 shows the scanning electron microscope (SEM) images of the crystal characteristics and size of MgCO3 precipitation under different grout liquid concentrations and B/C ratios.
From Table 4, it can be observed that at a grout liquid concentration of 0.5 mol/L, the average diameter is larger, with larger spherical diameters. This indicates that at lower concentrations, crystal growth is slower, and the formed crystals are coarser, leading to a lower microscopic density of the spherical crystals. At a grout liquid concentration of 1.0 mol/L, the crystal growth rate is moderate, but the number of spherical crystals does not show a clear trend. At higher grout liquid concentrations, the number of columnar crystals decreases, but their size increases.
Therefore, it can be concluded that the grout liquid concentration is the main factor affecting the MgCO3 crystal characteristics, and the B/C ratio also plays a role. At a grout liquid concentration of 0.5 mol/L, the Mg2+ concentration in the solution is insufficient, which restricts crystal formation. The crystal growth is slow but concentrated. As the B/C ratio decreases, the Mg2+ concentration gradually increases, resulting in an increased number of crystals, but the relatively insufficient Mg2+ quantity leads to smaller average diameters. At a grout liquid concentration of 1.0 mol/L, the Mg2+ concentration becomes saturated, and the number of crystals increases. The diameter of the crystals gradually decreases. At a concentration of 1.5 mol/L, the excessive Mg2+ concentration suppresses bacterial activity, leading to fewer nucleation points for crystals. However, the excess Mg2+ produces a large amount of MgCO3, causing the diameter of the MgCO3 crystals to increase. A reduction in the B/C ratio exacerbates this effect. At the same time, the size of the MgCO3 crystal polymer is influenced by the crystal size, showing a similar trend.

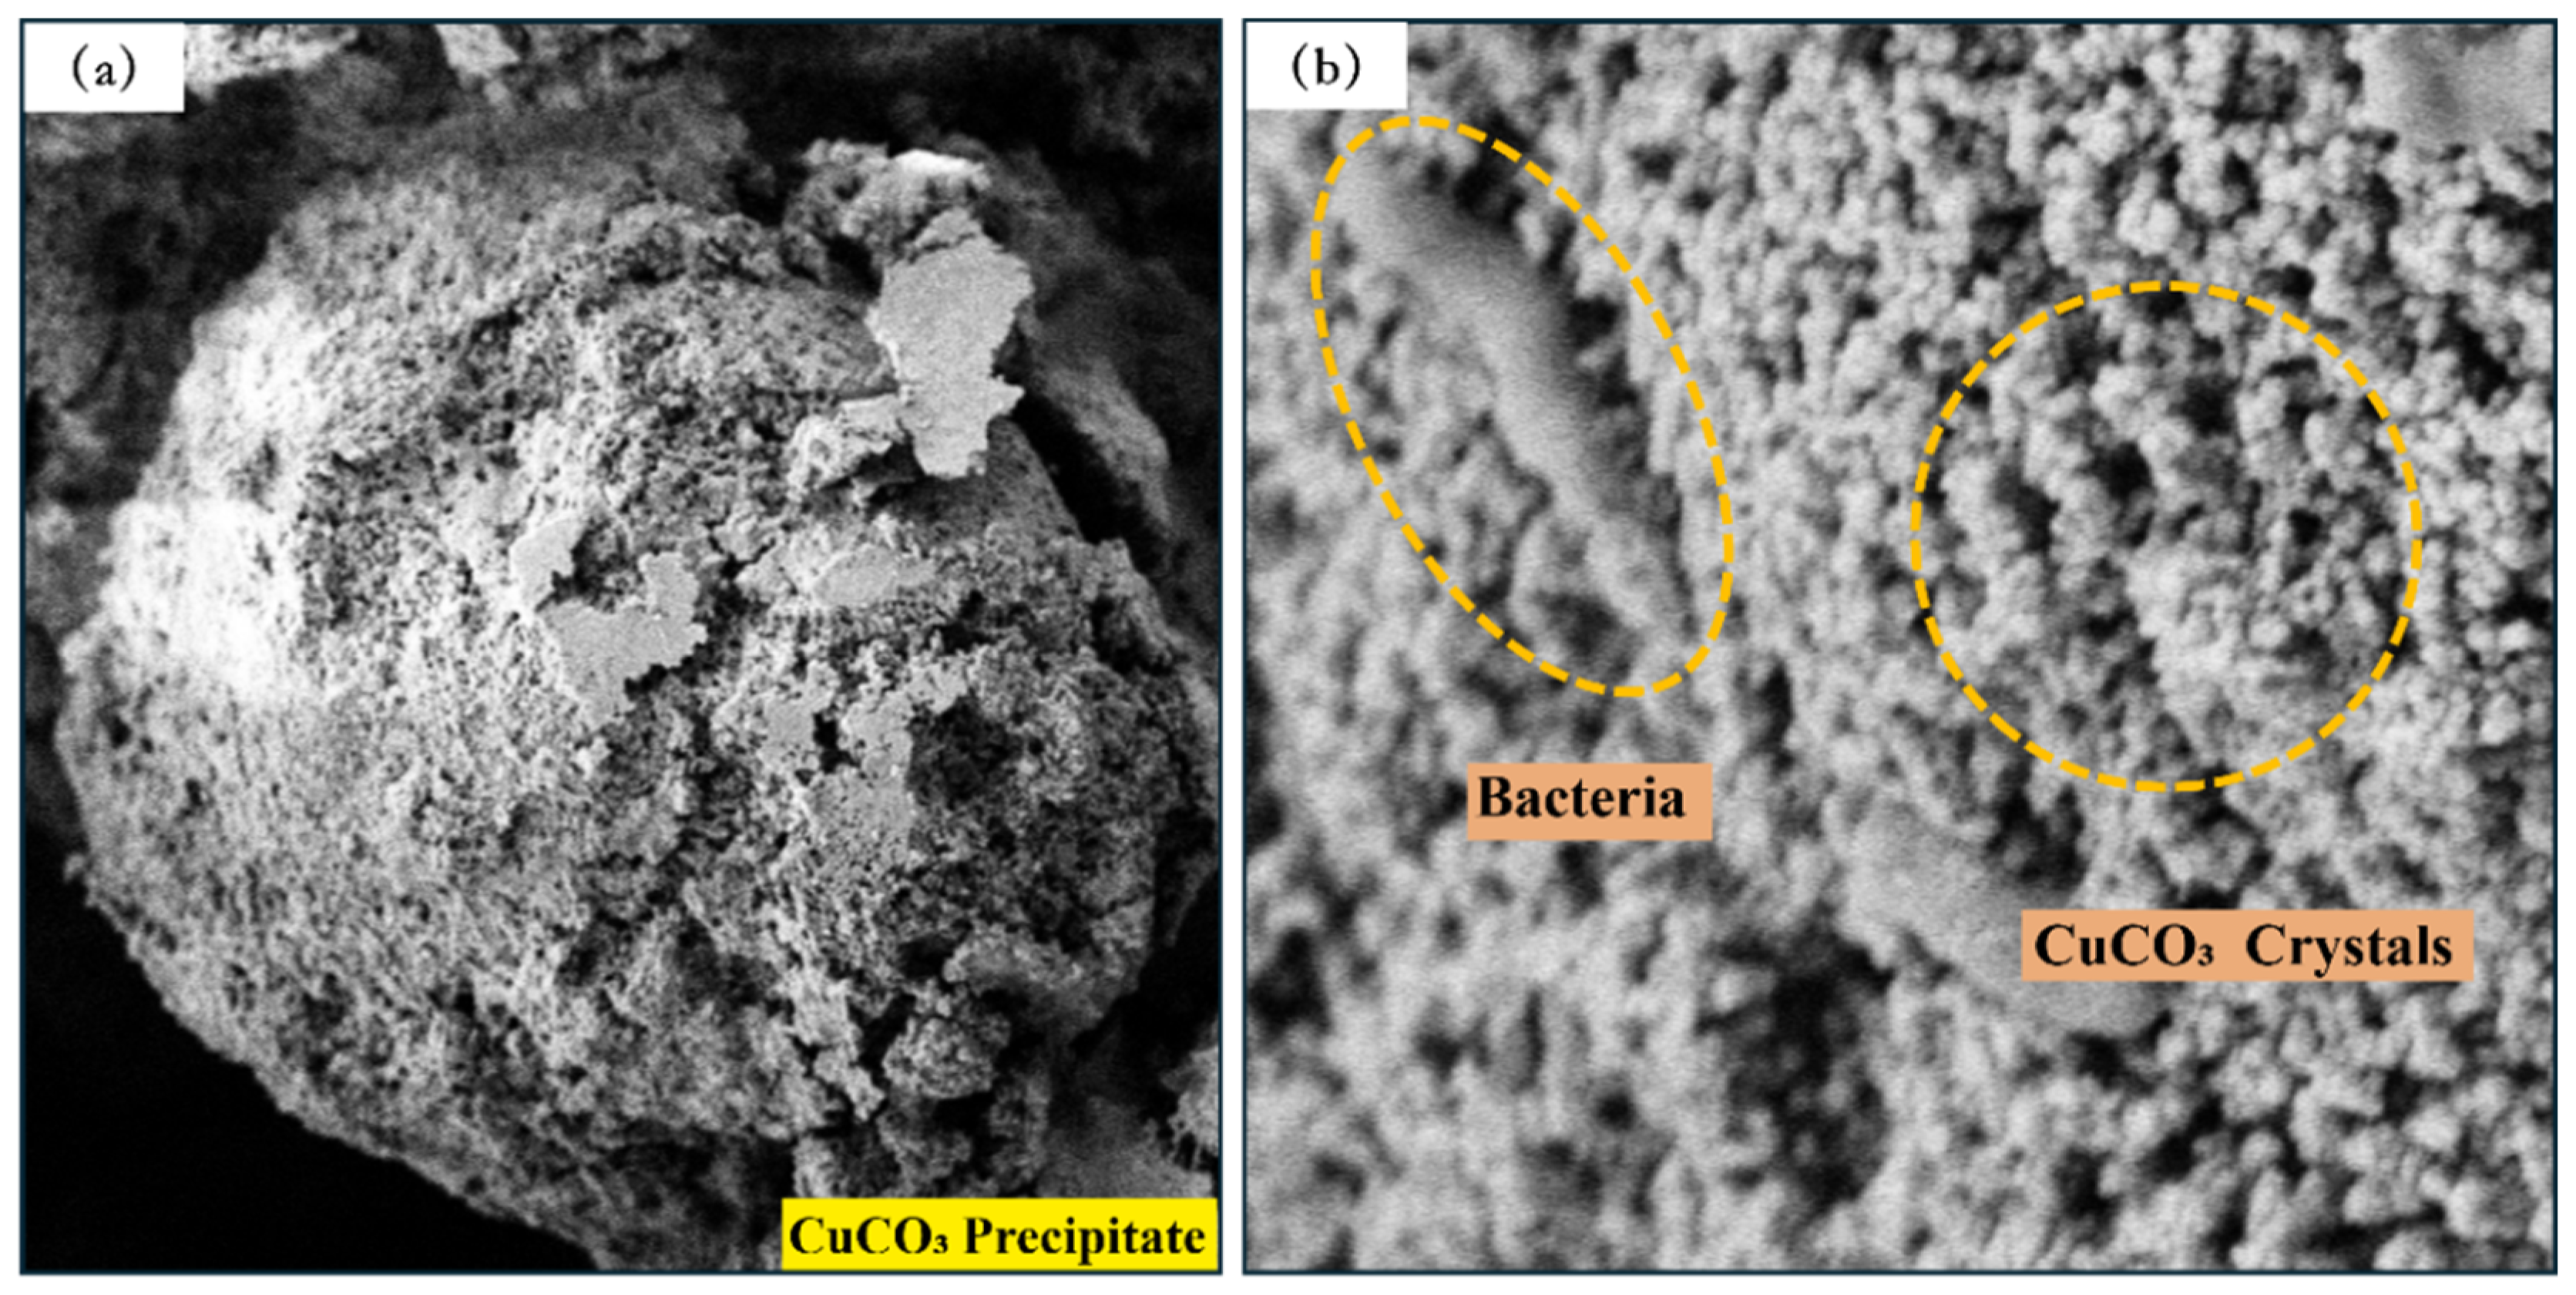
3.2.4. The Effect of CSC and B/C Ratio on CuCO3 Crystals

CuCO3 precipitate crystals are relatively uniform, which results in the grout liquid concentration and B/C ratio having a relatively small effect on the crystal size and characteristics. Scanning electron microscope (SEM) observations of the microstructural features of CuCO3 precipitates under different grout liquid concentrations and B/C ratios reveal the crystal characteristics and size, as shown in Figure 16 and Table 5.
The CuCO3 crystals have a size of approximately 1 μm. As a result, the CuCO3 crystal aggregates are also relatively uniform, with a diameter distribution between 100 and 200 μm. This is because Cu2+ ions affect the microbial activity, reducing the life activities of the bacteria, which leads to a slower precipitation rate for CuCO3 and smaller crystal diameters. Therefore, the grout liquid concentration and B/C ratio have a relatively minor impact on the crystal characteristics.

4. Conclusions

To investigate the effects of various factors on the precipitation amount and rate of carbonates, and to analyze the changes in characteristics such as the crystal diameter of carbonate precipitates, this study selected different types of grout liquids (CaCl2, MgCl2, CuCl2), concentrations (0.5 mol/L, 1.0 mol/L, 1.5 mol/L), and B/C ratios (2:1, 1:1, 1:2) for experimentation. The experimental results confirmed the following conclusions:
(1)
The type of grout liquid, concentration, and B/C ratio have a significant impact on the precipitation amount and rate. Among the metal sources, Mg2+ > Ca2+ > Cu2+. The CSC liquid is positively correlated with the precipitation amount and negatively correlated with the precipitation rate. The B/C ratio is positively correlated with the precipitation amount and negatively correlated with the precipitation rate. The scheme with a grout liquid concentration of 0.5 mol/L and a B/C ratio of 2:1 results in the highest production rate, which is beneficial for saving soil reinforcement resources. The scheme with a grout liquid concentration of 1.5 mol/L and a B/C ratio of 1:2 produces the most precipitation, which is beneficial for soil reinforcement effects.
(2)
When the CSC is 0.5 mol/L and the B/C ratio is 2:1, the CaCO3, MgCO3, and CuCO3 crystal polymers and crystals remain relatively intact, and bacteria are clearly visible. As the CSC increases and the B/C ratio decreases, excess metal ions participate in the reaction while inhibiting bacterial activity, leading to the gradual destruction of the crystals (CaCO3), crystal polymers (MgCO3, CuCO3), and spherical features. The number of bacteria on the surface sharply decreases.
(3)
As the concentration of the grout liquid increases and the B/C ratio decreases, the diameter of CaCO3 crystals show a decreasing trend. The MgCO3 crystals are influenced by both the grout liquid concentration and the B/C ratio. At low grout liquid concentrations, the average diameter is larger. As the B/C ratio decreases, the average diameter decreases. At higher grout liquid concentrations, the diameter of MgCO3 crystals increase, and the reduction in the B/C ratio further exacerbates this phenomenon. The diameter of CuCO3 crystals is relatively stable, around 1–2 μm.
(4)
This study systematically investigates the influence of multiple factors on microbial carbonate precipitation and crystal characteristics, aiming to establish optimized reaction conditions. By improving carbonate precipitation rates and quality, the approach reduces resource waste and unnecessary chemical usage, enhancing soil reinforcement effectiveness while minimizing environmental and resource impacts. The findings provide a theoretical foundation for sustainable soil remediation and ecological construction.

Author Contributions

Conceptualization, M.X. and W.G.; methodology, J.Z.; software, M.X.; validation, G.S. and F.J.; formal analysis, X.Z. (Xichen Zhao); investigation, X.Z. (Xuewei Zhang); resources, W.G.; data curation, X.X.; writing—original draft preparation, M.X.; writing—review and editing, J.Z.; visualization, M.X.; supervision, J.Z.; project administration, W.G.; funding acquisition, W.G. All authors have read and agreed to the published version of the manuscript.

Funding

This work described herein was supported by the Xinjiang Tianshan Talent Project-Youth Outstanding Scientific and Technological Innovation Talent Cultivation Project (2023TSYCCX0081).

Data Availability Statement

Some or all data, models, or codes generated or used during the study are available from the corresponding authors by request.

Acknowledgments

The authors thank the editor for providing helpful suggestions for improving the quality of this manuscript.

Conflicts of Interest

The authors declare no conflicts of interest.

References

  1. Dupraz, C.; Reid, R.P.; Braissant, O.; Decho, A.W.; Norman, R.S.; Visscher, P.T. Processes of carbonate precipitation in modern microbial mats. Earth Sci. Rev. 2009, 96, 141–162. [Google Scholar] [CrossRef]
  2. Jain, S. Influence of biomass and chemicals on kinetics of ureolysis-based carbonate biomineral precipitation. Environ. Earth Sci. 2024, 83, 58. [Google Scholar] [CrossRef]
  3. Liu, P.; Zhang, Y.; Tang, Q.; Shi, S. Bioremediation of metal-contaminated soils by microbially-induced carbonate precipitation and its effects on ecotoxicity and long-term stability. Biochem. Eng. J. 2021, 166, 107856. [Google Scholar] [CrossRef]
  4. Kakelar, M.M.; Yavari, M.; Yousefi, M.R.; Nimtaj, A. The influential factors in the effectiveness of microbial induced carbonate precipitation (micp) for soil consolidation. J. Hum. Environ. Health Promot. 2020, 6, 40–46. [Google Scholar] [CrossRef]
  5. Zhang, S.; Ding, J.; Wang, S.; Li, C. Evaluation of calcium carbonate production and cementitious characteristics of enzymatically induced carbonate precipitation during environmental adjustment. Constr. Build. Mater. 2024, 449, 138415. [Google Scholar] [CrossRef]
  6. Whiffin, V.S.; van Paassen, L.A.; Harkes, M.P. Microbial carbonate precipitation as a soil improvement technique. Geomicrobiol. J. 2007, 24, 417–423. [Google Scholar] [CrossRef]
  7. Xue, Z.-F.; Cheng, W.-C.; Wang, L.; Xie, Y.-X. Catalyzing urea hydrolysis using two-step microbial-induced carbonate precipitation for copper immobilization: Perspective of ph regulation. Front. Microbiol. 2022, 13, 1001464. [Google Scholar] [CrossRef]
  8. Zhao, T.; Du, H.; Shang, R. The effect of bacteria-to-calcium ratio on microbial-induced carbonate precipitation (micp) under different sequences of calcium-source introduction. Materials 2024, 17, 1881. [Google Scholar] [CrossRef]
  9. Sheikh, S.A.; Atmapoojya, S.L. Experimental study on factors affecting the efficiency of microbially induced carbonate precipitation in soil. Mater. Today Proc. 2022, 60, 275–280. [Google Scholar] [CrossRef]
  10. Sun, X.; Miao, L.; Tong, T.; Wang, C. Study of the effect of temperature on microbially induced carbonate precipitation. Acta Geotech. 2018, 14, 627–638. [Google Scholar] [CrossRef]
  11. Chen, S.; Kang, B.; Zha, F.; Shen, Y.; Chu, C.; Tao, W. Effects of different mg/ca molar ratio on the formation of carbonate minerals in microbially induced carbonate precipitation (micp) process. Constr. Build. Mater. 2024, 442, 137643. [Google Scholar] [CrossRef]
  12. Jiao, Y.; Feng, Q.; Li, X. The co-effect of collagen and magnesium ions on calcium carbonate biomineralization. Mater. Sci. Eng. C 2006, 26, 648–652. [Google Scholar] [CrossRef]
  13. Li, Y.; Zhang, Y.; Bi, J.; Zhao, Y.; Li, Y.; Zhong, X.; Zheng, K. Influences of calcium and magnesium sources on microbially modified strongly weathered phyllite filler. Constr. Build. Mater. 2024, 416, 135118. [Google Scholar] [CrossRef]
  14. Su, F.; Wang, Y.; Liu, Y.; Zhang, J.; Liu, X.; Zhang, S. Factors affecting soil treatment with the microbially induced carbonate precipitation technique and its optimization. J. Microbiol. Methods 2023, 211, 106771. [Google Scholar] [CrossRef]
  15. Zhang, C.; Li, F.; Yang, K.; Zhou, J. The formation of calcium–magnesium carbonate minerals induced by curvibacter sp. Hj-1 under different mg/ca molar ratios. Minerals 2024, 14, 606. [Google Scholar] [CrossRef]
  16. Okwadha, G.D.; Li, J. Optimum conditions for microbial carbonate precipitation. Chemosphere 2010, 81, 1143–1148. [Google Scholar] [CrossRef]
  17. Qiao, S.; Zeng, G.; Wang, X.; Dai, C.; Sheng, M.; Chen, Q.; Xu, F.; Xu, H. Multiple heavy metals immobilization based on microbially induced carbonate precipitation by ureolytic bacteria and the precipitation patterns exploration. Chemosphere 2021, 274, 129661. [Google Scholar] [CrossRef]
  18. Li, X.; Wang, Y.; Tang, J.; Li, K. Removal behavior of heavy metals from aqueous solutions via microbially induced carbonate precipitation driven by acclimatized sporosarcina pasteurii. Appl. Sci. 2022, 12, 9958. [Google Scholar] [CrossRef]
  19. Luciani, G.; Murugan, R.; Suraishkumar, G.K.; Mukherjee, A.; Dhami, N.K. Insights into the influence of cell concentration in design and development of microbially induced calcium carbonate precipitation (micp) process. PLoS ONE 2021, 16, e0254536. [Google Scholar] [CrossRef]
  20. Jarwar, M.A.; Dumontet, S.; Pasquale, V.; Chen, C. Microbial induced carbonate precipitation: Environments, applications, and mechanisms. Geomicrobiol. J. 2022, 39, 833–851. [Google Scholar] [CrossRef]
  21. Achal, V.; Peng, J.; Liu, Z. Influence of temperature on microbially induced calcium carbonate precipitation for soil treatment. PLoS ONE 2019, 14, e0218396. [Google Scholar] [CrossRef]
  22. Chen, M.; Gowthaman, S.; Nakashima, K.; Kawasaki, S. Influence of humic acid on microbial induced carbonate precipitation for organic soil improvement. Environ. Sci. Pollut. Res. 2022, 30, 15230–15240. [Google Scholar] [CrossRef] [PubMed]
  23. Shahrokhi-Shahraki, R.; Zomorodian, S.M.A.; Niazi, A.; O’Kelly, B.C. Improving sand with microbial-induced carbonate precipitation. Proc. Inst. Civ. Eng. Ground Improv. 2015, 168, 217–230. [Google Scholar] [CrossRef]
  24. Chen, X.; Zhang, D.; Larson, S.L.; Ballard, J.H.; Knotek-Smith, H.M.; Nie, J.; Hu, N.; Ding, D.; Han, F.X. Microbially induced carbonate precipitation techniques for the remediation of heavy metal and trace element–polluted soils and water. Water Air Soil Pollut. 2021, 232, 268. [Google Scholar] [CrossRef]
  25. Hao, Z.; Su, Y.; Liu, S.; Zhang, X. Roles of bacteria and extracellular polymeric substance in calcium carbonate formation: Insights from the effects of calcium source and deposition rate on nucleation. Biochem. Eng. J. 2024, 202, 109160. [Google Scholar] [CrossRef]
  26. Ouyang, J.; Liu, K.; Sun, D.; Xu, W.; Wang, A.; Ma, R. A focus on ca2+ supply in microbial induced carbonate precipitation and its effect on recycled aggregate. J. Build. Eng. 2022, 51, 104334. [Google Scholar] [CrossRef]
  27. Tamayo-Figueroa, D.P.; Castillo, E.; Brandão, P.F.B. Metal and metalloid immobilization by microbiologically induced carbonates precipitation. World J. Microbiol. Biotechnol. 2019, 35, 58. [Google Scholar] [CrossRef]
  28. Sujiritha, P.B.; Vikash, V.L.; Ponesakki, G.; Ayyadurai, N.; Kamini, N.R. Microbially induced carbonate precipitation with arthrobacter creatinolyticus: An eco-friendly strategy for mitigation of chromium contamination. J. Environ. Manag. 2024, 365, 121300. [Google Scholar] [CrossRef]
  29. Castro-Alonso, M.J.; Montañez-Hernandez, L.E.; Sanchez-Muñoz, M.A.; Franco, M.R.M.; Narayanasamy, R.; Balagurusamy, N. Microbially induced calcium carbonate precipitation (micp) and its potential in bioconcrete: Microbiological and molecular concepts. Front. Mater. 2019, 6, 126. [Google Scholar] [CrossRef]
  30. Zhang, W.; Zhang, H.; Xu, R.; Qin, H.; Liu, H.; Zhao, K. Heavy metal bioremediation using microbially induced carbonate precipitation: Key factors and enhancement strategies. Front. Microbiol. 2023, 14, 1116970. [Google Scholar] [CrossRef]
  31. Wu, L.; Miao, L.; Sun, X.; Wang, H. Effect of calcium sources on enzyme-induced carbonate precipitation to solidify desert aeolian sand. J. Environ. Manag. 2024, 366, 121687. [Google Scholar] [CrossRef] [PubMed]
  32. Omoregie, A.I.; Ouahbi, T.; Basri, H.F.; Ong, D.E.L.; Muda, K.; Ojuri, O.O.; Flores, D.J.; Ammami, M.T. Heavy metal immobilisation with microbial-induced carbonate precipitation: A review. Geotech. Res. 2024, 11, 188–212. [Google Scholar] [CrossRef]
  33. Zhang, J.; Shi, X.; Chen, X.; Huo, X.; Yu, Z.; Awoyera, P. Microbial-induced carbonate precipitation: A review on influencing factors and applications. Adv. Civ. Eng. 2021, 2021, 9974027. [Google Scholar] [CrossRef]
  34. Xue, Z.-F.; Cheng, W.-C.; Wang, L.; Qin, P.; Zhang, B. Revealing degradation and enhancement mechanisms affecting copper (cu) immobilization using microbial-induced carbonate precipitation (micp). J. Environ. Chem. Eng. 2022, 10, 108479. [Google Scholar] [CrossRef]
  35. Jiang, N.-J.; Liu, R.; Du, Y.-J.; Bi, Y.-Z. Microbial induced carbonate precipitation for immobilizing pb contaminants: Toxic effects on bacterial activity and immobilization efficiency. Sci. Total Environ. 2019, 672, 722–731. [Google Scholar] [CrossRef] [PubMed]
  36. Zhang, J.; Shi, X.; Guan, W.; Liu, Y.; Xia, X.; Yuan, J.; Chen, X. Mineralization performance and crystal characteristics of microbial induced carbonate precipitation in lead–zinc tailings under multiple factors. Constr. Build. Mater. 2023, 403, 133081. [Google Scholar] [CrossRef]
  37. Gu, Z.; Chen, Q.; Wang, L.; Niu, S.; Zheng, J.; Yang, M.; Yan, Y. Morphological changes of calcium carbonate and mechanical properties of samples during microbially induced carbonate precipitation (micp). Materials 2022, 15, 7754. [Google Scholar] [CrossRef]
  38. Wilcox, S.M.; Mulligan, C.N.; Neculita, C.M. Microbially induced calcium carbonate precipitation as a bioremediation technique for mining waste. Toxics 2024, 12, 107. [Google Scholar] [CrossRef]
  39. Liu, X.-j.; Fan, J.-Y.; Yu, J.; Gao, X. Solidification of loess using microbial induced carbonate precipitation. J. Mt. Sci. 2021, 18, 265–274. [Google Scholar] [CrossRef]
  40. Nishimura, I.; Yabiku, Y.; Shinyama, Y.; Mukunoki, T.; Matsubara, H. Ct image-based simulation of microbially induced carbonate precipitation. Comput. Geotech. 2024, 174, 106651. [Google Scholar] [CrossRef]
  41. Wang, Y.; Wang, Z.; Ali, A.; Su, J.; Huang, T.; Hou, C.; Li, X. Microbial-induced calcium precipitation: Bibliometric analysis, reaction mechanisms, mineralization types, and perspectives. Chemosphere 2024, 362, 142762. [Google Scholar] [CrossRef] [PubMed]
  42. Kim, Y.; Roh, Y. Microbially induced carbonate precipitation using microorganisms enriched from calcareous materials in marine environments and their metabolites. Minerals 2019, 9, 722. [Google Scholar] [CrossRef]
Figure 1. Experimental flowchart. (a) Bacterial Culture. (b) Cementation Solution Preparation. (c) Microbially Induced Calcium Carbonate Precipitation (MICP) Experiment. (d) Precipitate Filtration and Gravimetric Analysis. (e) Mechanistic Analysis.
Processes 13 00711 g001
Figure 2. XRD patterns of the precipitation. (a) CaCO3. (b) MgCO3. (c) CuCO3.
Processes 13 00711 g002
Figure 3. Bar chart of the impact of TCS on yield.
Processes 13 00711 g003
Figure 4. Line chart of the impact of TCS on yield rate.
Processes 13 00711 g004
Figure 5. Effect curves of CaCO3 precipitation production and yield under different CSC conditions.
Processes 13 00711 g005
Figure 6. Effect curves of MgCO3 precipitation production and yield under different CSC conditions.
Processes 13 00711 g006
Figure 7. Effect curves of CuCO3 precipitation production and yield under different CSC conditions.
Processes 13 00711 g007
Figure 8. Effect curves of CaCO3 precipitation production and yield under B/C ratio conditions.
Processes 13 00711 g008
Figure 9. Effect curves of MgCO3 precipitation production and yield under B/C ratio conditions.
Processes 13 00711 g009
Figure 10. Effect curves of CuCO3 precipitation production and yield under B/C ratio conditions.
Processes 13 00711 g010
Figure 11. CaCO3 precipitate crystal characteristics diagram. (a) CaCO3 Precipitate. (b) CaCO3 Crystals. (c) CaCO3 Particles. (d) Bacteria.
Processes 13 00711 g011
Figure 12. MgCO3 precipitate crystal characteristics diagram. (a) MgCO3 Polymer. (b) Bacteria. (c) Cross-sectional View of MgCO3 Crystals. (d) Planar View of MgCO3 Crystals.
Processes 13 00711 g012
Figure 13. CuCO3 precipitate crystal characteristics diagram. (a) CuCO3 Precipitation. (b) Bacteria and CuCO3 Crystals.
Processes 13 00711 g013
Figure 14. SEM image of CaCO3 precipitate crystal diameter. (a) CSC: 0.5 mol/L, B/C Ratio: 2:1. (b) CSC: 0.5 mol/L, B/C Ratio: 1:1. (c) CSC: 0.5 mol/L, B/C Ratio: 1:2. (d) CSC: 1.0 mol/L, B/C Ratio: 2:1. (e) CSC: 1.0 mol/L, B/C Ratio: 1:1. (f) CSC: 1.0 mol/L, B/C Ratio: 1:2. (g) CSC: 1.5 mol/L, B/C Ratio: 2:1. (h) CSC: 1.5 mol/L, B/C Ratio: 1:1. (i) CSC: 1.5 mol/L, B/C Ratio: 1:2.
Processes 13 00711 g014
Figure 15. SEM image of MgCO3 precipitate crystal diameter. (a) CSC: 0.5 mol/L, B/C Ratio: 2:1. (b) CSC: 0.5 mol/L, B/C Ratio: 1:1. (c) CSC: 0.5 mol/L, B/C Ratio: 1:2. (d) CSC: 1.0 mol/L, B/C Ratio: 2:1. (e) CSC: 1.0 mol/L, B/C Ratio: 1:1. (f) CSC: 1.0 mol/L, B/C Ratio: 1:2. (g) CSC: 1.5 mol/L, B/C Ratio: 2:1. (h) CSC: 1.5 mol/L, B/C Ratio: 1:1. (i) CSC: 1.5 mol/L, B/C Ratio: 1:2.
Processes 13 00711 g015
Figure 16. SEM image of CuCO3 precipitate crystal diameter. (a) CSC: 0.5 mol/L, B/C Ratio: 2:1. (b) CSC: 0.5 mol/L, B/C Ratio: 1:1. (c) CSC: 0.5 mol/L, B/C Ratio: 1:2. (d) CSC: 1.0 mol/L, B/C Ratio: 2:1. (e) CSC: 1.0 mol/L, B/C Ratio: 1:1. (f) CSC: 1.0 mol/L, B/C Ratio: 1:2. (g) CSC: 1.5 mol/L, B/C Ratio: 2:1. (h) CSC: 1.5 mol/L, B/C Ratio: 1:1. (i) CSC: 1.5 mol/L, B/C Ratio: 1:2.
Processes 13 00711 g016
Table 1. Experimental Design Table.
LevelTCS 1CSC 2B/C Ratio 3
1CaCl20.5 mol/L2:1
2MgCl21.0 mol/L1:1
3CuCl21.5 mol/L1:2
1 TCS: type of cementing solution, 2 cementing solution concentration, and 3 the ratio of bacteria to cementing solution.
Table 2. Experimental Design Protocol Table.
TestCSCB/C Ratio
10.5 mol/L2:1
21:1
31:2
41.0 mol/L2:1
51:1
61:2
71.5 mol/L2:1
81:1
91:2
Table 3. CaCO3 precipitate crystal characteristics statistics.
CSCB/C RatioAverage Diameter (μm)
10.5 mol/L2:127
20.5 mol/L1:123
30.5 mol/L1:220
41 mol/L2:115
51 mol/L1:110
61 mol/L1:29
71.5 mol/L2:17
81.5 mol/L1:13.5
91.5 mol/L1:23
Table 4. Characteristics of MgCO3 precipitate crystals.
CSCB/C RatioAverage Diameter (μm)Average Diameter of Spherical Polymer Aggregates (μm)
10.5 mol/L2:1201420
20.5 mol/L1:1141120
30.5 mol/L1:29700
41 mol/L2:17416
51 mol/L1:15927
61 mol/L1:23.51152
71.5 mol/L2:1111378
81.5 mol/L1:1261495
91.5 mol/L1:2302940
Table 5. Statistical table of CuCO3 precipitate crystal characteristics.
CSCB/C RatioAverage Diameter of Spherical Polymer Aggregates (μm)
10.5 mol/L2:1125.5
20.5 mol/L1:1148.04
30.5 mol/L1:2182.9
41 mol/L2:1160
51 mol/L1:1159
61 mol/L1:2133
71.5 mol/L2:1153
81.5 mol/L1:1132
91.5 mol/L1:2148
Disclaimer/Publisher’s Note: The statements, opinions and data contained in all publications are solely those of the individual author(s) and contributor(s) and not of MDPI and/or the editor(s). MDPI and/or the editor(s) disclaim responsibility for any injury to people or property resulting from any ideas, methods, instructions or products referred to in the content.

