Article

Fischer–Tropsch Biofuel Production from Supercritical Water Gasification of Lignocellulosic Biomass: Process Modelling and Life-Cycle Assessment

by
Dimitrios Katsourinis
,
Dimitrios Giannopoulos
* and
Maria Founti
Laboratory of Heterogeneous Mixtures and Combustion Systems, School of Mechanical Engineering, National Technical University of Athens, 15780 Athens, Greece
*
Author to whom correspondence should be addressed.
Processes 2025, 13(3), 895; https://doi.org/10.3390/pr13030895
Submission received: 30 January 2025 / Revised: 14 March 2025 / Accepted: 17 March 2025 / Published: 18 March 2025
(This article belongs to the Special Issue Processes in Biofuel Production and Biomass Valorization)

Abstract

:
The production of Fischer–Tropsch liquid biofuels from the supercritical water gasification (SCWG) of lignocellulosic biomass is energetically and environmentally assessed by coupling process modelling with Life-Cycle Assessment. A conceptual process model has been developed comprising the following stages: (a) the thermochemical conversion of lignocellulosic biomass in a supercritical water gasification (SCWG) reactor, (b) syngas upgrade through dry reforming (DRR), (c) liquid biofuel production from Fischer–Tropsch synthesis (FTS) and (d) FT product upgrade and refinement, so that diesel-like (FT—Diesel), gasoline-like (FT—Gasoline), and jet fuel-like (FT Jet Fuel) yields are predicted. Parametric studies have been performed, highlighting the effect of biomass concentration and SCWG temperature on end-product yields. Furthermore, alternative scenarios have been examined with respect to: (a) maximizing FT liquid biofuel yields and (b) minimizing heat requirements to potentially achieve a thermally self-sustained process. The results of the simulated process, including liquid biofuel yield and heat-demand predictions, are used as inputs in the inventories compiled for the Life-Cycle Assessment of the overall process. Agricultural and feedstock transportation stages have also been considered. Energetic and environmental benefits and challenges are highlighted through the quantification of Global Warming Potential (GWP), while special importance is assigned to following the REDII sustainability methodology and reference data.

1. Introduction

The transport sector is one of the largest sources of greenhouse gas emissions in the EU. Despite efforts, transport emissions have increased by 26% since 1990, and although estimates of 2023 emissions indicated a small drop of 0.8% compared to 2022, their projected share for 2030 on total emissions could reach 44% [1].
Although the use of innovative technologies for the decarbonization of the transport sector (e.g., electrification or hydrogen) is strongly promoted and under extensive investigation, the operation of large-scale applications is yet to be established. Therefore, biofuels comprise a convenient, reliable, and tangible short-term solution. Since 2009, the EU has introduced Renewable Energy Directives (RED) [2,3], according to which all country members are obliged to cover a significant part of their transport energy demand from renewable sources. In the latest amendment (Renewable Energy Directive III), published in October 2023 [4], it is stated that renewable energy sources in the overall energy mix must increase to at least 42.5% by 2030. An additional non-mandatory 2.5% top is also foreseen to achieve an overall EU target of 45% and be aligned with the REPowerEU Plan [5]. The sub-target for advanced biofuels was kept constant at 3.5%.
Supercritical water gasification (SCWG) is a complicated, hydrothermal process where biomass is converted to syngas containing CH4, CO, CO2, and H2 [6]. The water input has a multi-functional mission, since is used as a reactant, reaction medium, and solvent [7,8]. This is made feasible after reaching supercritical operating conditions (T > 374 °C, p > 22.1 MPa) [7,9]. SCWG comprises reaction steps such as hydrolysis, cracking, polymerisation, reforming, water–gas shift (WGS), and methanation [10]. It also depicts several advantages: (a) biomass samples with high moisture content can be processed and thus an upstream energy-intensive drying stage (which is necessary in the traditional gasification process) is avoided [11,12]; (b) the lower density–viscosity–dielectric constant properties of supercritical water ensure good mixing and are beneficial to the degradation of the biomass organic compounds, indicating that supercritical water is an ideal solvent [6,13]; (c) it can be associated with high gasification efficiencies, increased hydrogen yields, increased reaction rates, and minor formation of tars and CO [9,14]; (d) a pump is used to increase the water pressure upstream from the reactor and thus less mechanical power is required than using a compressor [8]; and (e) the produced syngas can be expanded in a turbine to produce electricity [8]. On the other hand, SCWG presents notable challenges such as: (a) significant energy demand, given that SCWG is an endothermic process and large amounts of water must be heated; (b) the corrosion of reactor materials due to extreme pressure and temperature conditions as well as the presence of traces of sulphur and chlorine in lignocellulosic biomass; and (c) reactor clogging [15].
Syngas composition is influenced by the biomass (feedstock) concentration in the reactive mixture as well as by the SCWG reactor’s operating conditions such as temperature, pressure, and residence time [8,9,16]. Experimental studies focus on producing syngas with high CH4 and/or H2 concentrations [8,16,17]. Downstream from the reactor, syngas can be upgraded to either produce clean gas biofuels (e.g., hydrogen) [14,18] or provide an appropriate H2/CO mixture to be fed in a Fischer–Tropsch reactor, thus producing liquid biofuels (BTL—the biomass to liquid process) [8].
Several publications can be found in the literature reviewing the integration of biomass gasification with Fischer–Tropsch synthesis (BTL–FTS) and focusing on the overall process’s main stages and characteristics [19,20]. Process viability and environmental impact implementing techno-economic analysis and Life-Cycle Assessment (LCA) methods have also been examined [21,22,23]. The use of “green” hydrogen (produced by electrolysis with renewable power) to significantly increase the overall BTL–FTS process’s carbon efficiency has also been investigated [24,25,26]. However, only a few studies have tackled the integration of SCWG with FTS. Rahbari et al. [27] presented a techno-economic analysis of an integrated solar-driven SCWG and FTS process to produce liquid biofuels from algae. A detailed process model was developed to perform the production process’s mass and energy balances. Campanario and Ortiz [28] proposed an integrated process to produce FT liquid biofuels from the SCW reforming of an aqueous bio-oil phase. Optimal conditions and scenarios for the maximization of product yields when process energy self-sufficiency is achieved were also reported. The effect of several techno-economic parameters on the viability of the proposed chain was addressed in [29]. Additionally, this integrated process has been examined as part of an overall project aiming to valorize the reject fraction of Municipal Solid Waste (MSW) [30]. Despite efforts, the implementation of SCWG to produce liquid biofuels is still not a mature technology used in scaled-up plants [8]. Furthermore, the use of other biomass types (e.g., lignocellulosic biomass) in SCWG chains comprising all necessary downstream steps, including syngas upgrade and FT biofuel production with refinement, has not been previously studied.
For this reason, a conceptual process chain, implementing SCWG, dry reforming (DR), and FT synthesis to produce synthetic liquid biofuels from lignocellulosic biomass, has been developed and is energetically and environmentally assessed in this work via a combined process modelling–LCA approach. Previous studies by the authors, in biomass gasification [31] and other industrial applications implementing this approach, have shown that a more comprehensive, accurate, and customized LCA can be achieved [32,33]. A conceptual computational process model has thus been developed to reproduce the basic SCWG–DR–FT process steps. It also includes an FT product upgrade and refinement section so that FT liquid biofuel yields (FT Diesel, FT Gasoline, and FT Jet Fuel) are predicted and used as input in the LCA. Alternative scenarios are assessed towards minimizing the heat requirements of the production chain and potentially achieving heat self-sufficiency for the process. The sustainability of the examined concept is evaluated through the quantification of the Global Warming Potential of the full production chain (from energy-crop cultivation to biofuel production), by implementing life-cycle methodologies. Special importance is assigned to following the REDII sustainability methodology, while detailed impact breakdowns are provided towards acquiring a holistic environmental performance profile.

2. Materials and Methods

2.1. Biomass Types

In the present simulations, two representative lignocellulosic biomass types have been considered: Miscanthus and Reed Canary Grass (RCG). Both are prominent energy crops used for the phytomanagement of marginal–degraded land [34,35,36]. Their selection allows the LCA methodology (further elaborated in Section 3.2.1) to consider the corresponding carbon-emission bonus foreseen in REDII [2] for biomass obtained from restored degraded land (details in Section 3.2.1). This enables the evaluation of the carbon bonus within the total environmental impact of the examined liquid biofuel production chain.

2.2. Process Modelling of FT Biofuel Production from SCWG of Lignocellulosic Biomass

A computational process model has been developed to simulate the conceptual supercritical water gasification (SCWG) chain for FT liquid biofuel production. Simulations of the SCWG reactor examine the effect of SCWG temperature and biomass (dry matter) concentration on the produced syngas composition. Downstream from the SCWG, syngas is upgraded through dry reforming (DR) and the resulting mixture of CO and H2 is fed to a Fisher–Tropsch synthesis (FTS) reactor to produce liquid biofuels with long hydrocarbon chains. In the final section of the model, a set of distillation columns and a hydrocracking reactor (HDR) are implemented for the refinement and upgrading of the FTS products. Therefore, indicative predictions of SCWG value chain end-products are depicted, including diesel-like (C14–C20), gasoline-like (C5–C9), and jet fuel yields (C10–C13). The process is also energetically assessed with respect to minimizing environmental impact.
The SCWG process model and associated versions have been developed in Aspen Plus® (V12) (AspenTech, Bedford, MA, USA), a commercial software solving mass–energy balances, thermodynamics, and reaction kinetics with widespread use in the simulation of industrial applications. The SCWG model consists of the following basic stages, which are integral to the SCWG value chain for liquid biofuel production.

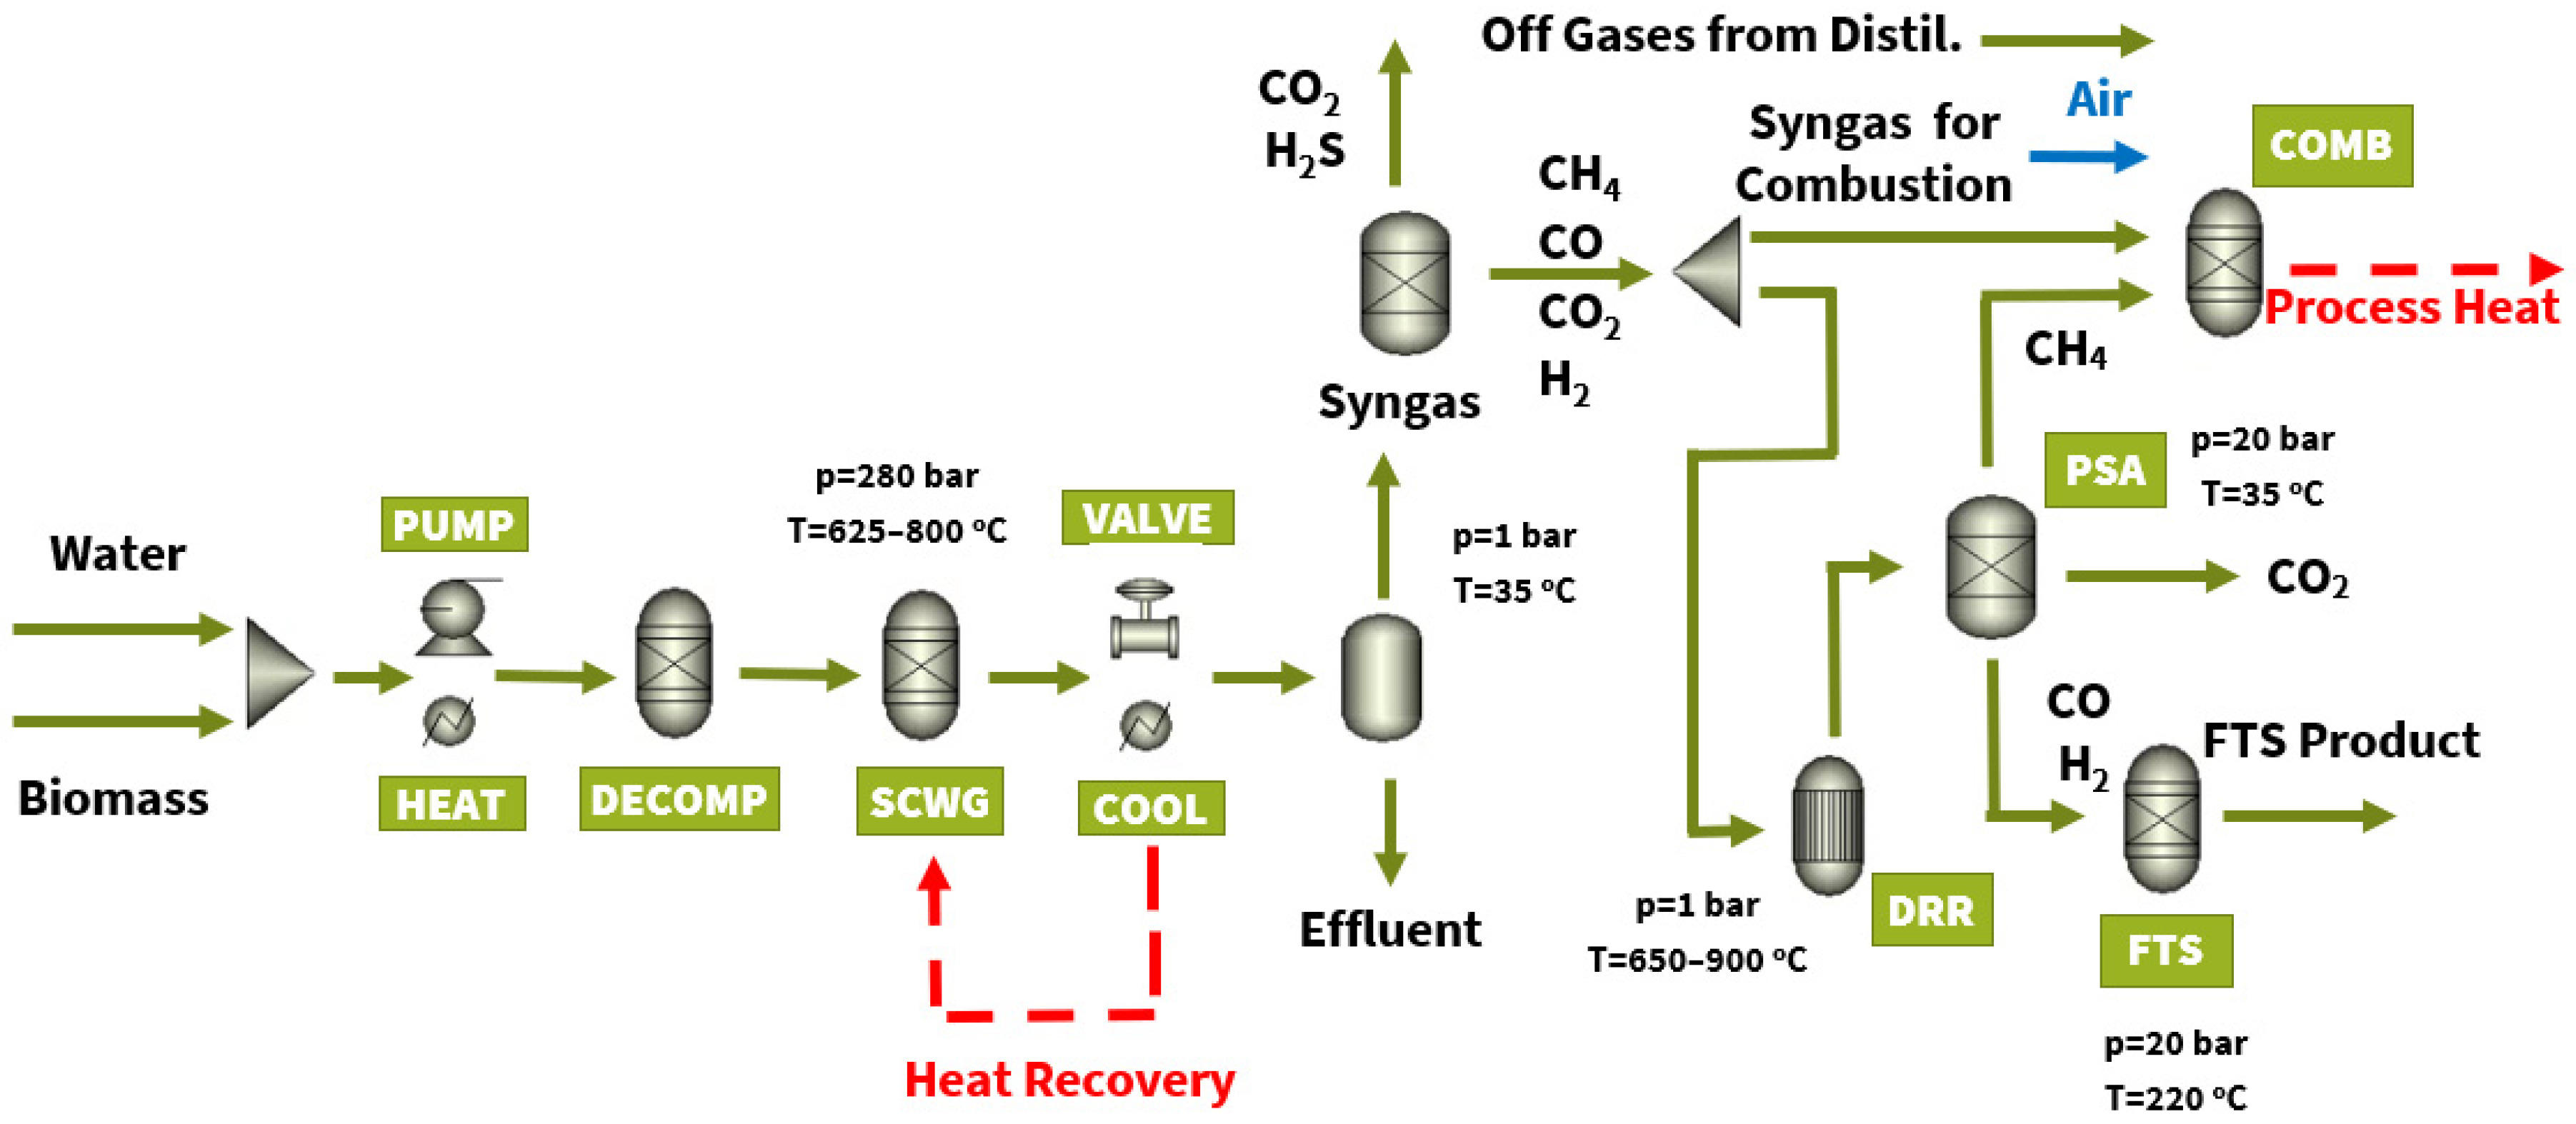
2.2.1. FT Biofuel Production Section (Incl. Supercritical Water Gasification, Dry Reforming and Fischer—Tropsch Synthesis Reactors)

Biomass is initially mixed with water at various concentrations. The mixture is pumped at 280 bar and then heated to the specified SCWG temperature (ranging between 625 and 775 °C). In all presented simulations, a total biomass—water mixture mass-flow rate of 1000 kg/h was considered.
Downstream from the reactor, gas-mixture pressure is reduced through a valve to atmospheric pressure conditions and then cooled to 35 °C, so that the water effluent is separated from the syngas. Subsequently, the syngas is cleaned to remove H2S and then it is transported to a Dry Reforming Reactor (DRR) operating at p = 1 atm and T = 650–900 °C. In the process-heat self-sufficient scenarios (Section 3.1.3), part of the produced syngas is separated and transported to a combustion chamber to provide process heat. In the max-yield scenario (Section 3.1.2), all the produced syngas is sent to the DRR. Dry reforming is implemented as a syngas upgrade process, where CH4 and CO2 react to produce a CO–H2 mixture appropriate for the FTS reactor. The dry reforming process is characterized by endothermic reaction 1. This is an additional requirement to the overall process heat demand.
CH4 + CO2 → 2CO + 2H2
The developed process model considers biomass as a non-conventional solid. HCOALGEN and DCOALIGT models have been adopted to calculate its basic properties. The biomass enthalpy of formation is calculated based on Heat of Combustion-based correlations available in the software and taking into account the biomass proximate/ultimate analysis as well as its heating value based on experiments and/or well-known formulas. The Peng–Robinson equation of state has been used for SCWG conditions [9]. An RYield reactor is implemented to decompose biomass to its constituent, conventional components (C, H2, O2, N2, S, ash) with respect to its proximate and ultimate analysis. Before entering the reactor, unreacted char is separated from the mixture. The 90% wt. SCWG carbon efficiency considered was based on typical values found in the literature. Specifically, in the computational work studying the production of liquid biofuels from algae via the integrated solar-driven SCWG and FTS process, the unreacted char was equal to 10% wt. [27]. Furthermore, SCWG experiments conducted with algae resulted in carbon efficiencies within 95–80% wt. for biomass concentration ranging between 2.5 and 20% wt. [37]. Overall, the SCWG carbon efficiency depends on the reactor’s operating conditions [11]. The SCWG is modelled, implementing an RGibbs reactor which assumes that reactants and products reach equilibrium and is used for parametric studies. A Flash 2 separator separates syngas from the effluent. A separator block is also implemented to separate H2S from syngas, upstream from the DRR. The DRR is modelled as an REquil reactor which also provides equilibrium calculations, though restricted to reaction 1. Unreacted CO2 is sequestered with the use of a PSA unit operating at p = 20 bar/T = 35 °C. In cases of a partial conversion of syngas CH4 to CO, the unreacted CH4 is a biomethane stream sent to the combustion chamber (also modelled as an RGibbs reactor) to provide process heat (heat self-sufficient scenario 2).
The CO–H2 mixture leaving the DRR is directed to an FTS reactor. In principle, a polymerization reaction process producing a mixture of paraffins, olefins, and oxygenates takes place [24]. This work adopts the modelling approach implemented in [27,28] for the modelling of the FTS reactor where a Cobalt (Co) catalyst operating at low FT temperatures (T = 220 °C) and pressure equal to 20 bar is considered. A mixture of (a) paraffins with linear hydrocarbon chains and carbon atoms up to 35 (C2–C35); and (b) olefins with linear hydrocarbon chains and carbon atoms up to 20 (C2–C35) is assumed to be produced in the FTS reactor.
Generic reactions associated with FTS (2 for paraffins and 3 for olefins) are taken into account:
n CO + (2n + 1) H2 → CnH2n+2 + nH2O
n CO + 2n H2 → CnH2n + nH2O
Liquid hydrocarbons with C5–C35 are produced. Product distribution was obtained by the Anderson–Schulz–Flory distribution law which provides the molar fraction of the produced hydrocarbons by the following equation:
αcn = αn−1 · (1 − α)
where n is the number of carbon atoms of a hydrocarbon product and α corresponds to the chain-growth probability, a variable providing an indication of the catalyst’s selectivity. In the performed simulations a standard α-value of 0.9 is adopted which is associated with increased yields of diesel-like and wax-like products. Furthermore, a typical value of total CO conversion equal to 87% for a Co catalyst was considered [28].
In order to calculate the olefin to paraffin molar ratio, R4 was implemented:
O P = e x p   n · Ε R · T = e c n
where T is the FTS reactor temperature and ∆E corresponds to the change in the activation energy due to olefins production and has a value of 1.1 kJ/mol C atom.
The FTS reactor is modelled as RStoich reactor. (R3), (R4) reactions are reproduced for every hydrocarbon product. Each reaction’s CO fractional conversion to its individual products is calculated by combining the aforementioned set of equations and assumptions. A subroutine was developed and linked to the reactor to facilitate calculations. Upon exiting the FTS reactor, the mixture of liquid hydrocarbons is dewatered through a Flash 3 separator and expanded to atmospheric pressure conditions. Subsequently, it is fed to the distillation and HDR section so that FT liquid biofuels are separated and collected.
Figure 1 presents a simplified flow diagram of the basic stages included in the 1st section of the integrated SCWG value chain consisting of (1) the biomass–water mixing; (2) the decomposition of biomass to its constituents’ species (DECOMP); (3) the SCWG reactor; (4) the separation of SCWG products’ syngas and effluent; (5) the separation of H2S from syngas (and potentially part of CO2); (6) the DRR for syngas upgrade; (7) a PSA unit for the separation of CO2 and CH4 (if conversion in the DRR is not complete); (8) the FTS reactor; and (9) a combustion chamber (COMB) which uses part of syngas, the CH4 (biomethane) surplus, and off-gases from the distillation-column section to provide process heat (particularly towards the SCWG and DRR).

2.2.2. FT Biofuel Upgrade and Refinement Section

Downstream from the FTS reactor, the model has been extended to include a distillation and hydrocracking reactor (HDR) stage for the refinement and upgrade of FTS products. To this end, a combination of relevant process-modelling options proposed by both [27,28] has been adopted. The basic stages of the distillation and HDR section are shown in the simplified flow diagram shown in Figure 2. FTS products are cooled down to 35 °C and then separated from light gases (unreacted H2, CO, CO2, CH4, and small concentrations of C2−C4 hydrocarbons) and wastewater. This stream of light gases (apart from H2) is sent to the combustion furnace to provide process heat. The unreacted H2 is separated and sent to the HDR. The FTS products’ liquid mixture enters a set of three distillation columns to be separated to (a) diesel-like (or FT-Diesel) fuels comprising C14−C20 paraffins and olefins; (b) gasoline-like (or FT-Gasoline) fuels consisting of C5−C9 paraffins and olefins; (c) jet fuel-like (or FT-Jet Fuel) fuels (C10−C13); (d) wax paraffins with C21+; and (e) the remaining light hydrocarbon gases (C2−H4). A simple, conceptual approach was adopted for the modelling of distillation columns. DSTWU blocks were implemented, calculations assumed a reflux ratio equal to 1.2, and light key components’ recoveries between 90 and 95% were applied.
The separated stream of heavier paraffins (C21+) is subsequently sent to the HDR so that the longer chain of waxes is broken down to higher quality, low to middle hydrocarbons, and thus increased yields of gasoline/jet fuel/diesel-like fuels are produced. In the developed model, a HDR implementing a platinum catalyst (Pt) and operating at p = 35 bar/T = 330 °C is implemented [38]. Wax conversion is equal to 92% and a detailed carbon number distribution of products (according to the catalyst selectivity) has been incorporated to the model via an RYIELD reactor, in which the resulting mass fractions (only for alkanes) are calculated. The implemented catalyst is selective to gasoline, jet fuel, and diesel, with selectivity peaking within C8−C12. To be more specific, 57.9% wt. of waxes are converted to C10−C22, 38.1% wt. to C5−C9, and 4% wt. to C1−C4. Hydrogen at a H2/a wax mass ratio equal to 0.1 is needed for the hydrocracking reactions to take place. The stream of hydrocracking products is mixed at appropriate conditions with the initial FT products’ stream and recirculated to the distillation column section.

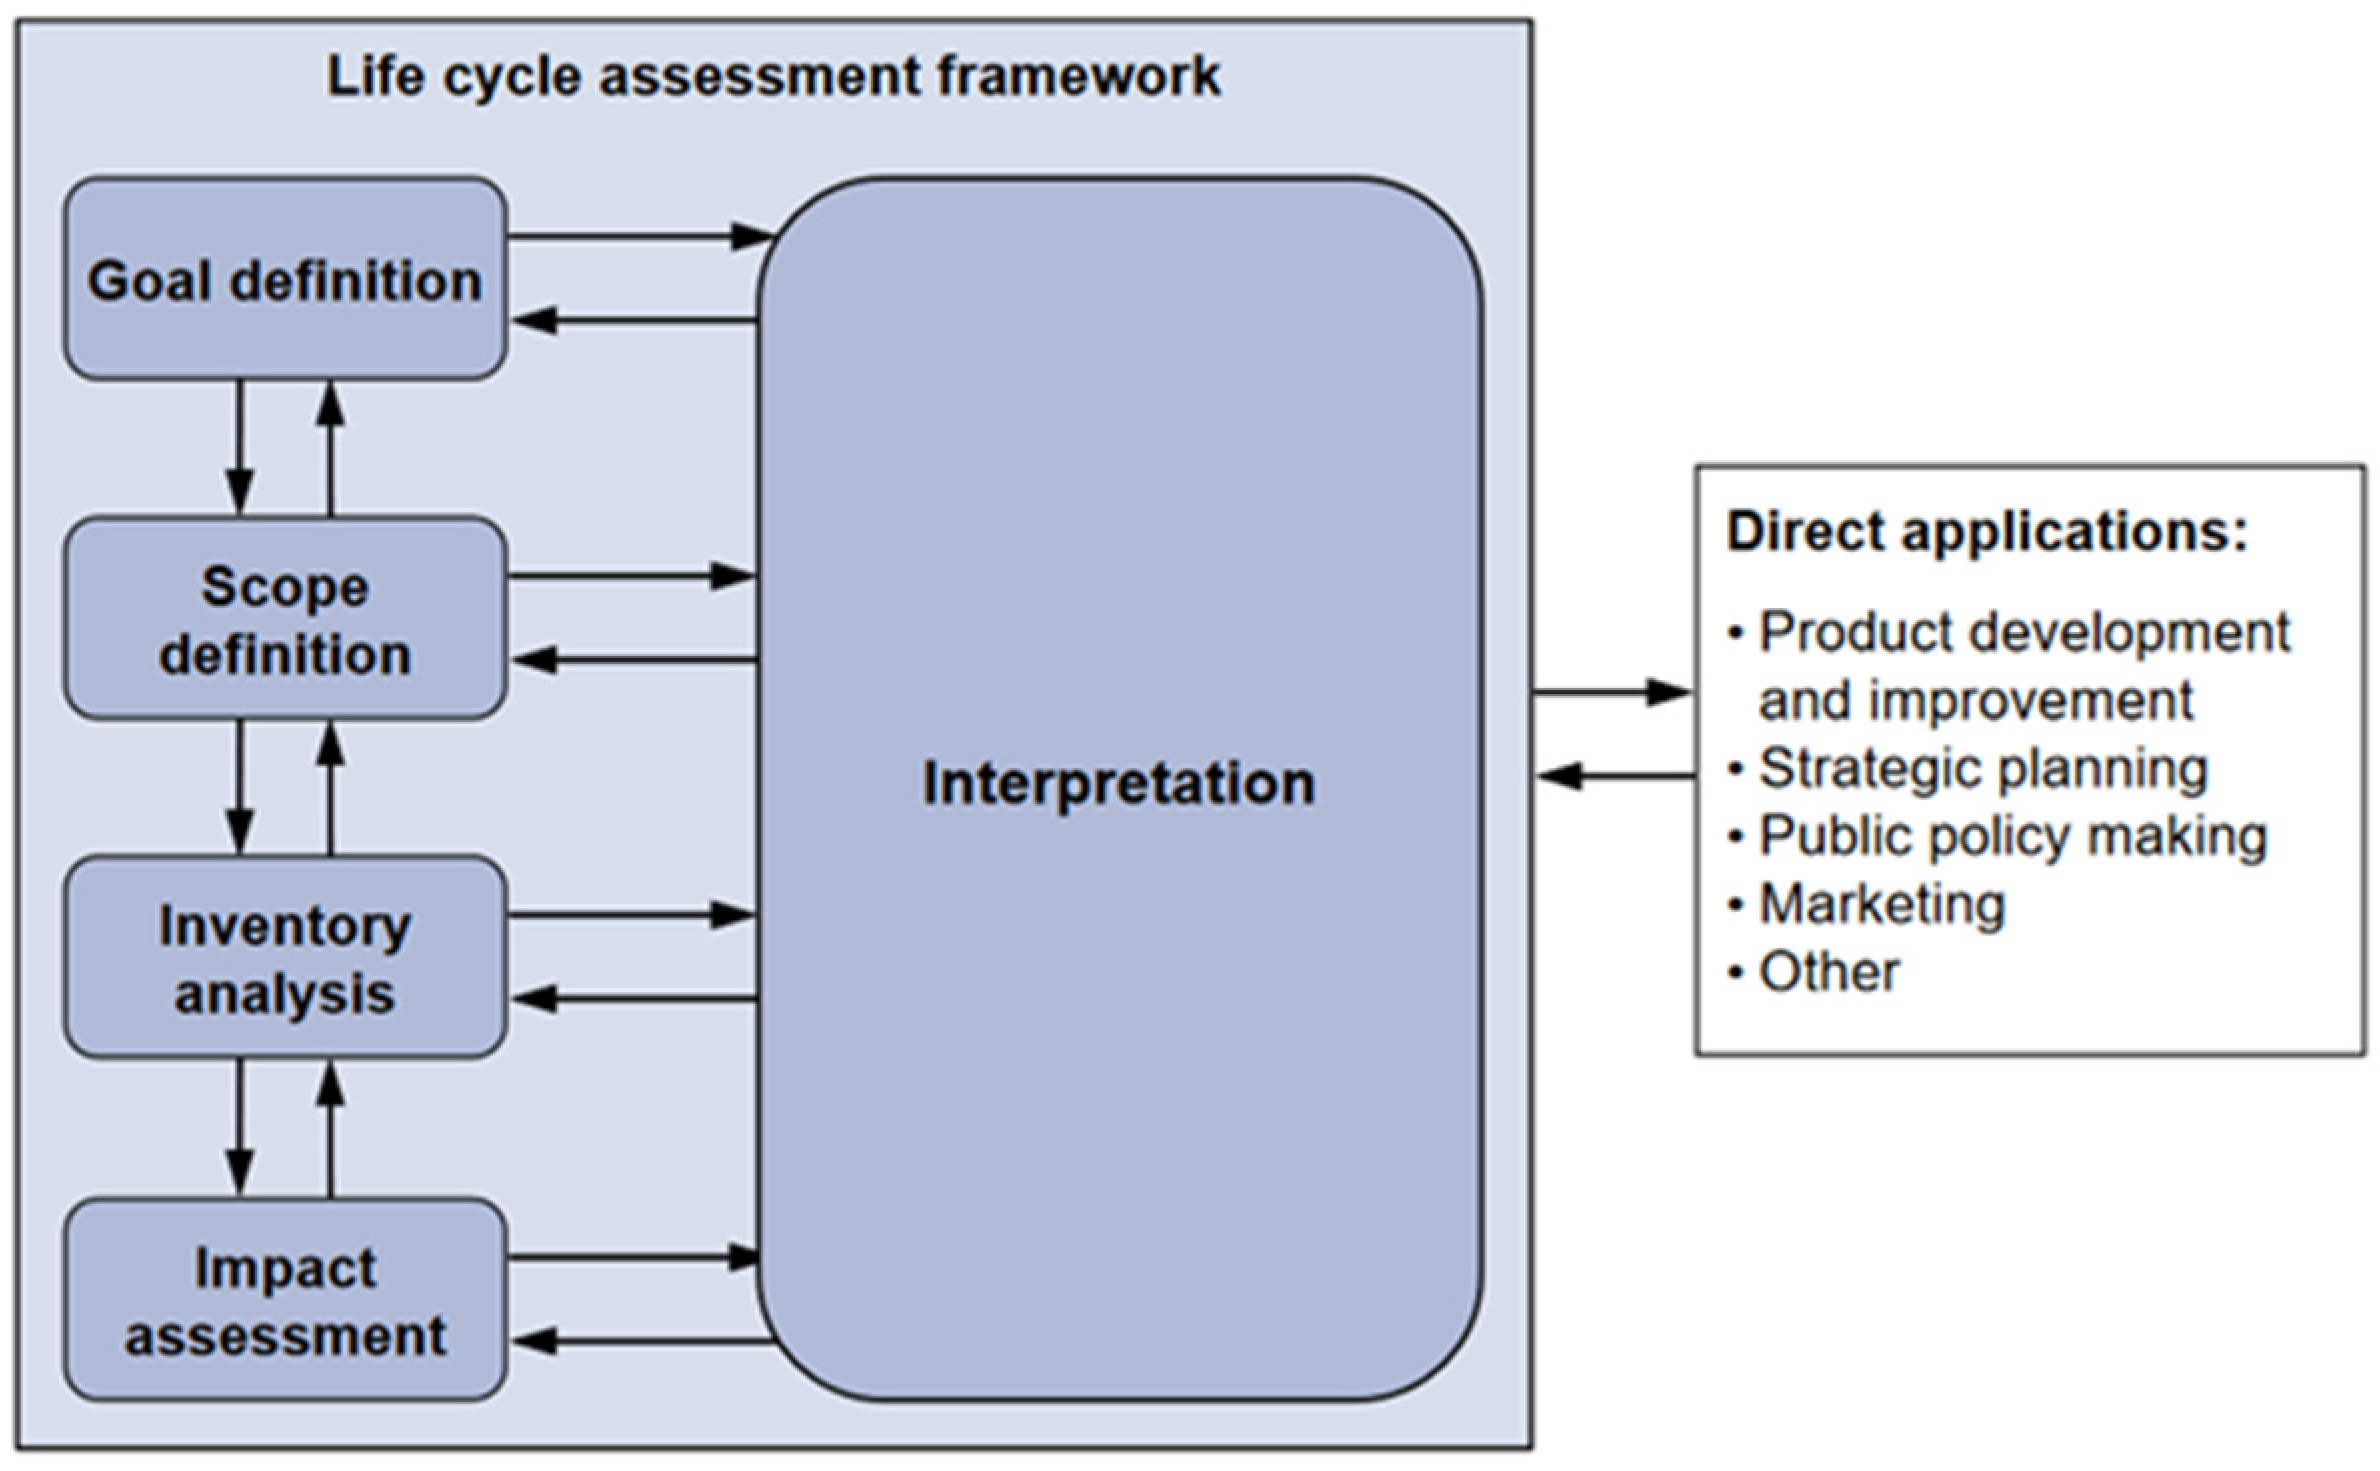
2.3. Life-Cycle Assessment (LCA) Modelling

LCA is a state-of-the-art, well-established and standardized [39,40] methodology which considers the entire life cycle of a product or system. The life cycle consists of distinct life-cycle stages that are, namely, raw material extraction, manufacturing, use stage (with all maintenance and repair), and the end of life (EoL) (waste treatment, possibly recycling, and ultimately the final disposal). Across the life cycle, LCA makes an inventory of all technical processes and use of resources required to deliver the service provided by the assessed product or system. Then, LCA identifies environmental exchanges (emissions of substances and wastes) occurring in different environmental compartments (like the air, water and soil) and further translates these exchanges into environmental impacts (such as climate change, ozone depletion, and toxicity to ecosystems and humans). The purpose of the assessment is to provide decision support to a certain audience in relation to a specific goal. The methodology, briefly outlined, consists of distinct life-cycle phases (goal and scope definition, inventory analysis, impact assessment, and interpretation), further analyzed in the following sections (Figure 3).
For describing the methodology and for conducting the LCA, the International Reference Life-Cycle Data System (ILCD) Handbook has been followed, as suggested by the European Commission [41]. The Handbook provides a basis for assuring quality and consistency of life-cycle data, methods, and assessments.

2.3.1. Goal and Scope Definition

The goal of this study is to evaluate the environmental performance of biofuels produced via the process chains described and modelled in Section 2.2. The results focus on the most important aspect, the Global Warming Potential (GWP). The environmental performance of the biofuels is evaluated following an attributional LCA approach.
Capital goods are not included, assuming that their influence on the final LCA results is negligible [42,43]. Production is assumed to be located in central Europe, hence corresponding secondary data are used (electricity mix, average vehicle, etc.) when available.
The functional unit (FU) used in this work is 1 MJ of energy content (LHV) of the biofuel mix (diesel, petrol, and jet fuel—the composition is presented in Section 3.2.1). This is a common FU for biofuel assessment [44] and allows for comparing the results with the GHG saving targets stated in Annex IV (Rules for calculating the greenhouse gas impact of biofuels, bioliquids and their fossil fuel comparators) of RED II [2].
The system boundaries are set according to Figure 4, including the whole conversion process, from feedstock production to the produced biofuels at the refinery gate.

2.3.2. System Description and LCI Modelling

The decision context of the LCA described is classified in ILCD as ‘Situation A’ (which describes studies used for the identification of KPIs and the comparison of a specific product to its category’s average). Under this decision context, the type of LCA modelling is attributional: the system is depicted as can be observed/measured, linking the single processes within the technosphere along the flow of matter, energy, and services. In attributional LCAs, the assessed system is treated like an isolated process that does not interact with global markets [45].

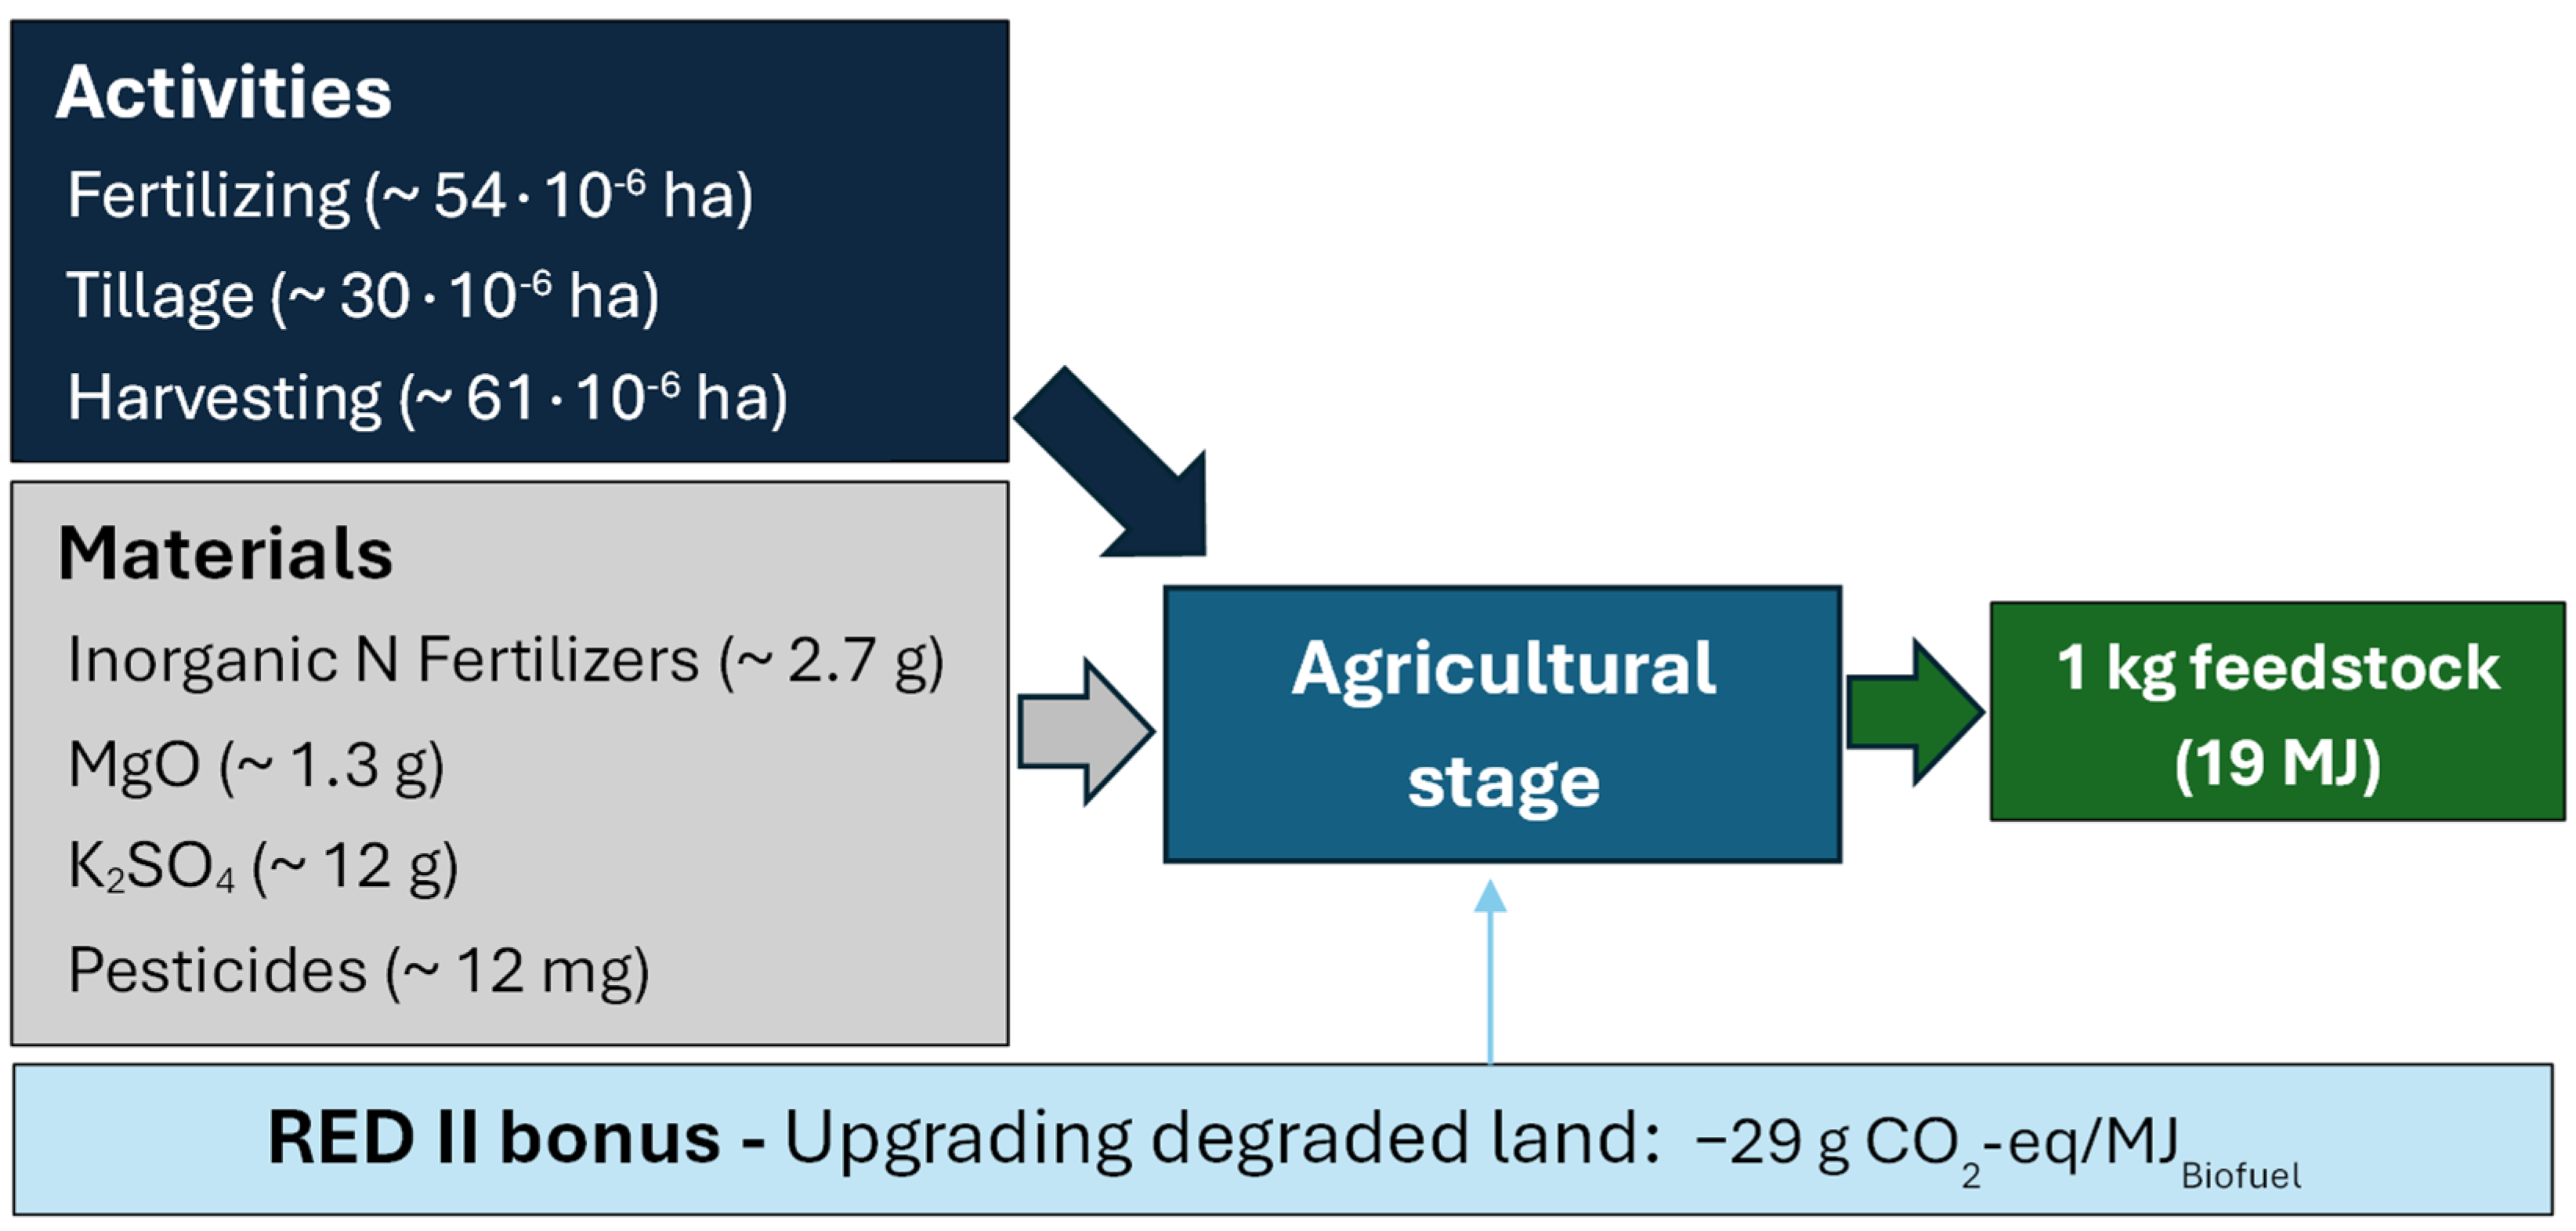
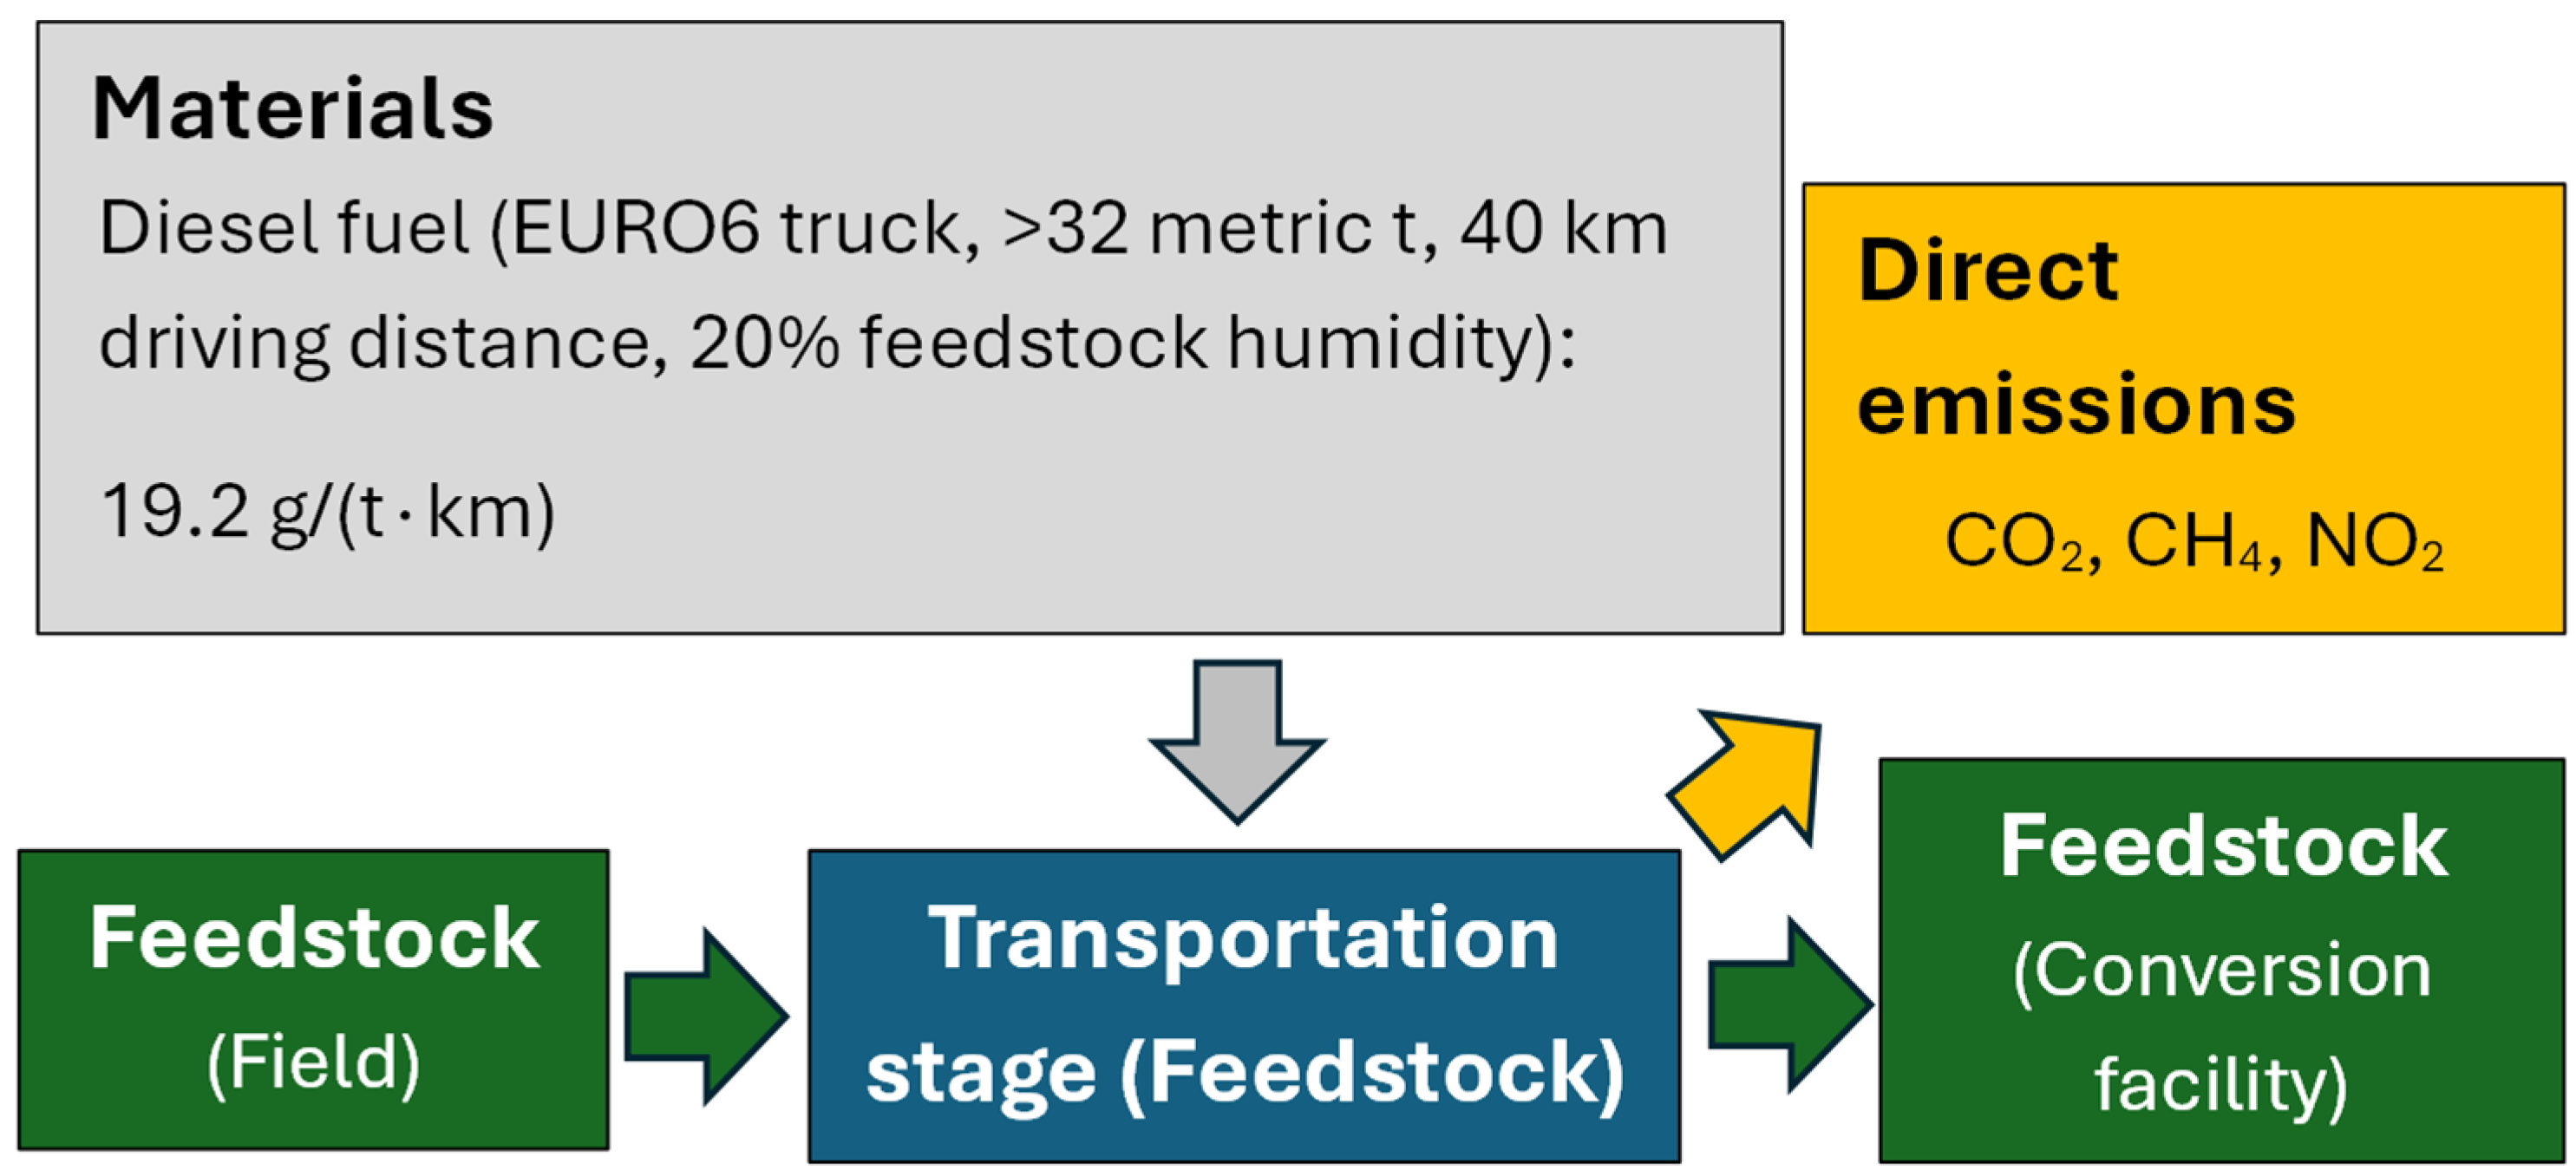
2.3.3. Life-Cycle Inventories

The inventories compiled for the chain stages are shown in the following section. All respective data were incorporated in and elaborated with the LCA Software SimaPro v. 9.5.0.1.
  • Agricultural stage (Field-to-feedstock)
Among the two feedstocks presented in Section 2.1, Miscanthus was chosen for LCA calculations, due to better yields than RCG (Section 3.1). The modelling of the agricultural stage was based on data from Ecoinvent v3.91, the most widespread commercial LCA database [46,47]. The dataset adopted represents the production of 1 kg of Miscanthus (dry matter) on a plantation with a lifetime of 20 years. The dry-matter yield assumed at first harvest is 6000 kg/ha and from second harvest onwards 17,000 kg/ha.
The original dataset from Ecoinvent (Figure 5) represents standard cultivation practices. It includes the relevant agricultural activities and the consumption of fertilizers and pesticides, towards the production of 1 kg of Miscanthus. Additionally, the aspect of enhancing the soil carbon stock through upgrading degraded land has been considered, according to the relevant methodological guidelines of RED II [2] (a bonus of −29 g CO2/MJbiofuel is applied—RED III has not amended this issue). All upstream emissions from activities and materials are modelled with the data available from Ecoinvent v3.91.
  • Transportation stage
The inventory compiled for the transportation of feedstock to the conversion facilities is presented in Figure 6. Direct emissions and upstream emissions of diesel are acquired from Ecoinvent v3.91 and its respective source [48].
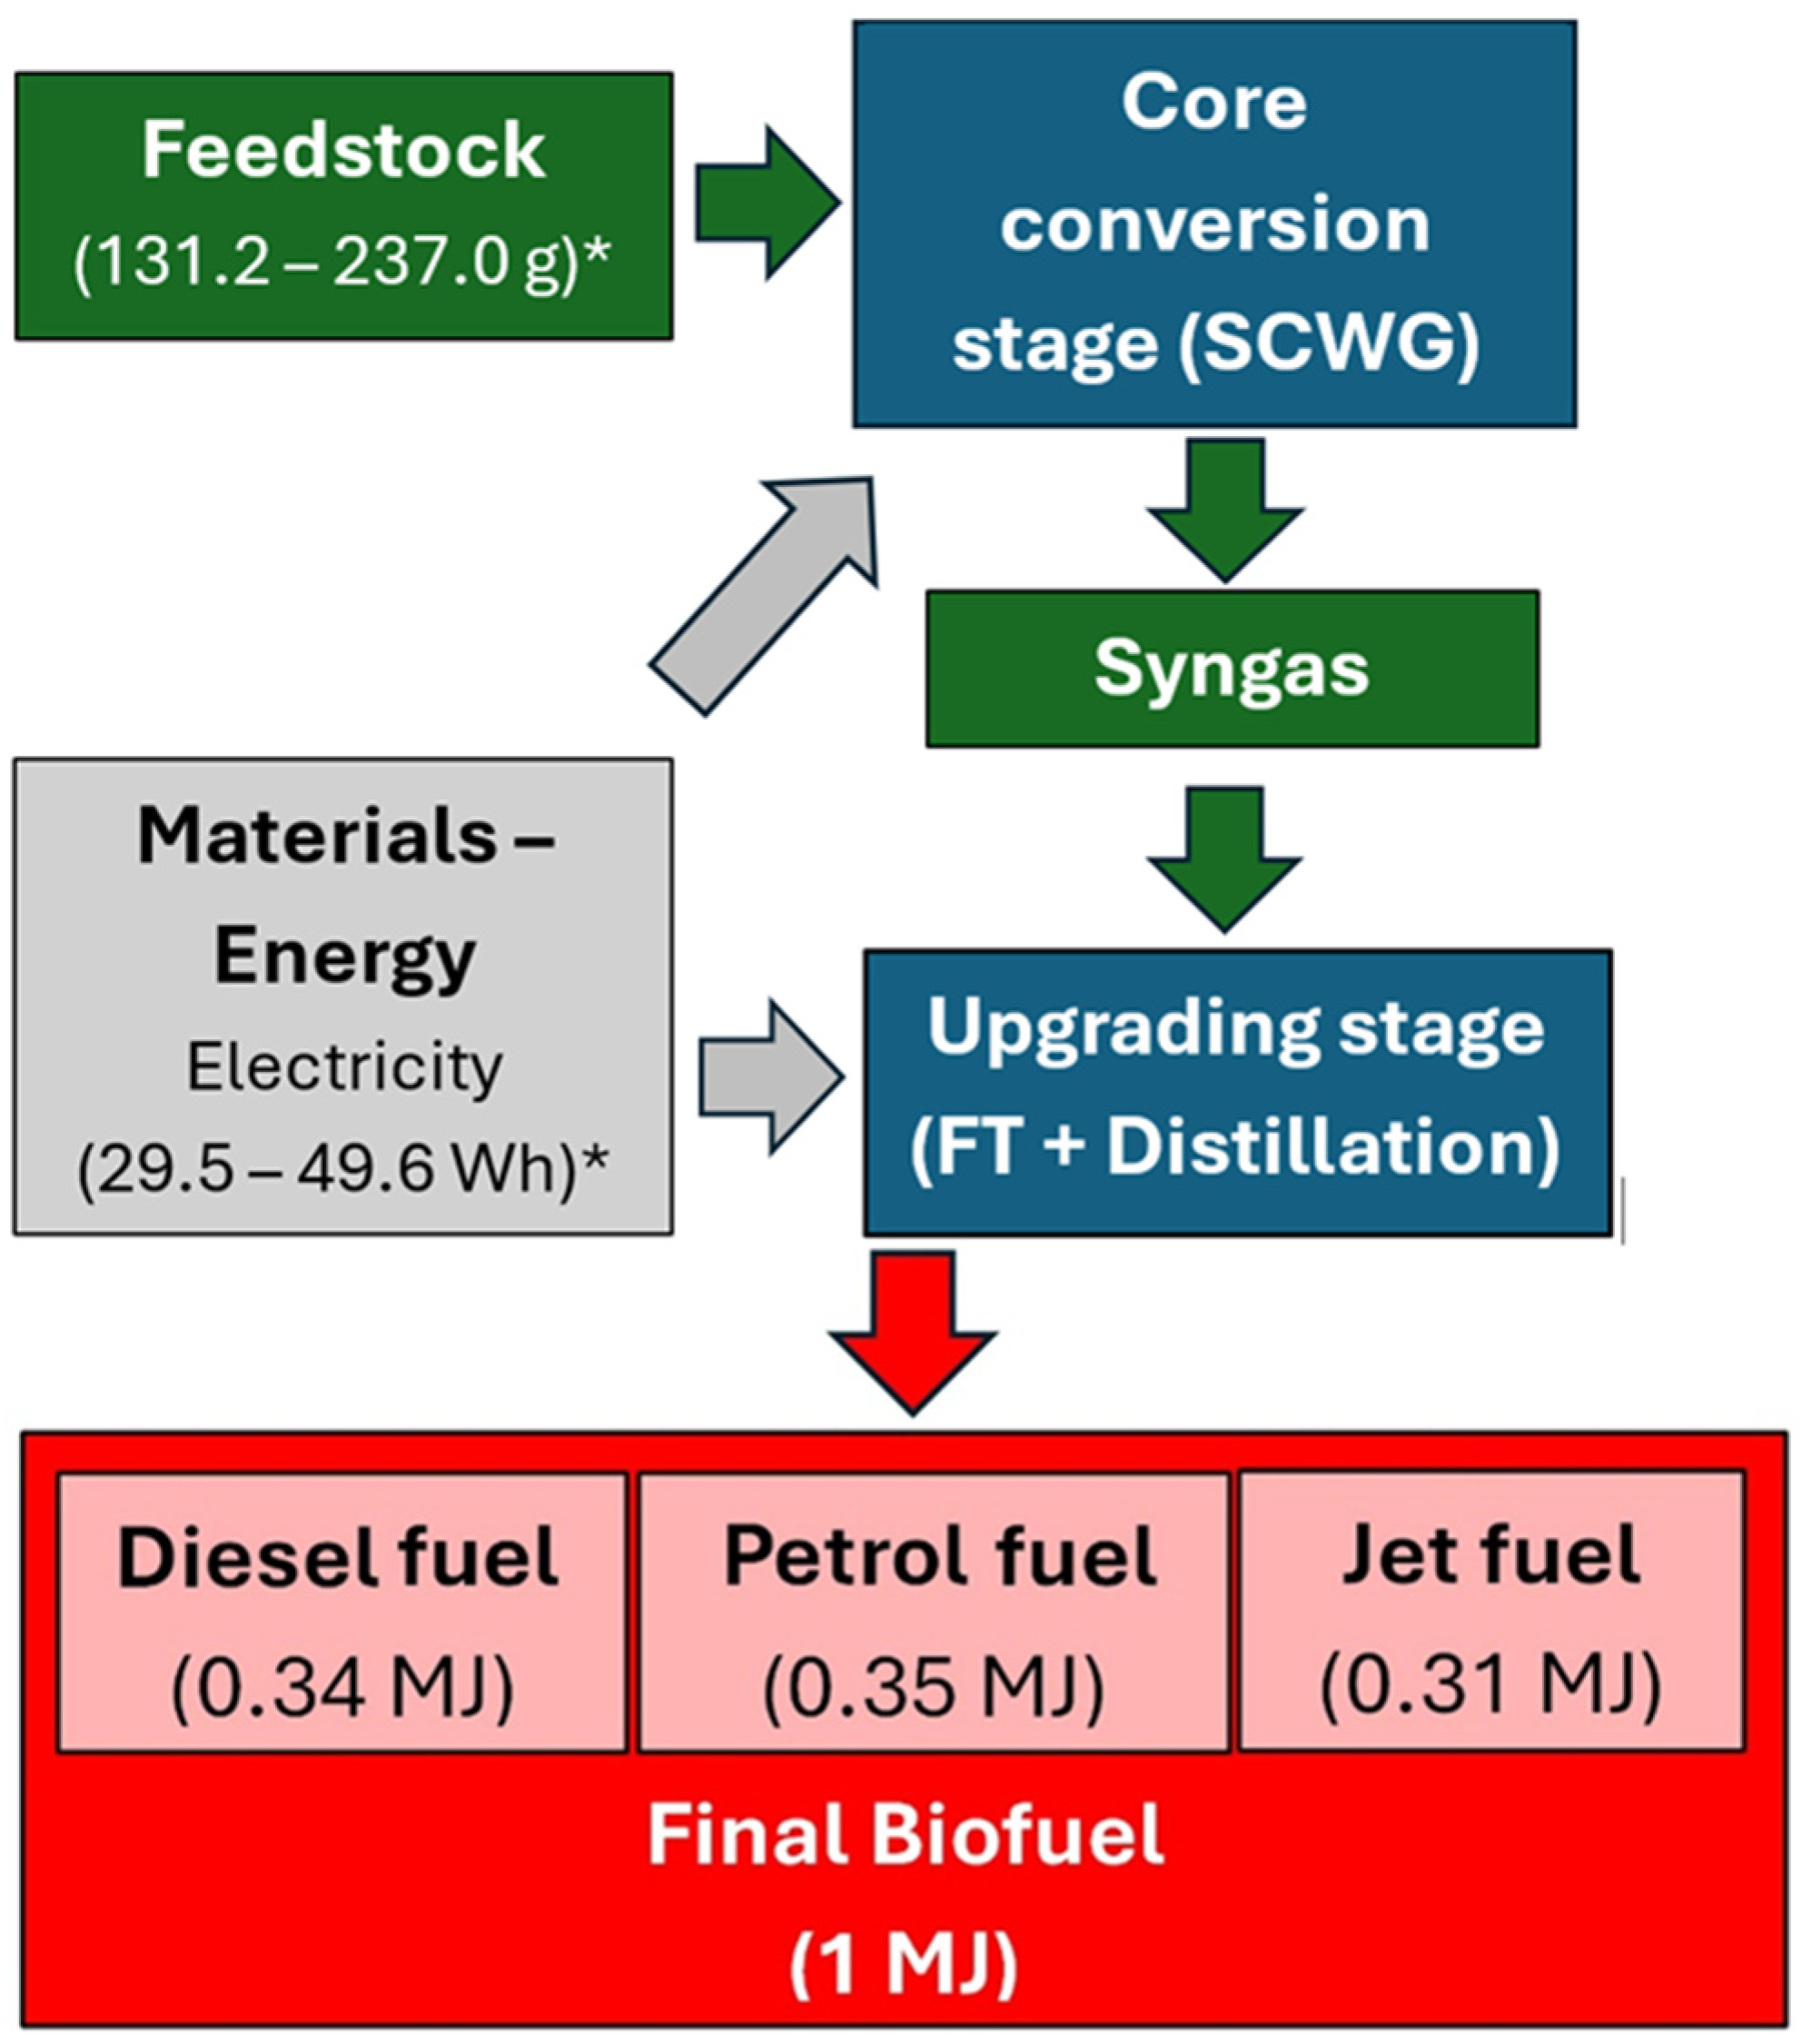
  • Core conversion and upgrading to final fuel.
The inventory compiled for the core conversion and upgrading is presented in Section 3.2.1, since it requires the results presented in Section 3.1.

3. Results

3.1. Process Modelling

3.1.1. Characterization of Biomass Types

Proximate and elemental analyses were obtained from the Phyllis2 database of the Energy Research of the Netherlands (ECN) and are presented in Table 1 [49]. The Higher Heating Value (HHV) of the two biomass types is also depicted. It is determined both experimentally and with the use of the Milne formula (6):
HHVMilne = 0.341·C + 1.322·H − 0.12·O − 0.12·N + 0.0686·S − 0.0153·ash

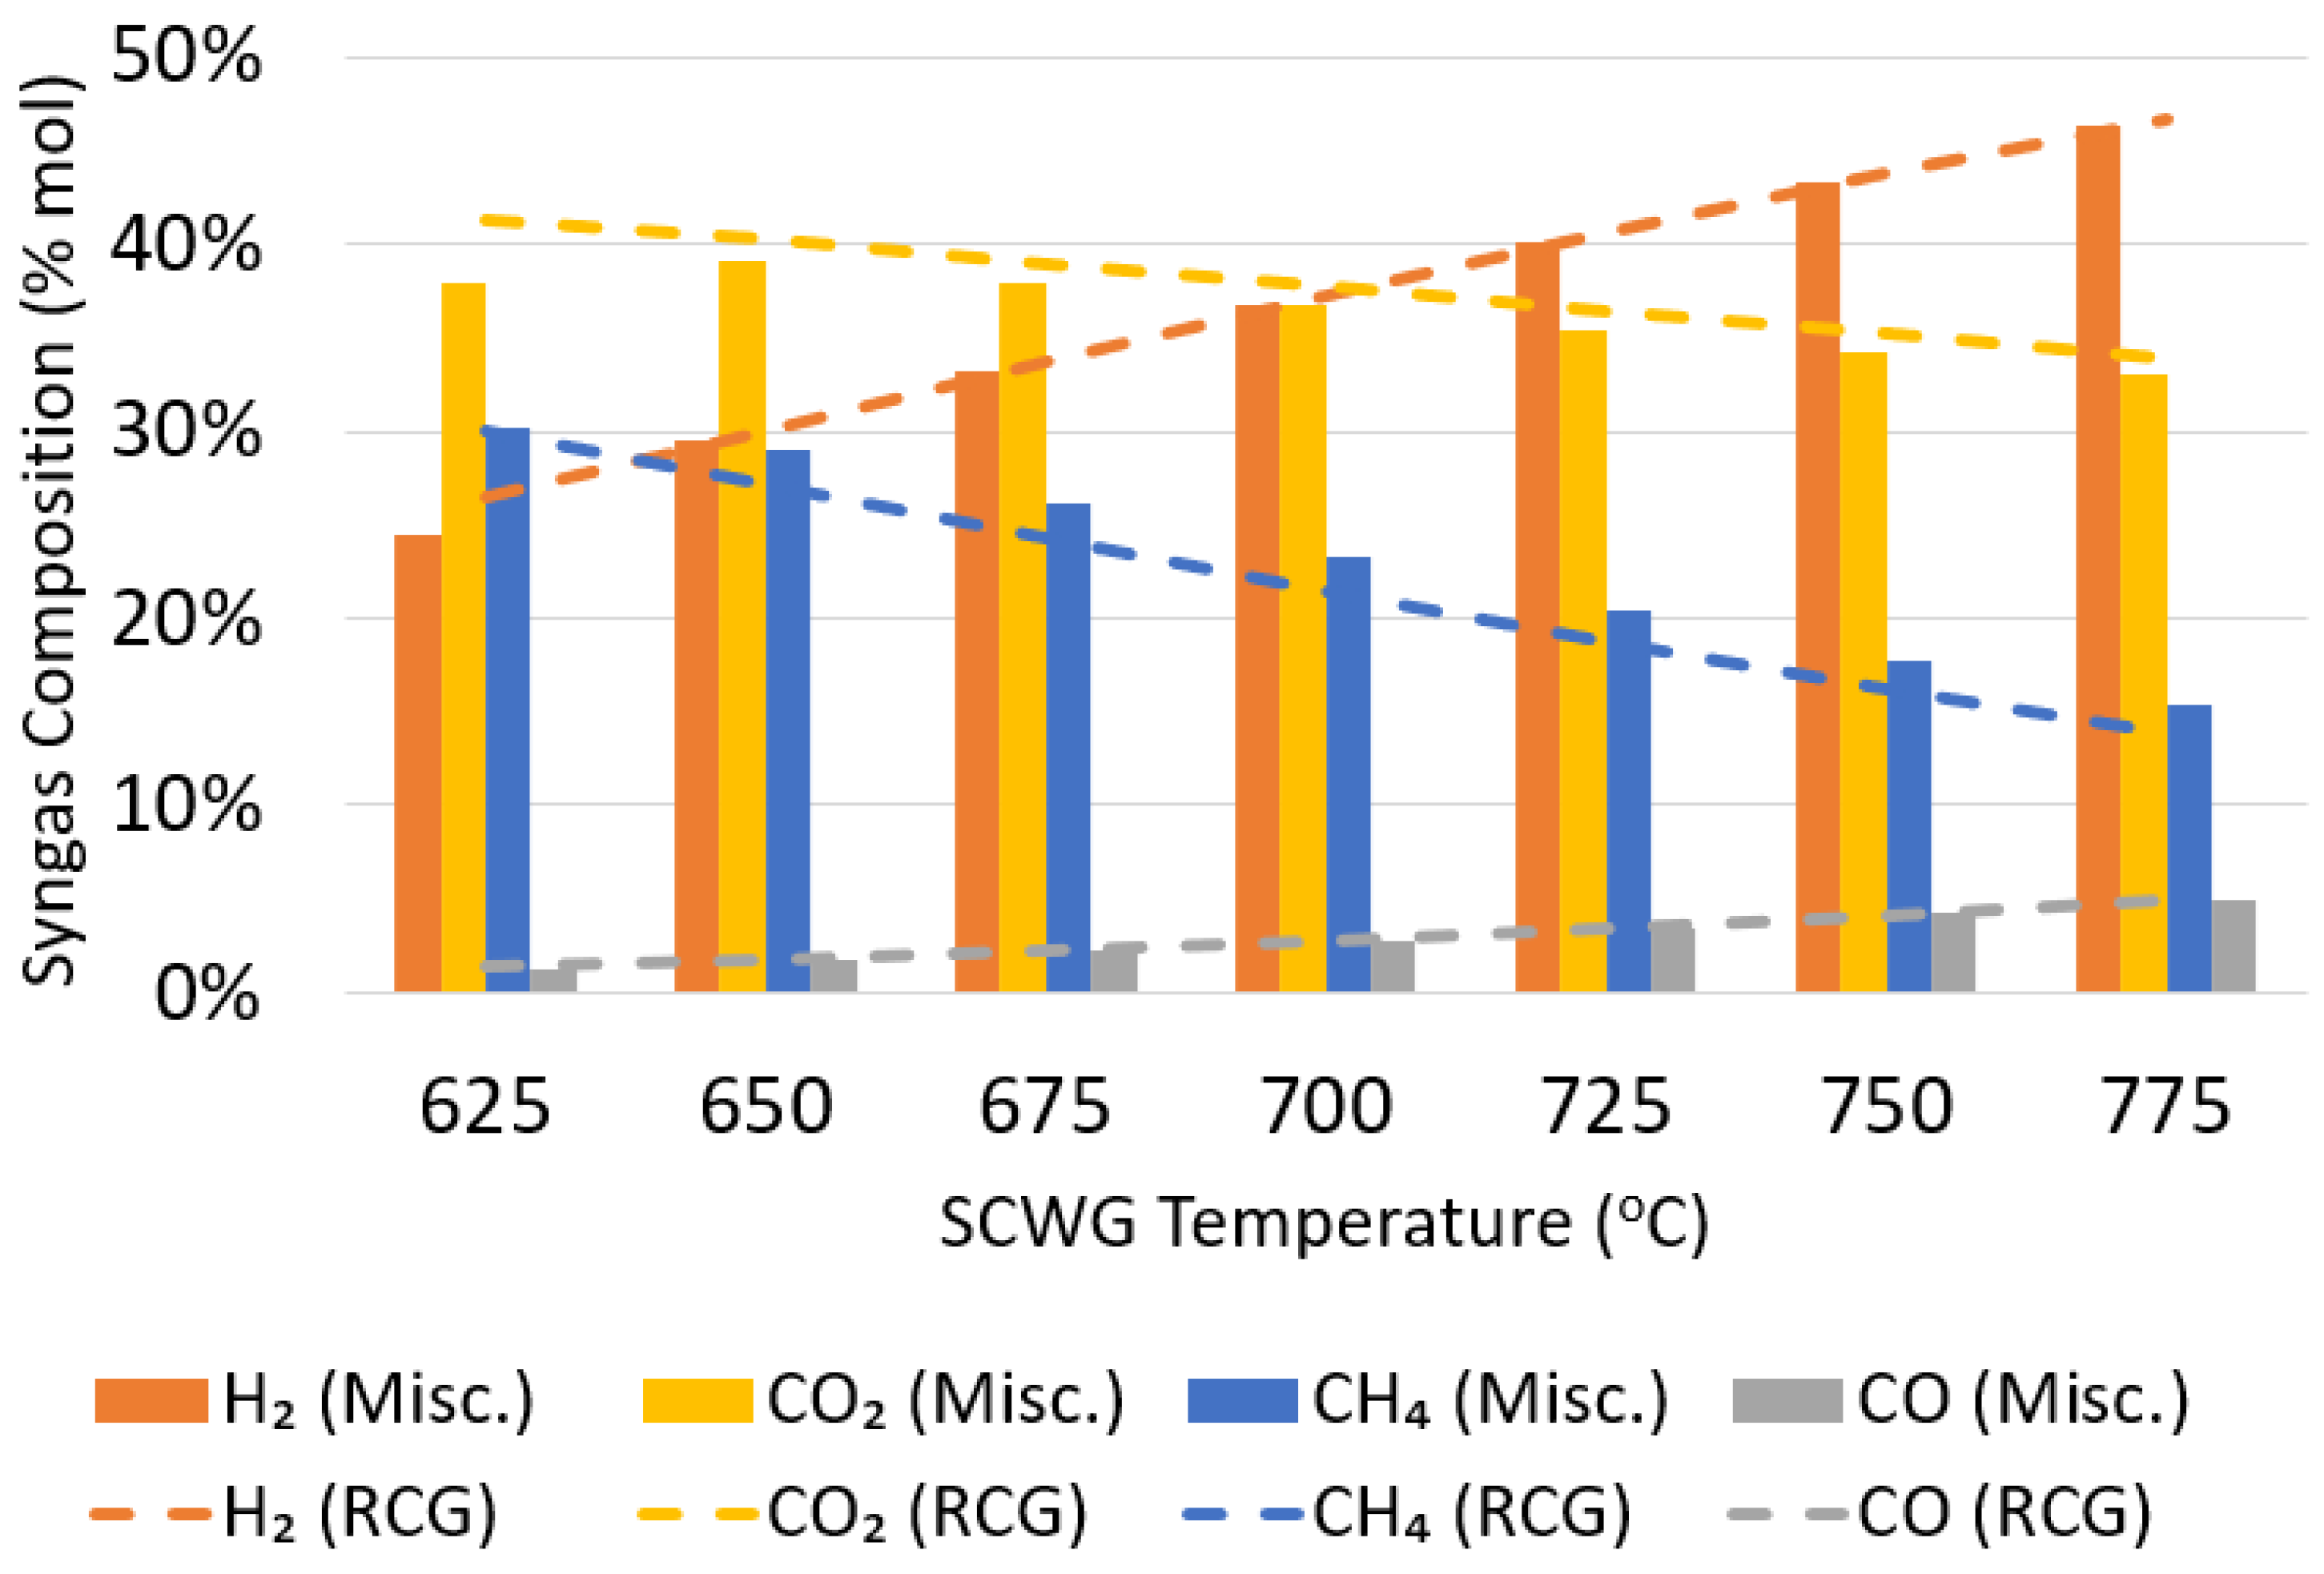
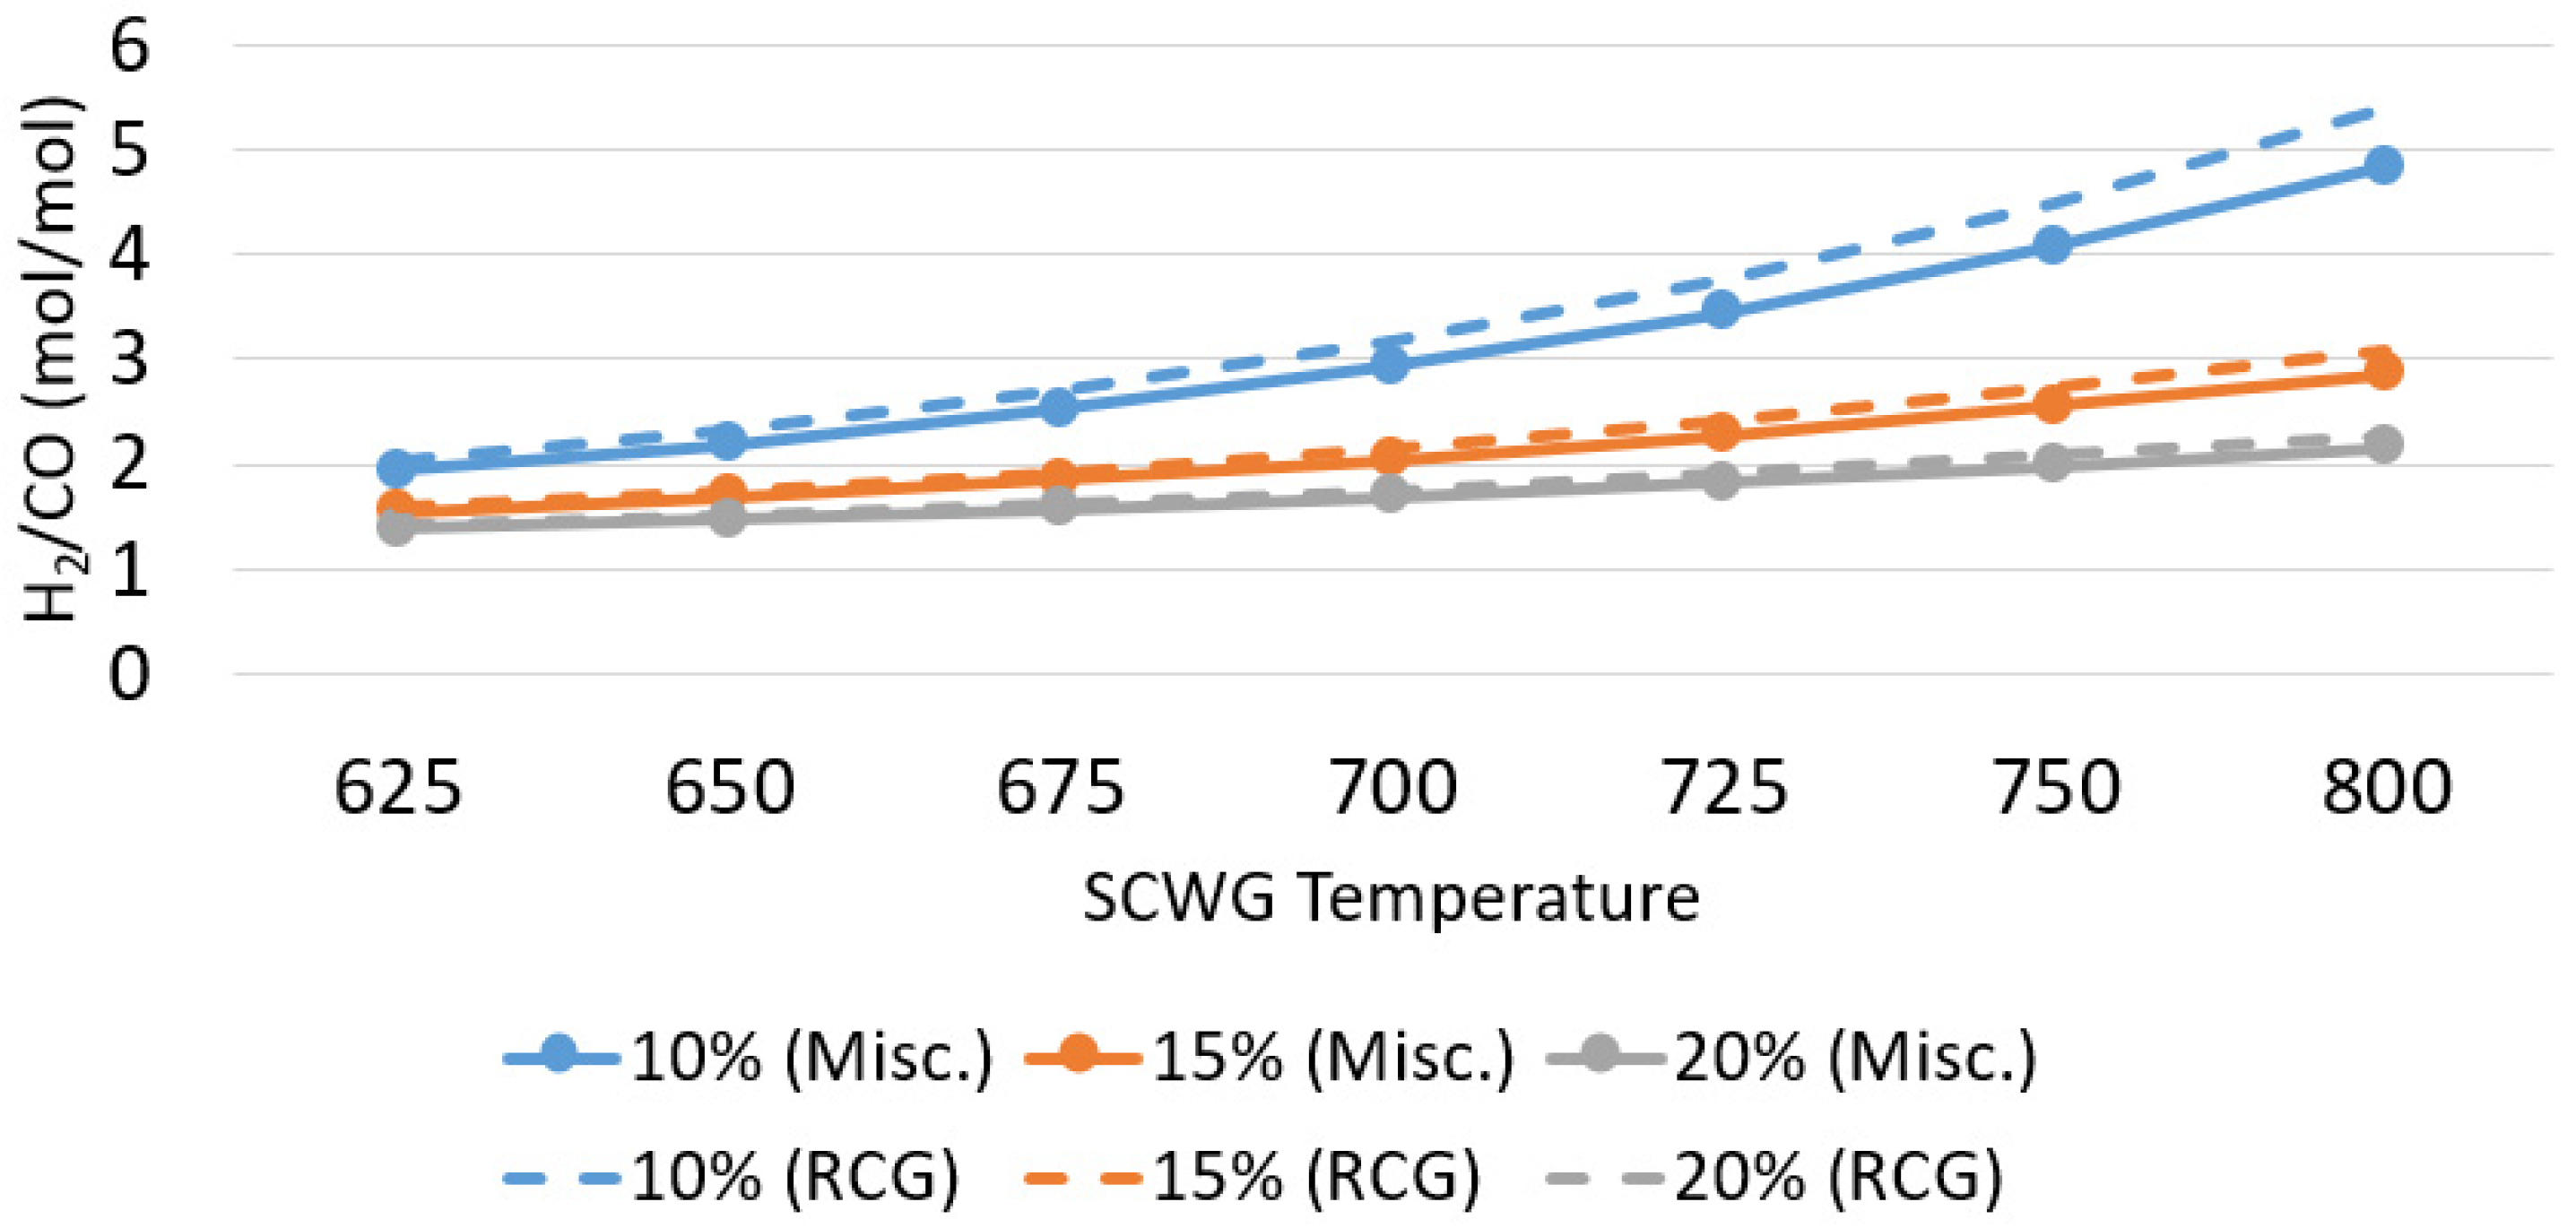
3.1.2. Syngas Composition and Upgrade

Initially, the produced syngas is characterized by examining the effect of SCWG temperature and biomass concentration on its composition with respect to maximizing FT biofuel yields downstream from the conceptual production chain. In this section, simulations focus on the SCWG equilibrium reactor.
It should be noted that conducting SCWG experiments at both high pressures (≈300 bar) and temperatures (particularly above 700 °C) remains a challenge with respect to the materials used in the SCWG reactor walls. Computational studies have previously considered such conditions to (a) focus on the SCWG temperature effect on syngas composition [37] and (b) provide heat self-sufficient and viable scenarios highlighting technology potential [28,50]. It should be noted that new enhanced materials are currently being developed for gas turbines and used under supercritical high-pressure/-temperature conditions relevant to those examined in this work [51,52].
Parametric studies for a SCWG temperature range within 625–775 °C have been performed and predictions of syngas composition (in mol) are shown in Figure 7. In all cases, biomass concentration was kept constant at 20% wt. For Miscanthus, the H2 molar fraction gradually increases from 24.5% to 46.3% with increasing SCWG temperature. On the contrary, CH4 production tends to decrease within the examined range (from 30.2% to 15.3% mol). A slight decrease in CO2 concentration can also be reported (from 37.9% to 33.0%). CO increases from 1.3% to 5.0%. These trends can be associated with the combined effect of biomass gasification reactions, such as the water–gas shift and the methanation reaction under the examined temperature range, and have been previously reported [9,37]. In the case of the RCG, H2 mol fraction ranges within 26.4–46.7%, CH4 decreases from 30.0% to 13.8%, and CO2 varies between 41.4 and 33.9% mol. Minor deviations are observed between the two biomass types and can be attributed to differences in their respective elemental analyses (e.g., Miscanthus is slightly richer in C and H).
Furthermore, according to [8], SCWG studies with lower biomass concentrations (under 10% wt.) may be more realistic for experimental tests (to avoid clogging); however, they can be prohibitive from a techno-economic point of view in scaled-up applications. Thus, a minimum biomass concentration of 15% wt. was suggested by the authors. To address this issue, parametric studies have been performed for biomass concentrations within 10–20% wt. Thus, range can be representative of scaled-up applications with respect to highlighting the implemented technology potential.
Figure 8 presents predictions of syngas composition (in mol) for three different biomass concentrations (10–15–20% wt.). SCWG reactor temperature was kept equal to 700 °C. Again, the basic anticipated trends, as reported in other computational campaigns using equilibrium models [37], are captured. For Miscanthus, H2 mol fraction depicts its maximum value (51.8%) at 10% wt. dry-matter concentration and subsequently decreases with increasing biomass concentration (to 36.7% at 20% wt.), due to less water in the SCWG reactor. On the other hand, higher biomass concentration leads to almost double CH4 production (11.8% for 10% wt. biomass to 23.3% for 20%), since more carbon atoms participate in the SCWG reactions. A slight increase of CO2 is also predicted (from 33.9% to 36.7%) within the examined biomass concentration range. A similar trend is also observed for CO (2.1% at 10% to 2.8% for 20% biomass wt.). Produced syngas from the SCWG of RCG presents a similar composition to Miscanthus throughout the examined biomass concentration range, with minor discrepancies attributed to differences in their elemental analyses.
The produced syngas is led to the DRR and upgraded for FTS. However, the produced H2/CO mixture molar ratio at the inlet of the FTS reactor is influenced by syngas composition and thus from biomass concentration and SCWG temperature. This is highlighted in Figure 9. To maximize the FT biofuel yield, the optimum value of H2/CO molar ratio for FTS must be approximately 2. Evidently, for all considered biomass concentrations (10–15–20% wt.), the SCWG temperature increase leads to higher H2/CO molar ratio values. This is expected, since syngas H2 increases and CH4 decreases with increasing temperature. Under a constant SCWG temperature, H2/CO molar ratios decrease with increasing biomass concentration, since more carbon and less water is fed to the SCWG reactor. Thus, if biomass concentration is 10% wt., optimum H2/CO molar ratios are achieved for SCWG temperatures below 650 °C. When biomass concentration is 15% wt., optimum H2/CO ratio is observed for SCWG temperatures close to 700 °C. Similarly, it is calculated that for 20% wt. biomass concentration, the H2/CO molar ratio is optimized when the SCWG temperature reaches 750 °C. Similar findings are shown for both implemented biomasses. This is expected, since both Miscanthus and RCG SCWG produce syngas with identical composition. The reported higher H2 and lower CH4 mol fractions predicted in RCG produced syngas result in slightly higher H2/CO molar ratios at the FTS inlet. It should be noted that other options of upgrading the syngas (e.g., water–gas shift reactor) or manipulating the H2/CO ratio (e.g., by including PSA units) were not considered in this study.
Overall, this parametric study provides a mapping of operating SCWG scenarios with respect to maximizing FT biofuel yields. It must be noted though that the selection of optimized conditions also depends on (a) the potential of achieving a thermally self-sufficient process; (b) technical challenges associated with the use of high biomass concentrations in SCWG reactors (plugins etc.); and (c) technical challenges associated with the use of materials that will be suitable for both high-pressure (≈300 bar)/high-temperature (>700 °C) conditions in the SCWG reactors.

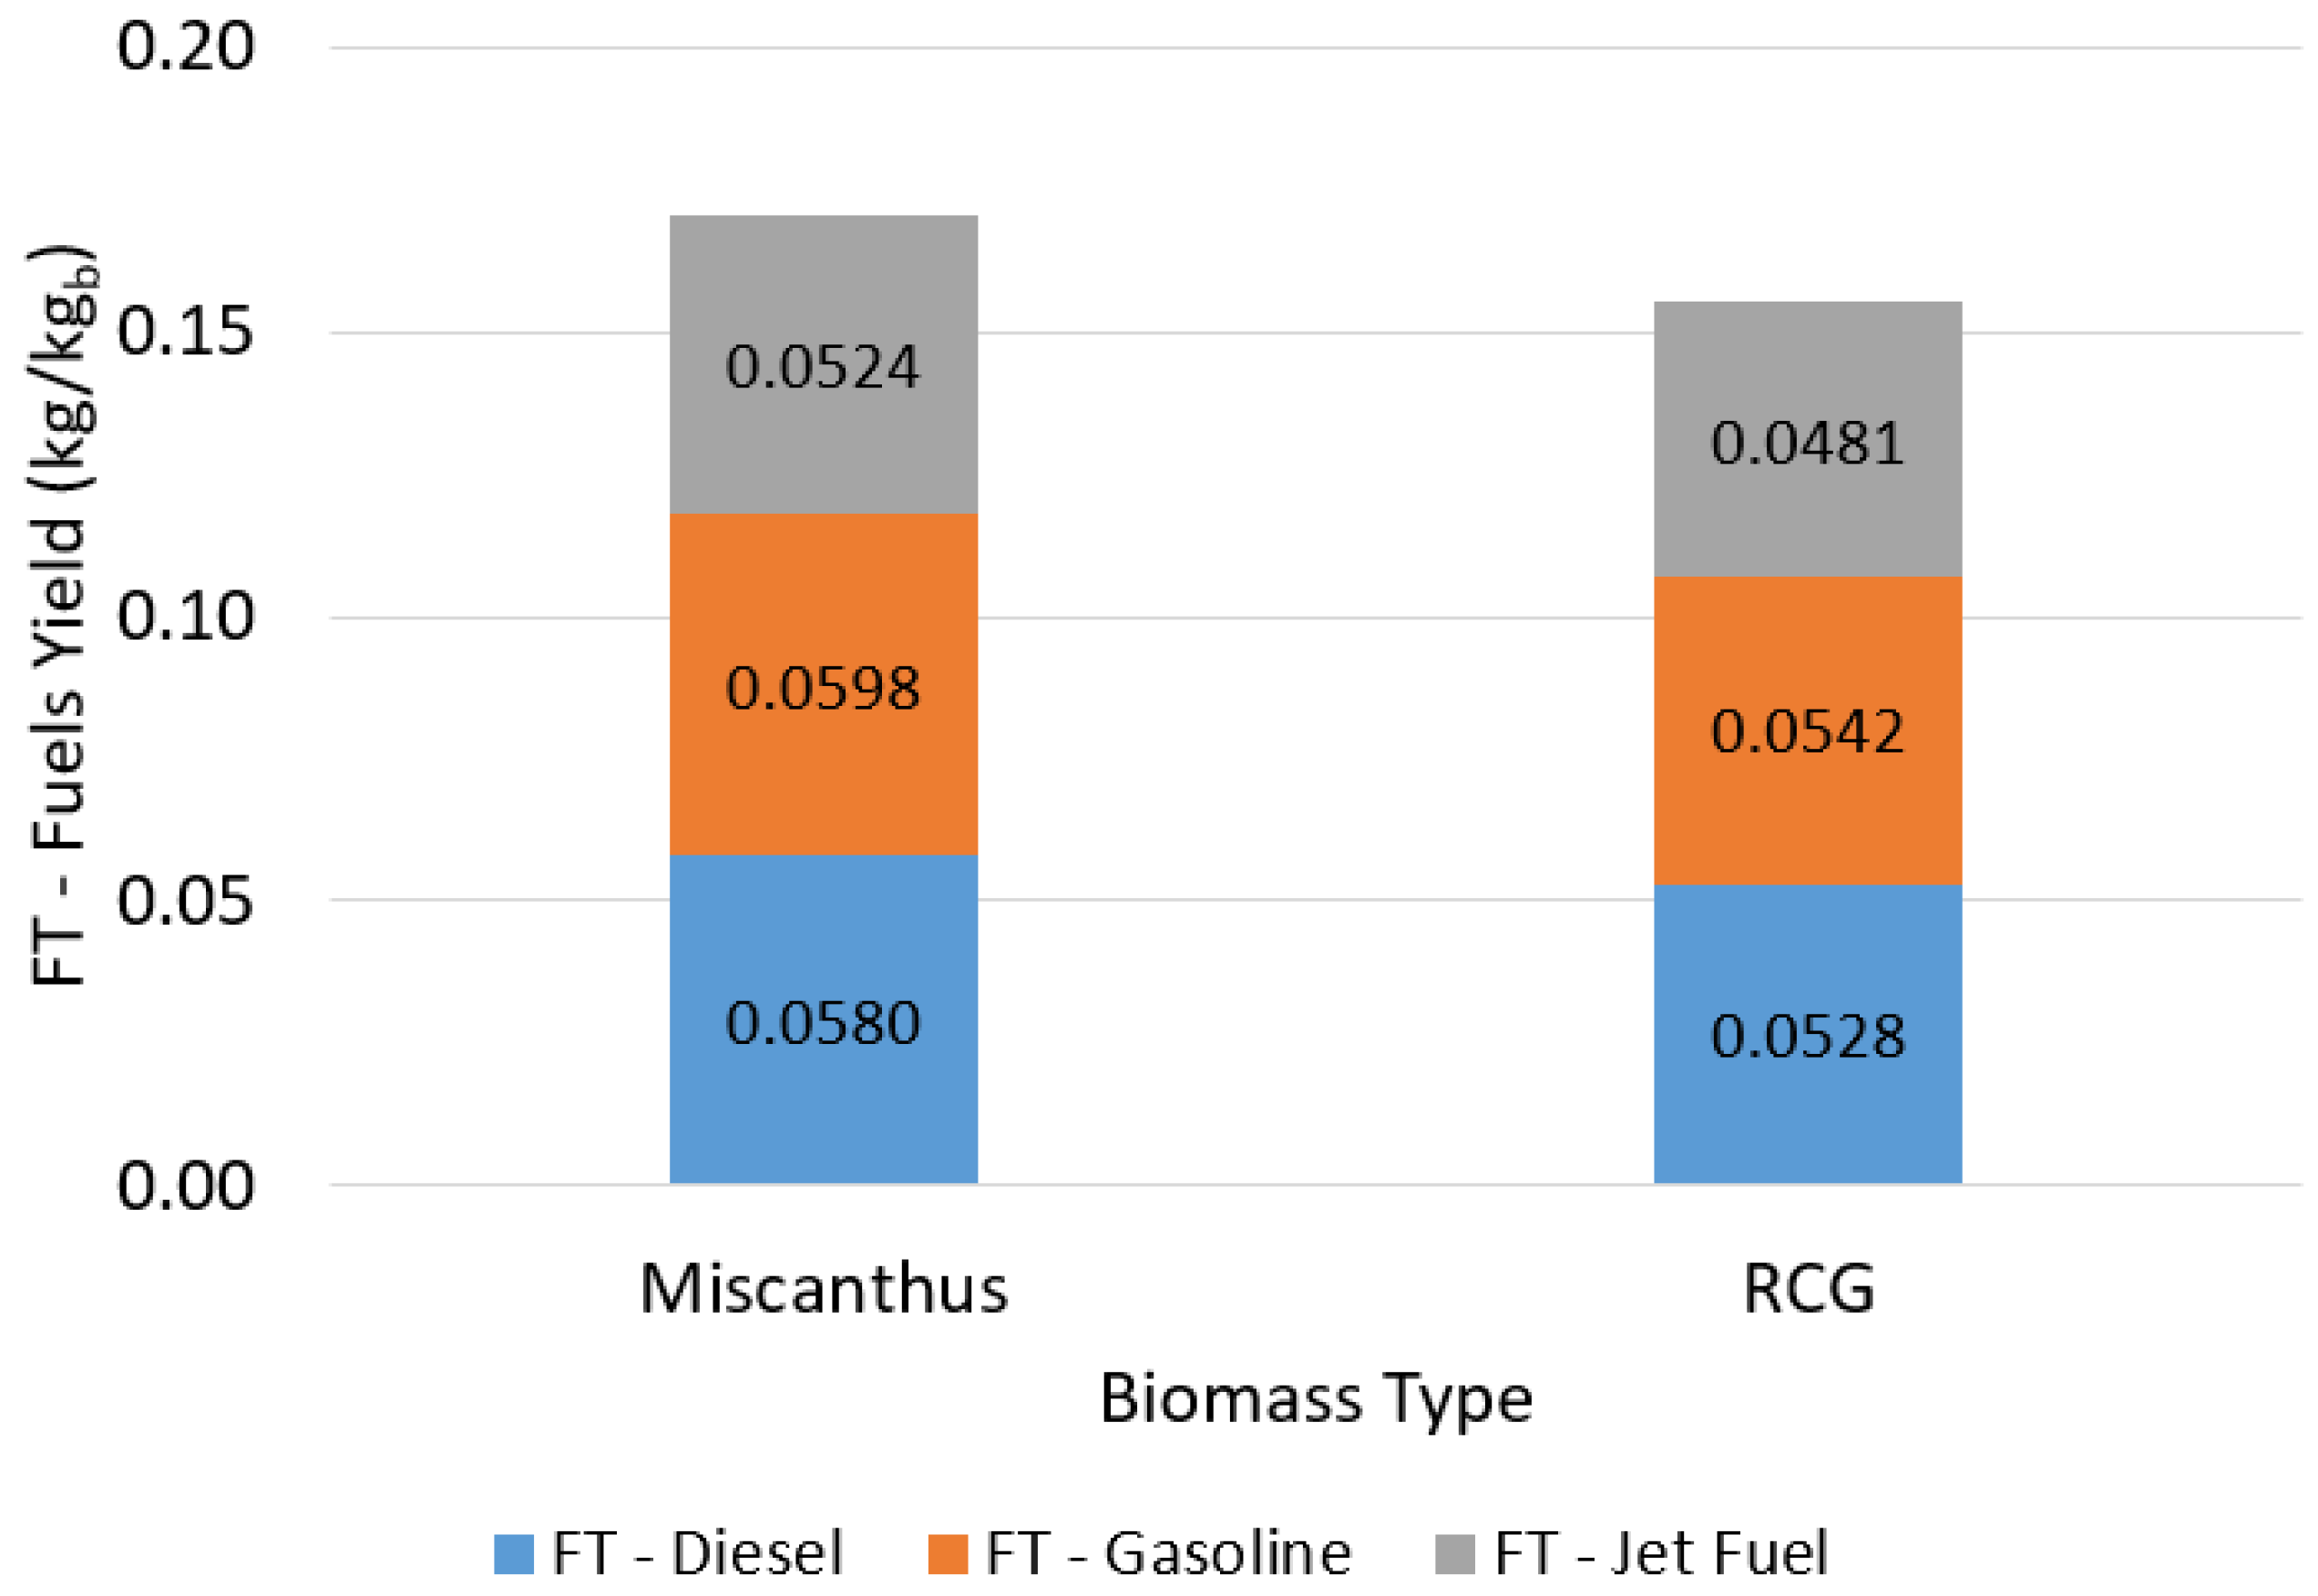
3.1.3. FT Fuel Production: Max-Yield Operating Scenario

Different scenarios are formulated to calculate synthetic liquid biofuel yields. They are based on implementing various heat-source options to provide the process heat demand. In the present analysis, heat requirements are attributed to both SCWG and DRR reactors, since they are associated with highly endothermic reactions and constitute the most energy-intensive part of the process. On the other hand, it is assumed that the FTS reactor produced heat due to the exothermic nature of the associated reactions [28], which counterbalances respective requirements in the FT biofuel upgrade and refinement section.
In the heat self-sufficient scenarios, part of the syngas is utilized to provide the process with heat via combustion. In that case, the expected FT biofuel yield is compromised, but the process can internally cover its estimated demand. In the max-yield operating scenario, an external heat source provides the calculated SCWG + DRR heat demand. Thus, all produced syngas is fed to the DRR-calculated and FT biofuels to obtain their maximum potential yields. In this scenario, the process is not thermally self-sufficient and the selection of a specific heat source is elaborated in Section 3.2, where LCA results are presented.
Simulations have been performed for all three biomass concentrations as well as for both Miscanthus and RCG biomasses. In each case, SCWG temperature has been selected with respect to achieving a H2/CO molar ratio at the FTS reactor inlet within 2.0–2.1 to (a) maximize the FT biofuel yields and (b) ensure that a surplus of unreacted H2 is achieved and sent to the HDR (H2 -sufficient process). The adopted SCWG temperatures are aligned with findings already presented in Figure 7. The DRR temperature was set equal to 900 °C so that complete conversion of CH4 and CO2 to CO and H2 is achieved. A summary of the selected operational conditions is presented in Table 2. The process’s carbon efficiencies are also depicted, approaching 50% in all examined cases, which is slightly higher than the typical values in conventional BTL–FTS processes (≈41% according to [25]) but indicative of technology potential.
Figure 10 depicts FT fuel product yields for Miscanthus and all three biomass concentration ranges. It is shown that biomass concentration does not influence FT biofuel specific yields (per 1 kg of dry biomass). Evidently, absolute yields are much higher with increasing biomass concentration, and this is reflected in the LCA. Furthermore, results show that FT Gasoline depicts the highest yields (0.0983–0.0998 kg/kgb), and FT Diesel follows with 0.0956–0.0968 kg/kgb. FT Jet Fuel values are lower and range within 0.0864–0.0873 kg/kgb. The distribution of individual FT biofuel yields are associated with (a) the FTS product distribution according to Anderson–Schulz–Flory for a-value equal to 0.9; (b) the HDR catalyst selectivity (Section 2.2.2) [38].
Figure 11 presents the total as well as individual FT biofuel yields for both Miscanthus and RCG biomasses in the indicative case of 20% wt. biomass concentration. It is shown that for Miscanthus a total of 0.2837 kg/kgb FT biofuels can be produced. This is broken down to 0.0997 kg/kgb, FT Gasoline, 0.0967 kg/kgb and 0.0873 kg/kgb, FT Jet Fuel. For RCG, the total of 0.2585 kg/kgb FT liquid biofuels calculated corresponds to 0.0904 kg/kgb, FT Gasoline, 0.0880 kg/kgb and 0.0801 kg/kgb FT Jet Fuel. The anticipated FT biofuel yield is approximately 8.9% lower for RCG than for Miscanthus. The discrepancy is associated with the lower C and H (and higher O) content of RCG compared to Miscanthus.
Predicted SCWG + DRR heat-demand values (per kg of biomass) with respect to both SCWG temperature and biomass concentration are presented in Figure 12. This study focuses on the syngas production and upgrade section of the model, since it constitutes the most energy-intensive part of the process. This can be associated with (a) the SCWG reactor’s high temperatures as well as the reactive mixture’s high water content; and (b) the high temperatures required for DRR operation. Heat requirements can be significantly reduced if heat from both SCWG and DRR gas products is used. Based on [14], a thermal efficiency equal to 75% is considered corresponding to the ratio of the actual recovered heat to the theoretically available (in counterflow). Waste heat from the DRR is also utilized to reduce heat demand. Furthermore, heat provided from off-gas combustion has been subtracted from the heat-demand calculations. In the present scenario, they include (a) process off-gases from FTS and refinement section products and (b) a hydrogen surplus. It is shown that increased biomass concentration results in lower demand per kg of dry biomass due to lower water content in the SCWG reactor. In the examined SCWG + DRR reactor conditions, heat demand ranges within 2.82–1.78 kWh/kgb for Miscanthus and 2.57–1.51 kWh/kgb for RCG for 10–20% wt. biomass.
A sensitivity analysis has also been performed investigating the effect of heat recovery efficiency on the calculated SCWG + DRR heat demand. The results are shown in Table 3 for a typical range [53]. As expected, heat demand is significantly decreased with improving efficiency. In this scenario, FT product yields are not influenced by the heat recovery efficiency.

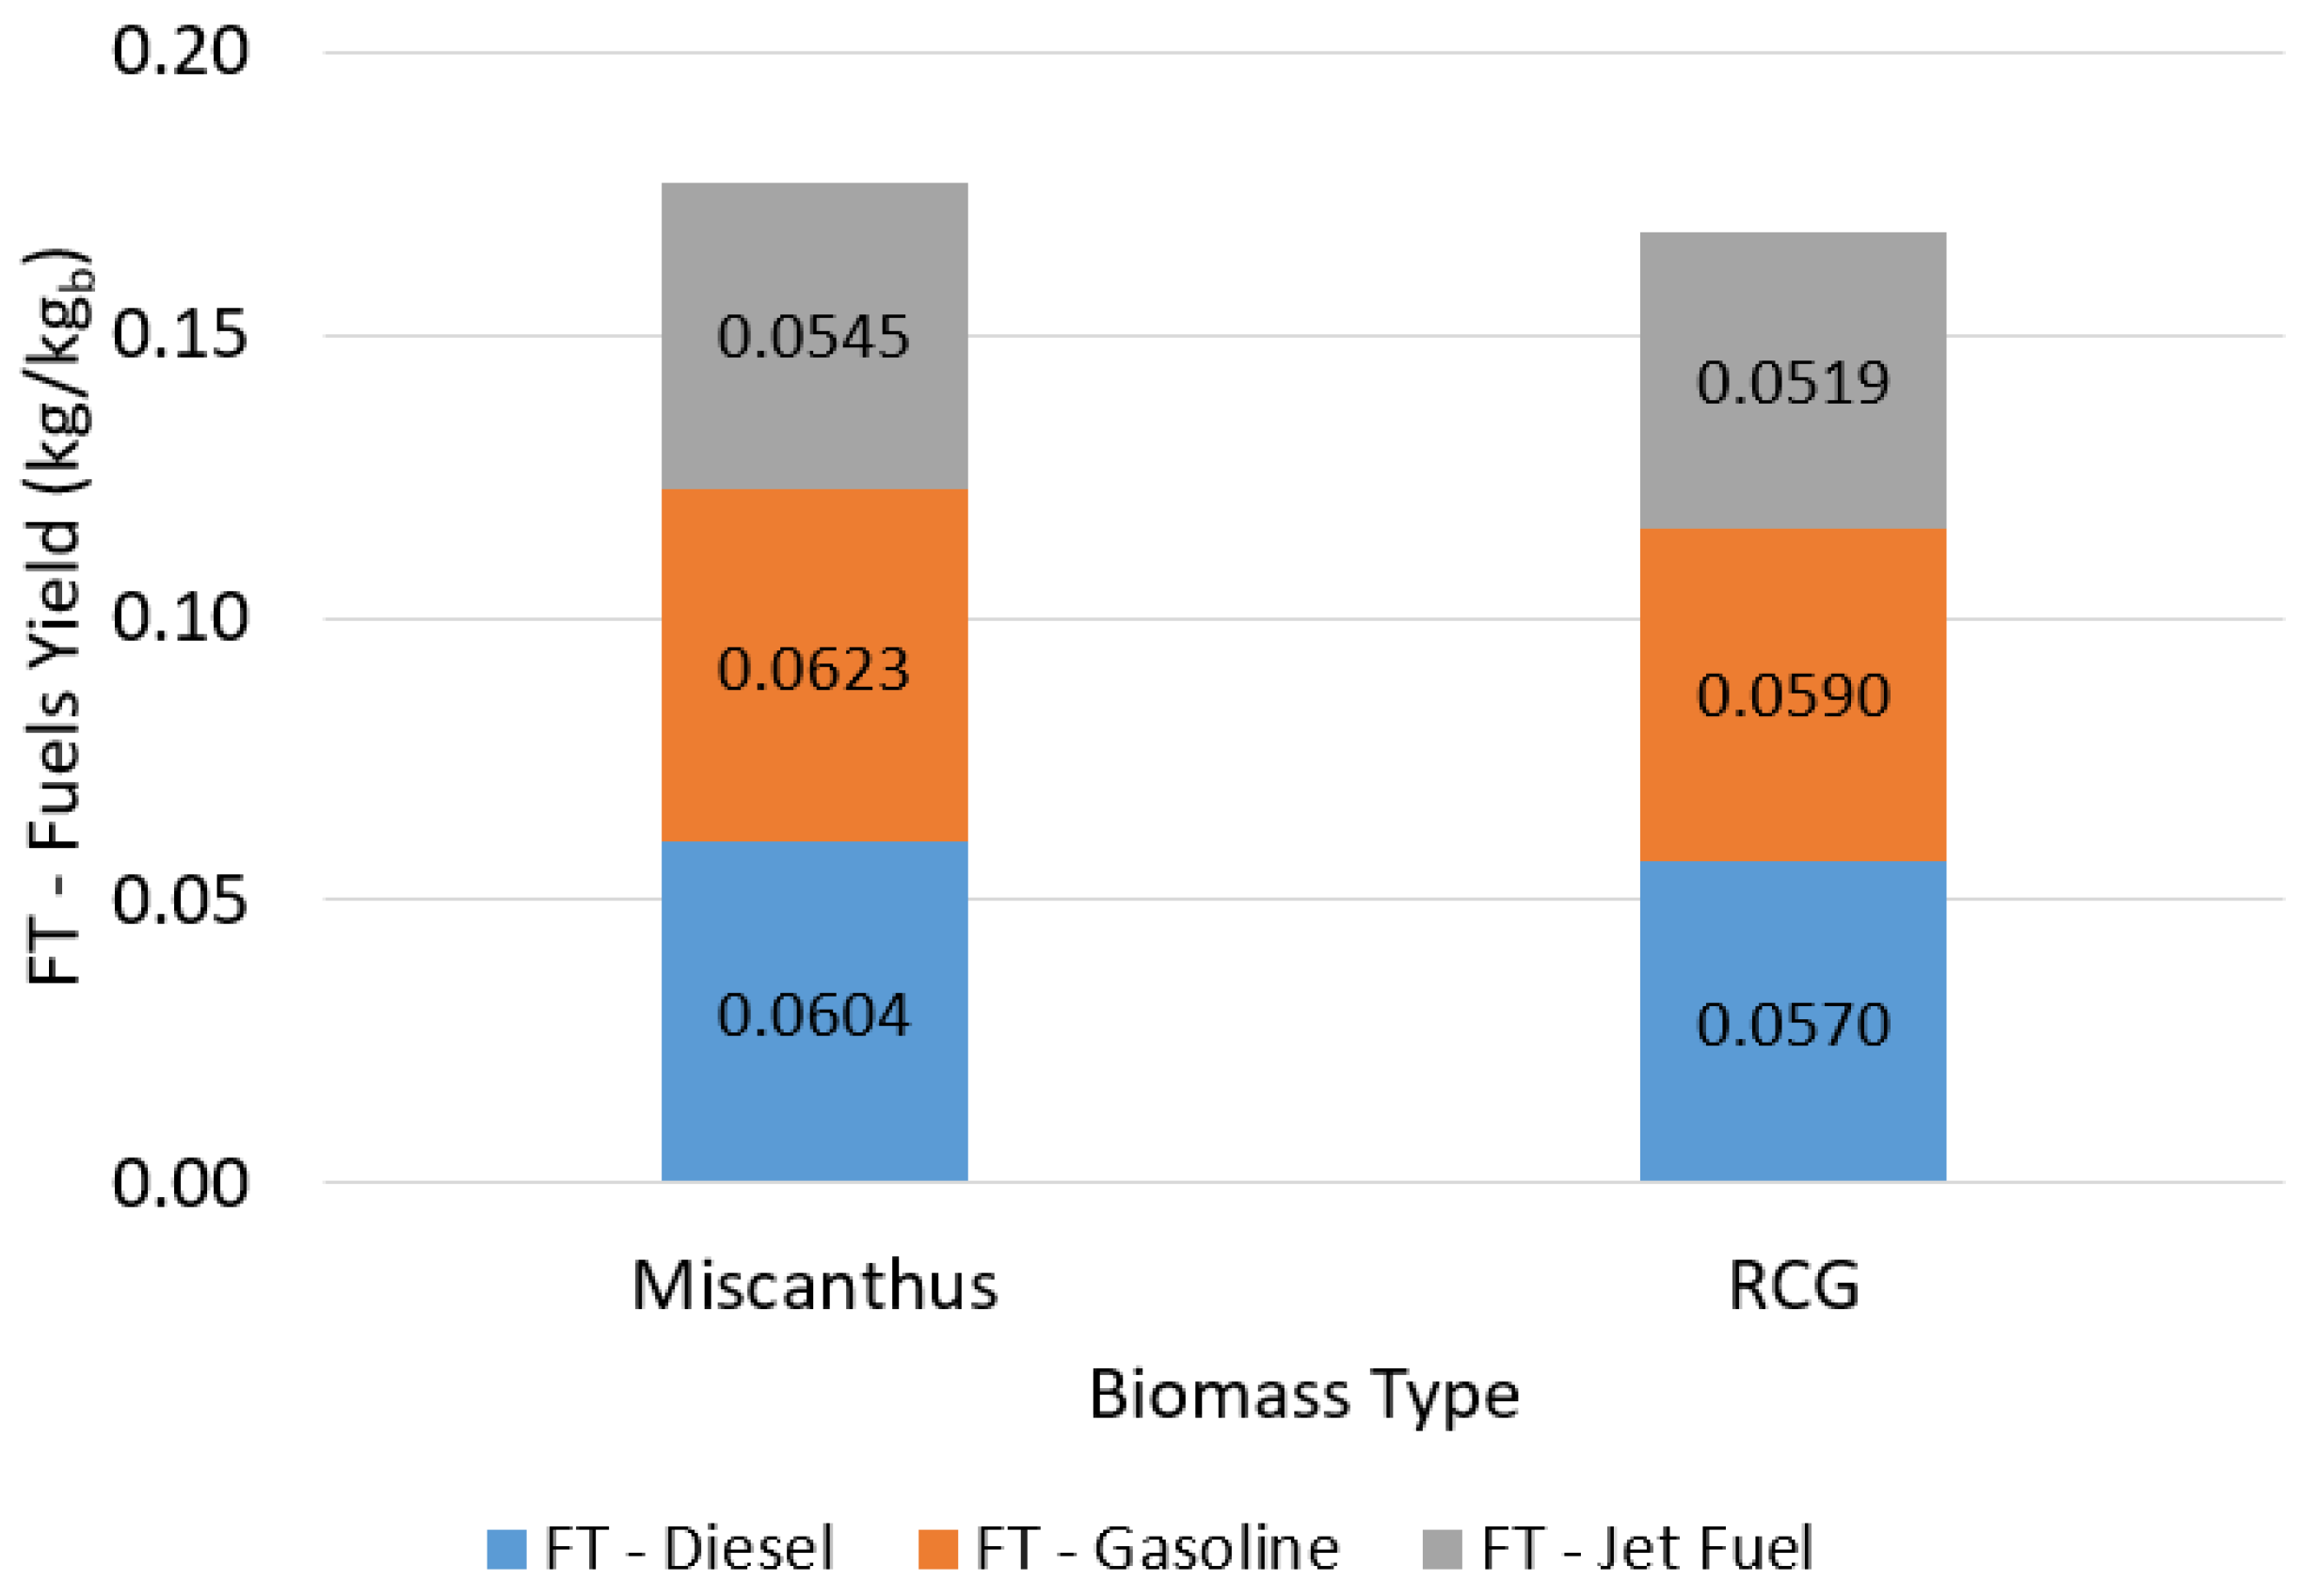
3.1.4. FT Fuel Production: Heat Self-Sufficient Process Operating Scenarios

In the thermally self-sufficient scenarios part of syngas is utilized to provide process heat via combustion. Τhe expected FT biofuel yield is decreased, but the process can internally cover its estimated heat demand. Two alternative cases are examined: (a) heat self-sufficient scenario 1 (HSS-1), where DRR temperature is equal to 900 °C to ensure complete conversion to CO and H2; and (b) heat self-sufficient scenario 2 (HSS-2) with DRR temperature equal to 650 °C to lower the total heat demand.
  • HSS-1 (DRR temperature = 900 °C)
Simulations have been performed for all three biomass concentrations as well as for both Miscanthus and RCG. For each simulation, SCWG temperature and H2/CO molar ratio at the FTS reactor inlet is the same as in Table 2. The heat produced by the exothermic combustion reactions of a fuel mixture comprising part of syngas and the off-gases with air is balanced to the net heat duty of both SCWG and DR reactors. Heat recovery from the cooling of both SCWG reactor products and the upgraded syngas (from the DRR) is also considered equal to 75%, as in the max-yield operating scenario.
According to the results presented in Table 4, for 10% wt. biomass concentration, 65% wt. of syngas must be burned to achieve process-heat self-sufficiency. By increasing biomass concentration, this fraction (syngas split) sent to combustion gradually decreases (50% and 40% wt. for 15 and 20% wt. biomass concentration, respectively). This is expected, since heat requirements in the SCWG reactor decrease with increasing biomass concentration (Figure 12). Furthermore, since the amount of syngas sent for combustion decreases, the process’s carbon efficiency increases with biomass concentration. Predicted values are lower than in the max-yield scenario and range within 17.0–29.6% for Miscanthus and 16.6–28.5% for RCG. Discrepancies between Miscanthus and RCG are up to 4% and are associated with the small differences of H2/CO molar ratios in the examined cases.
Figure 13 depicts FT fuel product yields for Miscanthus in all three biomass concentration ranges. Higher biomass concentration leads to an increase in FT biofuel-specific yields. The results show that FT Gasoline depicts the highest yields (0.0344–0.0598 kg/kgb) and FT Diesel follows with 0.0335–0.058 kg/kgb. FT Jet Fuel values are lower and vary within 0.0302–0.0524 kg/kgb. Maximum yields are obtained in the 20% wt. biomass concentration case. The latter is considered as the best-case scenario and its results are highlighted in Figure 14, where the total as well as individual FT fuel yields for both Miscanthus and RCG are depicted. It is shown that for Miscanthus, a total of 0.1702 kg/kgb FT liquid biofuels can be produced. For RCG predictions indicate a total 0.1551 kg/kgb FT liquid biofuel yield. The total anticipated FT biofuel yield is approximately 8.9% lower for RCG than for Miscanthus. This discrepancy is again associated with the lower C and H (and higher O) content of RCG compared to Miscanthus.
A sensitivity analysis investigating the effect of heat-recovery efficiency on the calculated SCWG + DRR heat demand has also been performed for this scenario. As expected, heat demand is significantly decreased with improving efficiency and thus less syngas must be burned to achieve the process-heat self-sufficiency. This has a direct impact on the calculated FT product yields, as shown in Table 5.
  • HSS-2 (DRR Temperature = 650 °C)
In this case, part of syngas is burned to provide process heat, but the DRR operates at a lower temperature (650 °C); thus, full conversion is not achieved. In this alternative, approximately 60% wt. of CH4 is converted to CO, and therefore (a) the unreacted biomethane can also be burned to provide process heat and (b) the H2/CO mol ratio at the FTS reactor inlet increases. Given that syngas H2 decreases with biomass concentration, it is deduced that process H2 sufficiency can be maintained even if SCWG is operated at lower temperatures (than in the full conversion case). This is in line with restrictions in SCWG reactor temperature when the operating pressure approaches 300 bar. Furthermore, in the present scenario, the syngas-split fraction requirement is expected to decrease due to the additional combustion of the unreacted biomethane, but this will not necessarily lead to higher FT biofuel yields since lower CH4 conversion in the DRR results in a decrease in respective H2/CO feeds at the FTS reactor inlet.
Indicative results are shown in Table 6 for both Miscanthus and RCG in all three biomass concentration cases. Expectedly, a lower amount of syngas must be sent for combustion to minimize the SCWG + DRR net-heat duty compared to the full DRR conversion case. Syngas split ranges within 50–15% for the 10–20% wt. biomass concentration cases, respectively. Carbon efficiency is slightly higher than in HSS-1; however, differences are very small. Its maximum value is obtained at the higher biomass concentration cases and reaches 30.8% (20% wt. biomass). Given the similarities of syngas compositions between Miscanthus and RCG, neither significant discrepancies between their respective carbon efficiencies are depicted, nor do they follow a systematic trend. They are mostly related to the small differences in H2/CO molar ratio at the FTS reactor inlet. Simulations have been performed, selecting the SCWG temperature with respect to achieving a H2/CO molar ratio at the FTS reactor inlet within 2.0–2.1. It is shown that in all cases, process H2 sufficiency can be marginally maintained, with SCWG temperature not exceeding 700 °C.
The predicted carbon efficiencies between this study and the work of Campanario and Ortiz [54], adopting a similar (SCWG + DRR + FTS) chain for the valorization of aqueous bio-oil, show convergence, despite not being directly comparable. For the case of 20% wt. biomass concentration, predicted carbon efficiencies are slightly higher than those presented in [54] (23.95% and 27.19% with and without refining, respectively). Discrepancies can be associated mainly with (a) a higher CH4 conversion in the DRR due to higher temperature considered here (650 °C); (b) differences in the calculation of SCWG + DRR heat demand due to uncertainties in the lignocellulosic biomass heat of formation estimation; and (c) the different catalyst considered in the HDR.
Figure 15 depicts FT fuel product yields for Miscanthus in all three biomass concentration ranges. A higher biomass concentration leads to an increase in FT biofuel-specific yields. The results show that FT Gasoline depicts the highest yields (0.0366–0.0623 kg/kgb) and FT Diesel follows with 0.0335–0.0604 kg/kgb. FT Jet Fuel values are lower and range within 0.0321–0.0545 kg/kgb. Overall, yields are slightly higher than those in HSS-1, as also indicated by the calculated carbon efficiencies. Maximum yields are obtained in the 20% wt. biomass concentration case. The results for the latter case are highlighted in Figure 16 where the total as well as individual FT fuel yields for both Miscanthus and RCG are depicted. It is shown that for Miscanthus, a combined yield of 0.1772 kg/kgb FT liquid biofuels can be produced. For RCG, predictions indicate a total FT liquid biofuel yield of 0.1679 kg/kgb, 5.3% lower than Miscanthus. This discrepancy is again associated with the lower C and H (and higher O) content of RCG compared to Miscanthus; however, this is slightly lower than the 8.9% depicted in the max-yield/HSS-1 scenarios. This is attributed to small differences in the DRR conversion efficiencies of Miscanthus and RCG (~65% in RCG and ~62% in Miscanthus) processes.
A sensitivity analysis investigating the effect of heat-recovery efficiency on the calculated SCWG + DRR heat demand has also been performed for this scenario. As expected, heat demand is significantly decreased with improving efficiency and thus less syngas must be burned to achieve process-heat self-sufficiency. In the particular case of the highest efficiency considered, the process can be marginally self-sustained without syngas combustion (Table 7). This has a direct impact on the calculated FT product yields.

3.2. Life-Cycle Results

3.2.1. Core Conversion and Upgrading to Final Fuel

According to the results of Section 3.1, the inventories presented in Figure 17 and Figure 18 were compiled. Two variations were developed, in line with the alternative system configurations, which correspond to the maximum external process’s heat requirement (Figure 17/max-yield case) and self-sustained operation with zero external heat requirements (Figure 18—HSS-1 and 2 scenarios).
The composition of the final biofuel (red blocks in Figure 17 and Figure 18) is acquired from the results of Section 3.1 and the corresponding final biofuel yields. The higher product yield of the first (maximum external heat requirement—Figure 17) case is reflected on the lower feedstock input per MJ of biofuel produced.
Both cases include the materials/energy requirements and expected emissions from conversion and upgrading. The consumptions of electricity and process heat were acquired from the modelling results of previous sections. The variation regarding feedstock mass, electricity, and process heat refers to the various cases of biomass concentration examined in Section 3.1 (10%, 15% and 20%).
In order to have a worst-case scenario (represented in Figure 17), external heat was assumed to be provided from natural gas combustion in an industrial size boiler. Therefore, direct emissions refer to NG combusted for process heat.
Upstream impacts were modelled using Ecoinvent data, while an electricity production mix with a carbon intensity of 379 g CO2-eq/kWh was modelled, which is a reference average EU-28 generation mix for 2030 according to [55].
On the other hand, Figure 18 presents the case where no external heat is required, and nevertheless lower product yield is achieved, thus increasing all corresponding mass and energy input flows. The utilization of a syngas fraction for covering heat requirements provides local CO2 emissions; however, these are biogenic and are not considered in the GWP calculation. According to Figure 17 and Figure 18, the produced petrol-fuel energy content contributes approximately 35% of the total, while the corresponding percentage for diesel and kerosene are 34% and 31%, respectively (LHV-based calculation, assuming typical fuel values: petrol: 43.4 MJ/kg; jet fuel (kerosene): 43.0 MJ/kg; diesel: 42.6 MJ/kg).

3.2.2. Reference Systems

The values of the GWP of the process chains examined are compared to reference values, referring to common biofuels. RED II [3] has established the threshold for liquid biofuels, in order to be characterized as “sustainable”. This performance target for biofuels dictates that the whole biofuel production chain should have an impact at least 65% lower than the fossil-fuel carbon intensity of 94 g CO2-eq/MJ_fossil_fuel. Therefore, a value of 32.9 g CO2-eq/MJbiofuel will be adopted as an applicable and globally accepted target value for the sustainability performance of the biofuel produced. Apart from the sustainability threshold, RED II provides reference carbon intensities for existing liquid biofuel production chains (namely biodiesel and bioethanol) [2]. RED III [4] has not amended any corresponding data.
Table 8 presents the data considered for the reference system. Conventional biodiesel and bioethanol show a large range of carbon load, depending heavily on feedstock and potential dLUC and iLUC contributions.

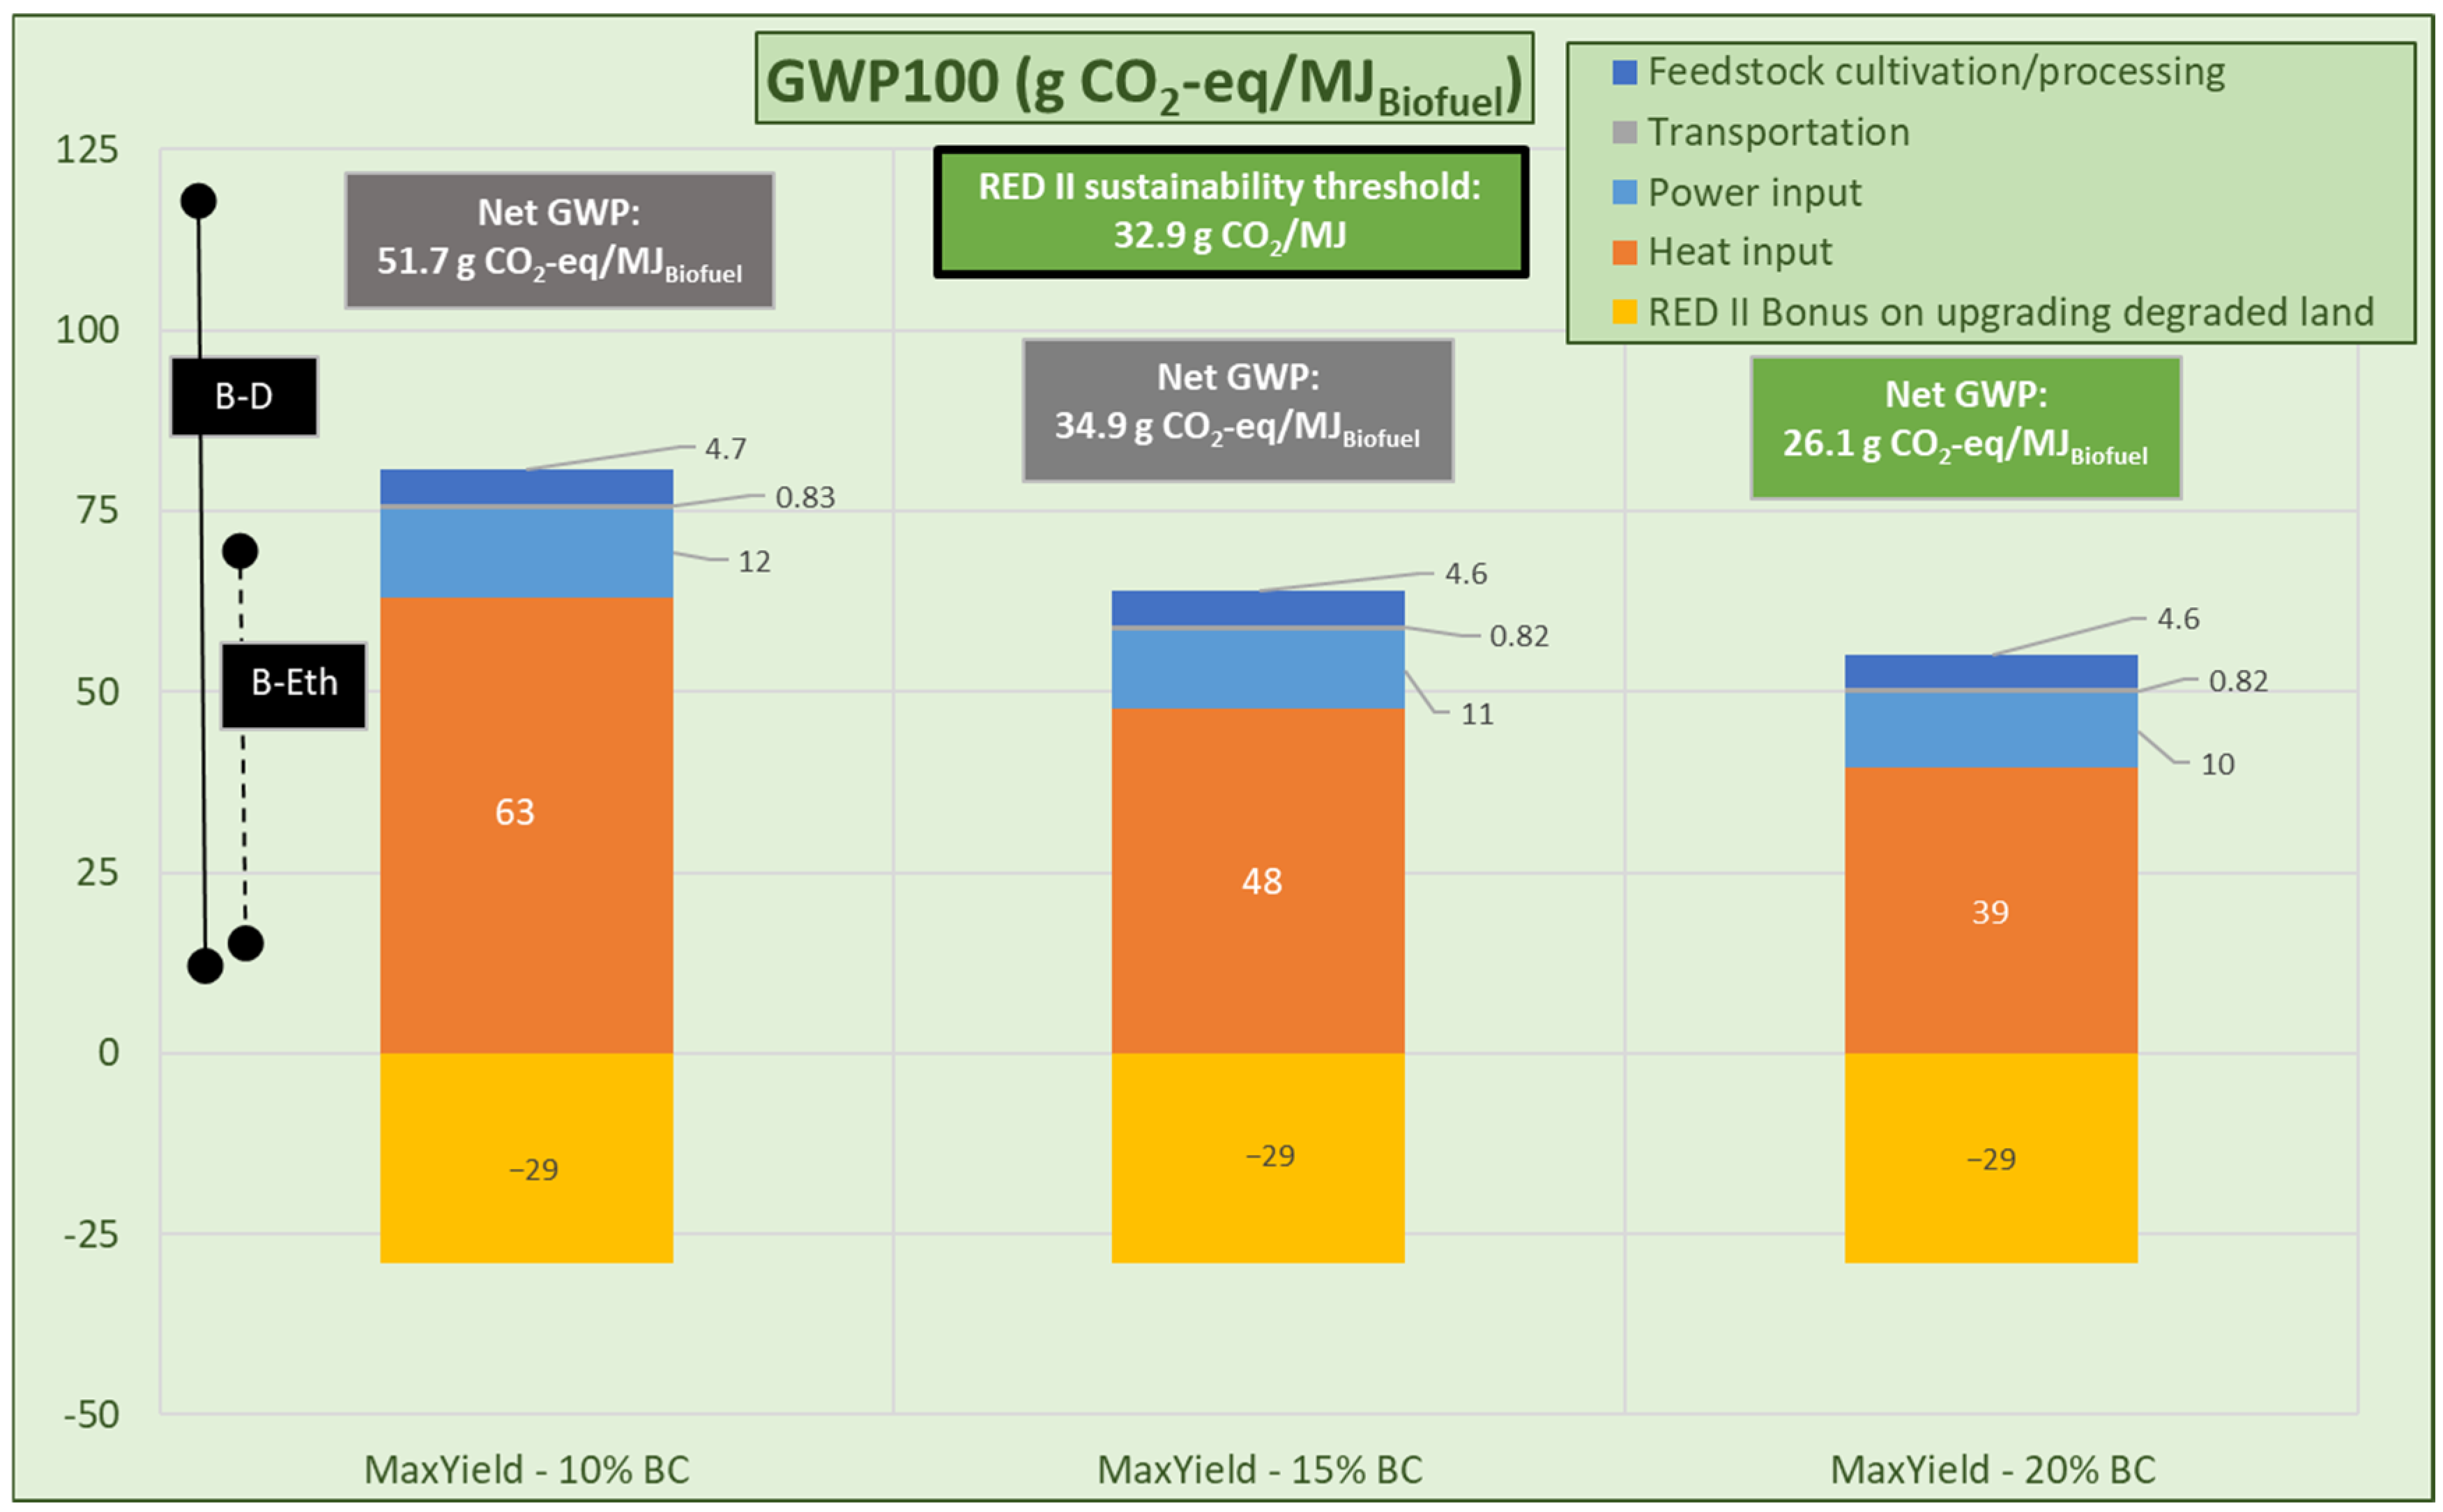
3.2.3. FT Fuel Production

The following section presents the GWP results for reference and SCWG value chains. The results are distinguished in three scenarios:
  • Max-yield scenario: Maximum yield assumed (Section 3.1.2) and external heat provided by fossil fuel combustion.
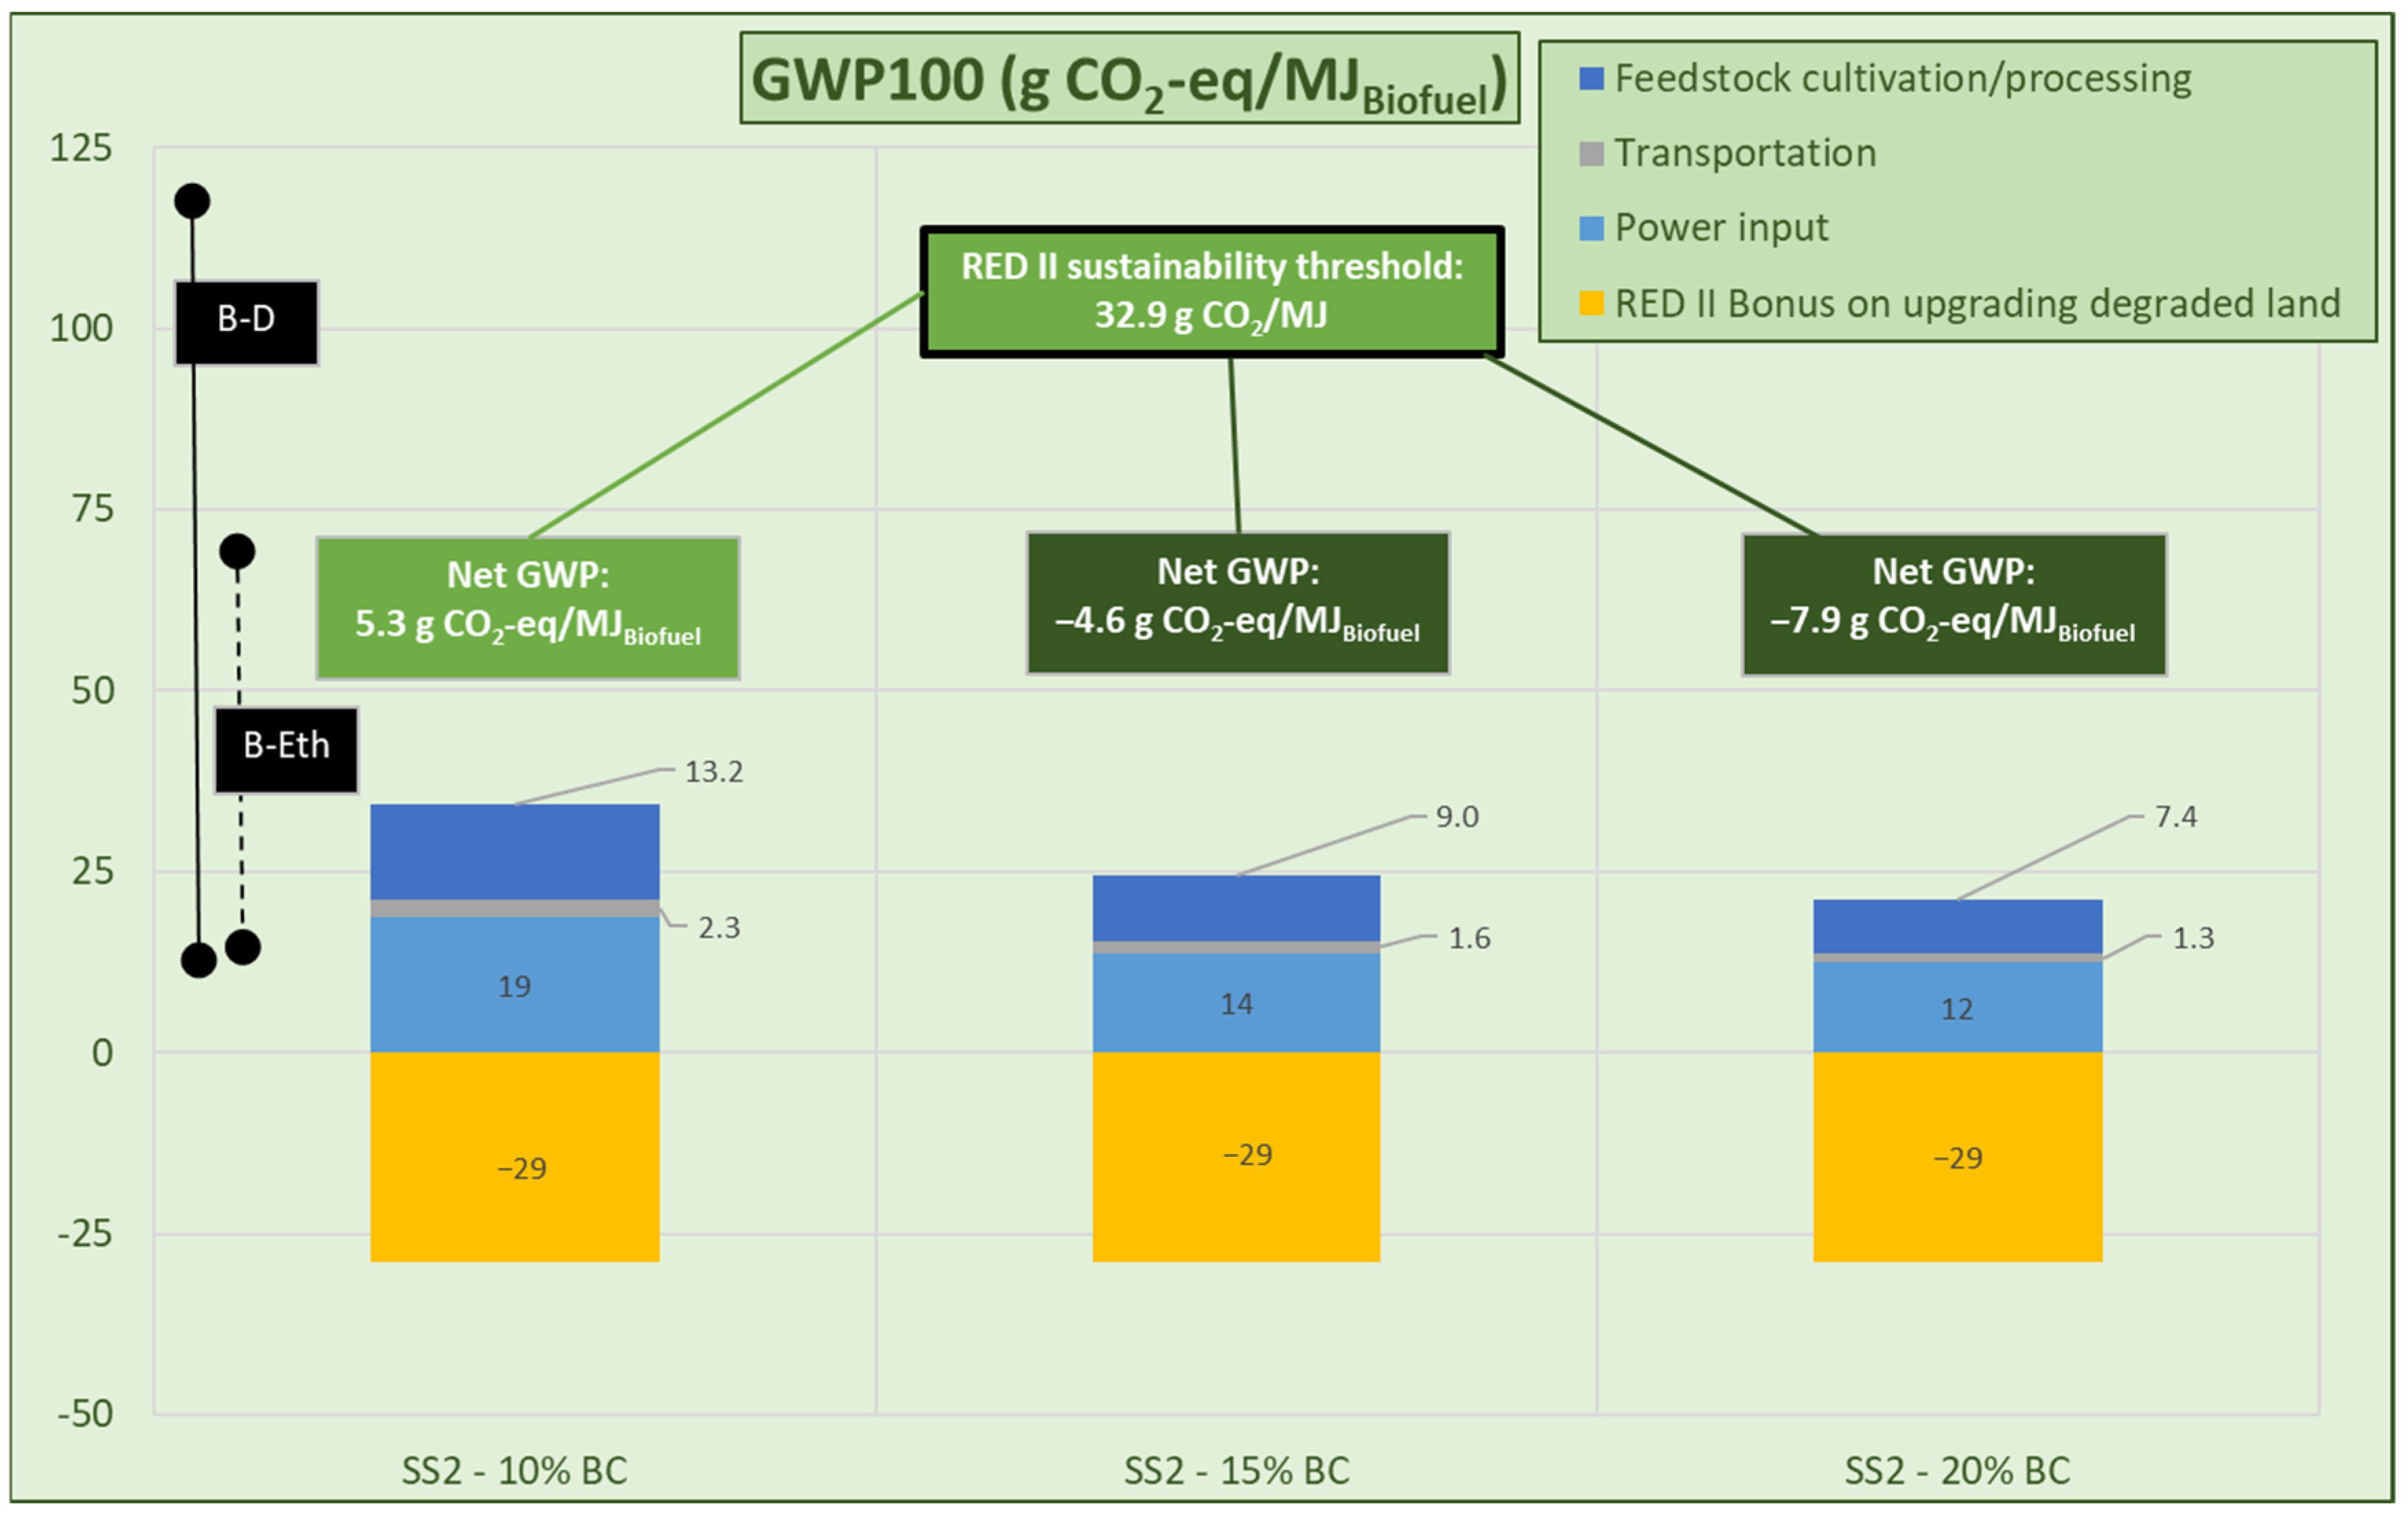
  • HSS-1 and HSS-2 scenarios: Reflecting the results of Section 3.1.3, where no external heat is required.
  • Max-yield operating scenario
Figure 19 presents the results regarding index Global Warming Potential (GWP), when considering maximum yield (Section 3.1.2) and external heat provided by fossil-fuel combustion. On the left side, the GWP ranges for conventional biodiesel (B-D) and bioethanol (B-Eth) are presented with black lines, according to the data of the rightmost column of Table 8.
Most of the GWP is connected to the core conversion and upgrading stages. This process-related impact is distinguished between the direct impact from providing process heat and the indirect impact due to power generation, transportation, and distribution. Due to fossil-fuel consumption for external heat requirements, all cases have relatively high CO2 emissions. On the other hand, the REDII bonus on upgrading degraded land [2] provides a considerably positive effect. Overall, it is necessary to assume that the feedstock comes from degraded fields in order to consider the REDII bonus and have at least one case that the produced biofuel is characterized as “sustainable”. Only the high biomass concentration case (BC: 20%) provides a result which is lower than the REDII sustainability threshold of 32.9 g CO2/MJbiofuel. Lower BC values require higher heat input, and thus higher fossil CO2 emissions from NG combustion. Compared to existing biofuels, SCWG biofuels under the max-yield scenario would have similar GWP to the most carbon-intensive bioethanol chains (if not considering the REDII carbon bonus).
The variation in the heat-recovery efficiency has a direct influence on the GWP contribution of “Heat impact”. Higher or lower efficiency by 10% (Table 3) results in lower or higher GWP (respectively) by 11 g CO2/MJbiofuel (in the case of 20% BC), which is a value comparable to the “Power input” impact (Figure 19).
  • Heat self-sufficient process’s operating scenarios.
Figure 20 and Figure 21 present the results regarding Global Warming Potential when considering self-sustained operation in terms of process-heat requirements.
By alleviating the requirement for external heat, all three cases are very close to the “net zero carbon” characterization. This is due to the REDII carbon bonus, acting towards counterbalancing the GWP impact of cultivating, transporting, and converting the feedstock. If degraded land cultivation is not considered, all cases are still well within the “sustainable” region (below 32.9 g CO2-eq/MJ total impact) and have a similar impact to the lowest carbon-intensive chains for existing liquid biofuels. Compared to Figure 19, the lower biofuel yields lead to increased impact for cultivation, transportation, and power supply. Therefore, if a waste or renewable (zero-impact) heat flow can be provided and utilized (possible within the boundary of a bio-refinery), the max-yield scenario would provide the minimum GWP impact.
Compared to the previous operating scenario, the variation in the heat-recovery efficiency has significantly lower influence, since there is no contribution related to external heat provision. The related influence refers to higher/lower yields (Table 5 and Table 7), and therefore lower feedstock and transportation contributions in the GWP results. By assuming higher or lower efficiency by 10% (Table 5 and Table 7), a lower or higher GWP (respectively) by 1.5 g CO2/MJbiofuel is acquired (in the case of 20% BC), which has a minor impact on the total results, as it can be observed when compared to the corresponding results in Figure 20 and Figure 21.

4. Discussion

A conceptual computational process model has been developed to simulate the production of FTS liquid biofuels through SCWG of lignocellulosic biomass. The model includes the following basic stages: (a) SCWG reactor; (b) syngas upgrade through dry reforming; (c) FTS reactor; (d) FT biofuel products’ upgrade and refinement, so that predictions of diesel-like, gasoline-like, and jet fuel-like yields are reported.
Simulations have been performed considering two biomass types: Miscanthus and RCG. Their proximate and elemental analyses available were obtained from the literature. The effect of biomass concentration (10–20% wt.) and SCWG temperatures within 625–775 °C has been assessed. The results show that syngas composition is similar for both Miscanthus and RCG. It is also shown that increasing biomass concentration increases syngas CH4 and reduces H2 concentrations. On the contrary, increasing SCWG temperature increases syngas H2 and reduces CH4 concentrations. To maximize the FT biofuel yields, the optimum value of H2/CO molar ratio for FTS must be equal to approximately 2. Thus, to achieve this ratio, higher SCWG temperatures must be employed at higher biomass concentrations. In all examined scenarios, the H2/CO ratios considered are slightly higher than 2, so that a surplus of unreacted H2 is achieved and sent to the HDR. Thus, a H2-sufficient process can be considered. Higher H2/CO molar ratios at the FTS inlet (produced at higher SCWG temperatures) would decrease FT liquid product yields and increase H2 to be used either as a surplus in the HDR or as fuel to provide additional heat to the system.
Two basic scenarios have been formulated. They are based on predicting FT liquid biofuel yields by implementing alternative heat-source options to provide process heat. Initially, emphasis was given in calculating maximum FT biofuel yields (max-yield operating scenario). To achieve that, an external heat source is considered to provide the calculated heat requirements (focusing on SCWG + DRR heat demand, as the most energy-intensive part of the process). Thus, all produced syngas is fed to the DRR and FT biofuels obtain potential maximum yields. Process carbon efficiencies reach approximately 50% in all examined cases. Similarly, specific yields (per kg of dry biomass) of FT biofuels are not influenced by biomass concentrations. For Miscanthus, a total of 0.2837 kg/kgb FT liquid biofuels can be produced. For RCG, the respective yield is 0.2585 kg/kgb, 8.8% lower than Miscanthus. This discrepancy is associated with the lower C and H (and higher O) content of RCG. The 20% wt. biomass concentration case is considered as the best-case scenario, since (a) heat requirements decrease with increasing biomass concentration due to less water in the SCWG reactor; (b) absolute FT biofuel yields are higher. In this case, for Miscanthus, specific yields of FT liquid biofuels are: 0.0997 kg/kgb, FT Gasoline, 0.0967 kg/kgb and 0.0873 kg/kgb FT Jet Fuel.
In the second scenario, part of syngas is utilized to provide heat to the process via combustion. This concept is assessed with respect to minimizing process-heat requirements and achieving thermal self-sufficiency. Two alternative approaches are examined. In HSS-1, the DRR temperature is equal to 900 °C, ensuring complete CH4 conversion to CO. It is shown that by increasing biomass concentration, the fraction of syngas sent to combustion gradually decreases (70% and 40% wt. split for 10 and 20% wt. biomass concentrations, respectively). This is expected, since heat requirements in the SCWG reactor decrease with increasing biomass concentration. Thus, process carbon efficiency and specific yields of FT biofuels increase with biomass concentration. Predicted values are lower than in the max-yield scenario, since part of the syngas is burned and not fed to the FTS reactor. Carbon efficiencies range within 17.0–29.6% for Miscanthus and 16.6–28.5% for RCG. For Miscanthus, a total of 0.1702 kg/kgb FT liquid biofuels can be produced. For RCG, the respective yield is 0.1551 kg/kgb. For Miscanthus, when the biomass concentration is 20% wt. (best-case scenario), FT Gasoline depicts the highest yield, 0.0598 kg/kgb, with FT Diesel and FT Jet Fuel following with 0.0580 and 0.0524 kg/kgb, respectively.
In HSS-2 DRR is considered equal to 650 °C to lower the total heat demand. Full conversion is not achieved, and approximately 60% wt. of CH4 is converted to CO. Therefore, the unreacted biomethane can also be burned to provide process heat and the H2/CO mol ratio at the FTS reactor inlet increases. Given that syngas H2 decreases with biomass concentration, process H2 sufficiency can be maintained even at lower SCWG temperatures. Increasing biomass concentration, the fraction of syngas sent to combustion gradually decreases (50% and 15% wt. split for 10 and 20% wt. biomass concentration, respectively). Thus, the process carbon efficiency and specific yields of FT biofuels increase with biomass concentration. Predicted values are slightly higher than in HSS-1. Carbon efficiencies range within 18.1–30.8% for Miscanthus and 18.0–30.8% for RCG. For Miscanthus, a total of 0.1772 kg/kgb FT liquid biofuels can be produced. For RCG, the respective yield is 0.1679 kg/kgb. For Miscanthus, when the biomass concentration is 20% wt. (best-case scenario), FT Gasoline depicts the highest yield, 0.0623 kg/kgb, with FT Diesel and FT Jet Fuel following with 0.0604 and 0.0545 kg/kgb, respectively.
A sensitivity analysis has also been performed for all implemented scenarios, highlighting the effect of heat-recovery efficiency on the SCWG + DRR heat demand and potentially FT products. Furthermore, process-modelling results have been obtained using the assumption of 90% SCWG carbon efficiency. For slightly different efficiencies (85–95%), there will be a respective decrease/increase in total carbon content in syngas and downstream from the SCWG reactor. By adjusting operational conditions (SCWG temperature) to maintain the H2/CO molar ratio at the inlet of the FT reactor at 2.0–2.1, it is expected that this decrease/increase will be reflected in the FT product yields.
Overall, the implemented process-modelling approach is based on the development of a conceptual model which can be further refined to reflect implementation in a more realistic, scaled-up environment. Specific computational limitations must be considered as already elaborated in the literature [8]: (a) the biomass enthalpy of formation calculation, and (b) the estimation of component properties in supercritical conditions. It should be noted that the equilibrium models used in SCWG and DR reactors are aligned with the concept of the present work. They highlight technology potential and feasibility with respect to providing syngas yield, composition, and upgrade-reforming predictions. Most of the relevant studies also implement thermodynamic models [8]. The use of kinetic models would provide a more detailed, case-specific approach also supporting the identification of process units’ (e.g., reactors, heat exchangers) design requirements. The viability of the process would thus be assessed via a comprehensive techno-economic analysis (TEA). Furthermore, FT wastewater, a major by-product emerging from the FTS reactor, contains small concentrations of light-oxygenated organic compounds. Recent studies have shown that it can be used for H2 production via a mild-temperature catalytic aqueous-phase-reforming (APR) process [56]. This option has not been investigated in this work but can be further pursued in the future. Despite the limitations, the implemented scenarios provide insight into a novel, yet challenging liquid biofuel production chain.
The second objective of this paper is to evaluate the sustainability of the SCWG process chains through the quantification of the important indicator of Global Warming Potential, implementing Life-Cycle Assessment. Focusing on the operating scenarios examined, it is concluded that the thermal self-sufficient cases (HSS-1 and HSS-2) combined with high biomass concentrations had the lowest GWP.
Overall, in terms of environmental performance, three major parameters have been identified as decisive:
  • External heat requirements must be minimal, in order to avoid possible fossil-generated heat inputs. Therefore, it is strongly advised to pursue the integration of the conversion and biofuel-upgrading stages.
  • The utilization of waste or renewable heat would greatly lower expected impacts.
  • Cultivation energy crops in degraded land can provide the potential of “negative carbon” biofuels, provided that sufficient biomass feedstock yields are achieved.
These findings, however, have to be presented alongside the important limitations of the exercise undertaken. Modelling compromises were necessary (such as the combination of calculated results with “hard” data from EU regulations) and the results cannot be considered representative to an upscaled production system.

5. Conclusions

The production of FT liquid biofuels from the SCWG of lignocellulosic biomass is energetically and environmentally assessed by coupling process modelling with LCA. A conceptual process model has been developed, comprising the thermochemical conversion of lignocellulosic biomass in a SCWG reactor, and syngas upgrade through dry reforming and FTS liquid biofuel production, upgrade, and refinement. Diesel-like, gasoline-like, and jet fuel-like yields are predicted for different biomass concentrations and SCWG temperatures. Alternative operating scenarios were assessed with respect to maximizing FT liquid biofuel yields and minimizing heat requirements towards a thermally self-sustained process. The results were used as inputs in the LCIs compiled for the overall process Life-Cycle Assessment. The elaboration of the field-to-biofuel LCIs resulted in detailed impact breakdowns, aiming to acquire a holistic environmental performance profile.
The conversion technology of SCWG, integrated with a suitable biofuel-upgrading process chain, has shown considerable potential in producing sustainable biofuels. The GWP of the biofuels produced is comparable to the best cases available in current liquid biofuels. Furthermore, if the utilized biomass feedstock originates from the cultivation of degraded land, the corresponding RED II carbon bonus can be claimed, leading to “negative carbon” biofuels. Therefore, provided that this biofuel value chain proves economically viable, a significant contribution towards decarbonizing the transport sector (possibly the hardest to abate) is identified.
Nevertheless, the present work contributes to a field with little literature coverage, providing an energetic and environmental reference for an important biomass conversion technology. An additional contribution can be claimed by the introduction of a combined methodology, which approaches both simulation modelling and environmental assessment. The corresponding benefit is demonstrated in the final results, where the effect of the variation in operational parameters in the core process can be evaluated in terms of the overall production chain, integrating the upstream impacts.

Author Contributions

Conceptualization, D.K. and D.G.; methodology, D.K. and D.G.; software, D.K. and D.G.; validation, D.K. and D.G.; formal analysis, D.K. and D.G.; investigation, D.K. and D.G.; resources, D.K. and D.G.; data curation, D.K. and D.G.; writing—original draft preparation, D.K. and D.G.; writing—review and editing, D.K., D.G. and M.F.; visualization, D.K. and D.G.; supervision, D.K., D.G. and M.F.; project administration, D.K., D.G. and M.F.; funding acquisition, D.K., D.G. and M.F. All authors have read and agreed to the published version of the manuscript.

Funding

The present work belongs to the framework of project “CERESiS”, which has received funding from the European Union’s Horizon 2020 research and innovation programme under Grant Agreement No. 101006717.

Data Availability Statement

The original contributions presented in this study are included in the article. Further inquiries can be directed to the corresponding author.

Conflicts of Interest

The authors declare no conflicts of interest. The funders had no role in the design of the study; in the collection, analyses, or interpretation of data; in the writing of the manuscript; or in the decision to publish the results.

Abbreviations

BTLBiomass to LiquidLCILife-Cycle Inventory
DRRDry Reforming ReactorLHVLower Heating Value
FTSFischer–Tropsch SynthesisMSWMunicipal Solid Waste
GWPGlobal Warming PotentialNGNatural Gas
HDRHydrocracking ReactorPSAPressure Swing Adsorption
HHVHigher Heating ValueRCGReed Canary Grass
HSSHeat Self-Sufficient scenarioREDRenewable Energy Directive
ILCDInternational Ref. Life-Cycle Data SystemSCWGSupercritical Water Gasification
i-LUCIndirect Land-Use Change WGSWater–Gas Shift
LCALife-Cycle Assessment

References

  1. “The State of European Transport 2024—An Overview of the EU’s Largest Climate Problem”, A Briefing by Transport & Environment 2024. Available online: https://www.transportenvironment.org/uploads/files/TE_SoT_2024_report-1.pdf (accessed on 29 January 2025).
  2. European Union. Directive (EU) 2018/2001 of the European Parliament and of the Council of 11 December 2018 on the Promotion of the Use of Energy from Renewable Sources. Off. J. Eur. Union 2018, 1–128. Available online: https://eur-lex.europa.eu/eli/dir/2018/2001/oj/eng (accessed on 29 January 2025).
  3. European Union. Directive 2009/28/EC of the European Parliament and of the Council of 23 April 2009 on the Promotion of the Use of Energy from Renewable Sources and Amending and Subsequently Repealing Directives 2001/77/EC and 2003/30/EC 2009. Off. J. Eur. Union 2009, 11, 1–47. Available online: https://eur-lex.europa.eu/LexUriServ/LexUriServ.do?uri=OJ:L:2009:260:0005:0019:EN:PDF (accessed on 29 January 2025).
  4. European Union. Directive (EU) 2023/2413 of the European Parliament and of the Council of 18 October 2023 amending Directive (EU) 2018/1999 and Directive 98/70/EC as Regards the promotion of Energy from Renewable Sources, and Repealing Council Directive (EU) 2015/652. Off. J. Eur. Union 2023, 1–77. Available online: https://eur-lex.europa.eu/eli/dir/2023/2413/oj/eng (accessed on 29 January 2025).
  5. European Union. REPowerEU: A Plan to Rapidly Reduce Dependence on Russian Fossil Fuels and Fast Forward the Green Transition. Press Release 2022. Available online: https://ec.europa.eu/commission/presscorner/api/files/document/print/en/ip_22_3131/IP_22_3131_EN.pdf (accessed on 29 January 2025).
  6. Boukis, N.; Katharina Stoll, I. Gasification of Biomass in Supercritical Water, Challenges for the Process Design—Lessons Learned from the Operation Experience of the First Dedicated Pilot Plant. Processes 2021, 9, 455. [Google Scholar] [CrossRef]
  7. Dutzi, J.; Boukis, N.; Sauer, J. Supercritical Water Gasification of Heavy Metal Contaminated Plants with Focus on Separation of Heavy Metal Contaminants. Biomass Bioenergy 2024, 182, 107059. [Google Scholar] [CrossRef]
  8. Gutiérrez Ortiz, F.J. Biofuel Production from Supercritical Water Gasification of Sustainable Biomass. Energy Convers. Manag. X 2022, 14, 100164. [Google Scholar] [CrossRef]
  9. Louw, J.; Schwarz, C.E.; Knoetze, J.H.; Burger, A.J. Thermodynamic Modelling of Supercritical Water Gasification: Investigating the Effect of Biomass Composition to Aid in the Selection of Appropriate Feedstock Material. Bioresour. Technol. 2014, 174, 11–23. [Google Scholar] [CrossRef]
  10. Wang, C.; Jin, H.; Peng, P.; Chen, J. Thermodynamics and LCA Analysis of Biomass Supercritical Water Gasification System Using External Recycle of Liquid Residual. Renew Energy 2019, 141, 1117–1126. [Google Scholar] [CrossRef]
  11. Dutzi, J.; Boukis, N.; Sauer, J. Investigating Salt Precipitation in Continuous Supercritical Water Gasification of Biomass. Processes 2024, 12, 935. [Google Scholar] [CrossRef]
  12. Wang, S.; Xu, D.; Guo, Y. Supercritical Water Processing Technologies for Environment, Energy and Nanomaterial Applications, 1st ed.; Springer: Berlin/Heidelberg, Germany, 2020. [Google Scholar]
  13. Kladisios, P.; Stegov Sagia, A. A Review on Supercritical Water Gasification of Biomass. Bioenergy Bioresour. 2022, 3, 7–10. [Google Scholar] [CrossRef]
  14. Gasafi, E.; Reinecke, M.Y.; Kruse, A.; Schebek, L. Economic Analysis of Sewage Sludge Gasification in Supercritical Water for Hydrogen Production. Biomass Bioenergy 2008, 32, 1085–1096. [Google Scholar] [CrossRef]
  15. Mi, Z.; Wang, S.; Huang, X.; Yang, C.; Zhang, F.; Li, Y. Review of the Supercritical Water Gasification System: Components, Challenges and Sustainability. Energy Convers. Manag. 2025, 323, 119169. [Google Scholar] [CrossRef]
  16. Antal, M.J.; Allen, S.G.; Schulman, D.; Xu, X.; Divilio, R.J. Biomass Gasification in Supercritical Water. Ind. Eng. Chem. Res. 2000, 39, 4040–4053. [Google Scholar] [CrossRef]
  17. Pinkard, B.R.; Gorman, D.J.; Tiwari, K.; Rasmussen, E.G.; Kramlich, J.C.; Reinhall, G.; Novosselov, I. V Supercritical Water Gasification: Practical Design Strategies and Operational Challenges for Lab-Scale, Continuous Flow Reactors. Heliyon 2019, 5, 1269. [Google Scholar] [CrossRef] [PubMed]
  18. Reddy, S.N.; Nanda, S.; Dalai, A.K.; Kozinski, J.A. Supercritical Water Gasification of Biomass for Hydrogen Production. Int. J. Hydrogen Energy 2014, 39, 6912–6926. [Google Scholar] [CrossRef]
  19. Hu, J.; Yu, F.; Lu, Y. Application of Fischer-Tropsch Synthesis in Biomass to Liquid Conversion. Catalysts 2012, 2, 303–326. [Google Scholar] [CrossRef]
  20. dos Santos, R.G.; Alencar, A.C. Biomass-Derived Syngas Production via Gasification Process and Its Catalytic Conversion into Fuels by Fischer Tropsch Synthesis: A Review. Int. J. Hydrogen Energy 2020, 45, 18114–18132. [Google Scholar] [CrossRef]
  21. Swanson, R.M.; Platon, A.; Satrio, J.A.; Brown, R.C. Techno-Economic Analysis of Biomass-to-Liquids Production Based on Gasification. Fuel 2010, 89, S11–S19. [Google Scholar] [CrossRef]
  22. Bressanin, J.M.; Klein, B.C.; Chagas, M.F.; Watanabe, M.D.B.; de Mesquita Sampaio, I.L.; Bonomi, A.; de Morais, E.R.; Cavalett, O. Techno-Economic and Environmental Assessment of Biomass Gasification and Fischer-Tropsch Synthesis Integrated to Sugarcane Biorefineries. Energies 2020, 13, 4576. [Google Scholar] [CrossRef]
  23. Snehesh, A.S.; Mukunda, H.S.; Mahapatra, S.; Dasappa, S. Fischer-Tropsch Route for the Conversion of Biomass to Liquid Fuels—Technical and Economic Analysis. Energy 2017, 130, 182–191. [Google Scholar] [CrossRef]
  24. Ostadi, M.; Rytter, E.; Hillestad, M. Boosting Carbon Efficiency of the Biomass to Liquid Process with Hydrogen from Power: The Effect of H2/CO Ratio to the Fischer-Tropsch Reactors on the Production and Power Consumption. Biomass Bioenergy 2019, 127, 105282. [Google Scholar] [CrossRef]
  25. Dossow, M.; Dieterich, V.; Hanel, A.; Spliethoff, H.; Fendt, S. Improving Carbon Efficiency for an Advanced Biomass-to-Liquid Process Using Hydrogen and Oxygen from Electrolysis. Renew. Sustain. Energy Rev. 2021, 152, 111670. [Google Scholar] [CrossRef]
  26. Gruber, H.; Groß, P.; Rauch, R.; Reichhold, A.; Zweiler, R.; Aichernig, C.; Müller, S.; Ataimisch, N.; Hofbauer, H. Fischer-Tropsch Products from Biomass-Derived Syngas and Renewable Hydrogen. Biomass Convers. Biorefinery 2021, 11, 2281–2292. [Google Scholar] [CrossRef]
  27. Rahbari, A.; Shirazi, A.; Venkataraman, M.B.; Pye, J. A Solar Fuel Plant via Supercritical Water Gasification Integrated with Fischer–Tropsch Synthesis: Steady-State Modelling and Techno-Economic Assessment. Energy Convers Manag. 2019, 184, 636–648. [Google Scholar] [CrossRef]
  28. Campanario, F.J.; Gutiérrez Ortiz, F.J. Fischer-Tropsch Biofuels Production from Syngas Obtained by Supercritical Water Reforming of the Bio-Oil Aqueous Phase. Energy Convers Manag. 2017, 150, 599–613. [Google Scholar] [CrossRef]
  29. Gutiérrez Ortiz, F.J. Techno-Economic Assessment of Supercritical Processes for Biofuel Production. J. Supercrit. Fluids 2020, 160, 104788. [Google Scholar] [CrossRef]
  30. Gutiérrez Ortiz, F.J.; Kruse, A.; Ramos, F.; Ollero, P. Integral Energy Valorization of Municipal Solid Waste Reject Fraction to Biofuels. Energy Convers Manag. 2019, 180, 1167–1184. [Google Scholar] [CrossRef]
  31. Voultsos, I.; Katsourinis, D.; Giannopoulos, D.; Founti, M. Integrating LCA with Process Modeling for the Energetic and Environmental Assessment of a CHP Biomass Gasification Plant: A Case Study in Thessaly, Greece. Eng.—Adv. Eng. 2020, 1, 2–30. [Google Scholar] [CrossRef]
  32. Alifieris, O.; Katsourinis, D.; Giannopoulos, D.; Founti, M. Process Simulation and Life Cycle Assessment of Ceramic Pigment Production: A Case Study of Green Cr2o3. Processes 2021, 9, 1731. [Google Scholar] [CrossRef]
  33. Tasiopoulou, T.; Katsourinis, D.; Giannopoulos, D.; Founti, M. Production-Process Simulation and Life-Cycle Assessment of Metakaolin as Supplementary Cementitious Material. Eng 2023, 4, 761–779. [Google Scholar] [CrossRef]
  34. Nsanganwimana, F.; Pourrut, B.; Mench, M.; Douay, F. Suitability of Miscanthus Species for Managing Inorganic and Organic Contaminated Land and Restoring Ecosystem Services. A Review. J. Environ. Manag. 2014, 143, 123–134. [Google Scholar] [CrossRef]
  35. Lord, R.A. Reed Canarygrass (Phalaris Arundinacea) Outperforms Miscanthus or Willow on Marginal Soils, Brownfield and Non-Agricultural Sites for Local, Sustainable Energy Crop Production. Biomass Bioenergy 2015, 78, 110–125. [Google Scholar] [CrossRef]
  36. Roni, M.S.; Cafferty, K.G.; Hess, J.R.; Jacobson, J.J.; Kenney, K.L.; Searcy, E.; Tumuluru, J.S. Biomass Supply Chains for Bioenergy & Biorefining. In Chapter 11: Miscanthus, Switchgrass, Reed Canary Grass, Rye, Giant Reed Etc.; Holm-Nielsen, J.B., Ehimen, E.A., Eds.; Woodhead Publishing: Sawston, UK, 2016; pp. 271–291. [Google Scholar] [CrossRef]
  37. Elsayed, S. Gasification of Algal Biomass in Supercritical Water with the Potential of Energy and Nutrients Recovery. Ph.D. Thesis, Karlsruhe Institute of Technology (KIT), Karlsruhe, Germany, 2019. [Google Scholar]
  38. Suárez París, R.; L’Abbate, M.E.; Liotta, L.F.; Montes, V.; Barrientos, J.; Regali, F.; Aho, A.; Boutonnet, M.; Järås, S. Hydroconversion of Paraffinic Wax over Platinum and Palladium Catalysts Supported on Silica–Alumina. Catal Today 2016, 275, 141–148. [Google Scholar] [CrossRef]
  39. ISO 14044:2006+A1+A2:2020; Environmental Management—Life Cycle Assessment—Requirements and Guidelines. CEN—European Committee for Standardization: Brussels, Belgium, 2020.
  40. ISO 14040:2006+A1:2020; Environmental Management—Life Cycle Assessment—Principles and Framework. CEN—European Committee for Standardization: Brussels, Belgium, 2020.
  41. EC-JRC. International Reference Life Cycle Data System (ILCD) Handbook—General Guide for Life Cycle Assessment—Detailed Guidance, 1st ed.; Publications Office of the European Union: Luxembourg, 2010. [Google Scholar] [CrossRef]
  42. Muench, S.; Guenther, E. A Systematic Review of Bioenergy Life Cycle Assessments. Appl. Energy 2013, 112, 257–273. [Google Scholar] [CrossRef]
  43. Zuwała, J. Life Cycle Approach for Energy and Environmental Analysis of Biomass and Coal Co-Firing in CHP Plant with Backpressure Turbine. J Clean Prod. 2012, 35, 164–175. [Google Scholar] [CrossRef]
  44. Peters, J.F.; Iribarren, D.; Dufour, J. Simulation and Life Cycle Assessment of Biofuel Production via Fast Pyrolysis and Hydroupgrading. Fuel 2015, 139, 441–456. [Google Scholar] [CrossRef]
  45. Brander, M.; Tipper, R.; Hutchison, C.; Davis, G. Consequential and Attributional Approaches to LCA: A Guide to Policy Makers with Specific Reference to Greenhouse Gas LCA of Biofuels; Technical Paper TP-090403-A; Ecometrica Press: Edinburgh, UK, 2009. [Google Scholar]
  46. Hölscher, T.; Deinmling, S.; Freiermuth Knuchel, R.; Gaillard, G.; Kägi, T.; Müller-Sämann, K. Energieoptionen Aus Landwirtschaftlicher Biomasse Am Oberrhein—Auswirkungen Für Landwirtschaft Und Umwelt—Endbericht Zum Projekt; Agentur Für Nachhaltige Nutzung von Agrarlandschaften (ANNA): Müllheim, Germany, 2007. [Google Scholar]
  47. KTBL Energiepflanzen. Daten Für Die Planung Des Energiepflanzenanbaus; Kuratorium Für Technik Und Bauwesen in Der Landwirtschaft: Darmstadt, Germany, 2006; p. 372. [Google Scholar]
  48. Keller, M.; Wuthrich, P.; Notter, B. Handbook of Emission Factors for Road Transport v3.1; HBEFA, INFRAS: Berne, Switzerland, 2017. [Google Scholar]
  49. Phyllis2—Database for the Physico-Chemical Composition of (Treated) Lignocellulosic Biomass, Micro- and Macroalgae, Various Feedstocks for Biogas Production and Biochar. Available online: https://phyllis.nl/ (accessed on 29 January 2025).
  50. Gutiérrez Ortiz, F.J.; Alonso-Fariñas, B.; Campanario, F.J.; Kruse, A. Life Cycle Assessment of the Fischer-Tropsch Biofuels Production by Supercritical Water Reforming of the Bio-Oil Aqueous Phase. Energy 2020, 210, 118648. [Google Scholar] [CrossRef]
  51. Allam, R.; Martin, S.; Forrest, B.; Fetvedt, J.; Lu, X.; Freed, D.; Brown, G.W.; Sasaki, T.; Itoh, M.; Manning, J. Demonstration of the Allam Cycle: An Update on the Development Status of a High Efficiency Supercritical Carbon Dioxide Power Process Employing Full Carbon Capture. In Proceedings of the Energy Procedia; Elsevier Ltd.: Amsterdam, The Netherlands, 2017; Volume 114, pp. 5948–5966. [Google Scholar]
  52. Rogalev, N.; Rogalev, A.; Kindra, V.; Zlyvko, O.; Bryzgunov, P. Review of Closed SCO2 and Semi-Closed Oxy–Fuel Combustion Power Cycles for Multi-Scale Power Generation in Terms of Energy, Ecology and Economic Efficiency. Energies 2022, 15, 9226. [Google Scholar] [CrossRef]
  53. Kaminski, K.; Znaczko, P.; Kardas-Cinal, E.; Chamier-Gliszczynski, N.; Koscielny, K.; Cur, K. Comparison of the Heat Transfer Efficiency of Selected Counterflow Air-to-Air Heat Exchangers Under Unbalanced Flow Conditions. Energies 2025, 18, 117. [Google Scholar] [CrossRef]
  54. Campanario, F.J.; Gutiérrez Ortiz, F.J. Techno-Economic Assessment of Bio-Oil Aqueous Phase-to-Liquids via Fischer-Tropsch Synthesis and Based on Supercritical Water Reforming. Energy Convers. Manag. 2017, 154, 591–602. [Google Scholar] [CrossRef]
  55. IRENA Report. Renewable Energy Prospects for the European Union. ISBN 978-92-9260-007-5. 2018. Available online: https://www.irena.org/publications/2018/Feb/Renewable-energy-prospects-for-the-EU (accessed on 30 January 2025).
  56. Zoppi, G.; Pipitone, G.; Gruber, H.; Weber, G.; Reichhold, A.; Pirone, R.; Bensaid, S. Aqueous Phase Reforming of Pilot-Scale Fischer-Tropsch Water Effluent for Sustainable Hydrogen Production. Catal. Today 2021, 367, 239–247. [Google Scholar] [CrossRef]
Figure 1. Flow diagram of FT biofuel production process’s model section (incl. SCWG, DRR, FTS).
Processes 13 00895 g001
Figure 2. A flow diagram of the process model’s FT products’ upgrade and refinement section.
Processes 13 00895 g002
Figure 3. LCA framework.
Processes 13 00895 g003
Figure 4. System boundaries.
Processes 13 00895 g004
Figure 5. LCI of agricultural stage.
Processes 13 00895 g005
Figure 6. LCI of transportation of biomass feedstock.
Processes 13 00895 g006
Figure 7. Effect of SCWG temperature (625–800 °C) on syngas composition (biomass concentration: 20% wt.).
Processes 13 00895 g007
Figure 8. Effect of biomass concentration (10–20% wt.) on syngas composition. (SCWG Temperature: 700 °C).
Processes 13 00895 g008
Figure 9. Effect of SCWG temperature (625–800 °C) and biomass concentration (10–20% wt.) on H2/CO molar radio at the FTS reactor inlet. (DRR temperature: 900 °C).
Processes 13 00895 g009
Figure 10. Effect of biomass concentration (10–20% wt.) on FT fuel yields. Max-yield operating scenario (biomass: Miscanthus).
Processes 13 00895 g010
Figure 11. Total FT fuel yields for Miscanthus and RCG. Max-yield operating scenario (biomass concentration: 20% wt./DRR temperature = 900 °C).
Processes 13 00895 g011
Figure 12. Effect of biomass (dry matter) concentration (10–20% wt.) on SCWG + DRR heat demand for Miscanthus and RCG biomasses. Max-yield operating scenario (DRR temperature = 900 °C).
Processes 13 00895 g012
Figure 13. Effect of biomass concentration (10–20% wt.) on FT fuel yields. HSS-1 (biomass: Miscanthus/DRR temperature = 900 °C).
Processes 13 00895 g013
Figure 14. Total FT fuel yields for Miscanthus and RCG. HSS-1 (biomass concentration: 20% wt./DRR temperature = 900 °C).
Processes 13 00895 g014
Figure 15. Effect of biomass concentration (15–20% wt.) on FT fuel yields. Self-sufficient scenario 2 (biomass: Miscanthus/DRR temperature = 650 °C).
Processes 13 00895 g015
Figure 16. Total FT fuel yields for Miscanthus and RCG. HSS-1 (biomass concentration: 20% wt./DRR temperature = 650 °C).
Processes 13 00895 g016
Figure 17. LCI of the conversion and upgrading stage. The SCWG pathway with the maximum external process-heat requirement. * The variation regarding feedstock mass, electricity, and process heat refers to the various cases of biomass concentration examined in Section 3.1 (10%, 15% and 20%).
Processes 13 00895 g017
Figure 18. LCI of the conversion and upgrading stage. SCWG pathway with minimum (zero) external process-heat requirement. * The variation regarding feedstock mass, electricity, and process heat refers to the various cases of biomass concentration between scenarios HSS-1 and HSS-2, examined in Section 3.1 (10%, 15% and 20%).
Processes 13 00895 g018
Figure 19. GWP results for scenario “Max–yield”.
Processes 13 00895 g019
Figure 20. GWP results for HSS-1.
Processes 13 00895 g020
Figure 21. GWP results for HSS-2.
Processes 13 00895 g021
Table 1. Miscanthus and RCG proximate and ultimate analysis (% wt. dry basis) [49].
AnalysisMiscanthusRCG
Volatile Matter86.5074
Fixed Carbon10.0920.4
Ash3.415.6
C48.6046.00
H6.005.50
O41.0741.84
N0.520.88
S0.200.09
HHV [MJ/kg] (exp)19.1218.80
HHV [MJ/kg] (Milne)19.4817.76
Phyllis2 ID 17432124
Table 2. SCWG Reactor Temperature and H2/CO mol fraction at the FTS reactor inlet (max. yield scenario).
Biomass TypeBiomass Concentration
(% wt.)
SCWG Temperature
(°C)
H2/CO
(mol/mol)
Carbon Efficiency
(%)
Miscanthus106402.0848.7
157002.0449.4
207602.0549.3
RCG106302.0847.4
156902.0647.8
207502.0847.4
Table 3. Sensitivity analysis assessing the impact’s heat-recovery efficiency on SCWG + DRR heat demand. Max-yield operating scenario (biomass: Miscanthus/biomass concentration: 20% wt./DRR temperature = 900 °C).
SCWG + DRR
Heat Recovery (%)
Heat Demand
(kWh/kgb)
652.28
751.78
851.28
Table 4. Syngas split (for combustion) for different biomass concentrations (HSS-1/DRR temperature = 900 °C).
Biomass TypeBiomass Concentration
(% wt.)
Syngas Combustion
(%)
Carbon Efficiency
(%)
Miscanthus106517.0
155024.7
204029.6
RCG106516.6
155023.9
204028.5
Table 5. Sensitivity analysis assessing the impact of heat-recovery efficiency on syngas split and FT products’ split. HSS-1 (biomass: Miscanthus/biomass concentration: 20% wt./DRR temperature = 900 °C).
SCWG + DRR
Heat Recovery (%)
Syngas Combustion
(%)
FT Diesel
(kg/kgb)
FT Gasoline (kg/kgb)FT Jet Fuel
(kg/kgb)
65500.04840.04990.0437
75400.05800.05980.0524
85300.06770.06980.0611
Table 6. Operating conditions and syngas split (for combustion) for different biomass concentrations (HSS-2/DRR temperature = 650 °C).
Biomass TypeBiomass
Concentration (% wt.)
SCWG
Temperature (°C)
H2/CO
(mol/mol)
Syngas
Combustion (%)
Carbon
Efficiency (%)
Miscanthus105952.065018.1
156502.063025.4
207002.061530.8
RCG105902.075018.0
156402.032527.3
206902.041530.8
Table 7. Sensitivity analysis assessing the impact of heat recovery efficiency on syngas split and FT products’ split. HSS-2 (biomass: Miscanthus/biomass concentration: 20% wt./DRR temperature = 650 °C).
SCWG + DRR
Heat Recovery (%)
Syngas Combustion
(%)
FT Diesel (kg/kgb)FT Gasoline (kg/kgb)FT Jet Fuel
(kg/kgb)
65300.04970.05130.0449
75150.06040.06230.0545
8500.07100.07330.0641
Table 8. GWP values for reference cases. (directly acquired from [2]).
DescriptionCultivation,
Transportation, and
Biofuel Production
(g CO2-eq/MJbiofuel)
Direct and Indirect Land-Use Change Impact
(g CO2-eq/MJbiofuel)
Total (Range)
(g CO2-eq/MJbiofuel)
Reference biofuelsBiodiesel
(B-D)
Lowest: 11.2
(Waste cooking oil–animal fat)
Highest: 63.5 (Palm oil)
Lowest: 0
(Waste cooking oil–animal fat)
Highest: 55 (Oil crops)
11.2–118.5
Bioethanol
(B-Eth)
Lowest: 13.5
(Wheat straw)
Highest: 56.3 (Corn)
Lowest: 0
Highest: 12
(Cereals and starch-rich crops)
13.5–68.3
Disclaimer/Publisher’s Note: The statements, opinions and data contained in all publications are solely those of the individual author(s) and contributor(s) and not of MDPI and/or the editor(s). MDPI and/or the editor(s) disclaim responsibility for any injury to people or property resulting from any ideas, methods, instructions or products referred to in the content.

