

Optimization Design of Protective Helmet Structure Guided by Machine Learning

 ,
,
Abstract
1. Introduction
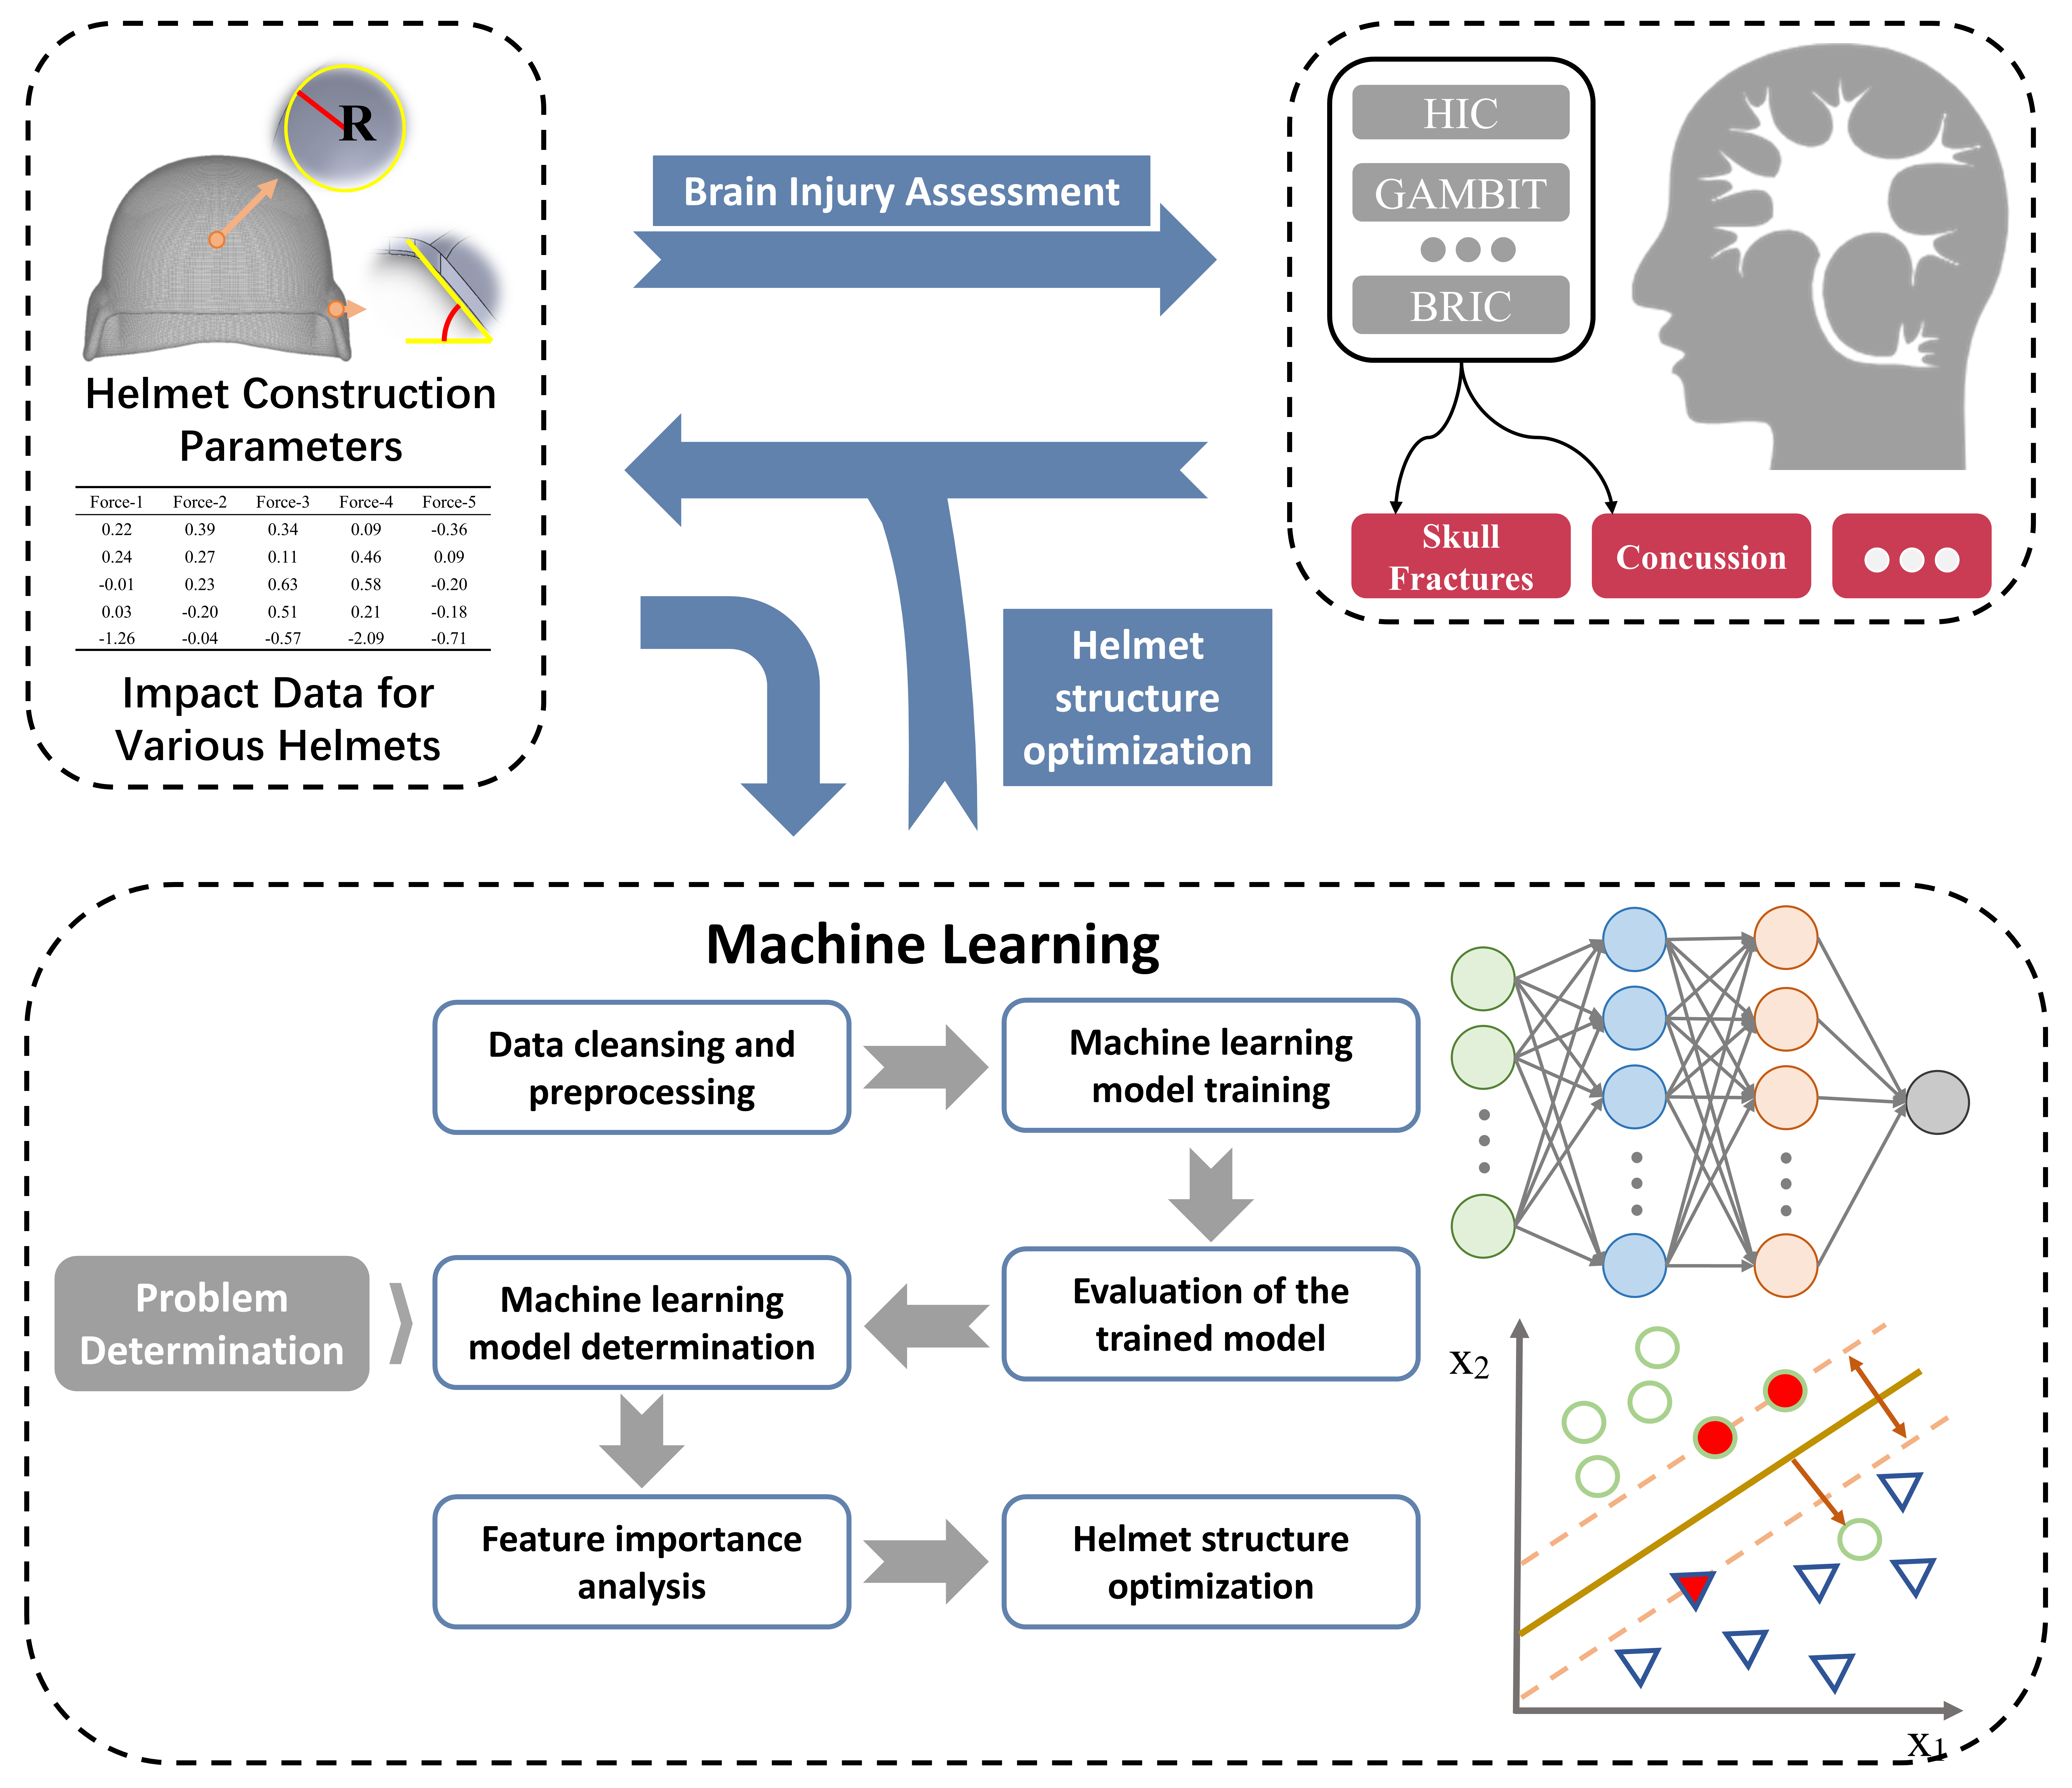
2. Research Methods
2.1. Experimental Design and Data Acquisition
2.2. Machine Learning Framework
2.3. Brain Injury Assessment Methods
3. Results and Discussion
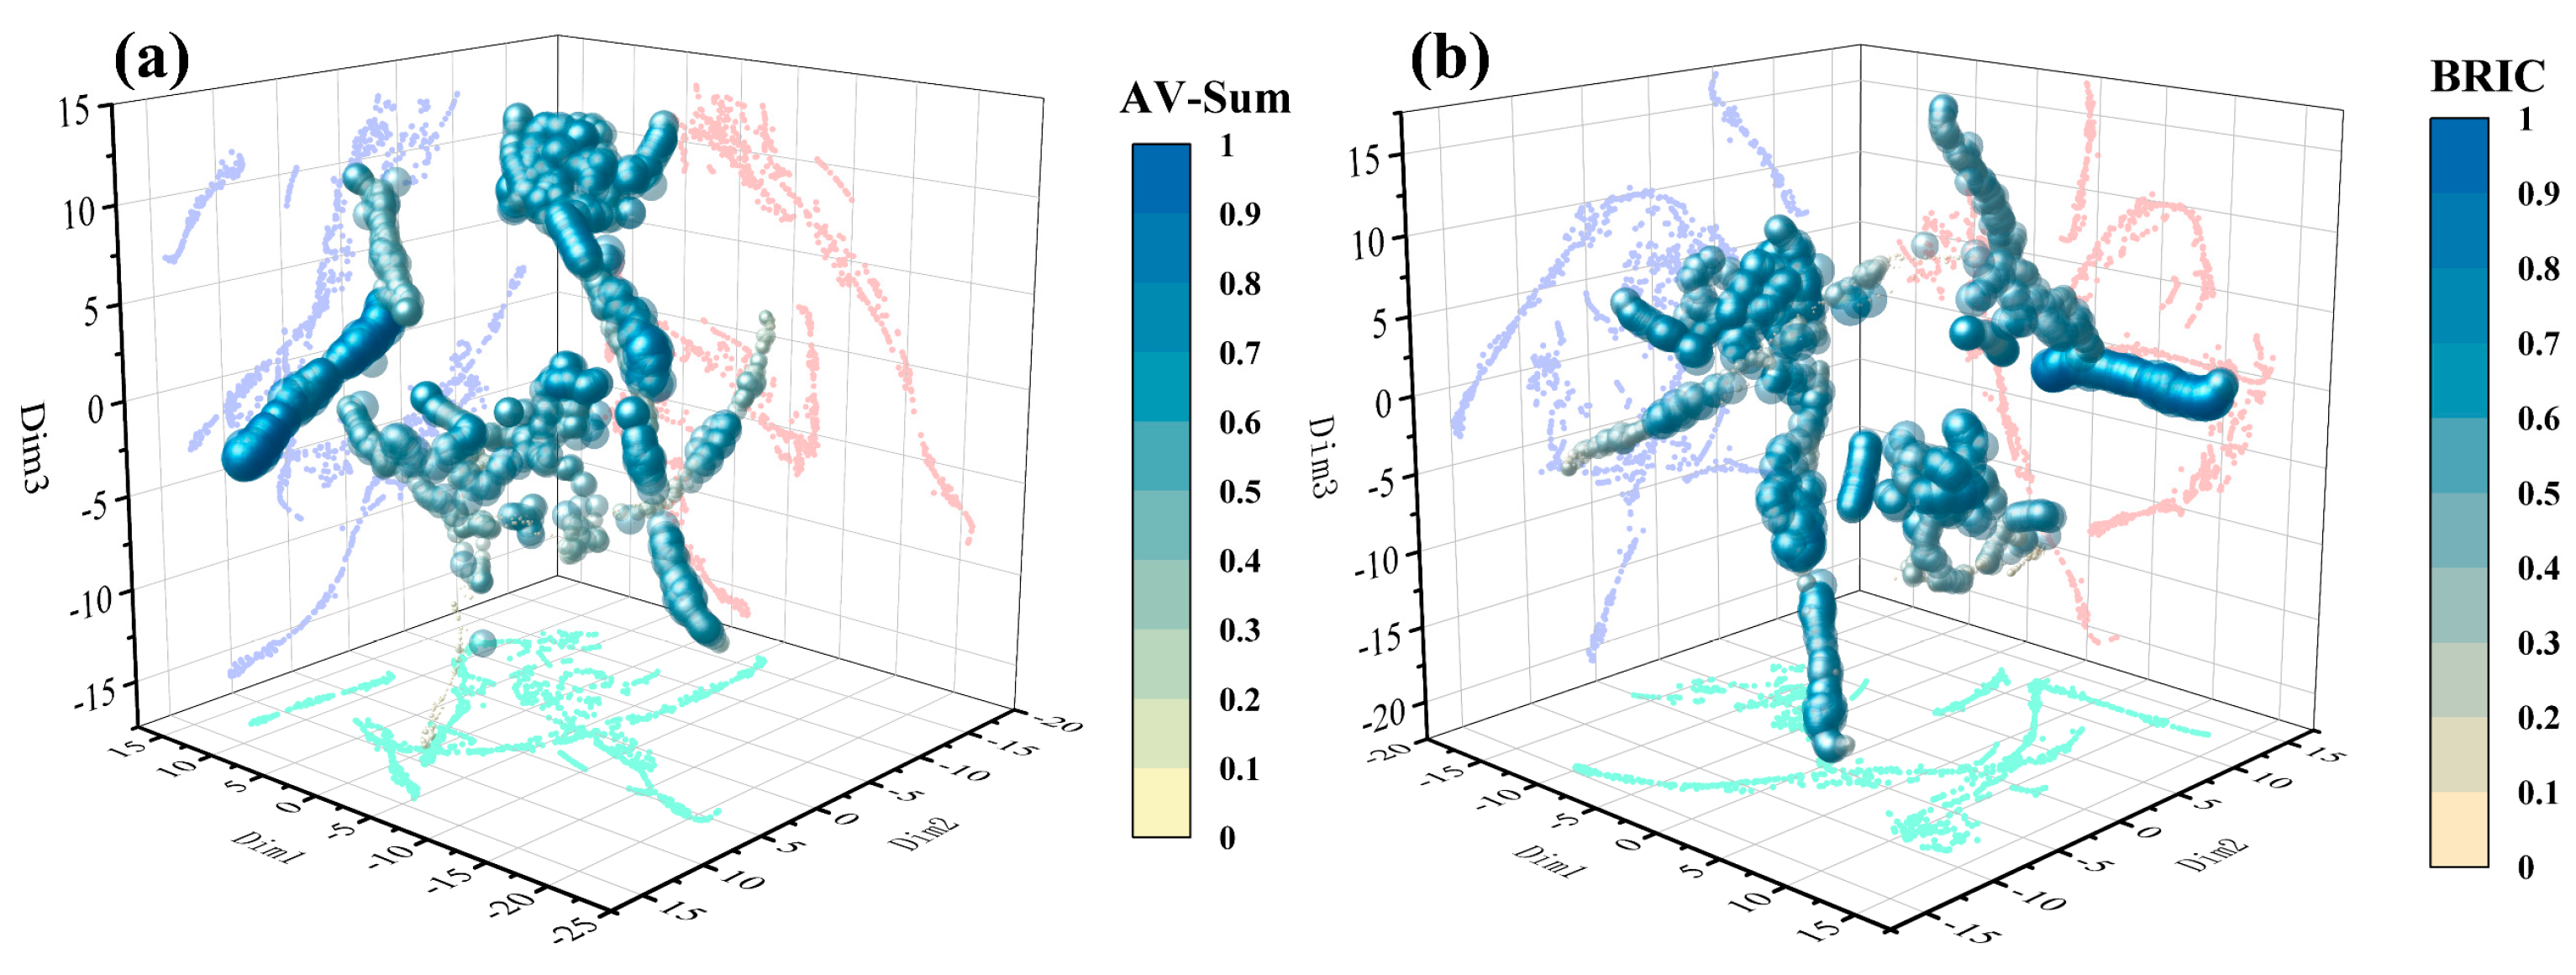
3.1. Data Preprocessing
3.2. Construction of Angular Velocity Prediction Model
3.2.1. Construction of Prediction Model
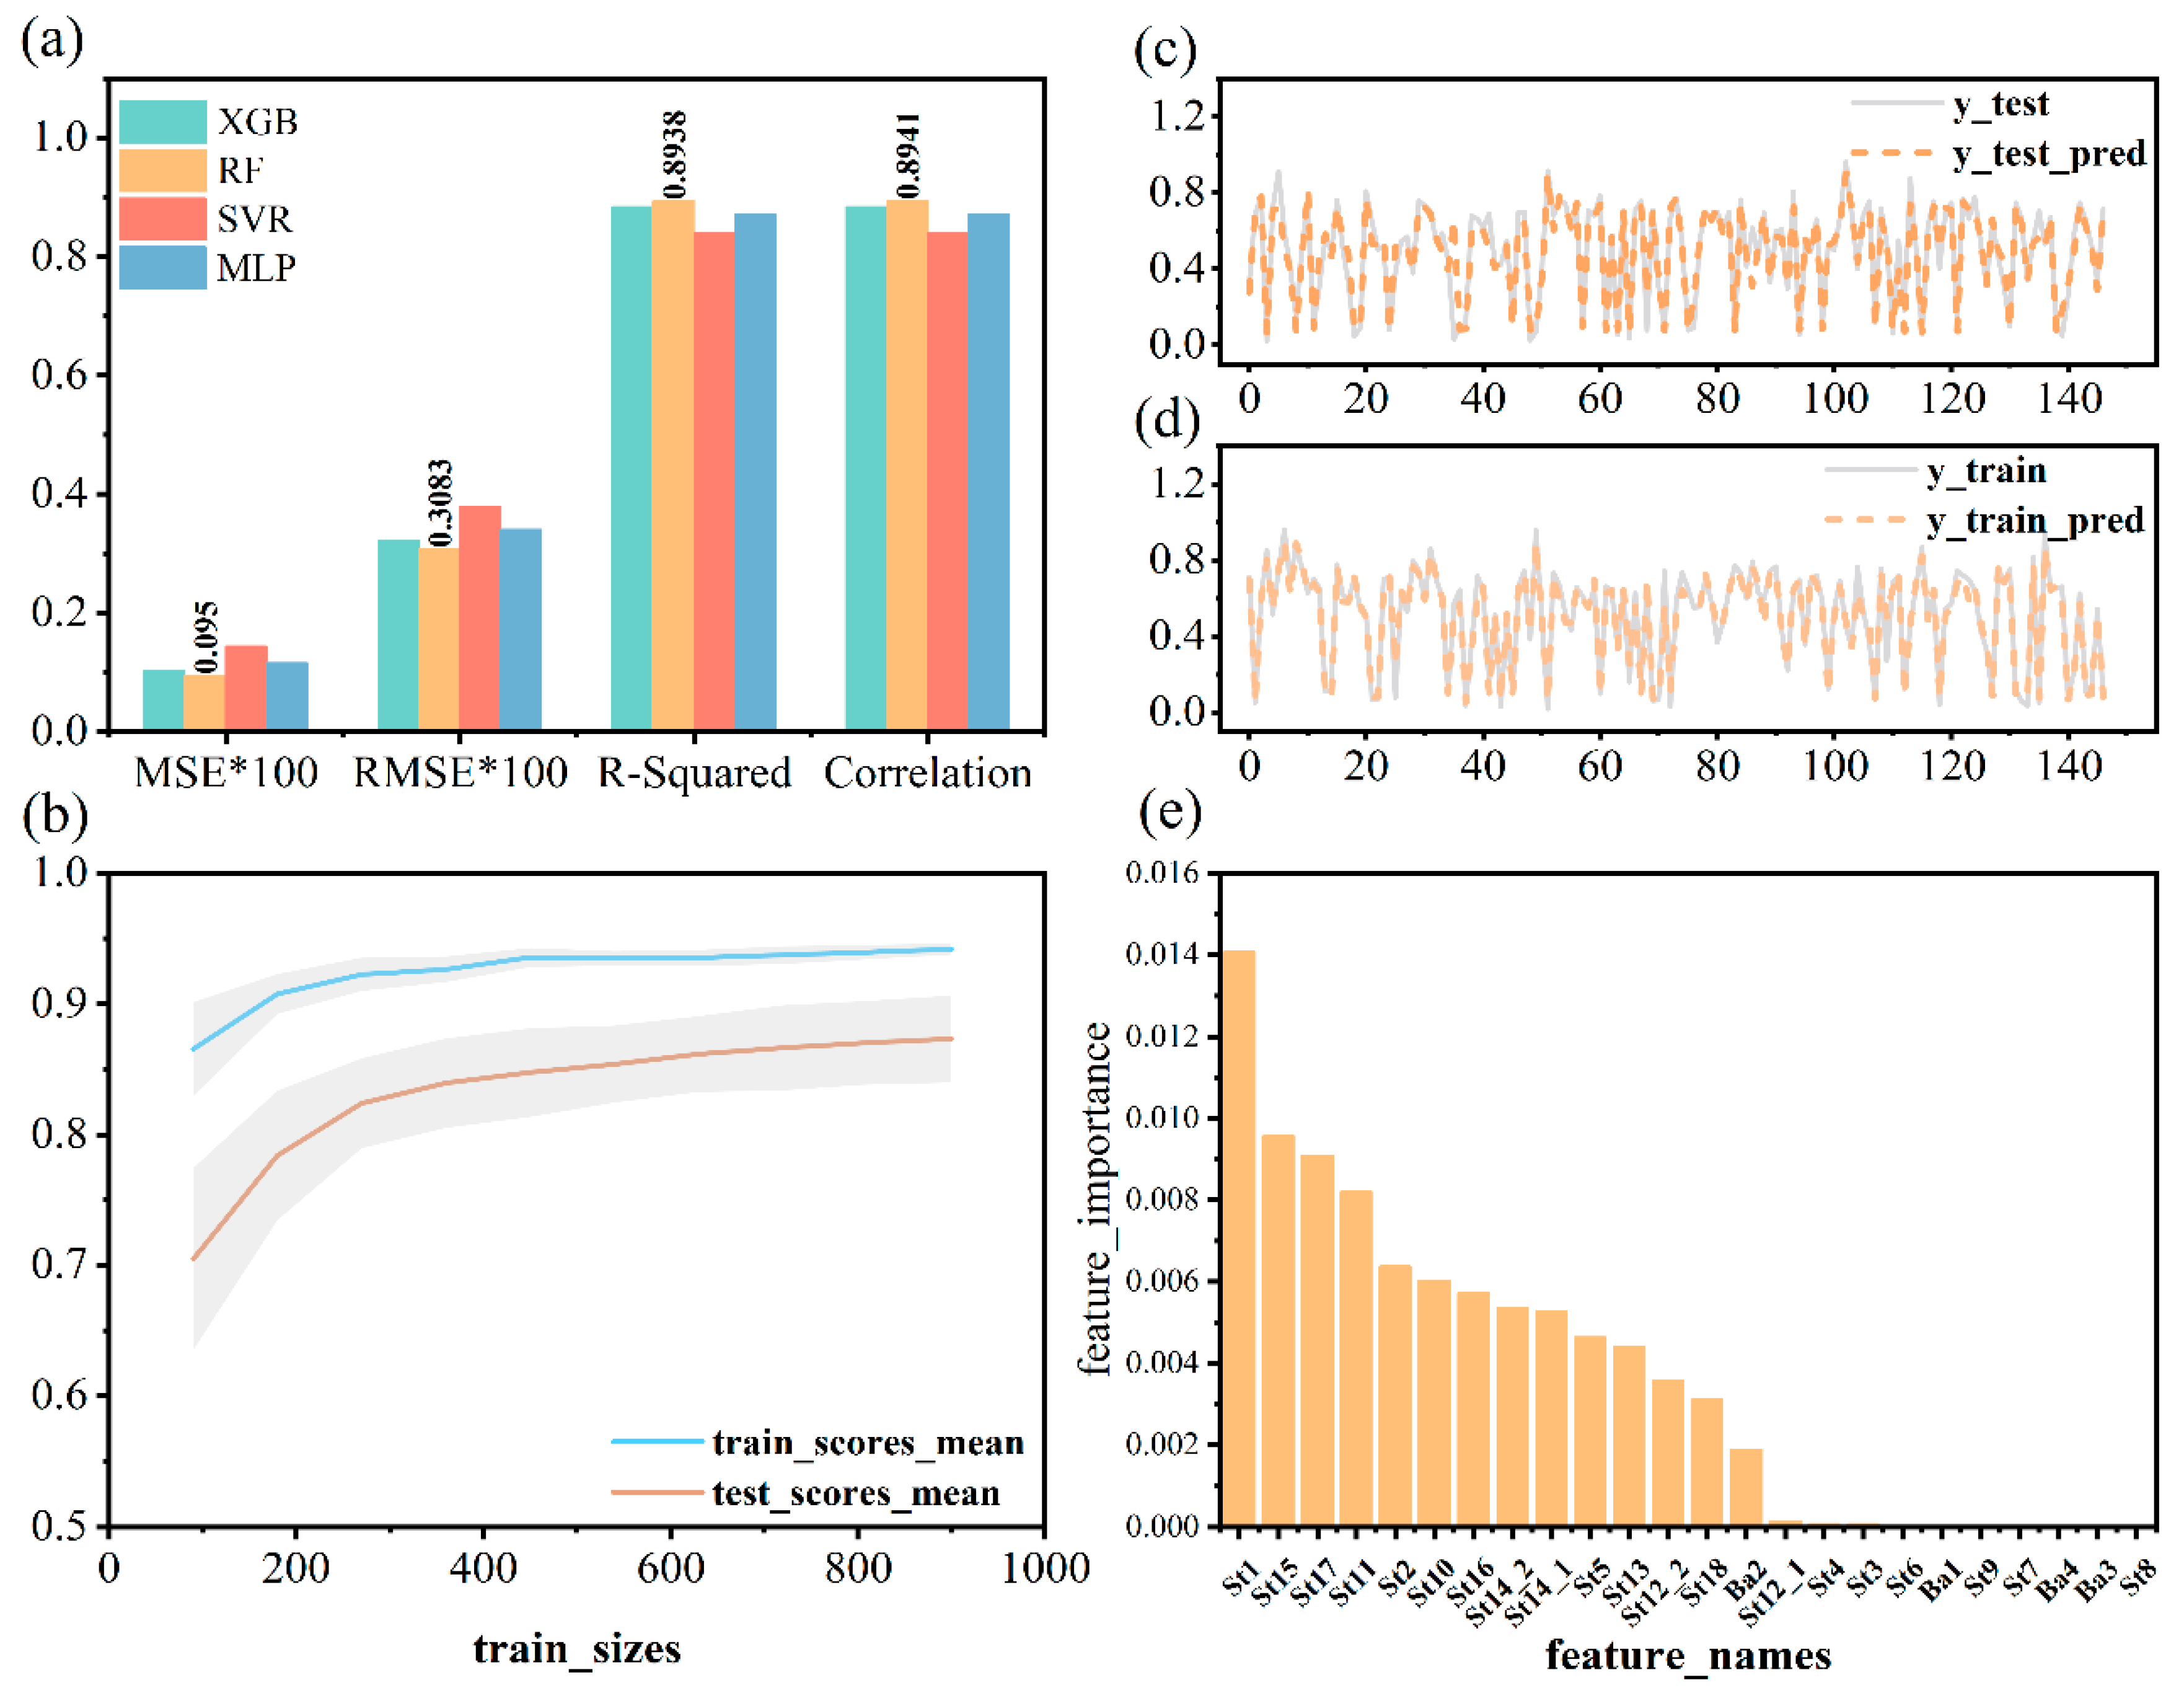
3.2.2. Model Evaluation and Analysis
3.3. Brain Injury Prediction Model Based on BrIC
Result Analysis
3.4. Discussion
4. Conclusions
Supplementary Materials
Author Contributions
Funding
Data Availability Statement
Conflicts of Interest
References
- Cascarano, A.; Mur-Petit, J.; Hernández-González, J.; Camacho, M.; de Toro Eadie, N.; Gkontra, P.; Chadeau-Hyam, M.; Vitrià, J.; Lekadir, K. Machine and Deep Learning for Longitudinal Biomedical Data: A Review of Methods and Applications. Artif. Intell. Rev. 2023, 56, 1711–1771. [Google Scholar] [CrossRef]
- Li, F.; Yigitcanlar, T.; Nepal, M.; Nguyen, K.; Dur, F. Machine Learning and Remote Sensing Integration for Leveraging Urban Sustainability: A Review and Framework. Sustain. Cities Soc. 2023, 96, 104653. [Google Scholar] [CrossRef]
- Osman, A.I.; Zhang, Y.; Lai, Z.Y.; Rashwan, A.K.; Farghali, M.; Ahmed, A.A.; Liu, Y.; Fang, B.; Chen, Z.; Al-Fatesh, A.; et al. Machine Learning and Computational Chemistry to Improve Biochar Fertilizers: A Review. Environ. Chem. Lett. 2023, 21, 3159–3244. [Google Scholar] [CrossRef]
- Pichler, M.; Hartig, F. Machine Learning and Deep Learning—A Review for Ecologists. Methods Ecol. Evol. 2023, 14, 994–1016. [Google Scholar] [CrossRef]
- Zhang, L.; Wen, J.; Li, Y.; Chen, J.; Ye, Y.; Fu, Y.; Livingood, W. A Review of Machine Learning in Building Load Prediction. Appl. Energy 2021, 285, 116452. [Google Scholar] [CrossRef]
- Flach, P.A. On the State of the Art in Machine Learning: A Personal Review. Artif. Intell. 2001, 131, 199–222. [Google Scholar] [CrossRef]
- Dong, X.; Thanou, D.; Toni, L.; Bronstein, M.; Frossard, P. Graph Signal Processing for Machine Learning: A Review and New Perspectives. IEEE Signal Process. Mag. 2020, 37, 117–127. [Google Scholar] [CrossRef]
- Koushik, A.N.P.; Manoj, M.; Nezamuddin, N. Machine Learning Applications in Activity-Travel Behaviour Research: A Review. Transp. Rev. 2020, 40, 288–311. [Google Scholar] [CrossRef]
- Reel, P.S.; Reel, S.; Pearson, E.; Trucco, E.; Jefferson, E. Using Machine Learning Approaches for Multi-Omics Data Analysis: A Review. Biotechnol. Adv. 2021, 49, 107739. [Google Scholar] [CrossRef]
- Gao, P.; Zhang, H.; Yu, J.; Lin, J.; Wang, X.; Yang, M.; Kong, F. Secure Cloud-Aided Object Recognition on Hyperspectral Remote Sensing Images. IEEE Internet Things J. 2021, 8, 3287–3299. [Google Scholar] [CrossRef]
- Li, B.; Xiong, W.; Wu, O.; Hu, W.; Maybank, S.; Yan, S. Horror Image Recognition Based on Context-Aware Multi-Instance Learning. IEEE Trans. Image Process. 2015, 24, 5193–5205. [Google Scholar] [CrossRef] [PubMed]
- Adlung, L.; Cohen, Y.; Mor, U.; Elinav, E. Machine Learning in Clinical Decision Making. Med 2021, 2, 642–665. [Google Scholar] [CrossRef] [PubMed]
- Myszczynska, M.A.; Ojamies, P.N.; Lacoste, A.M.B.; Neil, D.; Saffari, A.; Mead, R.; Hautbergue, G.M.; Holbrook, J.D.; Ferraiuolo, L. Applications of Machine Learning to Diagnosis and Treatment of Neurodegenerative Diseases. Nat. Rev. Neurol. 2020, 16, 440–456. [Google Scholar] [CrossRef] [PubMed]
- Jung, Y.H.; Hong, S.K.; Wang, H.S.; Han, J.H.; Pham, T.X.; Park, H.; Kim, J.; Kang, S.; Yoo, C.D.; Lee, K.J. Flexible Piezoelectric Acoustic Sensors and Machine Learning for Speech Processing. Adv. Mater. 2020, 32, 1904020. [Google Scholar] [CrossRef]
- Liu, D.; Dai, W.; Zhang, H.; Jin, X.; Cao, J.; Kong, W. Brain-Machine Coupled Learning Method for Facial Emotion Recognition. IEEE Trans. Pattern Anal. Mach. Intell. 2023, 45, 10703–10717. [Google Scholar] [CrossRef] [PubMed]
- Machado, G.R.; Silva, E.; Goldschmidt, R.R. Adversarial Machine Learning in Image Classification: A Survey Toward the Defender’s Perspective. ACM Comput. Surv. 2021, 55, 1–38. [Google Scholar] [CrossRef]
- Piris, Y.; Gay, A.-C. Customer Satisfaction and Natural Language Processing. J. Bus. Res. 2021, 124, 264–271. [Google Scholar] [CrossRef]
- Zhao, L.; Alhoshan, W.; Ferrari, A.; Letsholo, K.J.; Ajagbe, M.A.; Chioasca, E.-V.; Batista-Navarro, R.T. Natural Language Processing for Requirements Engineering: A Systematic Mapping Study. ACM Comput. Surv. 2021, 54, 1–41. [Google Scholar] [CrossRef]
- Carr, D.J.; Lewis, E.; Mahoney, P. Uk Military Helmet Design and Test Methods. BMJ Mil. Health 2020, 166, 342–346. [Google Scholar] [CrossRef]
- Hamouda, A.; Sohaimi, R.; Zaidi, A.; Abdullah, S. Materials and Design Issues for Military Helmets. In Advances in Military Textiles and Personal Equipment; Elsevier: Amsterdam, The Netherlands, 2012; pp. 103–138. [Google Scholar]
- Misra, A.; Srivastava, R.; Sarma, A. Design and Development of Customized Helmet for Military Personnel. In Proceedings of the International Conference on Production and Industrial Engineering, Online, 10–12 March 2023; Springer: Berlin, Germany, 2023; pp. 143–150. [Google Scholar]
- Natsa, S.; Akindapo, J.; Garba, D. Development of a Military Helmet Using Coconut Fiber Reinforced Polymer Matrix Composite. Eur. J. Eng. Technol. Vol. 2015, 3, 2056–5860. [Google Scholar]
- Sone, J.Y.; Kondziolka, D.; Huang, J.H.; Samadani, U. Helmet Efficacy against Concussion and Traumatic Brain Injury: A Review. J. Neurosurg. 2017, 126, 768–781. [Google Scholar] [CrossRef] [PubMed]
- Kulkarni, S.G.; Gao, X.-L.; Horner, S.; Zheng, J.Q.; David, N. Ballistic Helmets–Their Design, Materials, and Performance Against Traumatic Brain Injury. Compos. Struct. 2013, 101, 313–331. [Google Scholar] [CrossRef]
- McIver, K.G. Engineering Better Protective Headgear for Sport and Military Applications; Purdue University: West Lafayette, IN, USA, 2019. [Google Scholar]
- Wang, J.J.; Triplett, D.J. In Multioctave Broadband Body-Wearable Helmet and Vest Antennas. In 2007 IEEE Antennas and Propagation Society International Symposium; IEEE: Piscataway, NJ, USA, 2007; pp. 4172–4175. [Google Scholar]
- Leng, B.; Ruan, D.; Tse, K.M. Recent Bicycle Helmet Designs and Directions for Future Research: A Comprehensive Review from Material and Structural Mechanics Aspects. International journal of impact engineering. 2022, 168, 104317. [Google Scholar] [CrossRef]
- Chang, L.; Guo, Y.; Huang, X.; Xia, Y.; Cai, Z. Experimental Study on the Protective Performance of Bulletproof Plate and Padding Materials Under Ballistic Impact. Mater. Des. 2021, 207, 109841. [Google Scholar] [CrossRef]
- Huang, X.; Zheng, Q.; Chang, L.; Cai, Z. Study on Protective Performance and Gradient Optimization of Helmet Foam Liner Under Bullet Impact. Sci. Rep. 2022, 12, 16061. [Google Scholar] [CrossRef] [PubMed]
- Li, Y.; Fan, H.; Gao, X.-L. Ballistic Helmets: Recent Advances in Materials, Protection Mechanisms, Performance, and Head Injury Mitigation. Compos. Part B Eng. 2022, 238, 109890. [Google Scholar] [CrossRef]
- Żochowski, P.; Cegła, M.; Berent, J.; Grygoruk, R.; Szlązak, K.; Smędra, A. Experimental and Numerical Study on Failure Mechanisms of Bone Simulants Subjected to Projectile Impact. Int. J. Numer. Methods Biomed. Eng. 2023, 39, e3687. [Google Scholar] [CrossRef]
- Lee, J.M. Mandatory Helmet Legislation as a Policy Tool for Reducing Motorcycle Fatalities: Pinpointing the Efficacy of Universal Helmet Laws. Accid. Anal. Prev. 2018, 111, 173–183. [Google Scholar] [CrossRef]
- Bottlang, M.; DiGiacomo, G.; Tsai, S.; Madey, S. Effect of Helmet Design on Impact Performance of Industrial Safety Helmets. Heliyon 2022, 8, e09962. [Google Scholar] [CrossRef]
- Palomar, M.; Lozano-Mínguez, E.; Rodríguez-Millán, M.; Miguélez, M.H.; Giner, E. Relevant Factors in the Design of Composite Ballistic Helmets. Compos. Struct. 2018, 201, 49–61. [Google Scholar] [CrossRef]
- Philippens, M.M.G.M.; Anctil, B.; Markwardt, K.C. Results of a Round Robin Ballistic Load Sensing Headform Test Series. In Proceedings of the Personal Armour Systems Symposium, Cambridge, UK, 8–12 September 2014. [Google Scholar]
- Ahuja, R.; Chug, A.; Gupta, S.; Ahuja, P.; Kohli, S. Classification and Clustering Algorithms of Machine Learning with Their Applications. In Nature-Inspired Computation in Data Mining and Machine Learning; Springer: Berlin/Heidelberg, Germany, 2020; pp. 225–248. [Google Scholar]
- Kotsiantis, S.B.; Zaharakis, I.D.; Pintelas, P.E. Machine Learning: A Review of Classification and Combining Techniques. Artif. Intell. Rev. 2006, 26, 159–190. [Google Scholar] [CrossRef]
- Sluijterman, L.; Cator, E.; Heskes, T. How to Evaluate Uncertainty Estimates in Machine Learning for Regression? Neural Netw. 2024, 173, 106203. [Google Scholar] [CrossRef]
- Yildiz, B.; Bilbao, J.I.; Sproul, A.B. A Review and Analysis of Regression and Machine Learning Models on Commercial Building Electricity Load Forecasting. Renew. Sustain. Energy Rev. 2017, 73, 1104–1122. [Google Scholar] [CrossRef]
- Chen, Y.; Ji, H.; Lu, M.; Liu, B.; Zhao, Y.; Ou, Y.; Wang, Y.; Tao, J.; Zou, T.; Huang, Y.; et al. Machine Learning Guided Hydrothermal Synthesis of Thermochromic VO2 Nanoparticles. Ceram. Int. 2023, 49, 30794–30800. [Google Scholar] [CrossRef]
- Xu, P.; Ji, X.; Li, M.; Lu, W. Small Data Machine Learning in Materials Science. npj Comput. Mater. 2023, 9, 42. [Google Scholar] [CrossRef]
- Zelaya, C.V.G. Towards Explaining the Effects of Data Preprocessing on Machine Learning. In Proceedings of the 2019 IEEE 35th International Conference on Data Engineering (ICDE), Macao, China, 8–12 April 2019; IEEE: Piscataway, NJ, USA, 2019; pp. 2086–2090. [Google Scholar]
- Kotsiantis, S.B.; Kanellopoulos, D.; Pintelas, P.E. Data Preprocessing for Supervised Leaning. Int. J. Comput. Sci. 2006, 1, 111–117. [Google Scholar]
- Tao, S.; Sun, C.; Fu, S.; Wang, Y.; Ma, R.; Han, Z.; Sun, Y.; Li, Y.; Wei, G.; Zhang, X.; et al. Battery Cross-Operation-Condition Lifetime Prediction Via Interpretable Feature Engineering Assisted Adaptive Machine Learning. ACS Energy Lett. 2023, 8, 3269–3279. [Google Scholar] [CrossRef]
- Wei, J.; Chu, X.; Sun, X.-Y.; Xu, K.; Deng, H.-X.; Chen, J.; Wei, Z.; Lei, M. Machine Learning in Materials Science. InfoMat 2019, 1, 338–358. [Google Scholar] [CrossRef]
- Zheng, A.; Casari, A. Feature Engineering for Machine Learning: Principles and Techniques for Data Scientists; O’Reilly Media, Inc.: Sebastopol, CA, USA, 2018. [Google Scholar]
- Chicco, D.; Warrens, M.J.; Jurman, G. The Coefficient of Determination R-Squared Is More Informative Than Smape, Mae, Mape, Mse and Rmse in Regression Analysis Evaluation. PeerJ Comput. Sci. 2021, 7, e623. [Google Scholar] [CrossRef]
- Gao, J. R-Squared (R2)–How Much Variation Is Explained? Res. Methods Med. Health Sci. 2024, 5, 104–109. [Google Scholar] [CrossRef]
- Wang, A.; Xu, J.; Tu, R.; Saleh, M.; Hatzopoulou, M. Potential of Machine Learning for Prediction of Traffic Related Air Pollution. Transp. Res. Part D Transp. Environ. 2020, 88, 102599. [Google Scholar] [CrossRef]
- Bottou, L.; Curtis, F.E.; Nocedal, J. Optimization Methods for Large-Scale Machine Learning. SIAM Rev. 2018, 60, 223–311. [Google Scholar] [CrossRef]
- Sra, S.; Nowozin, S.; Wright, S.J. Optimization for Machine Learning; Mit Press: Cambridge, MA, USA, 2012. [Google Scholar]
- Sun, S.; Cao, Z.; Zhu, H.; Zhao, J. A Survey of Optimization Methods from a Machine Learning Perspective. IEEE Trans. Cybern. 2019, 50, 3668–3681. [Google Scholar] [CrossRef] [PubMed]
- Yang, L.; Shami, A. On Hyperparameter Optimization of Machine Learning Algorithms: Theory and Practice. Neurocomputing 2020, 415, 295–316. [Google Scholar] [CrossRef]
- Blennow, K.; Brody, D.L.; Kochanek, P.M.; Levin, H.; McKee, A.; Ribbers, G.M.; Yaffe, K.; Zetterberg, H. Traumatic Brain Injuries. Nat. Rev. Dis. Primers 2016, 2, 16084. [Google Scholar] [CrossRef] [PubMed]
- Ma, X.; Aravind, A.; Pfister, B.J.; Chandra, N.; Haorah, J. Animal Models of Traumatic Brain Injury and Assessment of Injury Severity. Mol. Neurobiol. 2019, 56, 5332–5345. [Google Scholar] [CrossRef] [PubMed]
- Marjoux, D.; Baumgartner, D.; Deck, C.; Willinger, R. Head Injury Prediction Capability of the Hic, Hip, Simon and Ulp Criteria. Accid. Anal. Prev. 2008, 40, 1135–1148. [Google Scholar] [CrossRef]
- Shuaeib, F.M.; Hamouda, A.M.S.; Radin Umar, R.S.; Hamdan, M.M.; Hashmi, M.S.J. Motorcycle Helmet: Part I. Biomechanics and Computational Issues. J. Mater. Process. Technol. 2002, 123, 406–421. [Google Scholar] [CrossRef]
- Newman, J.A.; Shewchenko, N. A Proposed New Biomechanical Head Injury Assessment Function—The Maximum Power Index; The Stapp Association: Ann Arbor, MI, USA, 2000. [Google Scholar]
- JA, N. In A Generalized Acceleration Model for Brain Injury Threshold (Gambit). In Proceedings of the International IRCOBI Conference, Zurich, Switzerland, 2–4 September 1986. [Google Scholar]
- McLEAN, A.J. Brain Injury without Head Impact? J. Neurotrauma 1995, 12, 621–625. [Google Scholar] [CrossRef]
- Takhounts, E.G.; Hasija, V.; Ridella, S.A.; Rowson, S.; Duma, S.M. Kinematic Rotational Brain Injury Criterion (Bric). In Proceedings of the 22nd Enhanced Safety of Vehicles Conference, Washington, DC, USA, 13–16 June 2011; pp. 1–10. [Google Scholar]
- Takhounts, E.G.; Craig, M.J.; Moorhouse, K.; McFadden, J.; Hasija, V. Development of Brain Injury Criteria (Bric); SAE Technical Paper; SAE International: Warrendale, PA, USA, 2013. [Google Scholar]
- Civil, I.D.; Schwab, C.W. The Abbreviated Injury Scale, 1985 Revision: A Condensed Chart for Clinical Use. J. Trauma 1988, 28, 87–90. [Google Scholar] [CrossRef]
- Belkina, A.C.; Ciccolella, C.O.; Anno, R.; Halpert, R.; Spidlen, J.; Snyder-Cappione, J.E. Automated Optimized Parameters for T-Distributed Stochastic Neighbor Embedding Improve Visualization and Analysis of Large Datasets. Nat. Commun. 2019, 10, 5415. [Google Scholar] [CrossRef] [PubMed]
- Bro, R.; Smilde, A.K. Principal Component Analysis. Anal. Methods 2014, 6, 2812–2831. [Google Scholar] [CrossRef]
- Cheng, Z.; Zou, C.; Dong, J. Outlier Detection Using Isolation Forest and Local Outlier Factor. In Proceedings of the Conference on Research in Adaptive and Convergent Systems, Chongqing, China, 24–27 September 2019; pp. 161–168. [Google Scholar]
- van der Gaag, M.; Hoffman, T.; Remijsen, M.; Hijman, R.; de Haan, L.; van Meijel, B.; van Harten, P.N.; Valmaggia, L.; De Hert, M.; Cuijpers, A. The Five-Factor Model of the Positive and Negative Syndrome Scale Ii: A Ten-Fold Cross-Validation of a Revised Model. Schizophr. Res. 2006, 85, 280–287. [Google Scholar] [CrossRef] [PubMed]
- Lee, S.L.S.-I. A Unified Approach to Interpreting Model Predictions. arXiv 2017, arXiv:1705.07874. [Google Scholar]
- Mangalathu, S.; Hwang, S.-H.; Jeon, J.-S. Failure Mode and Effects Analysis of Rc Members Based on Machine-Learning-Based Shapley Additive Explanations (Shap) Approach. Eng. Struct. 2020, 219, 110927. [Google Scholar] [CrossRef]


| Name | MSE | RMSE | R-Squared | Correlation |
|---|---|---|---|---|
| XGB | 98.6287 | 9.9312 | 0.8967 | 0.8980 |
| RF | 97.0735 | 9.85 | 0.8984 | 0.8991 |
| SVM | 122.9510 | 11.0883 | 0.8713 | 0.8746 |
| MLP | 99.0270 | 9.9512 | 0.8964 | 0.8997 |
| Name | MSE | RMSE | R-Squared | Correlation |
|---|---|---|---|---|
| XGB | 0.1040 | 0.3225 | 0.8838 | 0.8837 |
| RF | 0.0950 | 0.3083 | 0.8938 | 0.8941 |
| SVM | 0.1439 | 0.3793 | 0.8392 | 0.8398 |
| MLP | 0.1159 | 0.3405 | 0.8704 | 0.8714 |
Disclaimer/Publisher’s Note: The statements, opinions and data contained in all publications are solely those of the individual author(s) and contributor(s) and not of MDPI and/or the editor(s). MDPI and/or the editor(s) disclaim responsibility for any injury to people or property resulting from any ideas, methods, instructions or products referred to in the content. |
© 2025 by the authors. Licensee MDPI, Basel, Switzerland. This article is an open access article distributed under the terms and conditions of the Creative Commons Attribution (CC BY) license (https://creativecommons.org/licenses/by/4.0/).
Share and Cite
Chen, Y.; Wang, J.; Long, P.; Liu, B.; Wang, Y.; Ma, T.; Huang, X.; Li, W.; Kang, Y.; Ji, H. Optimization Design of Protective Helmet Structure Guided by Machine Learning. Processes 2025, 13, 877. https://doi.org/10.3390/pr13030877
Chen Y, Wang J, Long P, Liu B, Wang Y, Ma T, Huang X, Li W, Kang Y, Ji H. Optimization Design of Protective Helmet Structure Guided by Machine Learning. Processes. 2025; 13(3):877. https://doi.org/10.3390/pr13030877
Chicago/Turabian StyleChen, Yongxing, Junlong Wang, Peng Long, Bin Liu, Yi Wang, Tian Ma, Xiancong Huang, Weiping Li, Yue Kang, and Haining Ji. 2025. "Optimization Design of Protective Helmet Structure Guided by Machine Learning" Processes 13, no. 3: 877. https://doi.org/10.3390/pr13030877
APA StyleChen, Y., Wang, J., Long, P., Liu, B., Wang, Y., Ma, T., Huang, X., Li, W., Kang, Y., & Ji, H. (2025). Optimization Design of Protective Helmet Structure Guided by Machine Learning. Processes, 13(3), 877. https://doi.org/10.3390/pr13030877