Article

What’s Hot and What’s Not—A Simulation-Based Methodology for Fire Risk Assessment in Lead-Acid Battery Manufacturing

Department of Design Engineering and Robotics, Faculty of Industrial Engineering, Robotics and Production Management, Technical University of Cluj-Napoca, 400641 Cluj-Napoca, Romania
*
Authors to whom correspondence should be addressed.
Processes 2025, 13(3), 837; https://doi.org/10.3390/pr13030837
Submission received: 11 January 2025 / Revised: 21 February 2025 / Accepted: 9 March 2025 / Published: 12 March 2025

Abstract

:
The present paper addresses dynamic risks in automotive industry factories, specifically in the car lead-acid battery manufacturing area. The main analyzed risk is fire risk. The battery manufacturing process is described and analyzed from this perspective, and the hazard areas are identified. The investigation methodology uses case studies for different lead-acid battery formation processes, combined with 3D simulations using the PyroSim platform, and it is based on our practical experience in the battery manufacturing field. The results of the case studies are compared using the same inputs but specific process conditions, and conclusions are formulated. To avoid fires and mitigate the risk, a series of actions are proposed in the discussion section. As a general conclusion, the current research demonstrates that the complex and dynamic risks in the automotive industry, associated with Industry 5.0 technologies, must be analyzed using combined methods, both quantitative and qualitative, including 3D simulations.

1. Introduction

In our previous research and articles, we found that automotive industry companies adopting digitization and technologies specific to the fourth and fifth industrial revolutions face dynamic risks that are complex and difficult to control and mitigate [1,2]. After analyzing and testing various risk assessment methods, we concluded that developing a specific generic model for the automotive industry is essential, considering emerging technologies. Organizations should combine qualitative and quantitative analysis methods to discover and mitigate risks effectively [3]. Considering these aspects, this research aims to carry out validation case studies on complex dynamic risks in automotive industry companies, with the most relevant being fires in various phases of the manufacturing process, which are unpredictable and impactful. We chose the manufacturing of lead-acid batteries, considering the future market trend of these batteries and the industry’s development towards efficiency and sustainability. Although in recent years, the main focus of automotive battery manufacturing has been on lithium-based batteries and related technologies such as LiFePO4 and Nickel Cadmium, lead-acid technology batteries still have and will continue to have a significant demand, reflected in the total number of batteries produced worldwide, as shown in the statistics by GS Yuasa in Figure 1 [4]. Their reliability and proven track record make these batteries a necessity even for electric vehicles. Their manufacturing is expected to improve to keep up with changing customer expectations and the evolving regulatory landscape.
The significant demand for lead-acid batteries is due to the continued manufacturing of conventional cars with combustion engines until 2035 and possibly beyond. Additionally, most hybrid and fully electric cars still use a lead-acid battery as an auxiliary battery for backup and stationary consumption support, because these batteries are much cheaper, electrically efficient, and more stable than lithium technologies. Even though the switch to electric cars aims to reduce the carbon footprint and achieve zero emissions by 2035 [5], the reality is that lithium-based batteries are currently more polluting and have a lower recycling rate, which also involves higher costs. According to Romanian battery manufacturer Rombat’s official website, the recycling rate of lead from wasted batteries is about 99% [6], and based on our experience, the overall recycling rate of all battery materials can reach 84%. The significant advantage of lead is that it can be infinitely recycled and reused with minimal loss.
Within the current research, we aim to test the methodology proposed in our previous studies and to apply a combined analysis model to a real automotive company that uses a 360-degree battery manufacturing process, located in Romania. The manufacturer has implemented automated processes with collaborative robots, IIoT (Industrial Internet of Things) processes, and monitoring and planning using SCADA (Supervisory Control and Data Acquisition) and SAP ERP (Enterprise Resource Planning). Most of the production is concentrated on lead-based batteries, but it also sells lithium-based batteries dedicated solely to energy storage in small volumes at this time.
Lithium-based batteries are more often associated with fires, due to the “thermal runaway” phenomenon that occurs during use (in the car or at the storage site) caused by internal manufacturing defects or exploitation problems [7]. However, such incidents are very rare at the production plant due to strictly supervised processes. The literature provides several research studies and case studies on fire risk causes and mitigation solutions, including fire extinction methods, as can be seen in articles [8,9,10] and others. Compared with lithium batteries, lead-based batteries are much safer and more stable during use because of the reduced possibility of generating a fire, as the battery itself is smaller in size. However, we focused on lead-based technologies because there are many manufacturers worldwide, and the risks are more associated with the manufacturing process than with the product itself. Additionally, for sustainable development, the safety of employees is critical.

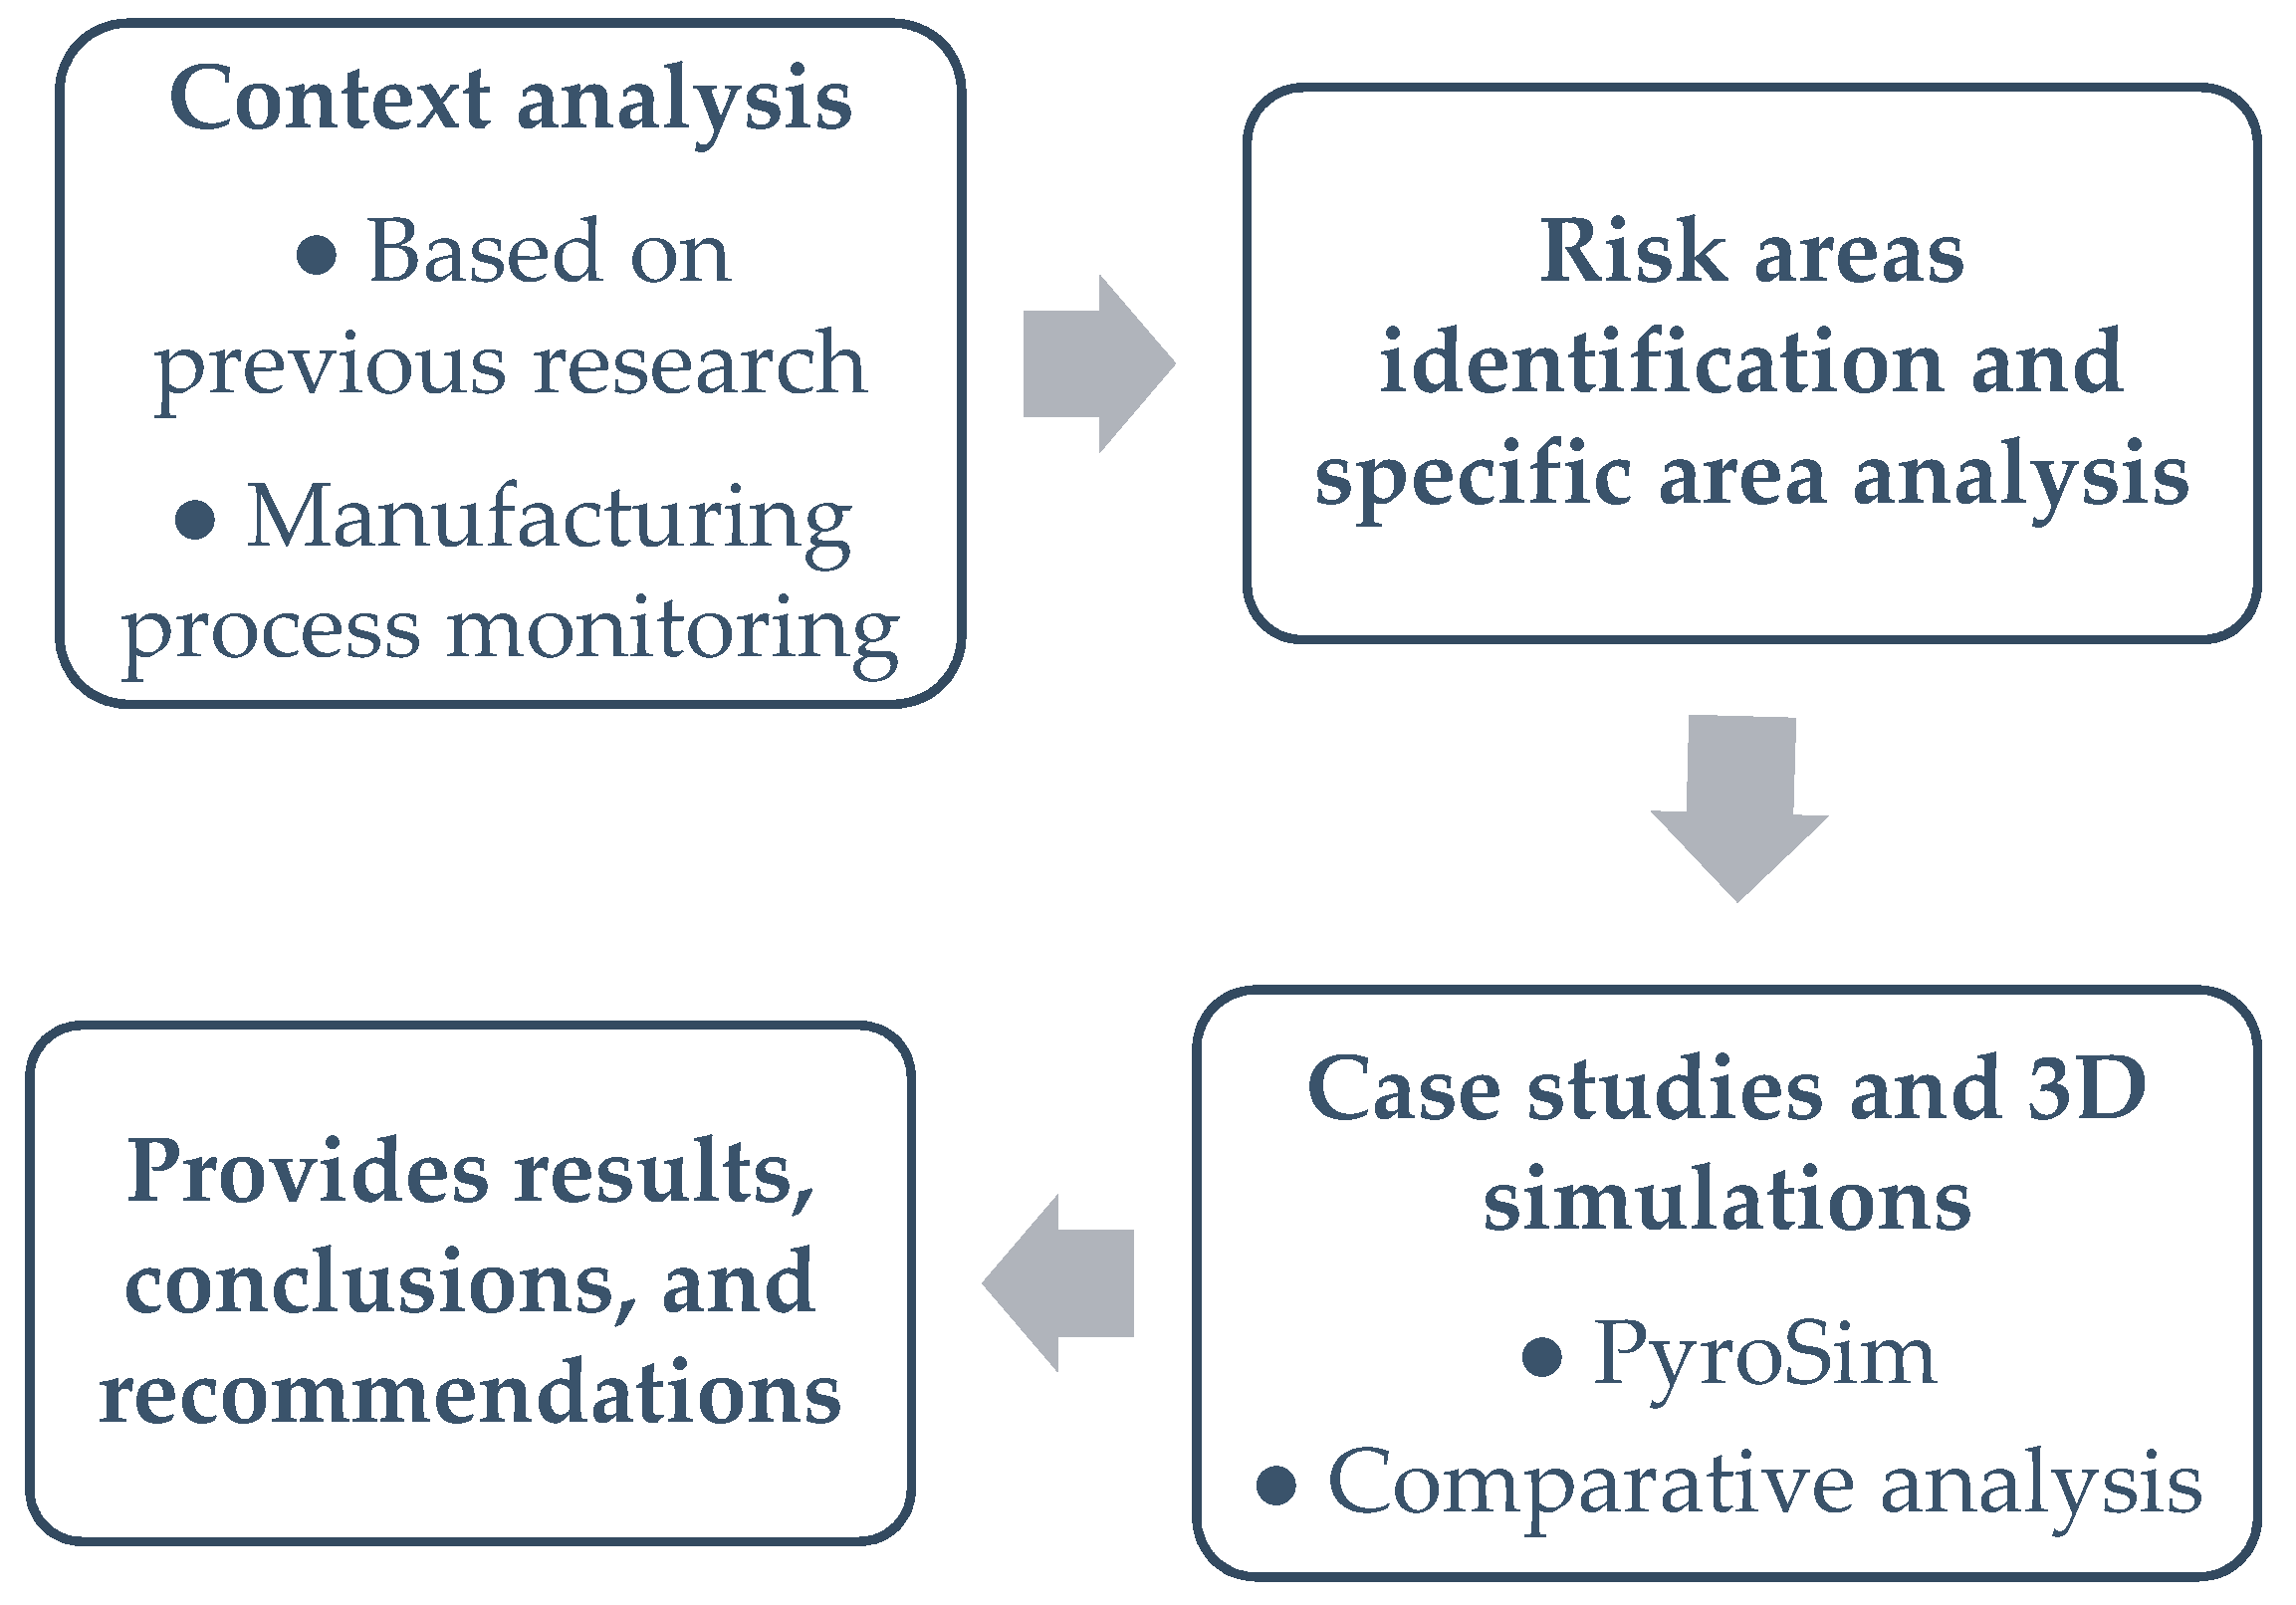
2. Materials and Methods

At the beginning of the study, we created the research methodology based on best practices specific to the field of engineering management (Figure 2).
The introduction is based on our previous research and experience in lead-acid battery manufacturing. We decided to analyze fire risk using case studies and 3D simulations. To provide a proper context, we first describe car lead-acid batteries and then present the complete manufacturing process. Next, we identify and present the risk areas. These risks are analyzed in the case studies by presenting the theoretical background for each specific area, and 3D simulations are performed using PyroSim software to test the hypotheses and demonstrate their effects. The simulation results are analyzed using graphs and numerical data, forming the basis for pertinent conclusions and recommendations for manufacturers in this field. The research instruments include case studies, SolidWorks Premium 2020 SP01 software for modeling some parts, PyroSim 3D fire simulation software, and graphs and tables for comparative analyses. The most complex instrument is the PyroSim software, version 2023.3.1312 X64, provided to the team through a six-month free license by Thunderhead Engineering Software House, Manhattan, KS, USA. This software offers a 3D interface, as shown in Figure 3, allowing users to model the desired areas and objects and generate numeric results and graphs based on fire knowledge and user inputs [11].
Objects can be modeled directly in the application or imported from other programs such as Autodesk or SolidWorks. For this study, we modeled the production area to create a realistic simulation. All the specific points, such as access doors, windows, vents, and exhaust systems, were defined, along with input parameters like dimensions, airflow, the materials involved, and burning areas. The burning areas were defined using the software library and were represented in our research by polypropylene and a gas mix of hydrogen and oxygen. Default parameters can be used or modified based on user experience. Additionally, the simulation time, frame number, display mode, and other parameters can be set. Depending on these settings, the simulation can take from a few minutes to several hours, allowing for a detailed investigation of phenomena.

3. Results

3.1. Lead-Acid Batteries and Manufacturing Process Description

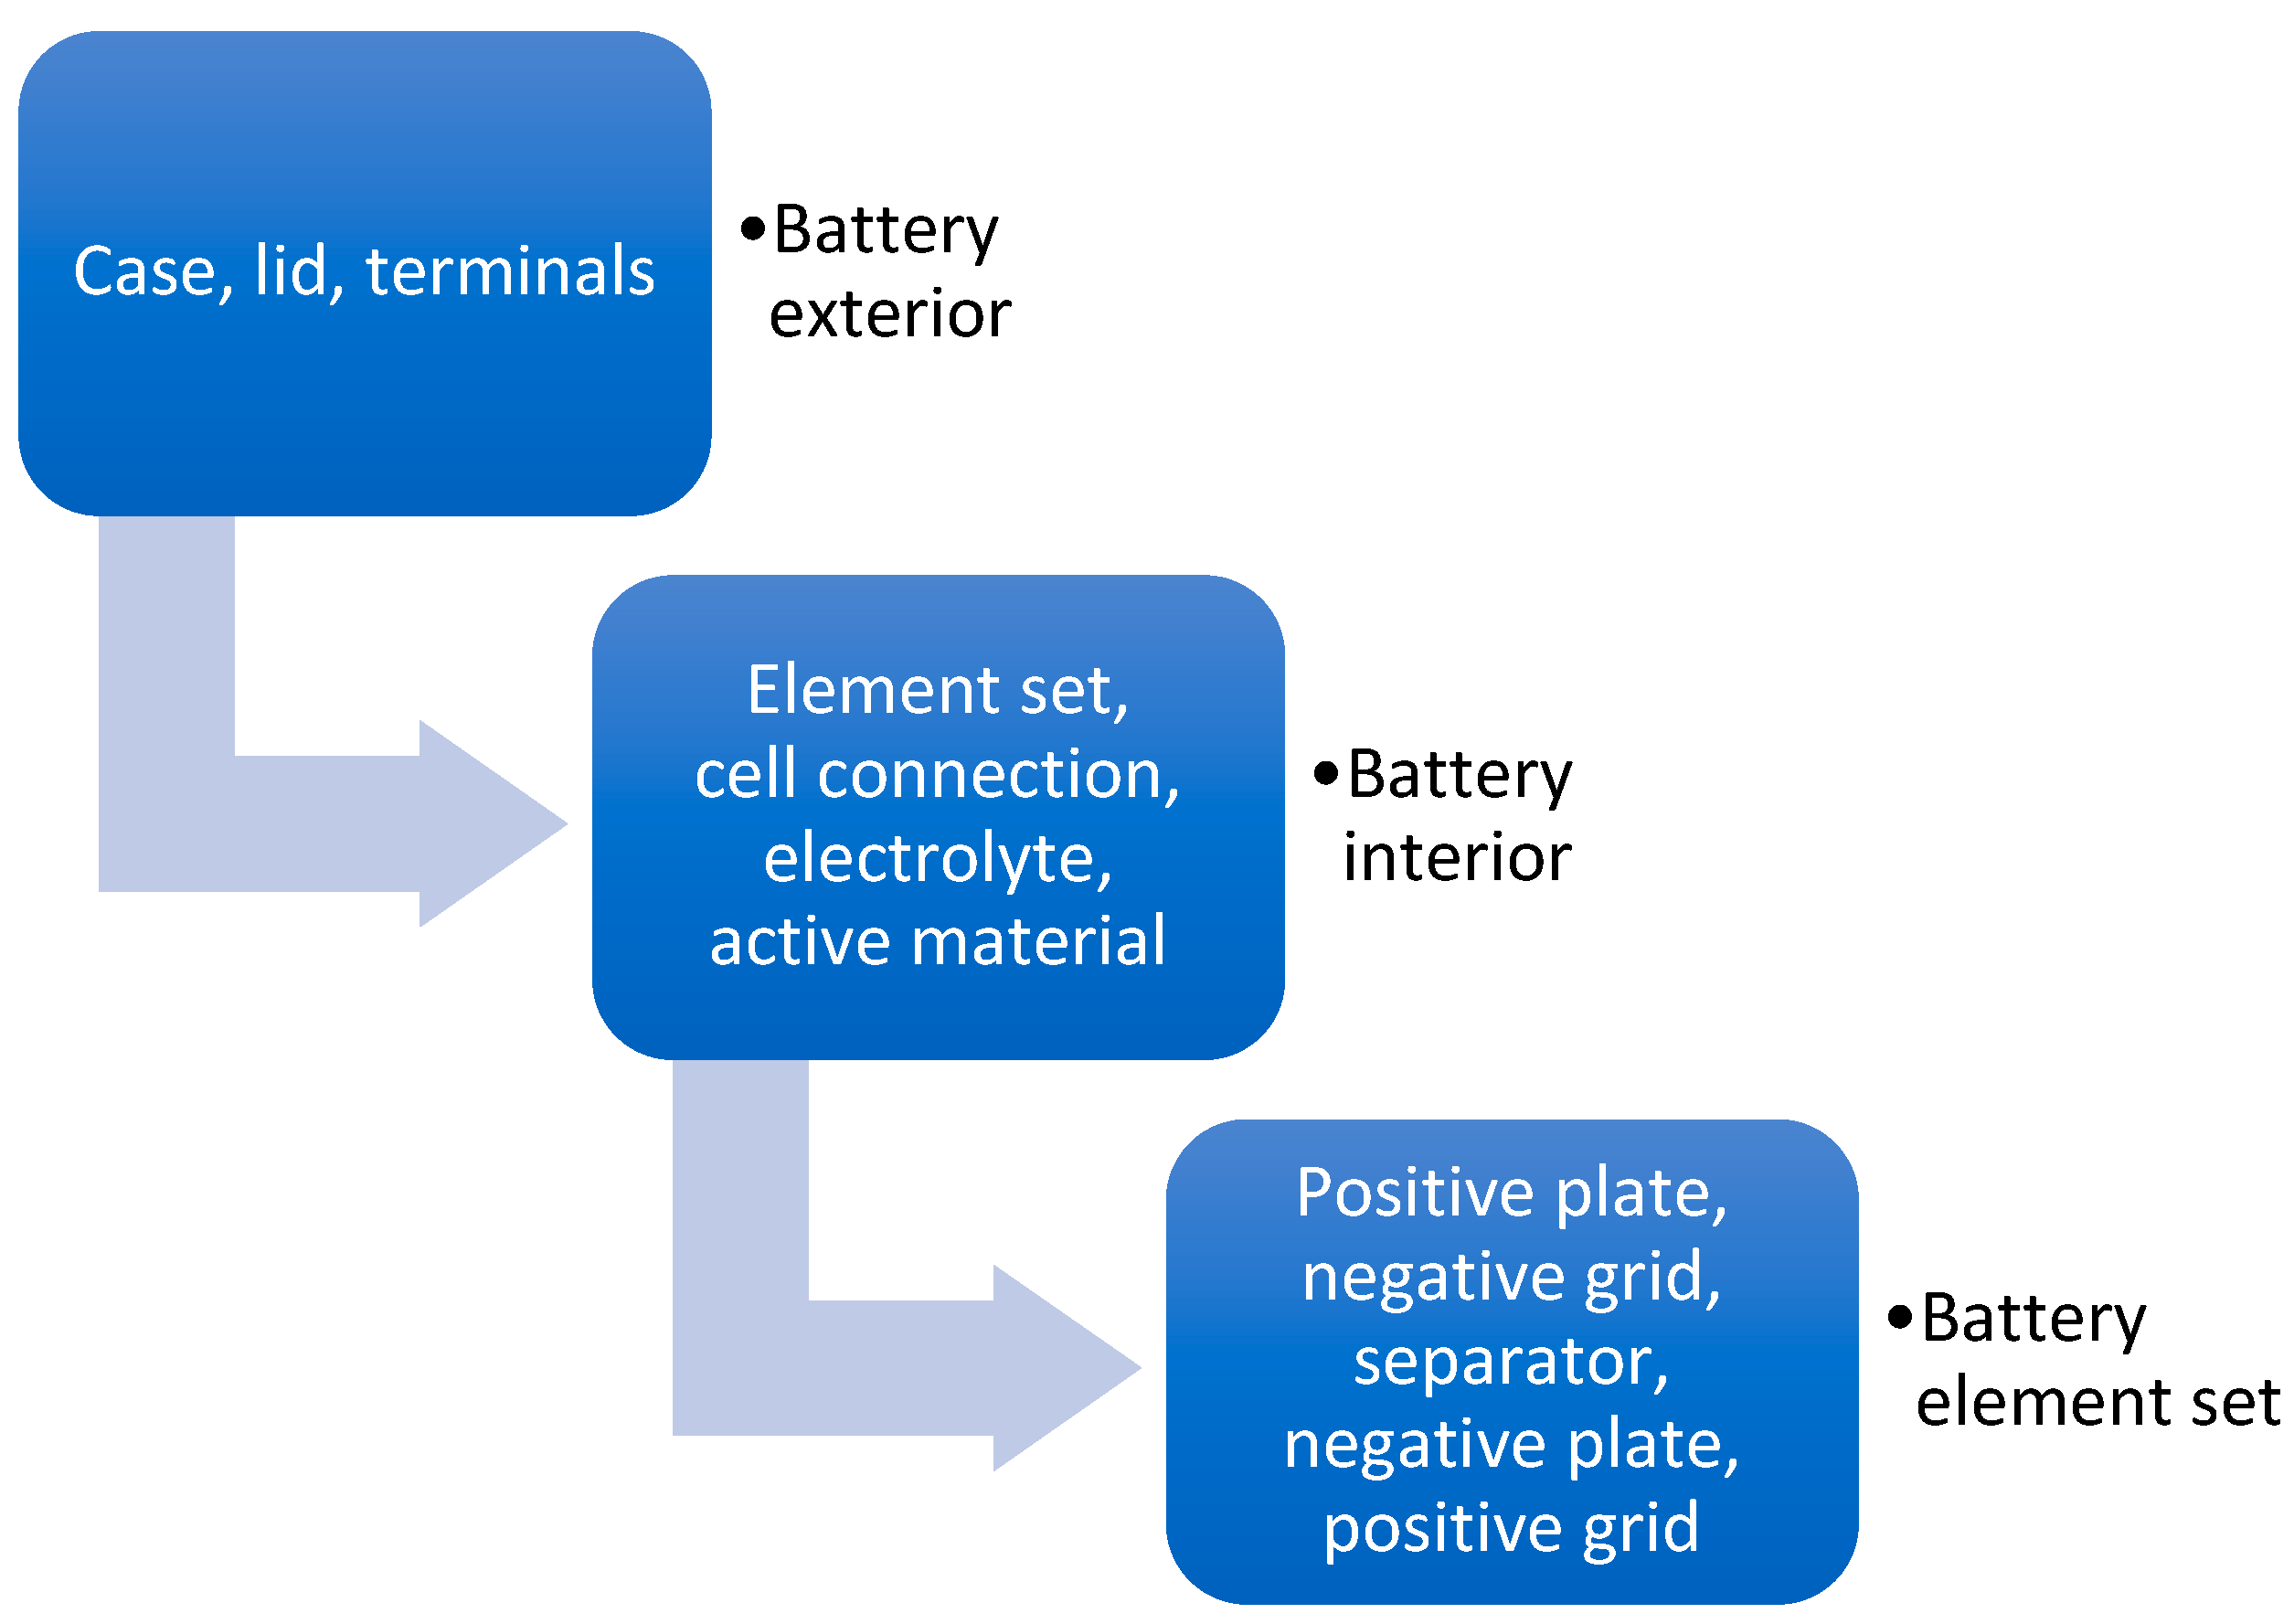
3.1.1. Car Lead-Acid Batteries—Overview

Lead-acid batteries for cars are a type of battery that quickly charges and discharges, providing energy for starting the engine and supporting consumption while the engine is off. This is why they are called SLI batteries (Starting, Lighting, Ignition). These batteries have a long history of about 150 years and were invented by Gaston Plante in 1859 [13,14]. Initially, they were developed to provide a nominal OCV (Open Circuit Voltage) of 6 volts. However, after 1950, they switched to 12 volts due to higher consumption and engines that required a higher power supply [15]. Modern batteries provide 12 volts and are built with six individual cells. Each cell contains groups of positive and negative plates that provide a nominal voltage of 2 volts and are connected in series, as shown in Figure 4. The most basic parts are the positive and negative grids, made of lead and alloyed with different materials according to the manufacturer’s specifications. These grids are produced using various technologies such as punching, expanding, and continuous casting. A paste made of lead oxide is applied to the grids to create positive plates, while metallic lead is used for negative plates. The positive and negative plates are connected separately with a lead strap called the Cast On Strap, which is cast into a mold with melted lead alloy, forming the terminals on the sides. The plates are separated using different separators, such as polyethylene bags or glass mat foil, depending on the battery technology. Inside the box or separator, there is an electrolyte liquid containing approximately 35% sulfuric acid and distilled water. The groups, known as element sets, are connected in series (positive plates from one cell connected to negative plates from the next cell) and react with the electrolyte to generate lead sulfate and electrons, providing the energy needed for the car. For proper battery operation, other components not mentioned in Figure 4 include the polypropylene battery box, lid, plugs, handle, positive and negative terminals, terminal protection and covers, and specific labels for recycling, safety, and battery parameters.
The main parameters of the battery are as follows:
  • OCV—(Open Circuit Voltage);
  • Battery Capacity—defined as the amount of energy provided over a specific time period [17]. This is rated at 20 h (C20) and measured in ampere-hours (Ah), according to ISO EN 50342 standards [18]. The battery’s capacity is linked to the quantity of active mass applied to the plates and is determined by the manufacturer during the development phase;
  • CCA (Cold Cranking Amps)—defined as the maximum amount of current that the battery can provide at a temperature of −18 °C for 30 s [19]. The starting current is linked to the active surface area that reacts during the electrochemical process. This theoretically means that the more plates a battery contains, the higher its CCA value.
The dimensions of the batteries (length, height, width, terminal positions, etc.) and the requirements for testing the parameters are specified in the ISO EN 50342 standards. These standards also define the current technologies, including the Standard Flooded battery, and other technologies such as EFB (Enhanced Flooded Battery [20]), which has almost the same construction as the Flooded battery but is enhanced to withstand higher numbers of charging and discharging cycles; EFB + C; and VRLA (Valve-Regulated Lead-Acid battery [20]), which can use AGM (Absorbent Glass Mat [21]) technology or GEL (where the electrolyte is not liquid but a gel). EFB and VRLA batteries are dedicated to cars with a Start and Stop System.

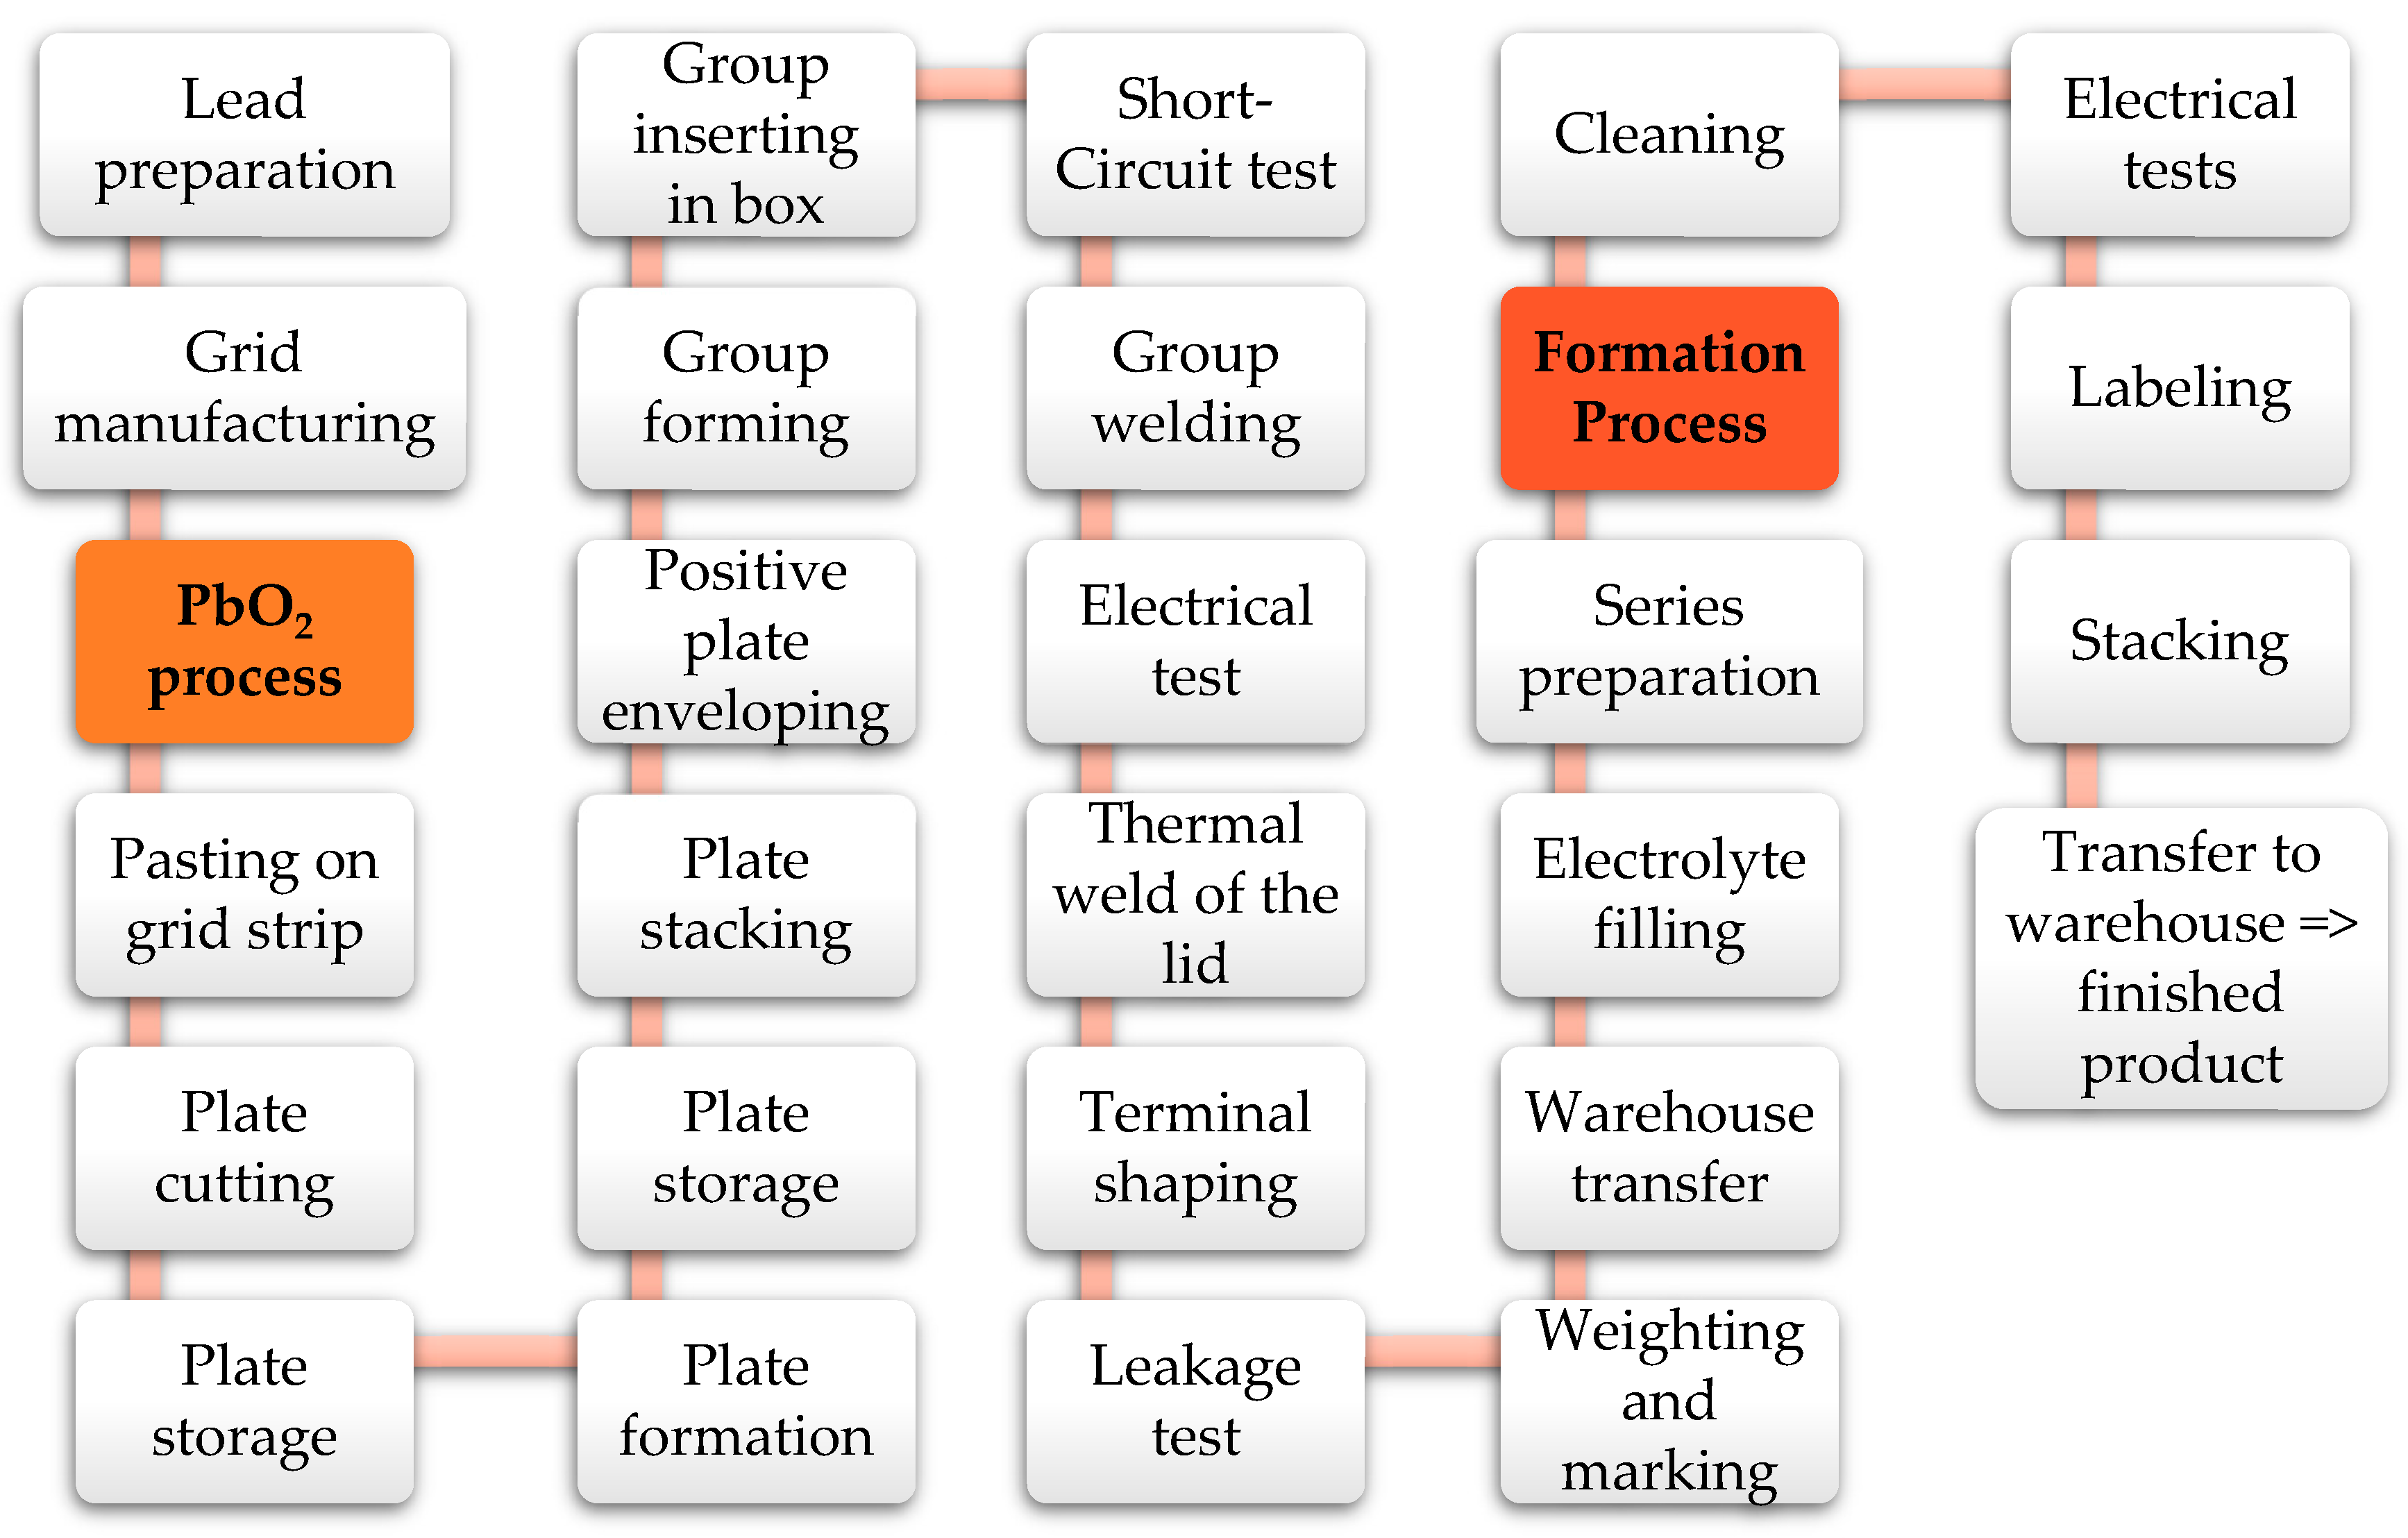
3.1.2. Manufacturing Process Description

To better understand the risks, Figure 5 presents the manufacturing process of lead-acid batteries. The process starts with lead preparation, using either pure lead (99.998% Pb) or lead alloy, depending on the process. The lead bars are melted and transformed into strips or grids using various methods (continuous casting, punching, expanding, etc.). The melted lead is also shaped into molds to create cylinders, which are then introduced into a mill. Through continuous rotation and friction, a thin dust called lead oxide is obtained.
Next, the lead oxide is mixed with electrolyte, distilled water, and other elements to create the positive and negative paste. Using pasting machines, the paste is applied to the grid strips, pressed, and dried with special paper to ensure optimal adherence. The plates are cut from the strips, stacked on special pallets, and prepared for the next step: plate formation. The plates are placed in automatic chambers with climate and humidity control for several hours, as prescribed. The plates are then stored, awaiting stacking, enveloping (only the positive plates), and the preparation of plate groups. A robot takes the groups, stores them in a buffer, and transfers them into molds, where connection strips are built using melted lead. Another robot extracts the groups, places them into battery boxes, and performs an electrical test to detect possible short circuits. If the battery passes the test, it proceeds to group welding (creating series connections). Another electrical test is conducted to detect internal defects. The lid and box are fitted using a thermal welding process, and the terminals are built using an oxy-acetylene flame and molds. To ensure proper welding, a leakage test is performed. The batteries are then weighed, and manufacturing codes are engraved on the lid. Finally, an industrial robot stacks the batteries on pallets and transfers them to the warehouse, awaiting the next phases.
Based on the orders, the semi-finished batteries are transferred to the finishing line, where they are filled with electrolyte, connected in series, and introduced into the formation process (charging process). The charging time depends on the formation technology used, the battery type, and the battery capacity. The charged batteries then go through the washing step, electrical tests to detect any defects, manufacturing code engraving, and labeling according to customer requirements. Terminal protections are fitted, and a robot places the batteries on pallets. The pallets are wrapped, labeled, registered into the ERP, and transferred to the warehouse, awaiting delivery.

3.2. Case Studies for the Fire Risk Areas

In Figure 5, the areas where fire risks can occur are highlighted in orange/red, specifically during the lead oxide manufacturing process and the formation step. According to previous experience, the formation process presents the highest fire risk. In the lead-acid battery industry, three types of formation processes are used:
  • Formation in open air, on shelves—the most basic and least efficient type;
  • Formation in tank cells with water cooling;
  • Formation with electrolyte recirculation—the most advanced one.
These three formation processes are the most common worldwide in lead-acid battery manufacturing. Based on industrial experience within a real-world battery factory in Romania, it is inferred that fire risk is one of the most significant cause of disasters, when compared with other process and product risks (e.g., worker safety or logistical errors).
The root causes of the fire may seem to be in common, but due to process specificity, they will be treated separately.
The generic root causes of fires during formation are as follows:
  • Internal battery defect;
  • Electrolyte filling problems;
  • Empty battery or empty battery cells due to formation process problems;
  • Foaming on the cooling water surface;
  • Cooling water level problems;
  • Electrolyte recirculation system problems;
  • Cables or connection worn or wrongly connected.
Usually, these are automated processes controlled by computerized systems, and operators only need to supervise the parameters without being physically present in the workplace.
There is another risk area in the complementary processes—the air aspiration area (exhaust system). Occasionally, and under extraordinary conditions, the filters can burn, but the effects are less significant. The risks are analyzed in detail below, and the important ones are simulated using PyroSim.

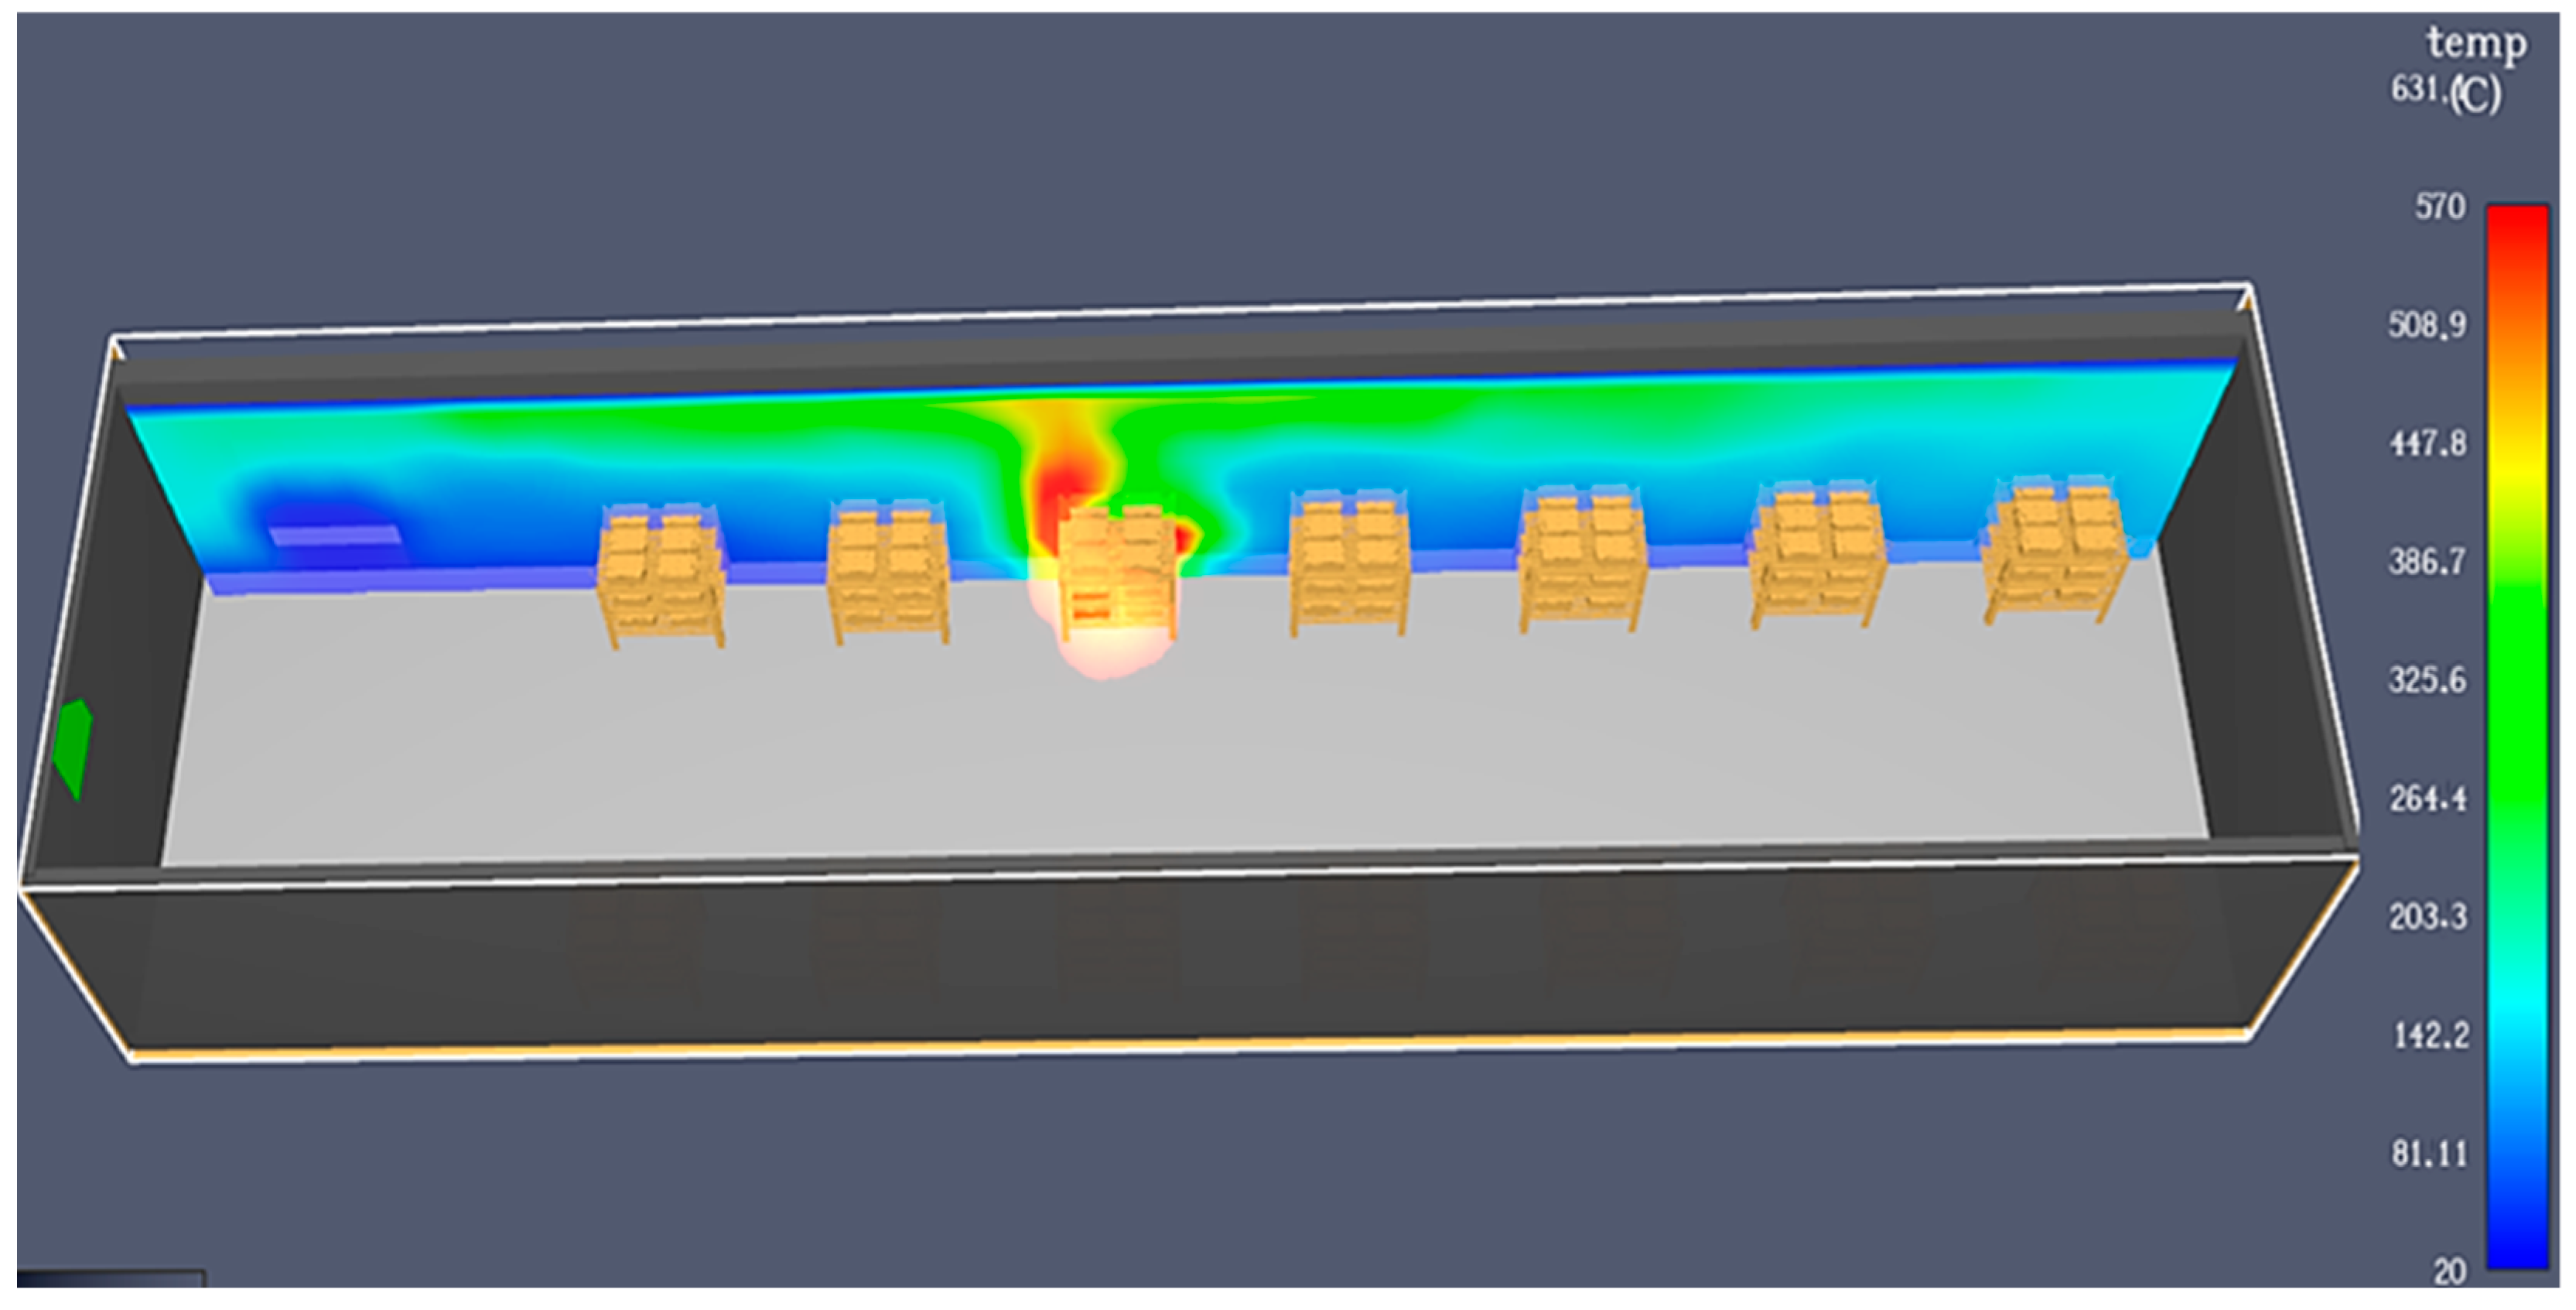
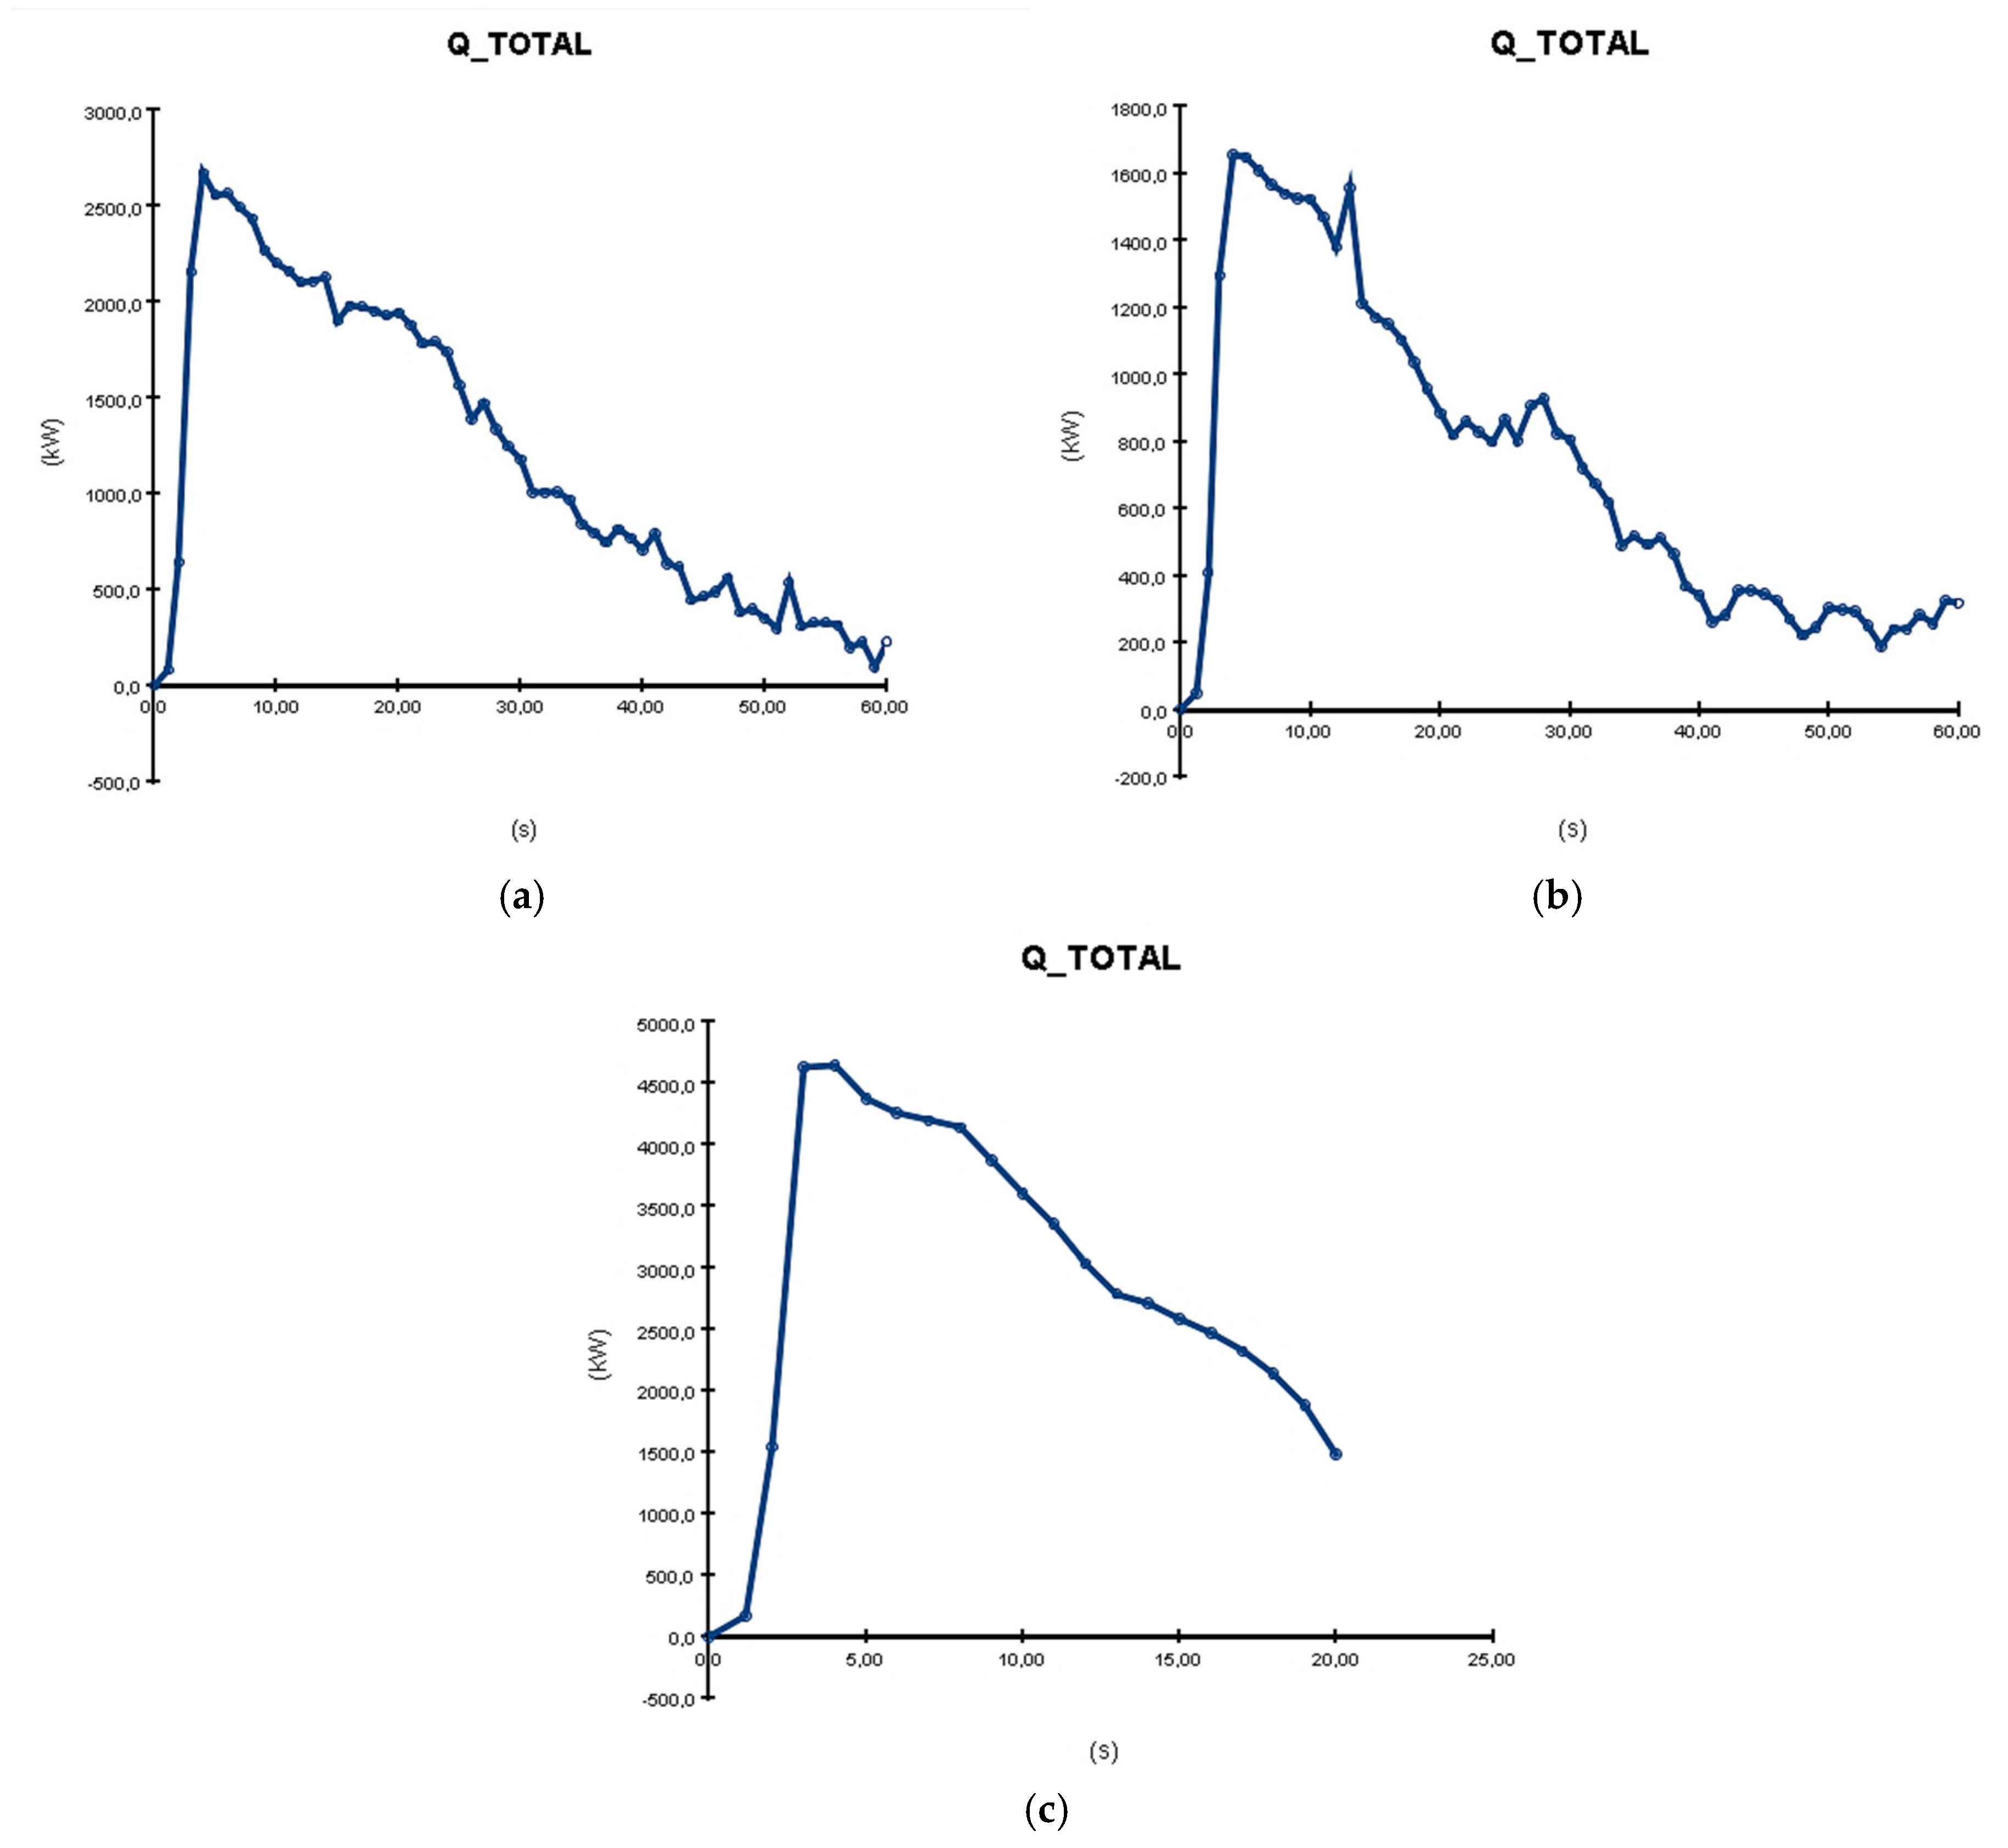
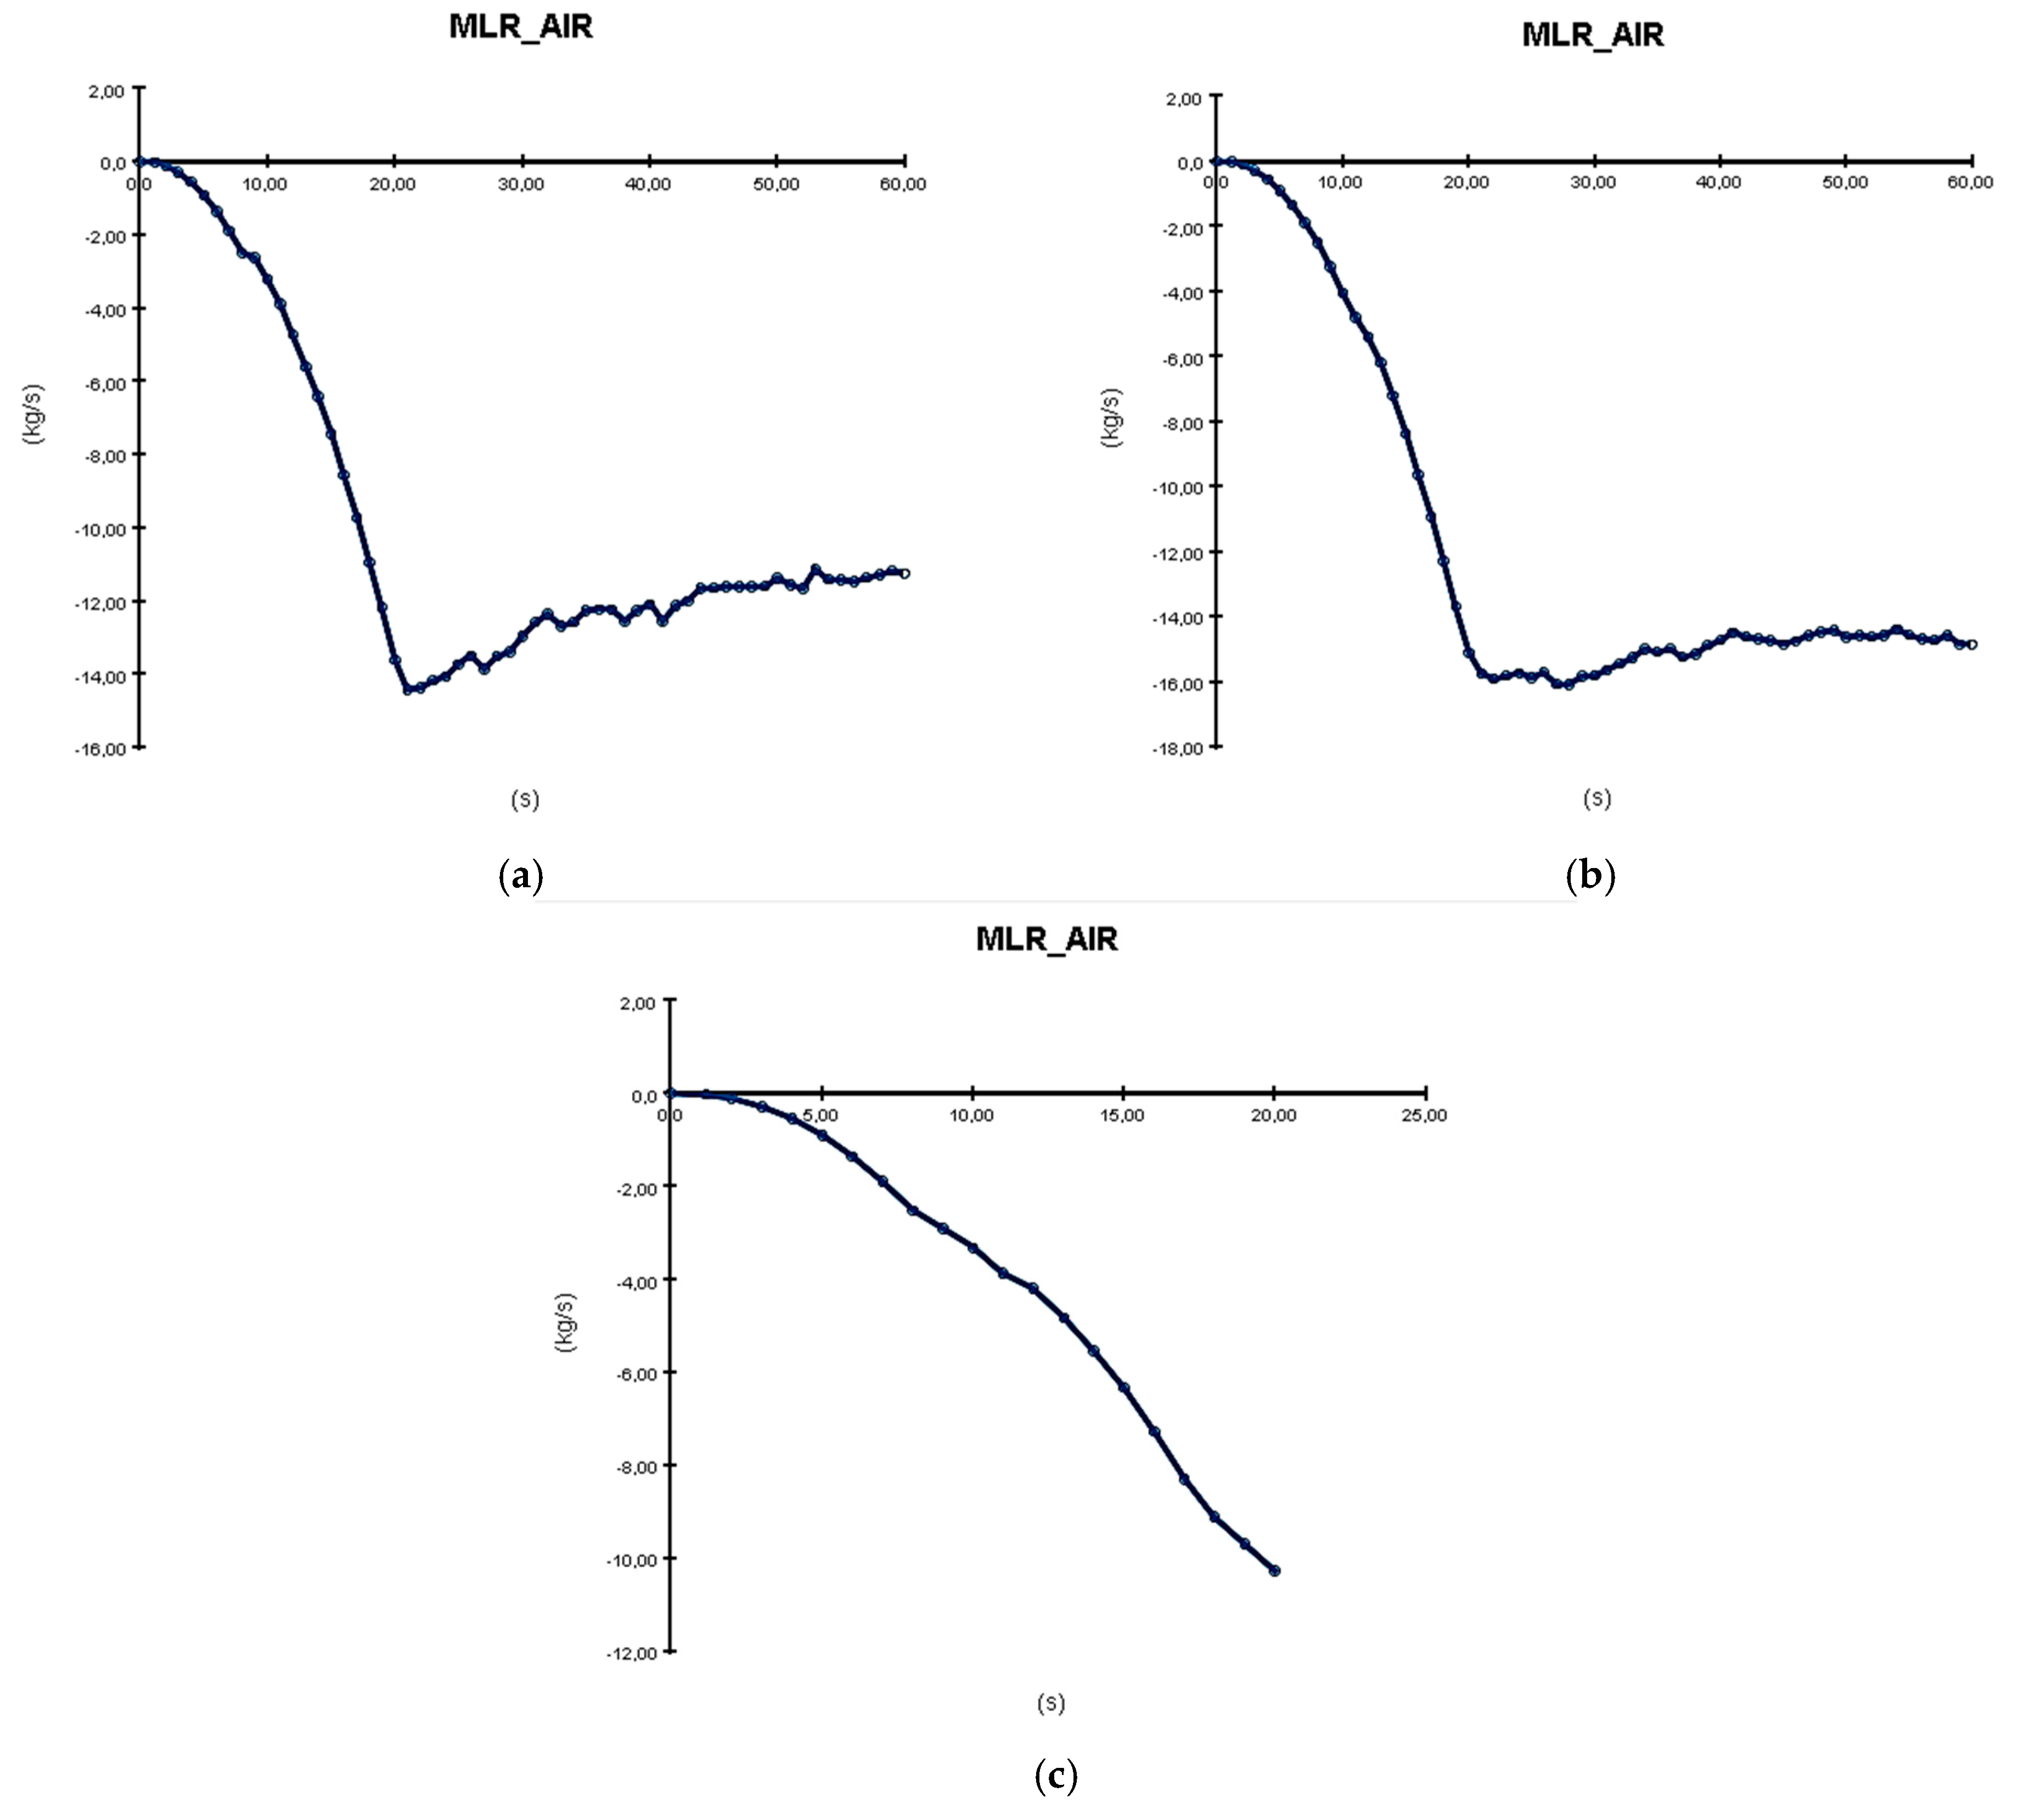
3.2.1. Fire Risks in the Battery Formation Process—In Open Air, on Shelves

As the name suggests, the batteries are placed on metal shelves, connected with cables for electricity transfer, and cooled solely by airflow, as shown in the 3D model in Figure 6.
This process is the slowest, and due to high temperatures, various complications can occur. The cooling method can cause the temperature to rise quickly, leading to fires if there are any process problems, especially in the summertime when outside temperatures are also high. For example, if one of the batteries has electrolyte level problems (a lack or low level) due to the filling process or other causes, the temperature in the problematic cell will rise significantly due to the applied electrical current. The plates come into contact due to grid growth and separator wear, generating short circuits. The battery box and lid will slowly melt and eventually burn. If the fire is not quickly detected, it will spread to other batteries through the air or connection cables, as shown in Figure 7.
An internal battery defect due to manufacturing processes, such as short circuits or interruption problems, can cause sparks, local heating, water loss, and gas release, resulting in the same effects as described above. Moreover, because the gases generated during the formation process are oxygen and hydrogen, any spark or fire can cause the battery to explode, increasing the fire’s intensity and propagation. This can cause significant trouble and injuries to firefighters, as the hot and corrosive electrolyte is splashed around the area. The smoke is also dangerous for workers and firefighters.

3.2.2. Fire Risks in the Battery Formation Process—Formation in Tanks with Water Cooling

The batteries are placed in special tanks made of stainless steel or plastic base materials. They are connected to each other and to the chargers with cables (series connection) and continuously cooled with water, as shown in the 3D model created in PyroSim (Figure 8).
Water pumps are used to continuously recirculate the water. These pumps are computer-controlled using information from the PLC, level sensors, and temperature sensors. The water is supplied from the municipal network or the internal neutralization station. While this process ensures good cooling and involves water, making it theoretically safer from a fire risk perspective, problems can still occur. If the cooling process fails, the water level is inadequate, or the batteries have internal defects or level issues as previously described, a fire can still occur, as shown in Figure 9.
Additionally, in this process, the “foaming phenomenon” can occur on the water’s surface, causing electrical contact between the positive and negative battery terminals through the foam, leading to lids melting or burning, fire, and even explosions. Other problems can arise after the formation process, during battery resting (e.g., on weekends), with or without the water drained from the tanks. If one or more batteries have internal defects (usually a short circuit), especially if the tanks are made of plastic, fires can occur. Similar to the previous case, the plastic materials used in battery construction can cause the fire to escalate quickly, leading to explosions and splashing, which are dangerous for operators and firefighters. Usually, the fire is isolated to one formation tank, but without a proper response, it can spread to others. The smoke is also hazardous.

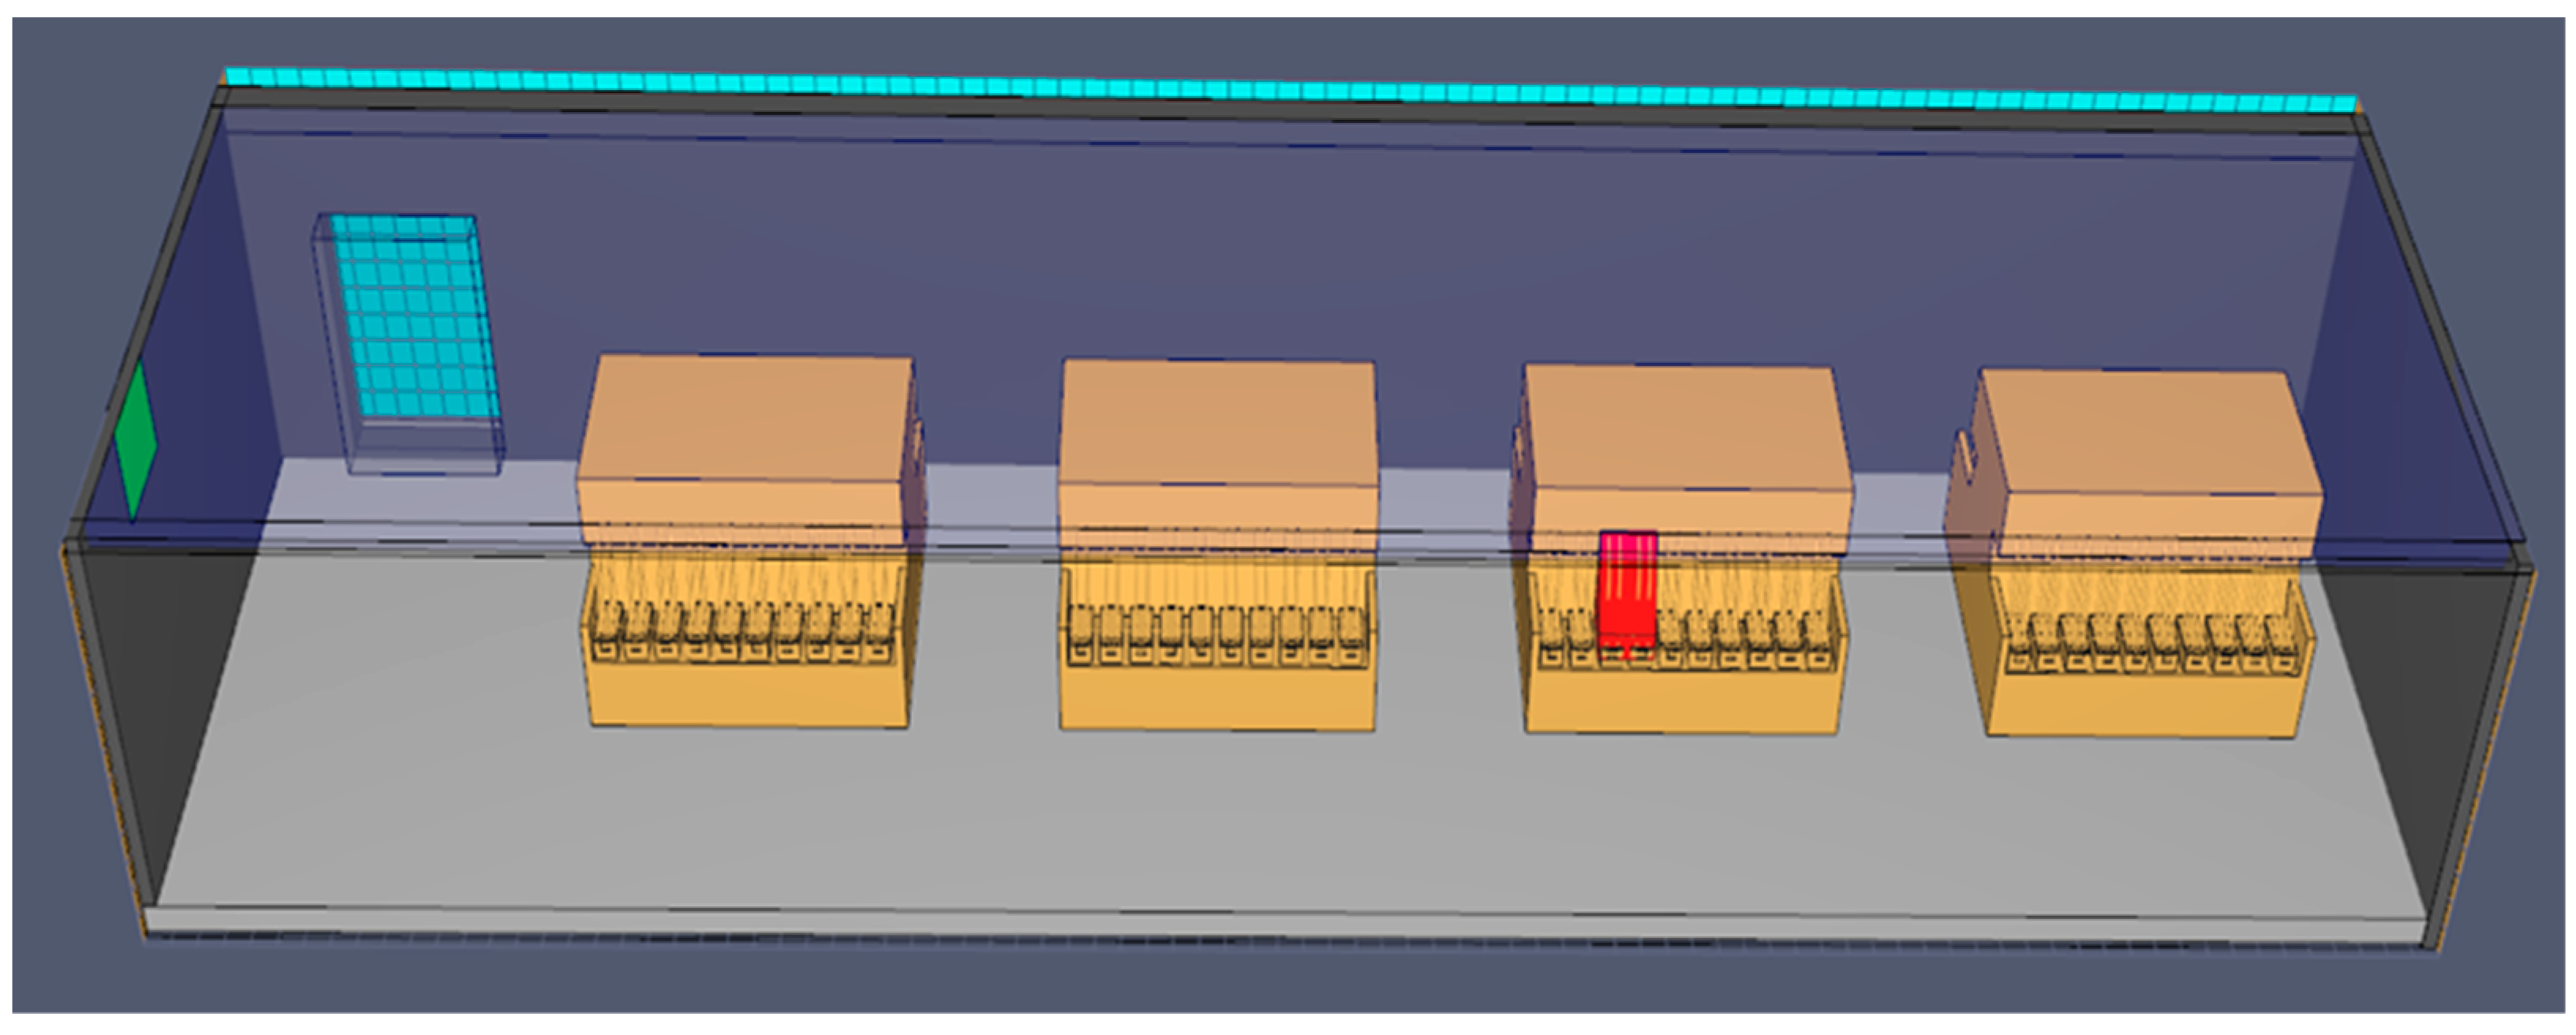
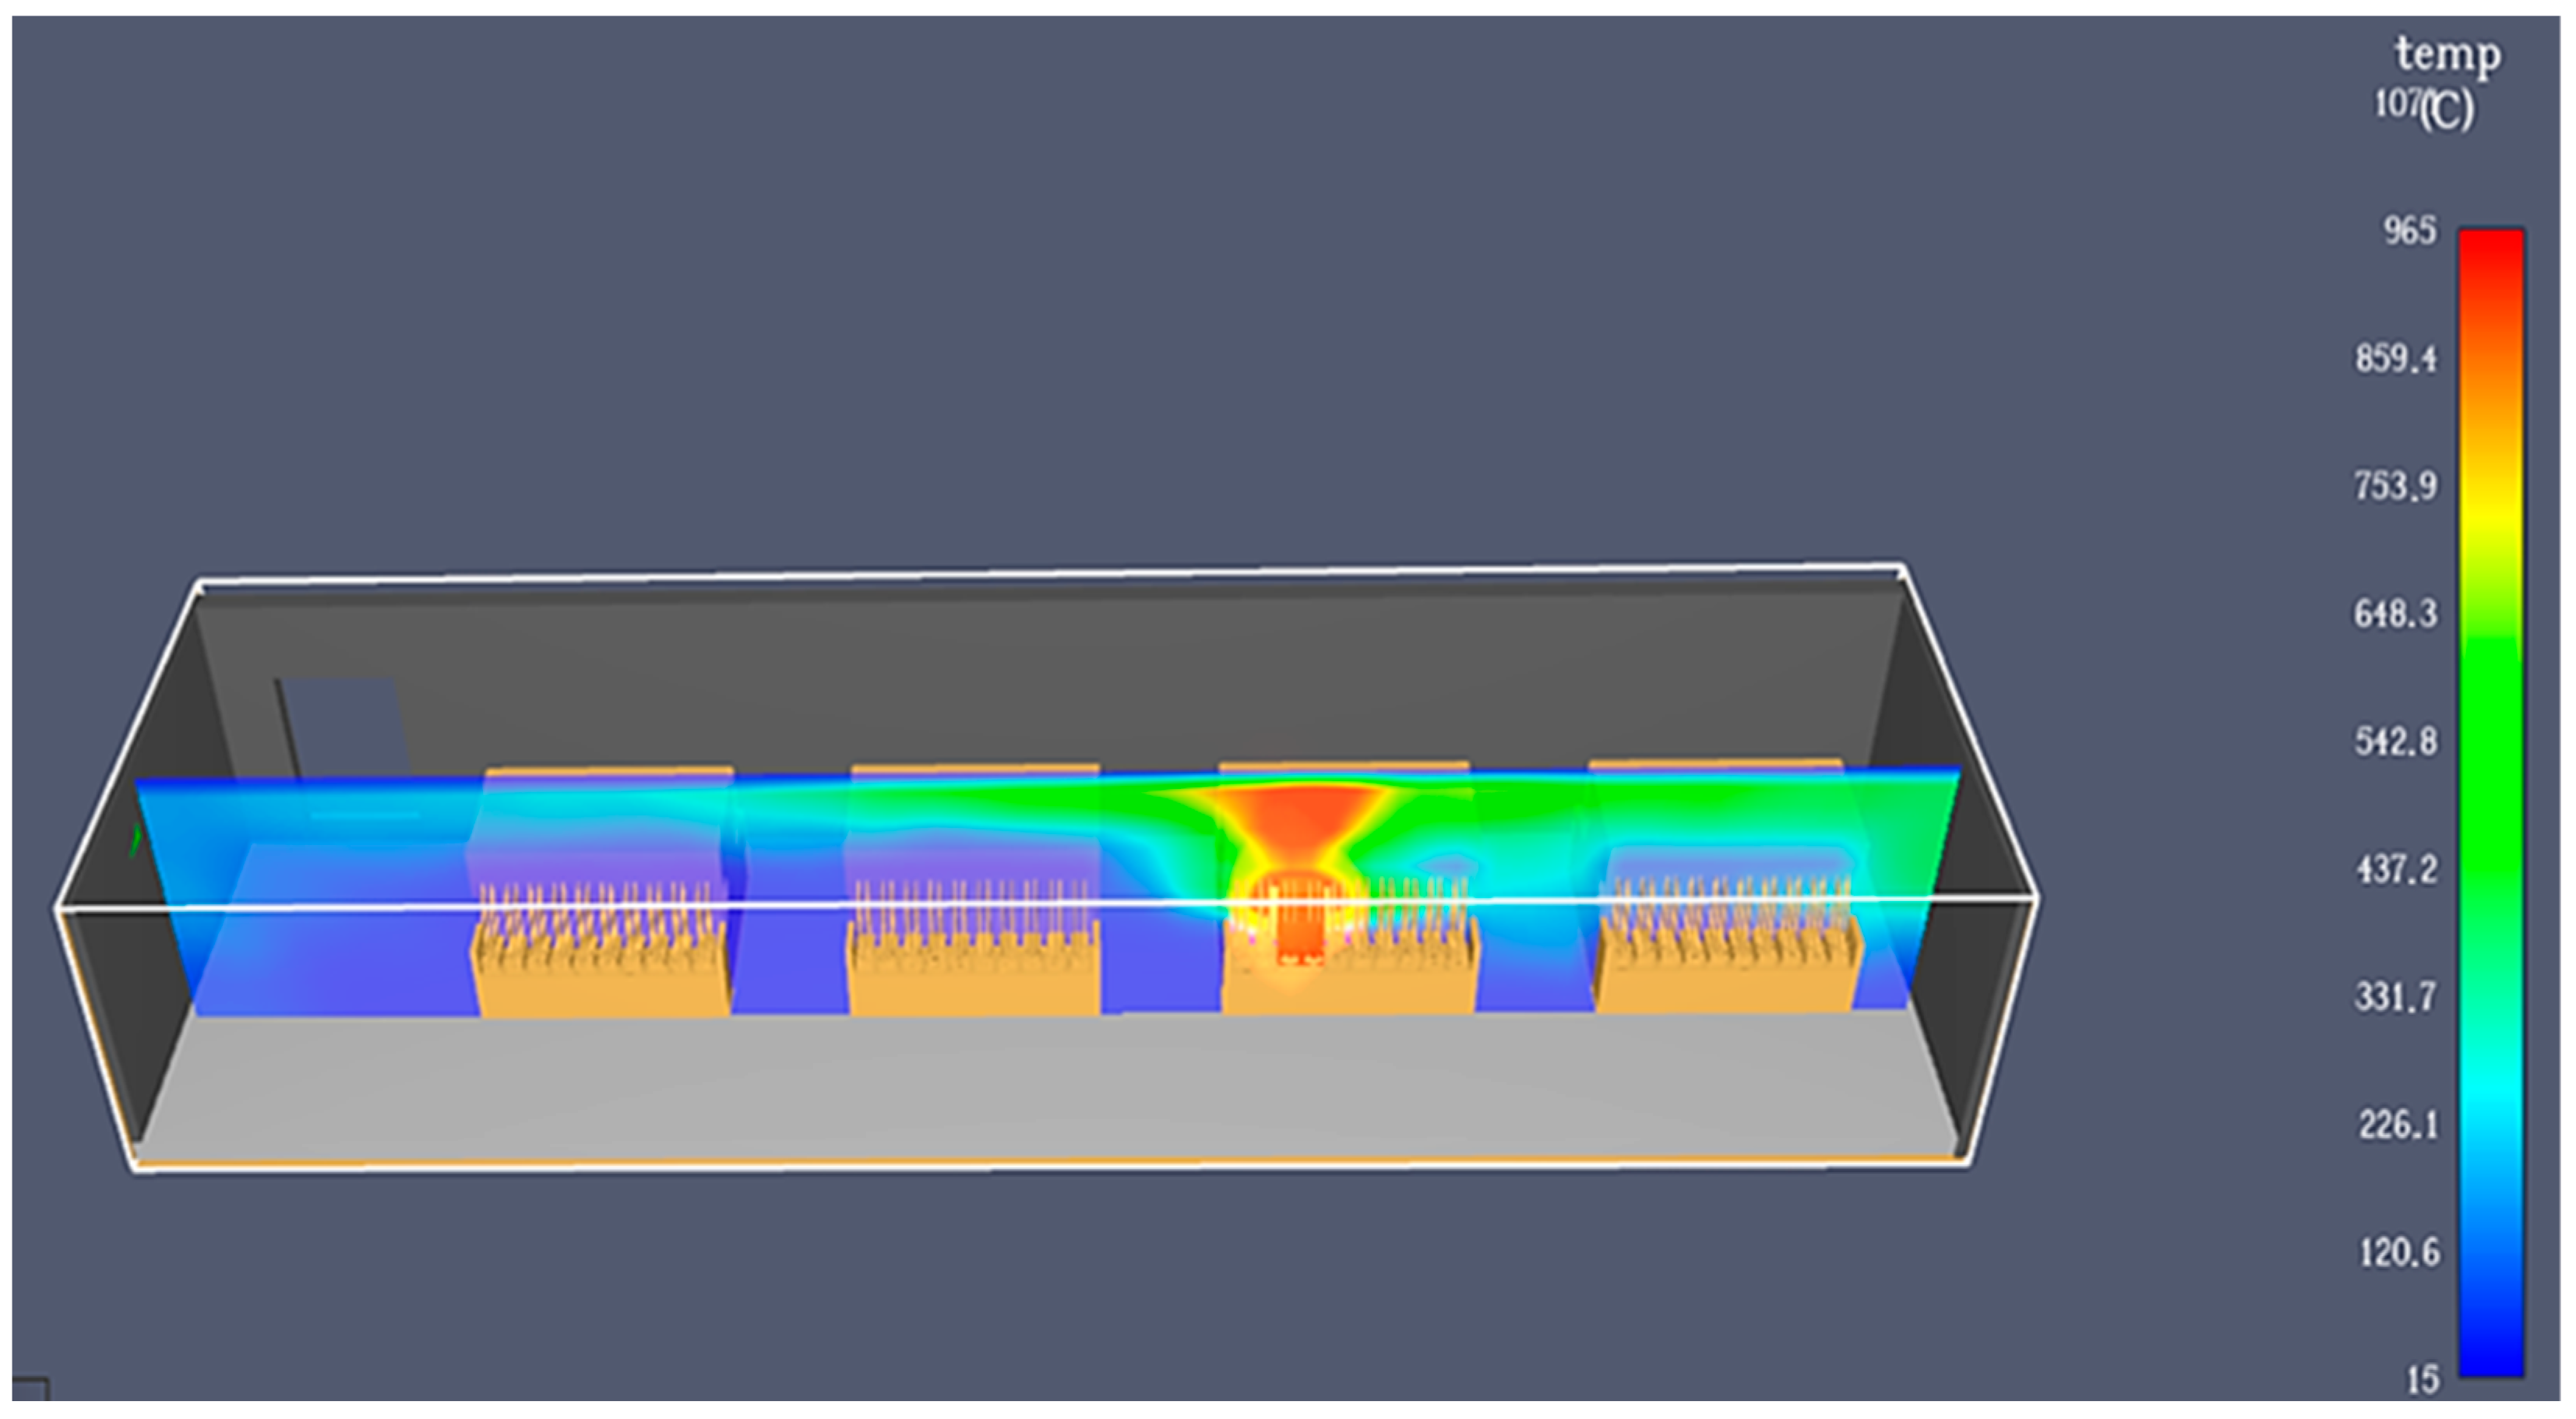
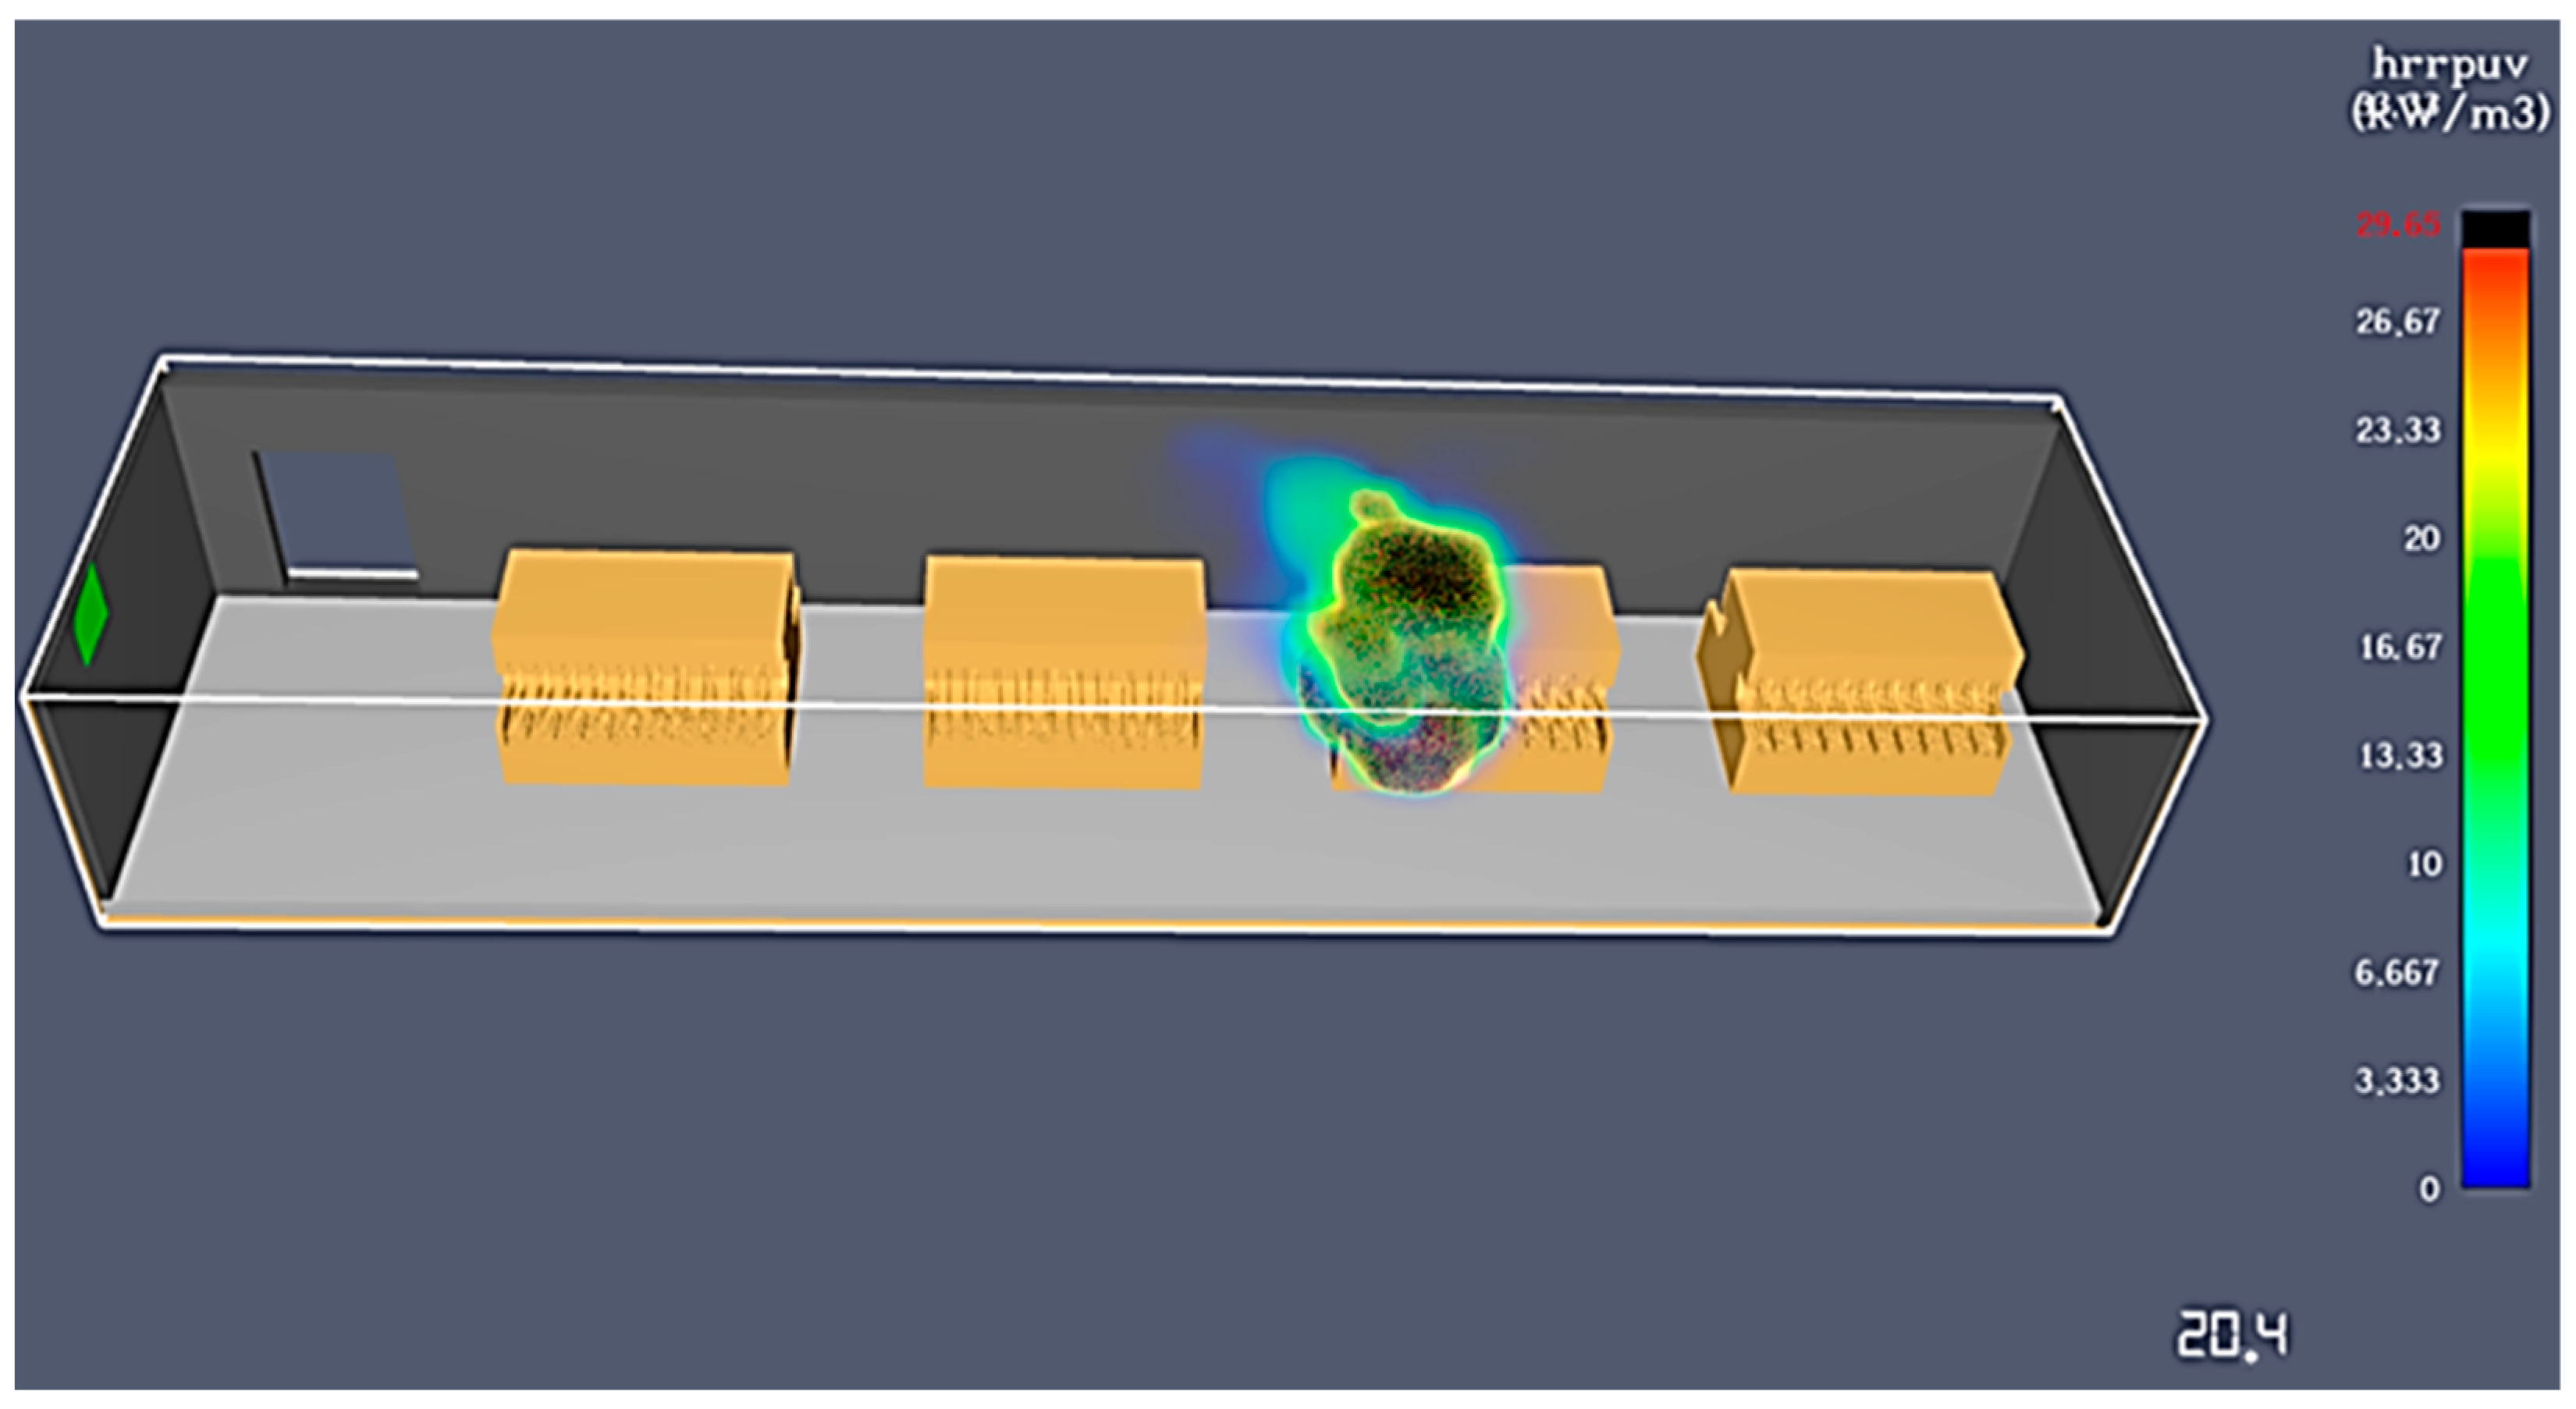
3.2.3. Fire Risks in the Battery Formation Process—Formation with Electrolyte Recirculation

This is the most advanced formation process today, but it is also the most challenging from a fire safety perspective. The batteries are placed in modules integrated into the formation cell, as shown in Figure 10. They are connected with cables for electricity and hoses to the acid recirculation system. The electrolyte is continuously recirculated using special pumps and a tank to ensure cooling and cleanliness.
Most of the components of the formation modules are made of plastic and rubber because they need to resist the corrosive effect of the electrolyte. Unfortunately, this also facilitates the propagation of fire. If there are batteries with electrolyte level problems, including issues caused by the recirculation system (such as clogged hoses), excessive heating can occur, causing the battery lid to ignite. The fire spreads rapidly due to the connecting hoses, which conduct it to the top of the module and the rest of the batteries, as shown in Figure 11.
Due to the various plastic-based materials used in the modules’ construction, fires can spread quickly. If not detected urgently, the consequences can be disastrous, which is why every manufacturer using this technology takes precautions. Moreover, when the connection hoses burn and melt, a large amount of electrolyte leaks and splashes onto the floor and factory. Similar to the other two processes, explosions can occur, but in this case, the electrolyte splashing can make the firefighters’ work harder. The smoke is also dangerous for the workers.

3.2.4. Fire Risks in the Lead Oxide Manufacturing Process

Depending on the type of lead oxide desired, various methods are available. The process usually involves a rotary mill loaded with lead cylinders or slices. The lead parts are introduced into a spinning metal drum, and due to the friction between them, a thin dust of oxide is generated. This dust is then aspirated into tanks based on the airflow introduced from outside. The airflow, containing oxygen and water, plays a role in the superficial oxidation of the lead. If rough lead particles with a lower oxidation grade are generated and aspirated by the airflow, an exothermic reaction can occur due to the humidity and air, causing the filters to burn. This is specific to mills with low-grade oxidation processes. The fire remains inside the mill, typically damaging only the filters and lead oxide, and usually does not spread outside. Modern mills use an automated and controlled process of water supply and oxygenation that theoretically prevents fires, though small, localized fires can still occur. Because this risk is considered very low and the effects are not significant, only causing material damage, we decided not to treat it the same way as the other three cases above and not to perform a 3D simulation. We applied the same reasoning to the next risk as well.

3.2.5. Fire Risks in the Auxiliary Processes

Separate from the manufacturing processes, there are also places with fire risks. These are linked to auxiliary processes, one of which is the vent system that eliminates and filters the polluted air from the factory, especially from the lead oxide manufacturing area, pasting area, and assembly area. Special textile bags are used, which can generate a fire under certain conditions, such as when low-oxidized lead oxide dust accumulates, humidity is present, or small parts of the pasting paper are aspirated from the process. This can cause local fires and filter burning. The filters are located outside on the roof of the factory, and theoretically, the fire effects are reduced and limited to air quality and system efficiency.

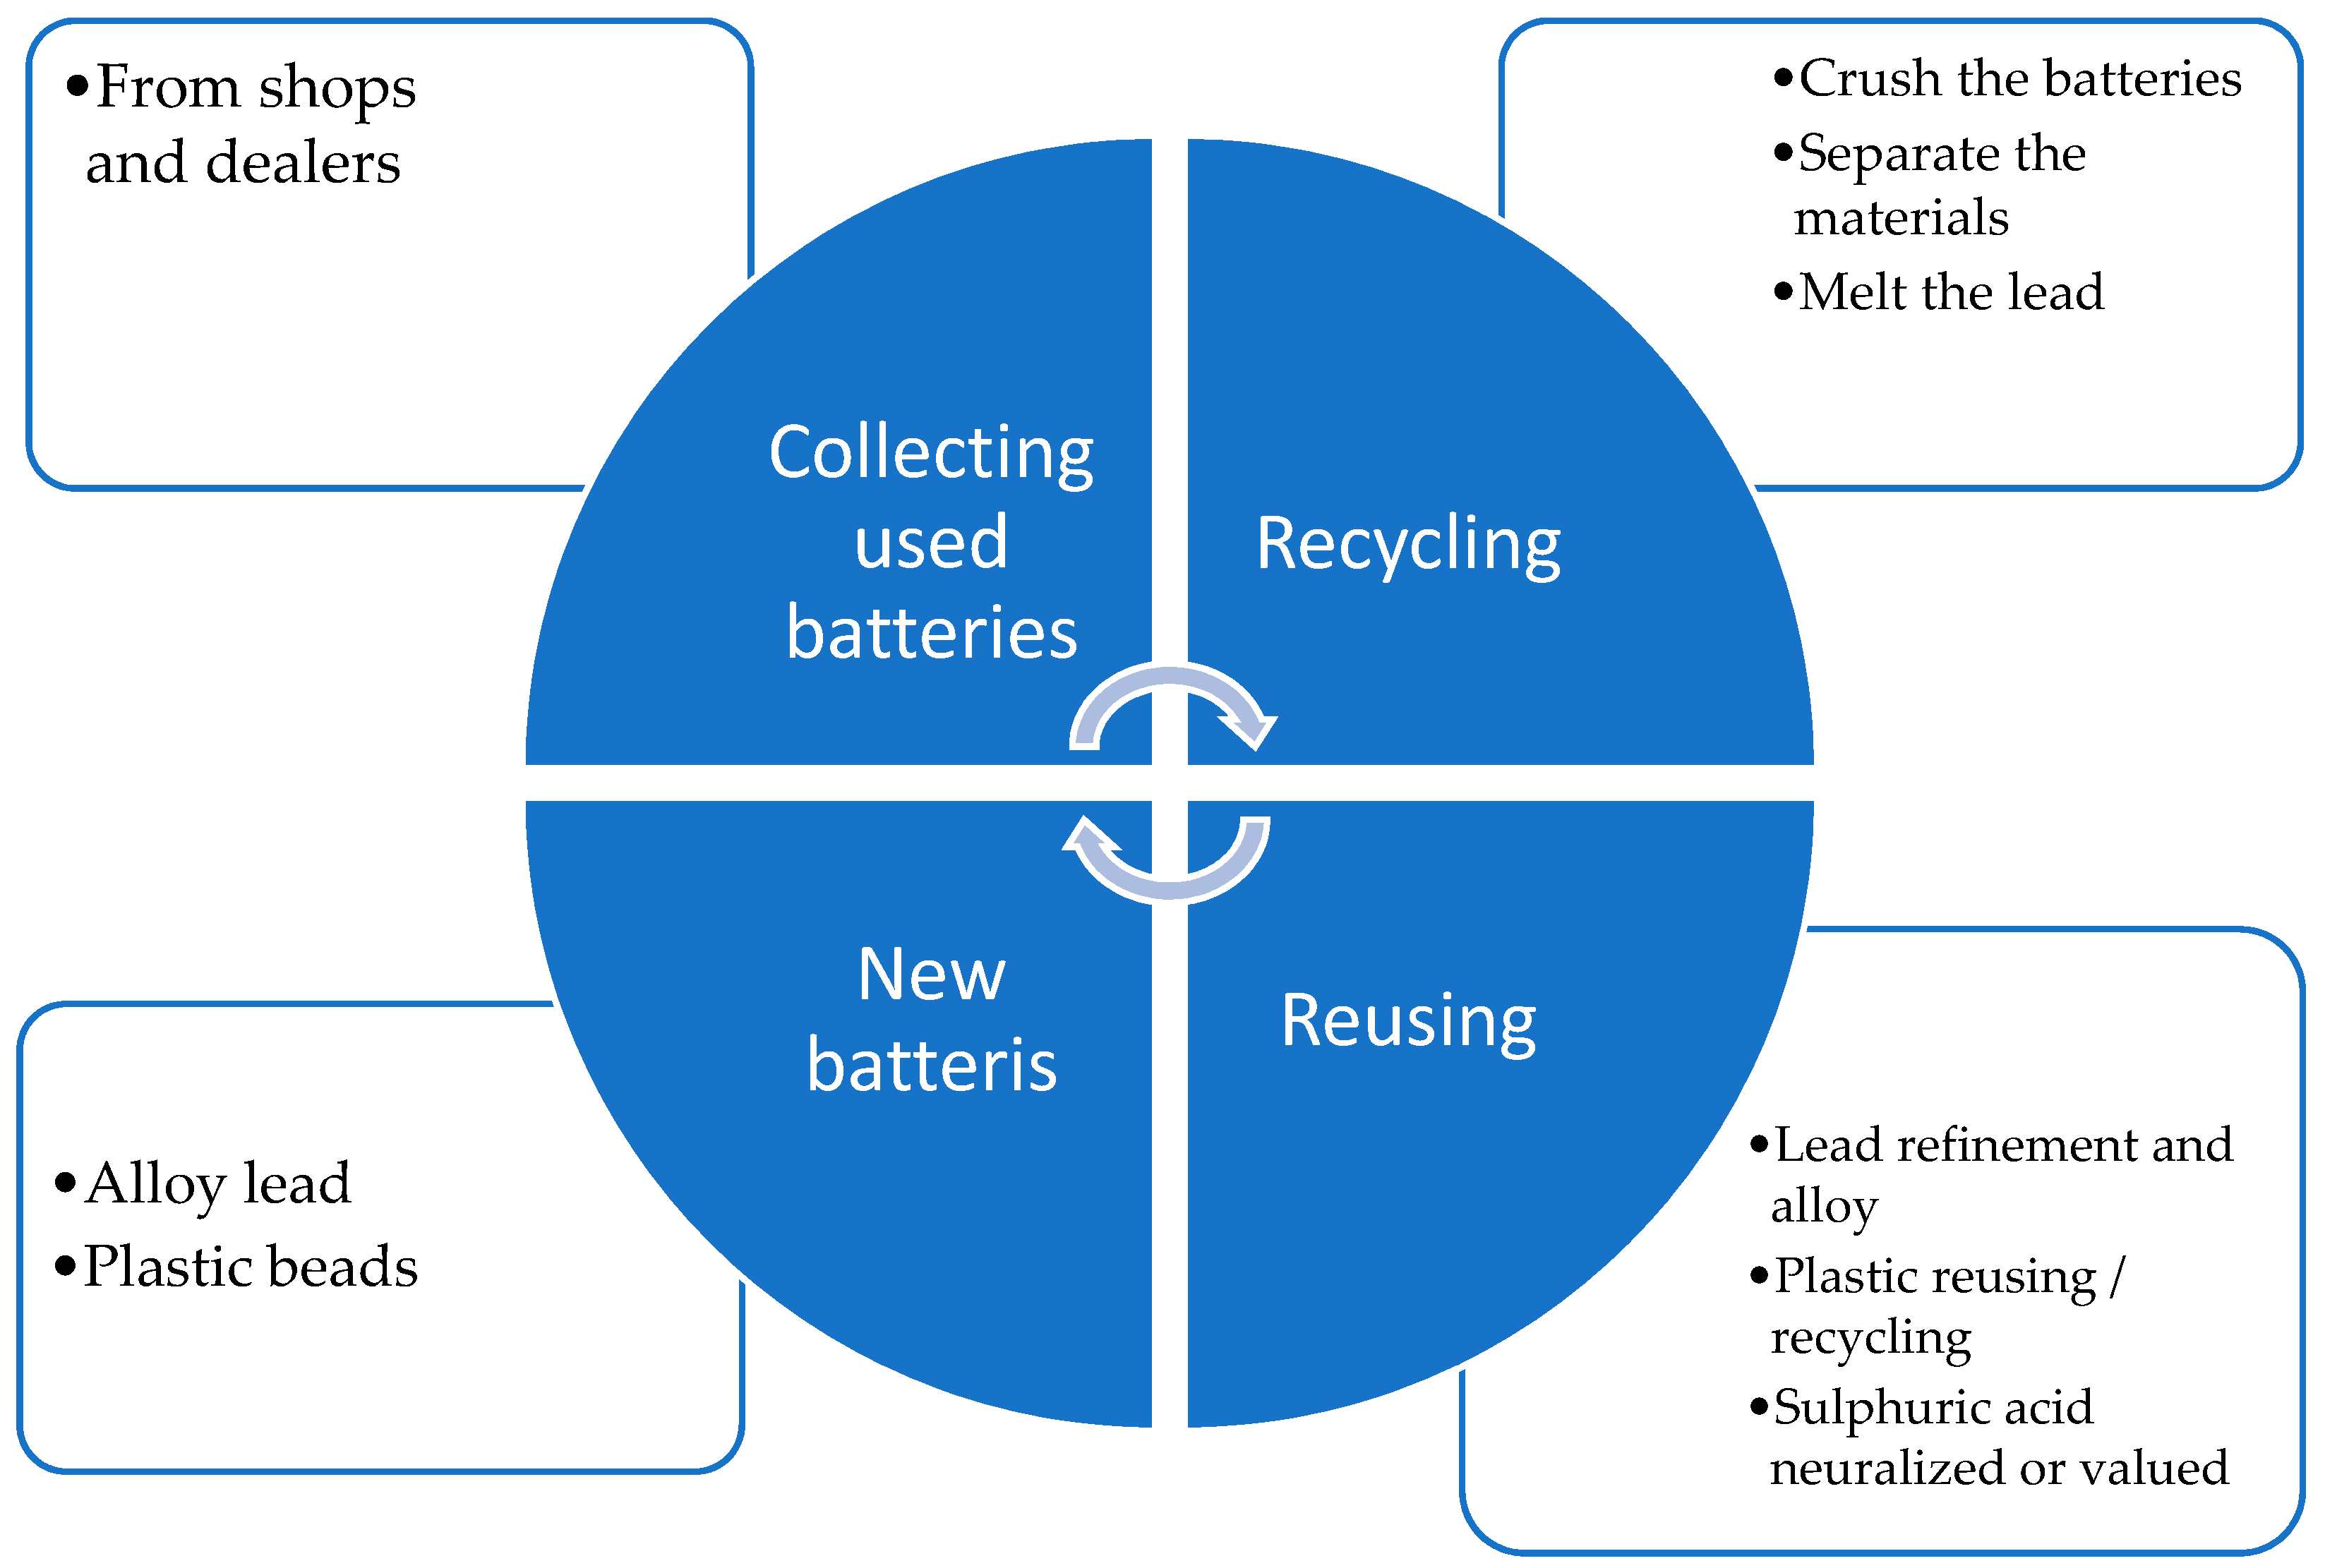
3.2.6. Fire Risks in the Recycling Process
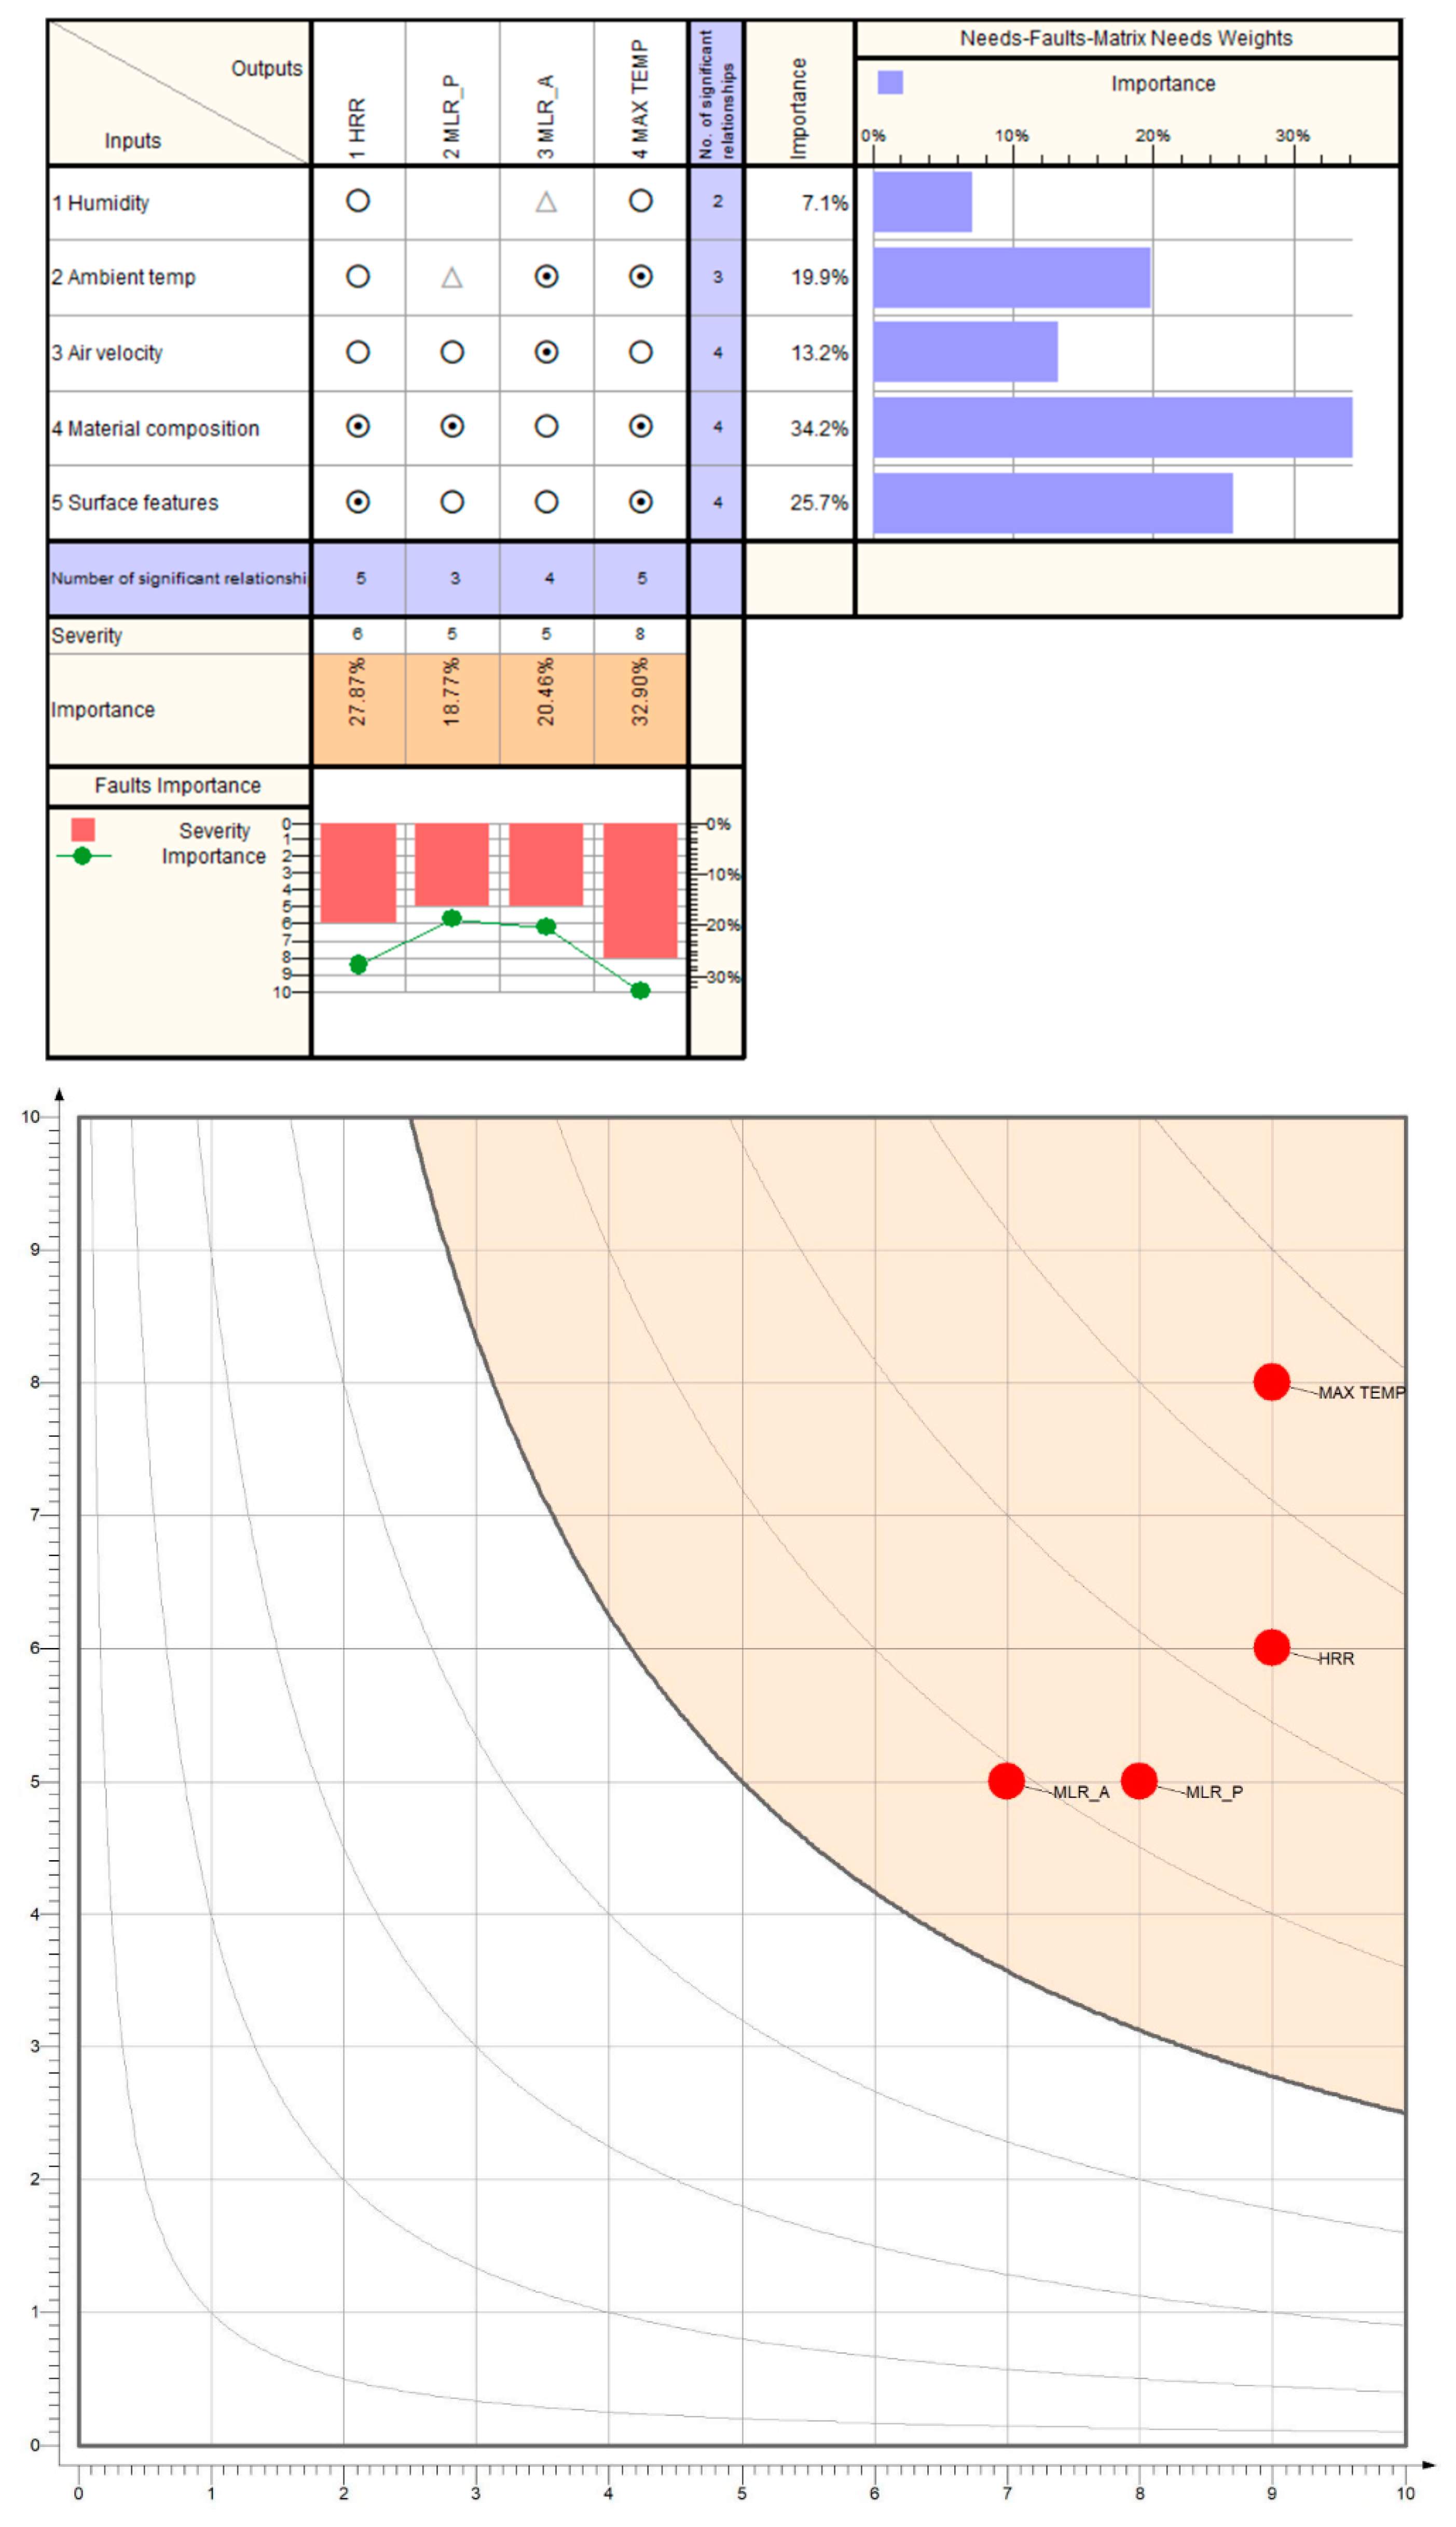
The recycling process is quite safe from a fire perspective because there are strict regulations and supervised processes. Scrap batteries (out of use) are collected from the market by authorized distributors. The batteries are stored in dedicated containers that prevent leakage, usually made of plastic-based materials. Transport from dealers to the recycling factory is performed according to legislation and only by companies that hold environmental licenses. Only trucks equipped with ADR (Agreement concerning the International Carriage of Dangerous Goods by Road) certification are allowed to carry the scrap batteries. The route of the truck must be declared to the authorities and strictly followed. Because most of the scrap batteries are discharged or deeply discharged, the voltage and current values are low, resulting in a very low risk of fire during storage or transport. According to our experience (more than 10 years), no incidents have been reported in Romania directly linked to batteries as the root cause. As a precaution, to prevent any short circuits or possible fires, new batteries that are fully charged must have terminal protections (made of plastic), should be stacked in a vertical position to prevent leakage, and properly wrapped.
As we mentioned, the batteries have an 85% recycling rate for the materials they are made of, and specifically, the lead can be recovered at a rate of up to 99%. At the recycling unit, the batteries are processed to give new life to future batteries, as shown in Figure 12.
The first step is unloading the batteries from the truck directly into a large collector. To prevent any fire risks, continuous watering is implemented. Using a conveyor belt, the batteries are transported to a mill that crushes them. There is a risk of fire if lithium- or nickel metal-based batteries arrive at the mill, because they can explode and catch fire. The damage could cause a prolonged production breakdown and high repair costs. The easiest and cheapest way to prevent this is to collect the batteries very carefully and strictly. To ensure this, the collectors are trained, and handbooks can be prepared for them. For some batteries, metal detectors installed on the conveyor might be sufficient for detection, but they are not 100% effective. We suggest implementing a robust action plan that involves AI technologies to detect battery types. Cameras can be used to detect labels and battery shapes, and X-ray detectors can also be employed. The solutions must be adapted to the company’s budget because complex ones, such as those involving X-rays, can cost over 1 million Euros.
The materials are separated by the mill and transported separately using special conveyors to the next steps. The lead parts (plates, terminals, etc.) are transferred to a rotary furnace that melts them at 1100 °C. The lead is then refined to achieve 99.98% purity and used to create alloys such as lead–calcium and lead–antimony. The casting machine creates ingots of these materials, which will be used to manufacture new batteries.
At this step, fires can occur if water meets the hot melted material. This will react and may even cause explosions. To avoid this, the process should be supervised, and any unauthorized actions should be prevented. The box and lid of the battery are ground, and the resulting material is reused in other battery parts or sold for use in other industries. Sulfuric acid is neutralized or repurposed in other industrial fields. To avoid any operator injuries, the processes that involve crushing and hot materials, such as melting and casting, are automated. For other processes, the operators are properly equipped with PPE (personal protective equipment) like dedicated visors, gloves, aprons, etc.

4. Discussion

4.1. Discussions of the Case Studies

Based on a theoretical analysis and validation case studies, the most hazardous formation process used in the company, from a fire perspective, is formation with electrolyte recirculation. This is also confirmed by the 3D simulations. The comparative analysis starts with the input data and conditions used for the three simulations:
  • The same surface of the manufacturing area: 26,000 × 6200 × 4000 mm3 (L × W × H);
  • The same type of batteries: Heavy Duty batteries, C type (M16);
  • The same battery box and lid materials: polypropylene;
  • The same simulation end time: 60 s;
  • The same ramp-up time on the burning area: t2 = 20 s;
  • The same Heat Release Rate Per Area: 1000 kW/m2;
  • The same maximum air debit of the exhaust system: 15 m3/h;
  • The same geometry of the vents: circular with a radius of 200 mm;
  • The same position of the vent;
  • The same positions and dimensions of the access doors—important for the air flow.
In all scenarios, the building is equipped with exhaust systems, and the ambient temperature is not taken into account, as the only process that can involve higher ambient temperatures is formation on shelves. Other parameters, such as humidity, influence only the lead-oxide process and auxiliary processes where they can truly cause problems—see Section 3.2.4 and Section 3.2.5. Humidity is problematic for lithium-based batteries, but in the case of lead-acid batteries, it does not have a significant effect on fire hazard. We chose the parameters to provide proper results that can be adequately compared and to ensure that the simulations can be performed in a reasonable time. The time needed can vary from minutes to hours, depending on the inputs. Of course, there are also differences based on the process specificity, such as the following:
  • Cooling type: with air (natural flow)/with recirculated water (in tanks)/with recirculated electrolyte;
  • Burning surface: complete battery and neighbors/the part of the battery from the water surface/the battery, the neighbors, the connection hoses, and the formation module;
  • The position, the arrangement of batteries, and their number in the production area.
However, the process conditions are specific to each formation process. Due to this specificity, there can be a larger or a smaller burning area, the materials around the batteries are more or less flammable, the amount of the batteries could be different, etc. For example, in the case of tanks cooled with water, the fire cannot go under the water and will arrive in a longer time to the neighbor batteries, but in the case of the other two formation processes the batteries are on shelves, without any water around, and more batteries stay together, thus heightening the risks, etc.
For a clear overview of the 3D simulation results using PyroSim, we decided to perform an analysis using graphs and diagrams, as seen in Figures 13 and 15–17, and numerically in Table 1. As shown in Figure 13a–c, the Heat Release Rate resulting from the burning process varies between these three types of processes. The most hazardous is formation with electrolyte recirculation (almost 2000 kW), while the least problematic is formation in tanks cooled with water (almost 400 kW).
Moreover, the graphs show a quick increase in the HRR in the first 20 s and a stabilization, with small variations around the maximum value, for the cases of formation in tanks cooled with water and on shelves. However, in the case of formation with electrolyte recirculation, there is a quick increase up to 20.4 s, when the maximum value is reached, and the battery material is completely burned, leaving no lasting effects, as seen in Figure 14.
Another relevant graph represents the total quantity of heat released (Q_TOTAL) during burning, as seen in Figure 15. All three graphs show a very quick increase in the parameter in the first 5 s, followed by a decrease with small variations until the end of the simulation. In this case, the formation with electrolyte recirculation has the highest value (4500 kW)—almost double compared with the one on shelves and almost triple compared with the one in tanks cooled with water. Similar to the HRR case, the process stops at 20 s and about 1500 kW. The other two processes have smaller values at the end, around 200–300 kW.
In the graphs from Figure 16, the Mass Loss Rate (MLR) of the battery material selected as combustible (polypropylene) is analyzed. This presents the amount of material burned per second. As shown, in the case of formation on shelves (a) and in tanks cooled with water (b), there is a loss of material in the first 15 s, followed by a linear loss until the end of the simulation. However, for the formation with recirculation, there is a continuous mass loss that suddenly ends at 20 s because the entire material is burned. The lost mass value differs for all three processes, with that of formation with electrolyte recirculation being three times greater than that of formation on shelves and almost double that of formation in tanks cooled with water.
The amount of material burned per second indicates how quickly the batteries and surrounding materials will ignite. This helps stakeholders understand the potential speed and devastation of the fire’s spread. It is also crucial for determining response times and intervention strategies.
The last analyzed parameter is MLR_AIR (Mass Loss Rate for Air), based on the graphs from Figure 17. This represents the volume of air from the manufacturing building that is lost per second due to the burning process, which is why the values in the graphs are negative. As shown in the case of formation on shelves (a) and in tanks cooled with water (b), there is a quick air mass loss in the first 20 s, followed by an almost linear loss around −12 to −14 kg/s until the end of the simulation. In the case of formation with electrolyte recirculation, there is a linear air loss that stops at 20 s, similar to the other parameters monitored. The mass loss at the end of the simulation is almost the same for all three types of formation, about −10 kg/s, with the difference being smaller than in the other cases. The Mass Loss Rate has two components: the materials involved in the burning process and the air. The amount of the material that is burned per second shows how quickly the batteries and materials around will burn. This will help the stakeholders understand how quickly the fire can expand and how devastating it can be. Also, this is very important for response time and intervention. Air loss is important for the risk of harm to operators and the propagation of dangerous gases resulting from the burning.
PyroSim software provides several graphs at the end of the simulation regarding the pressure values at different workspace points, as well as other heat and material losses. The minimum and maximum values of these parameters, along with other important values, are presented in Table 1.
The inferences based on the graph analyses from Figure 12, Figure 14, Figure 15 and Figure 16 are confirmed by the data from Table 1. The battery formation process with electrolyte recirculation is the most hazardous from a fire perspective, followed by formation on shelves with air cooling.

4.2. Discussions of Fire Safety Regulations

In Romania, fire safety legislation is primarily governed by Law No. 307/2006. This law sets the legal framework for preventing and managing fires, including measures and obligations for building owners, business administrators, and other entities. Other laws include Law No. 481/2004 on Civil Protection and Emergency Ordinance No. 21/2004. As can be seen, the regulation has not been updated over time, but the processes have become more and more complex.
The international standards regarding fire safety include the EN 54 series [22,23,24,25], ISO 45001 [26] (not directly linked), and the previous OHSAS 18001 [27] (not directly linked). The EN 54 series is a comprehensive set of European standards that cover various aspects of fire detection and fire alarm systems, such as control and indicating equipment, fire alarm devices, power supply equipment, heat detectors, smoke detectors, manual call points, voice alarm systems, and visual alarm devices.
According to these laws and standards, companies have to adopt preventive actions such as the following:
  • Performing periodic training for all employees, based on working procedures and safety regulations;
  • Conducting practical exercises with employees;
  • Designing evacuation plans and making them available in all rooms;
  • Installing emergency lighting;
  • Installing manual triggers and alarm systems
  • Installing fire and smoke detection systems, depending on the company type and size;
  • Installing fire extinguishers on all floors and in all production areas;
  • Installing vents for smoke control;
  • Installing automated fire-extinguishing systems (mandatory only for large companies);
  • Installing fire hydrants (mandatory only for large companies);
  • Having their own firefighting team (mandatory only for large companies);
  • Hiring dedicated and qualified employees in charge of fire safety.

5. Conclusions

Risk assessment in automated processes within automotive companies involves facing dynamic risks, as we presented in the current research focused on analyzing fire risks. This study addresses fire risks in lead-acid battery factories by using case studies and simulations to identify hazardous areas and analyze the main causes, effects, and outcomes. Fire risk is one of the most hazardous risks because its effects can be catastrophic, involving material loss, human injuries or deaths, and even company bankruptcy in extreme cases, if the company lacks appropriate resilience plans.
Avoiding fires in lead-acid battery manufacturing is challenging, and the fires are also difficult to control if they are not quickly detected in the initial phase. The regulations provide a generic set of rules, but to ensure proper fire safety, companies should identify specific risks as accurately as possible and adopt appropriate actions. Therefore, our recommendations for companies wishing to adopt efficient preventive actions include the following:
  • Automated fire management systems;
  • Fire sensors for smoke detection in problematic areas—these sensors send a signal to the fire management system and trigger an alarm at the fire station;
  • Thermal detection cameras connected to the fire management system—these issue an alert when maximum temperature values are exceeded and are useful for formation with electrolyte recirculation;
  • Water temperature sensors—useful for formation in tanks cooled with water;
  • AI systems for fire detection in the initial phase;
  • Automated fire-extinguishing systems mounted on the ceiling.
The cost may be a problem for smaller manufacturers, but when comparing these costs with the costs of the resulting effects in case of a fire, such as manufacturing breakdown, replacing the formation cells and annexes, the lack of delivery to car manufacturers, and rebuilding the formation in extreme cases, the cost of automation will be lower. Moreover, some basic solutions that are not very expensive can be adopted with a smaller budget, such as temperature sensors, smoke detection sensors, and standard alarms.
This analysis is a comprehensive one, addressing qualitative issues through a safety audit, followed by the evaluation and quantification of risks for the hazardous areas and the implementation of robust actions based on immersive 3D visualization studies. For a proper analysis and risk mitigation, we recommend that companies use and combine classical methods, both qualitative and quantitative, as listed in the ISO 31000 standard [28], with complex and modern instruments such as 3D simulations and AI.
The outputs, such as values, graphs, and videos with 3D simulations, are invaluable as inputs for management review, process and product development, and other analyses. Top management and other stakeholders can properly understand the risks and effects without needing special knowledge, making them more oriented toward and open to supporting the team in controlling and eliminating those risks. Using PyroSim or other 3D software, the risk manager can easily present the evolution of the fire, the influence of the involved factors and materials, the time of escalation, the losses, the resulting polluting gases, the visibility of the manufacturing area, the airflow, etc.
The authors’ recommendations regarding hazard identification and mitigation can apply to any kind of automotive company, including lithium-based battery manufacturers. Lithium-based batteries use very different technologies compared to lead-acid batteries. The manufacturing process, chemical technology, and cell types are different in lithium batteries. The most hazardous risk in lithium-based batteries is the thermal runaway phenomenon, and the problem is that containment is not as easy as with lead batteries. In this case, automated water systems are not suitable, because water can cause short circuits and other problems. However, our recommendations regarding fire detection in the initial phases can be successfully applied to lithium batteries as well.
Lithium batteries use complex technologies, some of which are more stable than others. For example, LiFePO4 cells are much safer from the perspective of thermal runaway risk than NMC batteries (Lithium Nickel Manganese Cobalt Oxide). In the future, we will consider expanding our research scope to encompass this area further.
The methodology presented is oriented towards the technical benefits of improving the fire risk assessment process, but consideration should be given also to the economic aspects that can influence investment decisions based on cost–benefit considerations. For the three types of formation presented, the mitigation of risk should include costs for the following: smoke detectors, thermal tracking cameras, fire suppression systems, personal protective equipment, smoke ventilation systems, fire extinguishers, chemical spill sensors, infrastructure upgrades (e.g., emergency showers, diversion channels), personnel training and drills, the overhauling of safety procedures, simulation and data analytics software, AI solutions, etc. For one production unit, the costs estimated by the company are ca. 1.5 million Euros over a period of 2 years, with 100,000 Euros/year operational costs for an active life of 10 years. However, the benefits of continued production and facility uptime, and avoiding medical and insurance costs for injured personnel, are estimated to be at least five times that value during the same period.
A cursory sensitivity analysis was conducted, using a modified correlation matrix combined with a risk analysis protocol, using Qualica QFD software, version 2.5. The most important input and output parameters of the simulations have been considered, ensuring their robustness and continued relevance (Figure 18). Based on industrial experience and the simulation findings, the analysis revealed that the most important inputs are related to material composition and surface features (summing ca. 60%) that influence the potential fire, while the most relevant outputs are related to the maximum temperature and the Heat Release Rate from the incident (also summing ca. 60%).
The second analysis, considering scores for impact, sensitivity and mitigability on decimal scales, classifies all the output parameters as being critical ones, which require intervention plans and the stabilization of inputs through environment control on temperature and humidity and material composition control through chemical and physical analysis of the raw materials.
We conclude that the approach presented in this paper is feasible because, by applying this methodology, we conducted a complex analysis of the risks in battery manufacturing companies. In this way, one can understand not only the causes but also their effects very well and offer recommendations to other similar companies. The risk hierarchization is much more accurate compared to current practices, and the mitigation actions are more efficient.

Author Contributions

Conceptualization, M.D.; Methodology, M.D.; Software, D.D.; Validation, A.Z.; Formal analysis, A.Z.; Investigation, A.Z.; Data curation, D.D.; Writing—original draft, A.Z., M.D. and D.D.; Writing—review & editing, A.Z., M.D. and D.D.; Supervision, M.D. All authors have read and agreed to the published version of the manuscript.

Funding

This research received no external funding.

Data Availability Statement

The original contributions presented in this study are included in the article. Further inquiries can be directed to the corresponding authors.

Acknowledgments

The authors would like to thank Thunderhead Engineering Consultants, Inc. for generously providing access to the PyroSim software for research purposes.

Conflicts of Interest

The authors declare no conflict of interest.

References

  1. Zinveli, A.; Tareq, S.; Popescu, S. Literature review concerning safety risk assessment in collaborative environments. In Proceedings of the 22nd International Conference of Nonconventional Technologies, Bistrita, Romania, 16–18 November 2023. [Google Scholar]
  2. Zinveli, A.; Dragomir, M. A case study in improving the safety of collaborative tasks in the automotive industry. In Proceedings of the 22nd International Conference of Nonconventional Technologies, Bistrita, Romania, 16–18 November 2023. [Google Scholar]
  3. Zinveli, A.; Dragomir, M. Risk assessment in collaborative tasks: A comparative analysis—Qualitative method and quantitative method. In Advances in Manufacturing IV; Springer Nature: Cham, Switzerland, 2024; pp. 68–79. [Google Scholar] [CrossRef]
  4. Yuasa Bullish on Future Global Auto Market for Lead Batteries, Batteries International Magazine. Available online: https://www.batteriesinternational.com/2024/03/21/yuasa-bullish-on-future-global-auto-market-for-lead-batteries/# (accessed on 21 March 2024).
  5. EU Ban on the Sale of New Petrol and Diesel Cars from 2035 Explained. Available online: https://www.europarl.europa.eu/topics/en/article/20221019STO44572/eu-ban-on-sale-of-new-petrol-and-diesel-cars-from-2035-explained (accessed on 25 March 2024).
  6. Recycling Process. Available online: https://www.rombat.ro/en/company/rebat/ (accessed on 26 March 2024).
  7. Feng, X.; Zhang, F.; Feng, J.; Jin, C.; Wang, H.; Xu, C.; Ouyang, M. Propagation dynamics of the thermal runaway front in large-scale lithium-ion batteries: Theoretical and experiment validation. Int. J. Heat Mass Transf. 2024, 225, 125393. [Google Scholar] [CrossRef]
  8. Chen, M.; Liu, J.; He, Y.; Yuen, R.; Wang, J. Study of the fire hazards of lithium-ion batteries at different pressures. Appl. Therm. Eng. 2017, 125, 1061–1074. [Google Scholar] [CrossRef]
  9. Funk, E.; Flecknoe-Brown, K.W.; Wijesekere, T.; Husted, B.P.; Andres, B. Fire extinguishment tests of electric vehicles in an open sided enclosure. Fire Saf. J. 2023, 141, 103920. [Google Scholar] [CrossRef]
  10. Hodges, J.L.; Salvi, U.; Kapahi, A. Design fire scenarios for hazard assessment of modern battery electric and internal combustion engine passenger vehicles. Fire Saf. J. 2024, 146, 104145. [Google Scholar] [CrossRef]
  11. Thunderhead Egnineering. Faster FDS Modeling with Professional Results. Available online: https://www.thunderheadeng.com/pyrosim (accessed on 10 April 2024).
  12. PyroSim Software by Thunderhead Engineering, version 2023.3.1312, X64. Available online: https://support.thunderheadeng.com/release-notes/pyrosim/2023/2023-3-1312/ (accessed on 10 January 2025).
  13. Buchmann, I. Can the Lead-Acid Battery Compete in Modern Times? Available online: https://batteryuniversity.com/article/can-the-lead-acid-battery-compete-in-modern-times (accessed on 15 April 2024).
  14. Buchmann, I. BU-1501 Battery History. Available online: https://batteryuniversity.com/article/bu-1501-battery-history (accessed on 15 April 2024).
  15. Continental Battery Systems, Car Battery Evolution—From Old-Tech to MIXTECH. Available online: https://www.continentalbattery.com/blog/car-battery-evolution-from-old-tech-to-mixtech (accessed on 15 April 2024).
  16. Yakup, Ş.; Yıldırım, E.; Çağatay, A.; Enes, D.; Emre, K. Lead Acid Batteries for Micro Hybrid Electrical Vehicles—Influence of Different Type Expanders on the Performance of the negative plates. In Proceedings of the 5th International Anatolian Energy Symposium, Karadeniz Technical University, Trabzon, Turkey, 24–26 March 2021; Available online: https://www.researchgate.net/publication/357673614 (accessed on 15 April 2024).
  17. Buchmann, I. BU-904: How to Measure Capacity. Available online: https://batteryuniversity.com/article/bu-904-how-to-measure-capacity (accessed on 15 April 2024).
  18. EN 50342-1:2015; Lead Acid Starter Batteries—Part 1: General Requirements and Test Methods. CENELEC: Brussels, Belgium, 2015.
  19. Buchmann, I. BU-902a: How to Measure CCA. Available online: https://batteryuniversity.com/article/bu-902a-how-to-measure-cca (accessed on 15 April 2024).
  20. Buchmann, I. BU-1102: Abbreviations. Available online: https://batteryuniversity.com/article/bu-1102-abbreviations (accessed on 15 April 2024).
  21. EUROBAT. EUROBAT Battery Innovation Roadmap 2030 White Paper. Available online: https://www.eurobat.org/wp-content/uploads/2022/03/EUROBAT_Battery_Innovation_Roadmap_2030_White_Paper.pdf (accessed on 15 April 2024).
  22. EN 54-1:2021; Fire Detection and Fire Alarm Systems. Introduction. CENELEC: Brussels, Belgium, 2021.
  23. EN 54-7:2001; Smoke Detectors. Point Detectors Using Scattered Light, Transmitted Light, or Ionization. CENELEC: Brussels, Belgium, 2001.
  24. EN 54-22:2015; Resettable Line-Type Heat Detectors. CENELEC: Brussels, Belgium, 2015.
  25. EN 54-23:2010; Fire Alarm Devices. Visual Alarm Devices. CENELEC: Brussels, Belgium, 2010.
  26. ISO 45001:2018; Occupational Health and Safety Management Systems—Requirements with Guidance for Use. International Organization for Standardization: Geneva, Switzerland, 2018.
  27. OHSAS 18001:2007; Occupational Health and Safety Management Systems—Requirements. British Standards Institution: London, UK, 2007.
  28. ISO 31000:2018; Risk Management—Guidelines. International Organization for Standardization: Geneva, Switzerland, 2018.
Figure 1. Worldwide car battery demand forecast, 2023–2035, in million units [4].
Processes 13 00837 g001
Figure 2. Research methodology.
Processes 13 00837 g002
Figure 3. PyroSim Start Interface (screenshot from [12]).
Processes 13 00837 g003
Figure 4. Lead-acid battery construction [16].
Processes 13 00837 g004
Figure 5. Lead-acid battery manufacturing process.
Processes 13 00837 g005
Figure 6. A 3D model of formation on shelves in open air using PyroSim.
Processes 13 00837 g006
Figure 7. Fire simulation for formation on the shelves in open air using PyroSim.
Processes 13 00837 g007
Figure 8. A 3D model of formation in tanks cooled with water, using PyroSim.
Processes 13 00837 g008
Figure 9. Fire simulation in the case of formation in tanks, using PyroSim.
Processes 13 00837 g009
Figure 10. A 3D model of formation with electrolyte recirculation, using PyroSim.
Processes 13 00837 g010
Figure 11. Fire simulation in the case of formation with electrolyte recirculation, using PyroSim.
Processes 13 00837 g011
Figure 12. Battery recycling process [9].
Processes 13 00837 g012
Figure 13. HRR (Heat Release Rate) graphs resulting from PyroSim simulation: (a) formation on shelves, in open air; (b) formation in tanks cooled with water; (c) formation with electrolyte recirculation.
Processes 13 00837 g013
Figure 14. Simulation end time for formation with acid recirculation.
Processes 13 00837 g014
Figure 15. Q_TOTAL graphs resulting from PyroSim simulation: (a) formation on shelves in open air; (b) formation in tanks cooled with water; (c) formation with electrolyte recirculation.
Processes 13 00837 g015
Figure 16. Mass Loss Rate resulted from PyroSim simulation: (a) formation on shelves in open air; (b) formation in tanks cooled with water; (c) formation with electrolyte recirculation.
Processes 13 00837 g016
Figure 17. MLR—Air (Mass Loss Rate—Air) graphs resulting from PyroSim simulation: (a) formation on shelves in open air; (b) formation in tanks cooled with water; (c) formation with electrolyte recirculation.
Processes 13 00837 g017
Figure 18. Sensitivity analysis carried out for input–output relationships using correlation (above) and risk influences (below).
Processes 13 00837 g018
Table 1. Parameter values that resulted from PyroSim simulations [12].
Parameter Formation on ShelvesFormation in Tanks Cooled with WaterFormation with Electrolyte Recirculation
Maximum temperature570 [°C]420 [°C]965 [°C]
Maximum air velocity5.5 [m/s]4.5 [m/s]4 [m/s]
Soot visibility29.18 [m]28.82 [m]28.71 [m]
Maximum HRR (Heat Release Rate) 1366 [KW]373 [KW]2000 [KW]
Maximum Q_radi (heat radiated)2621 [KW]1805 [KW]4613 [KW]
Maximum Q_Conv (heat convection) 5.8 [KW] 2.95 [KW]107 [KW]
Minimum Q_Conv (heat convection)−1667 [KW]−987 [KW]−1620 [KW]
Minimum Q_Cond (heat conducted)−1097 [KW]−703 [KW]−1160 [KW]
Q_Total (total heat) 2671 [KW]1666 [KW]4568 [KW]
MLR_air (Mass Loss Rate—Air) −14.4 [Kg/s]−15.83 [Kg/s]−10.25 [Kg/s]
MLR_Polypropylene (Mass Loss Rate—Polypropylene)2.88 [Kg/s]1.51 [Kg/s]4.63 [Kg/s]
Simulation time (until the whole material is burned)60 [s]60 [s]20.4 [s]
Disclaimer/Publisher’s Note: The statements, opinions and data contained in all publications are solely those of the individual author(s) and contributor(s) and not of MDPI and/or the editor(s). MDPI and/or the editor(s) disclaim responsibility for any injury to people or property resulting from any ideas, methods, instructions or products referred to in the content.

