Article

Biochemical Methane Production Potential of Different Industrial Wastes: The Impact of the Food-to-Microorganism (F/M) Ratio

Environmental Research Group for Resource Recovery, Department of Civil Engineering, Faculty of Engineering, Architecture and Science, Toronto Metropolitan University, 350 Victoria Street, Toronto, ON M5B 2K3, Canada
*
Author to whom correspondence should be addressed.
Processes 2025, 13(3), 802; https://doi.org/10.3390/pr13030802
Submission received: 6 February 2025 / Revised: 25 February 2025 / Accepted: 3 March 2025 / Published: 10 March 2025
(This article belongs to the Section Environmental and Green Processes)

Abstract

:
In this study, five distinct industrial waste streams, encompassing bakery processing and kitchen waste (BP plus KW) mixture, fat, oil, and grease (FOG), ultrafiltered milk permeate (UFMP), powder whey (PW), and pulp and paper (PP) compost, underwent mesophilic biochemical methane potential (BMP) assays at F/M ratios of 1, 2, 4, and 6 g COD/g VSS. An F/M ratio of 1 g COD/g VSS showed the highest methane yield across the investigated feedstocks. In the case of UFMP and PW, an F/M ratio of 2 produced identical results to an F/M ratio of 1 despite their relatively high carbohydrate content which is easily acidified to VFAs. Increasing the F/M ratio to 2 decreased the biodegradability of both BP plus KW and FOG by 63%. Increasing the F/M ratio of the PP did not show as much of a significant impact on biodegradability compared to the other feedstocks as methane yields decreased from 135 to 92 mL CH4/g COD, a decrease of 32%.

1. Introduction

In recent decades, waste disposal has surged dramatically, largely driven by rapid industrialization and population growth. Urban centers now grapple with diverse waste streams from both industrial and municipal sources. For example, global solid waste production reached an estimated 7 to 10 billion tons in 2015, with industries accounting for roughly 32% of that total. In 2022 alone, paper and paperboard production exceeded 414 million metric tons (Fioreze and Silva, 2023 [1]). Moreover, food waste (FW) has ballooned to 1.4 billion tons and is expected to double, reaching nearly 2.6 billion tons by 2025. This rapid escalation poses significant challenges for municipalities and urban infrastructures worldwide.
Industrial waste primarily originates from processing, manufacturing, milling, and mining. In particular, the food processing and packaging sectors generate vast amounts of waste and biosolids that are typically destined for landfills and incineration. These conventional waste management practices, which currently account for about 48% of global waste handling, provide temporary relief and contribute to greenhouse gas emissions; methane emissions, for instance, are projected to soar to 43.3 million tons by 2030 (Abbasi et al., 2012 [2]).
Against this backdrop, the search for sustainable, environmentally friendly waste treatment technologies has intensified. Anaerobic digestion (AD) has emerged as a promising alternative, capable of diverting waste from landfills while offering operational and ecological benefits. Among various industrial wastes, food processing residues are particularly attractive as feedstock for AD due to their rich mix of carbohydrates, proteins, and lipids (Mirabella et al., 2014 [3]). The food manufacturing process is inherently water-intensive, from agricultural cultivation to packaging. At the same time, industries like dairy, pulp, and paper also generate substantial amounts of biodegradable waste suitable for AD.
However, the efficiency of AD hinges on several factors, most notably the loading rate, typically measured as the food-to-microorganism (F/M) ratio. High organic loads can hinder efficient processing because each waste type brings its own set of inhibitory challenges. For example, carbohydrate-rich agricultural residues (including lignocellulosic materials) often exhibit low hydrolysis rates at high loadings. Similarly, protein-rich wastes, such as slaughterhouse byproducts, can produce excessive ammonia, inhibiting microbial activity. Lipid-rich wastes like fats, oils, and greases (FOGs) tend to produce long-chain fatty acids (LCFAs) that adversely affect key microbial populations (Mata-Alvarez et al., 2014 [4]).
Despite the critical importance of AD loading rates, relatively few studies have systematically explored how varying the F/M ratio impacts biomethane production from industrial feedstocks. In this study, five feedstocks were selected based on their biodegradability and methane generation potential: bakery processing and kitchen waste (BP plus KW), FOG, ultrafiltered milk permeate (UFMP), powdered whey (PW), and pulp and paper (PP) sludge. Notably, these materials were used in their original form, without any biological or thermal pretreatment. This objectively evaluates their methane recovery potential in current manufacturing processes.
Several studies have investigated the biodegradability of FW at F/M ratios ranging from 0.25 to 3 g VS/g VS; however, the results were not consistent (Okoro-Shekwaga et al., 2020 [5]; Xie et al., 2021 [6]; Yulisa et al., 2022 [7]). Kawai et al. (2014) [8] investigated the biodegradability of FW at F/M ratios of 0.33, 0.5, 1, 2, and 4 g VS/g VS in mesophilic batch assays. They reported a methane yield of 435 mL CH4/g VS at an F/M ratio of 0.33, which dropped rapidly to 269 mL CH4/g VS as it increased to 0.5. However, degradation kinetics were not reported.
Veluchamy and Kalamdhad (2020) [9] investigated the biodegradability of PP at F/M ratios ranging from 0.5 to 2.5 in mesophilic batch assays and reported the highest methane yield of 272 mL CH4/g VS at an F/M ratio of 2. However, the solids content across the batch assays differed at each F/M ratio; hence, VS removal was consistent across the different assays, providing biased insights into the feedstock’s biodegradability and degradation kinetics.
Nieto et al. (2012) [10] investigated the biodegradability of milk waste at F/M ratios ranging from 0.25 to 1.5 in mesophilic batch assays. However, methane yields were consistent across all F/M ratios ranging from 307 to 322 mL CH4/g COD.
This study aims to investigate methane production, yields, biodegradability, and process kinetics of various industrial wastes at F/M ratios beyond those investigated in the literature while providing insights into their behavior during AD.

2. Materials and Methods

2.1. Analytical Methods

The analysis of solid contents of the substrates, including total solids (TSs), volatile solids (VSs), total suspended solids (TSSs), and volatile suspended solids (VSSs) of the inoculum according to the Standard Methods procedures [11]. Chemical oxygen demand, ammonia, and VFA were analyzed using Hach methods and a Hach spectrophotometer model 3900. For the measurement of the soluble content, samples were centrifuged at 9000 rpm for 45 min, and then the supernatant was filtered using 0.45 µm microfiber filters. Gas production was measured manually using a 100 mL Gastight Luer-Lock glass syringe (Hamilton, ON, Canada). The methane content in the produced biogas was measured using a Thermo Scientific Trace 1310 gas chromatograph (GC) (Thermo Fisher Scientific, Burlington, ON, Canada) equipped with a thermal conductivity detector, with the oven, detector, and filament temperature set to 80, 100, and 250 °C, respectively. The type of column used was a TG-Bond Msieve 5A model with a 30 m length and 0.53 mm diameter.

2.2. Biochemical Methane Potential Tests

Biochemical methane potential (BMP) assays were carried out in 250 mL serum bottles with a 50 mL headspace, according to Angelidaki et al. (2009) [12]. The substrate and inoculum volumes were calculated based on F/M ratios of 1, 2, 4, and 6 g COD/g VSS. All BMPs were carried out in triplicates at 37 ± 1 °C by incubating the bottles in a Thermo Scientific MAXQ 4000 shaker (Thermo Fisher Scientific, Burlington, ON, Canada) at a rotational speed of 160 rpm. The headspace of the bottles was flushed with nitrogen gas for 3 min at 10 psi and sealed to maintain anaerobic conditions. The inoculum was also preincubated at the same temperature for a week until methane production curves plateaued to remove any endogenous methane production potential. The pH was adjusted to maintain a range of 7–7.4 using sulfuric acid and sodium hydroxide. Gas measurements were obtained periodically every day in the first week and every other day till the end of the experiment.

2.3. Materials

The characteristics of the substrates and the inoculum are summarized in Table 1. The inoculum for all BMPs was collected from Ashbridges Bay Wastewater Treatment Plant (Toronto, ON, Canada). FOG, bakery processing, and kitchen waste were collected from Walker Environmental Group (Toronto, ON, Canada). The samples were homogenized using a blender for analysis and testing. The dairy processing waste was collected from Agropur Dairy Cooperative (Longueuil, QC, Canada). The substrates were collected from the Toronto and Longueuil facilities, which included ultrafiltered milk permeate (UFMP) and powdered whey (PW). The pulp and paper composts were collected at the New Forest paper mill facility (Toronto, ON, Canada). The powdered whey and pulp and paper wastes were mixed with distilled deionized water at 1:5 and 1:20 ratios, respectively, to create a slurry that can be easily characterized and fed to the serum bottles. All substrates were kept in a cold room at 5 °C to maintain their characteristics.

2.4. Calculations

The F/M ratio was calculated using Equation (1).
F/M = Cf × Vf/Cs × Vs
where F/M is the food-to-microorganism ratio, Cf is the COD concentration of the feedstock (mg/L), Vf is the volume of the feedstock (mL), Cs is the VSS concentration of the inoculum (mg VSS/L), and Vs is the volume of the inoculum.
The biodegradability of the substrates was calculated using Equation (2).
Bo = Yex/Yth
where Bo is the biodegradability, Yex is the experimental methane yield (mL CH4/g COD), and Yth is the theoretical methane yield at 37 °C (397 mL CH4/g COD).
The kinetics of biogas production were modelled using the Modified-Gompertz model in Equation (3).
M = P exp {−exp [(Rm × e/P) (λt) + 1]}
where M is the cumulative methane produced (mL), P is the maximum methane potential (mL), Rm is the maximum methane production rate (MMPR) (mL/d), λ is the lag phase (d), and e is Euler’s number.
First-order kinetics were used for the organic substrate’s degradation according to Equation (4).
S = S0 exp (−k × t)
where S is the residual substrate concentration at any given time (mg/L), S0 is the initial substrate concentration, and k is the first-order degradation rate (d−1).

3. Results and Discussion

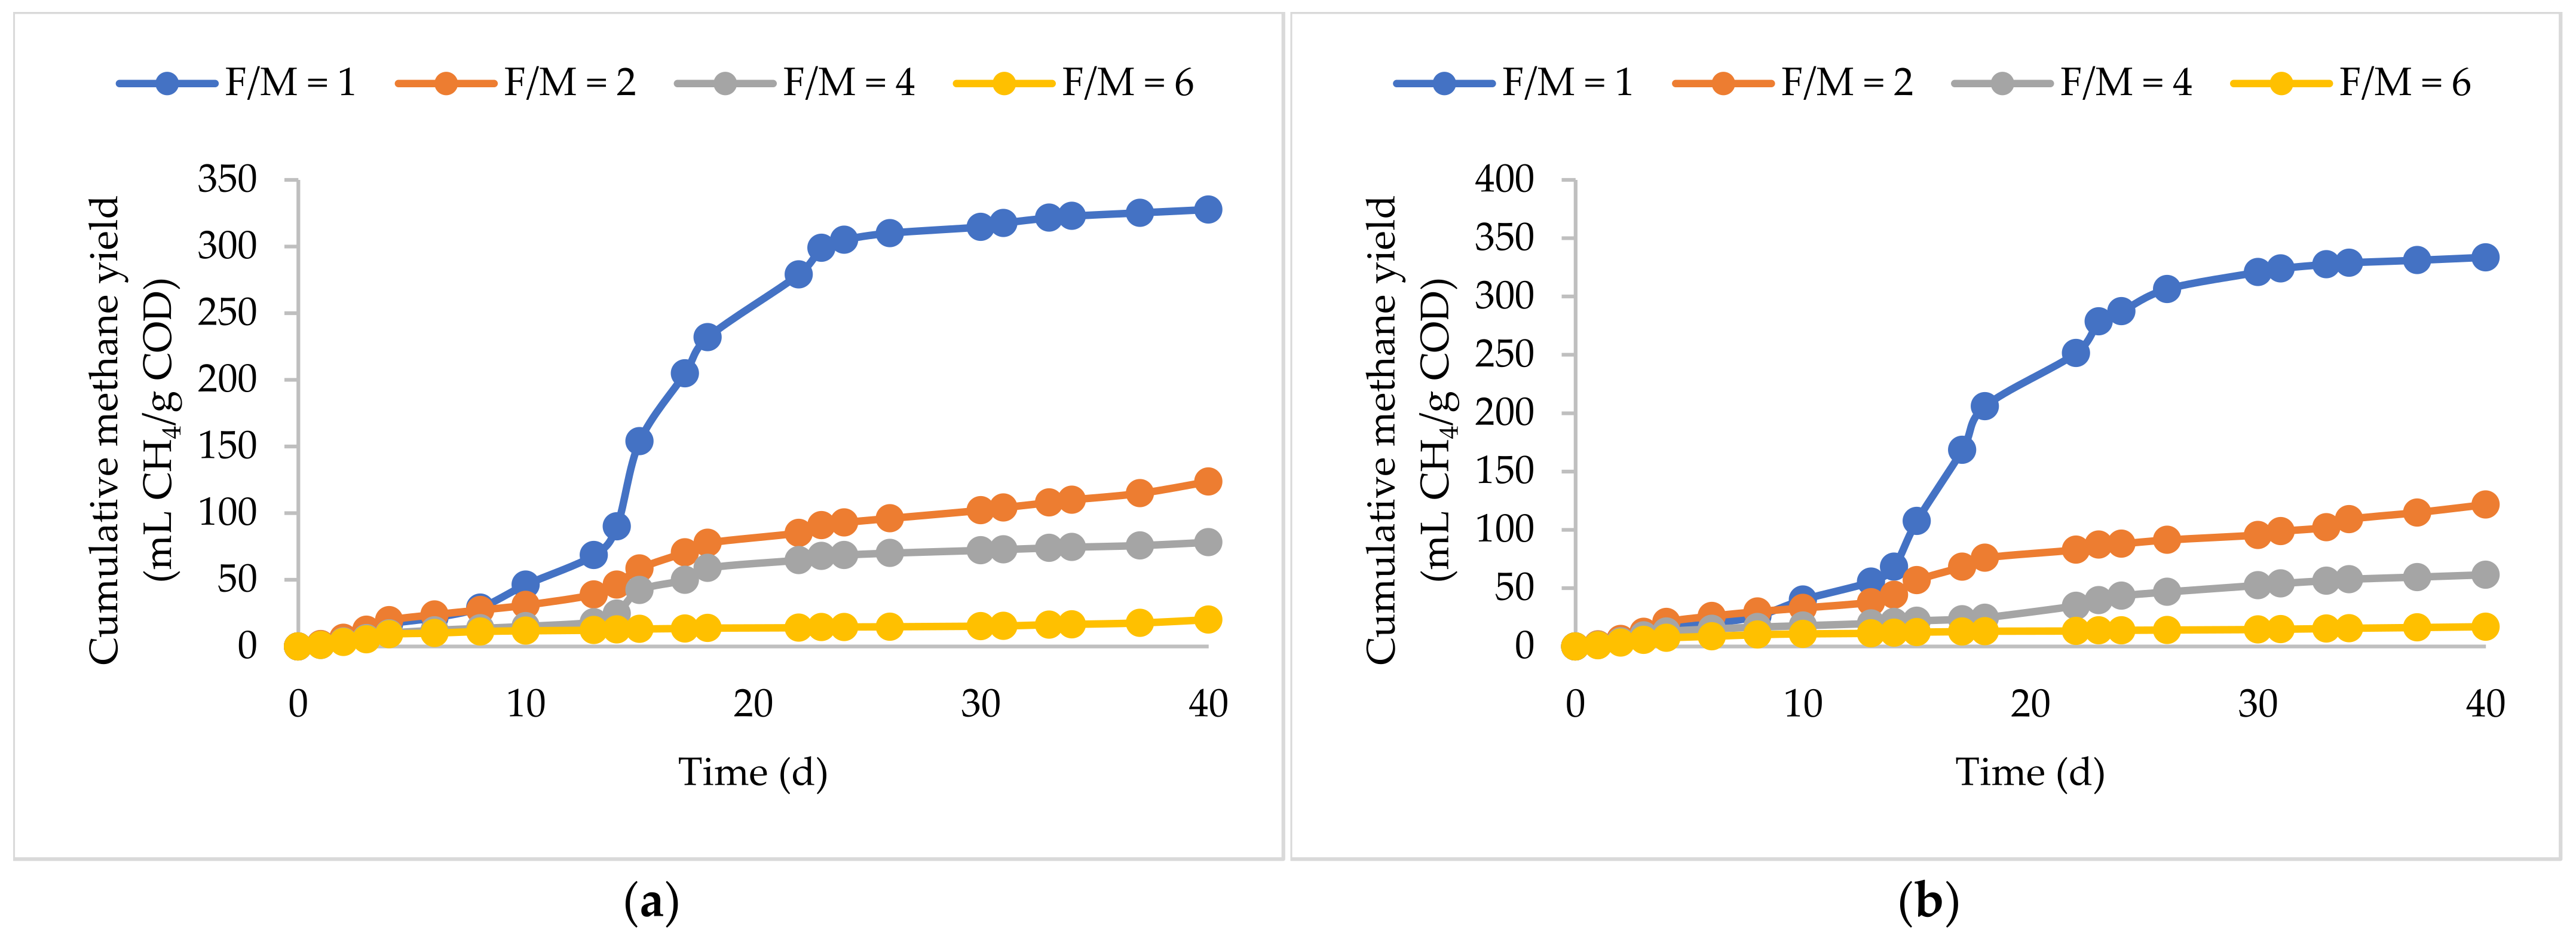
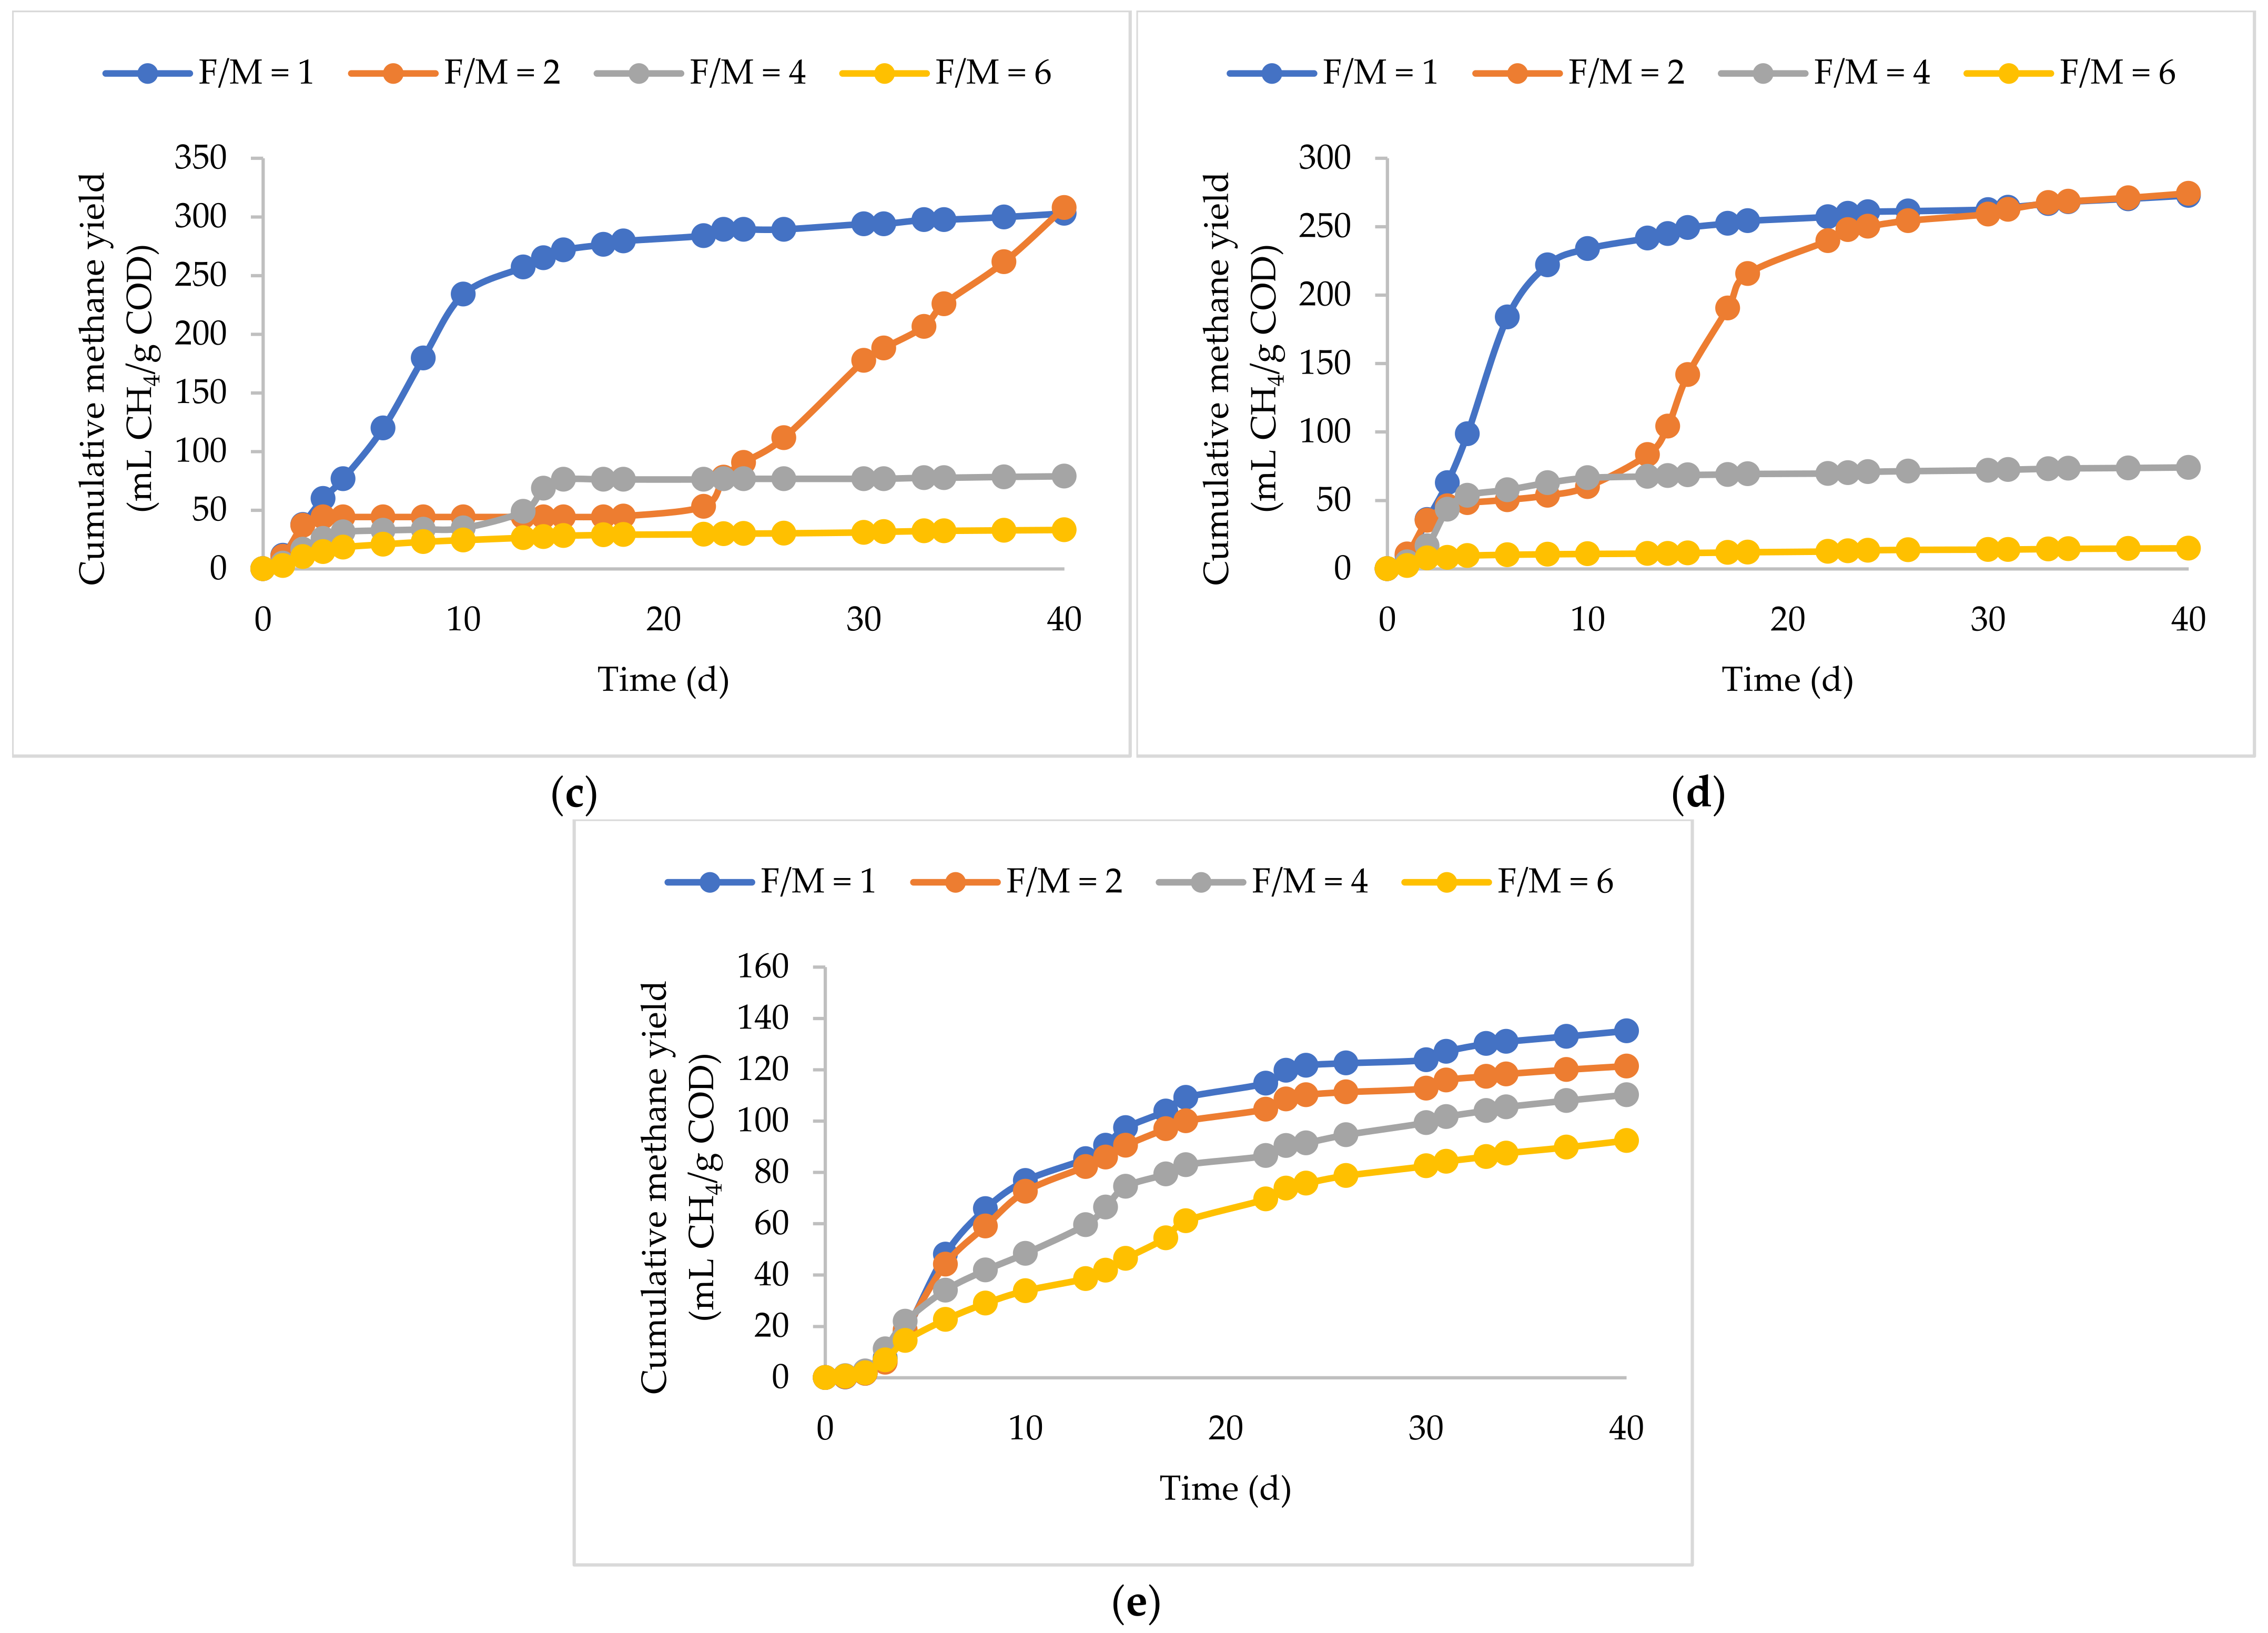
3.1. Methane Yields and Biodegradability

The differences in the cumulative methane production curves in all BMP replicates were statistically insignificant (p > 0.05), emphasizing the data’s reproducibility. Figure 1 and Figure 2 depict the cumulative methane yields and biodegradability of the substrates at the F/M ratios investigated.

3.2. BP Plus KW

For the BP plus KW, the highest methane yield of 328 mL CH4/g COD (i.e., 403 mL CH4/g VS) was achieved at an F/M ratio of 1, corresponding to a biodegradability of 83%. The reported methane yields at the same F/M range from 257 to 421 mL CH4/g VS (Kafle et al., 2014 [8]; Gallipoli et al., 2020 [13]; Y. Li et al., 2018 [14]; Kawai et al., 2014 [15]). The increase in the F/M ratio to 2 adversely impacted methane yields, resulting in a 62% decrease to 124 mL CH4/g COD, corresponding to a biodegradability of 31%. Further increasing the F/M ratio to 4 and 6 diminished methane yields to 78 and 20 mL CH4/g COD, corresponding to 20% and 5% biodegradability, respectively. The methane yield of the BP plus KW in this study falls in the upper limit of the reported values. The high yield is attributed to several factors, including a high lipid content and the substrate preparation techniques. Mahmoud et al. (2022) [16] reported a carbohydrate, lipid, and protein content of 2.7, 46.9, and 50.4%, respectively, using the same BP plus KW used in this study. The high lipid content is attributed to butter and cooking oils used in bakeries. KW also contains several high-lipid components, such as used cooking oil and meat fat. Lipids are typically easily fermented to hydrogen gas, which is utilized by hydrogenotrophic methanogens at rates higher than those of acetate utilizers, increasing their contribution to methane production compared to carbohydrates and proteins, as seen in Angelidaki and Sanders (2004) [17]. The results of this study agree with the findings of Li et al. (2018) [14], who reported a methane yield of 421 mL CH4/g VS at an F/M ratio of 1. However, at elevated concentrations from the higher F/M ratios, methane yields declined due to excessive acidification at rates higher than those for uptake by methanogens leading to VFA accumulation and eventual inhibition. Additionally, lipids break down into long-chain fatty acids (LCFAs). The hydrophobic nature of LCFA exerts its inhibition by blocking mass transfer pathways of soluble intermediates and microbial cells (Pereira et al., 2004) [18]. Sun et al. (2014) [19] reported an increase in methane yields when lipids constituted up to 60% of the total VSs, beyond which significant inhibition to fermentation processes occurred, which is far less sensitive than methanogenesis. In addition to substrate content, sample preparation is also believed to play a key role in improving the kinetics and overall biodegradation of the substrate. In this study, blending the substrates into a paste may have reduced the particle size and biodegradation potential. Okoro-Shekwaga et al. (2020) [5] reported methane yields of 538, 543, and 515 mL CH4/g VS at F/M ratios of 2, 3, and 4, respectively, at a particle size of 1 mm, which was 38% higher compared to a particle size of 5 mm.

3.3. FOG

Methane production of FOG resembled that of the BP plus KW, peaking at an F/M ratio of 1 and significantly declining as the F/M ratio increased. The highest methane yield was 334 mL CH4/g COD, corresponding to biodegradability of 84%, almost equal to that of the BP plus KW. Increasing the F/M ratio to 2 resulted in a 63% decrease in the methane yield at 122 mL CH4/g COD, further decreasing to 61 and 71 mL CH4/g COD, corresponding to 15% and 4% biodegradability. LCFAs are broken down via β-oxidation, forming acetate, hydrogen, and VFAs. The β-oxidation step is a rate-limiting step, leading to the accumulation of LCFAs, which can be attached to cell membranes, decreasing cellular permeability, thus impacting the mass transfer of metabolites and substrates across cellular membranes. The magnitude of LCFA’s inhibitory effect is a function of several factors, including the length of LCFA’s carbon chain and the anaerobic sludge’s specific surface area. Moreover, methanogenic activity inhibition can occur at LCFAs and oleate concentrations as low as 75 mg/L. Several recovery strategies were tested to overcome LCFA toxicity, where dilution with inoculum was among the most ideal because it increases the biomass-to-LCFA ratio, corresponding to a reduction in the F/M ratio [20,21]). This increase in the biomass-to-LCFA ratio explains the high methane yield values obtained from FOG at lower F/M ratios in this study.

3.4. UFMP and PW

Whey permeate is a yellow-greenish liquid with a carbohydrate-rich nature containing, on average, 85% lactose. Since the sCOD of the UF permeate and powdered whey slurry was 97% and 89% of the total COD, hydrolysis was not a limiting step, and macromolecular components, notably carbohydrates, can be easily fermented into VFA. The methane yields at F/M ratios of 1 and 2 were almost identical. For the UFMP, the observed methane yields were 303 and 308 mL CH4/g COD at F/M ratios of 1 and 2, corresponding to 76% and 78% biodegradability, respectively. Similarly, the observed methane yields for the PW were 273 and 274 mL CH4/g COD, respectively, corresponding to a 69% biodegradability. Increasing it to 4 and 6 showed a significant reduction, possibly due to the increased production rate of VFA beyond the uptake capacity of methanogens, leading to its accumulation and eventually hindering the process. Nieto et al. (2012) [10] reported a higher methane yield of 535 ± 29 mL CH4/g VS at an F/M ratio of 1.5, the highest out of the F/M ratios ranging from 0.25 to 1.5. Carminati et al. (2018) [22] reported the highest methane yield of 365 ± 3 mL CH4/g VS at an F/M ratio of 3.3 with deproteinated cheese whey. Mainardis et al. (2019) [23] reported the highest methane yield of 437 mL CH4/g VS at an F/M ratio of 0.17 with fat whey. Bella and Venkateswara Rao (2022) [24] reported a methane yield of 66 ± 0.8 mL CH4/g VS at an F/M ratio of 1 with cheese whey. These discrepancies indicate that the processing of the waste plays an important role in its potential for methane production as it directly affects its macromolecular composition.

3.5. PP

The highest methane yield of 135 mL CH4/g COD (i.e., 190 mL CH4/g VS) was observed at an F/M ratio of 1, corresponding to a 34% biodegradability, agreeing with the findings of Xu et al. (2022) [25], who reported the same yield at the same F/M ratio with paper waste. Increasing the F/M ratio showed a linear decline in methane yields to 92 mL CH4/g COD and 23% biodegradability. Rodriguez et al. (2017) [26] investigated the methane potential of pretreated wastepaper pulp at F/M ratios of 0.3, 0.5, and 0.7. They reported the highest yield of 253 mL CH4/g VS at an F/M of 0.3, which decreased to 175 mL CH4/g VS at an F/M ratio of 0.7. Veluchamy and Kalamdhad (2020) [9] reported an increasing trend in the methane yield of PP mill sludge from 168 to 272 mL CH4/g VS as the F/M ratio increased from 0.5 to 2, which was later decreased to 242 mL CH4/g VS as the F/M ratio was increased to 2.5, which was attributed to the higher solids content hindering hydrolysis. During the breakdown of lignocellulosic fibers, a wide range of byproducts, such as weak acids, furan derivatives, and phenolic compounds, are produced. Amongst those byproducts, furan derivatives such as furfural significantly inhibit anaerobic digestion. The increase in the F/M ratio increases the production of such byproducts beyond the inhibition thresholds in anaerobic digestion processes, which could be as low as 250 mg/L (Haroun et al., 2016) [27]. Additionally, the inoculum used plays an important role in the overall performance of the breakdown of PP wastes. Veluchamy and Kalamdhad, (2017) [28] showed an increase in methane yields from 190 to 303 mL CH4/g VS as the F/M ratio increased from 1 to 3. However, the inoculum used was cow dung, which might have bacteria that are acclimated to the breakdown of lignocellulosic fibers.

3.6. Kinetics

The first-order and Modified-Gompertz kinetics of the substrates and their corresponding F/M ratios are reported in Table 2.
The lag phase observed at the different F/M ratios did not show a consistent trend across all substrates peaking at an F/M ratio of 1 with the BP plus KW and FOG and an F/M ratio of 2 with the UFMP, PW, and PP. The inoculum used in this study is acclimatized to wastewater biosolids; hence, a lag phase should be observed due to the sudden change in the nature of the waste. Additionally, the heterogeneity of the waste could also play a role in these inconsistencies. However, this does not apply to the UFMP and PW, considering both substrates are almost completely soluble.
Aside from FOG, no significant change in the first-order degradation rate was observed across all substrates at the different F/M ratios (p > 0.05). The Modified-Gompertz kinetics provided better insight into the kinetics of the BMPs. The MMPR of the BP plus KW peaked at 31 mL CH4/g COD∙d, but significantly decreased to a range of 2–5 mL CH4/g COD∙d as the F/M ratio increased, which is attributed to the LCFA inhibition. The highest MMPR also corresponded to the highest methane yield and biodegradability. FOG followed the same trend as the BP and KW peaking at an F/M ratio of 1, corresponding to the highest methane yield and biodegradability. Although the highest methane yields and biodegradability in the case of the UFWP and PW were at F/M ratios of 1 and 2, they were almost identical. However, the MMPRs decreased by 48% from 27 to 14 mL CH4/g COD∙d and 67% from 39 to 13 mL CH4/g COD∙d with the UFWP and PW, respectively, at an F/M ratio of 2. The further increase in the F/M ratio decreased MPPRs even further. UFWP and PW are mainly soluble carbohydrates that ferment easily, producing VFAs and eventually inhibiting methanogens. Despite the availability of a readily biodegradable substrate to which methanogens are accustomed, elevated concentrations cannot be utilized. The MPPR and lag phase of the PP were not significantly different at F/M ratios of 1 and 2. However, the MPPRs dropped to 5 and 4 mL CH4/g COD∙d as the F/M ratio increased to 4 and 6, respectively. The heterogeneity of the PP, in addition to the fact that its primary constituents (i.e., cellulose, hemicellulose, and lignin) are hardly degradable in the absence of a specific microbial community that is not available in wastewater biosolids, created an unfavorable environment for anaerobic digestion.
The mass balance of COD completed at the end of the experiment demonstrated high accuracy, with percentages ranging between 86% and 99%, indicating that BMPs were performed reliably across all feedstocks.

4. Conclusions

In this study, the impact of the F/M ratio was investigated on several substrates (i.e., BP plus KW, FOG, UFMP, PW, and PP). All feedstocks showed the highest methane yield and biodegradability at an F/M ratio of 1. UFMP and PW exhibited almost identical methane yields at F/M ratios of 1 and 2; however, MPPRs decreased by 48% and 67%, respectively, at an F/M ratio of 2. PP waste showed the least variability in results, considering its heterogeneity and hard-to-degrade composition. The macromolecular components of the substrates play an important role in their anaerobic digestion response. Substrates with higher lipids content (i.e., BP plus KW and FOG) were susceptible to inhibition by the accumulation of LCFAs which has a severely higher impact on methanogens compared to VFAs. Substrates with higher carbohydrate content were also susceptible to inhibition; however, it was due to the rapid accumulation of VFAs. Increasing the F/M ratio did not necessarily correspond to higher biodegradable or kinetics. However, it provided a deeper insight into how sensitive anaerobic digestion is to certain components. Additionally, the different natures of these substrates could complement each other when co-digested; however, further investigation into the ideal mixing ratios of these macromolecular components is required.

Author Contributions

Conceptualization, A.E.S., R.A.H. and E.E.; Methodology, A.E.S., A.R. and E.E.; Validation, A.E.S., A.I., R.A.H. and E.E.; Formal analysis, A.E.S., A.I., A.R. and A.H.; Investigation, A.E.S., A.I., A.R. and A.H.; Resources, R.A.H. and E.E.; Data curation, A.E.S. and A.I.; Writing—original draft, A.E.S., A.I. and A.H.; Writing—review & editing, A.I.; Visualization, A.I.; Supervision, R.A.H. and E.E. All authors have read and agreed to the published version of the manuscript.

Funding

This research was funded by the Natural Sciences and Engineering Research Council (NSERC) grant number [RGPIN-2016-04122].

Data Availability Statement

The original contributions presented in this study are included in the article. Further inquiries can be directed to the corresponding author.

Conflicts of Interest

The authors declare no conflict of interest.

References

  1. Fioreze, M.; Silva, C.M. Anaerobic digestion and pretreatment methods applied to primary and secondary sludge from pulp and paper mills: A review of the development of global research and a case study of a typical brazilian kraft pulp mill. J. Urban Environ. Eng. 2023, 17, 39–50. [Google Scholar]
  2. Abbasi, T.; Tauseef, S.M.; Abbasi, S.A. Anaerobic digestion for global warming control and energy generation—An overview. Renew. Sustain. Energy Rev. 2012, 16, 3228–3242. [Google Scholar] [CrossRef]
  3. Mirabella, N.; Castellani, V.; Sala, S. Current options for the valorization of food manufacturing waste: A review. J. Clean. Prod. 2014, 65, 28–41. [Google Scholar] [CrossRef]
  4. Mata-Alvarez, J.; Dosta, J.; Romero-Güiza, M.S.; Fonoll, X.; Peces, M.; Astals, S. A critical review on anaerobic co-digestion achievements between 2010 and 2013. Renew. Sustain. Energy Rev. 2014, 36, 412–427. [Google Scholar] [CrossRef]
  5. Shekwaga, C.K.O.; Suruagy, M.V.T.; Ross, A.; Valero, M.A.C. Particle size, inoculum-to-substrate ratio and nutrient media effects on biomethane yield from food waste. Renew. Energy 2020, 151, 311–321. [Google Scholar] [CrossRef]
  6. Xie, A.; Deaver, J.A.; Miller, E.; Popat, S.C. Effect of feed-to-inoculum ratio on anaerobic digestibility of high-fat content animal rendering wastewater. Biochem. Eng. J. 2021, 176, 108215. [Google Scholar] [CrossRef]
  7. Yulisa, A.; Chairattanawat, C.; Park, S.H.; Jannat, M.A.H.; Hwang, S. Effect of Substrate-to-Inoculum Ratio and Temperatures During the Start-up of Anaerobic Digestion of Fish Waste. Ind. Domest. Waste Manag. 2022, 2, 17–29. [Google Scholar] [CrossRef]
  8. Kawai, M.; Nagao, N.; Tajima, N.; Niwa, C.; Matsuyama, T.; Toda, T. The effect of the labile organic fraction in food waste and the substrate/inoculum ratio on anaerobic digestion for a reliable methane yield. Bioresour. Technol. 2014, 157, 174–180. [Google Scholar] [CrossRef]
  9. Veluchamy, C.; Kalamdhad, A.S. Effect of Total Solid Content of Lignocellulose Pulp and Paper Mill Sludge on Methane Production and Modeling. J. Environ. Eng. 2020, 146, 04019121. [Google Scholar] [CrossRef]
  10. Nieto, P.P.; Hidalgo, D.; Irusta, R.; Kraut, D. Biochemical methane potential (BMP) of agro-food wastes from the Cider Region (Spain). Water Sci. Technol. 2012, 66, 1842–1848. [Google Scholar] [CrossRef]
  11. American Public Health Association (APHA). Standard Methods for the Examination of Water and Wastewater, 21st ed.; American Public Health Association: Washington, DC, USA, 2005; p. 1220. [Google Scholar]
  12. Angelidaki, I.; Alves, M.; Bolzonella, D.; Borzacconi, L.; Campos, J.L.; Guwy, A.J.; Kalyuzhnyi, S.; Jenicek, P.; van Lier, J.B. Defining the biomethane potential (BMP) of solid organic wastes and energy crops: A proposed protocol for batch assays. Water Sci. Technol. 2009, 59, 927–934. [Google Scholar] [CrossRef] [PubMed]
  13. Gallipoli, A.; Braguglia, C.M.; Gianico, A.; Montecchio, D.; Pagliaccia, P. Kitchen waste valorization through a mild-temperature pretreatment to enhance biogas production and fermentability: Kinetics study in mesophilic and thermophilic regimen. J. Environ. Sci. (China) 2020, 89, 167–179. [Google Scholar] [CrossRef]
  14. Li, Y.; Jin, Y.; Borrion, A.; Li, J. Influence of feed/inoculum ratios and waste cooking oil content on the mesophilic anaerobic digestion of food waste. Waste Manag. 2018, 73, 156–164. [Google Scholar] [CrossRef] [PubMed]
  15. Kafle, G.K.; Bhattarai, S.; Kim, S.H.; Chen, L. Effect of feed to microbe ratios on anaerobic digestion of Chinese cabbage waste under mesophilic and thermophilic conditions: Biogas potential and kinetic study. J. Environ. Manag. 2014, 133, 293–301. [Google Scholar] [CrossRef] [PubMed]
  16. Mahmoud, A.; Hamza, R.A.; Elbeshbishy, E. Enhancement of denitrification efficiency using municipal and industrial waste fermentation liquids as external carbon sources. Sci. Total Environ. 2022, 816, 151578. [Google Scholar] [CrossRef]
  17. Angelidaki, I.; Sanders, W. Assessment of the anaerobic biodegradability of macropollutants. Rev. Environ. Sci. Bio/Technol. 2004, 3, 117–129. [Google Scholar] [CrossRef]
  18. Pereira, M.A.; Sousa, D.Z.; Mota, M.; Alves, M.M. Mineralization of LCFA associated with anaerobic sludge: Kinetics, enhancement of methanogenic activity, and effect of VFA. Biotechnol. Bioeng. 2004, 88, 502–511. [Google Scholar] [CrossRef]
  19. Sun, Y.; Wang, D.; Yan, J.; Qiao, W.; Wang, W.; Zhu, T. Effects of lipid concentration on anaerobic co-digestion of municipal biomass wastes. Waste Manag. 2014, 34, 1025–1034. [Google Scholar] [CrossRef]
  20. Palatsi, J.; Laureni, M.; Andrés, M.V.; Flotats, X.; Nielsen, H.B.; Angelidaki, I. Strategies for recovering inhibition caused by long chain fatty acids on anaerobic thermophilic biogas reactors. Bioresour. Technol. 2009, 100, 4588–4596. [Google Scholar] [CrossRef]
  21. Hwu, C.S.; Donlon, B.; Lettinga, G. Comparative toxicity of long-chain fatty acid to anaerobic sludges from various origins. Water Sci. Technol. 1996, 34, 351–358. [Google Scholar] [CrossRef]
  22. Carminati, P.; Gusmini, D.; Pizzera, A.; Catenacci, A.; Parati, K.; Ficara, E. Biogas from mono- and co-digestion of microalgal biomass grown on piggery wastewater. Water Sci. Technol. 2018, 78, 103–113. [Google Scholar] [CrossRef] [PubMed]
  23. Mainardis, M.; Flaibani, S.; Trigatti, M.; Goi, D. Techno-economic feasibility of anaerobic digestion of cheese whey in small Italian dairies and effect of ultrasound pre-treatment on methane yield. J. Environ. Manag. 2019, 246, 557–563. [Google Scholar] [CrossRef]
  24. Bella, K.; Rao, P.V. Anaerobic co-digestion of cheese whey and septage: Effect of substrate and inoculum on biogas production. J. Environ. Manag. 2022, 308, 114581. [Google Scholar] [CrossRef] [PubMed]
  25. Xu, F.; Okopi, S.I.; Jiang, Y.; Chen, Z.; Meng, L.; Li, Y.; Sun, W.; Li, C. Multi-criteria assessment of food waste and waste paper anaerobic co-digestion: Effects of inoculation ratio, total solids content, and feedstock composition. Renew. Energy 2022, 194, 40–50. [Google Scholar] [CrossRef]
  26. Rodriguez, C.; Alaswad, A.; El-Hassan, Z.; Olabi, A.G. Mechanical pretreatment of waste paper for biogas production. Waste Manag. 2017, 68, 157–164. [Google Scholar] [CrossRef]
  27. Haroun, B.M.; Nakhla, G.; Hafez, H.; Nasr, F.A. Impact of furfural on biohydrogen production from glucose and xylose in continuous-flow systems. Renew. Energy 2016, 93, 302–311. [Google Scholar] [CrossRef]
  28. Veluchamy, C.; Kalamdhad, A.S. Biochemical methane potential test for pulp and paper mill sludge with different food/microorganisms ratios and its kinetics. Int. Biodeterior. Biodegrad. 2017, 117, 197–204. [Google Scholar] [CrossRef]
Figure 1. Cumulative methane yields of (a) BP plus KW, (b) FOG, (c) UFMP, (d) PW, and (e) PP at F/M ratios of 1, 2, 4, and 6.
Processes 13 00802 g001aProcesses 13 00802 g001b
Figure 2. Biodegradability of BP plus KW, FOG, UFMP, PW, and PP compost at F/M ratios of 1, 2, 4, and 6.
Processes 13 00802 g002
Table 1. Characterization of BP plus KW, FOG, UFMP, PW, PP compost, and the inoculum. Values are presented as value ± standard deviation.
ParametersBP Plus KWFOGUFMPPWPP SludgeInoculum
COD (g/L)195 ± 14283 ± 2070 ± 5252 ± 1838 ± 318 ± 0.5
sCOD (g/L)45 ± 348 ± 368 ± 5224 ± 1619 ± 10.8 ± 0.02
VFA (g/L)5.6 ± 0.47 ± 0.55.3 ± 0.45.4 ± 0.40.9 ± 0.1
TS (g/L)164 ± 11211± 1567 ± 5209 ± 1546 ± 317 ± 0.5
VS (g/L)154 ± 11206 ± 1461± 4191± 1327± 214 ± 0.4
TSS (g/L)148 ± 10192 ±1325 ± 249 ± 318 ± 116 ± 0.5
VSS (g/L)146 ±10188 ±1324 ± 248 ± 314 ± 113 ± 0.4
Ammonia (mg/L)80 ± 630 ± 23 ± 0.240 ± 320 ± 1782 ± 24
pH3.683.784.325.426.617.2
Alkalinity (g/L as CaCO3) 5.3 ± 0.40.5 ± 04.2 ± 0.1
Table 2. First-order and Modified-Gompertz kinetics of the substrates at the different F/M ratios investigated.
SubstrateF/MFirst-Order Rate (k) (d−1)Modified-Gompertz Kinetics
P (mL CH4/g COD)Rm (mL CH4/g COD∙d)λ (d)
BP plus KW10.143263110.32
20.1312842.15
40.127956.36
60.121520
FOG10.183263110.32
20.2312842.15
40.217956.36
60.171520
UFMP10.14295271.16
20.133081417
40.138050.00
60.113040.00
PW10.12260391.32
20.13293133.69
40.1170180.87
60.091330
PP10.1612981.53
20.1411681.68
40.1310750.80
60.139641.58
Disclaimer/Publisher’s Note: The statements, opinions and data contained in all publications are solely those of the individual author(s) and contributor(s) and not of MDPI and/or the editor(s). MDPI and/or the editor(s) disclaim responsibility for any injury to people or property resulting from any ideas, methods, instructions or products referred to in the content.

