1. Introduction
In recent years, there has been a global upswing in interest in renewable energy, driven by the pressing need to address climate change, minimize harmful emissions, and transition away from fossil fuels [
1,
2]. Statistical data reveal a remarkable growth in installed renewable energy capacity worldwide, escalating from 100,000 MW in 2012 to an impressive 700,000 MW in 2022 [
1]. Furthermore, net electricity generation from renewable sources has surged from approximately 17 trillion kilowatts in 2007 to 21 trillion kilowatts in 2020, with projections indicating a future leap to over 30 trillion kilowatts by 2035 [
2].
According to the International Renewable Energy Agency’s
A roadmap to 2050 (2019 edition), the share of renewable energy in the primary supply is projected to surge from less than one-sixth to nearly two-thirds by 2050. Simultaneously, energy efficiency will see a substantial boost, with an annual improvement rate of 3.2%. This collective effort sets the stage for electricity to become the primary energy carrier, reaching almost 50% by 2050. This transformation is predominantly propelled by renewable power, which is expected to meet 86% of the global power demand. Notably, by 2050, the generation of solar energy is anticipated to surge to 48% [
3].
Renewable energy resources exhibit intermittent patterns in their availability [
4,
5]. Recognizing hydrogen as a pivotal energy vector for the future [
6], the emergence of green hydrogen presents a promising solution to the challenges associated with storing electricity from renewable sources and addressing intermittence and fluctuation issues [
7,
8]. Conventional methods of hydrogen production from fossil fuels, biomass, and nuclear power incur drawbacks such as high energy consumption, carbon emissions, and reliance on established technologies like steam reforming.
In contrast, green hydrogen, produced through renewable energies, emerges as a sustainable alternative that effectively mitigates environmental concerns, particularly when powered by renewable electricity sources [
9]. The significance of green hydrogen as an energy vector transcends its role in the industrial sector. With the potential to reduce annual CO
2 emissions by 1.1 Gt, it promises substantial benefits in transportation, buildings, and heating, contributing to a noteworthy decrease in CO
2 emissions by 95 Mt and 3.1 Gt, respectively. Remarkably, green hydrogen exhibits a unique capacity to fulfill 15% of the seasonal storage demand in the electricity sector [
10]. Looking toward the future, the European Union (EU) envisions a substantial shift, projecting the production of 665 TWh of hydrogen by 2030 and setting an ambitious target of 2250 TWh by 2050. This represents a significant stride toward meeting 24% of the EU’s energy requirements with green hydrogen [
11]. The International Energy Agency predicts that the global renewable hydrogen capacity will grow by 45 GW from 2023 to 2028, which constitutes only 7% of the projects announced for this timeframe. More than 75% of this expansion is expected to occur in China, Saudi Arabia, and the United States, underlining their dominant positions in advancing the global green hydrogen market [
12].
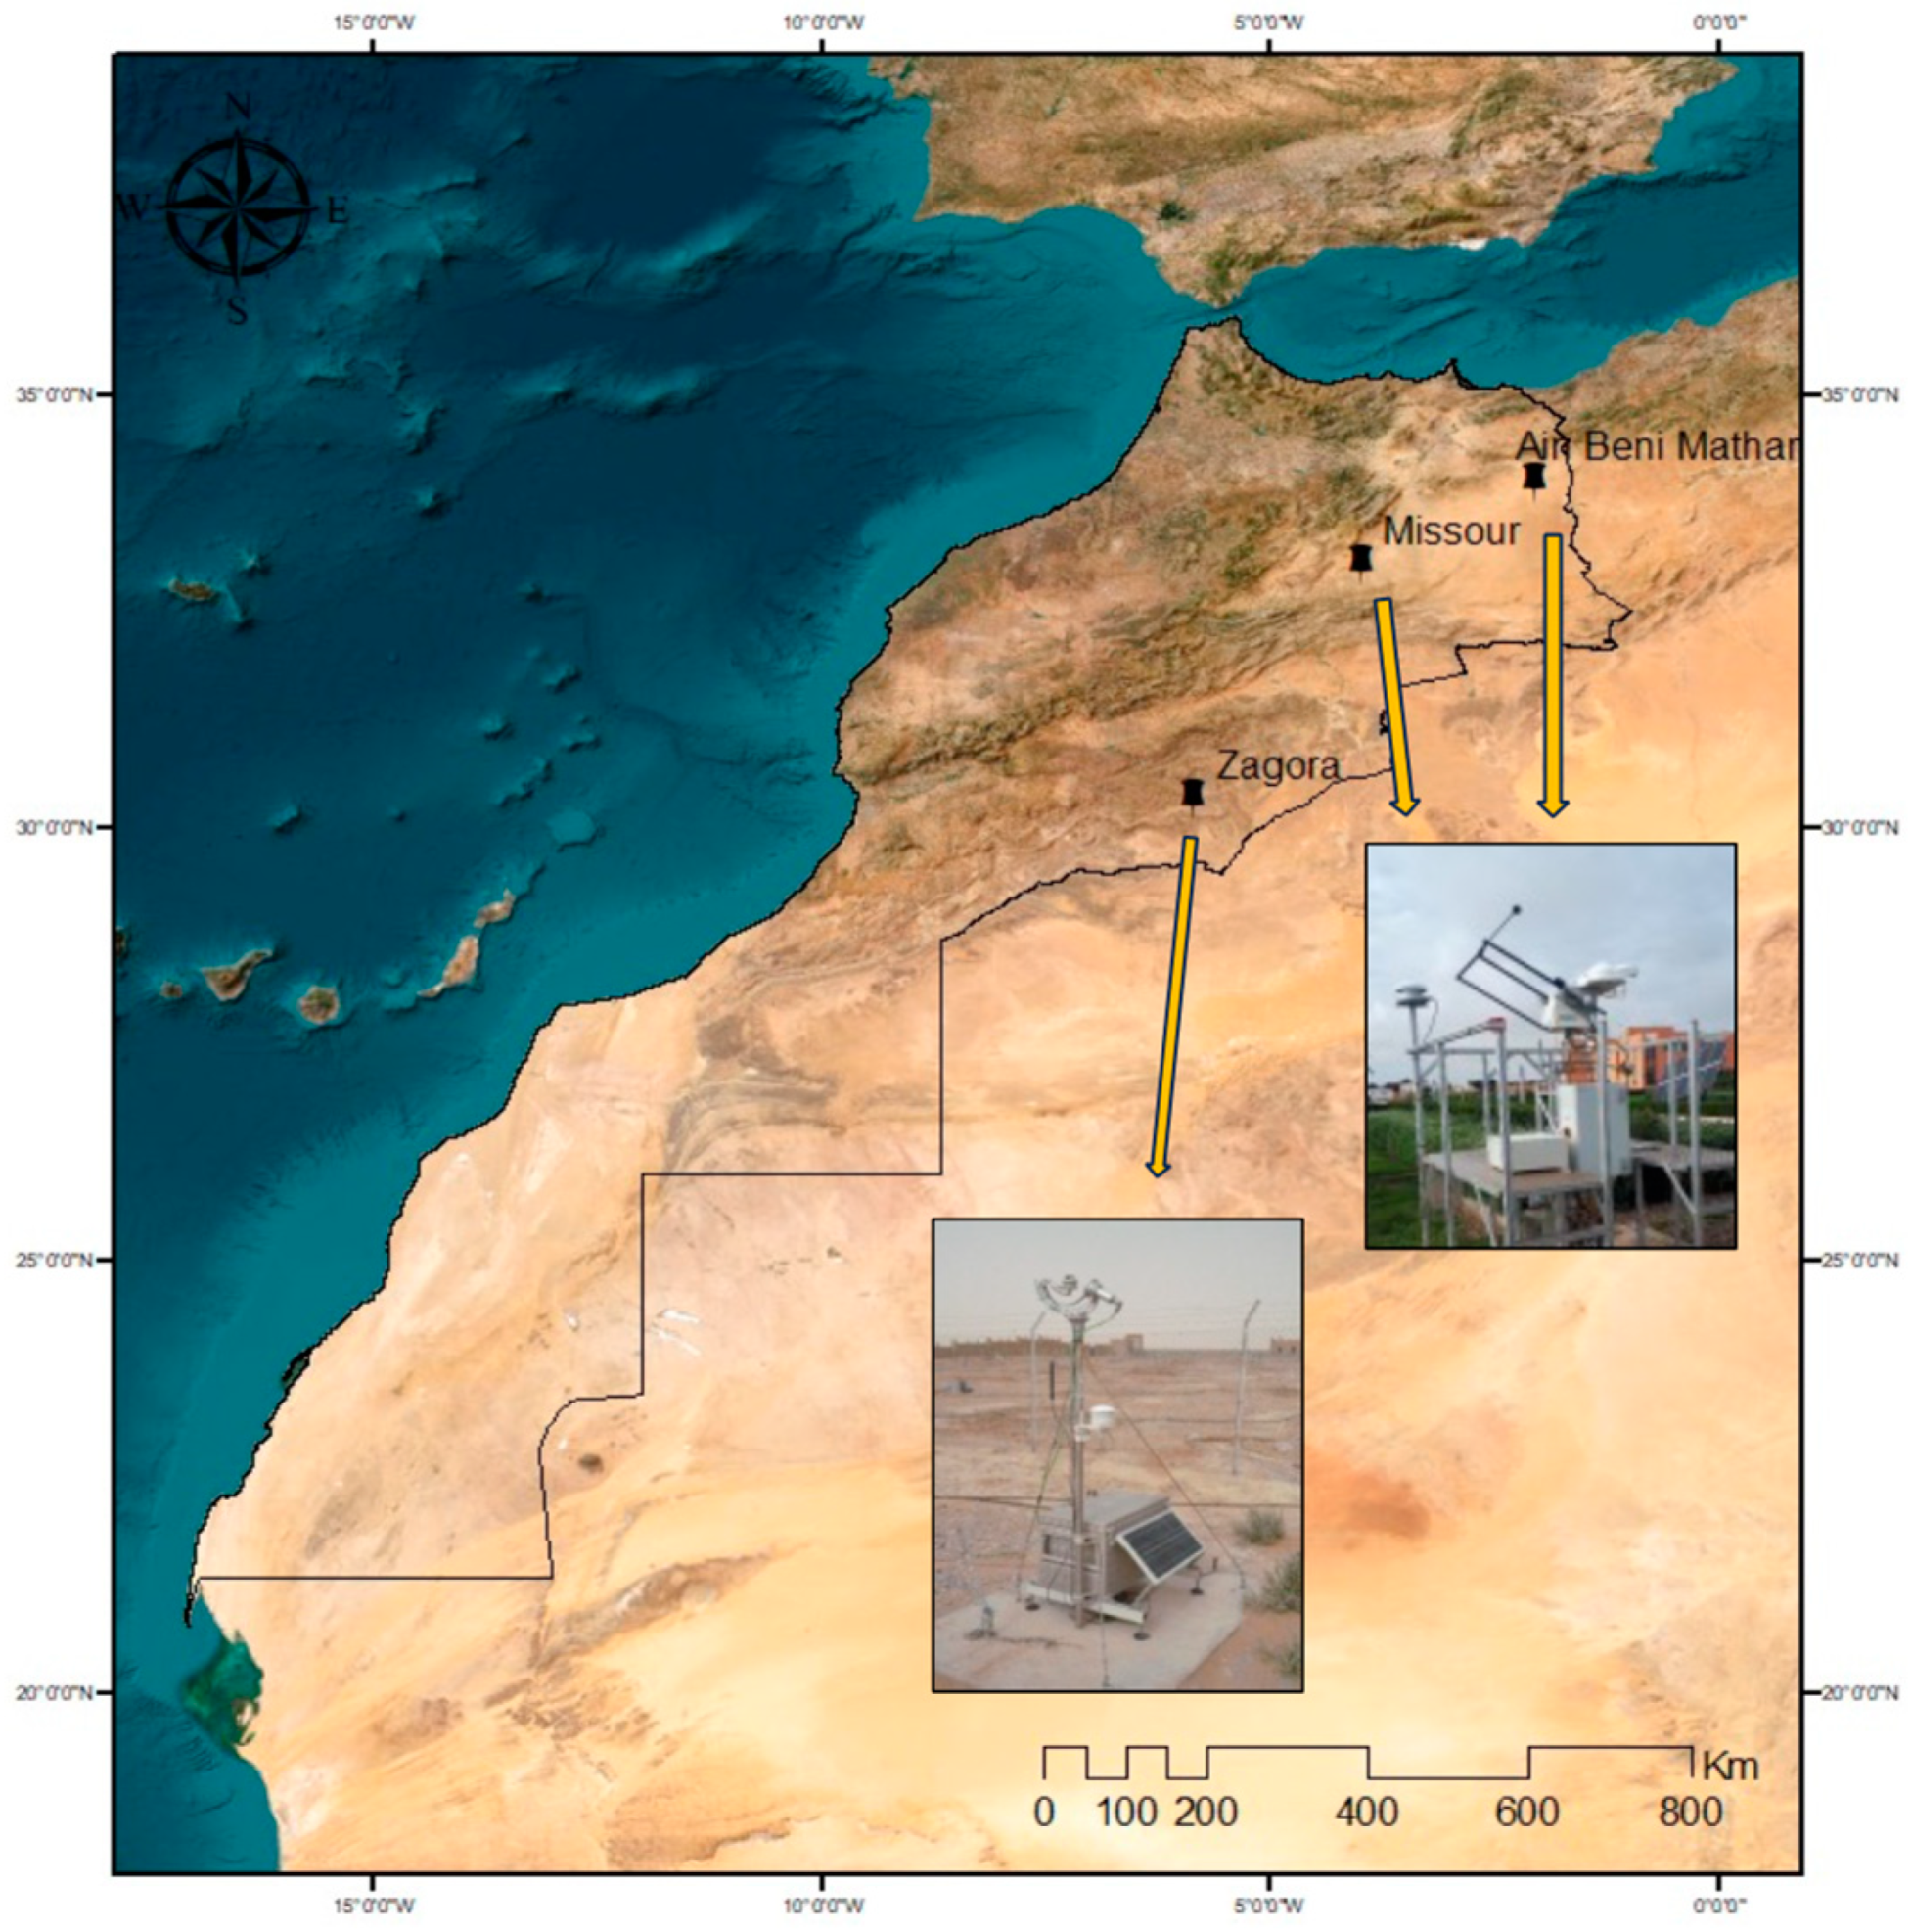
Morocco, our case study, stands out as a prominent player in the global shift towards renewable energy, making substantial strides in sustainable practices. The nation boasts significant installed capacities: 850 MW in solar energy, 920 MW in hydroelectric power, and 759 MW in wind power. Notable among Morocco’s projects is the Noor complex, a colossal initiative with a total capacity of 580 MW, ranking among the world’s most powerful projects [
13]. Further emphasizing Morocco’s commitment to a diversified renewable energy portfolio are specific projects, including the Noor Tafilalt solar photovoltaic endeavor, with a capacity of 120 MW, and the Oum Er-Rbia river project, contributing an installed capacity of 365 MW [
13]. Looking ahead, Morocco has set an ambitious target of achieving a 52% penetration rate of renewable energy by 2030 [
14]. This goal reflects the nation’s dedication to sustainable development, showcasing its leadership in adopting cleaner, more environmentally friendly energy sources.
Leveraging its substantial capacities in solar, hydroelectric, and wind energy, Morocco showcases considerable potential in power generation, especially in the realm of green hydrogen production [
15]. The production of hydrogen involves a range of methods, incorporating both hydrocarbon reforming and renewable sources. Hydrocarbon reforming techniques, such as steam reforming and partial oxidation, play a significant role in the generation of hydrogen. Furthermore, renewable sources present eco-friendly pathways for hydrogen production. Processes involving biomass, classified into thermochemical and biological processes, showcase the viability of extracting hydrogen from organic materials. Another crucial avenue is water splitting, utilizing electrolysis, thermolysis, and photo-electrolysis for the extraction of hydrogen [
16]. In our study, we are interested in the production of hydrogen from electrical energy; among the most effective methods in this sense is the use of water electrolysis. There are several types of water electrolyzer, such as alkaline electrolyzers, proton exchange membrane (PEM) electrolyzers, and solid oxide electrolyzers. The selection of the PEM electrolyzer was driven by its superior efficiency, extended operational lifespan, and compatibility with the fluctuating electricity generated from renewable energy sources [
17].
Water electrolysis can be powered by electricity produced by solar technologies for the production of hydrogen [
18]. Photovoltaic (PV) and concentrating solar power are the most commonly used solar systems which offer a price that improves over time [
19]. Research into the production of hydrogen, whether through photovoltaic systems or concentrating solar power, is receiving increasing attention. Touili et al. [
20] utilized high-precision global horizontal irradiation (GHI) data for simulations across 76 sites in their investigation of Morocco’s hydrogen production potential with a photovoltaic electrolyzer system. This comprehensive approach revealed the substantial annual hydrogen production potential for Morocco, ranging from 6489 to 8308 tons/km
2. In terms of economic analysis, the study indicates that electricity and hydrogen production costs vary from 0.077 to 0.099
$/kWh and 4.64 to 5.79
$/Kg, respectively. In another study, Amrani et al. proposed a water-based method, combining the analytical hierarchy process and geographic information system, to identify optimal sites for large-scale photovoltaic-powered hydrogen production in the eastern region of Morocco. The research examined three integration scenarios, assessing various water sources for the electrolyzer feed: surface water, groundwater, and seawater. The study findings indicate that selecting the surface water scenario is the most advantageous, with the highest annual hydrogen production of 1875 tons and a cost of 3.690
$/kg. Fereidooni et al. [
21] investigated the feasibility of hydrogen production through electrolysis, leveraging a photovoltaic power system. Assessing a 20 kW photovoltaic power station in Yazd City, Iran, through both experimentation and simulation, the study unveiled that the station’s actual output holds promise for producing approximately 373 tons of hydrogen annually. Furthermore, the average monthly hydrogen production is anticipated to be 48.6 tons for real power and 48.3 tons for simulated power. Gutiérrez-Martín et al. proposed a methodology for designing (Photovoltaic-Hydrogen) PV-H2 hybrid systems, analyzing weather data and electrical variables. The study explored configurations with and without batteries in Madrid and Fisciano, emphasizing the trade-off between efficiency, subsystem sizes, and costs. Results indicated that directly connected (PV-electrolyzer) PV-EL systems can work but involve higher energy and battery costs. They also achieve high coupling factors without power-tracking devices, but optimizing PV-EL coupling reduces solar field requirements while increasing electrolyzer sizes. Battery-assisted electrolysis reduces electrolyzer sizes [
22]. Sayedin et al. explored two optimization scenarios: minimizing energy transfer losses and the cost of hydrogen production to determine the impact of climate conditions on the performance of PV/PEM electrolyzers. The study focused on six Iranian cities. The research identified the cities of Shiraz and Isfahan as having the lowest hydrogen production costs, measured at 7.32
$/Kg and 7.39
$/Kg, respectively [
23]. Concentrating solar power stands out as a potential solar technology for integration with an electrolyzer for hydrogen production. However, studies in this domain are less prevalent compared to other renewable energy sources like PV. Boudries et al. conducted a techno-economic study on solar-electrolysis for hydrogen production, focusing on a hybrid solar parabolic trough-gas power plant–electrolysis system in Algeria. Examining factors like direct normal irradiance and solar fraction, the study analyzed two sites in northern and southern Algeria to understand climatic impacts. The results revealed that hydrogen production costs were predominantly influenced by energy production costs, particularly dependent on solar fraction and solar insolation. The study also underscored the competitive advantage of solar CSP-based hydrogen production over traditional PV-based methods [
24]. Moradi Nafchi et al. examined a high-temperature PEM electrolyzer integrated with a concentrating solar power (CSP) plant and thermal energy storage (TES) for concurrent hydrogen and electricity production. Employing finite-time thermodynamic analysis and exergy concepts, the study identified the influences of solar intensity, electrolyzer parameters, and working temperature. A TES subsystem ensured continuous hydrogen and electricity generation, yielding efficiencies of 20.1% for generation and 41.25% for exergy. However, with TES supplying energy, overall energy and exergy efficiencies decreased to 23.1% and 45%, respectively [
25]. Puig-Sampe et al. conducted a forward-looking life cycle assessment, concentrating on the key performance parameters anticipated in 2030. Their findings revealed that parabolic trough CSP coupled with a solid oxide electrolyzer presents a promising environmental solution, resulting in a prospective hydrogen carbon footprint of 1.85 kg CO
2 eq/kg H
2. Significantly, this system demonstrates substantial reductions in the hydrogen carbon footprint compared to future hydrogen from steam methane reforming (by 81%) and grid electrolysis (by 51%) in the year 2030 [
26].
Photovoltaic systems and concentrating solar power can be combined in hybrid systems for hydrogen production. For example, Tang et al. proposed an integrated system, combining hybrid CSP/PV with a solid oxide electrolyzer for electricity generation and hydrogen production; this research found that ensuring a continuous electricity supply requires a solar multiple of 2 and a thermal storage size of 14 h. The solid oxide electrolysis cell (SOEC) stack, operating at 275 Watts, demonstrated superior techno-economic performance. The hybrid system was characterized by a competitive levelized cost of electricity (LCOE) of 0.219
$/kWh and a levelized cost of hydrogen (LCOH) at 7.5
$/kg [
27]. Khouya et al. explored hydrogen production using polymer electrolyte membrane electrolysis powered by solar and concentrated photovoltaic thermal technologies. Simulations in Morocco revealed annual electricity and hydrogen production without thermal storage at 106.5 GWh and 1.87 million kg, with an overall efficiency of 20% and a 34% capacity factor. The levelized cost of hydrogen for the combined renewable system without thermal storage was 6.86
$/kg. Furthermore, the optimal hydrogen production occurred when the solar installation was three times oversized, resulting in a levelized cost of hydrogen of 4.07
$/kg [
28].
Despite the existence of numerous studies focused on the techno-economic analysis of hydrogen production, research on hybrid CSP/PV systems remains limited, particularly in Morocco. This is notable given Morocco’s significant potential to become a key player in the future hydrogen market, thanks to its abundant solar resources and strategic position. This study aims to fill the research gap by thoroughly investigating the technical and economic viability of hybrid CSP/PV systems for hydrogen production in various Moroccan regions. By capitalizing on the country’s rich solar resources and advantageous geographic location, the research focuses on identifying optimal system configurations that balance efficiency and cost-effectiveness. Additionally, it examines the capacity of these hybrid systems to maximize hydrogen production, minimize associated costs, and enhance Morocco’s position as a key stakeholder in the global hydrogen economy. Furthermore, a sensitivity analysis has been conducted to evaluate the impact of electrolyzer investment cost drop on the hydrogen production costs. The findings highlight the superior performance of the hybrid CSP-PV system, especially when integrated with single-axis PV tracking. This configuration emerges as the most cost-effective, delivering the lowest levelized cost of hydrogen (LCOH2) among all analyzed setups. In terms of cost reduction, the single-axis CSP/PV system outperforms the two-axis counterpart, decreasing hydrogen production costs by 11.19% in Zagora, 9.76% in Missour, and 9.13% in Ain Beni Mathar. Additionally, it enhances hydrogen output by approximately 10% compared to the non-tracking CSP/PV system. In addition, the hybrid SD-CSP/PV system further underscores its advantages by increasing annual hydrogen production by 2.5% to 11.2% relative to the PV-only configuration. This configuration also achieves a remarkable 25% reduction in production costs compared to the standalone CSP-SD system, reinforcing its potential as a highly efficient and economically viable solution for hydrogen generation.
3. Results and Discussion
This section presents the study results, organized into three main parts. The first part details and discusses the hydrogen yield for each scenario across the three locations. Next, a comparative analysis between scenarios will highlight the technical and economic benefits of using a hybrid solar configuration. Finally, we present and discuss the sensitivity analysis results to determine the optimal CSP-PV hybrid configuration for the Moroccan context.
3.1. Yield Analysis of the Hydrogen Production
3.1.1. Scenario 1: Hydrogen Production from 10 MW PV-Fix System
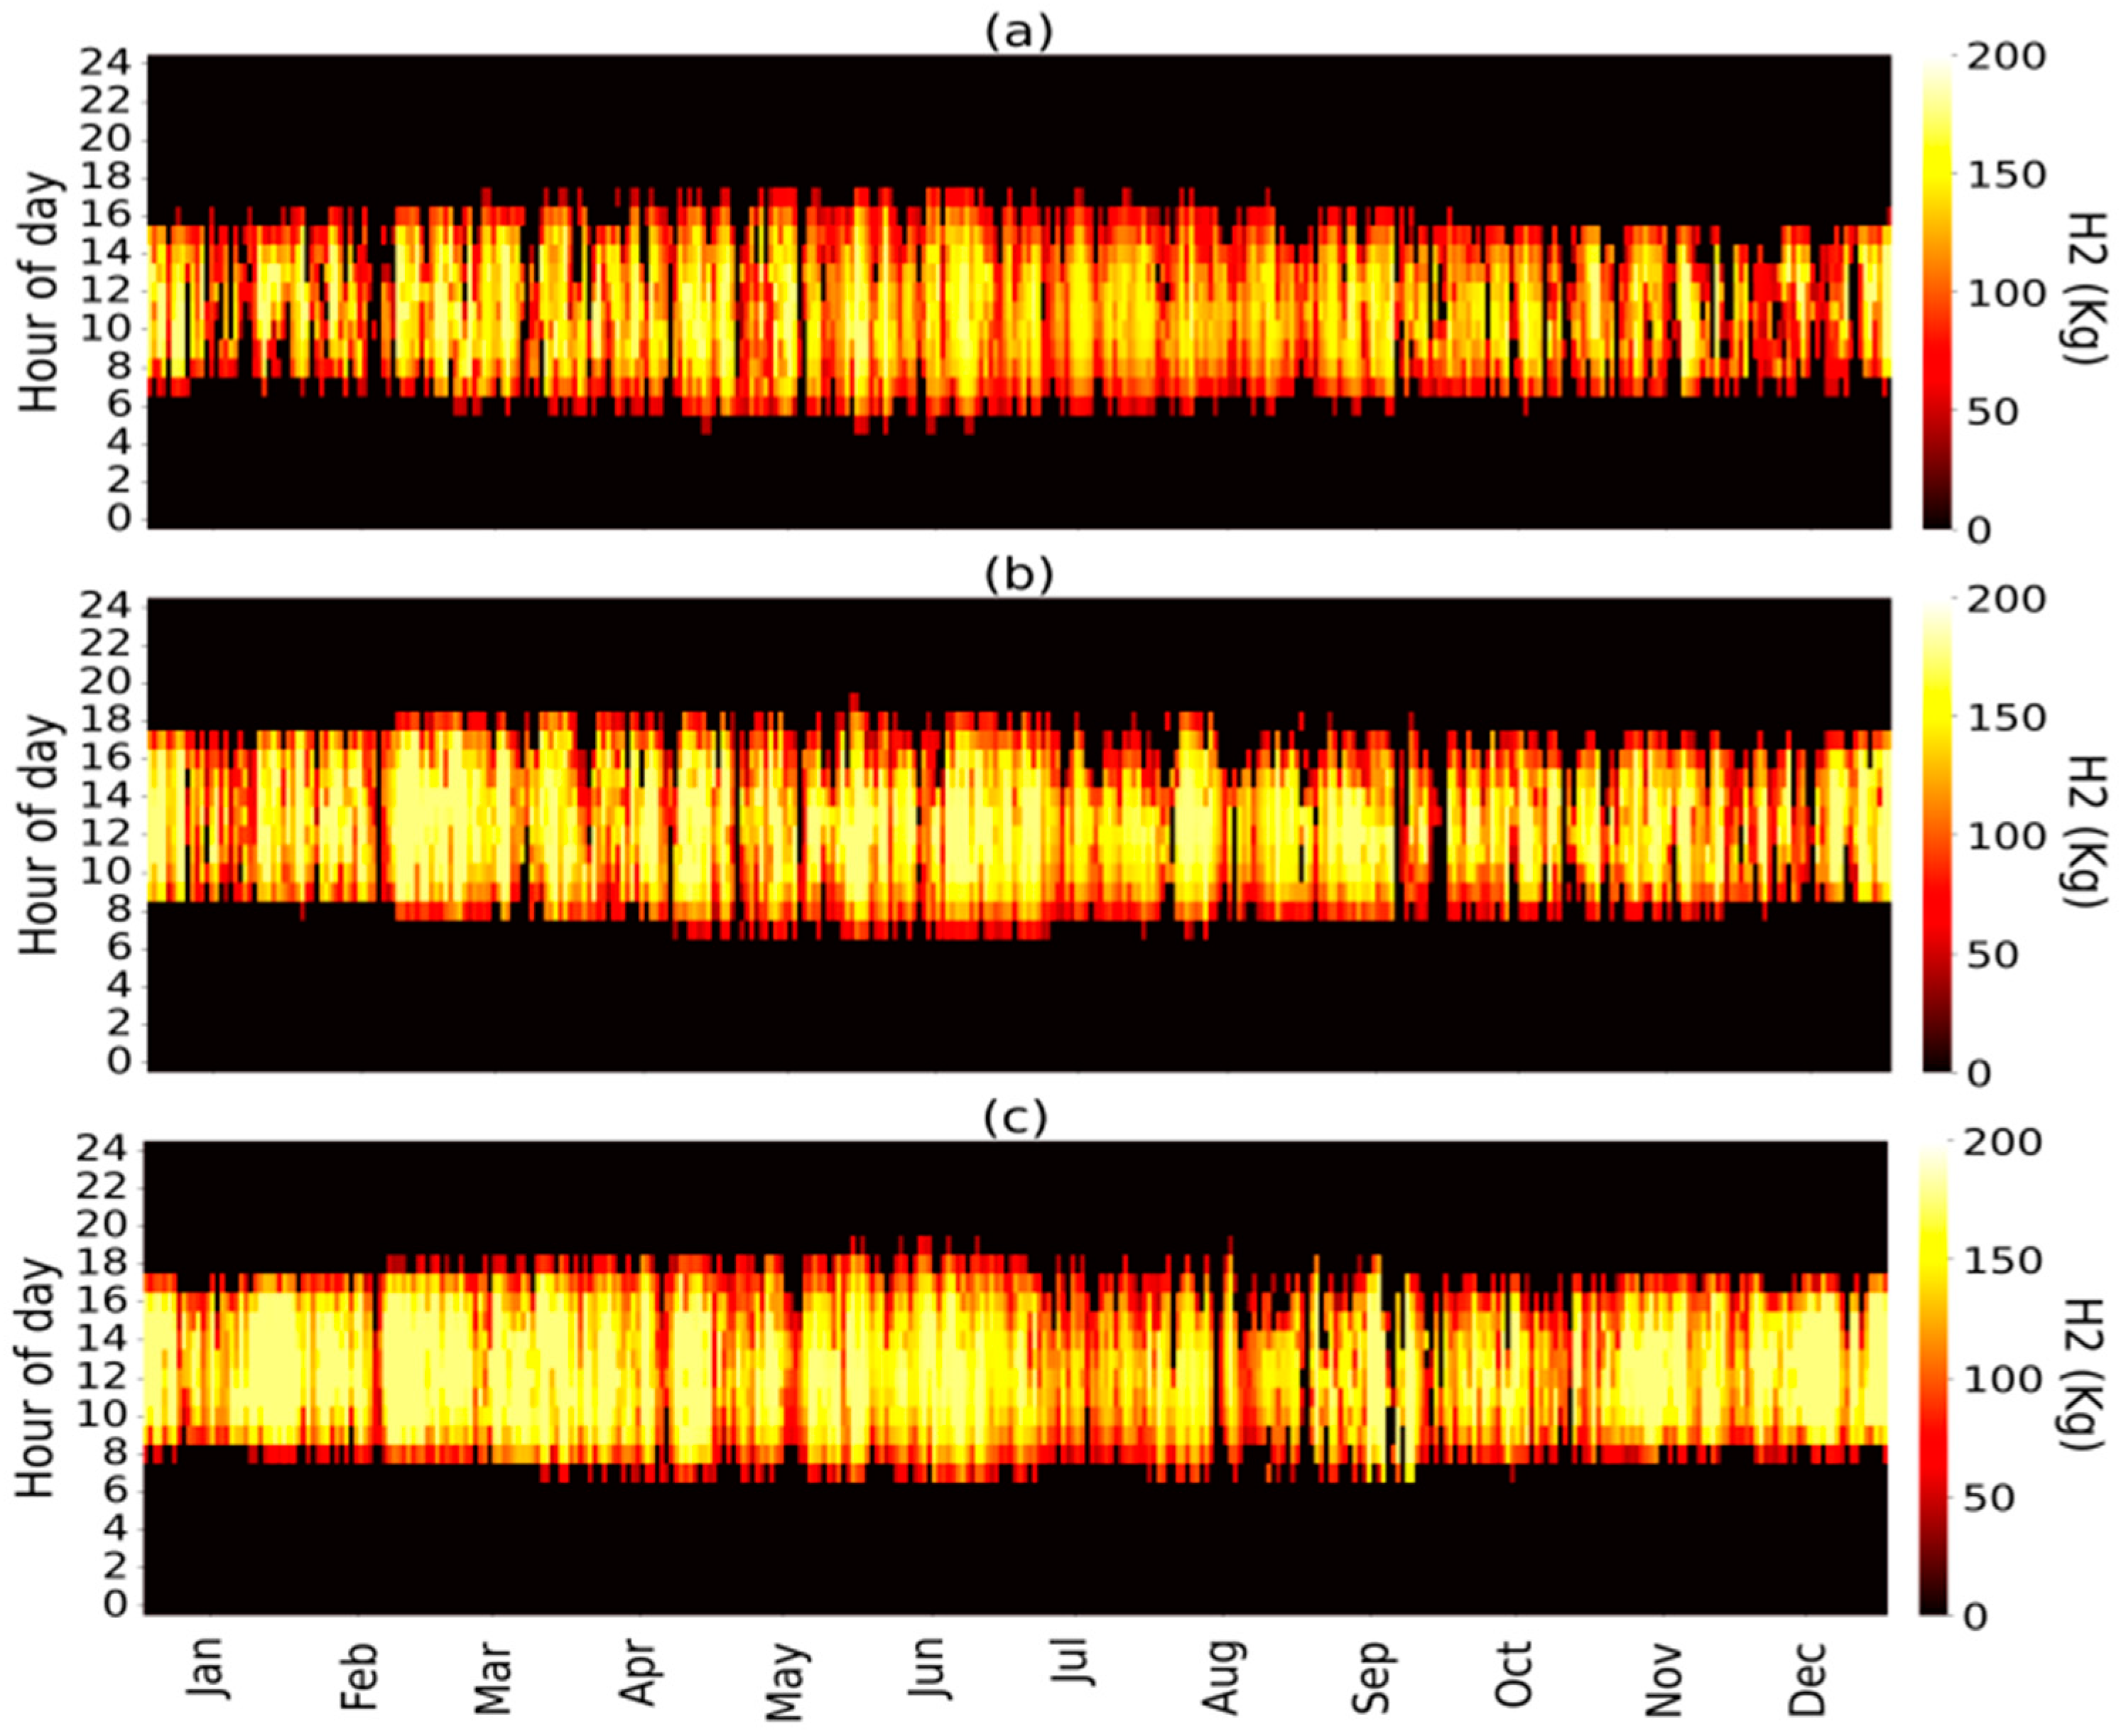
The initial analysis of hydrogen yield across the three selected locations focuses on the hourly distribution throughout the year, presented in a 2D heat map (see
Figure 7). As shown, hydrogen production closely follows the GHI pattern. Notably, the locations studied demonstrate consistent hydrogen production, exceeding 100 kg for approximately five hours daily throughout the year. During the spring, production sees a significant increase, with hydrogen yields surpassing 150 kg for at least three hours daily, particularly from 11:00 a.m. to 2:00 p.m.
Additionally, extended production hours—up to seven hours—are observed for yields above 100 kg. However, hydrogen production drops in the summer, with yields ranging between 100 and 140 kg. This reduction is expected due to high temperatures causing a drop in the efficiency and the PV modules performances [
37,
38].
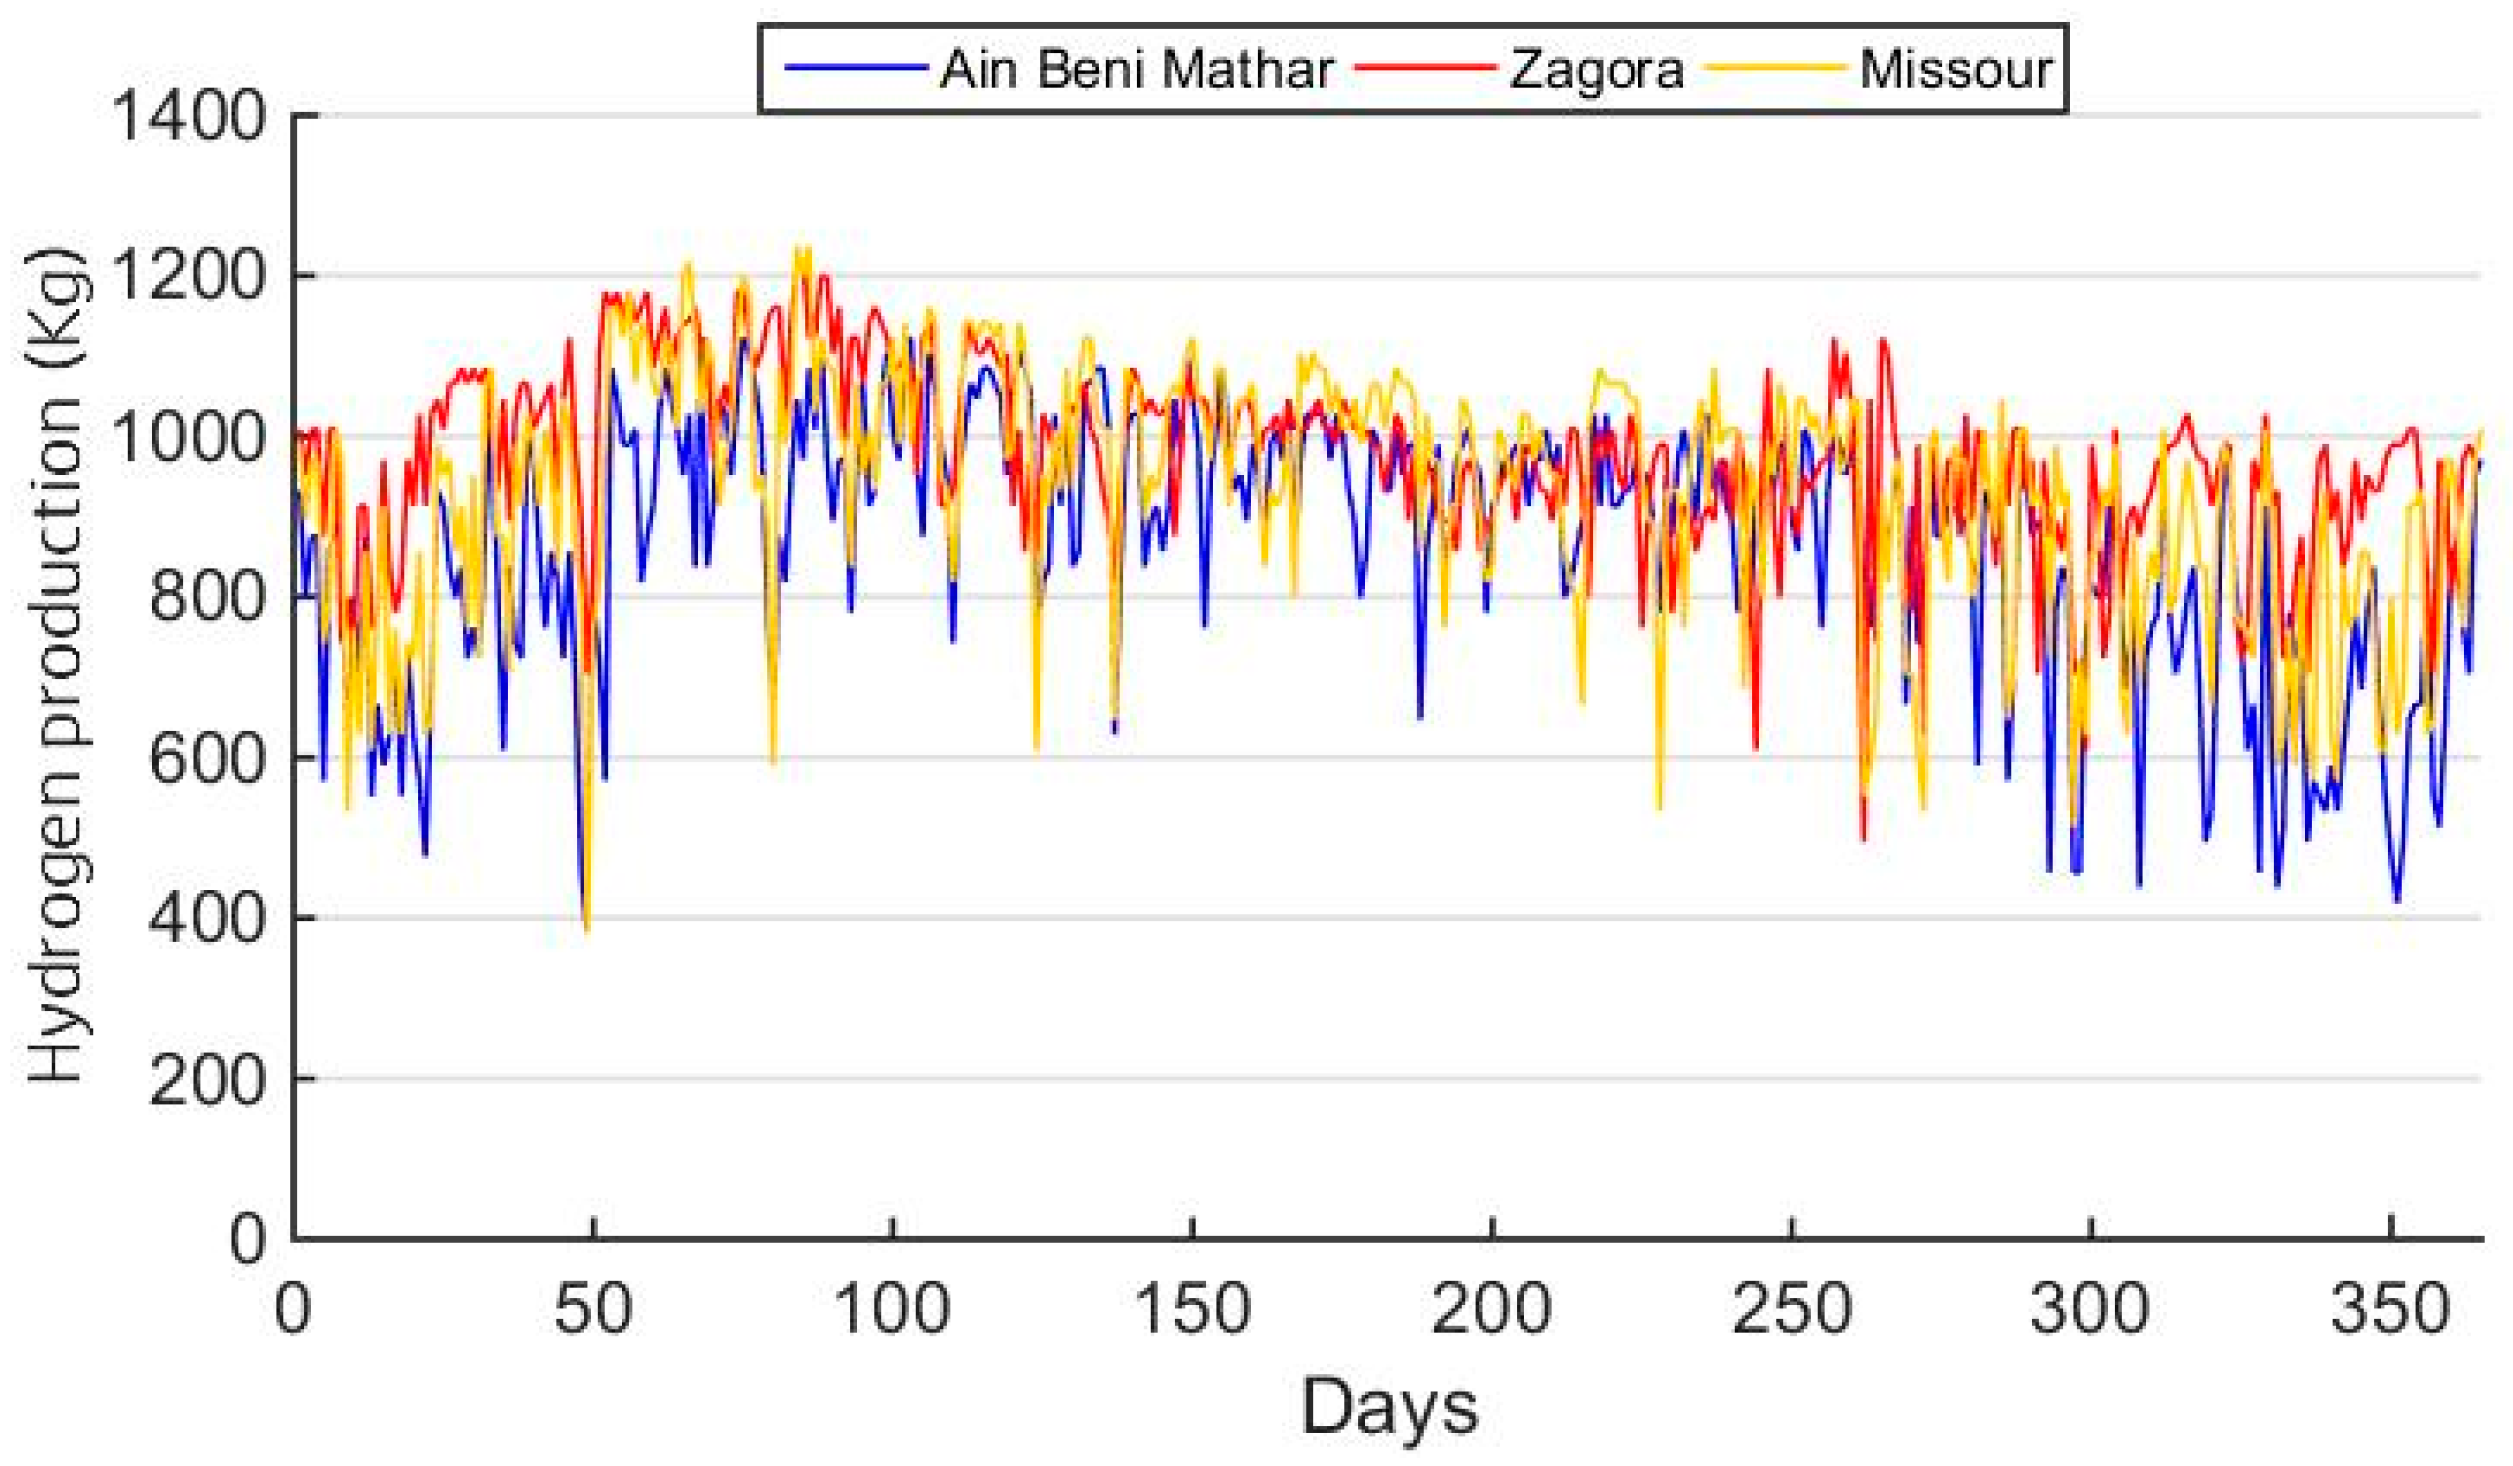
For a more detailed view of hydrogen production from PV systems,
Figure 8 illustrates daily hydrogen output by the 10 MW photovoltaic system. Hydrogen production ranges from 381 kg/day to 1295 kg/day across the three investigated locations, with daily averages of 903 kg/day, 973 kg/day, and 1026 kg/day for Ain Beni Mathar (ABM), Missour, and Zagora, respectively. A noteworthy observation is the relative consistency in hydrogen production during summer, where daily output is around 1000 kg, particularly in Zagora. In contrast, production shows significant variability during winter and fall, which is expected due to the intermittent nature of GHI measurements.
For a more general view,
Figure 9 illustrates the average monthly hydrogen production across the three sites, Ain Beni Mathar, Missour, and Zagora, revealing distinct differences in performance, with Zagora consistently producing the highest average hydrogen output. The monthly production at Zagora ranges from 27.35 tons to 34.85 tons, demonstrating significant seasonal variation, with peak production occurring in the early months of the year. Missour’s production fluctuates between 24.23 tons and 33.01 tons, following a similar seasonal trend but with slightly lower overall output. Ain Beni Mathar, on the other hand, produces the least hydrogen, with values ranging from 20.63 tons to 30.32 tons, and a gradual decline in production toward the latter months. These differences in hydrogen production can be attributed to variations in solar radiation, which are influenced by the sites’ distinct geographical locations and climatic conditions.
3.1.2. Scenario 2: Hydrogen Production from 10 MW SD-CSP System
The hourly variation in hydrogen production from the Stirling dish (SD) system throughout the year is shown in the 2D heat map in
Figure 10. The key observation is that the longest daily period of hydrogen production, lasting approximately 8 h, occurs during the spring and summer. For example, in June at Ain Beni Mathar, hydrogen production exceeding 160 kg lasts for 8 h per day. However, in fall and winter, the number of production hours decreases, although the amount of hydrogen produced per hour increases. This trend is consistent across all locations, with Zagora showing a more pronounced effect. In February, for instance, Zagora experiences hourly hydrogen production ranging between 175 and 190 kg for a continuous 7 h period.
From the initial observations and by comparing the results of the Stirling dish (SD) system with those of the photovoltaic (PV) system, it is clear that the CSP-SD system is highly efficient and could potentially be the optimal solution for hydrogen production in Morocco. However, given the high costs associated with this technology, an economic analysis must first be conducted to draw a definitive conclusion. Further details of this comparison will be discussed in the following sections.
Regarding daily hydrogen production, as shown in
Figure 11, the Stirling dish (SD) system is capable of generating significantly more hydrogen compared to the PV system. The daily average hydrogen production is 961 kg/day, 1133 kg/day, and 1269 kg/day for Ain Beni Mathar, Missour, and Zagora, respectively. However, it is important to note that hydrogen production, across all locations, exhibits low consistency throughout the year. This variability may not be ideal for clients seeking a stable hydrogen production rate across all seasons.
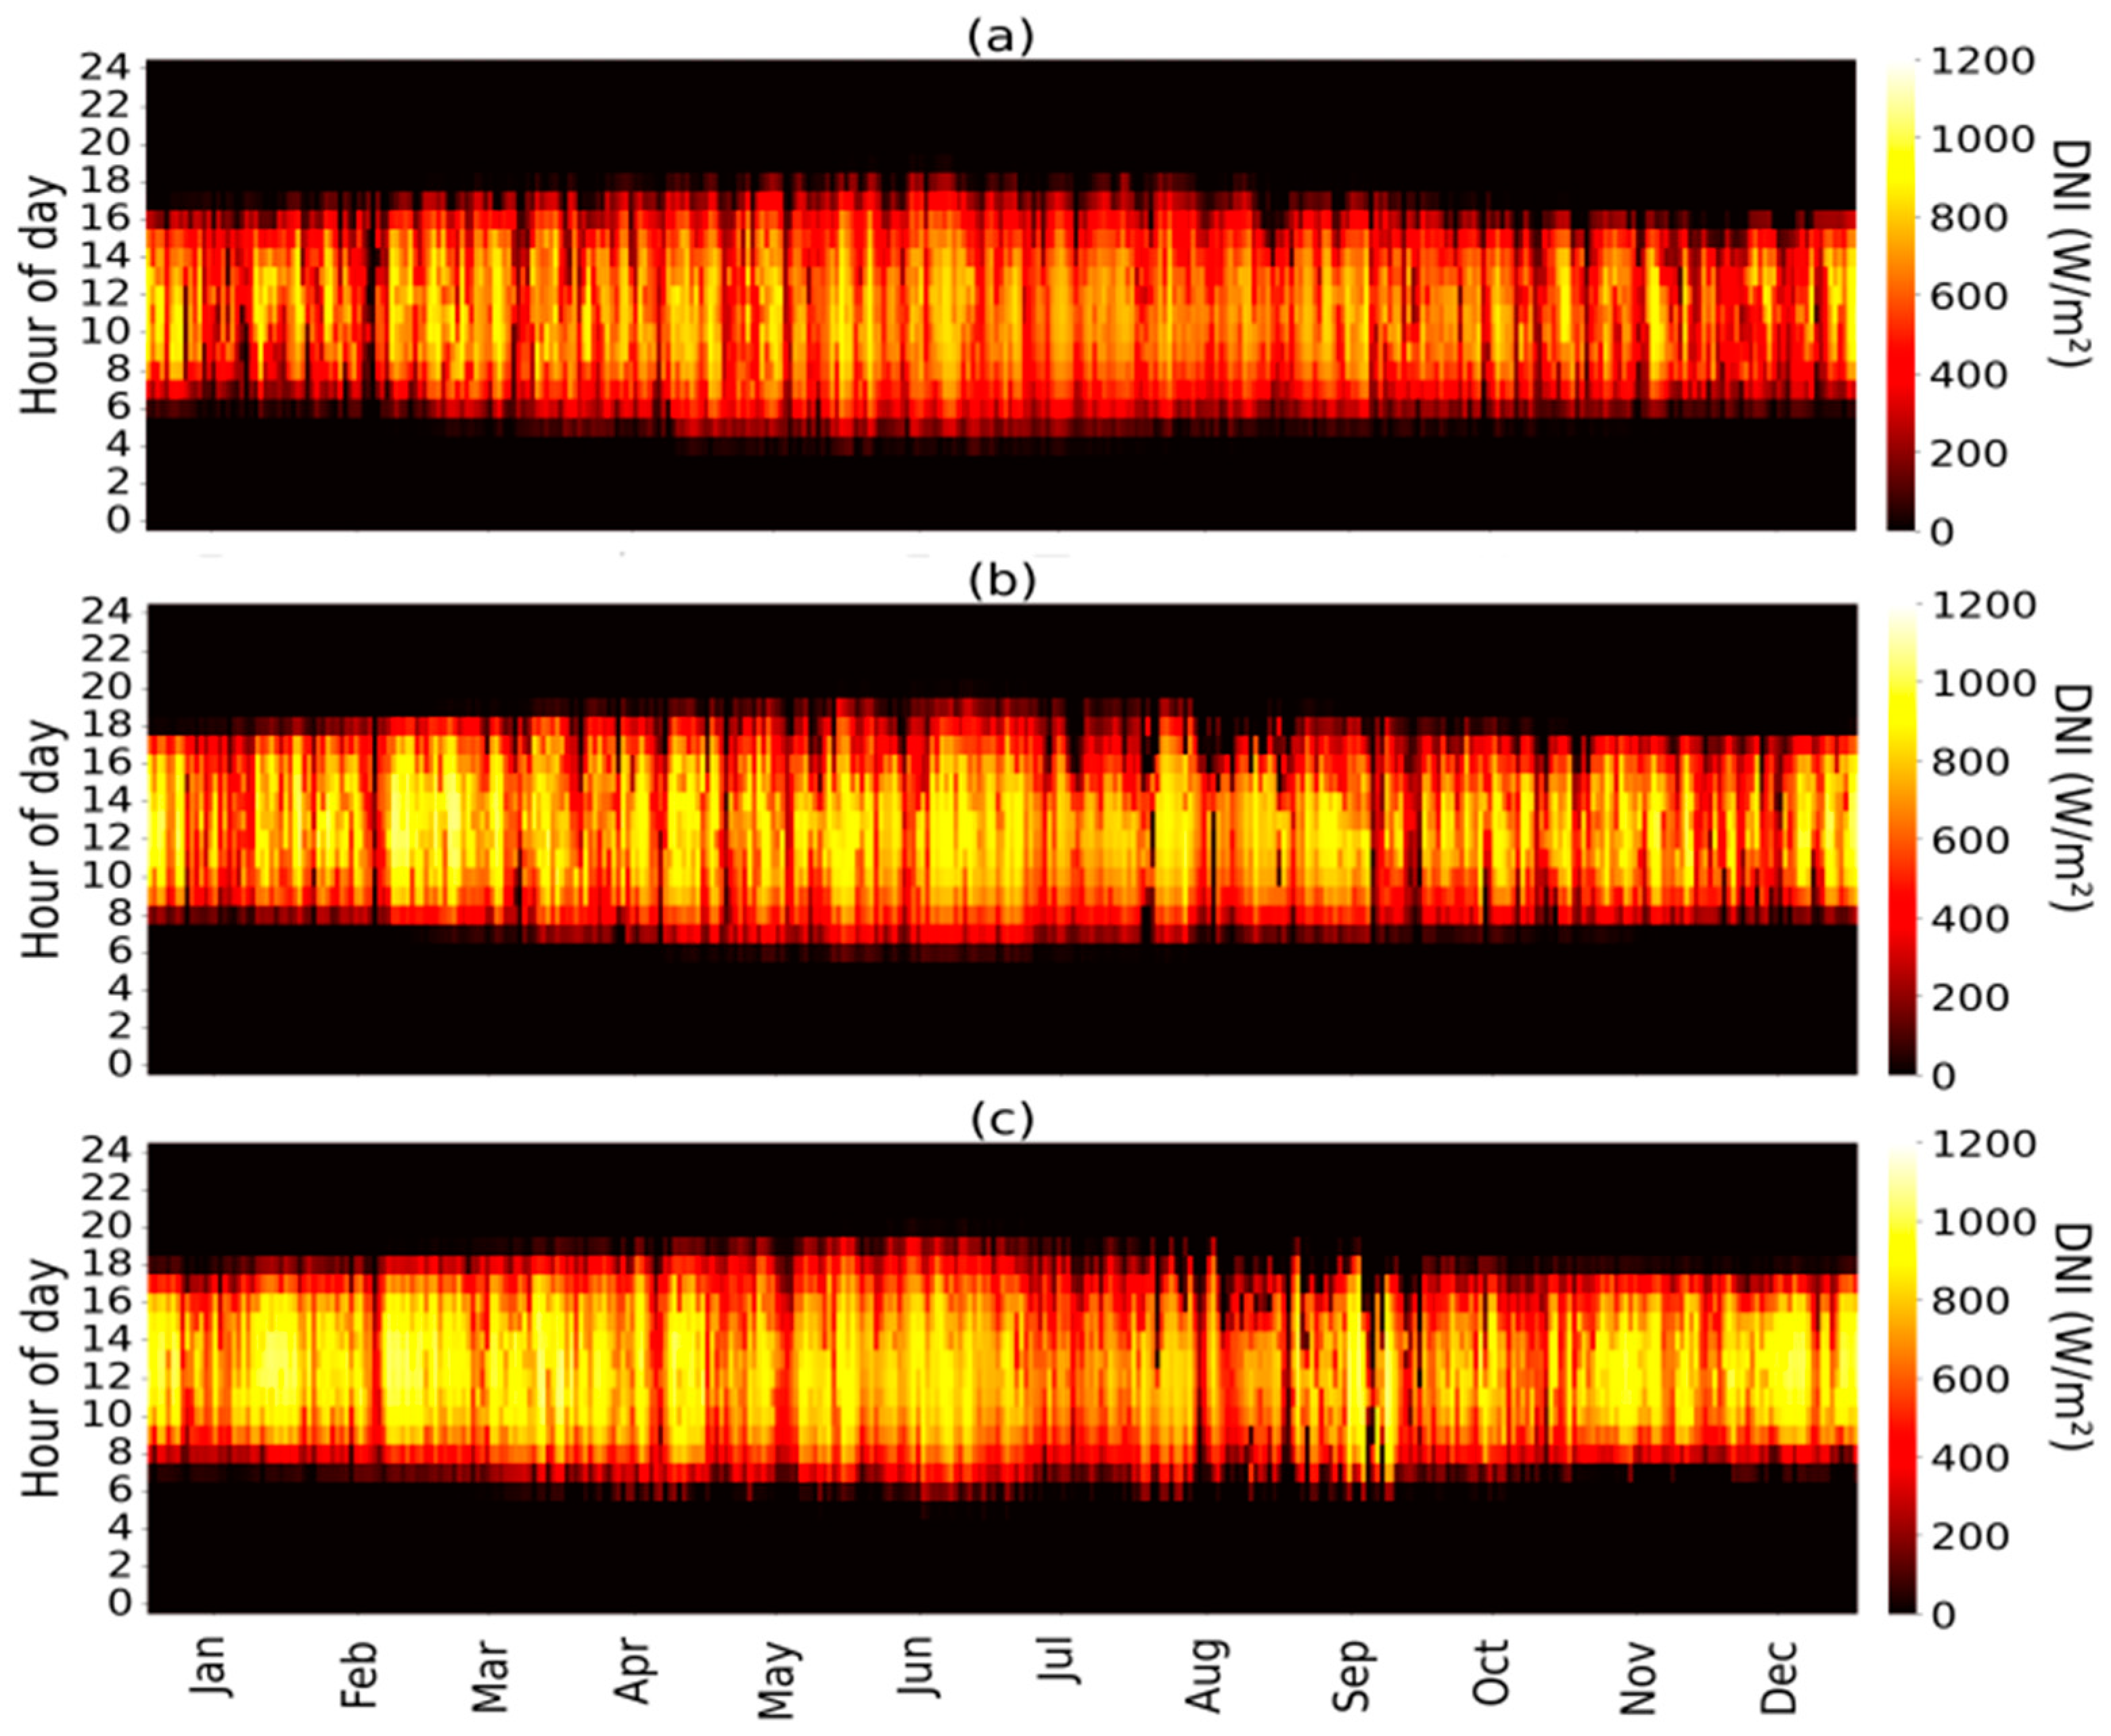
Additionally, unlike PV systems, there are days when hydrogen production from the SD system is nearly zero. This is due to the operational limitations of the Stirling dish system, which requires a minimum DNI value of 300 W/m
2 to initiate operation [
29]. This limitation can be mitigated by hybridizing the SD technology with PV, allowing for a more continuous production of hydrogen throughout the year.
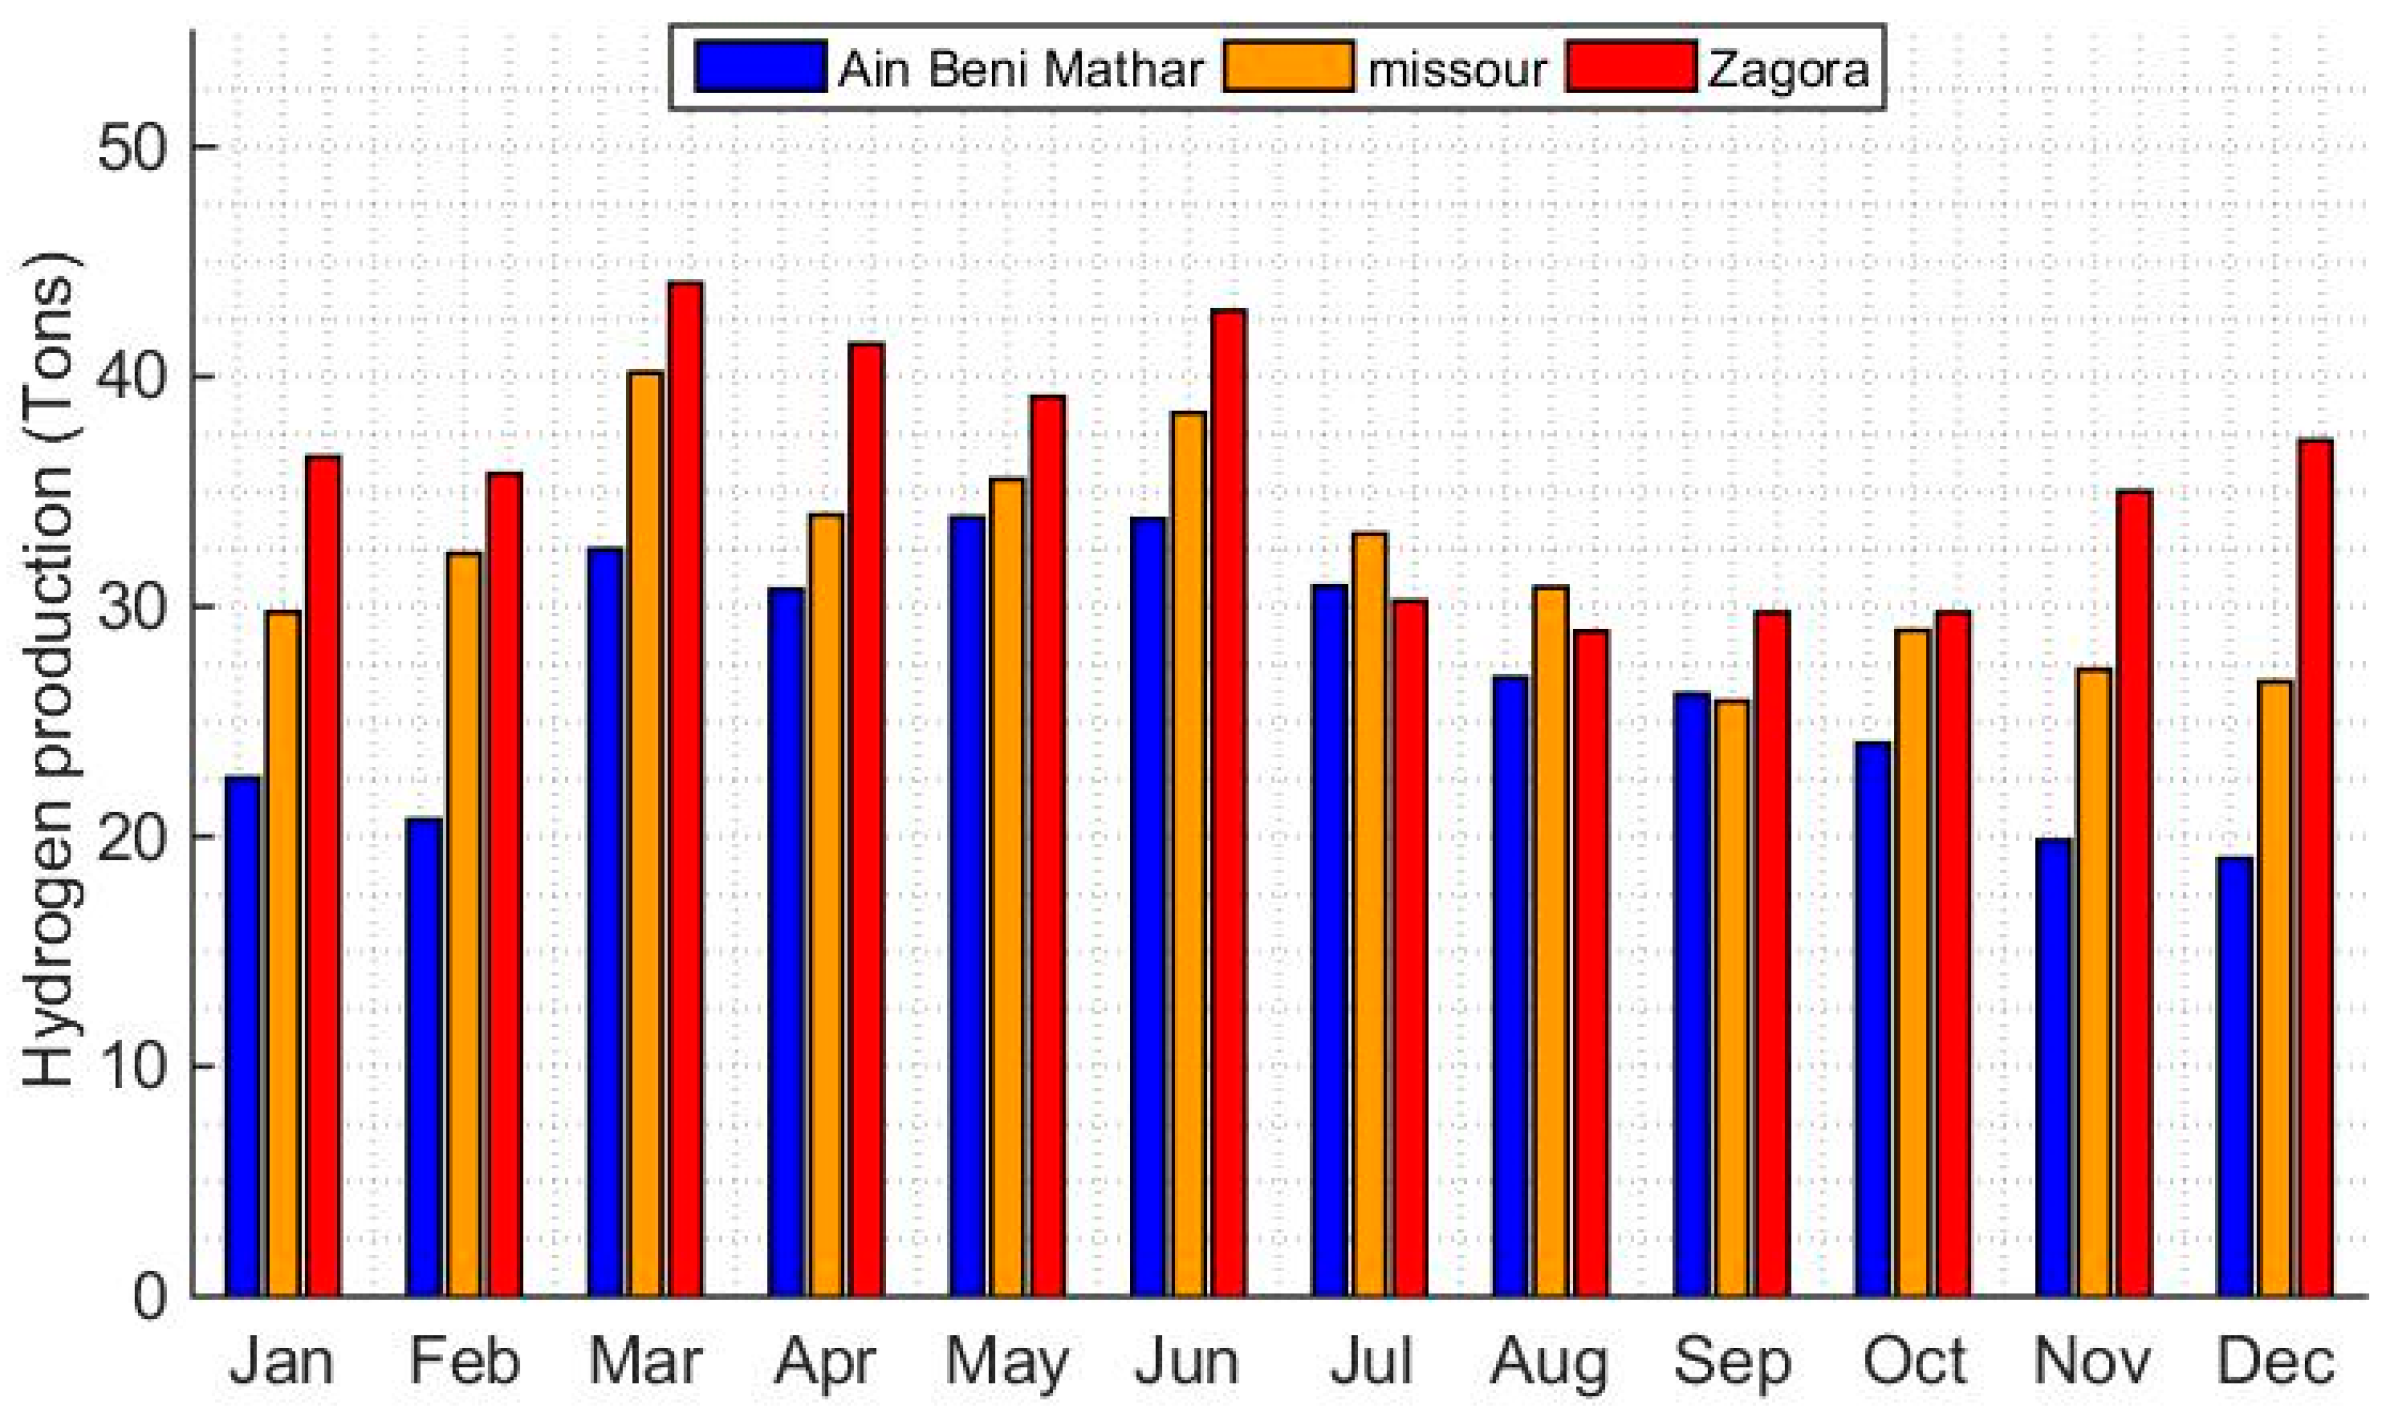
Regarding the monthly patterns,
Figure 12 illustrates the hydrogen production trends at Ain Beni Mathar, Missour, and Zagora, with each site influenced by local solar resources. Zagora consistently achieves the highest production, ranging from 28.93 tons in August to 44.06 tons in March, benefiting from optimal solar irradiance, especially in spring. Missour’s production ranges between 25.88 tons and 40.17 tons, peaking from March to May and declining in winter due to lower solar availability. Ain Beni Mathar shows stable but lower production, from 19.05 tons in December to 33.88 tons in May. Overall, Zagora leads in production, while Missour shows greater seasonal variation and Ain Beni Mathar maintains a consistent but lower output.
3.1.3. Scenario 3: Hydrogen Production from 10 MW Hybrid SD-PV System
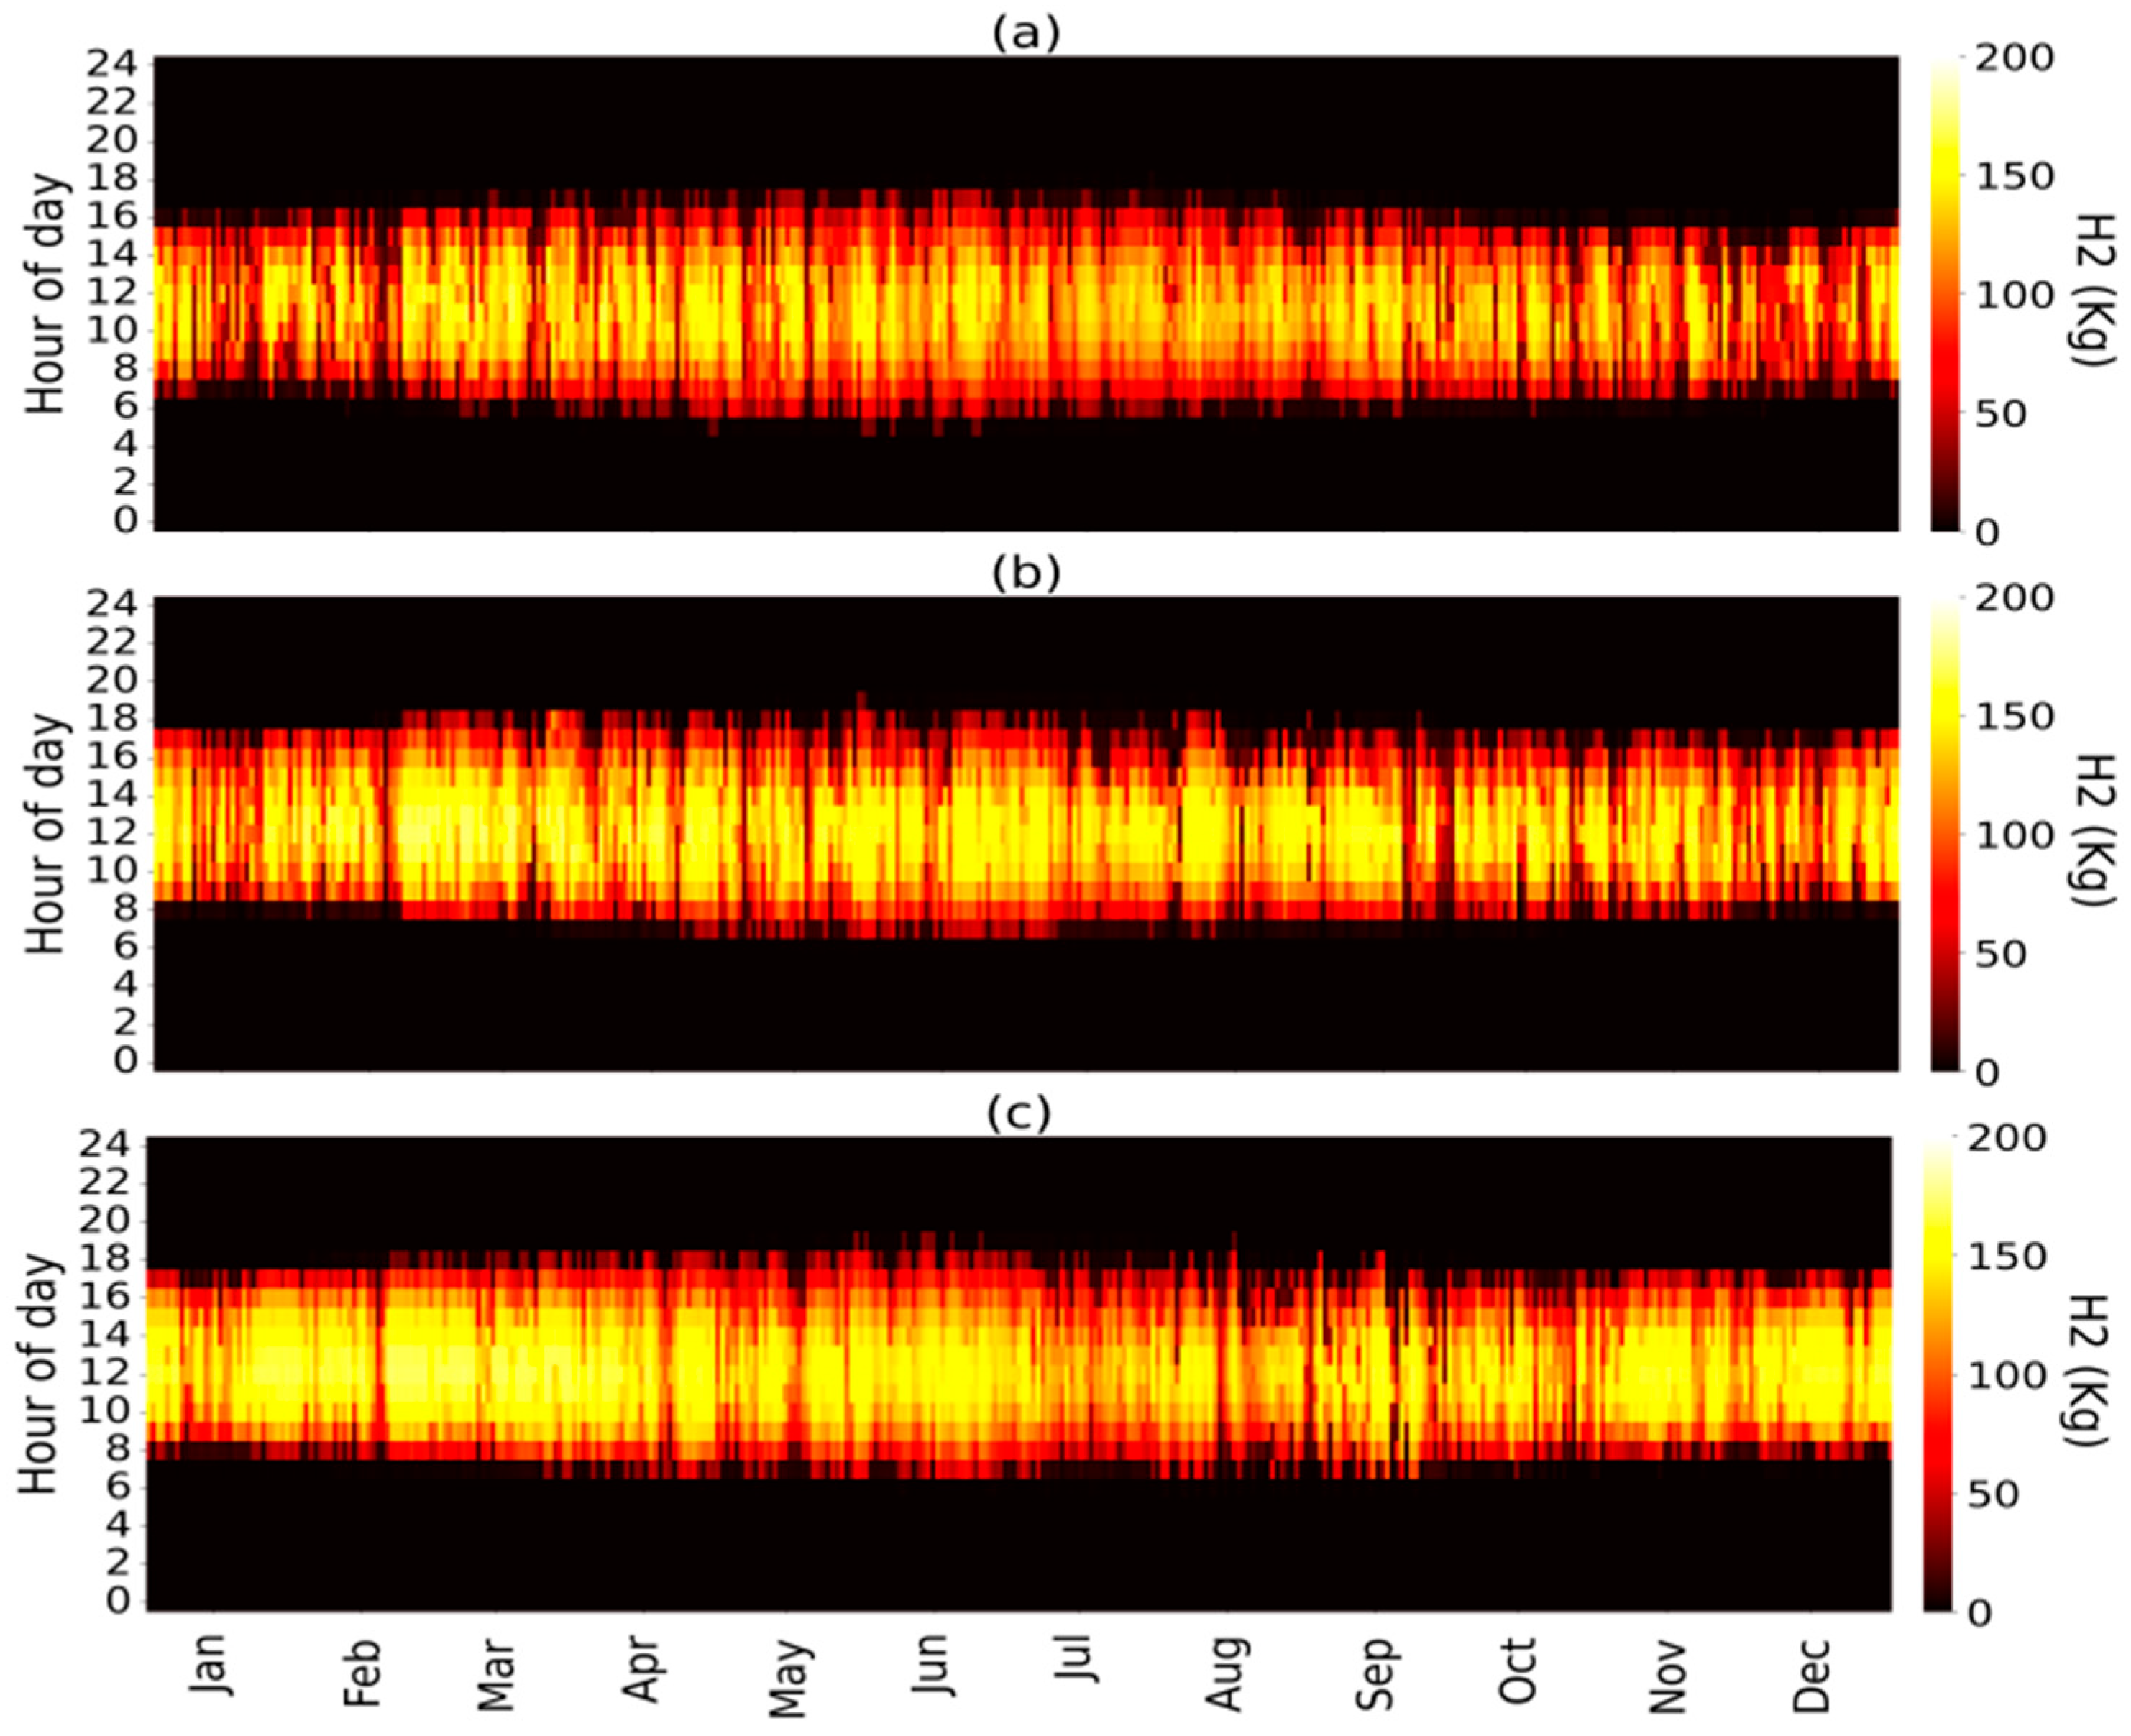
The hourly hydrogen production from the hybrid configuration throughout the year is shown in
Figure 13. A key observation is that the hydrogen production profile demonstrates an increase in production compared to the PV system, as well as a higher level of consistency compared to the SD-CSP system. The increased red areas indicate higher hydrogen production levels. Notably, the hydrogen production exceeds 100 kg/day for all three locations throughout the year, lasting at least 8 h per day during spring and summer, and 6 h per day during winter and fall. This results in an additional 3 h of production (exceeding 100 kg/day) compared to the PV system alone.
The hybrid configuration consistently produces more than 150 kg of hydrogen per hour year-round, showing stability without the fluctuations seen in the CSP-SD system. Specifically, it maintains at least 4 h of high hydrogen production (above 150 kg) daily and throughout the year, with the production duration extending to 6 h/day during spring and summer.
Regarding daily hydrogen production, the results are presented in
Figure 14. As shown, the hybrid CSP-SD/PV system demonstrates a significantly higher capacity for hydrogen generation compared to PV alone across all locations. Daily production generally ranges from 190 kg/day to 1571 kg/day, with daily averages of 932 kg/day, 1054 kg/day, and 1104 kg/day for Ain Beni Mathar, Missour, and Zagora, respectively.
Although the PV system alone exhibits more consistent production stability, the hybrid configuration generally fluctuates less than the CSP-SD system. However, it still shows some variability when compared to the stability of the PV system alone. Furthermore, the inclusion of a photovoltaic system in the hybrid CSP-SD/PV power plant ensures continuous operation by compensating for days with zero production from the CSP-SD system alone, even when the direct normal irradiance (DNI) falls below 300 W/m2. This hybrid configuration mitigates the intermittency of the CSP system, providing a more stable and reliable hydrogen production profile year-round.
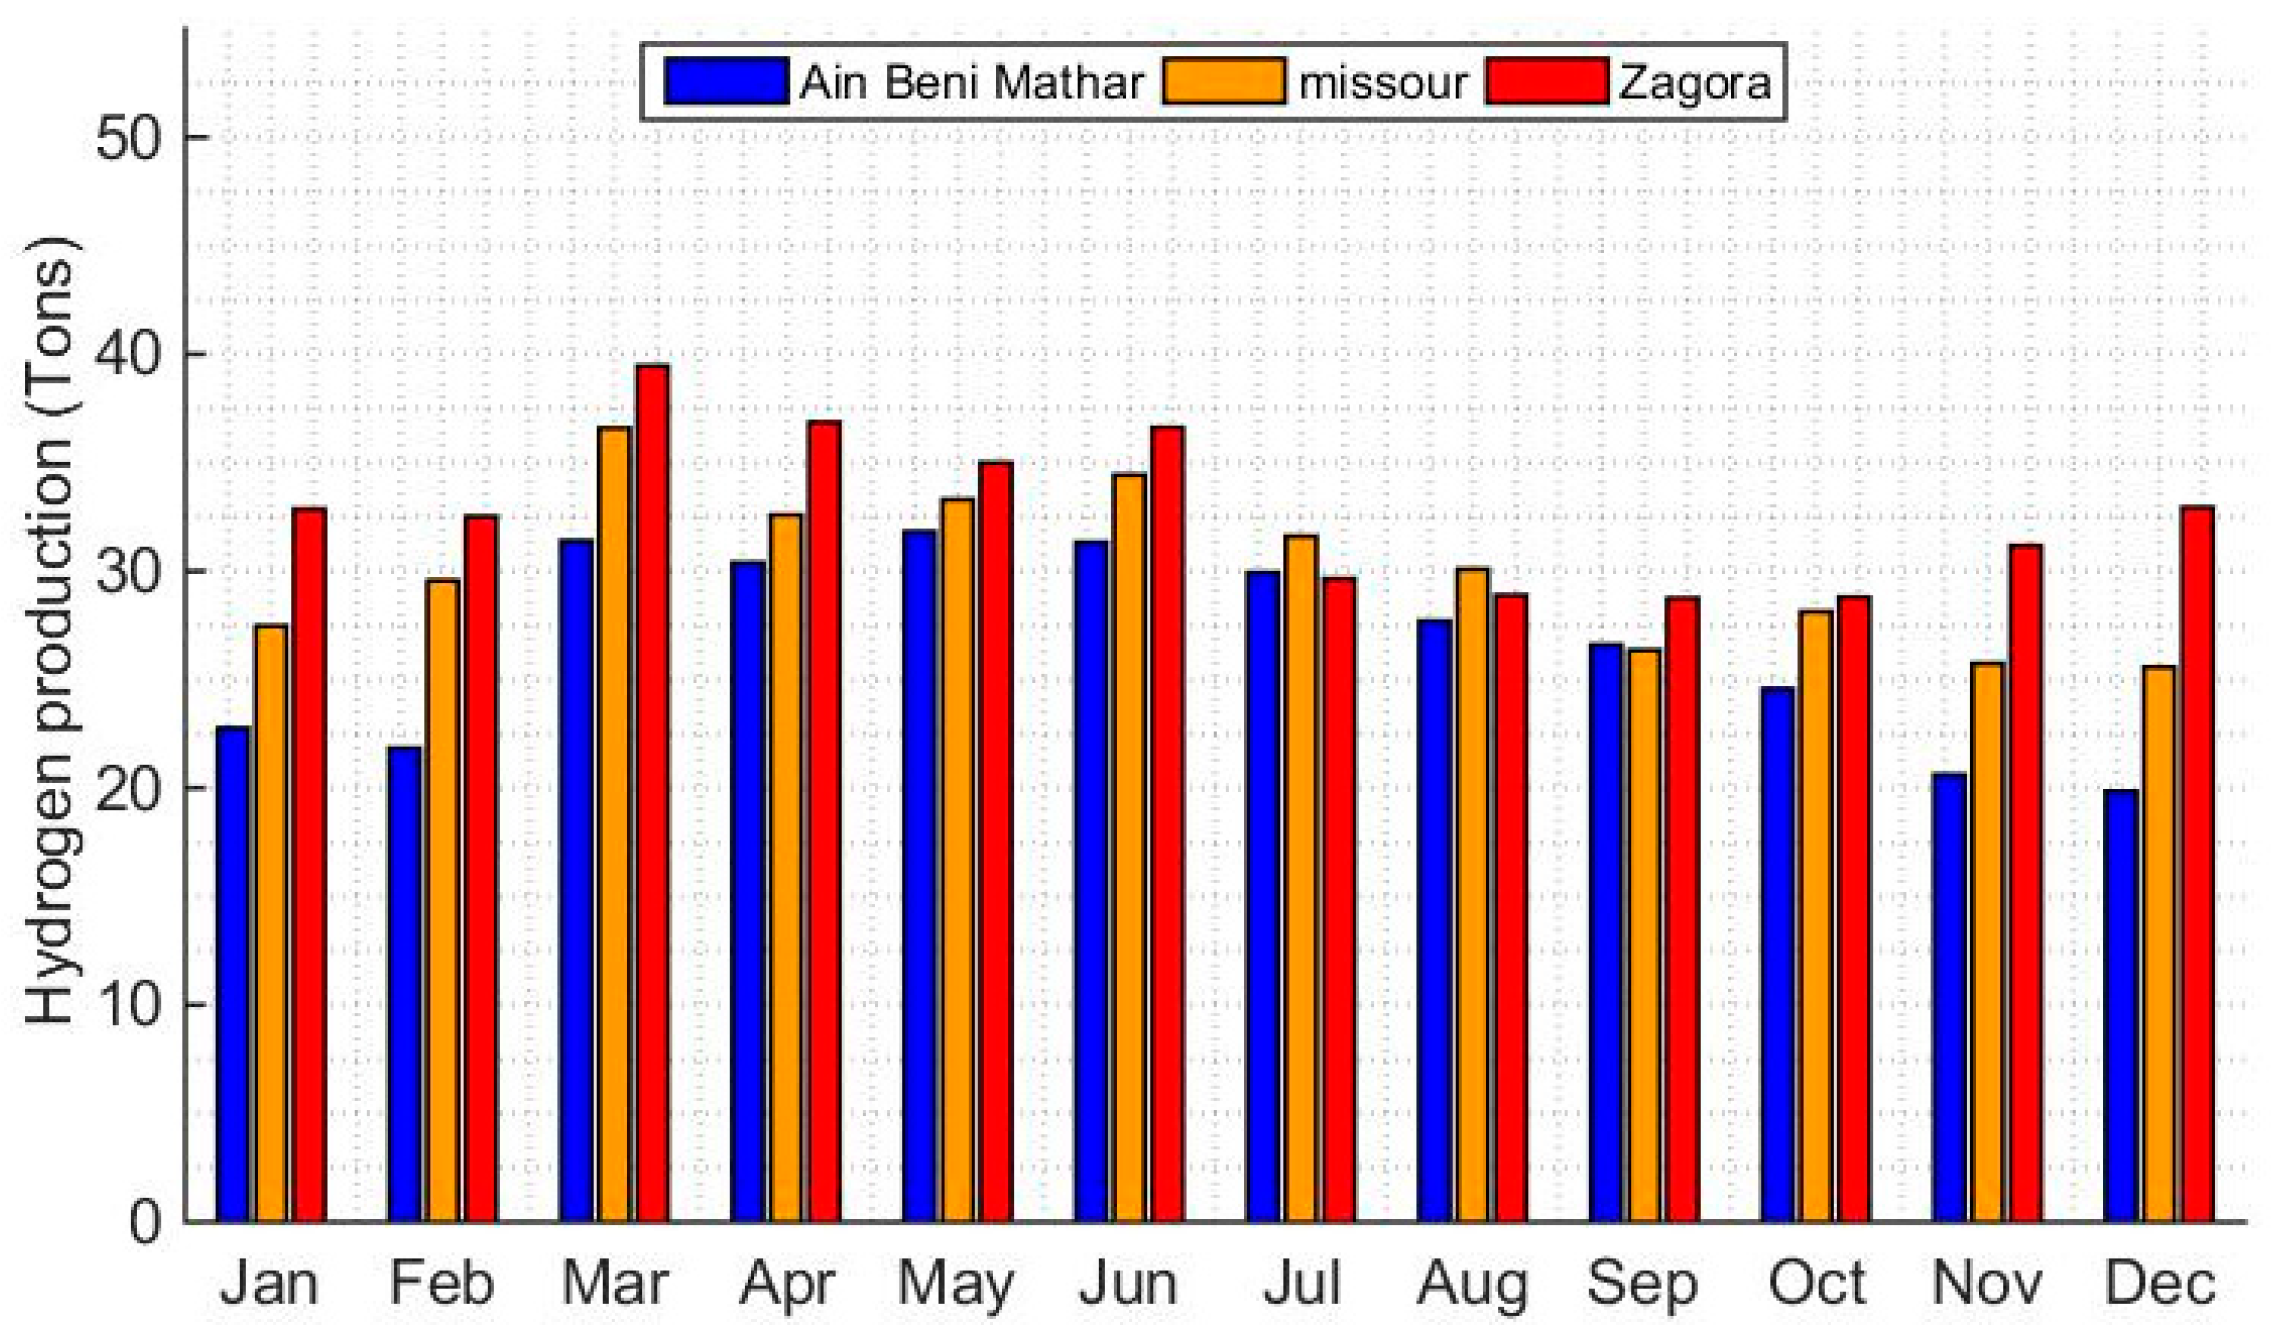
For a broader perspective,
Figure 15 presents the hydrogen production from the hybrid PV/SD-CSP system across Ain Beni Mathar, Missour, and Zagora. Hydrogen production varies across these sites, with monthly averages of 26.1 tons, 31.1 tons, and 34.9 tons, respectively. All sites show higher production in spring (March–June) and lower output in winter, driven by solar radiation levels. Zagora consistently leads in hydrogen production due to superior solar resources, especially high DNI for the SD-CSP system, followed by Missour. Ain Beni Mathar shows the lowest output, reflecting its lower solar resource. Overall, the hybrid PV/SD-CSP system ensures stable hydrogen production year-round, highlighting the importance of site-specific solar conditions.
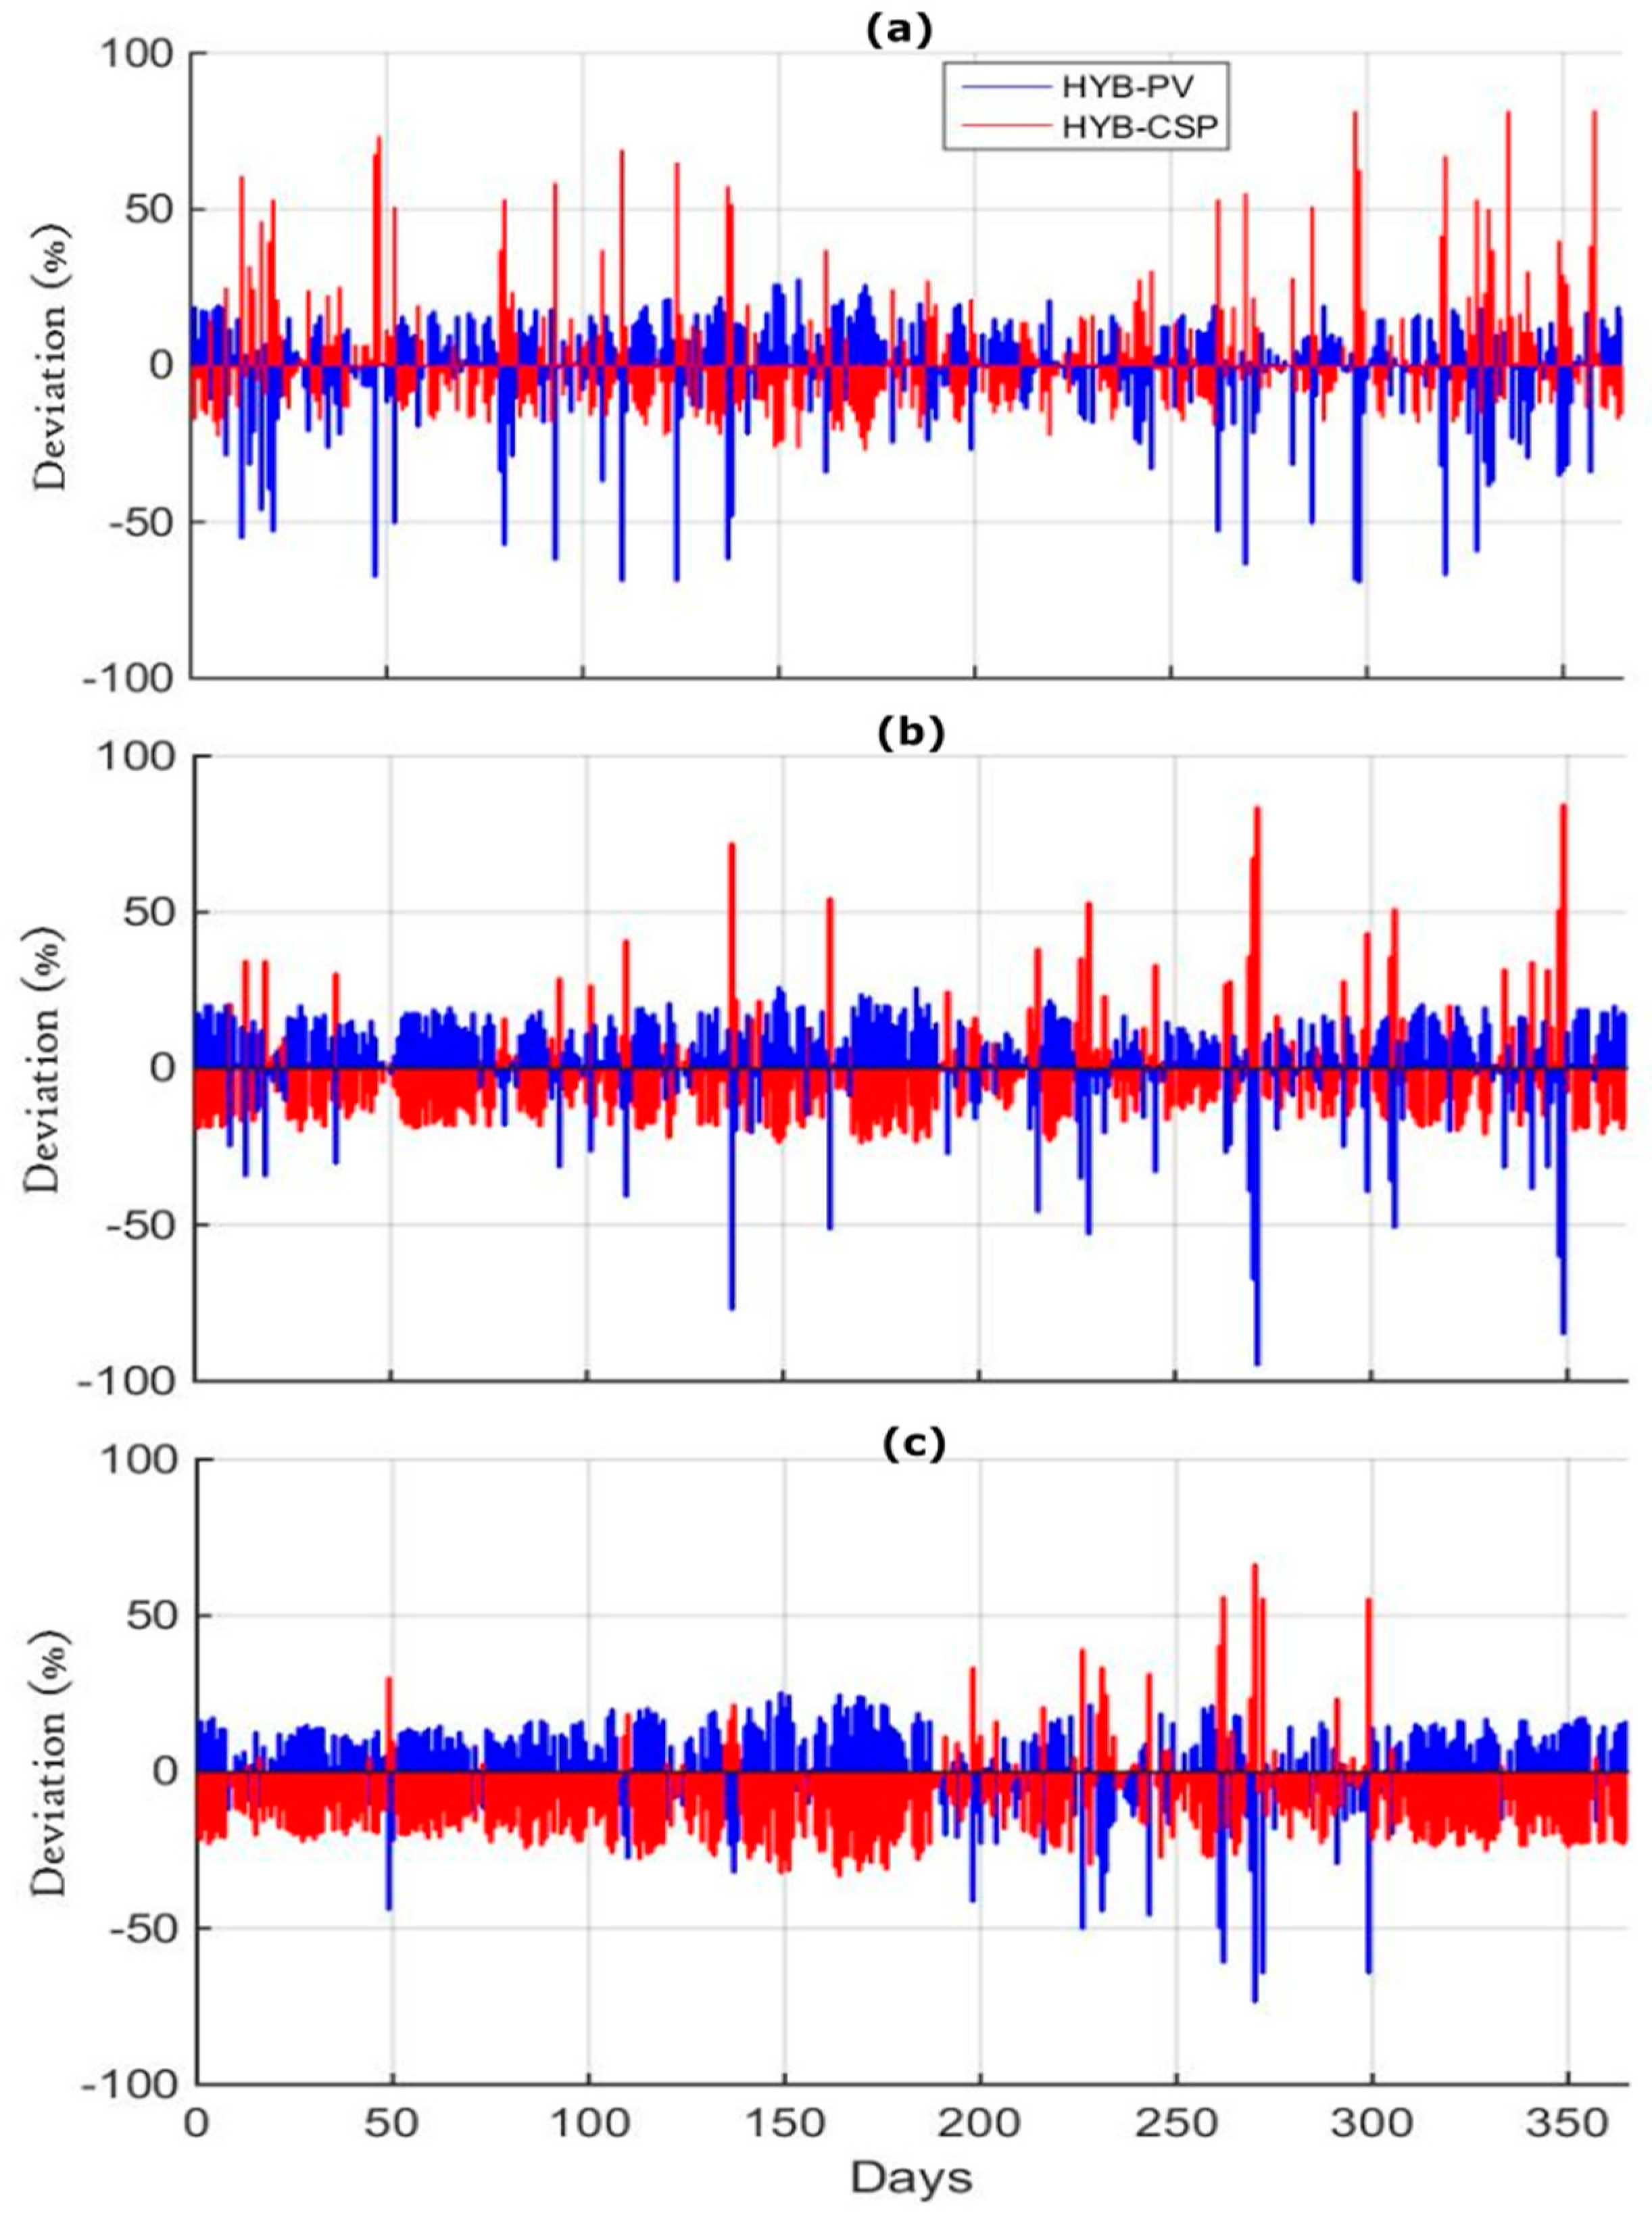
For a more comprehensive analysis, the deviation between the hybrid system and the individual PV and CSP systems was evaluated. The deviation is presented as a daily percentage throughout the year, as shown in
Figure 16. Positive deviation values indicate the production advantage of the hybrid system, while negative values suggest that the PV and CSP systems alone outperform the hybrid configuration.
Examining the blue zone, which represents the deviation between the hybrid system and the PV system, reveals that the hybrid system dominates in most periods, particularly in spring and summer. However, occasional days with negative deviations, reaching up to −90%, highlight instances where the PV system alone is superior in terms of production due to low DNI values leading to zero production from the SD system.
Regarding the deviation between the hybrid system and the CSP system (represented by the red zone), as shown in
Figure 16, most days of the year show that the CSP system alone controls production, particularly in Missour and Zagora. However, there are periods where the CSP/PV hybrid configuration exhibits dominance, with very high deviation percentages reaching up to 81.5%. These significant deviations in these periods can be attributed to fluctuations in CSP system production, which are compensated when combined with the PV system.
The average deviation in hydrogen production between the hybrid system and PV alone is 1.54% for Ain Beni Mathar, 2.73% for Missour, and 3.71% for Zagora. In contrast, the average deviation between the hybrid configuration and CSP alone is 2.95% for Ain Beni Mathar, −4.18% for Missour, and −12.44% for Zagora.
With these results, one can observe, from a technical perspective, the advantages of using a hybrid system for solar hydrogen production, especially in terms of production consistency and the low average production deviation. However, to gain a more comprehensive understanding of the benefits of this configuration, an economic evaluation must be conducted. This will be the focus of the next section.
Nevertheless, before exploring the economic assessment, it is crucial to present the yearly hydrogen production for each power plant configuration across all locations, as this provides a comprehensive understanding of the yield of the simulated configurations. See
Figure 17 for the detailed results.
As illustrated in
Figure 17, the 10 MW Stirling dish-based concentrated solar power (SD-CSP) power plant, when coupled with an electrolyzer, yields the highest hydrogen quantities compared to both PV alone and hybrid SD-CSP/PV configurations. Specifically, this system enables production of 431 tons/year for Zagora, 383 tons/year for Missour, and 351 tons/year for Ain Beni Mathar.
Simultaneously, the CSP-SD/PV hybrid system produces a significantly higher amount of hydrogen than the PV system alone, with production rates of 401 tons/year (Zagora), 368 tons/year (Missour), and 324 tons/year (Ain Beni Mathar). In comparison, the hydrogen production for the PV system alone is 356 tons/year for Zagora, 340 tons/year for Missour, and 316 tons/year for Ain Beni Mathar.
Overall, from a technical perspective, the 10 MW CSP-SD/PV hybrid can annually produce a higher amount of hydrogen than the photovoltaic system, with an increase of 11.2% for Zagora, 7.6% for Missour, and 2.5% for Ain Beni Mathar.
3.2. Economic Analysis and Site Comparison
To evaluate the hydrogen cost and benchmark it with other locations, the main metric used is the levelized cost of hydrogen (LCO
H2). In this study, LCO
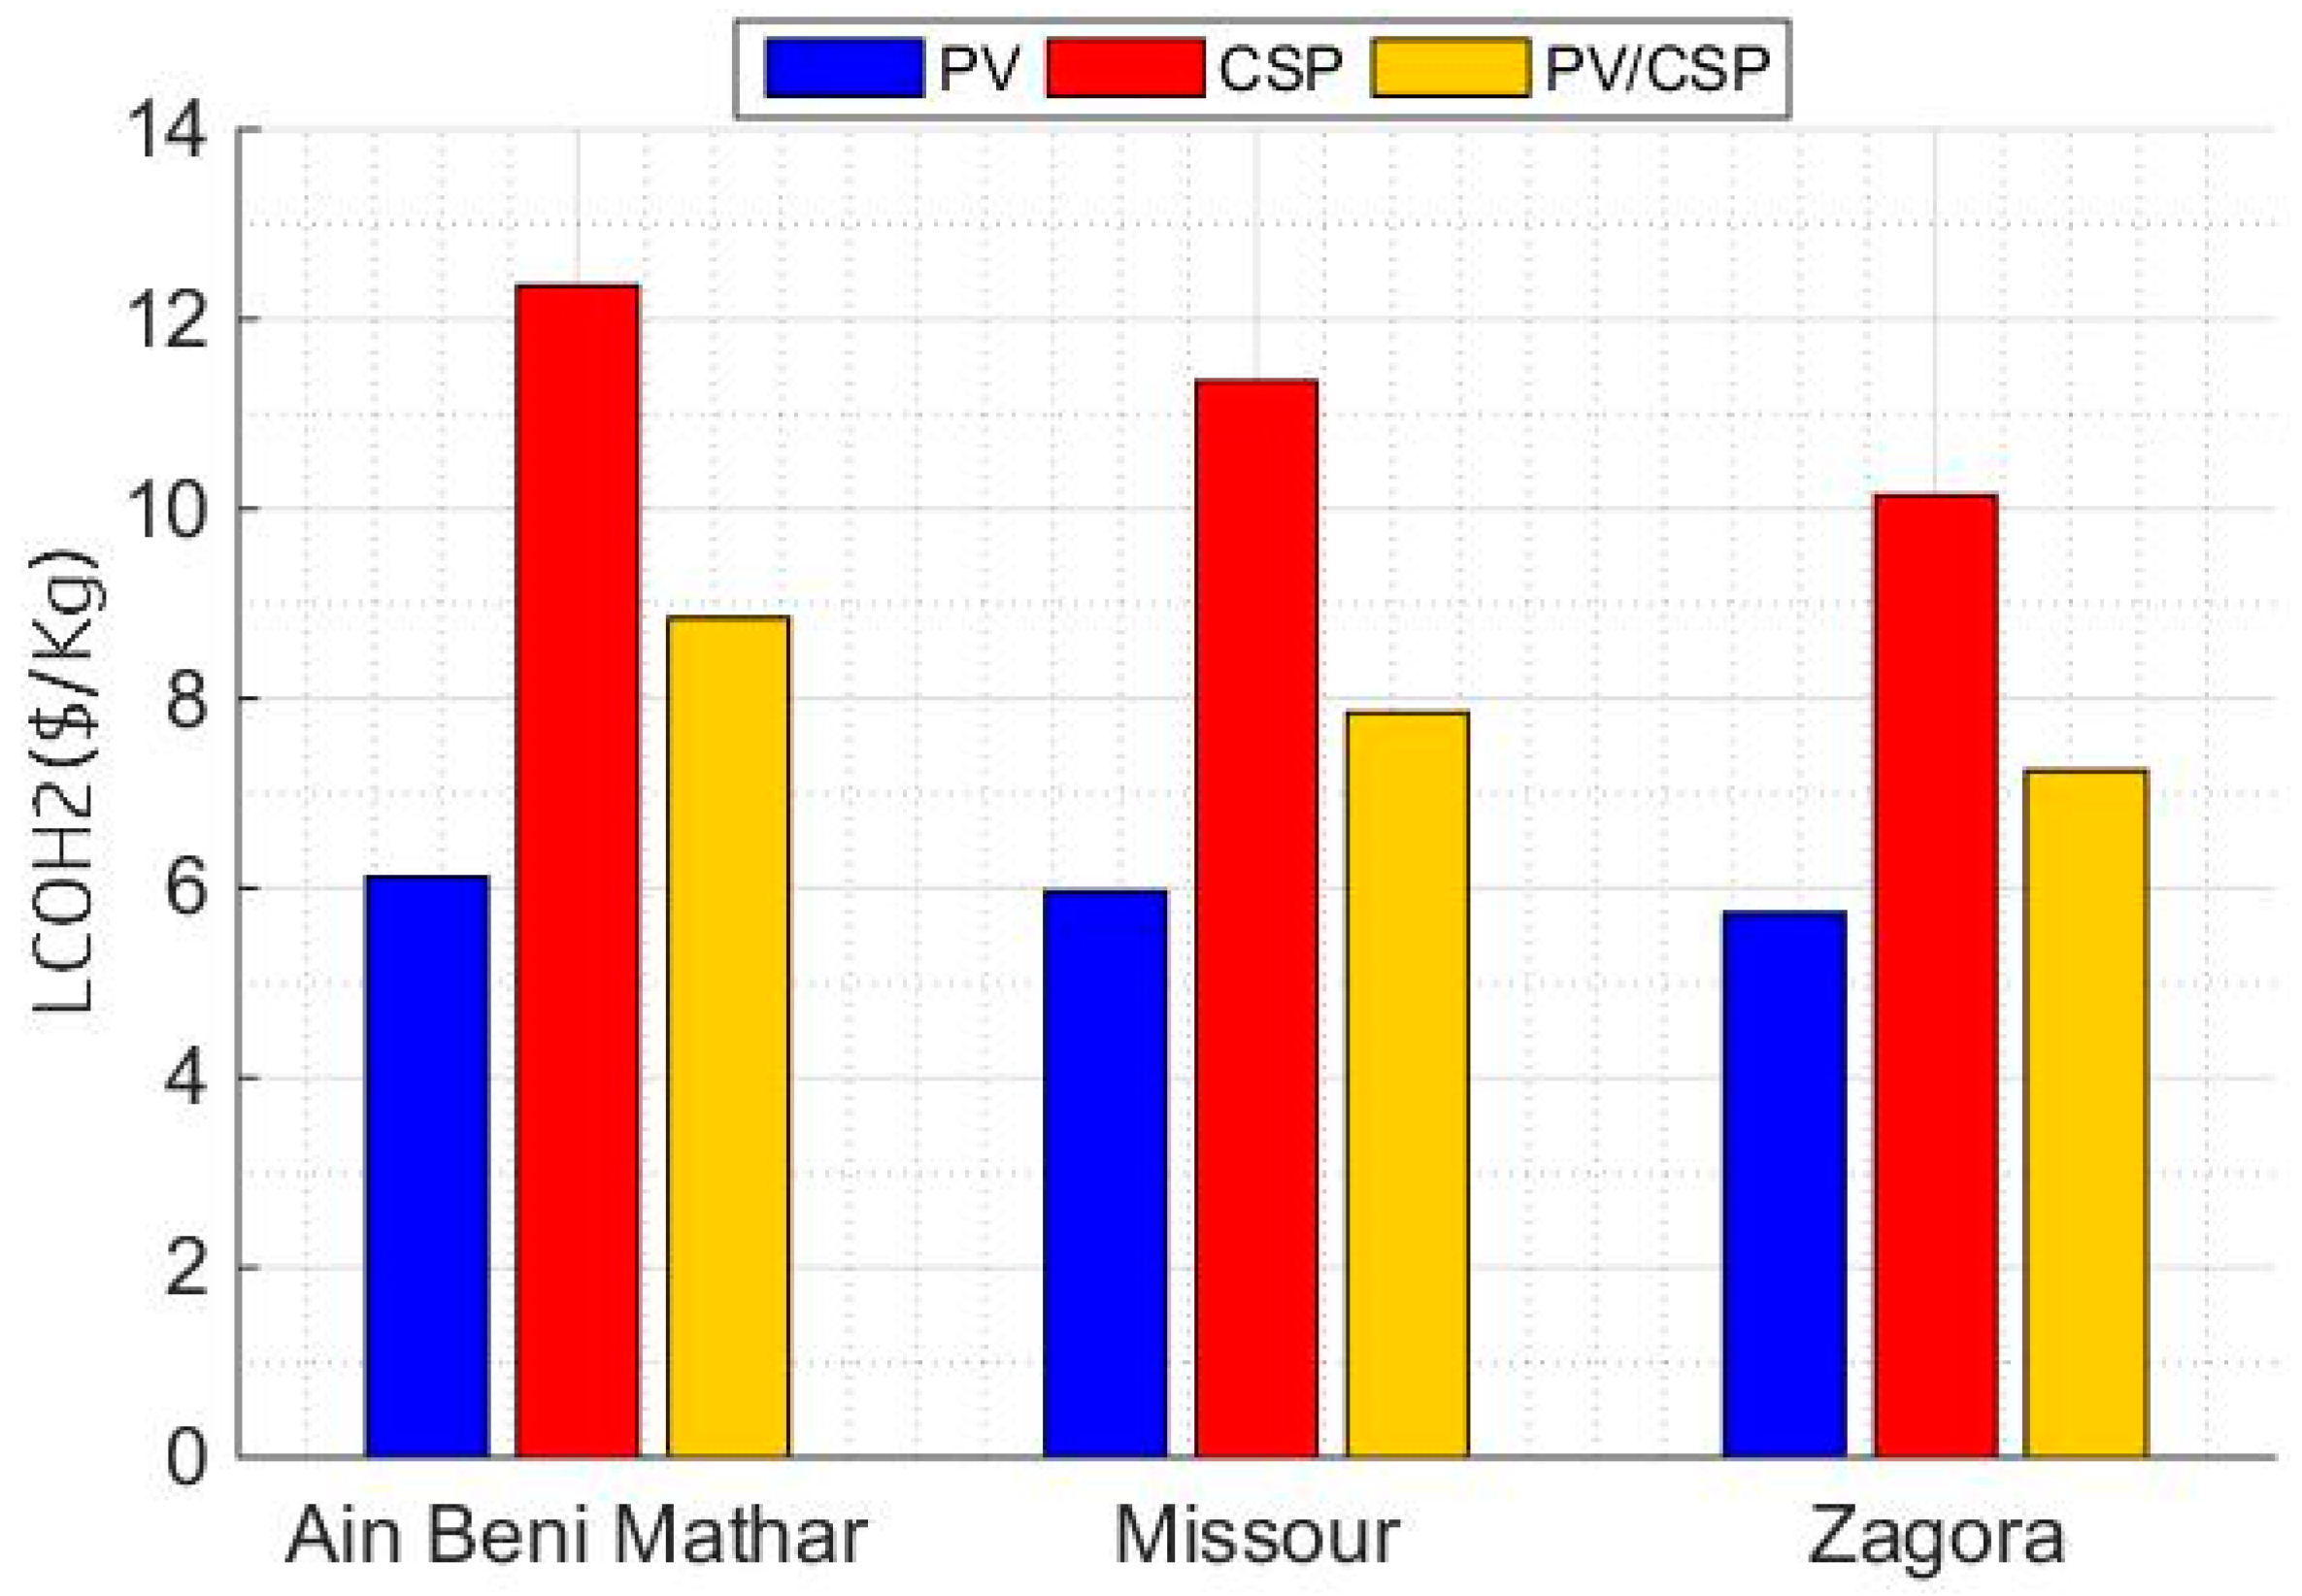
H2 has been calculated for all the locations and power plant scenarios, as depicted in
Figure 18. As can be seen, the CSP-SD system, when combined with the PEM electrolyzer, has the highest LCO
H2 price for all locations, even though this scenario yielded the highest hydrogen production.
This is attributed to the elevated investment and equipment costs and the developmental immaturity of CSP-SD in comparison to the photovoltaic system. Specifically, the LCOH2 for CSP-SD reaches 10.14 $/kg for Zagora, 11.34 $/kg for Missour, and 12.34 $/kg for Ain Beni Mathar. In contrast, the cost of hydrogen produced through the PV system is relatively lower, standing at 5.74 $/kg, 5.96 $/kg, and 6.11 $/kg for Zagora, Missour, and Ain Beni Mathar, respectively.
Regarding the hybrid scenario, the SD-CSP/PV system proves to be an effective approach to reduce the cost of hydrogen, presenting a cost approximately 25% lower than that of the CSP-SD system. In comparison, the LCOH2 for the SD-CSP/PV configuration is $7.23/kg for Zagora, $7.85/kg for Missour, and $8.85/kg for Ain Beni Mathar, reflecting a numerical reduction of USD 2.91/kg for Zagora, $3.49/kg for Missour, and $3.49/kg for Ain Beni Mathar, which corresponds to a 25% reduction in cost. Moreover, the hybrid SD-CSP/PV scenario enables an increase in yearly hydrogen production by 2.5% to 11.2% compared to the PV system alone. This demonstrates the hybrid system’s advantage in improving hydrogen production while simultaneously reducing the overall cost.
To conclude, based on the results above, it is evident that the hybrid scenario remains the optimal choice for Morocco to produce solar-driven hydrogen. This configuration not only increases the hydrogen yield but also reduces production costs and ensures a more stable hydrogen supply with reduced intermittency. The next section will focus on optimizing the SD-CSP/PV system by integrating tracking systems into the PV part. This optimization aims to improve profitability and further increase the hydrogen yield, making the system more efficient and economically viable.
3.3. SD-CSP/PV System Optimization
In this section, the focus is on evaluating the impact of technology selection to optimize the performance of the SD-CSP/PV hybrid system for hydrogen production, considering both technical and economic perspectives. To this end, three selected cases were selected for comparison, all with a nominal capacity of 10 MW (5 MW for CSP and 5 MW for PV), as follows:
SD-CSP/PV with fixed tilt: This configuration is the one presented earlier and uses a fixed photovoltaic system.
SD-CSP/PV with one-axis tracking system: This configuration incorporates a single-axis tracking system for the photovoltaic part.
SD-CSP/PV with two-axis tracking system: This configuration integrates a dual-axis tracking system for the photovoltaic part.
The results of this analysis will provide insights into how different tracking systems influence the overall performance of the hybrid system, including hydrogen yield, cost, and efficiency. By comparing these configurations, we aim to identify the most optimal setup for maximizing the technical and economic feasibility of solar-driven hydrogen production.
Figure 19 clearly depicts that integrating tracking systems into the hybrid SD-CSP/PV system enhances hydrogen production compared to the configuration without tracking systems. The tracking systems optimize solar energy capture by adjusting the position of the panels to follow the sun throughout the day. Specifically, the SD-CSP/PV system with a one-axis tracking system yields an annual hydrogen production of 449.18 Tons for Zagora, 409.90 Tons for Missour, and 361.11 Tons for Ain Beni Mathar.
The inclusion of a two-axis tracking system further boosts hydrogen production, with yields of 464.28 Tons for Zagora, 426.46 Tons for Missour, and 379.84 Tons for Ain Beni Mathar. These results demonstrate that tracking systems, especially the two-axis configuration, significantly increase hydrogen output by capturing more solar radiation, optimizing the performance of the hybrid system and making it more efficient in the selected locations.
Taking into account the economic analysis, the CSP/PV one-axis system exhibits the most optimal cost, with the LCOH2 for this configuration being 7.38 ($/Kg), 8.14 ($/Kg), and 9.16 ($/Kg) for Zagora, Missour, and Ain Beni Mathar, respectively. It is noteworthy that while the CSP/PV 2-axis system produces a substantial quantity of hydrogen, its cost remains comparatively high among the hybrid systems, with an LCOH2 of 8.31 ($/Kg) for Zagora, 9.02 ($/Kg) for Missour, and 10.08 ($/Kg) for Ain Beni Mathar. This cost disparity is attributed to the higher expense associated with the two-axis tracking system compared to the one-axis configuration.
By analyzing the above results, it is obvious that the CSP/PV one-axis configuration emerges as the optimal choice for the hybrid system, leading to cost reductions of 11.2% (Zagora), 9.76% (Missour), and 9.13% (Ain Beni Mathar) compared to the two-axis CSP/PV configuration. Likewise, this configuration leads to an increase in production by 10.72%, 10.26%, and 10.24% for Zagora, Missour, and Ain Beni Mathar, respectively, when compared to the hybrid system with PV and no tracking system.
A hybrid PV/Stirling dish CSP system, integrated with a PEM electrolyzer, was evaluated for hydrogen production at three distinct sites in Morocco: Ain Beni Mathar, Missour, and Zagora. Under current capital costs, the levelized cost of hydrogen (LCO
H2) was found to be 8.85
$/kg for Ain Beni Mathar, 7.85
$/kg for Missour, and 7.23
$/kg for Zagora. These baseline results offer a comprehensive understanding of the economic viability of the system under current market conditions, as illustrated in
Figure 18.
To investigate the potential for cost reductions in the future, a sensitivity analysis was conducted, considering anticipated reductions in capital costs by 2030. According to the International Renewable Energy Agency (IRENA) reports on Renewable Power Generation Costs for 2022 and 2023, PV module costs are expected to decrease by as much as 59%, while Stirling dish CSP costs could decline by 30–45% [
39,
40]. Additionally, the capital cost of PEM electrolyzers, which was 371
$/kW in 2020, is projected to fall by 34.5%, reaching 243
$/kW by 2030 [
41]. With these projected cost reductions, the recalculated LCO
H2 values are 5.71
$/kg for Ain Beni Mathar, 5.07
$/kg for Missour, and 4.68
$/kg for Zagora. These results, presented in
Figure 20, underscore the significant economic potential that can be realized through technological advancements and their integration into hydrogen production systems.
3.4. Limitations of This Study and Recommendations
It is of high importance to highlight that this study has some limitations that have to be taken into account for a more realistic techno-economic analysis of the feasibility of the projects’ implementation. Morocco has a semi-arid climate characterized by a high dust concentration that may cause a decrease in the optical capabilities of both CSP and PV technologies [
42,
43], which cause a significant drop in electricity production [
44,
45] and, thus, the hydrogen production. Also, the durability and lifespan of the solar technologies should be considered, as, in harsh desert climates, some defects may appear [
46,
47], causing a significant drop in the solar plants’ performances. In addition, more details about the electrolyzer parameters (like the density) should be considered for a more accurate evaluation. Finally, to overlap seasonality variation in the solar irradiance and to keep a constant flow of the hydrogen production over the year, it is recommended to add a storage medium, like batteries or a biomass source, to the proposed configuration.
4. Conclusions
Morocco is a leader in renewable energy deployment, aiming to source 52% of its electricity from renewables by 2030. This ambitious target poses technical challenges, particularly in managing renewable energy intermittency and ensuring grid stability, necessitating advanced energy storage solutions. Hydrogen emerges as a promising option, offering clean, scalable energy storage to support the energy transition. However, its high capital costs underscore the need for cost-effective technologies and optimized configurations.
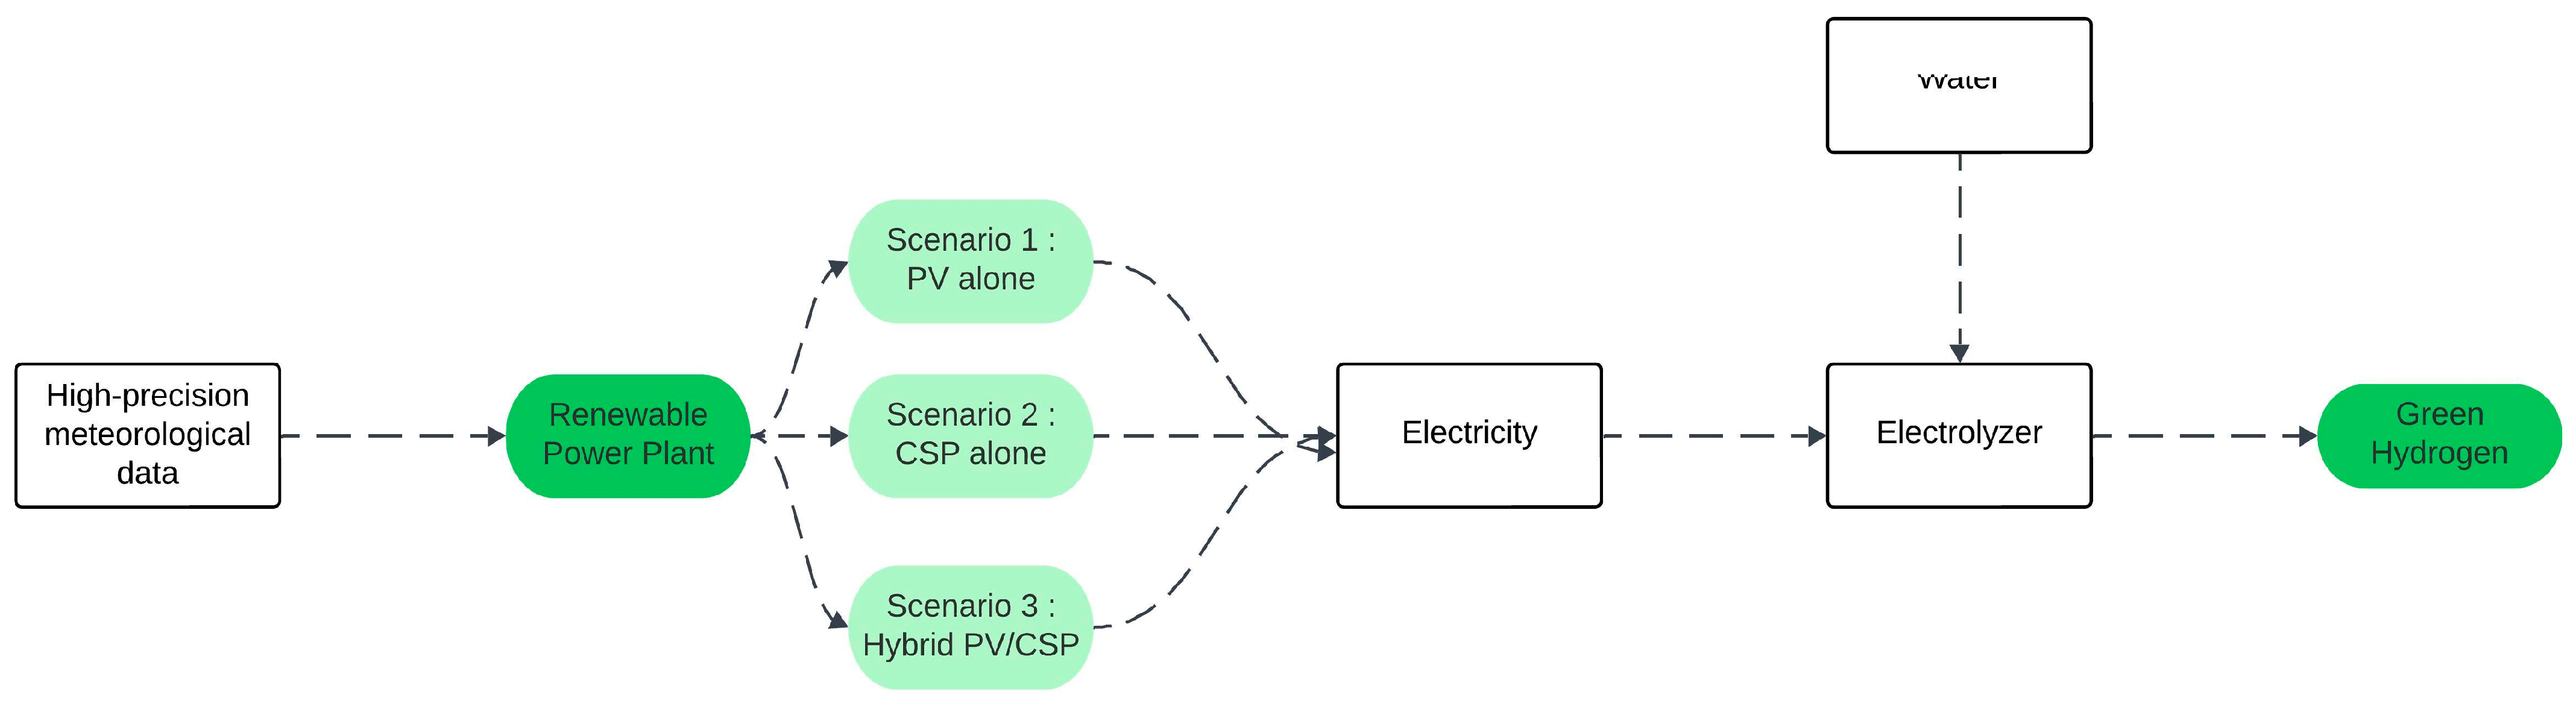
This study assessed the potential for solar-driven hydrogen production at three Moroccan locations: Ain Beni Mathar, Zagora, and M, utilizing both PV and CSP technologies to power a PEM electrolyzer. The objective was to evaluate and compare different system configurations based on their technical and economic performance, specifically hydrogen output and production costs. High-precision ground-based meteorological measurements of solar irradiance (GHI and DNI) were used for each site to ensure accurate simulation inputs. Following the evaluation of hybridization’s impact on stabilizing and enhancing production while reducing costs, the optimization of the hybrid system was analyzed through the following three scenarios: a standalone 10 MW PV plant, a 10 MW Stirling dish CSP plant, and a hybrid configuration integrating 5 MW from each technology.
The results revealed that the CSP-only system achieved the highest hydrogen production, with Zagora leading at an annual output of 431 tons. However, the CSP configuration incurred the highest levelized cost of hydrogen (LCOH2), reaching $12.34/kg in Ain Beni Mathar, due to its significant investment and equipment costs. Conversely, the PV system demonstrated the lowest production cost, achieving $5.74/kg at the Zagora site, though it produced less hydrogen compared to both CSP and the hybrid system.
Adding tracking systems to the hybrid CSP/PV setup provided notable advantages, particularly with the one-axis tracking system, which achieved a balanced increase in hydrogen production and reduction in costs. This configuration allowed for a cost reduction of up to 11.19% compared to the two-axis CSP/PV configuration, and an increase in annual hydrogen production by up to 10.72% compared to setups without tracking. In conclusion, the hybrid SD-CSP/PV system with one-axis tracking emerged as the optimal choice for solar hydrogen production in Morocco, offering both enhanced efficiency and economic viability, making it a promising approach to support the country’s sustainable energy objectives.
Looking ahead, future research should focus on scaling hybrid systems across different regions of Morocco, particularly considering variations in local meteorological conditions. Moreover, exploring advanced hydrogen production technologies and integrating other renewable sources could further enhance system efficiency and cost-effectiveness. In addition, long-term economic assessments will be crucial for evaluating the feasibility of large-scale implementation and the long-term sustainability of these systems.


