Abstract
As a large number of large-scale photovoltaic (PV) stations are integrated into the power grid, the penetration rate of PV power is growing higher and higher. The intermittency and volatility of PV power generation bring great pressure to the safe and stable operation of the distribution network. In order to realize scientific energy dispatching and optimization, the predicted output of large PV stations is the data basis and prerequisite. The output prediction method of large PV stations is studied in this paper, and a prediction method based on gradient-boosting decision trees is proposed. In the method, the original data are first collected, and the sample set is established through the steps of data interpolation, supplement, and integration, and then the sample set is pre-processed by data cleaning and normalization. The model training and PV output prediction during the test period are carried out based on the pre-processed data. Finally, the prediction results are imported into the error analysis module. The feasibility and accuracy of the proposed method are analyzed by comparing it with the traditional method. The results show that the normalized mean absolute error () and normalized root mean square error () of the proposed method are 7.31% and 11.78%, respectively, while the and of the traditional method are 11.67% and 20.39%, respectively. Thus, the prediction performance of the proposed method is superior to that of the traditional method.
1. Introduction
In the face of energy security problems caused by climate change, air pollution, and the use of traditional energy, as well as the continuous reduction in traditional fossil energy reserves such as coal, oil, and gas and the continuous rise in global power energy demand, many countries are vigorously promoting the development of renewable energy [1]. Solar energy has many advantages, such as abundant reserves, wide distribution, and cleanliness. The development of efficient utilization of solar energy has received extensive attention [2]. As a clean and renewable energy form, PV power generation has great development potential and application prospects. With the continuous advancement of technology and the continuous support of policies, PV power generation will play an increasingly important role in global energy transformation.
With more and more large-scale PV power stations connected to the power grid, the intermittency and volatility of PV power generation pose a great threat to the stable balance and reliable operation of the regional power grid. Using meteorological data and historical PV operation data, the system output can be predicted in advance. On the basis of prediction, the advanced dispatching control technology can be used to stabilize or even eliminate the fluctuation and intermittency influence of PV power generation. Therefore, it is of great significance to establish an accurate output prediction model for large-scale PV power stations for the popularization and promotion of PV power stations.
PV prediction models can be divided into direct prediction [3] and indirect prediction [4] according to the prediction object. Direct prediction predicts the output of PV power generation directly, while indirect prediction predicts the meteorological factors related to PV power generation, such as irradiance, and then calculates the output of PV power generation according to the photoelectric conversion model.
From the time scale of prediction, PV power generation prediction can be divided into ultra-short-term prediction (0~6 h), short-term prediction (6 h~1 day), and long-term prediction (one month~one year) [5]. Ultra-short-term forecasting is critical for real-time system scheduling, rapid demand responses, and grid stability [6,7,8]. The short-term prediction results are mainly used for load balancing and power dispatching [9]. Long-term power generation prediction is based on the statistical analysis of historical data such as long-term meteorology and solar radiation in a certain area, and the future long-term PV power generation situation is obtained. The prediction results can be applied to energy planning [10] and benefit evaluation.
In recent years, many PV power prediction models have been developed based on deep learning [11]. For short-term prediction problems, Wang et al. [12] conducted day-ahead PV power prediction based on the LSTM-RNN model and time correlation modification under the partial daily pattern prediction framework. Li et al. [13] proposed a method for centralized PV plants based on LSTNet-Attention. Wu et al. [14] predicted the outpower of a PV station in Australia by combining a deep learning model with trend feature extraction and feature selection. Jakoplic et al. [15] realized short-term PV power plant output forecasting by using sky images and deep learning. In literature [16], a deep learning framework based on 7.5-min-ahead and 15-min-ahead approaches to predict short-term PV power was introduced. In addition to short-term prediction, Jung et al. [17] conducted long-term power forecasting for the PV system in South Korea based on long short-term memory recurrent neural networks. The processes of the proposed models are relatively complicated, and the cost of practical application is too high. What is more, high-quality training data are required. However, in practical applications, when there are certain outliers, the accuracy of the prediction results will be affected to some extent, even after complex data preprocessing.
As a highly effective and widely used machine learning algorithm, gradient-boosting decision trees (GBDT) have been continuously researched and developed in recent years. The GBDT is a machine learning algorithm based on ensemble learning. It has the advantages of strong prediction ability, good adaptability to data, strong interpretability, strong anti-overfitting ability, and good scalability. The GBDT model can use parallel computation in the training stage and does not require a large number of parameters, so it has high training efficiency. However, it is rarely studied in the field of PV power generation prediction. Compared with the prediction method based on deep learning, the prediction method based on the GBDT can accommodate some outliers, so there is no need for overly complex data preprocessing. It is more efficient and concise in the model training stage, so the prediction cost is relatively lower, and the low-cost nature is conducive to the promotion and application of the method in practice. In this paper, the GBDT is introduced into the output prediction application of a large-scale PV power station, and an output prediction method of a large-scale PV power station based on a GBDT is proposed. This method first collects the original data and then establishes the experimental sample set through data interpolation, data supplement, and data integration. Further data preprocessing is performed through data cleaning and normalization; the pre-processed data are used to train the model so as to establish a PV output prediction model. Based on the test samples and the trained model, the prediction of PV output is realized. Finally, the prediction results are imported into the error analysis module to quantitatively evaluate the model performance. The remainder of this paper is organized as follows: The second section introduces the specific implementation steps of the PV output prediction method proposed in this paper. In the third section, the proposed method is analyzed and verified by an example analysis. The fourth section is the conclusion of this study.
2. PV Output Prediction Method Based on GBDT
2.1. GBDT Model
The GBDT regression algorithm process is described as follows:
Let be the training set, where , and X is the input sample space; is the input feature; , and Y is the output feature.
- Initialize the first learner.
- 2.
- Establish the M classification regression tree (m = 1, 2, …, M).
The pseudo residual corresponding to the mth tree is calculated for sample i as follows:
By using the regression tree to fit the data (), the leaf node area , corresponding to the m-th tree, is obtained, where , and are the number of leaf nodes of the m-th regression tree.
Calculate the best fitting value for j:
Update learner :
where is an indicative function, the sample observation point falls into the area, and the function is 1; otherwise, it is 0.
- 3.
- The expression of the final learner is as follows:
2.2. PVoutput Prediction Method Based on GBDT
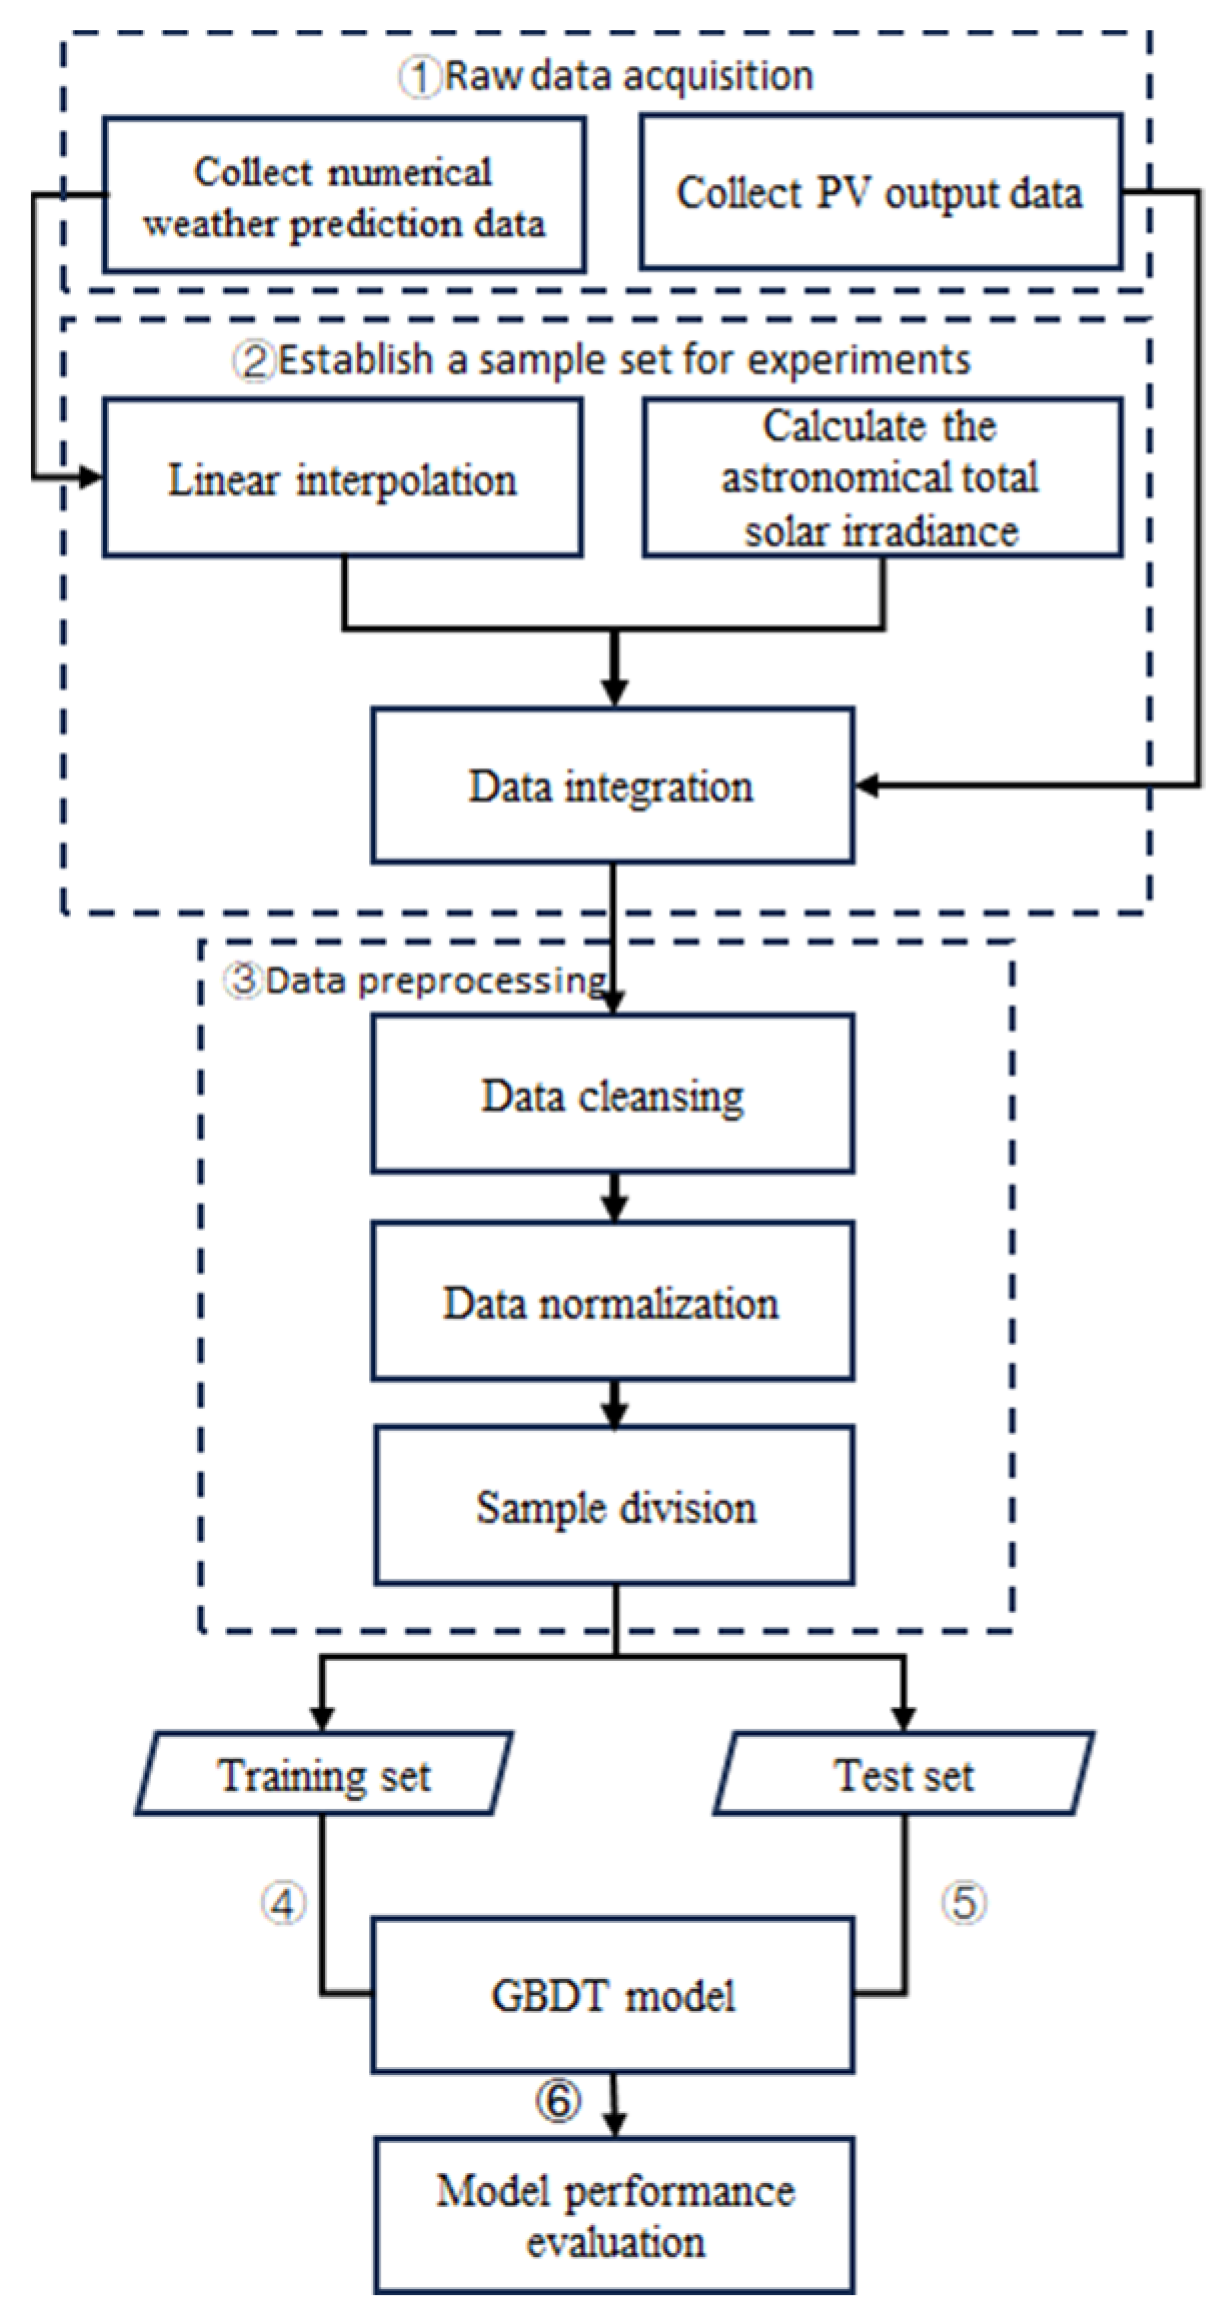
In this paper, the specific steps of the PV output prediction method based on the GBDT model are as follows, as shown in Figure 1:
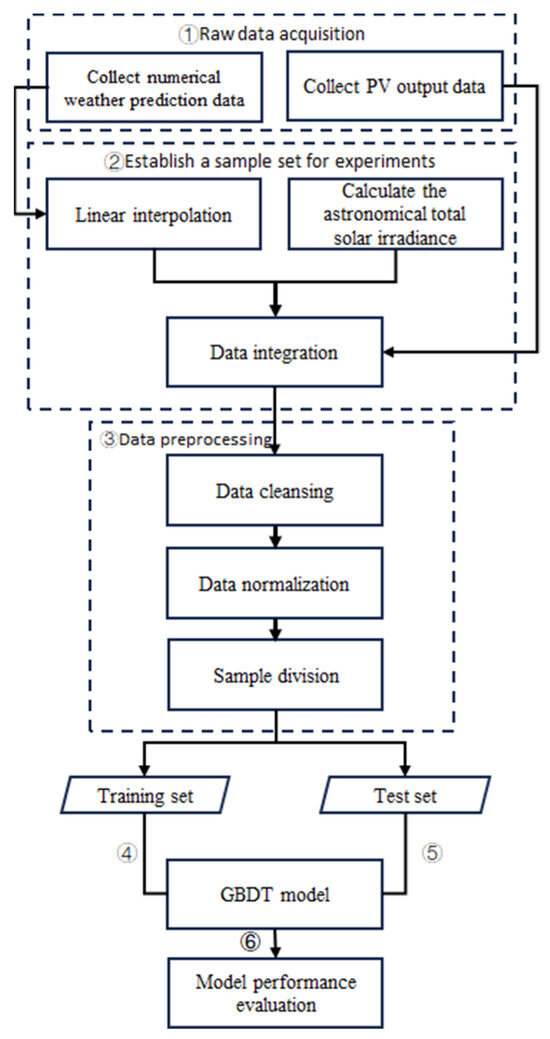
Figure 1.
PV output forecasting method based on the GBDT model.
- Raw data collection.
Collect the PV output data and numerical weather forecast data.
- 2.
- Establish the experimental sample set.
The weather forecast data with a period of 15 min are obtained by linear interpolation. Calculate the total astronomical solar irradiance data at the corresponding time of the PV output sequence. Through the time matching method, the PV output data, numerical weather forecast data, and astronomical solar total irradiance data are integrated to establish the experimental sample set.
- 3.
- Data preprocessing.
Clean the abnormal samples and construct the sample set under the normal operation state of the system. Based on the following formula, the input and output eigenvalues of the prediction model are normalized by Max–Min, and then the training sample set and the test sample set are divided.
where is the normalized input and output eigenvalues, is the original eigenvalue, is the maximum eigenvalue, and is the minimum eigenvalue.
- 4.
- Model training.
The output of the PV system is used as the model output, and the numerical weather forecast characteristics and the total solar irradiance are used as the model input. The GBDT model is trained based on the training sample set, and the hyperparameters are adjusted to prevent overfitting.
- 5.
- Output sequence prediction.
Based on the test sample set and GBDT model, the PV output sequence during the test period is predicted.
- 6.
- Model performance evaluation.
The test sample set and the PV output prediction results are imported into the error analysis module, and the model performance is quantitatively evaluated by comparison. In this paper, the error indicators are the normalized mean absolute error (nMAE) and normalized root mean square error (nRMSE), as shown in Formula (7) and Formula (8).
where is the test sample size, is the predicted value of the normalized output, and is the actual value of the normalized output.
2.3. Reference Model
In this paper, the output prediction methods based on the persistent prediction model, the random forest regression (RFR), and the support vector machine (SVM) model are used to compare with the method proposed in this paper so as to verify the feasibility and accuracy of the proposed method.
The persistence prediction model takes the historical output value at the same time point as the predicted output value. The prediction process is simple, but the error is large. The RFR model [18] is an improved bagged regression tree model [19,20,21,22], which is one of the most effective machine learning prediction algorithms [23]. The RFR model establishes a sample set through the Bootstrap sampling strategy. The Bootstrap sampling strategy aims to generate a new sample set, called an in-bag sample set, from an existing training sample set by repeated, random, and put-back sampling. These samples will be used to train one of the RFR classification and regression trees (CART). Based on a bag sample set, a CART regression tree is trained by dichotomy. Repeat the above steps to generate a CART regression tree, which forms the trained RFR model. After training the required number of CART regression trees, the prediction results of the RFR model are the average of the prediction results of these CART regression trees based on the test data. SVM is a supervised learning model that is widely used in classification and regression tasks. By selecting the appropriate kernel functions and parameters, SVM can deal with nonlinearly separable data in high-dimensional space with high classification accuracy and strong generalization ability. Its working principle is to find a hyperplane to distinguish different types of data points so that the interval between the two types of data is maximized.
3. Results
In this paper, a PV power station in Guangxi, China, is selected for an example analysis. The data collection period is from 1 August 2023 to 29 February 2024. The data of the first 6 months were used as the training set, and the data of the last 1 month were used as the test set. In the total set, after the data of the night when there was no solar radiation is deleted, there are no null values in the meteorological data, while there are some null values in the measured output data of the inverters of the PV power station. The statistical results show that the minimum value of the proportions of null values of 780 inverters is 6.3%, and the maximum value is 10.1%.
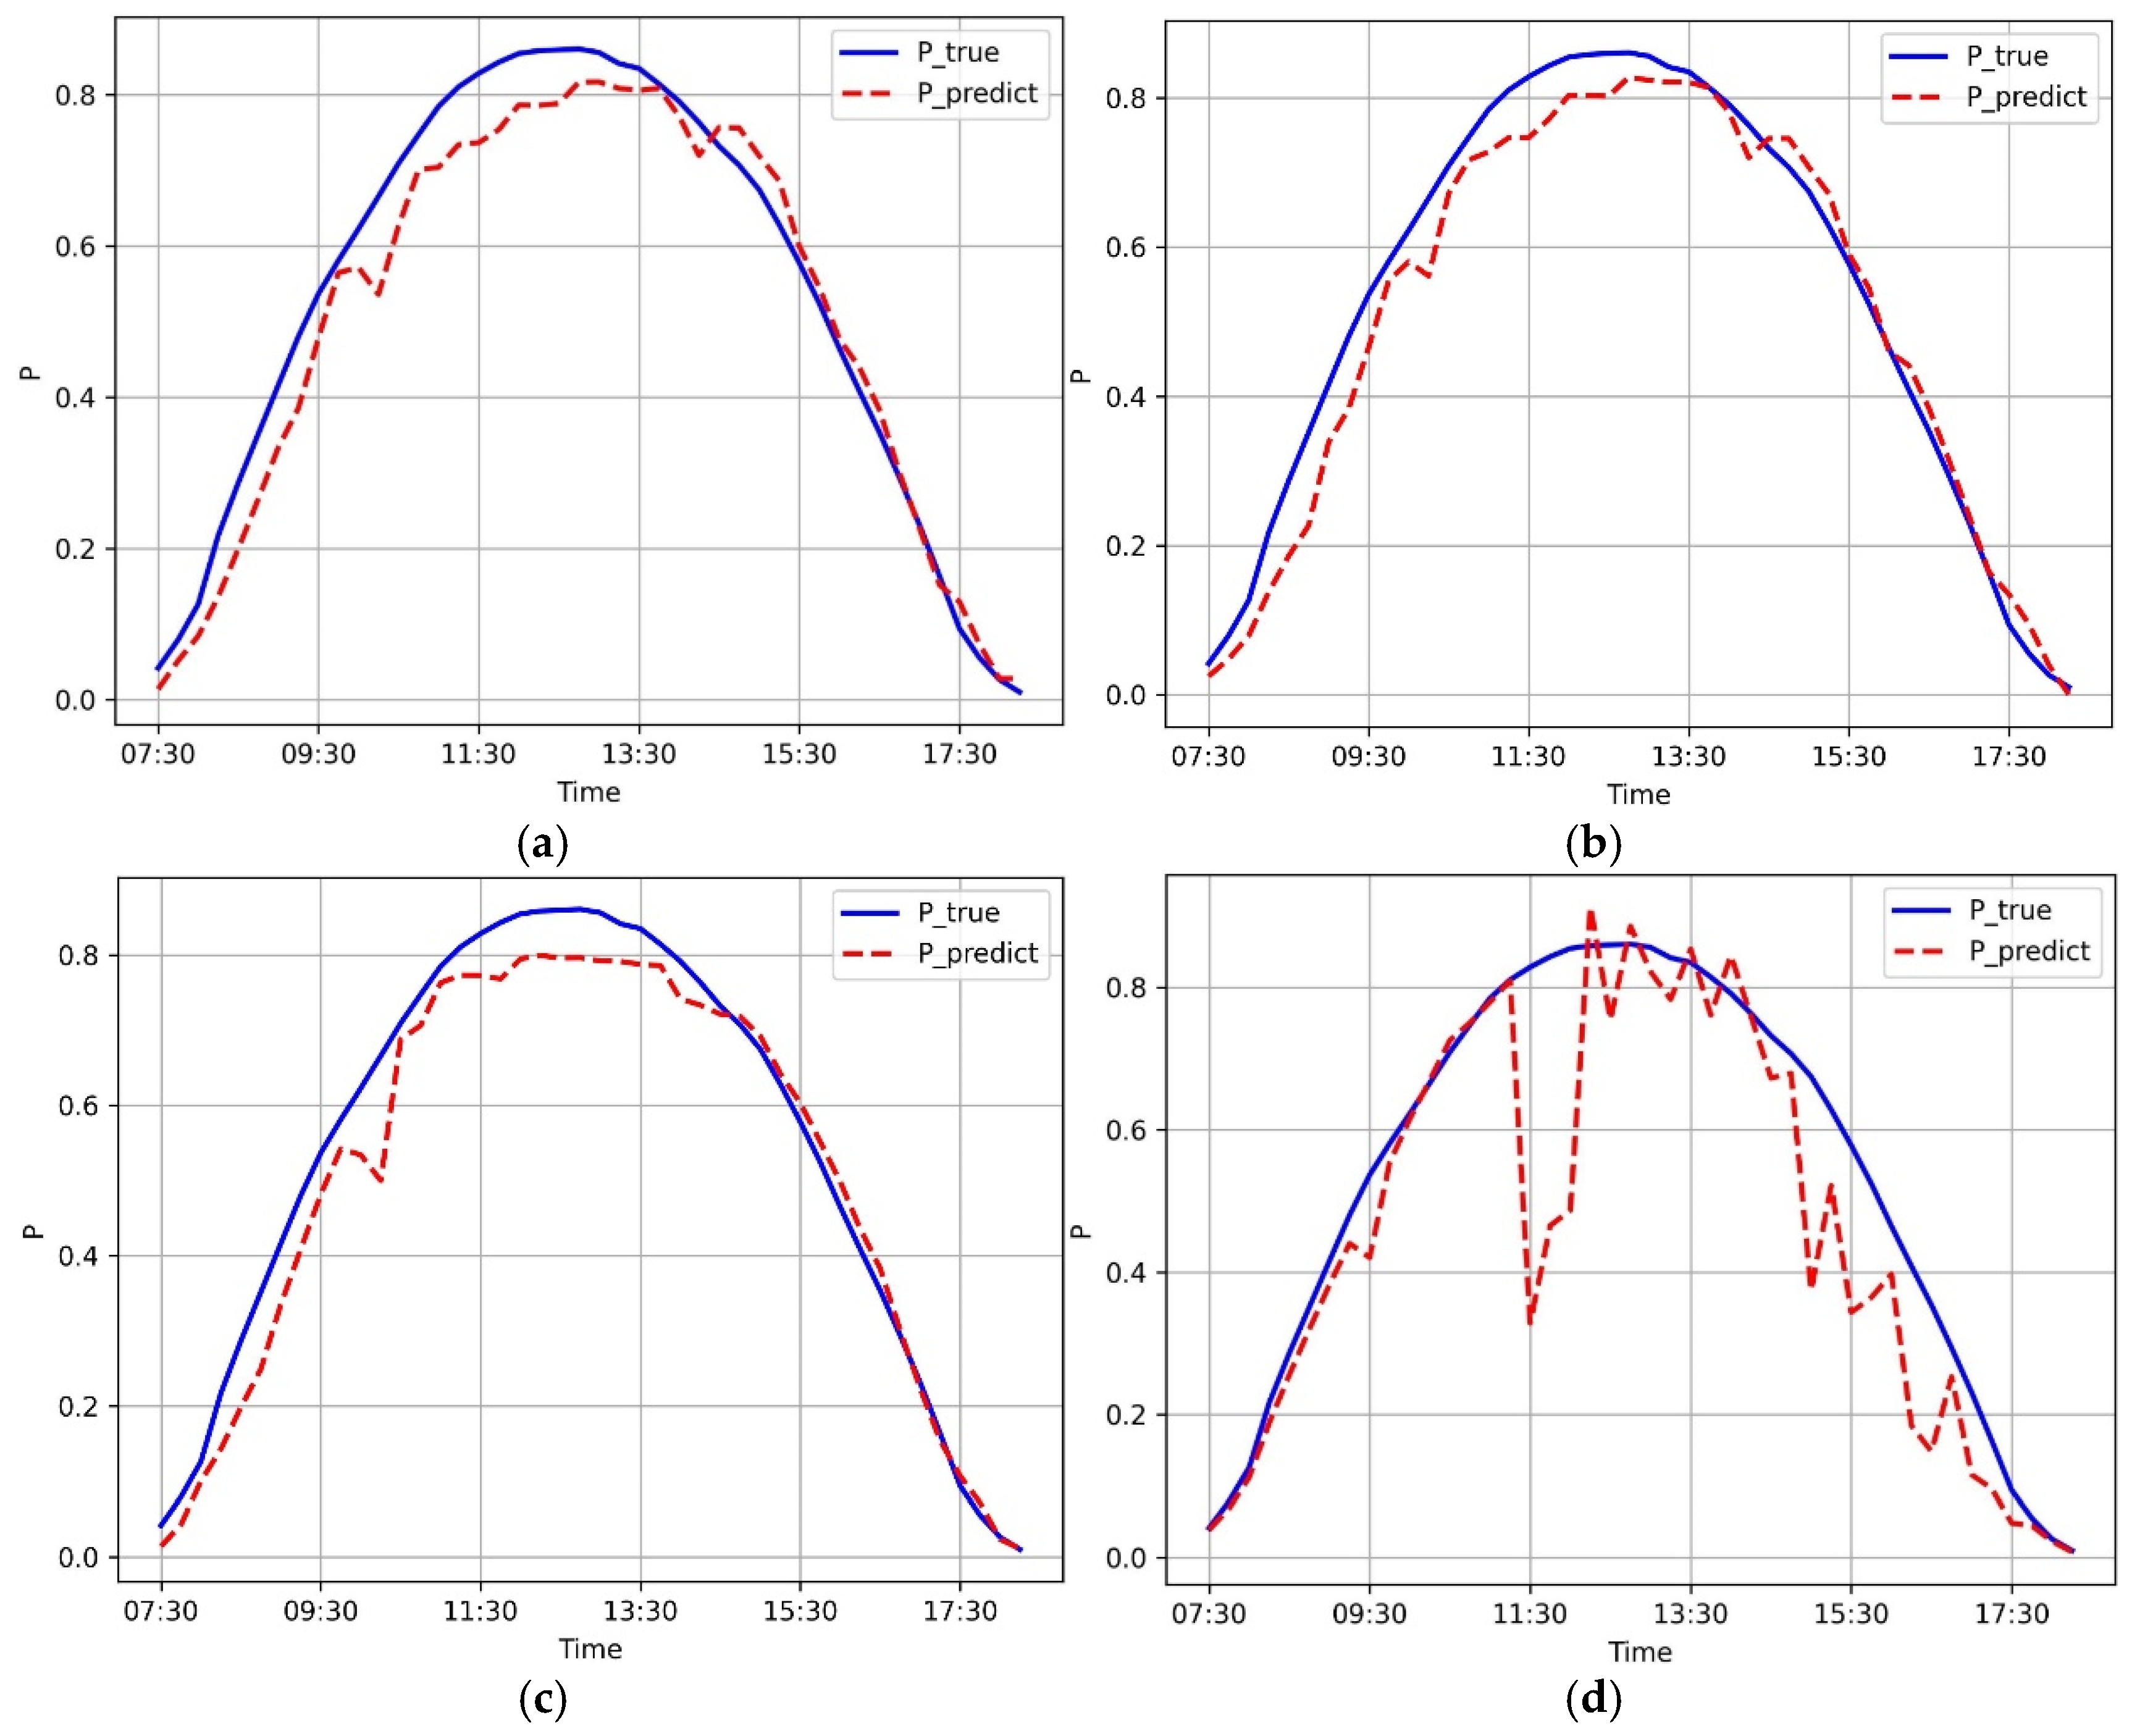
Figure 2 shows the comparison of the prediction results of different prediction models on 11 February 2024. The results show that the method using the persistent prediction model deviated more from the true value than other methods.
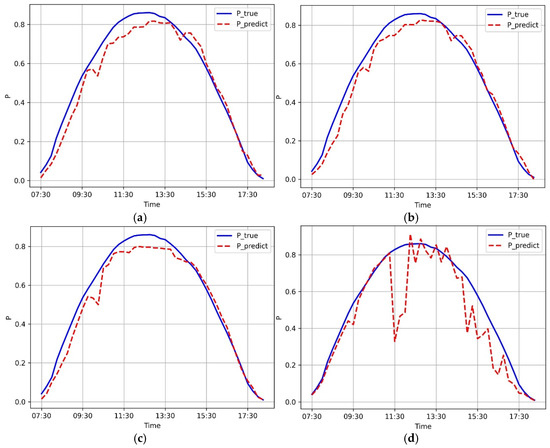
Figure 2.
Comparison of model prediction: (a) time series of the measured outputs and predicted outputs based on GBDT; (b) time series of the t measured outputs and predicted outputs based on SVM; (c) time series of the t measured outputs and predicted outputs based on RFR; (d) time series of the t measured outputs and predicted outputs based on the persistence prediction model.
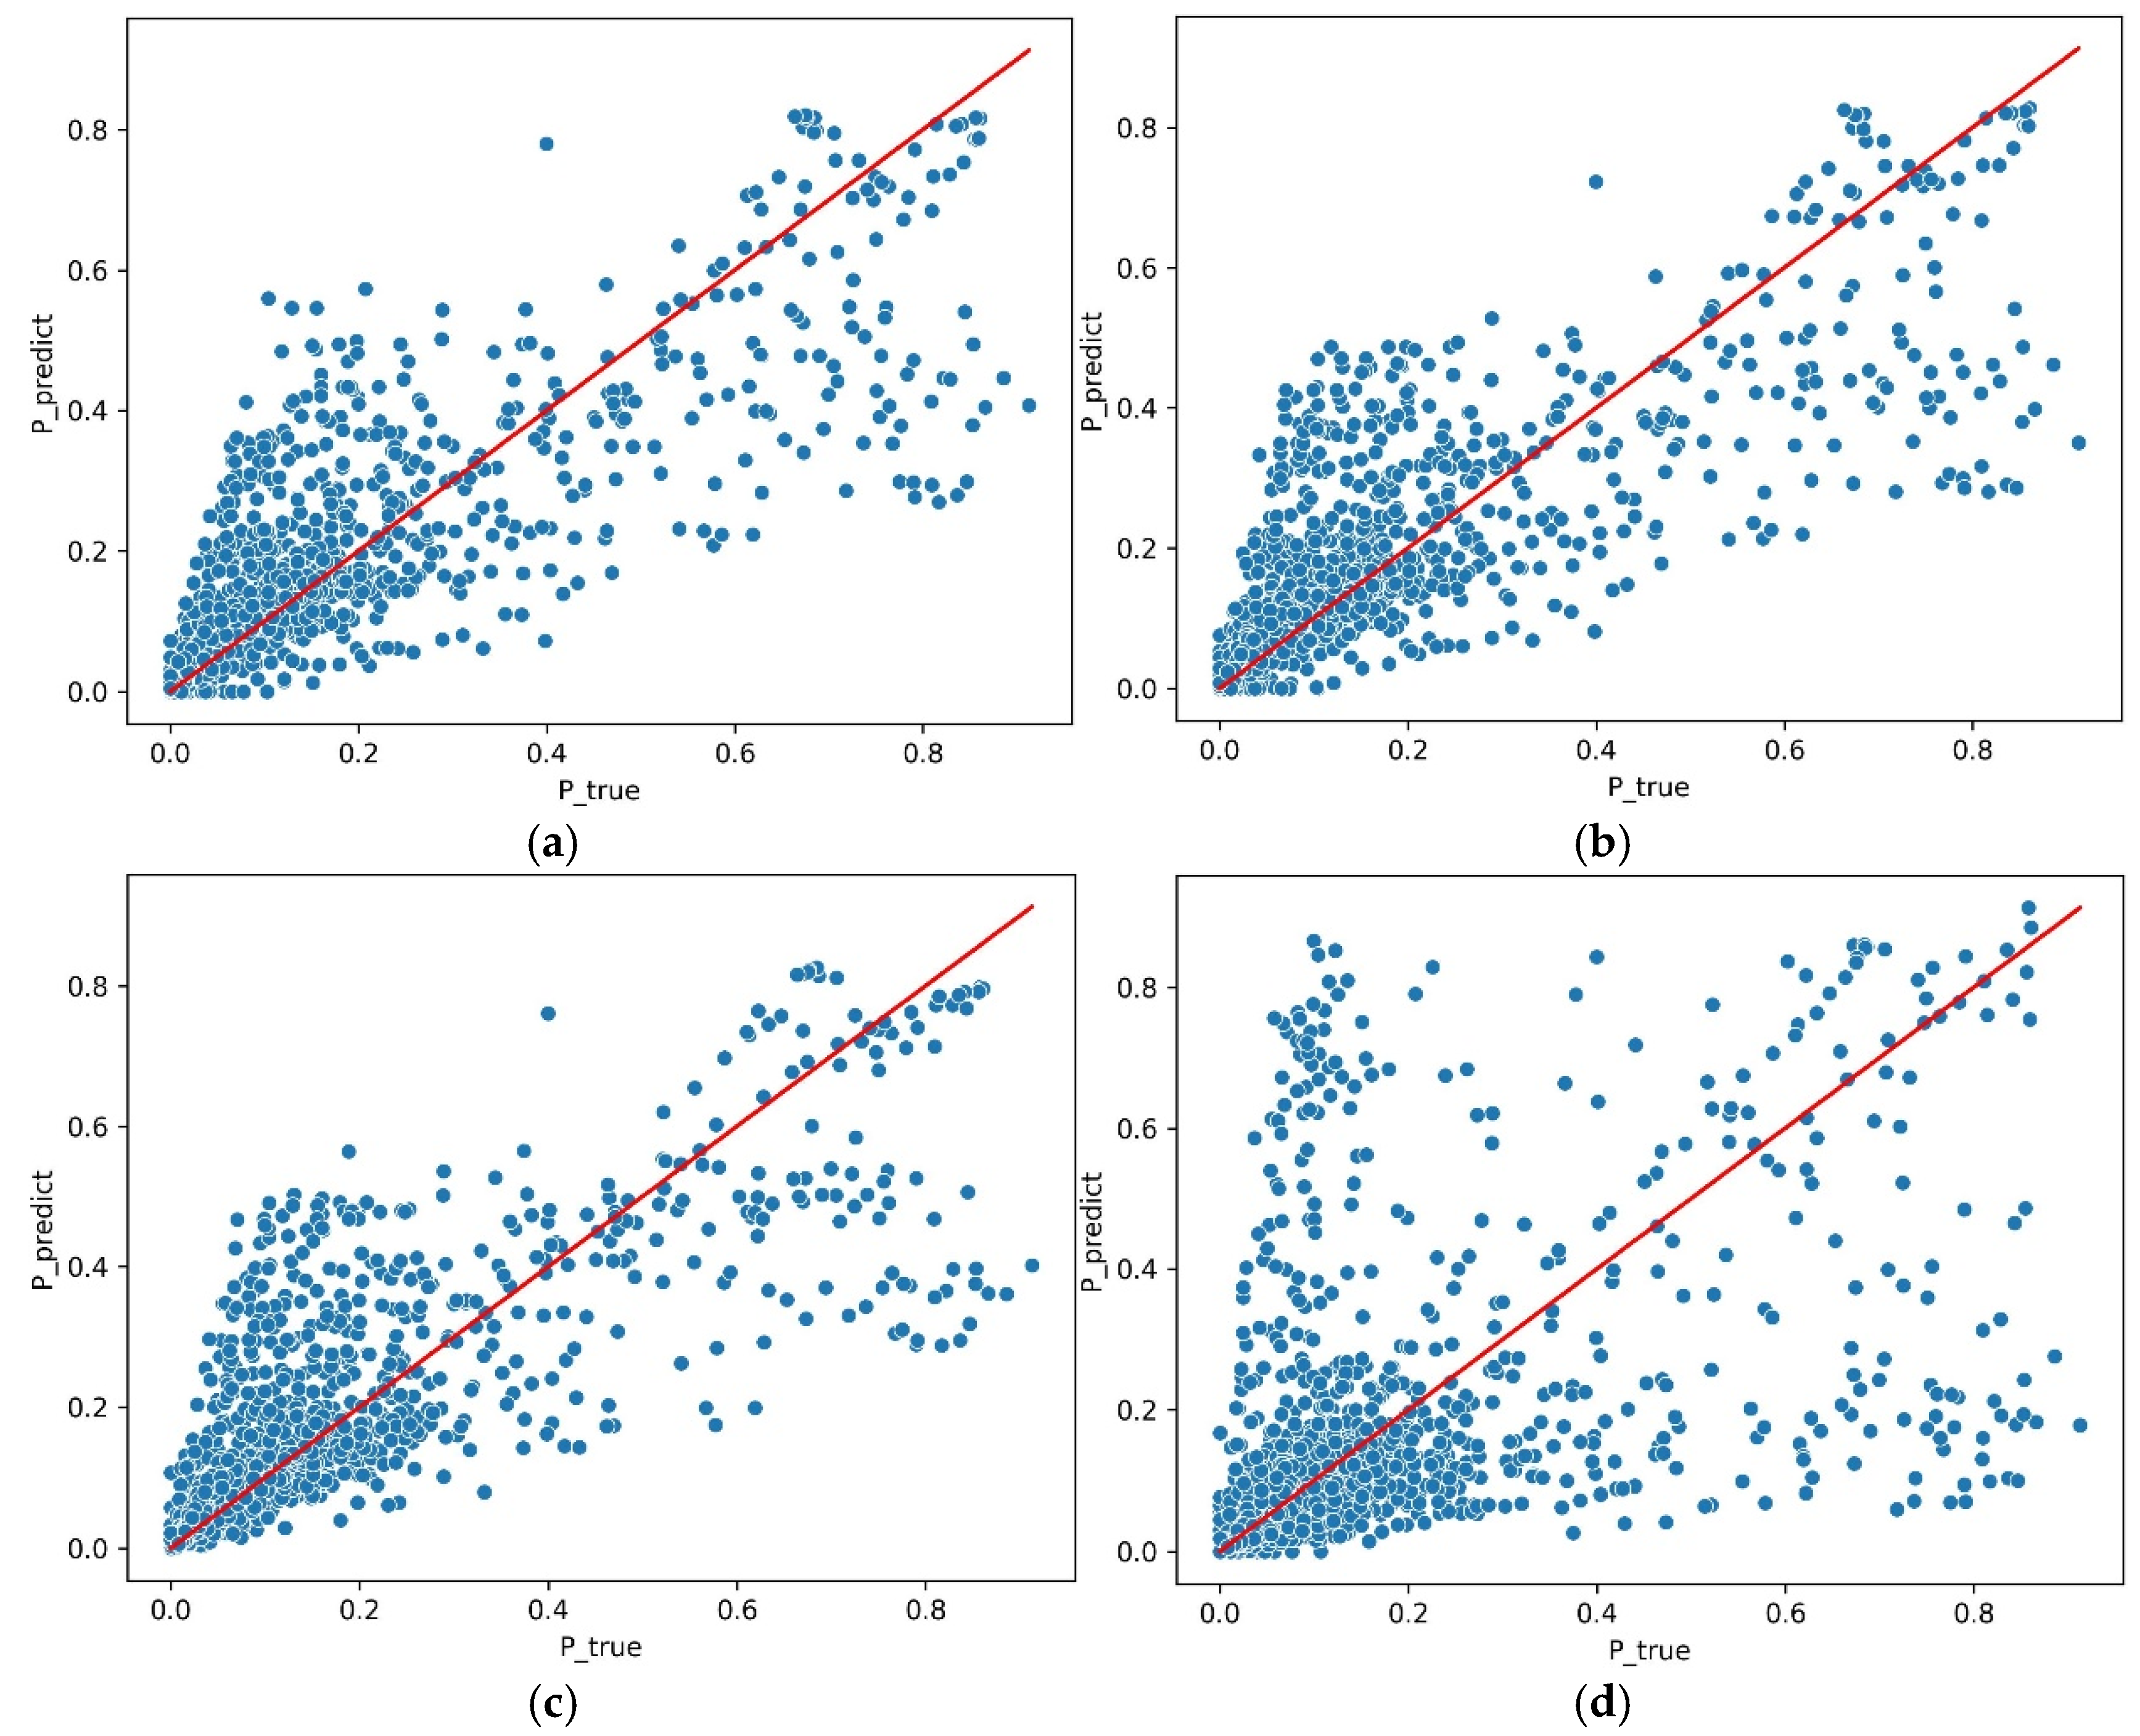
In addition to the comparative analysis of the single-day prediction results, the effectiveness of the proposed model was further verified using a test sample from February 2024. Figure 3 shows the correlation diagrams between the predicted and measured values of the output based on different models. In order to make a better comparison, the power value is normalized to the interval [0, 1]. The blue point represents the normalized predicted output and the corresponding actual output. When the predicted value is equal to the measured value, the blue point falls on the red solid line, so the dispersion degree of the blue points around the red line reflects the error between the predicted output and the measured output. The denser the concentration of blue spots around the red line, the smaller the prediction error of the corresponding model. Figure 3 intuitively reflects that the output prediction results based on the GBDT model are densely distributed around the red solid line, followed by the output prediction results based on the SVM model and the RFR model, and the results obtained by the persistent prediction model are sparsely distributed around the red solid line.
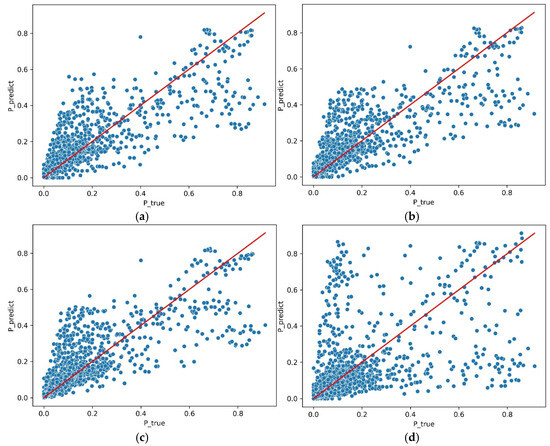
Figure 3.
Model correlation scatter plot: (a) the measured output versus the predicted output based on GBDT; (b) the measured output versus the predicted output based on SVM; (c) the measured output versus the predicted output based on RFR; (d) the measured output versus the predicted output based on the persistence prediction model.
As shown in Figure 3, the correlation diagram between the measured and the predicted output intuitively compares the performance of different prediction methods, but it is not reliable in quantitative evaluation. The statistical results of the prediction errors based on different models are shown in Table 1. Through quantitative comparison, the error indexes nMAE and nRMSE of the prediction results using the proposed method are lower than those of the other three reference models.

Table 1.
Prediction errors.
4. Conclusions and Discussion
On the basis of prediction, advanced dispatching control technology can be used to stabilize or even eliminate the fluctuation and intermittent influence of PV power generation. In this paper, the output prediction of large-scale PV power stations is studied. An output prediction method based on the GBDT is proposed, and the feasibility and accuracy of the method are verified. The proposed method can work effectively, even in the case of missing values or partial outliers in the data, so there is no need to fill in the missing values or preprocess the outliers extensively in the data preprocessing stage. The proposed method can gradually optimize the model through iteration in the model training stage. Each tree corrects the error of the previous tree, thereby enhancing the overall prediction ability of the model. It also automatically selects important features and reduces the workload of feature engineering. Through quantitative analysis, compared with the traditional method, the prediction error nMAE of the proposed method is reduced by 4.36%, and the prediction error nRMSE is reduced by 8.61%. Therefore, for the output prediction of large-scale PV power stations, the proposed method has better prediction performance than the traditional method. The proposed method can be applied to other large-scale centralized PV power stations to improve the accuracy and efficiency of the whole station output prediction. This method can adapt to the situation of a few outliers, but when there are too many outliers, the prediction method needs to be improved through further research.
Author Contributions
Conceptualization, R.X.; methodology, G.P.; software, C.L. and O.Y.; validation, B.L.; formal analysis, G.P.; investigation, C.L.; resources, B.L.; data curation, R.X.; writing—original draft preparation, R.X. and G.P.; writing—review and editing, C.L.; visualization, C.L.; supervision, O.Y.; project administration, R.X. and B.L.; funding acquisition, G.P. All authors have read and agreed to the published version of the manuscript.
Funding
This research was funded by the National Key Research and Development Plan (2017YFA0700301).
Data Availability Statement
Data will be made available on request.
Conflicts of Interest
Authors Rongyi Xie, Chun Liang and Beimin Lin employed by the Guangxi Beibu Gulf Land-Sea New Energy Co., Ltd. The remaining authors declare that the research was conducted in the absence of any commercial or financial relationships that could be construed as a potential conflict of interest.
Abbreviations
The following abbreviations are used in this manuscript:
| GBDT | Gradient-boosting decision trees |
| RFR | Random forest regression |
| SVM | Support vector machine |
References
- Xu, W.H.; Wang, Z.K.; Wang, W.S.; Zhao, J.; Wang, M.J.; Wang, Q.B. Short-Term Photovoltaic Output Prediction Based on Decomposition and Reconstruction and Xgboost under Two Base Learners. Energies 2024, 17, 906. [Google Scholar] [CrossRef]
- Wang, D.J.; Qi, T.; Liu, Y.F.; Wang, Y.Y.; Fan, J.H.; Wang, Y.; Du, H. A Method for Evaluating Both Shading and Power Generation Effects of Rooftop Solar Pv Panels for Different Climate Zones of China. Sol. Energy 2020, 205, 432–445. [Google Scholar] [CrossRef]
- Zhang, Y.; Mo, H.; Zhang, L. Prediction of Photovoltaic power generation based on fuzzy support vector machine. Therm. Power Gener. 2017, 46, 116–120. [Google Scholar]
- Faceira, J.; Afonso, P.; Salgado, P. Prediction of Solar Radiation Using Artificial Neural Networks. Lect. Notes Electr. Eng. 2015, 321, 397–406. [Google Scholar]
- Louzazni, M.; Mosalam, H.; Cotfas, D.T. Forecasting of Photovoltaic Power by Means of Non-Linear Auto-Regressive Exogenous Artificial Neural Network and Time Series Analysis. Electronics 2021, 10, 1953. [Google Scholar] [CrossRef]
- Mellit, A.; Pavan, A.M.; Lughi, V. Deep Learning Neural Networks for Short-Term Photovoltaic Power Forecasting. Renew. Energy 2021, 172, 276–288. [Google Scholar] [CrossRef]
- Yin, W.; Han, Y.; Zhou, H.; Ma, M.; Li, L.; Zhu, H. A Novel Non-Iterative Correction Method for Short-Term Photovoltaic Power Forecasting. Renew. Energy 2020, 159, 23–32. [Google Scholar] [CrossRef]
- Huang, Z.; Huang, J.; Min, J. Ssa-Lstm: Short-Term Photovoltaic Power Prediction Based on Feature Matching. Energies 2022, 15, 7806. [Google Scholar] [CrossRef]
- Ahmad, T.; Zhang, D.; Huang, C. Methodological Framework for Short-and Medium-Term Energy, Solar and Wind Power Forecasting with Stochastic-Based Machine Learning Approach to Monetary and Energy Policy Applications. Energy 2021, 231, 120911. [Google Scholar] [CrossRef]
- Ding, S.; Li, R.; Tao, Z. A Novel Adaptive Discrete Grey Model with Time-Varying Parameters for Long-Term Photovoltaic Power Generation Forecasting. Energy Convers. Manag. 2021, 227, 113644. [Google Scholar] [CrossRef]
- Mauladdawilah, H.; Gago, E.J.; Balfaqih, H.; Pegalajar, M.C. Towards Energy Efficiency: A Comprehensive Review of Deep Learning-Based Photovoltaic Power Forecasting Strategies. Heliyon 2024, 10, e33419. [Google Scholar]
- Wang, F.; Xuan, Z.; Zhen, Z.; Li, K.; Wang, T.; Shi, M. A Day-Ahead Pv Power Forecasting Method Based on Lstm-Rnn Model and Time Correlation Modification under Partial Daily Pattern Prediction Framework. Energy Convers. Manag. 2020, 212, 112766. [Google Scholar] [CrossRef]
- Li, D.; Li, J.; Lin, Y.; Chen, H.; Yang, G.; Chen, W. Short-Term Power Prediction for Centralized Photovoltaic Plants Based on Lstnet-Attention. In Proceedings of the IEEE/IAS Industrial and Commercial Power System Asia (IEEE I and CPS Asia), Chongqing, China, 7–9 July 2023. [Google Scholar]
- Wu, K.; Peng, X.; Li, Z.; Cui, W.; Yuan, H.; Lai, C.S.; Lai, L.L. A Short-Term Photovoltaic Power Forecasting Method Combining a Deep Learning Model with Trend Feature Extraction and Feature Selection. Energies 2022, 15, 5410. [Google Scholar] [CrossRef]
- Jakoplic, A.; Frankovic, D.; Havelka, J.; Bulat, H. Short-Term Photovoltaic Power Plant Output Forecasting Using Sky Images and Deep Learning. Energies 2023, 16, 5428. [Google Scholar] [CrossRef]
- Guo, X.; Mo, Y.; Yan, K. Short-Term Photovoltaic Power Forecasting Based on Historical Information and Deep Learning Methods. Sensors 2022, 22, 9630. [Google Scholar] [CrossRef]
- Jung, Y.; Jung, J.; Kim, B.; Han, S. Long Short-Term Memory Recurrent Neural Network for Modeling Temporal Patterns in Long-Term Power Forecasting for Solar Pv Facilities: Case Study of South Korea. J. Clean. Prod. 2020, 250, 119476. [Google Scholar] [CrossRef]
- Breiman, L. Random Forests. Mach. Learn. 2001, 45, 5–32. [Google Scholar] [CrossRef]
- Voyant, C.; Notton, G.; Kalogirou, S.; Nivet, M.L.; Paoli, C.; Motte, F.; Fouilloy, A. Machine Learning Methods for Solar Radiation Forecasting: A Review. Renew. Energy 2017, 105, 569–582. [Google Scholar] [CrossRef]
- Prasad, A.M.; Iverson, L.R.; Liaw, A. Newer Classification and Regression Tree Techniques: Bagging and Random Forests for Ecological Prediction. Ecosystems 2006, 9, 181–199. [Google Scholar] [CrossRef]
- Zamo, M.; Mestre, O.; Arbogast, P.; Pannekoucke, O. A Benchmark of Statistical Regression Methods for Short-Term Forecasting of Photovoltaic Electricity Production, Part I: Deterministic Forecast of Hourly Production. Sol. Energy 2014, 105, 792–803. [Google Scholar] [CrossRef]
- Yu, P.-S.; Yang, T.-C.; Chen, S.-Y.; Kuo, C.-M.; Tseng, H.-W. Comparison of Random Forests and Support Vector Machine for Real-Time Radar-Derived Rainfall Forecasting. J. Hydrol. 2017, 552, 92–104. [Google Scholar] [CrossRef]
- Benali, L.; Notton, G.; Fouilloy, A.; Voyant, C.; Dizene, R. Solar Radiation Forecasting Using Artificial Neural Network and Random Forest Methods: Application to Normal Beam, Horizontal Diffuse and Global Components. Renew. Energy 2019, 132, 871–884. [Google Scholar] [CrossRef]
Disclaimer/Publisher’s Note: The statements, opinions and data contained in all publications are solely those of the individual author(s) and contributor(s) and not of MDPI and/or the editor(s). MDPI and/or the editor(s) disclaim responsibility for any injury to people or property resulting from any ideas, methods, instructions or products referred to in the content. |
© 2025 by the authors. Licensee MDPI, Basel, Switzerland. This article is an open access article distributed under the terms and conditions of the Creative Commons Attribution (CC BY) license (https://creativecommons.org/licenses/by/4.0/).