Article

Simulation of the Effects of Hydrogen on the Combustion of Synthesis Gas Composed of Carbon Monoxide, Hydrogen, and Nitrogen in a Round Jet Burner

1
Gemlik Asim Kocabiyik Vocational School, Department of Mechanics, Bursa Uludag University, Gemlik, Bursa 16600, Turkey
2
Mechanical Engineering Department, Faculty of Engineering, Bursa Uludag University, Gorukle, Bursa 16059, Turkey
*
Author to whom correspondence should be addressed.
Processes 2025, 13(3), 654; https://doi.org/10.3390/pr13030654
Submission received: 3 January 2025 / Revised: 20 February 2025 / Accepted: 24 February 2025 / Published: 25 February 2025
(This article belongs to the Section Chemical Processes and Systems)

Abstract

:
Synthesis gas used in the production of synthetic natural gas is a gaseous mixture consisting of carbon monoxide, hydrogen, and nitrogen gas. A combustion flame is produced by mixing synthesis gas with a high-velocity air jet. In this study, the flame of synthesis gas and air combustion in a round jet burner was investigated numerically. The temperature, velocity, and pressure changes in the flame in the burner and the CO2, H2O, O2 mass fraction changes for six different mixture ratios were investigated numerically. The accuracy of the numerical method used in the study was supported by data from the literature. Depending on the production area, evaluations can be made in terms of emission rate, temperature, pressure change, and energy consumption values, and the most suitable working conditions for product quality can be determined. It has been established that a 40% increase in the hydrogen content of the mixture results in a flame temperature of approximately 1910 °C, with a corresponding temperature rise of 11%. This enhancement in hydrogen concentration contributes to an accelerated combustion rate and a higher peak temperature. The proportion of hydrogen in syngas is a significant factor affecting the combustion rate.

1. Introduction

The use of petroleum-based fuels has significant environmental and climatic consequences, making alternative energy sources increasingly important. One such alternative is synthesis gas, composed primarily of carbon monoxide, hydrogen, and nitrogen, which is expected to contribute significantly to future energy production [1]. Syngas is a blend of carbon monoxide, carbon dioxide, hydrogen, and trace amounts of methane, derived from sources such as natural gas, coal, oil, biomass, and organic waste [2]. Due to its potential as a cleaner fuel, investigating syngas flame structures—particularly in relation to pollutant formation—remains a crucial area of research. Studies indicate that hydrogen-rich syngas combustion generates considerably fewer emissions than coal combustion. As a result, syngas technology is being increasingly integrated into energy management systems. Moreover, syngas serves as a feedstock for producing ammonia, methanol, synthetic petroleum, and other fuel sources [3]. Synthesis gas is used to drive a gas turbine in a moist air cycle. The effects of porous media introduction were examined to predict the thermal behaviour of non-premixed synthesis gas. When compared to a free-space burner, a porous burner produces a shorter flame. As the air vapour drifted more rapidly and the fuel flow was delayed, the maximum temperature was reached closer to the fuel nozzle [4].
Ref. [5] examines the non-premixed combustion of CO/H2 mixtures in a round jet burner. A three-dimensional solution was achieved through direct numerical simulation, incorporating flame-formed manifolds based on detailed chemical kinetics. The findings demonstrated that the H2/CO ratio in the syngas mixture significantly influences flame characteristics [6]. Furthermore, experimental studies have analyzed the temperature and composition of unpremixed CO/H2/N2 combustion in a round jet burner [7,8]. Alavandi and Agrawal [9] experimentally investigated the lean premixed combustion of CO/H2/CH4/air mixture and observed that the CO-H2 mixture added with CH4 promoted CO and NOx emissions. Zhang and Yang [10] used micromixing to study the effect of CO dilution on emissions reduction. In addition to CFD analyses, experimental studies have also been conducted on turbulent unpremixed combustion analyses [11,12,13,14].
Numerical investigations of syngas combustion in various burner configurations have been conducted to understand the effects of hydrogen content and other gas compositions on flame characteristics and emissions. Studies have shown that increasing the hydrogen concentration in syngas affects the flame structure, decreases radial velocity and strain rate, and significantly reduces NO emissions without substantially impacting temperature [15,16]. The addition of diluents like CO2, H2O, and N2 to syngas mixtures can further reduce NO emissions, with CO2 being the most effective [16]. Researchers have employed various numerical models, including finite-rate chemistry and assumed-PDF approaches, to simulate turbulent reacting flows and investigate combustion efficiency [17]. Parameters such as fuel composition, pipe diameter, jet velocity, and co-flow velocity have been analyzed to optimize combustion characteristics and reduce pollutant emissions in non-premixed burners [18].
Syngas, a mixture of H2, CO, CO2, and N2, is being investigated as a cleaner alternative fuel for internal combustion engines [19]. The composition of syngas significantly affects its combustion characteristics. Lower H2/CO ratios lead to a higher flame instability, while CO promotes heat generation with less fluctuation [20]. Dilution with CO2 or N2 reduces the flame propagation velocity, maximum pressure rise, and deflagration index compared to undiluted syngas [21]. CO2 dilution results in longer flame lengths and lower reaction rates than N2 dilution while also increasing CO concentrations in the flame [22]. The choice of syngas production method, base fuel for reforming, and engine operating conditions are critical factors in determining the advantages of syngas use in internal combustion engines [19]. These findings contribute to the ongoing research on syngas as a potential environmentally friendly fuel source. In their study, they investigated the flame properties of turbulent premixed jet flames fed with stoichiometric hydrogen/methane mixtures. They examined four conditions with 0, 10, 50, and 80 vol% hydrogen. They found that the addition of hydrogen resulted in a decrease in wrinkling as the flame moved from the thin reaction zone regime to the corrugated flame regime [23].
For both flames, the radial dependence of the conditional means is slightly more pronounced at z/d = 20 than at z/d = 30, while it remains lower at all other measured downstream positions. These findings indicate that assuming radial independence of the conditional means serves as a reasonable approximation for fully coupled simple jet flames, as demonstrated in the present study [7]. The substantial advancements achieved by artificial intelligence in the domains of supersonic flow and combustion can be categorized into three primary areas. These include intelligent simulation of turbulent combustion, deep learning-based reconstruction of supersonic flow fields, and the smart design of complete flow passages in supersonic engines. In recent years, the turbulent combustion sector has increasingly utilized extensive datasets alongside sophisticated machine learning models, facilitating precise predictions of combustion efficiency and enhancements in the combustion process [24].
Syngas is a combustible gas mixture produced from solid fuels through gasification technology, which operates at elevated temperatures and pressures. The primary constituents of this flammable gas are hydrogen and carbon monoxide. Syngas is the main gaseous product obtained from thermal conversion processes, predominantly generated through gasification [25,26]. It is noteworthy that the pyrolysis process can also yield a gas mixture, commonly known as syngas, alongside tar and char. Demirbas and Arin [27] are recognized as early contributors to the study of biomass pyrolysis for syngas generation. They found that maintaining high temperatures, modest heating rates, and extended gas residence durations are crucial for pyrolysis to produce the best syngas yields. Kan et al. [28] examined several factors influencing syngas production, such as biomass type, its inherent characteristics, conversion techniques, and various pretreatment methods, including thermal, physical, biological, and chemical processes. Traditionally, syngas production has been primarily associated with the thermal conversion of fossil fuels like coal, char, natural gas, and petroleum, along with lignocellulosic biomass [29]. Tangestani et al. [30] examined the application of the multilayer perceptron neural network (MLP-NN) for predicting CO conversion in the water–gas shift (WGS) reaction, focusing on various active phase compositions and catalyst supports. Their findings showed that the MLP-NN model effectively estimated CO conversion by incorporating catalyst-specific parameters. Through sensitivity analysis [25,26] they identified temperature and H2 feed concentration as the key factors influencing reaction performance. This work demonstrates the accuracy and reliability of neural network techniques like MLP-NN in modelling CO conversion in WGS reactions. Liu et al. [31] proposed a smooth gradient approximation neural network for solving nonsmooth nonconvex optimization problems, which are commonly encountered in engineering applications. The method introduces a time-varying control parameter to smooth nonsmooth objective functions and uses a hard comparator function to ensure that the solution stays within nonconvex inequality constraints. The authors prove that any accumulation point of the neural network’s state solution is a stationary point of the nonconvex optimization problem. The proposed neural network outperforms related models by offering simpler algorithm structures and weaker convergence conditions. Simulation results and an optimization application demonstrate the practical effectiveness of the approach.
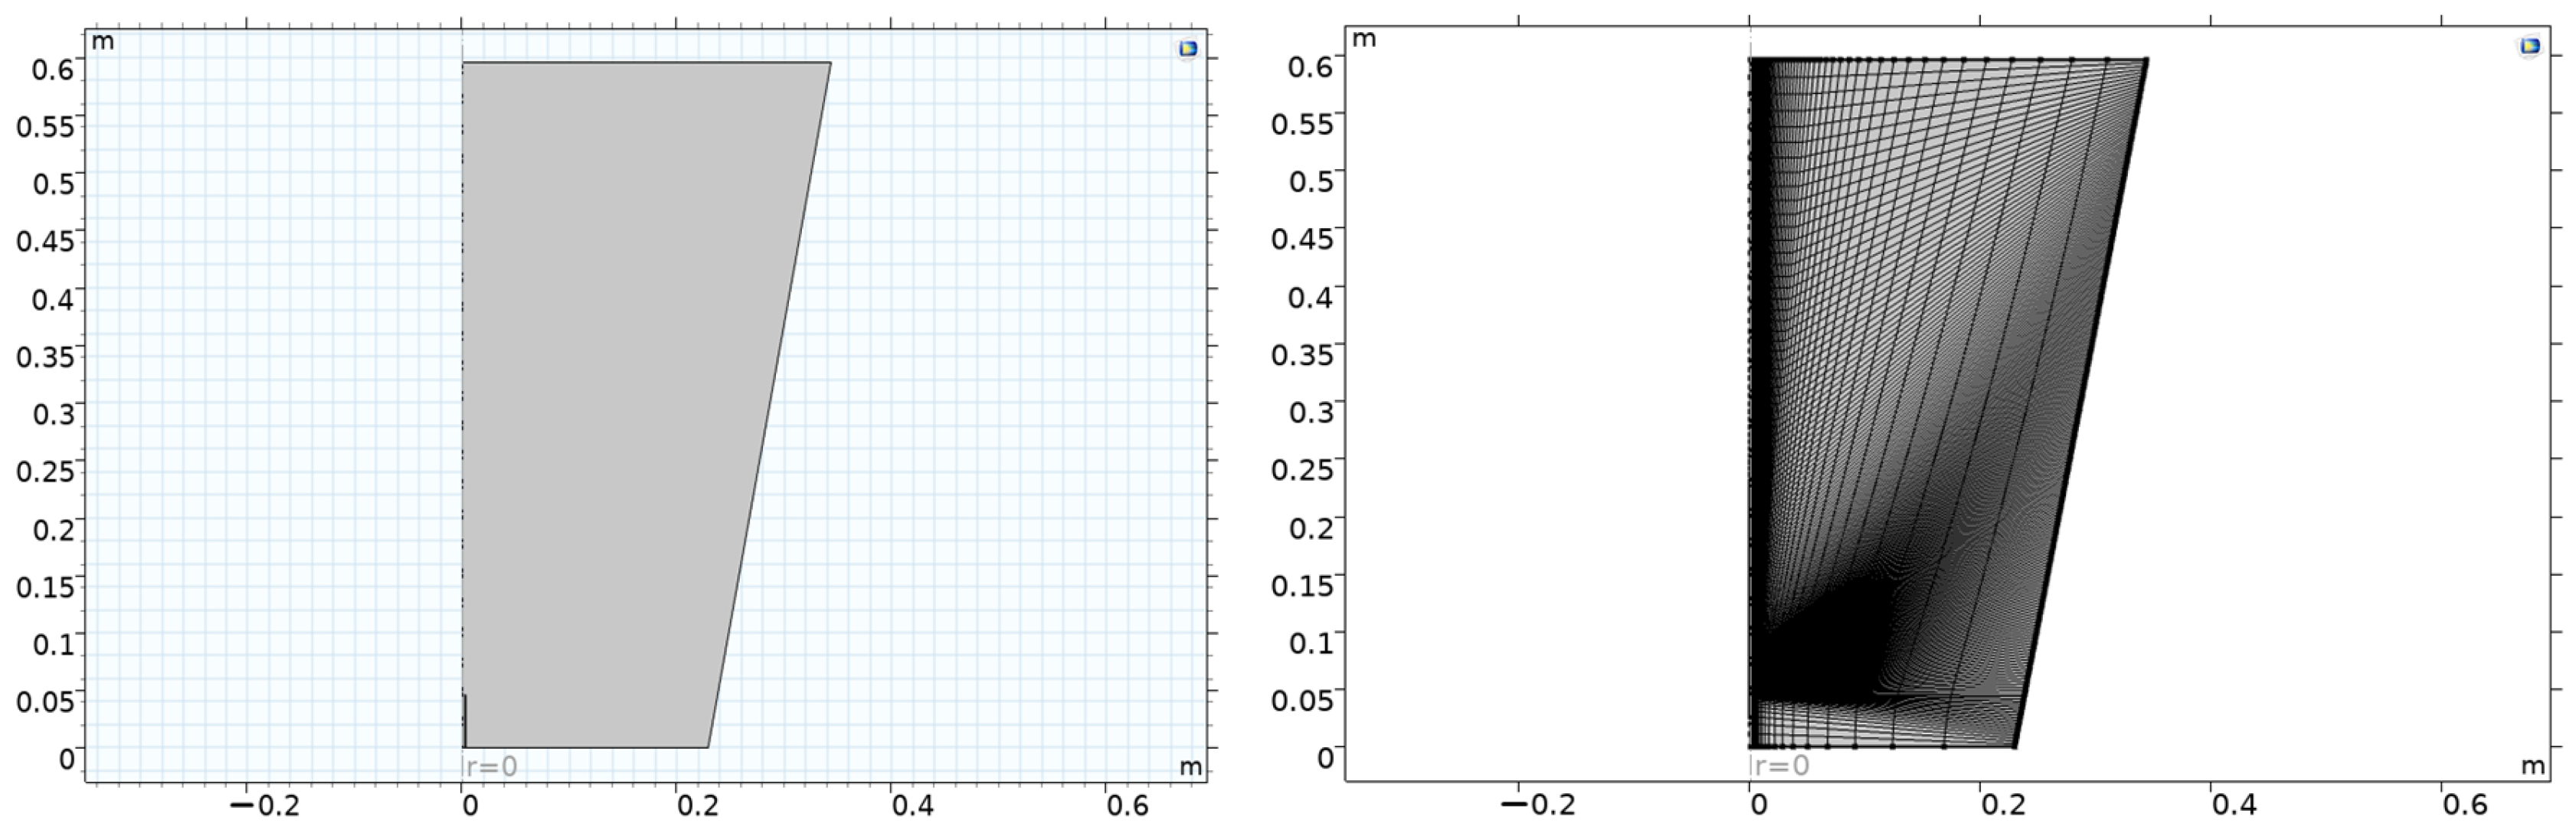
The aim of this study is to compare simultaneously the resulting changes in temperature, velocity, and pressure with the effects of carbon dioxide, water, and oxygen produced after combustion with different proportions of fuel amounts (hydrogen, carbon monoxide, and nitrogen) by volume. The temperature, velocity and pressure changes in the combustion flame obtained for different H2, CO, and N values (30% H2, 30% CO, 40% N2; 30% H2, 40% CO, 30% N2; 50% H2, 20% CO, 30% N2; 50% H2, 30% CO, 20% N2; 70% H2, 10% CO, 20% N2; 70% H2, 20% CO, 10% N2) and the mass change values of CO2, H2O, and O2 were obtained numerically in the Comsol Multiphysics 5.3. programme (COMSOL AB, Stockholm, Sweden, 2017). Additionally, velocity and temperature changes were obtained for z/d = 20 and z/d = 50 values. The internal diameter of the nozzle is represented by d, while z denotes the axial distance measured from the outlet of the nozzle. It was investigated whether there is a radial dependence.

2. Materials and Methods

This model examines a burner featuring a pipe positioned within a low-velocity stream (Figure 1). Fuel in the gas phase enters the pipe at a speed of 76 m/s, while the surrounding flow maintains a velocity of 0.7 m/s. At the pipe exit, the fuel gas mixes with air, forming a free circular jet. The gas fed from the tube consists of three parts. Compounds specific to synthesis gas are as follows: carbon monoxide (CO), hydrogen (H2), and nitrogen (N2). Fuel is ignited at the pipe exit. Since the fuel and oxidizer enter the reaction zone separately, the resulting combustion is of the non-premixed type.
In this case, the jet’s turbulent flow efficiently blends the fuel exiting the pipe with the surrounding oxygen. Furthermore, continuous combustion of the mixture is required. The Reynolds number for the jet, which is influenced by the inlet velocity and the pipe’s inner diameter, is approximately 16,700, confirming a fully turbulent state [32]. The initial conditions and assumptions for the analysis were derived from previous research [4]. Under these conditions, turbulence plays a crucial role in both the mixing and reaction processes within the jet. To incorporate turbulence effects, the k-ω turbulence model was employed in solving the flow field [4,32]. Utilizing symmetry, a two-dimensional model was formulated and solved using a cylindrical coordinate system (Figure 2). Before the analysis studies were carried out, mesh independence studies were carried out. The mesh number was chosen as 12,800 with 1% precision. Highly nonlinear equations are addressed through a series of solution steps. This approach is vital to ensuring a reliable solution process when tackling highly coupled models. The resolution of highly nonlinear equations is achieved through multiple solution steps. This approach is essential for ensuring a reliable solution process when addressing models characterized by significant coupling. The numerical simulation of the turbulent reaction flow within the burner and combustion chamber was conducted utilizing the COMSOL software 5.3. This platform enables the application of the finite volume method alongside various physical models, including laminar, viscous, turbulent, and others, to address the governing equations pertaining to fluid dynamics and species transport. A relative tolerance of 0.001 was implemented. The PARADISO solver 5.3 was employed for fluid flow, turbulence parameters, mass fractions, and temperature, while the SIMPLE algorithm was utilized for the remaining variables. The mesh configuration employed for resolving syngas combustion issues is constructed using the free triangle pattern. The maximum element size is established at 0.039, while the maximum growth factor is set to 1.3. Additionally, the resolution for narrow regions is defined as 1.

2.1. Mathematic Model

The turbulent, non-premixed combustion of syngas and air in a multilayer burner is modelled. The solution is implemented with COMSOL Multiphysics [33]. A gaseous fuel, which is a mixture of carbon monoxide (CO), hydrogen (H2), and nitrogen (N2), is supplied through the nozzle. The mass fractions of the syngas components are as follows: 30% H2, 30% CO, 40% N2; 30% H2, 40% CO, 30% N2; 50% H2, 20% CO, 30% N2; 50% H2, 30% CO, 20% N2; 70% H2, 10% CO, 20% N2; and 70% H2, 20% CO, 10% N2. We successfully studied the structure of the turbulent CO/H2/N2 jet flame. The mixed gas is ignited at the nozzle outlet, where the fuel jet and the entrained gas meet in the air.
The chemical kinetics of the syngas are described by two global irreversible reactions [34].
CO + 0.5 O2 → CO2
H2 + 0.5 O2 → H2O

2.2. Mass Conversation

ρ u = 0
where ρ is density and u is velocity.

2.3. Momentum Conversation

ρ u u = p l + ( μ + μ T ) ( u + u T 2 3 μ + μ T u l 2 3 ρ k l μ u κ
where p l is the pressure tensor (with I as the identity matrix), μ T is turbulent viscosity, k is turbulent kinetic energy, μ is dynamic viscosity, and u T is transpose of the velocity gradient tensor.

2.4. Turbulence Modeli

The fluid flow is governed by the averaged Navier–Stokes equations, ensuring momentum conservation, along with the continuity equation for total mass conservation. To model turbulence, the Wilcox-modified k-ω approach with feasibility constraints is applied [32]. Near solid surfaces, wall functions are utilized to describe flow behaviour and mass transfer. For chemical species, the governing transport equations account for convection, diffusion, and, if applicable, migration within an electric field, as detailed below:
ρ u . k = μ + μ T σ k k + P k β 0 ρ ω k
where σ k is the turbulent kinetic energy diffusion coefficient, P k is the turbulent kinetic energy production term, β 0 is the model coefficient (characteristic multiplier), and ω is the specific dissipation rate of turbulent kinetic energy.
ρ u . ω = μ + μ T σ ω ω + α ω k P k β 0 ρ ω 2 ω = o m
where ω is the specific dissipation rate of turbulent kinetic energy, σ ω is the turbulent diffusion coefficient for ω , α ω k P k is the production term for ω , and β 0 ρ ω 2 is the dissipation term for ω .
μ T = ρ k ω
where μ T is the turbulent viscosity, which represents the effect of turbulence on momentum transport.
P k = μ T u : u + ( u ) T 2 3 ( u ) 2 2 3 ρ k u
where P k is the production of turbulent kinetic energy, u is the velocity gradient tensor, ( u ) T is the transpose of the velocity gradient tensor, μ T is the turbulent viscosity, 2 3 ( u ) 2 is the isotropic dissipation correction, and 2 3 ρ k u is the correction term for the pressure–strain interaction.

2.5. Equation of Species Transport

The reaction yields the relative mass flux vector using Fick’s law diffusion model.
J i + ρ ( u ) ω i = f R i
where J i is the diffusive flux of species i, ω i is the mass fraction of species i, f is the source term related to combustion or reaction rates, and R i is the reaction rate of species i.
J i = ( ρ D i F + v T S c T ω i + ρ ω i D i F M n M n + D i T T T
where D i F is the molecular diffusion coefficient of species, v T is the turbulent kinematic viscosity, S c T is the turbulent Schmidt number, M n   is the gradient of mean molar mass, and D i T is the thermal diffusion coefficient.

2.6. The Heat Transfer Model

Thermal equilibrium assumptions are used to model the heat transmission in porous media interfaces. The temperature-dependent equivalent of this energy equation is as follows:
ρ c p u . T + k T = Q + Q p + Q v d
where Q p is the heat generated by a physical or chemical process, Q v d is the viscous dissipation heat source, k T is the heat conduction term, Q is the heat source term, and u . T is the convective heat transfer term [35].

2.7. Turbulent Reaction Rate

The reaction rate as characterized by the eddy dissipation model [4] is as follows:
r E D , j = α j τ T ρ . min m i n ω r v r j M r , β P ω P v p j M p
where r E D , j is the eddy dissipation model reaction rate for species j, α j is the reaction rate coefficient for species j, τ T is the turbulent time scale, ω r is the mass fraction of reactant, v r j is the Stoichiometric coefficient of reactant r for species j, M r is the molecular weight of reactant r, β is the empirical constant related to the reaction model, ω P is the mass fraction of product p, v p j is the Stoichiometric coefficient of product p for species j, and M p is the molecular weight of product p. The eddy dissipation model operates under the premise that both the Reynolds and Damköhler numbers are sufficiently elevated, allowing the reaction rate to be constrained by the turbulent mixing time scale, τ T . As a result, the overall reaction advances at a rate determined by the molecular-level mixing of fresh reactants, which is driven by turbulence. Moreover, the reaction rate is assumed to be constrained by the reactant present in the lowest concentration, acting as the limiting component. The model parameter β indicates that the presence of a product species is necessary for the reaction, effectively modelling the activation energy. For gaseous non-premixed combustion, the model parameters have been identified as follows: α = 4, β = 0.5 [32].
In this model, the molecular reaction rate is considered to be infinitely rapid, which is accomplished by assigning high rate constants to the reactions. This leads to the conclusion that the production rate is determined exclusively by turbulent mixing, as expressed in Equation (12). The eddy dissipation model is recognized for its simplicity and robustness in addressing turbulent reactions. Thus, the reaction rate is dictated by a singular time scale, namely the turbulent mixing time scale.

2.8. Boundary Conditions and Numerical Solution

The burner’s flat syngas nozzle is positioned at the centre of the co-flowing air. Since the combustor exhibits axisymmetric behaviour around its central vertical axis, a semi-symmetric model is used to reduce computation time and storage requirements, while still capturing all essential details. The side anti-slip wall is assumed to be perfectly insulated. The syngas feed rate from the nozzle is 76 m/s and the ambient air velocity is 0.7 m/s. The gas mixture consists of carbon monoxide (CO), hydrogen (H2), and nitrogen (N2). The fuel ignition occurs at the outlet. The fuel and oxidizer enter the reaction zone separately and burn without mixing beforehand. With a Reynolds number of 16,700 for the fuel jet, determined by the pipe diameter and inlet velocity, the jet is turbulent. Under these conditions, turbulent flow significantly influences both the mixing and reaction processes in the jet, hence a turbulent flow model is employed.
Table 1 shows the properties of the components used in the simulation [33].
The two-dimensional model of syngas combustion consists of highly nonlinear equations that are solved in three steps using the finite element method.
  • The isothermal turbulent flow in a straight pipe is solved using an initial submodel. The fully developed flow at the pipe outlet is then used as the inlet condition for the burner.
  • The turbulent reacting flow in an omnidirectional burner configuration is solved.
  • Heat transfer is incorporated into the analysis and solved within the context of the fully coupled reacting flow. The initial conditions are based on the results from the previous solution. The reacting flow, along with heat transfer, is calculated by using the previous solution as the starting point for the new computations.
When solving highly coupled models, using multiple solution steps is essential for a robust solution process. This is the case for turbulent reacting flows including heat transfer.

2.9. Model Validation

Figure 3 shows the comparison of the literature data [7] and the numerical studies of the velocity profile of a jet. The x-axis represents the radial distance from the jet centre, normalized by the jet diameter (r/Di), and the y-axis represents the normalized velocity (uz/Ujet), which is the velocity at a given point divided by the velocity at the jet centre.
The literature study [7] is represented by the blue dots, while the numerical study is represented by the orange line. Both studies show that the velocity profile is bell shaped, with the highest velocity at the jet centre and decreasing velocity as the distance from the centre increases. The numerical study closely matches the literature data, suggesting that the numerical model is in good agreement with the literature data.

3. Results and Discussion

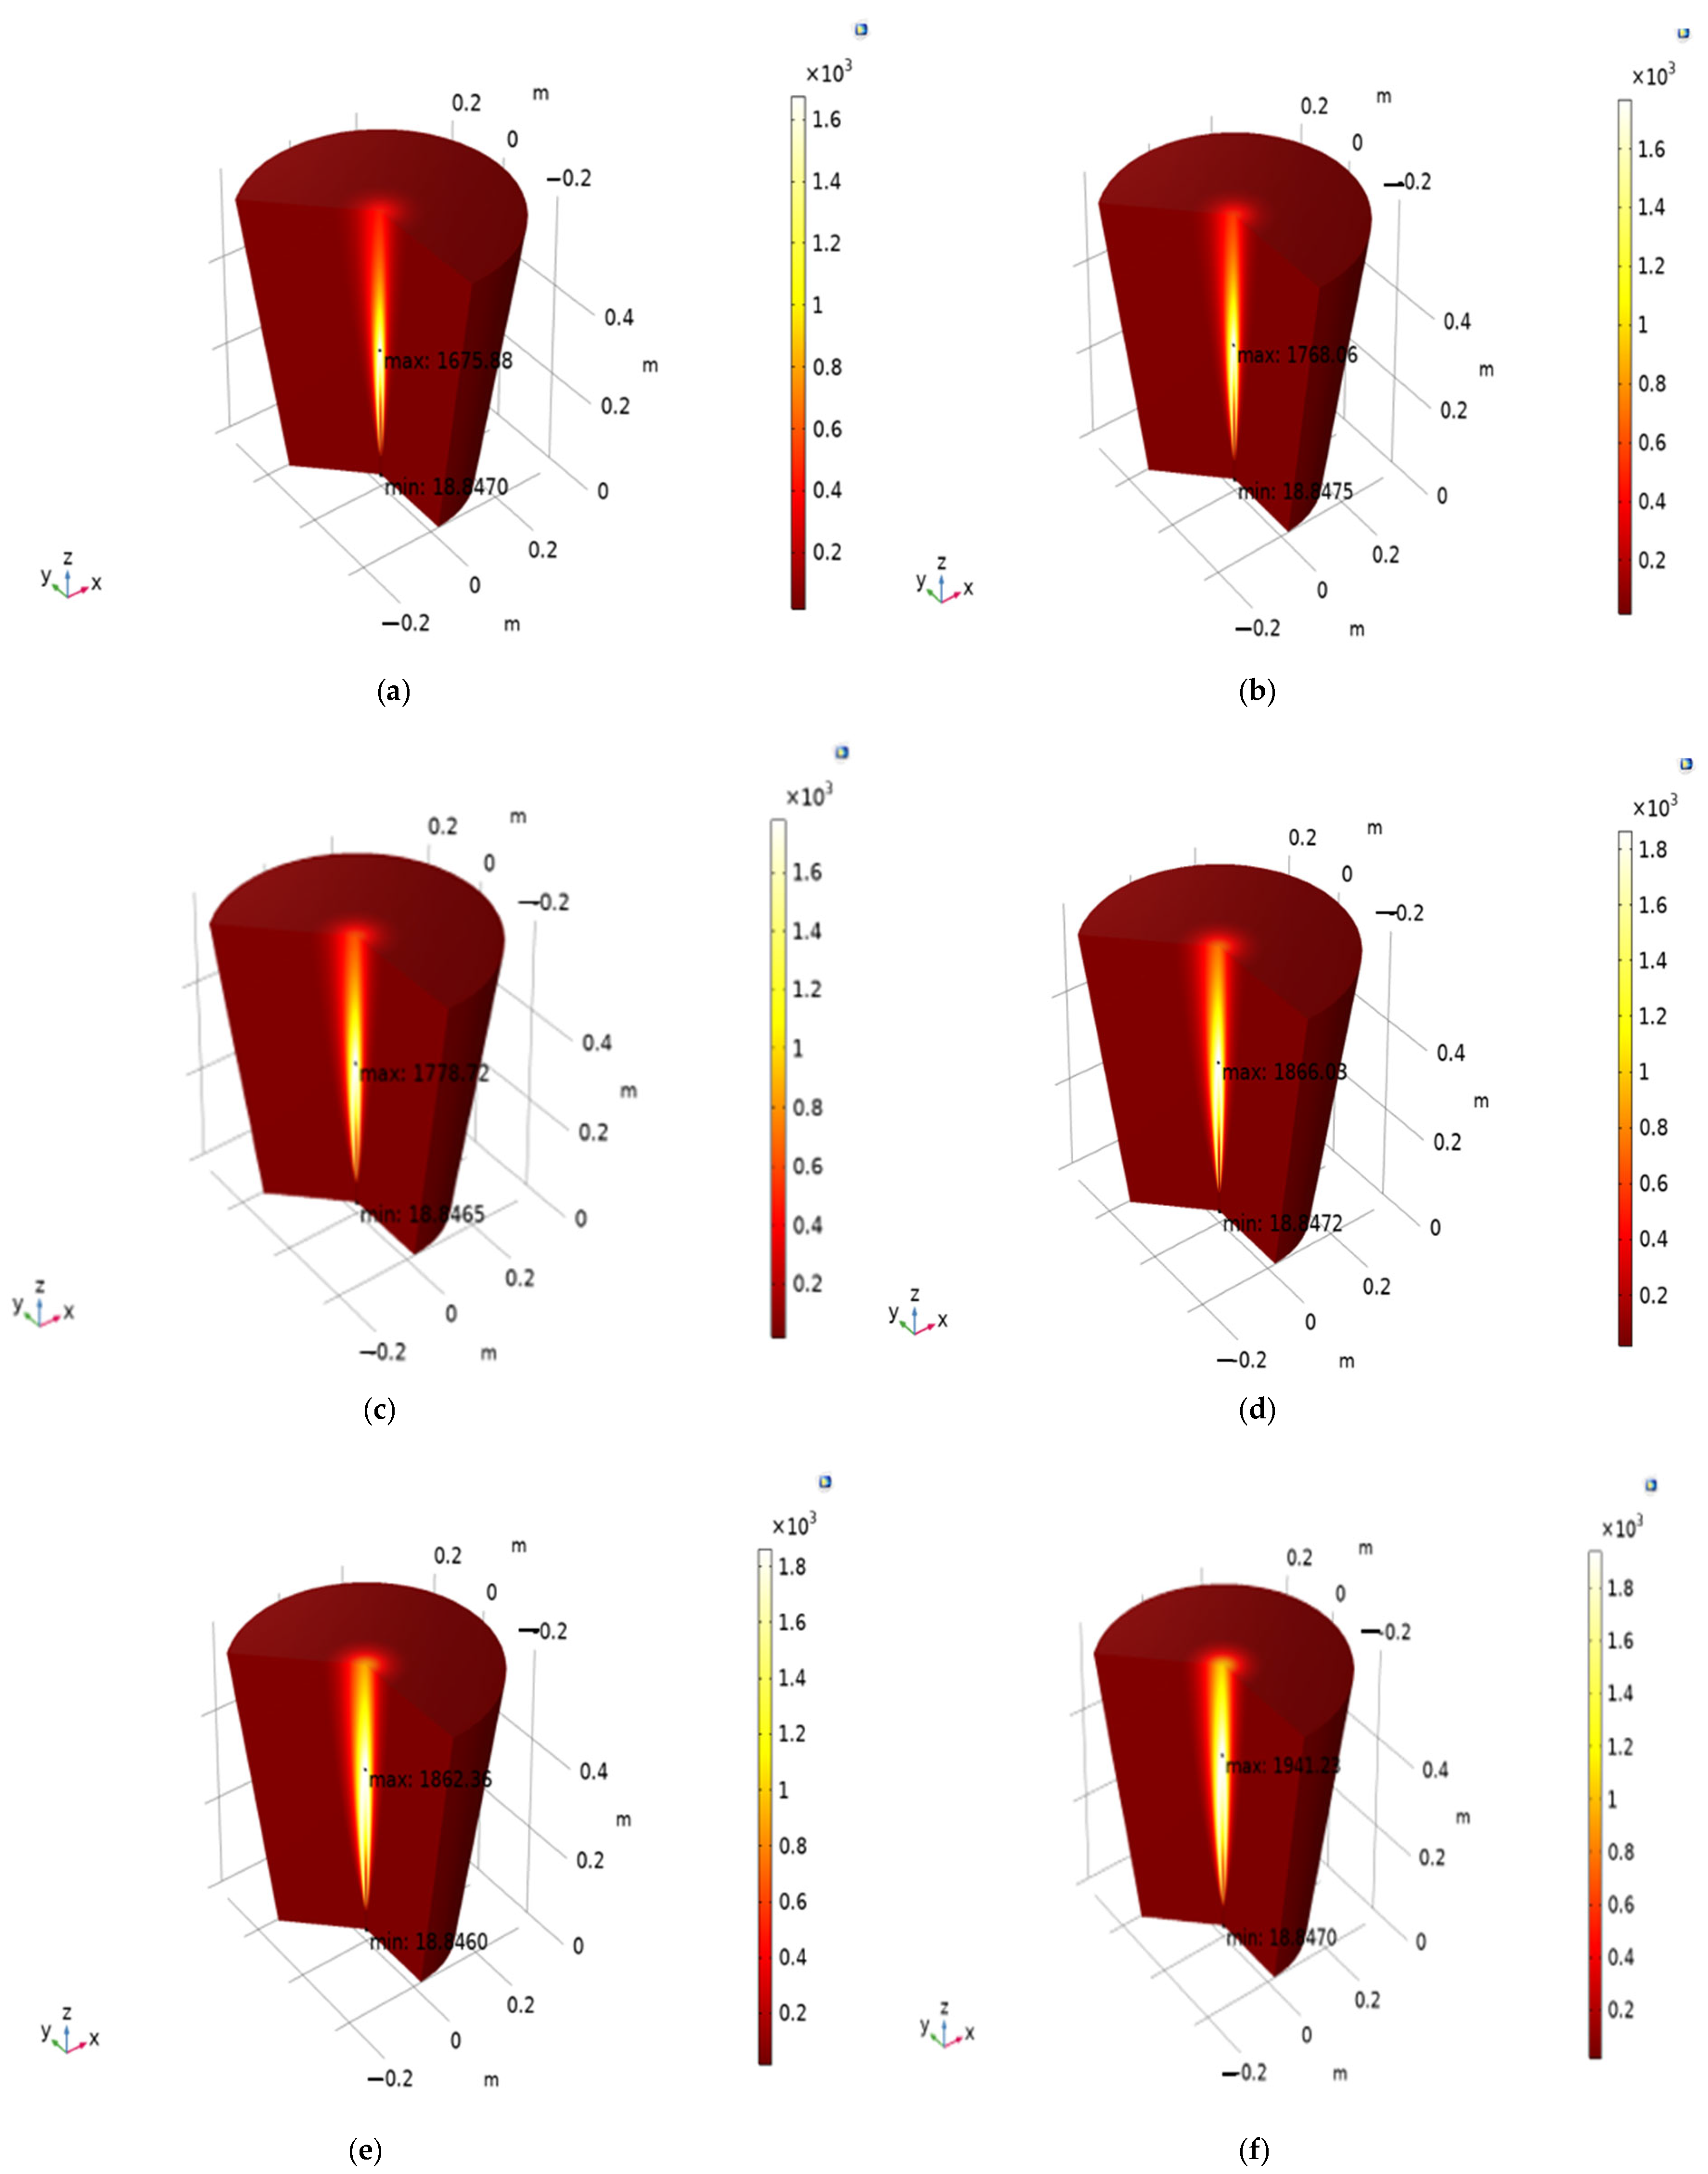
Figure 4 gives simulation results for different gas mixture ratios shown in subpoints a–f. Each subplot represents the temperature distribution of a specific mixture of hydrogen (H2), carbon monoxide (CO), and nitrogen (N2). This mixture (30% H2, 30% CO, 40% N2) contains equal amounts of hydrogen and carbon monoxide, with nitrogen being the dominant component. The temperature distribution appears relatively even, with a moderate maximum temperature compared to the other mixtures. Here (30% H2, 40% CO, 30% N2), the CO concentration is higher than in Figure 4a, while H2 and N2 are equal. The maximum temperature increases compared to Figure 4a, suggesting that a higher CO content contributes to higher peak temperatures., This mixture (50% H2, 20% CO, 30% N2) has a higher hydrogen content and a lower CO content compared to Figure 4a,b.
The peak temperature increases significantly, indicating that hydrogen has a more substantial impact on raising the temperature. In the mixture of 50% H2, 30% CO, and 20% N2, with equal amounts of H2 and CO and a reduced N2 content, the temperature distribution shows a high peak temperature. The results suggest that reducing N2 and increasing H2 and CO leads to higher temperatures. This mixture (70% H2, 10% CO, 20% N2) is dominated by hydrogen, with a very low CO content and moderate N2. The highest maximum temperature is observed in this scenario, highlighting the significant role of hydrogen in raising the temperature. The mixture of 70% H2, 20% CO, and 10% N2 is similar to Figure 4e but with a higher CO content and lower N2. The temperature distribution is slightly more uniform, but the peak temperature remains high, confirming the influence of hydrogen.
The increase in hydrogen content leads to a significant rise in the maximum temperature. This is evident from Figure 4c–f, where mixtures with higher hydrogen percentages show higher peak temperatures. Increasing CO content also contributes to higher temperatures but not as significantly as hydrogen. This is observed by comparing Figure 4a,b and Figure 4c,d. Nitrogen appears to act as a diluent, reducing the overall peak temperature. Mixtures with a higher nitrogen content (like in Figure 4a,b) show lower temperatures compared to those with a reduced nitrogen content (like in Figure 4e,f).
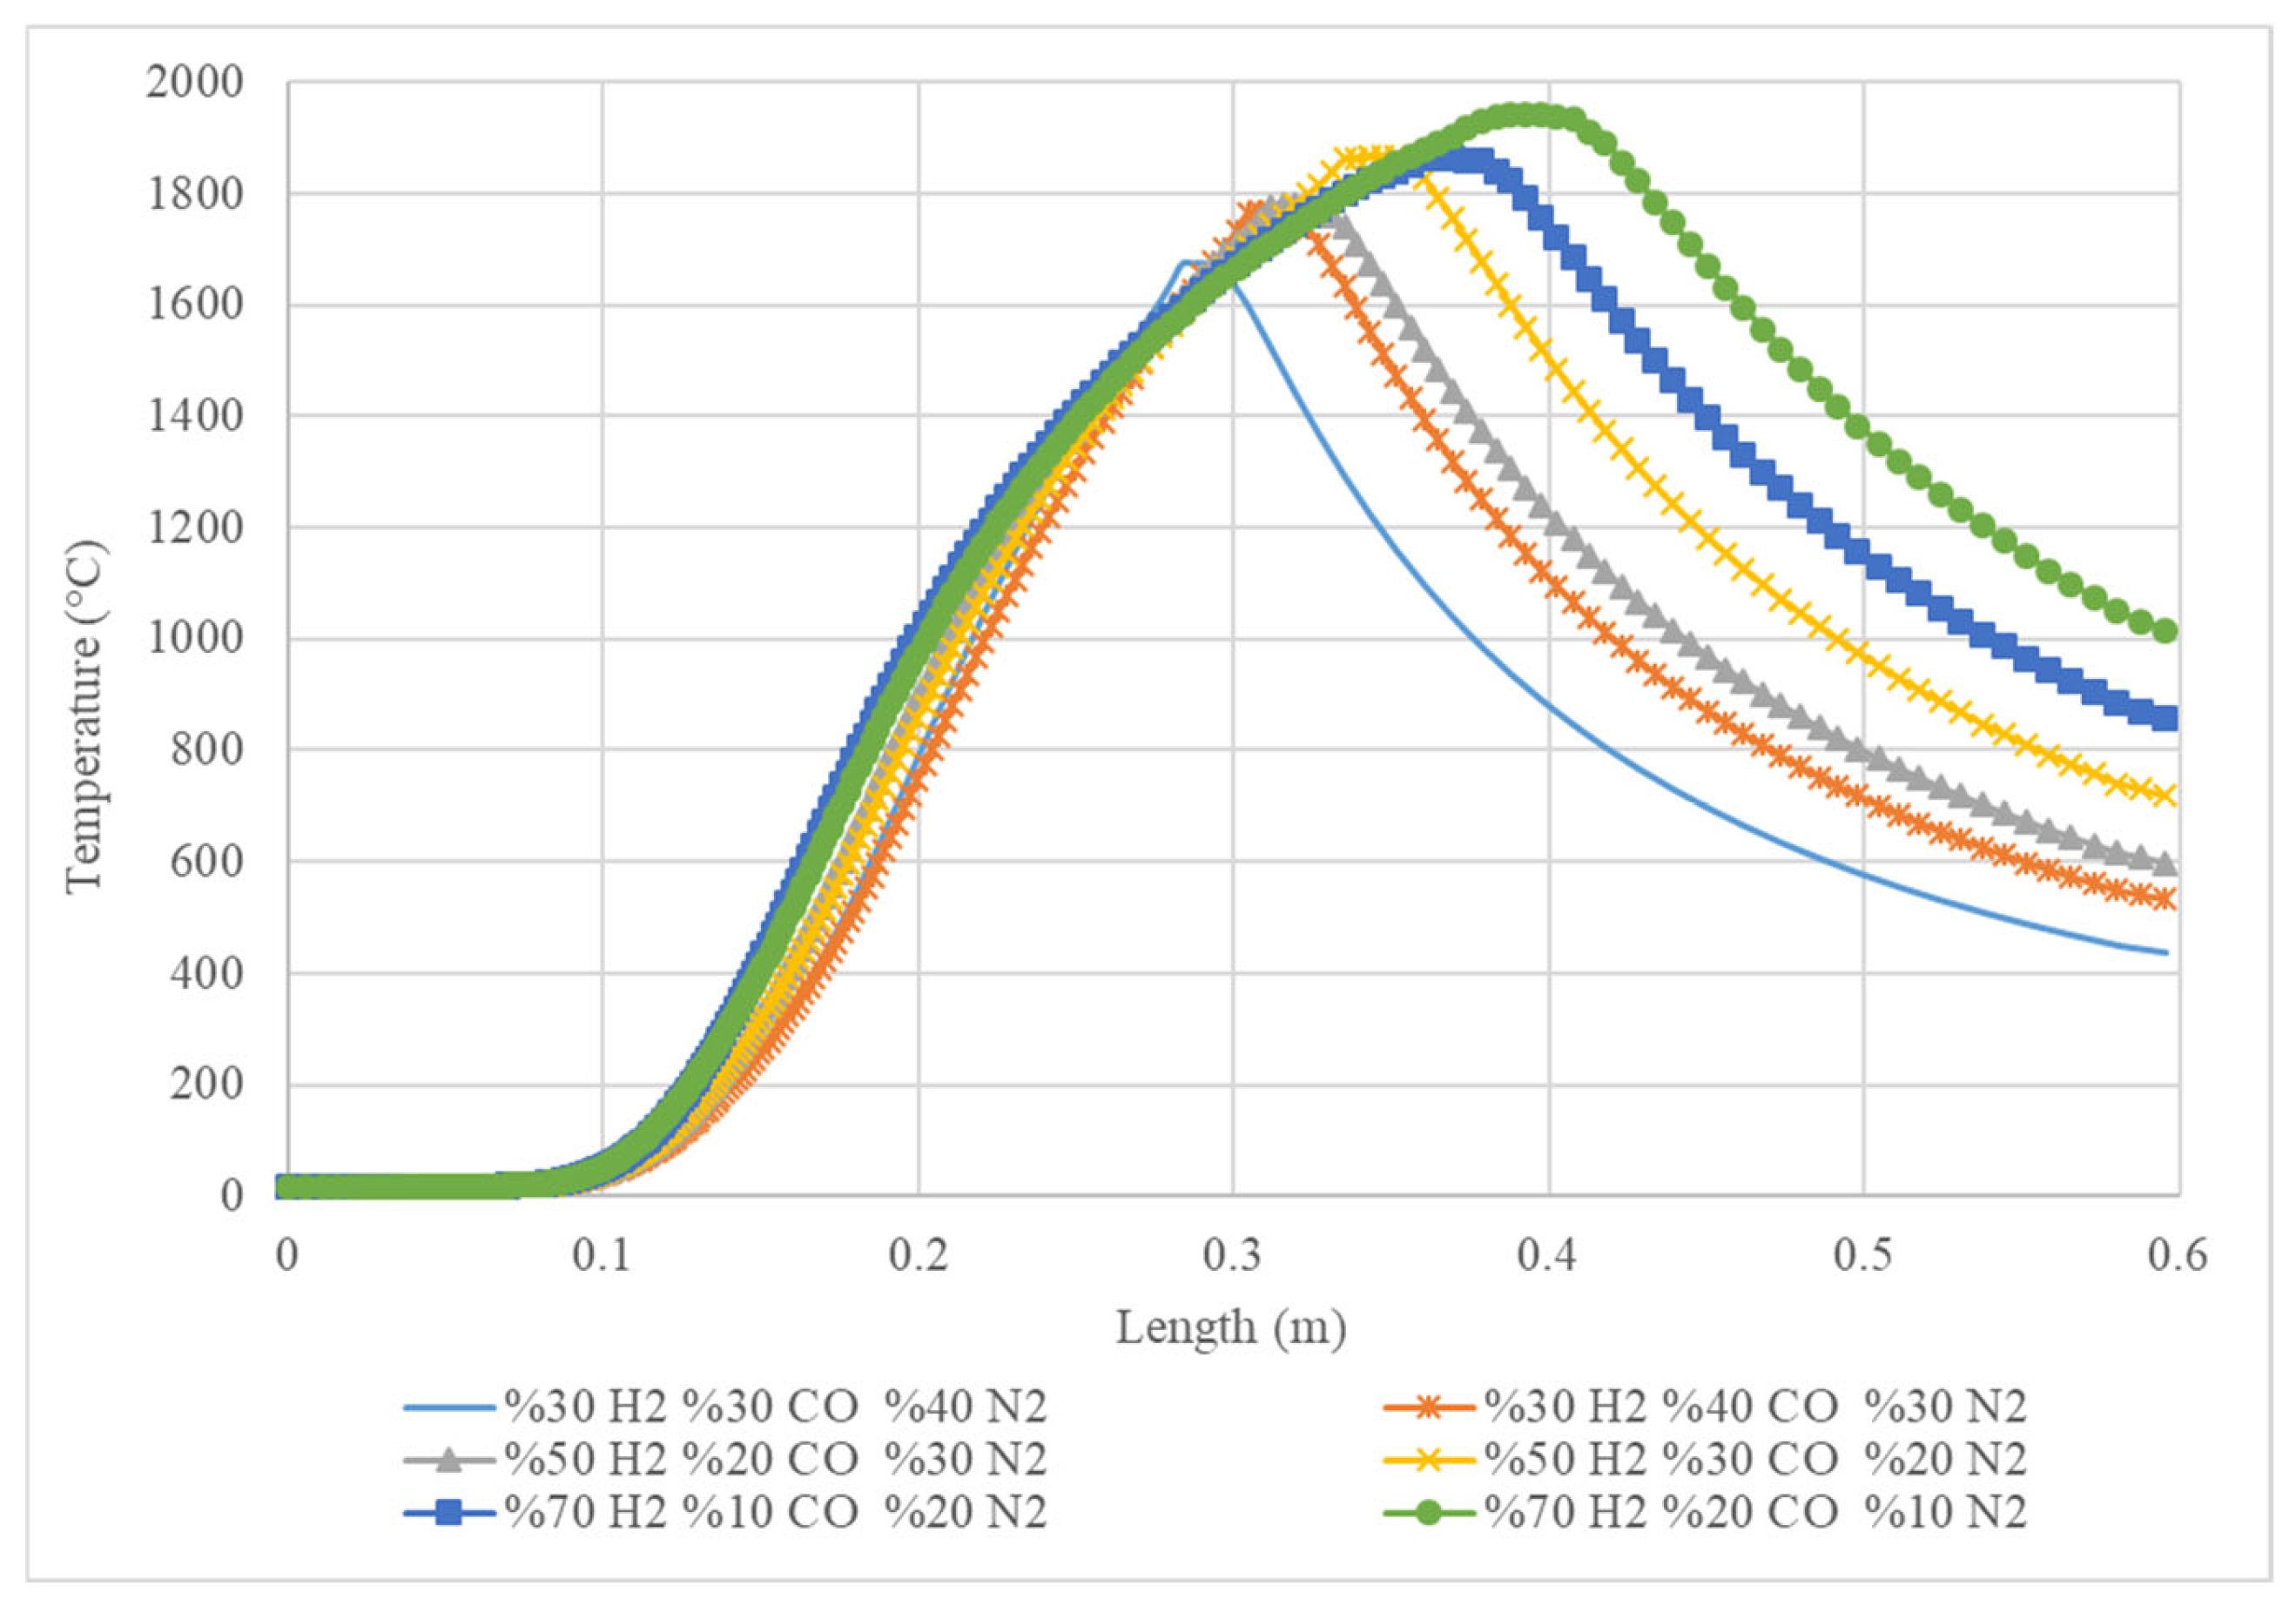
Figure 5 shows the temperature profile along a certain length for different gas compositions. The x-axis represents the length in metres, and the y-axis represents the temperature in degrees Celsius. Each line on the graph represents a different gas mixture, with the percentages of hydrogen (H2), carbon monoxide (CO), and nitrogen (N2) given in the legend. The graph shows that the temperature increases along the length, reaching a peak before decreasing again. The peak temperature varies depending on the gas mixture, with the highest temperature achieved by the mixture with 70% H2, 20% CO, and 10% N2 (green line). The graph suggests that the gas mixture has a significant impact on the temperature profile. The mixture with the highest percentage of hydrogen and the lowest percentage of nitrogen has the highest peak temperature.
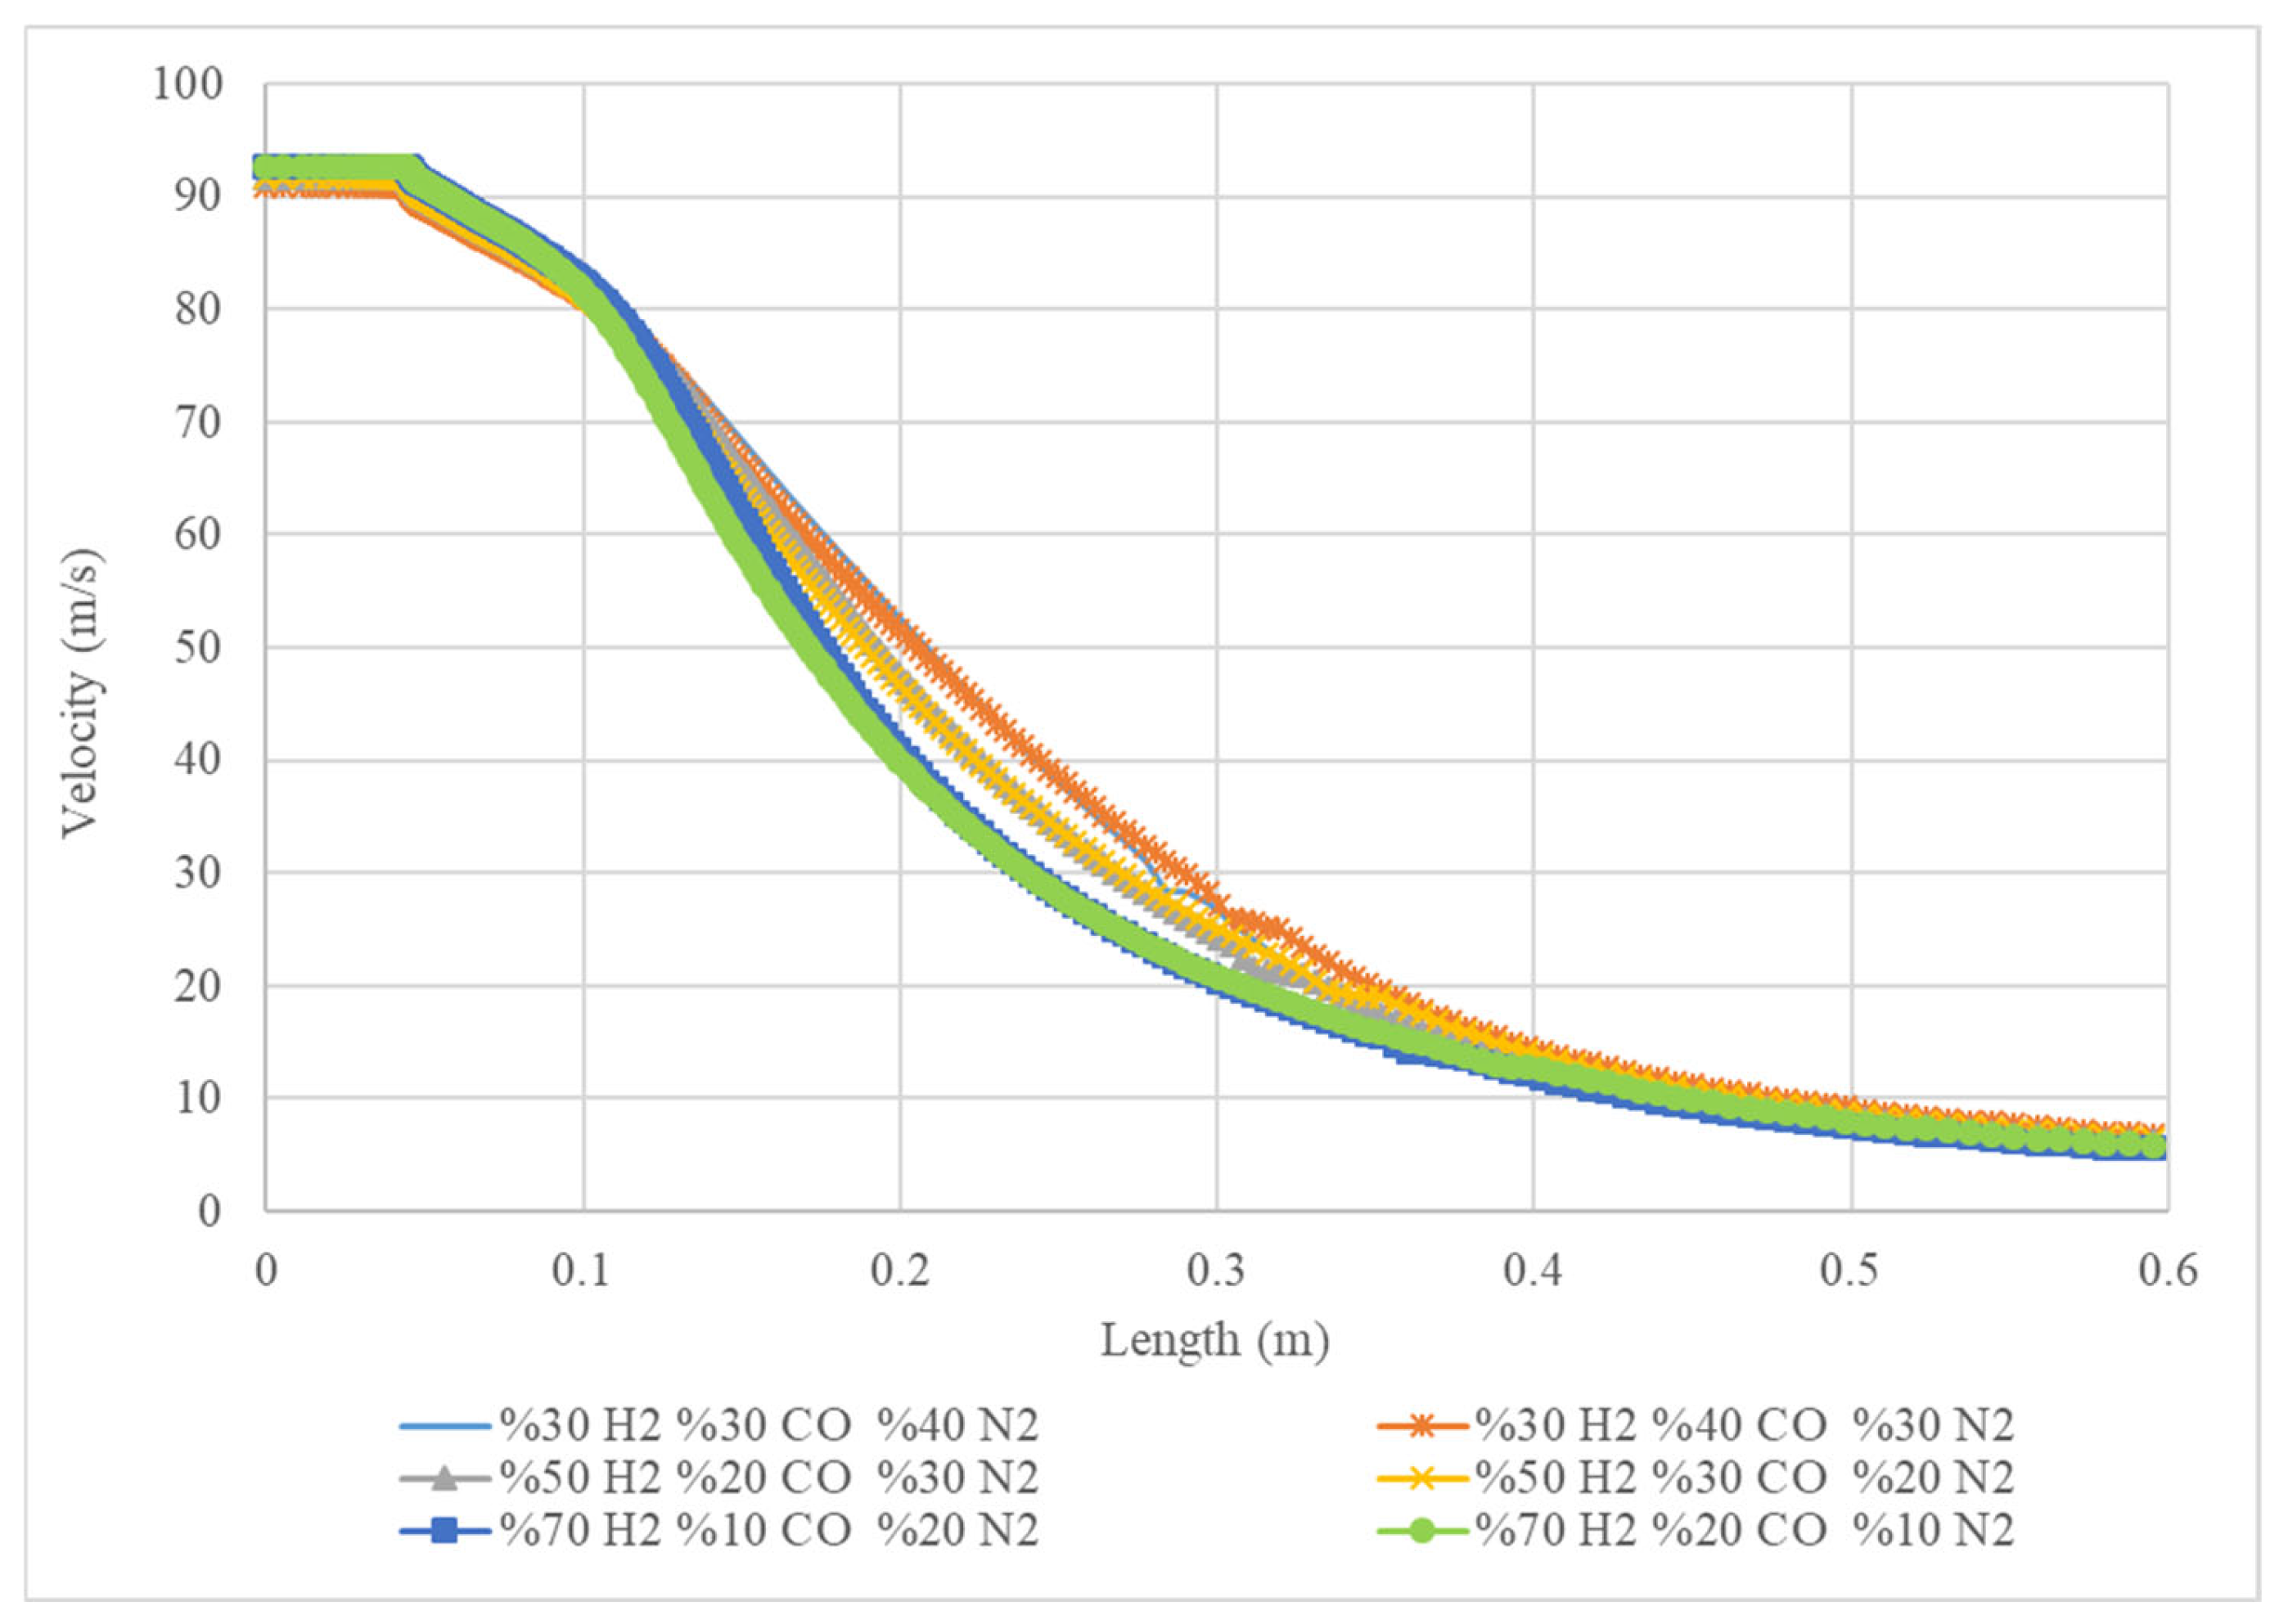
Figure 6 shows the velocity of a gas mixture as it travels along a certain length. The x-axis represents the length in metres, and the y-axis represents the velocity in metres per second (m/s). Each line on the graph represents a different gas mixture, with the percentages of hydrogen (H2), carbon monoxide (CO), and nitrogen (N2) given in the legend. The graph shows that the velocity decreases as the gas travels along the length, with the rate of decrease varying depending on the gas composition. The mixture with the highest initial velocity is the one with 70% H2, 10% CO, and 20% N2 (blue line), but it also decreases the fastest. The mixture with the lowest initial velocity is the one with 30% H2, 30% CO, and 40% N2 (light blue line), but it decreases at a slower rate. An increase in the hydrogen concentration leads to a higher combustion rate and an elevated maximum temperature. The concentration of hydrogen in syngas plays a crucial role in influencing the combustion rate. The mechanism of the chemical reaction that takes place during the simulation of an elevated jet flame, which is a result of hydrogen combustion, and leads to an increase in temperature.
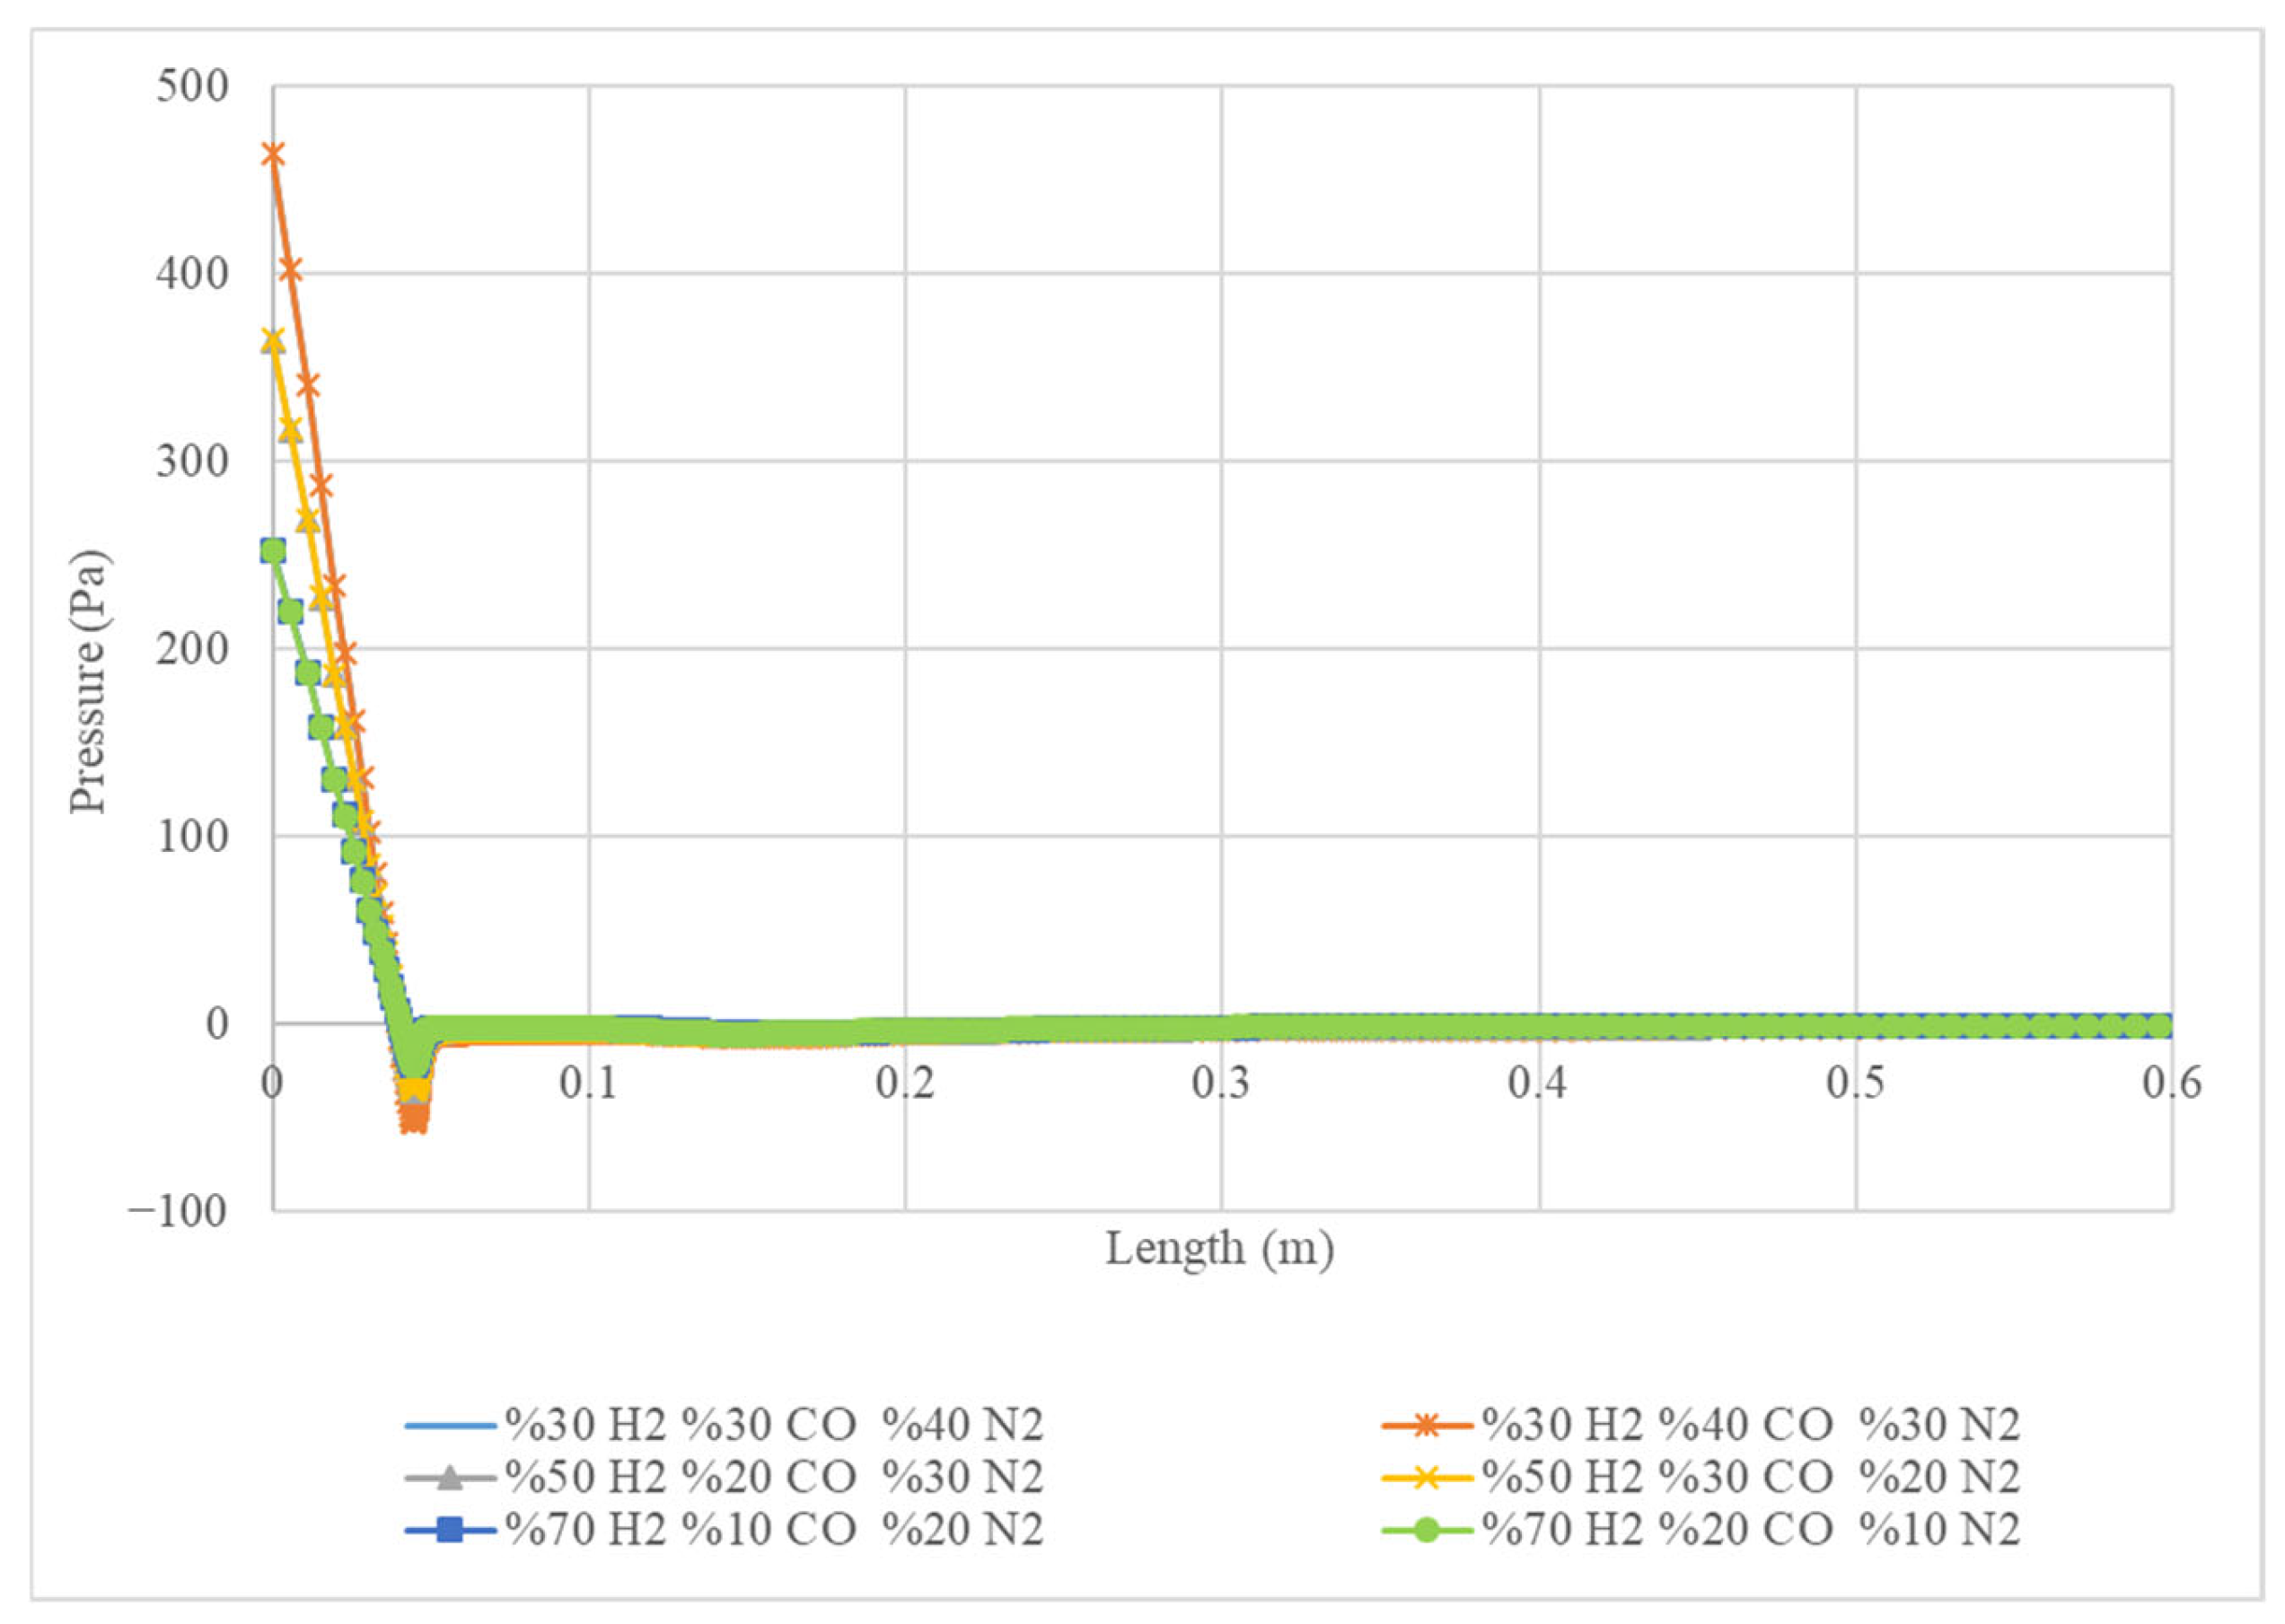
Figure 7 displays the pressure of four different gas mixtures as they flow along a specified length. The x-axis represents the length in metres, and the y-axis represents the pressure in Pascals (Pa). Each line represents a different gas mixture, with the percentages of hydrogen (H2), carbon monoxide (CO), and nitrogen (N2) indicated in the legend. The graph shows that the pressure drops significantly along the length of all mixtures, indicating that the gases are expanding as they flow. The initial pressure is highest for the mixture with 30% H2, 40% CO, and 30% N2 (orange line) and decreases the fastest. The pressure drop is less significant for the mixture with 70% H2, 20% CO, and 10% N2 (green line), indicating a slower expansion rate. The graph suggests that the gas composition affects the pressure drop rate, with mixtures containing higher percentages of hydrogen exhibiting a faster pressure drop.
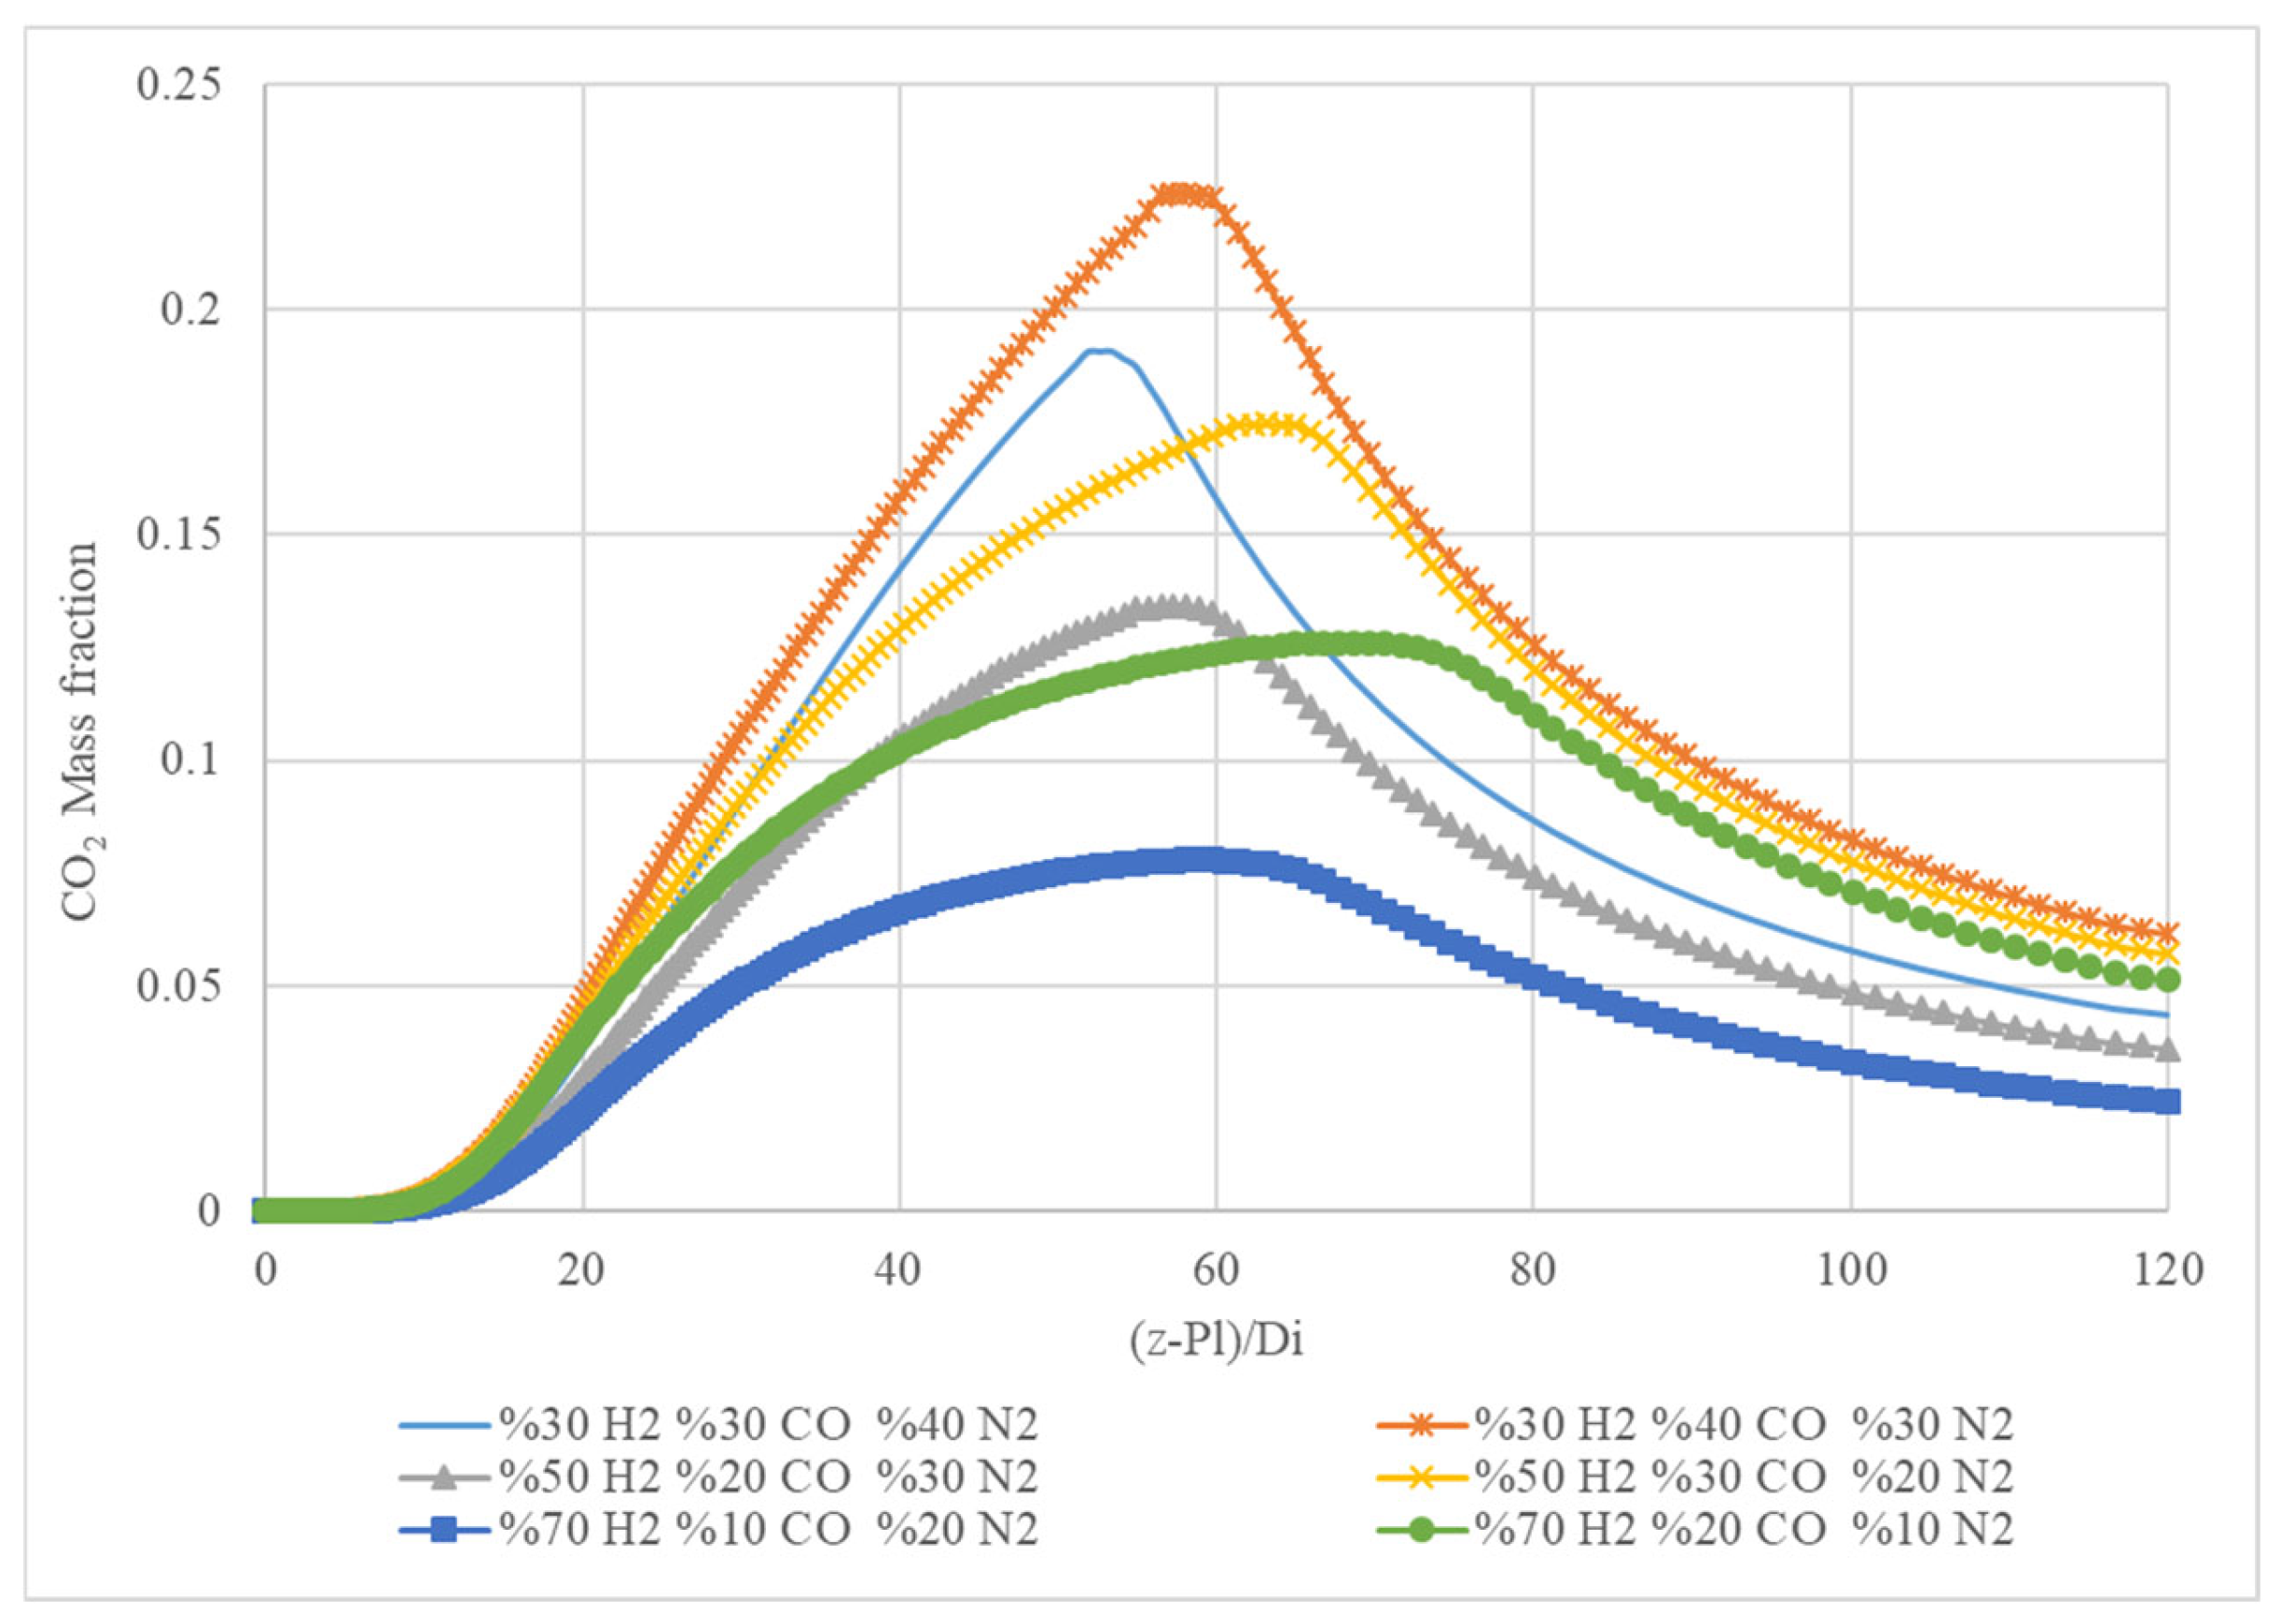
Figure 8 presents the mass fraction of carbon dioxide (CO2) in a gas mixture as a function of the position along a specified length. The x-axis represents the position along the length in non-dimensional form, (z-Pl)/Di, where ‘z’ is the position, ‘Pl’ is the position of the inlet, and ‘Di’ is the diameter of the chamber. The y-axis represents the mass fraction of CO2. The graph shows five different curves, each representing a different gas mixture. Each mixture consists of different percentages of hydrogen (H2), carbon monoxide (CO), and nitrogen (N2). All curves display a similar trend, showing an increase in the CO2 mass fraction with increasing position, reaching a peak, and then decreasing. The peak values and the positions where the peaks occur vary based on the gas composition. This graph suggests that the gas composition significantly impacts the CO2 formation and distribution along the length of the chamber. The mixtures with higher hydrogen content generally exhibit lower peak CO2 values and shift the peak further down the length.
Figure 9 provides a graph showing the H2O mass fraction along the axial position normalized by the inlet diameter (z−PI)/Di for different gas mixtures. The legend indicates the composition of each gas mixture, and the graph displays how the water vapour (H2O) mass fraction evolves along the reactor’s length for these mixtures.
All the mixtures start with a low H2O mass fraction near zero at the beginning of the reactor. As the reaction progresses (moving right along the x-axis), the H2O mass fraction increases. Each mixture reaches a peak H2O mass fraction at different positions along the reactor. Mixtures with higher hydrogen content (70% H2) tend to have higher peak H2O mass fractions. For example, the green and blue dotted lines reach the highest peaks. Mixtures with higher nitrogen content tend to have lower peaks. The mixture with 30% H2, 30% CO, and 40% N2 (blue line) shows a lower peak compared to mixtures with less nitrogen. After reaching the peak, the H2O mass fraction decreases for all mixtures. The rate of decrease varies among the mixtures. Mixtures with higher H2 content show a more gradual decline compared to those with lower H2 content. Mixtures with 70% H2 (green and blue dotted lines) show the highest H2O mass fractions, indicating more efficient water production. Mixtures with 50% H2 (yellow and grey lines) show moderate peaks, demonstrating that intermediate H2 levels produce less water compared to higher H2 levels. Mixtures with 30% H2 (blue and orange lines) have the lowest H2O mass fractions, indicating less water production efficiency.
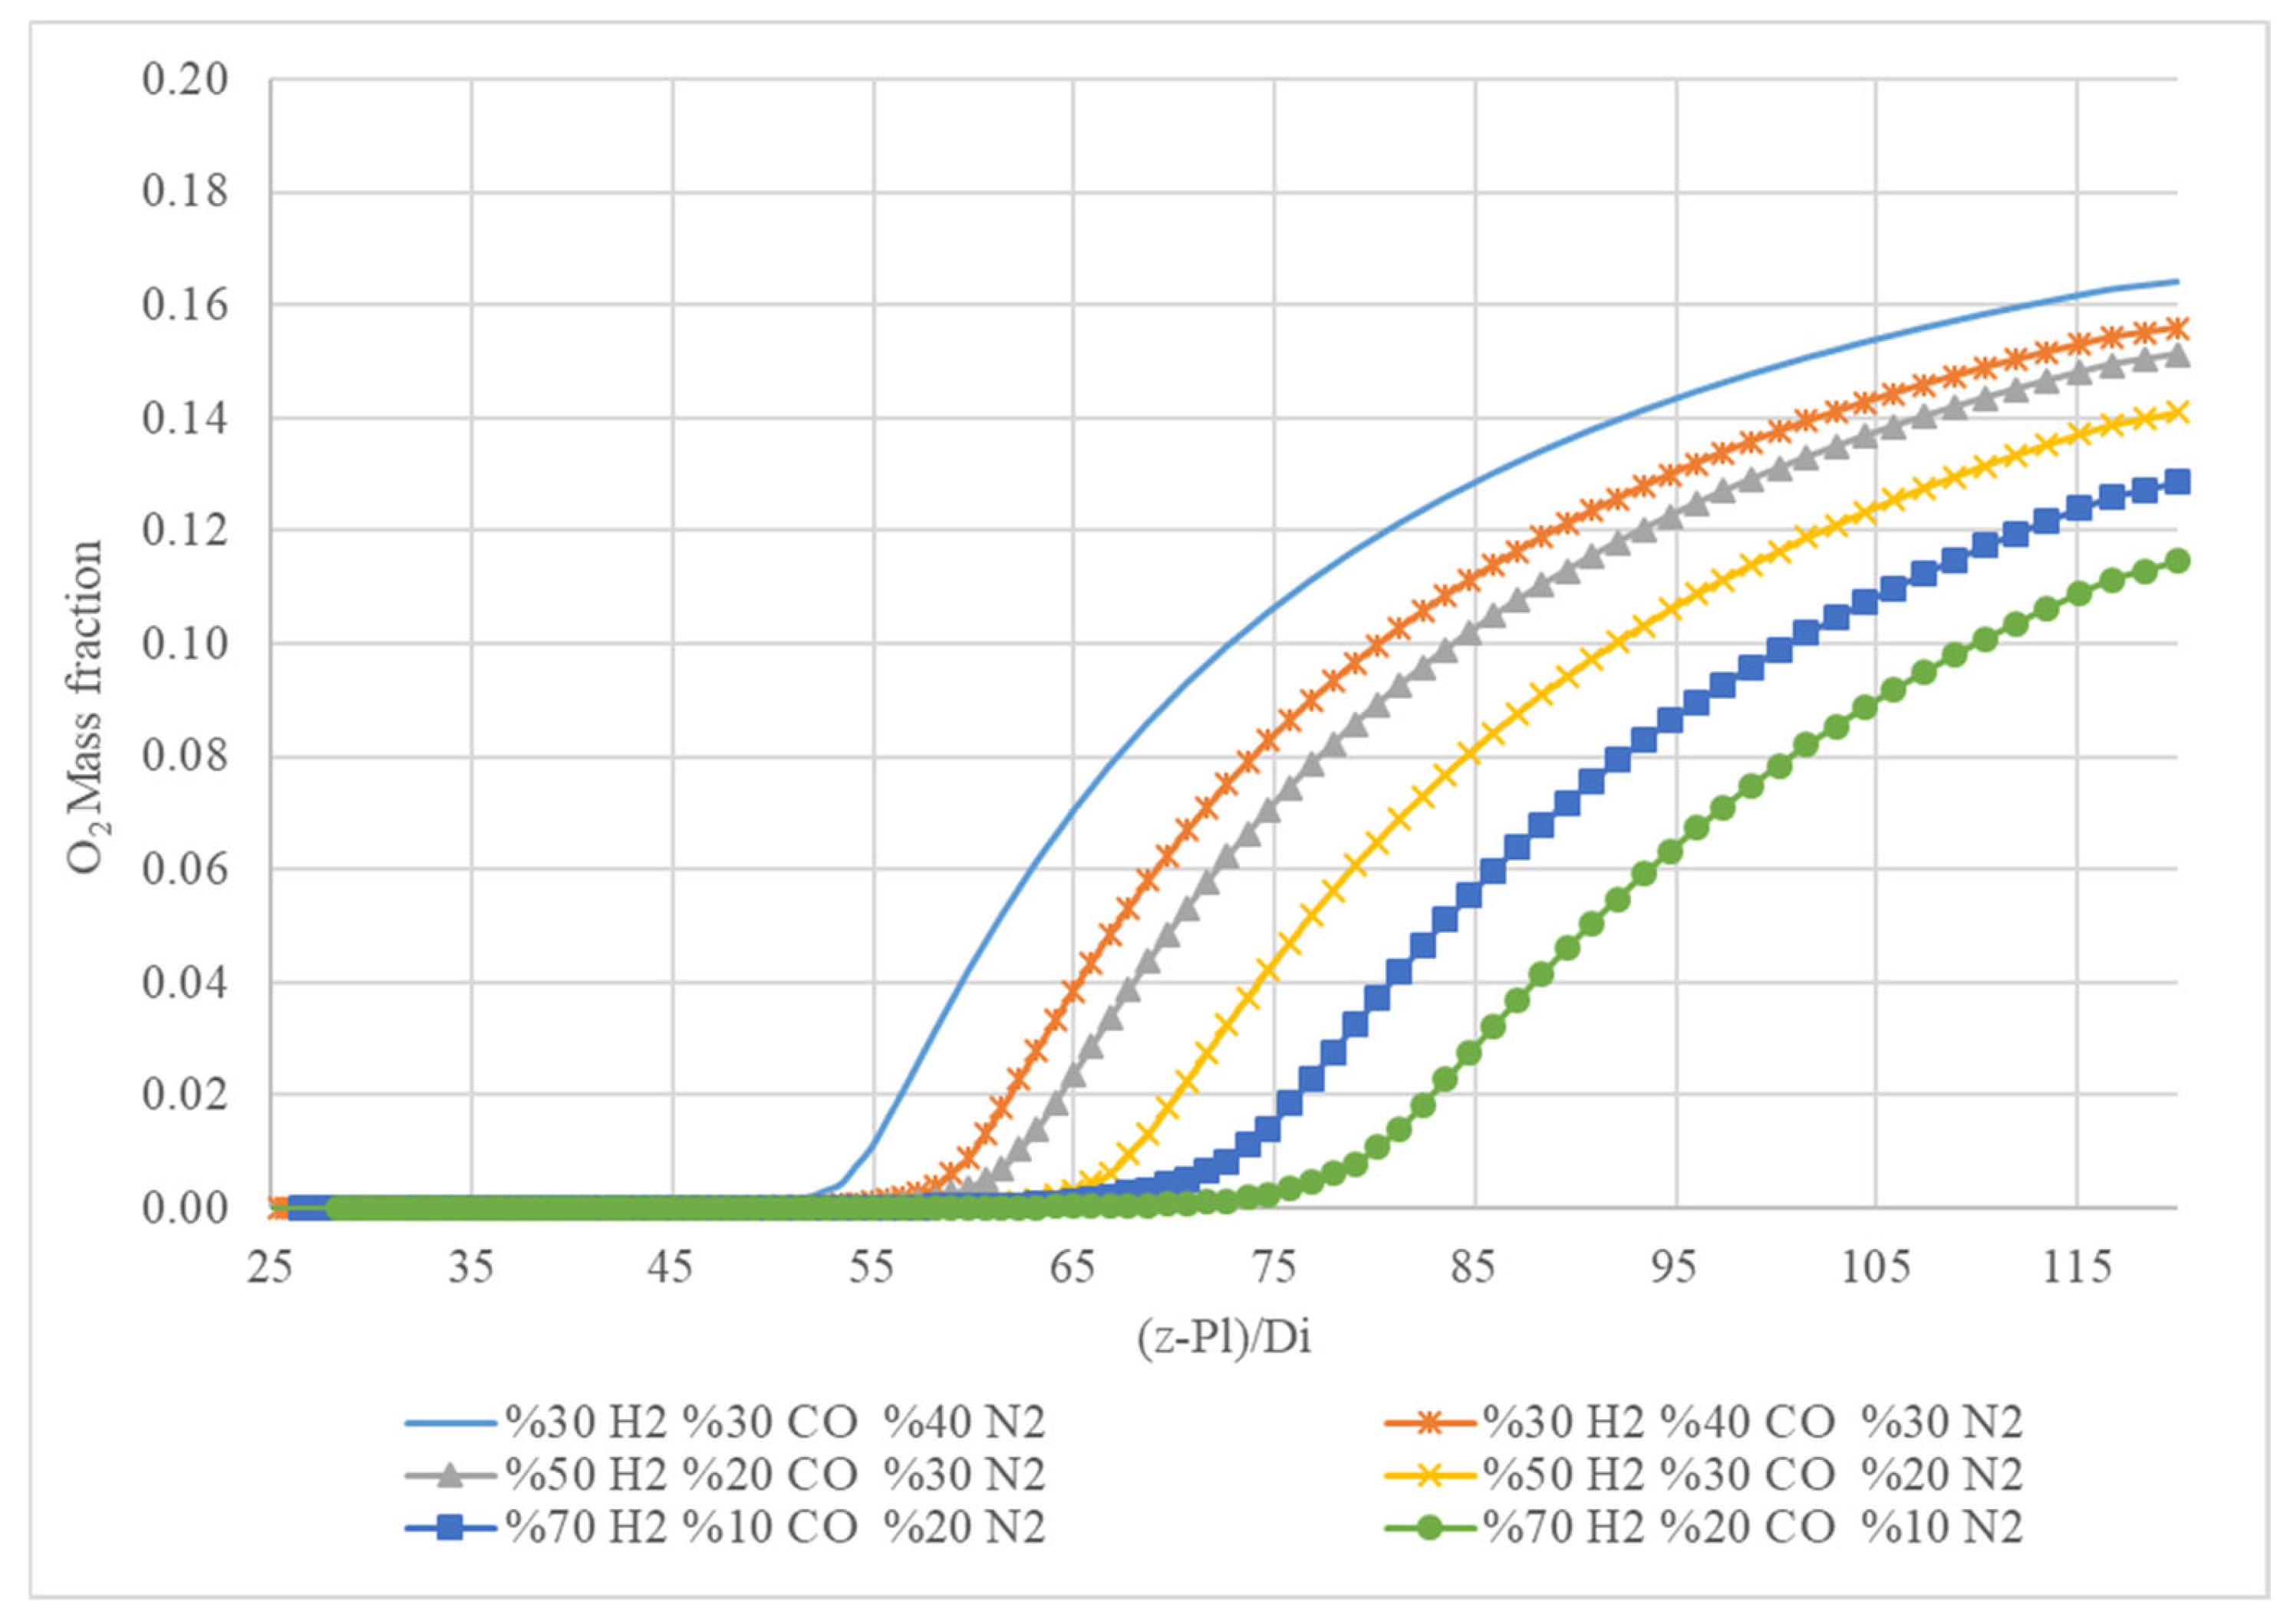
Figure 10 shows a graph of the O2 mass fraction along the axial position normalized by the inlet diameter (z−PI)/Di for different gas mixtures. The legend indicates the composition of each gas mixture, and the graph displays how the oxygen (O2) mass fraction evolves along the reactor’s length for these mixtures.
All mixtures start with a very low O2 mass fraction near zero at the beginning of the reactor. As the reaction progresses (moving right along the x-axis), the O2 mass fraction increases for all mixtures. The increase starts after a certain point along the axial length, indicating the onset of oxygen consumption reactions. Mixtures with lower hydrogen content (30% H2, blue and orange lines) reach higher O2 mass fractions compared to those with higher hydrogen content. Mixtures with higher hydrogen content (70% H2, green and blue squares) reach lower O2 mass fractions, indicating more efficient consumption of oxygen in the presence of higher hydrogen levels. The mixture with 70% H2 and 20% CO (green line) shows the lowest final O2 mass fraction, suggesting the most efficient consumption of oxygen. Mixtures with 50% H2 (yellow and grey lines) show intermediate O2 mass fractions. Mixtures with 30% H2 (blue and orange lines) reach the highest O2 mass fractions, indicating less efficient consumption of oxygen compared to mixtures with higher hydrogen content.
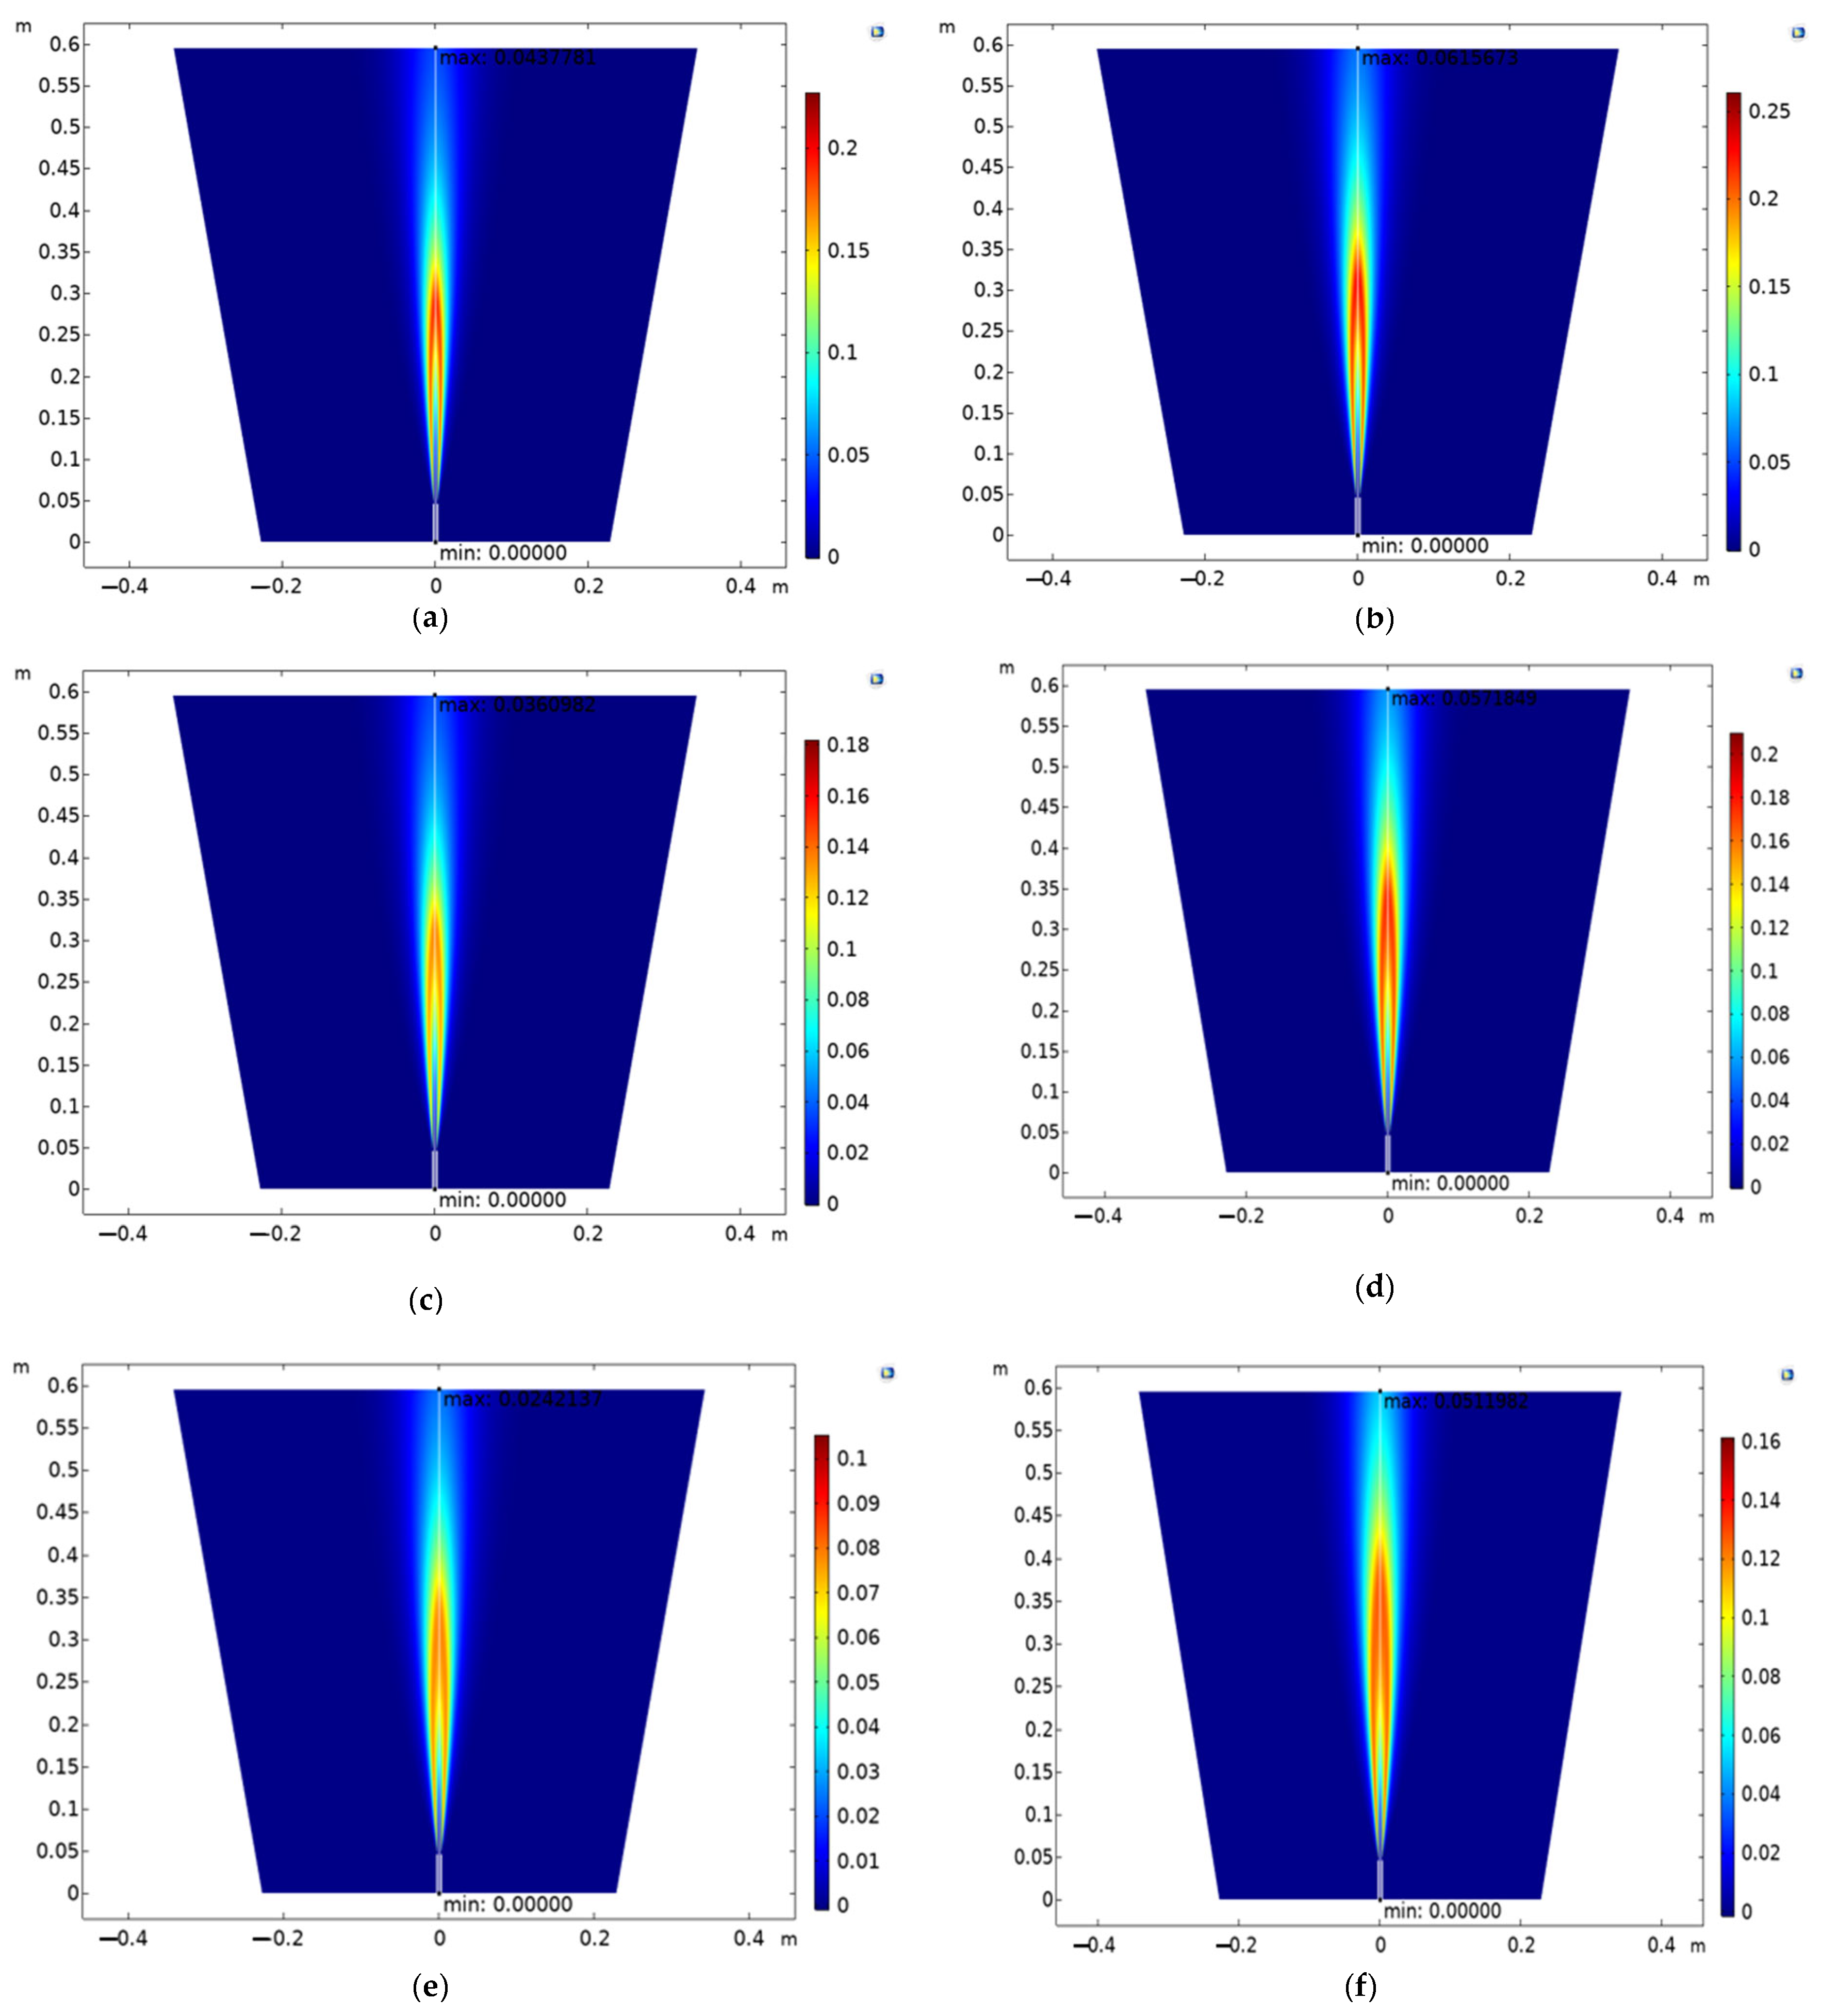
The colour bar (Figure 11) next to each subplot represents the concentration of CO2. The scale ranges from 0 (blue) to the maximum concentration (red) shown in the colour bar. The plots illustrate the vertical spatial distribution of CO2 concentration in the simulation domain. The x-axis represents the horizontal distance (m) and the y-axis represents the vertical distance (m). Areas with red or warmer colours indicate higher concentrations of CO2. Areas with blue or cooler colours indicate lower concentrations of CO2. Figure 11a shows a balanced mixture of H2 and CO, with a higher concentration of N2, leading to a specific CO2 distribution. Figure 11b increases the CO percentage while decreasing N2, which alters the CO2 concentration pattern. Figure 11c,d have higher H2 percentages, impacting the combustion process and CO2 formation. Figure 11e,f have the highest H2 concentrations, significantly affecting CO2 emissions due to the reduced CO and N2 components.
The colour bar (Figure 12) next to each subplot represents the concentration of O2. The scale ranges from 0 (blue) to the maximum concentration (red) shown in the colour bar. The plots illustrate the vertical spatial distribution of O2 concentration in the simulation domain. The x-axis represents the horizontal distance (m), and the y-axis represents the vertical distance (m). Areas with red or warmer colours indicate higher concentrations of O2. Areas with blue or cooler colours indicate lower concentrations of O2. Figure 12a shows a balanced mixture of H2 and CO, with a higher concentration of N2, leading to a specific O2 distribution. Figure 12b increases the CO percentage while decreasing N2, which alters the O2 concentration pattern. Figure 12c,d have higher H2 percentages, impacting the combustion process and O2 consumption. Figure 12e,f have the highest H2 concentrations, significantly affecting the O2 distribution due to the reduced CO and N2 components.
The colour bar (Figure 13) next to each subplot represents the concentration of H2O. The scale ranges from 0 (blue) to the maximum concentration (red) shown in the colour bar. The plots illustrate the vertical spatial distribution of H2O concentration in the simulation domain. The x-axis represents the horizontal distance (m), and the y-axis represents the vertical distance (m). Areas with red or warmer colours indicate higher concentrations of H2O. Areas with blue or cooler colours indicate lower concentrations of H2O. Figure 13a shows a balanced mixture of H2 and CO, with a higher concentration of N2, leading to a specific H2O distribution. Figure 13b increases the CO percentage while decreasing N2, which alters the H2O concentration pattern. Figure 13c,d have higher H2 percentages, impacting the combustion process and H2O formation. Figure 13e,f have the highest H2 concentrations, significantly affecting the H2O distribution due to the reduced CO and N2 components.
These subplots help in understanding how varying the gas mixture composition influences the resultant H2O concentrations, which is crucial for optimizing combustion processes and understanding the water vapour emissions from different fuel mixtures.
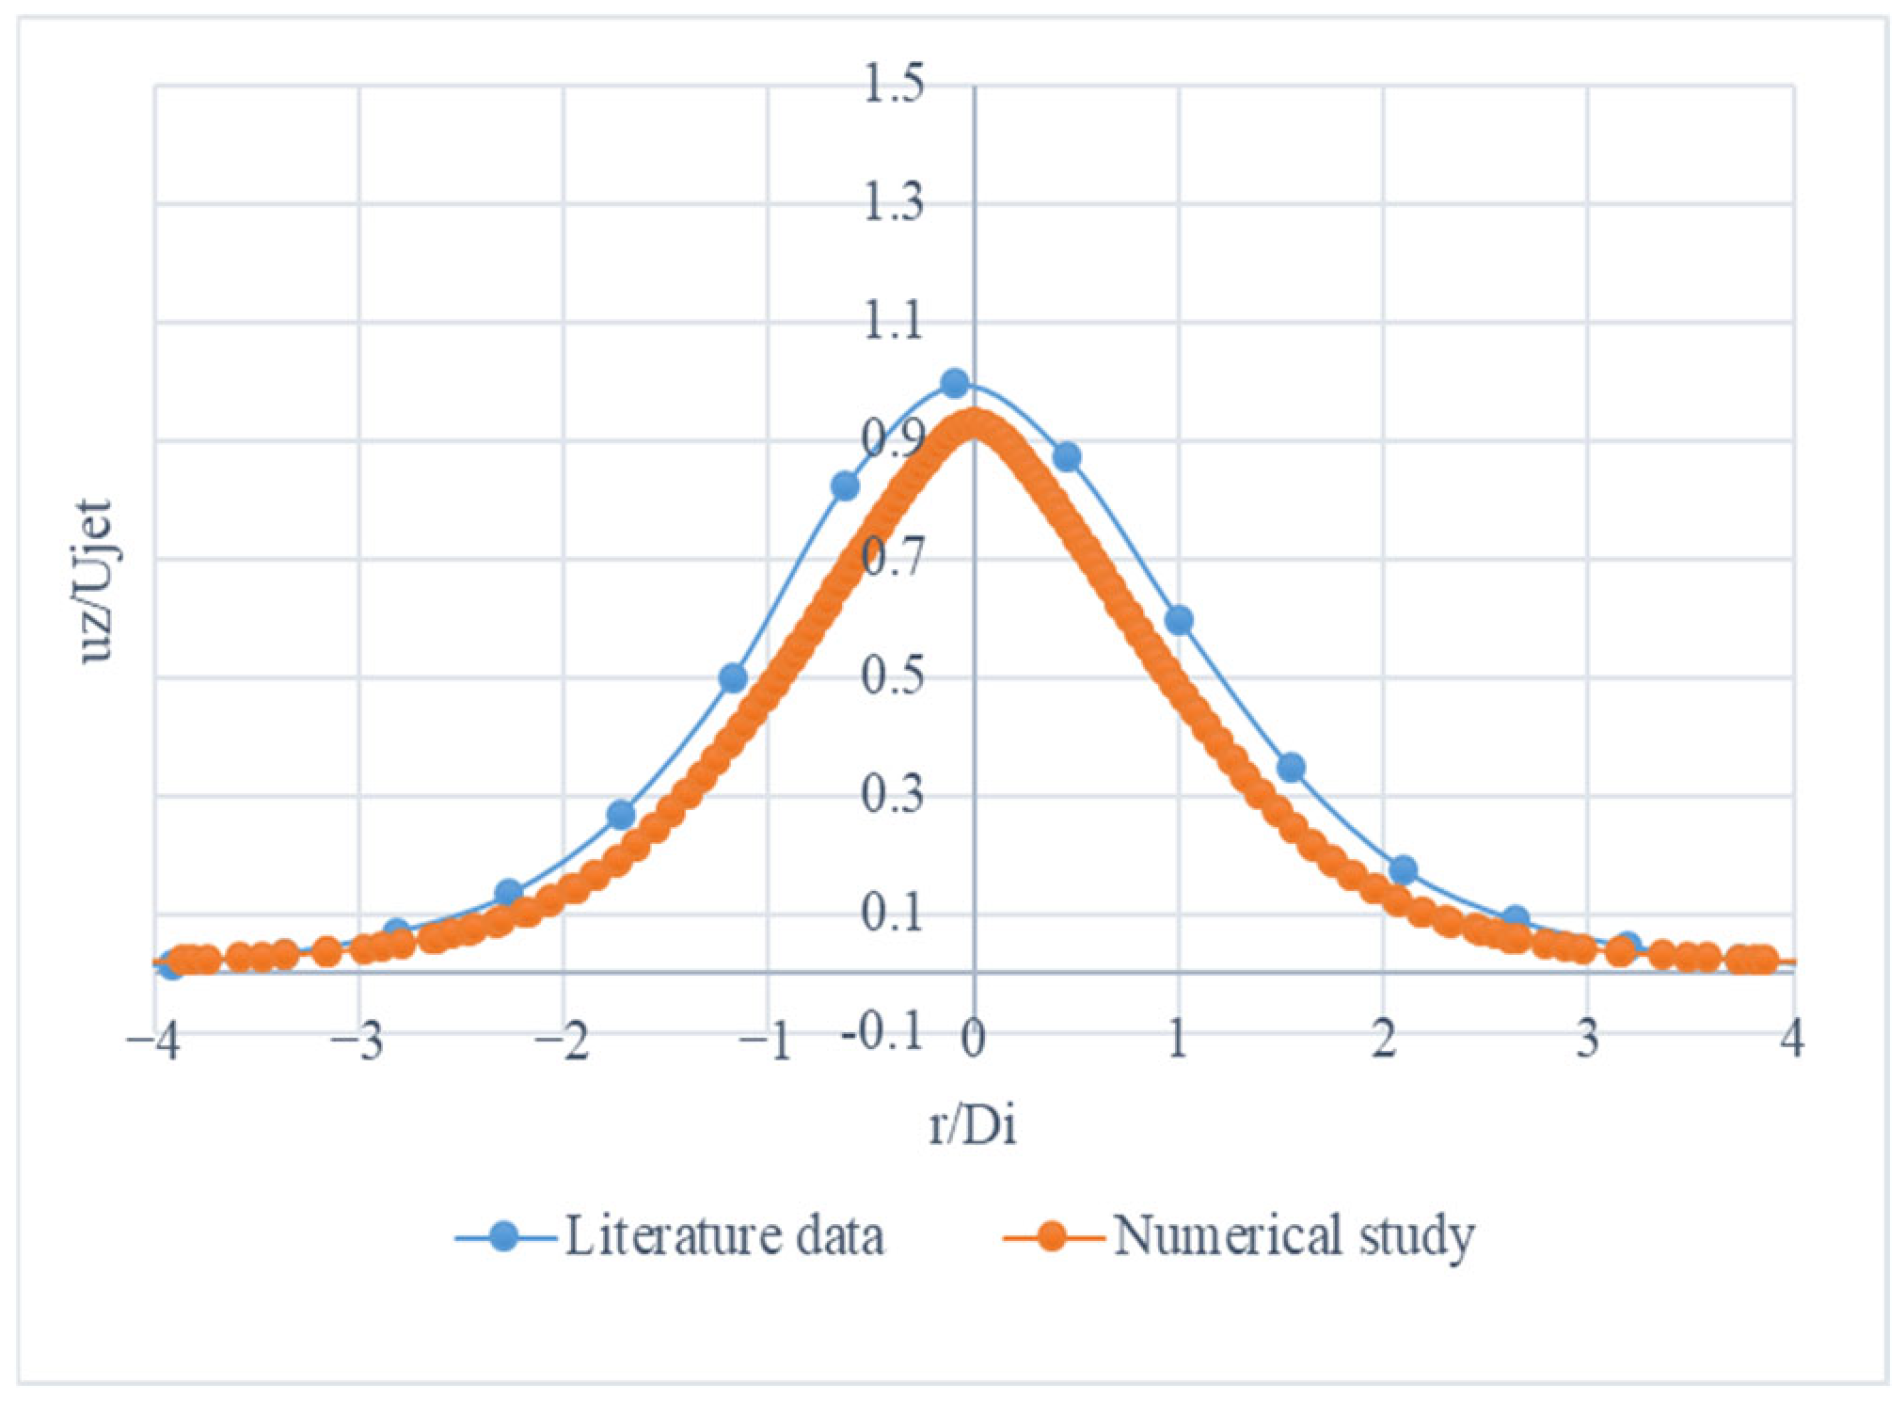
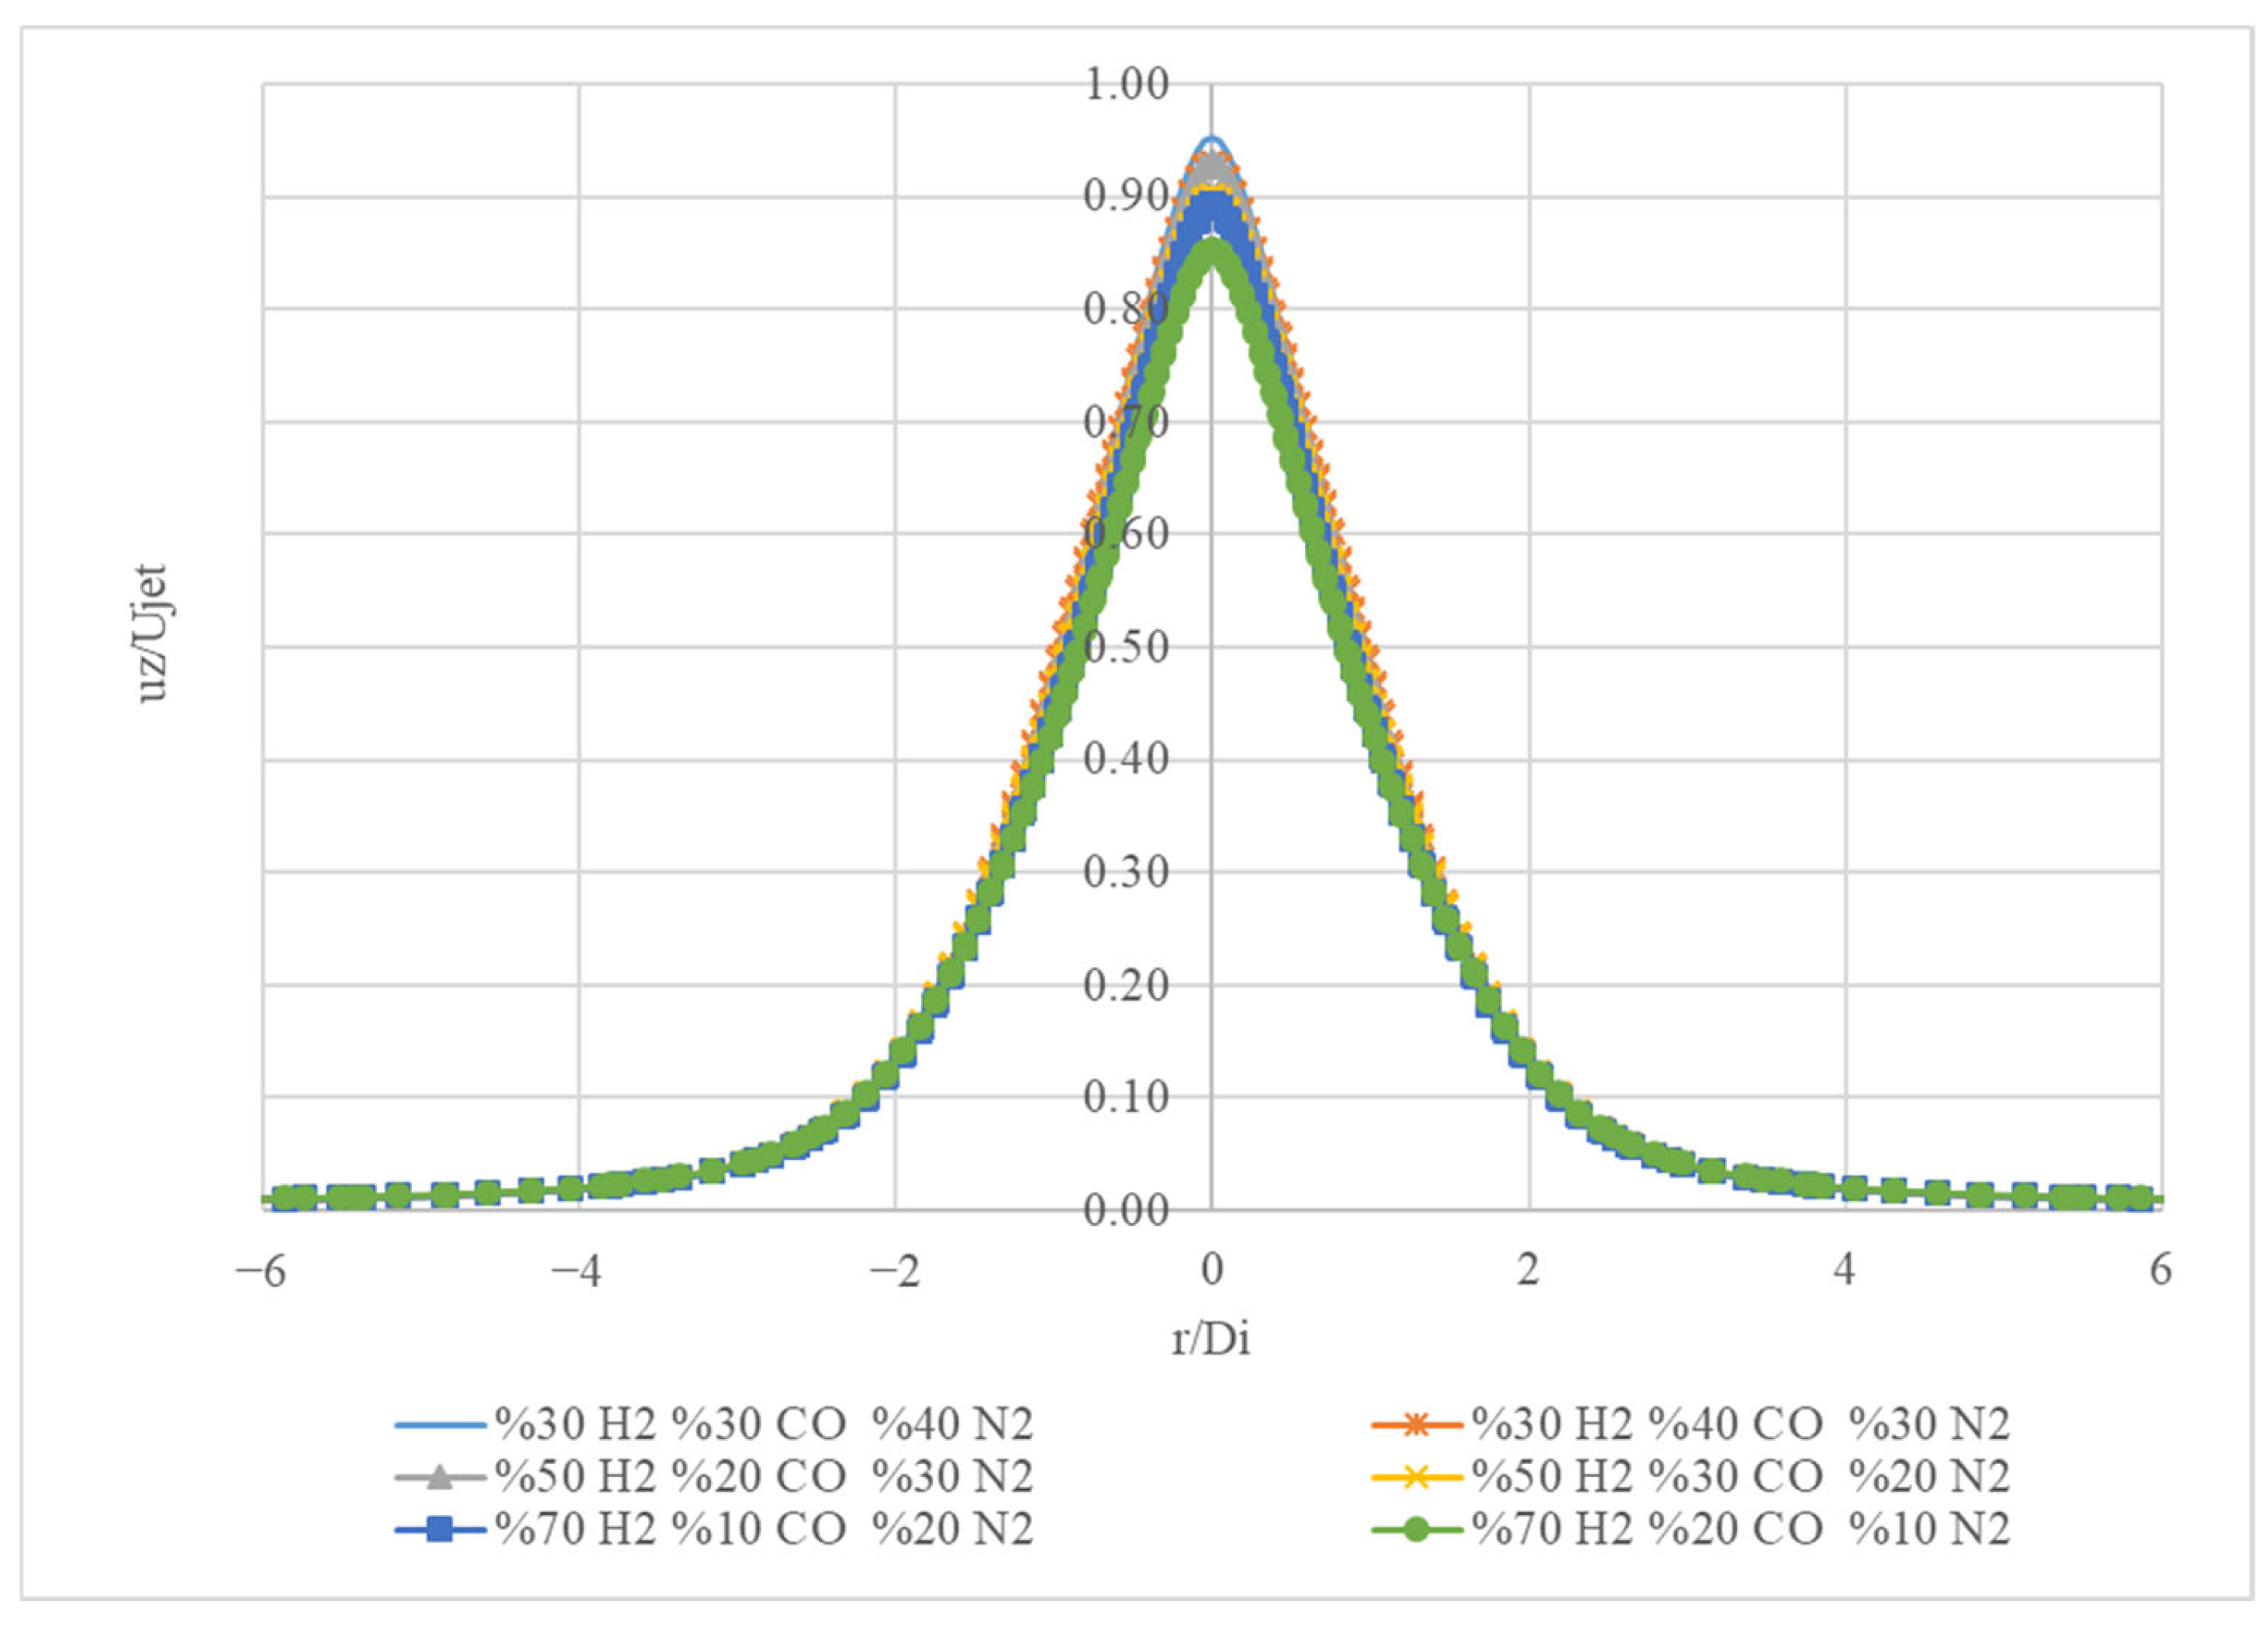
Figure 14 appears to be a graph depicting the relationship between the ratio r/Di (the ratio of the distance from the centre to the distance from the edge) and the normalized intensity or reflectivity (uz/ujet) for different gas mixtures.
The curves exhibit a characteristic peak shape, indicating that the reflectivity or intensity reaches a maximum at a certain ratio of r/Di. This type of graph is commonly used in optical or spectroscopic analysis to understand the behaviour of different gas mixtures under various conditions.
Figure 14 provides a visual representation of how the normalized intensity or reflectivity changes as the ratio r/Di is varied for different gas mixture compositions. This information can be useful in applications such as gas sensing, combustion analysis, or other processes where the optical properties of gas mixtures are important.
Figure 14 presents the normalized axial velocity (uz/Ujet) profiles for different gas mixtures as a function of the radial position (r/Di).
The mixture (30% H2, 30% CO, 40% N2) exhibits a peak normalized axial velocity of approximately 0.95 at r/Di = 0. It shows a symmetrical profile, decreasing to a normalized velocity of 0.1 at r/Di values near −3 and 3. The mixture (50% H2, 20% CO, 30% N2) reaches a peak normalized axial velocity of around 0.90 at r/Di = 0. It also shows a symmetrical profile, declining to a normalized velocity of 0.1 at r/Di values close to −3 and 3. The mixture (70% H2, 10% CO, 20% N2) has a peak normalized axial velocity of about 0.85 at r/Di = 0. It exhibits a symmetrical shape similar to the other curves, falling to a normalized velocity of 0.1 at r/Di values near −3 and 3. The mixture (30% H2, 40% CO, 30% N2) has a peak normalized axial velocity of approximately 0.90 at r/Di = 0. It displays a symmetrical profile, diminishing to a normalized velocity of 0.1 at r/Di values near −3 and 3. The mixture (50% H2, 30% CO, 20% N2) has a peak normalized axial velocity of approximately 0.85 at r/Di = 0. It exhibits a symmetrical profile, decreasing to a normalized velocity of 0.1 at r/Di values near −3 and 3. The mixture (70% H2, 20% CO, 10% N2) has a peak normalized axial velocity of approximately 0.80 at r/Di = 0. It displays a symmetrical profile, decreasing to a normalized velocity of 0.1 at r/Di values near −3 and 3.
The gas mixtures with the highest peak normalized axial velocities are 30% H2, 30% CO, and 40% N2, and 30% H2, 40% CO, and 30% N2, with both reaching approximately 0.95 and 0.90, respectively. All the gas mixtures show a symmetrical profile, with the peak velocity occurring at r/Di = 0. This indicates that the velocity distribution is symmetrical around the centre. As the proportion of H2 increases and the proportion of CO decreases, the peak normalized axial velocity tends to decrease. This trend is consistent across all the mixtures.
Figure 14 shows the normalized axial velocity profiles of different gas mixtures. It highlights how the composition of the gas mixture can affect the peak velocity and overall velocity distribution. Mixtures with higher CO ratios tend to have higher peak velocities. Additionally, the velocity distribution for all gas mixtures is symmetrical around the centre.
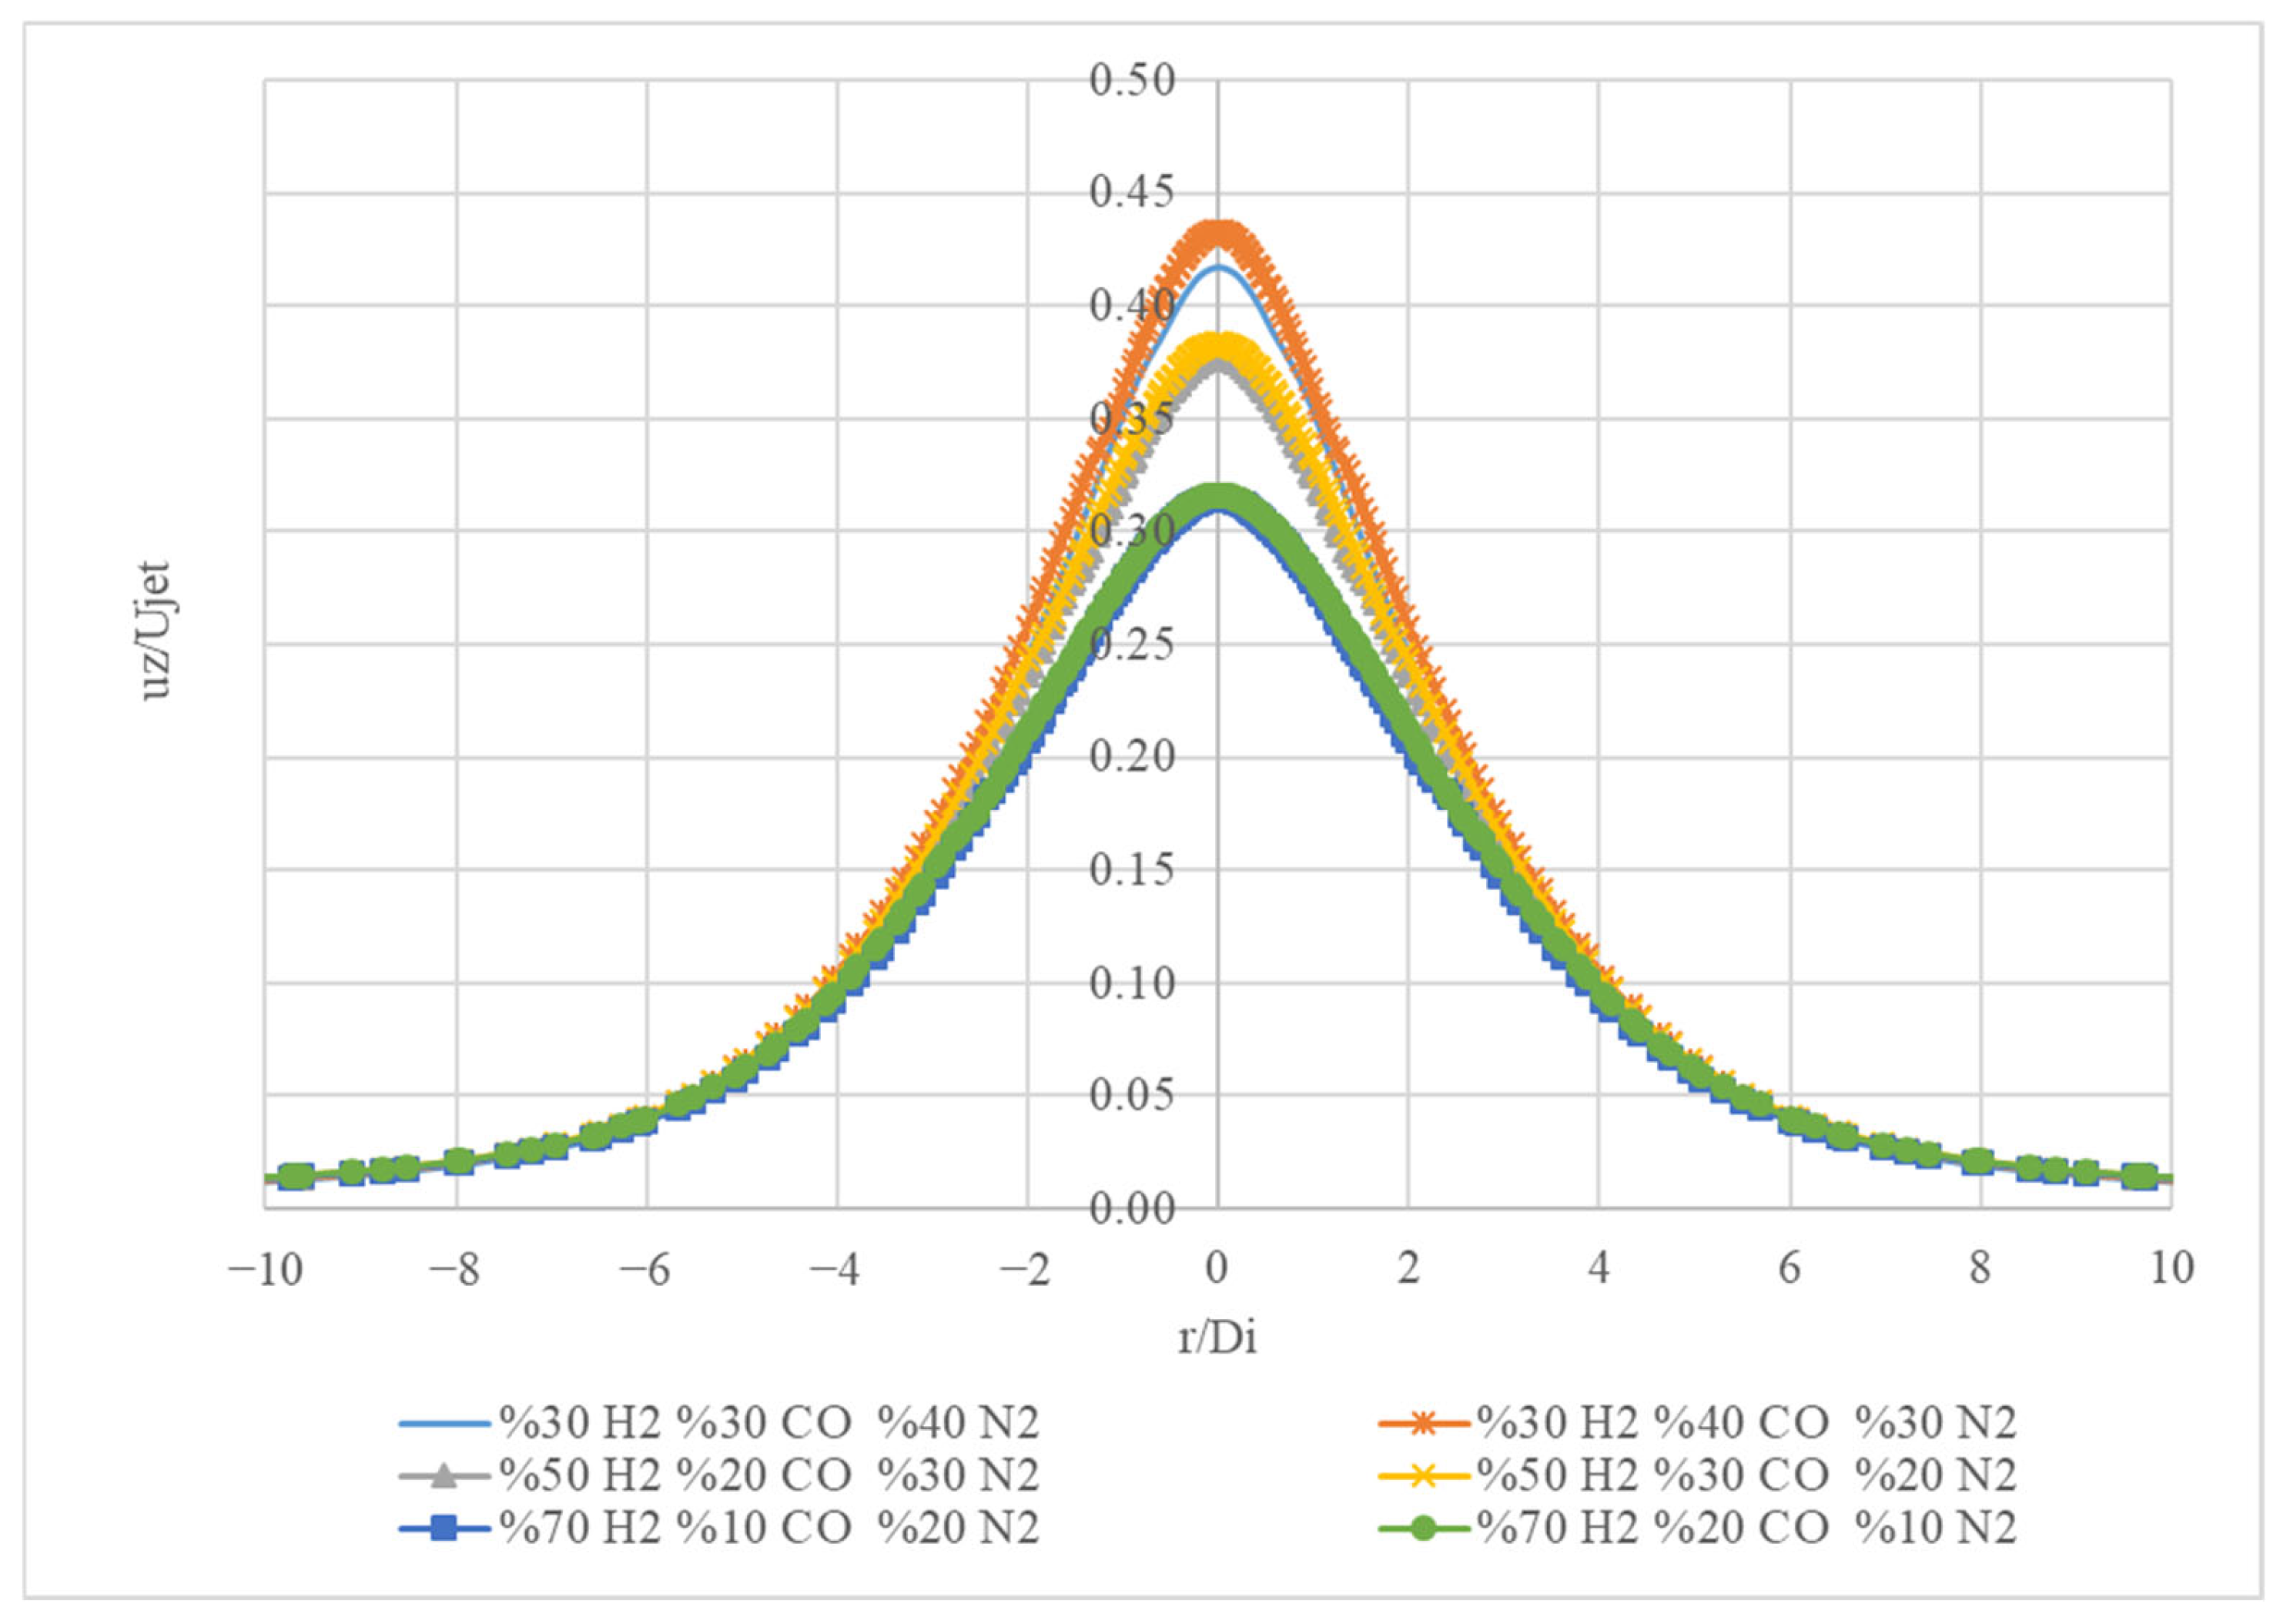
Figure 15 shows a graph with four different curves, each representing the normalized intensity of a specific gas mixture. The x-axis represents the ratio of the distance from the centre (r) to the distance from the edge (Di). The y-axis represents the normalized intensity or reflectivity (uz/Ujet).
The curves all exhibit a bell-shaped curve, reaching a peak at a specific value of r/Di. This indicates that the intensity reaches a maximum at a certain point within the gas mixture. This type of graph is commonly used in optical or spectroscopic analysis to understand the behaviour of different gas mixtures under various conditions.
Figure 15 shows the normalized intensity (uz/Ujet) of four different gas mixtures as a function of the ratio of the distance from the centre to the distance from the edge (r/Di).
The mixture (30% H2, 30% CO, 40% N2) reaches a peak intensity of approximately 0.42 at a r/Di of around 0.5. The mixture (50% H2, 20% CO, 30% N2) has a peak intensity of around 0.38 at a r/Di of about 0.5. The mixture (70% H2, 10% CO, 20% N2) shows a peak intensity of approximately 0.33 at a r/Di of roughly 0.5. The mixture (30% H2, 40% CO, 30% N2) has a peak intensity of approximately 0.44 at a r/Di of around 0.5.
The gas mixture with the highest peak intensity is 30% H2, 40% CO, and 30% N2, reaching a maximum of 0.44. This indicates that this mixture has the highest reflectivity or intensity at a certain point within the gas mixture. As the proportion of H2 increases and the proportion of CO decreases, the peak intensity decreases. The peak intensity of each mixture occurs at roughly the same r/Di value, indicating that the position of maximum intensity is similar for these different gas mixtures.
Overall, the graph demonstrates how the composition of the gas mixture affects its normalized intensity. It shows that different gas mixtures exhibit distinct intensity profiles, with variations in peak intensity and the shape of the curve.
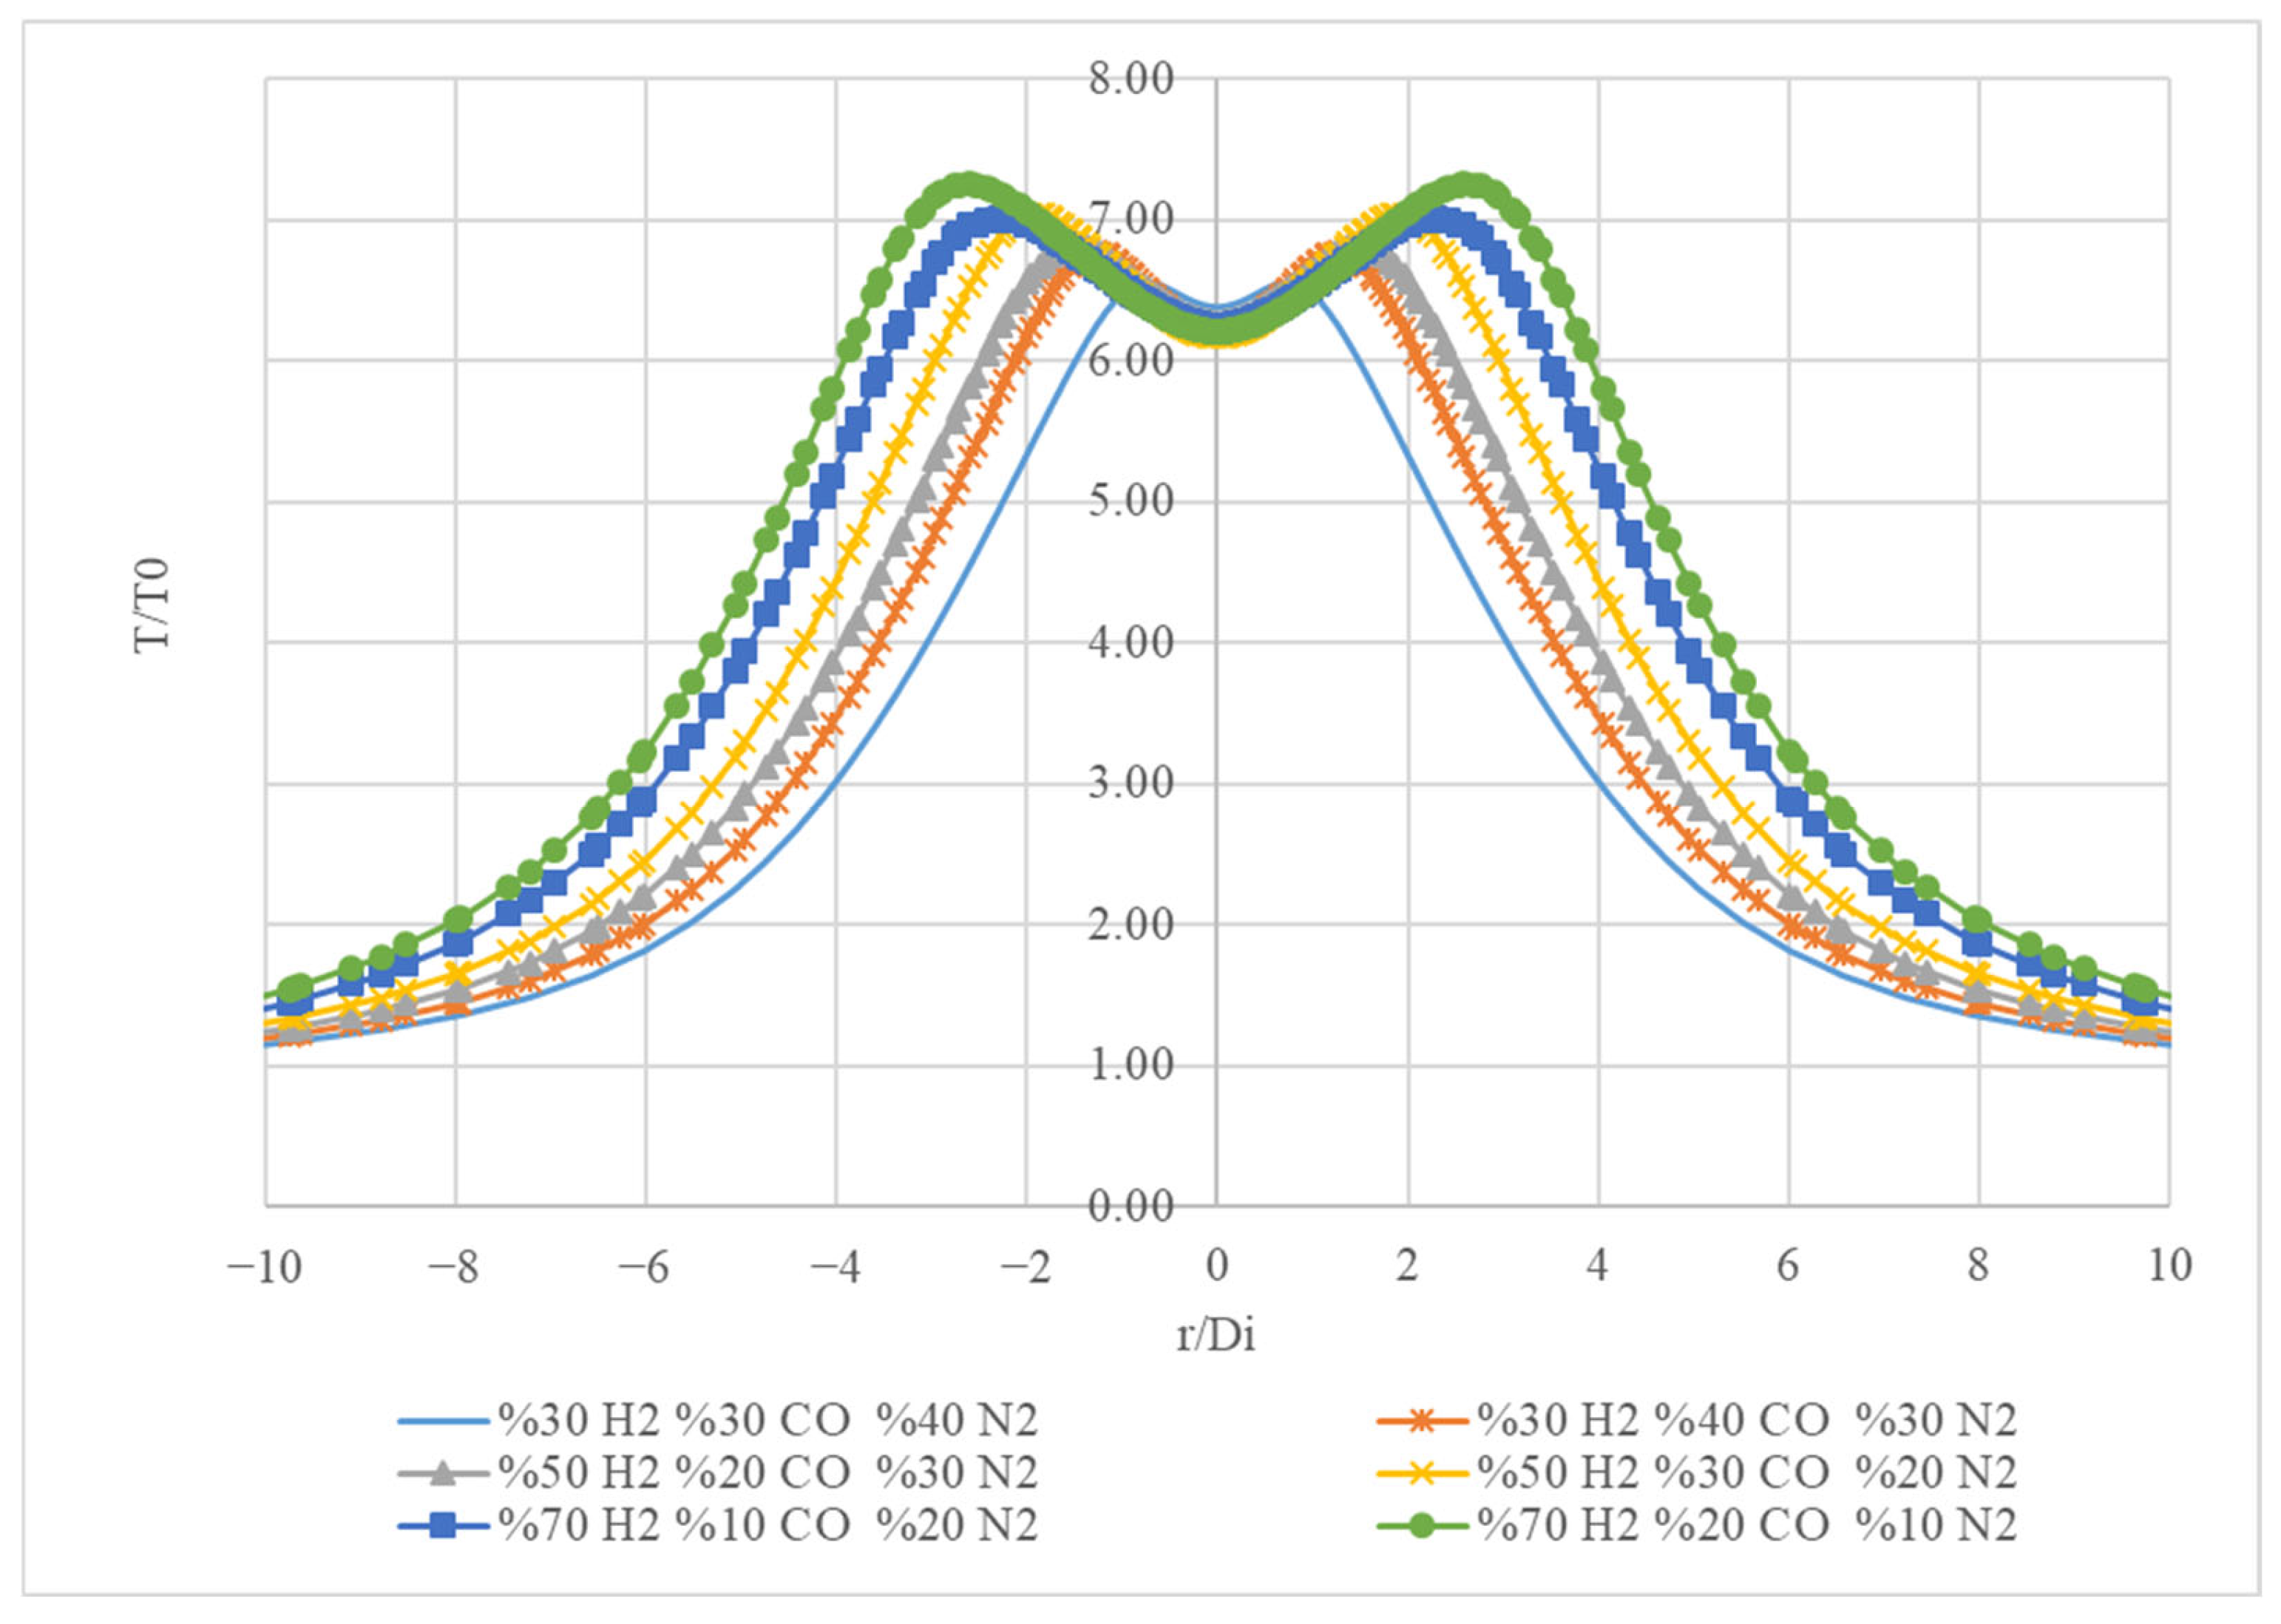
Figure 16 presents temperature profiles (T/T0) as a function of the radial distance (r/Di) for three different gas compositions. On the x-axis (r/Di), the radial distance is plotted from −6 to 6, indicating the distance from the centre of the system. On the y-axis (T/T0), the temperature is normalized to a reference temperature (T0), ranging from 0 to 8.
For the mixture (30% H2, 30% CO, 40% N2), the blue curve shows the highest peak temperature, reaching approximately 6.54 at r/Di = −0.8 The temperature decreases symmetrically as you move away from the centre, indicating a strong thermal gradient. For the mixture 50% H2, 20% CO, and 30% N2 (orange curve) the peak temperature is slightly lower, around 6.6. The shape of the curve is similar to the blue curve but with a reduced peak, indicating that increasing the hydrogen concentration affects the thermal profile. For the mixture of 70% H2, 10% CO, and 20% N2 (green curve) the curve has the highest peak temperature of approximately 7.24.
Figure 17 illustrates how varying the composition of gases affects the temperature profile in a radial system. The decreasing peak temperatures with increasing hydrogen concentration suggest that the thermal properties of the gas mixture are significantly influenced by its composition. This information is crucial for applications in thermodynamics, combustion processes, and chemical engineering, where understanding temperature distributions is essential for optimizing performance and efficiency.
It is important that the emission values of CO2 gases reach low levels. Power companies have come to recognize the importance of thoroughly examining the combustion performance of synthetic gas to enhance the availability and reliability of syngas turbines. Extensive studies have been conducted to investigate syngas combustion in order to address these issues. Notable participants in this research include power companies and major heavy industries, such as General Electric, Mitsubishi Heavy Industries, Korea Electric Power Corporation, and the Central Research Institute of Japan. The electric power sector has engaged in both experimental and computational studies to evaluate the combustion performance of synthetic gas and hydrogen [36,37,38]. In this study, results regarding the changes in the emission values of gases resulting from combustion are given, and information that can be useful for industrial users in their designs and analyses is presented.
The heat released during the reaction causes temperature increases in the system. The magnitude of these temperature increases depends on the reaction rate and the thermal properties of the environment. Enthalpy of formation and the molar heat capacities given in Table 2 (based on [35]) express the resistance of substances to temperature changes. Because the products have a lower heat of formation than the reactants, both reactions are exothermic and emit heat. The molar heat capacity of water is higher than that of hydrogen and oxygen, indicating that water is more resistant to temperature changes. Reaction rates tend to increase with temperature, which leads to more heat release and, thus, temperature peaks. In addition, changes in the mass ratios of the components in the system can affect the progress of the reaction and, therefore, the temperature distribution. For example, an increase in the concentration of hydrogen or carbon monoxide can increase the reaction rate and cause higher temperature peaks.
Furthermore, given that steam possesses the highest heat capacity among the gases listed in Table 2, it exerts a greater influence on flame temperature and reaction rate compared to N2 and CO2. Consequently, steam dilution results in higher CO emissions. This observation further supports the notion that the diminished reaction rate due to dilution is a primary factor contributing to the significant increase in CO emissions when steam is injected at a low heat input. Therefore, it is advisable to opt for N2 or CO2 dilution rather than steam dilution to mitigate CO emissions.

4. Conclusions

The combustion of syngas in the jet diffusion flame mode was numerically simulated. Six different mixing ratios (30% H2, 30% CO, 40% N2; 30% H2, 40% CO, 30% N2; 50% H2, 20% CO, 30% N2; 50% H2, 30% CO, 20% N2; 70% H2, 10% CO, 20% N2; 70% H2, 20% CO, 10% N2) were numerically analyzed to investigate the variations in temperature, velocity, pressure, and the mass fractions of CO2, H2O, and O2 in the burner flame. Simulation results indicate that hydrogen is the most effective component in increasing the temperature in these mixtures, followed by carbon monoxide. Nitrogen acts to moderate the temperature increase. Understanding these effects is crucial for applications involving combustion or gas mixtures where temperature control is critical.
It was observed that the obtained results were compatible with the literature data.
This study indicates that hydrogen content significantly affects water vapour production in the reactor. Higher hydrogen content leads to higher peak water mass fractions (Figure 9), while higher nitrogen content appears to dilute the reaction and reduce the water mass fraction (Figure 13). These results are consistent with previous observations [6,7] that hydrogen plays an important role in increasing reaction temperatures and increasing water production.
The study also shows that hydrogen content significantly affects oxygen consumption in the reactor. Higher hydrogen content results in lower final oxygen mass fractions, indicating more efficient oxygen consumption (Figure 10 and Figure 12). This pattern is in line with research showing that hydrogen is an essential component of reaction kinetics that influences temperature and product production.
The structure and high temperature location of the jet diffusion flame can be altered by varying the hydrogen content of the fuel mixture. Understanding these changes in the flame structure may aid in the development of syngas burners with different gas compositions.
The effects of fuel side diluents, including N2, CO2, and H2O, on H2/CO syngas turbulent non-premixed combustion can be studied using different turbulence models. Diluents, including nitrogen, carbon dioxide, and steam present in synthesis gas, significantly enhance combustion performance; however, the extent of their effectiveness and the underlying mechanisms remain inadequately explored. While some numerical and experimental investigations have addressed the dilution effects of carbon dioxide and nitrogen, these studies primarily concentrated on combustion characteristics with basic burners. A more comprehensive analysis of gas turbine combustion chambers can be achieved through detailed modelling techniques.

Author Contributions

Conceptualization, B.T.; Methodology, B.T.; Software, B.T.; Validation, B.T.; Formal analysis, B.T.; Investigation, B.T. and R.G.; Resources, B.T. and R.G.; Writing—original draft, B.T. and R.G.; Writing—review & editing, R.G.; Visualization, R.G. All authors have read and agreed to the published version of the manuscript.

Funding

This research received no external funding.

Data Availability Statement

The original contributions presented in this study are included in the article. Further inquiries can be directed to the corresponding author.

Acknowledgments

The author would like to express his gratitude to A.B. Etemoglu and Muhiddin Can for his valuable comments on the paper.

Conflicts of Interest

The authors declare no conflict of interest.

References

  1. Zhuo, L.; Jiang, Y.; Qiu, R.; An, J.; Xu, W. Effects of fuel-side N2, CO2, H2O dilution on combustion characteristics and NOx formation of syngas turbulent nonpremixed jet flames. J. Eng. Gas Turbines Power 2014, 136, 6. [Google Scholar] [CrossRef]
  2. Wender, I. Reactions of synthesis gas. Fuel Process. Technol. 1996, 48, 189–207. [Google Scholar] [CrossRef]
  3. Di Nardo, A.; Galletti, C.; Giammartini, S.S. Design and analysis of a gas turbine trapped vortex combustion. In Proceedings of the Technologies for Sustainable Energy, Ischia, Italy, 27–30 June 2010. [Google Scholar]
  4. Klayborworn, S.; Pakdee, W. Effects of porous insertion in a round-jet burner on flame characteristics of turbulent non-premixed syngas combustion. Case Stud. Therm. Eng. 2019, 14, 100451. [Google Scholar] [CrossRef]
  5. Cuoci, A.; Frassoldati, A.; Buzzi Ferraris, G.; Faravelli, T.; Ranzi, E. The ignition, combustion and flame structure of carbon monoxide/hydrogen mixtures. Note 2: Fluid dynamics and kinetic aspects of syngas combustion. Int. J. Hydrogen Energy 2007, 32, 3486–3500. [Google Scholar] [CrossRef]
  6. Ranga Dinesh, K.K.J.; Jiang, X.; Van Oijen, J.A. Direct numerical simulation of non-premixed syngas burning with detailed chemistry. Fuel 2013, 107, 343–355. [Google Scholar] [CrossRef]
  7. Barlow, R.S.; Fiechtner, G.J.; Carter, C.D.; Chen, J.Y. Experiments on the scalar structure of turbulent CO/H2/N2 jet flames. Combust. Flame 2000, 120, 549–569. [Google Scholar] [CrossRef]
  8. Flury, M. Experimentelle Analyse der Mischungstruktur in Turbulenten Nicht Vorgemischten Flammen. PhD Thesis, ETH Zurich (Swiss Federal Institute of Technology Zurich), Zurich, Switzerland, 1999. [Google Scholar]
  9. Alavandi, S.K.; Agrawal, A.K. Lean Premixed Combustion of Carbon Monoxide-Hydrogen-Methane Fuel Mixtures Using Porous Inert Media. In Proceedings of the ASME Turbo Expo 2005: Power for Land, Sea, and Air, Reno, NV, USA, 6–9 June 2005. ASME Paper No. GT2005-68586. [Google Scholar]
  10. Zhang, Y.; Yang, T.; Liu, X.; Tian, L.; Fu, Z.; Zhang, K. Reduction of Emissions from A Syngas Flame Using Micromixing and Dilution with CO2. Energy Fuels 2012, 26, 6595–6601. [Google Scholar] [CrossRef]
  11. Strahle, W.C. Preface to “evaluation of data on simple turbulent reacting flows”. Prog. Energy Combust. Sci. 1986, 12, 253–255. [Google Scholar] [CrossRef]
  12. Faeth, G.M.; Samuelsen, G.S. Fast reaction nonpremixed combustion. Prog. Energy Combust. Sci. 1986, 12, 305–372. [Google Scholar] [CrossRef]
  13. Drake, M.C.; Kollmann, W. Slow chemistry nonpremixed flows. Prog. Energy Combust. Sci. 1986, 12, 373–392. [Google Scholar] [CrossRef]
  14. Masri, A.R.; Dibble, R.W.; Barlow, R.S. The structure of turbulent nonpremixed flames revealed by Raman-Rayleigh-LIF measurements. Prog. Energy Combust. Sci. 1996, 22, 307–362. [Google Scholar] [CrossRef]
  15. Swarnkar, P.; Sahu, A.K.; Sundararajan, T. Numerical study of effect of hydrogen content on the structure of syngas diffusion flame. In Proceedings of the HEFAT2014 10th International Conference on Heat Transfer, Fluid Mechanics and Thermodynamics, Orlando, FL, USA, 14–16 July 2014. [Google Scholar]
  16. Chen, L.; Battaglia, F. The Effects of Fuel Mixtures in Nonpremixed Combustion for a Bluff-Body Flame. J. Energy Resour. Technol. Trans. Asme 2016, 138, 022204. [Google Scholar] [CrossRef]
  17. Domenico, M.D.; Kutne, P.; Naumann, C.; Aigner, M. Numerical and experimental investigation of syngas combustion in a semi-technical scale burner. In Proceedings of the 48th AIAA Aerospace Sciences Meeting Including the New Horizons Forum and Aerospace Expositio, Orlando, FL, USA, 4–7 January 2010. [Google Scholar]
  18. Pradhan, A.; Pattnaik, S.; Bastia, A.A.; Samantray, D. Combustion characteristic and optimization of round jet burner using Syngas. Mater. Today Proc. 2022, 80, 219–225. [Google Scholar] [CrossRef]
  19. Paykani, A.; Chehrmonavari, H.; Tsolakis, A.; Alger, T.; Northrop, W.F.; Reitz, R. Synthesis gas as a fuel for internal combustion engines in transportation. Prog. Energy Combust. Sci. 2022, 90, 100995. [Google Scholar] [CrossRef]
  20. Piemsinlapakunchon, T.; Paul, M.C. Effect of syngas fuel compositions on the occurrence of instability of laminar diffusion flame. Int. J. Hydrogen Energy 2021, 46, 7573–7588. [Google Scholar] [CrossRef]
  21. Zhang, G.; Li, G.; Li, H.; Lv, J. Effect of diluent gas on propagation and explosion characteristics of hydrogen-rich syngas laminar premixed flame. Energy 2022, 246, 123370. [Google Scholar] [CrossRef]
  22. Liu, Y.; Xue, Q.; Zuo, H.; Yang, F.; Peng, X.; Wang, J. Effects of CO2 and N2 Dilution on the Combustion Characteristics of H2/CO Mixture in a Turbulent, Partially Premixed Burner. ACS Omega 2021, 6, 15651–15662. [Google Scholar] [CrossRef] [PubMed]
  23. Ho, J.Z.; Talei, M.; Gordon, R.L. Direct numerical simulation of stoichiometric hydrogen/methane premixed jet flames. Int. J. Hydrogen Energy 2024, 81, 831–841. [Google Scholar] [CrossRef]
  24. Le, J.; Yang, M.; Guo, M.; Tian, Y.; Zhang, H. Progress and prospects of artificial intelligence development and applications in supersonic flow and combustion. Prog. Aerosp. Sci. 2024, 151, 101046. [Google Scholar] [CrossRef]
  25. Khlifi, S.; Pozzobon, V.; Lajili, M. A Comprehensive Review of Syngas Production, Fuel Properties, and Operational Parameters for Biomass Conversion. Energies 2024, 17, 3646. [Google Scholar] [CrossRef]
  26. Trabelsi, A.B.H.; Ghrib, A.; Zaafouri, K.; Friaa, A.; Ouerghi, A.; Naoui, S.; Belayouni, H. Hydrogen-Rich Syngas Production from Gasification and Pyrolysis of Solar Dried Sewage Sludge: Experimental and Modeling Investigations. BioMed Res. Int. 2017, 919, 7831470. [Google Scholar]
  27. Demirbas, A.; Arin, G. An Overview of Biomass Pyrolysis. Energy Sources 2002, 24, 471–482. [Google Scholar] [CrossRef]
  28. Kan, T.; Strezov, V.; Evans, T.J. Lignocellulosic biomass pyrolysis: A review of product properties and effects of pyrolysis parameters. Renew. Sustain. Energy Rev. 2016, 57, 1126–1140. [Google Scholar] [CrossRef]
  29. Andican, A.; Faizal, M.; Said, M.; Aprianti, N. Synthetic Gas Production from Fine Coal Gasification Using Low-Cost Catalyst. J. Ecol. Eng. 2022, 23, 64–72. [Google Scholar] [CrossRef]
  30. Tangestani, E.; Ghanbarzadeh, S.; Garcia, J.F. Prediction of Catalytic Hydrogen Generation by Water–Gas Shift Reaction Using a Neural Network Approach. Catal. Lett. 2023, 153, 863–875. [Google Scholar] [CrossRef]
  31. Liu, N.; Jia, W.; Qin, S. A smooth gradient approximation neural network for general constrained nonsmooth nonconvex optimization problems. Neural Netw. 2025, 184, 107121. [Google Scholar] [CrossRef]
  32. Wilcox, D.C. Turbulence Modeling for CFD, 2nd ed.; DCW Industries: La Canada, CA, USA, 1998. [Google Scholar]
  33. COMSOL Multiphysics 5.3; Flow Module User’s Guide, Heat Transfer Module; COMSOL Inc: Burlington, MA, USA, 2021.
  34. Klayborworn, S.; Pakdee, W. Numerical analysis of turbulent non-premixed combustion of syngas and air in a round-jet porous burner. J. Porous Media 2021, 24, 55–71. [Google Scholar] [CrossRef]
  35. Frassoldati, A.; Faravelli, T.; Ranzi, E. Combustion and flame structure of carbon monoxide/hydrogen mixtures. Note 1: Detailed kinetic modeling of syngas combustion also in presence of nitrogen compounds. Int. J. Hydrogen Energy 2007, 32, 3471–3485. [Google Scholar] [CrossRef]
  36. Hasegawa, T.; Sato, M.; Nakata, T. A study of combustion characteristics of gasified coal fuel. Trans. ASME 2001, 123, 22–32. [Google Scholar] [CrossRef]
  37. Nakata, T.; Sato, M.; Ninomiya, T.; Hasegawa, T. A study on low NOx combustion in LBG-fueled 1500 C–class gas turbine. Trans ASME 1996, 118, 534–540. [Google Scholar] [CrossRef]
  38. Lee, M.C.; Seo, S.B.; Chung, J.W.; Kim, S.M.; Joo, Y.J.; Ahn, D.H. Gas turbine combustion performance test of hydrogen and carbon monoxide synthetic gas. Fuel 2010, 89, 1485–1491. [Google Scholar] [CrossRef]
Figure 1. Burner and combustion flame model.
Processes 13 00654 g001
Figure 2. Model and mesh structure.
Processes 13 00654 g002
Figure 3. Comparison of literature data and numerical results (axial velocity measurements at two distinct locations downstream of the pipe exit are presented, normalized by the inlet velocity. The radial distance is normalized by the inner diameter of the pipe).
Processes 13 00654 g003
Figure 4. Simulation results of temperature values (°C) of different mixture ratios, where the temperature values are presented in units of 103. In case, the mixing ratios given in the figure are as follows: (a) 30% H2, 30% CO, 40% N2; (b) 30% H2, 40% CO, 30% N2; (c) 50% H2, 20% CO, 30% N2; (d) 50% H2, 30% CO, 20% N2; (e) 70% H2, 10% CO, 20% N2; (f) 70% H2, 20% CO, 10% N2.
Processes 13 00654 g004
Figure 5. Change the graph of temperature values of different mixture ratios (temperature change along the z-axis).
Processes 13 00654 g005
Figure 6. Change the graph of velocity values of different mixture ratios (temperature change along the z-axis).
Processes 13 00654 g006
Figure 7. Change the graph of pressure values of different mixture ratios (temperature change along the z-axis).
Processes 13 00654 g007
Figure 8. Change graph of CO2 mass fraction values of different mixture ratios (species mass fractions along the centerline of the jet. The distance from the centerline is normalized by the inner diameter of the pipe).
Processes 13 00654 g008
Figure 9. Change graph of H2O mass fraction values of different mixture ratios (species mass fractions along the centerline of the jet. The distance from the centerline is normalized by the inner diameter of the pipe).
Processes 13 00654 g009
Figure 10. Change graph of O2 mass fraction values of different mixture ratios (species mass fractions along the centerline of the jet. The distance from the centerline is normalized by the inner diameter of the pipe).
Processes 13 00654 g010
Figure 11. Simulation results of CO2 amounts (mol/m3) of different mixture ratios (a) 30% H2, 30% CO, 40% N2; (b) 30% H2, 40% CO, 30% N2; (c) 50% H2, 20% CO, 30% N2; (d) 50% H2, 30% CO, 20% N2; (e) 70% H2, 10% CO, 20% N2; (f) 70% H2, 20% CO, 10% N2.
Processes 13 00654 g011
Figure 12. Simulation results of O2 amounts (mol/m3) of different mixture ratios (a) 30% H2, 30% CO, 40% N2; (b) 30% H2, 40% CO, 30% N2; (c) 50% H2, 20% CO, 30% N2; (d) 50% H2, 30% CO, 20% N2; (e) 70% H2, 10% CO, 20% N2; (f) 70% H2, 20% CO, 10% N2.
Processes 13 00654 g012
Figure 13. Simulation results of H2O amounts (mol/m3) of different mixture ratios (a) 30% H2, 30% CO, 40% N2; (b) 30% H2, 40% CO, 30% N2; (c) 50% H2, 20% CO, 30% N2; (d) 50% H2, 30% CO, 20% N2; (e) 70% H2, 10% CO, 20% N2; (f) 70% H2, 20% CO, 10% N2.
Processes 13 00654 g013
Figure 14. Results of uz/Ujet value of different mixing ratios (Z/D 20). Axial velocity measurements at two distinct locations downstream of the pipe exit are presented, normalized by the inlet velocity. The radial distance is normalized by the inner diameter of the pipe.
Processes 13 00654 g014
Figure 15. Results of uz/Ujet value of different mixing ratios (Z/D 50). Axial velocity measurements at two distinct locations downstream of the pipe exit are presented, normalized by the inlet velocity. The radial distance is normalized by the inner diameter of the pipe.
Processes 13 00654 g015
Figure 16. Results of T/T0 value for different mixing ratios (Z/D 20). Axial temperature measurements at two distinct locations downstream of the pipe exit are presented, normalized by the temperature. The radial distance is normalized by the inner diameter of the pipe.
Processes 13 00654 g016
Figure 17. Results of T/T0 value for different mixing ratios (Z/D 50). Axial temperature measurements at two distinct locations downstream of the pipe exit are presented, normalized by the temperature. The radial distance is normalized by the inner diameter of the pipe.
Processes 13 00654 g017
Table 1. Properties of the components used in the simulation.
COO2CO2H2H2ON2
Molar mass (g/mol)28324421828
Standard enthalpy (kcal/mol)−26.42−94.0610−57.800
Table 2. Enthalpy of formation and heat capacity of species [35].
ΔHf (cal/mol) T = 298 KCp (cal/(mol·K) T = 1000 K
N207.830
H207.209
O208.350
H2O−57.89.875
CO−26.46.950
CO2−948.910
Disclaimer/Publisher’s Note: The statements, opinions and data contained in all publications are solely those of the individual author(s) and contributor(s) and not of MDPI and/or the editor(s). MDPI and/or the editor(s) disclaim responsibility for any injury to people or property resulting from any ideas, methods, instructions or products referred to in the content.

