
The Impact of Weld Repairs on the Microstructure and Mechanical Integrity of X80 Pipelines in Oil and Gas Transmission

Abstract
1. Introduction
2. Experimental Materials and Methods
2.1. Experimental Procedures
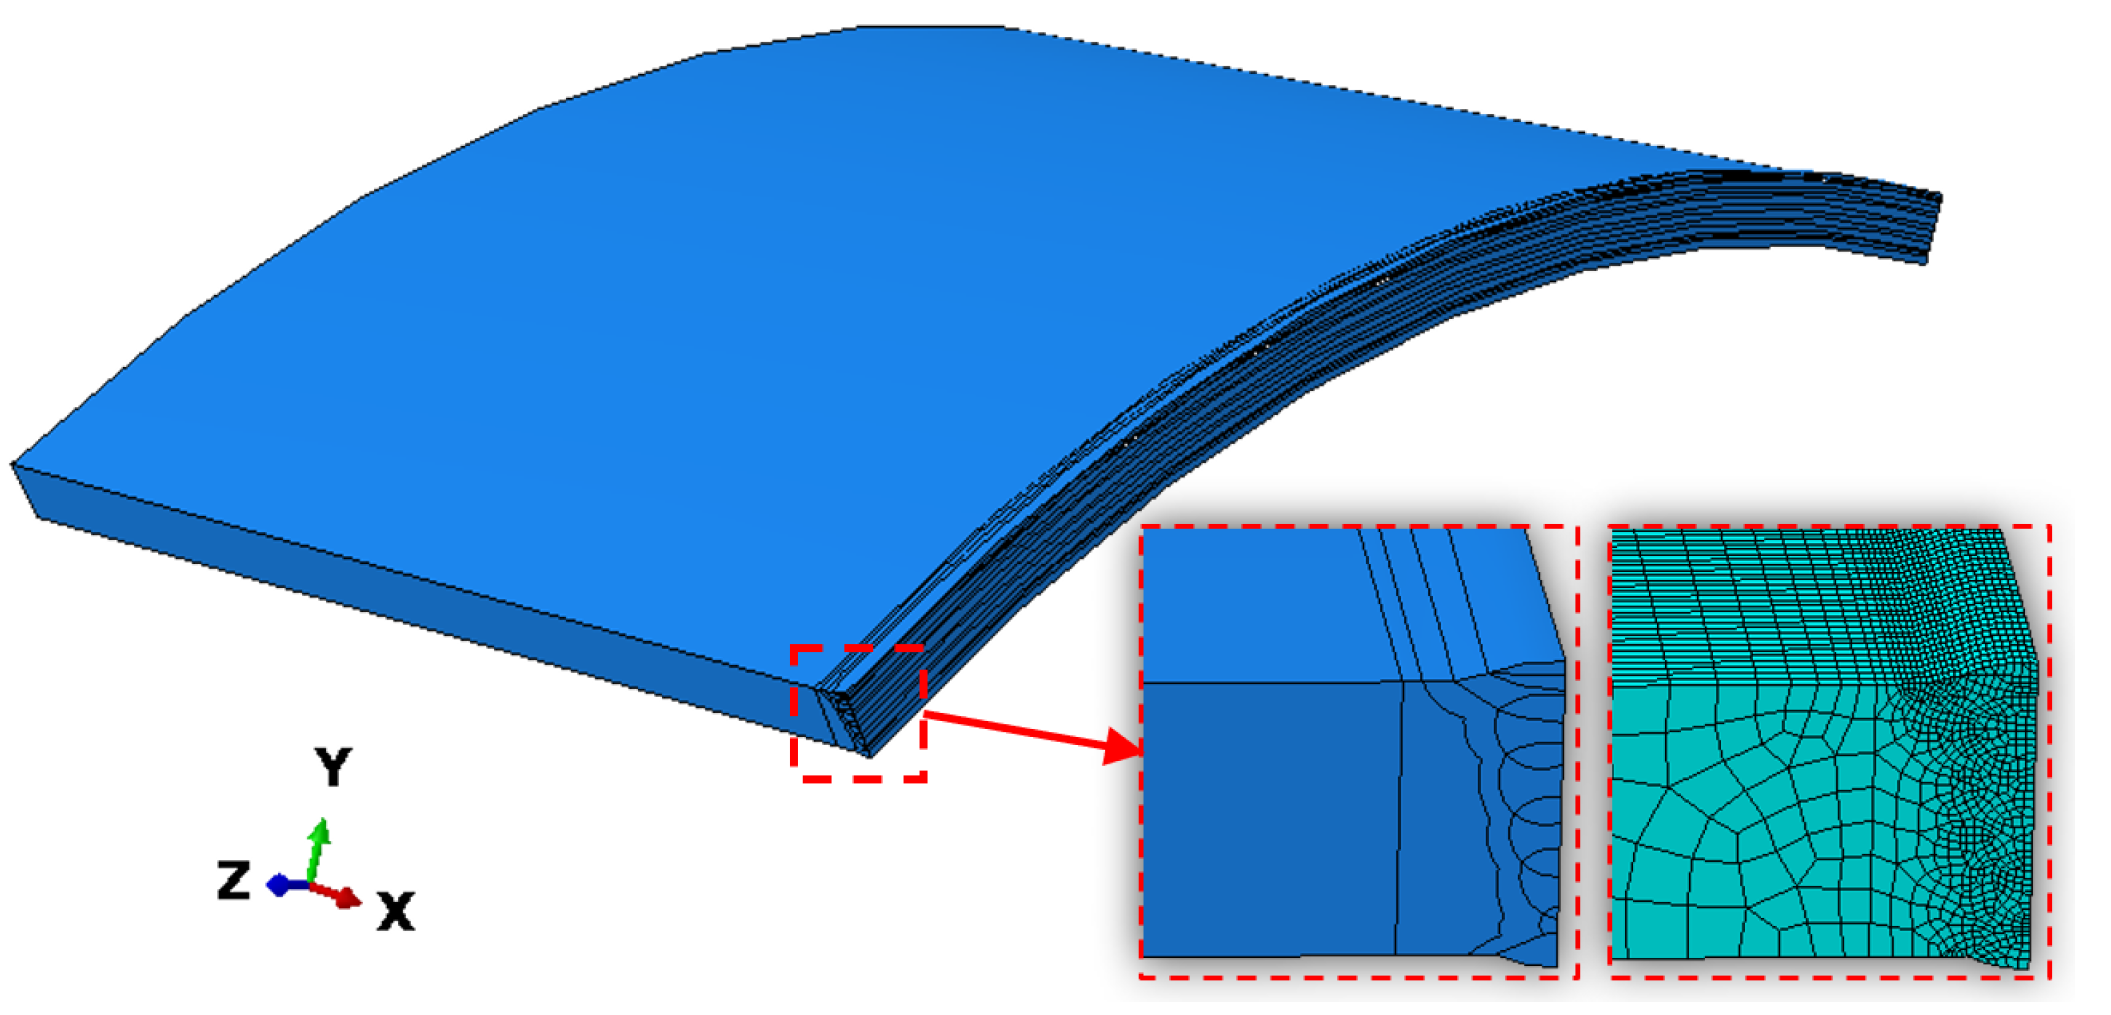
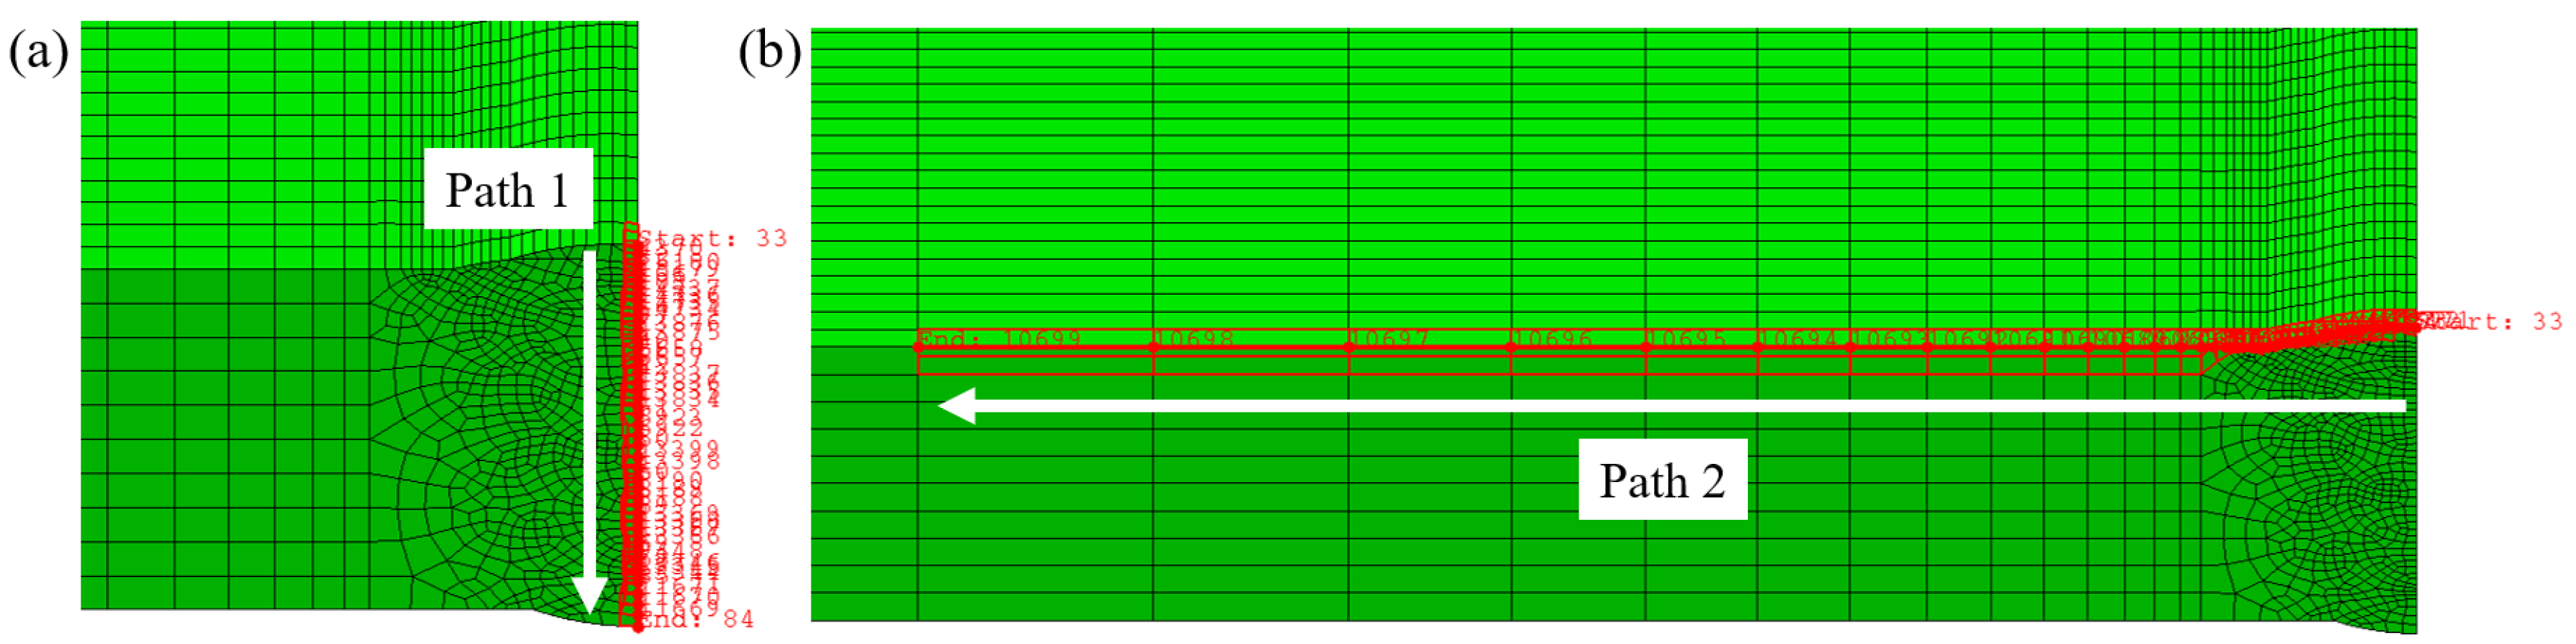
2.2. Establishment of the Model
3. Results and Discussion
3.1. Microstructure
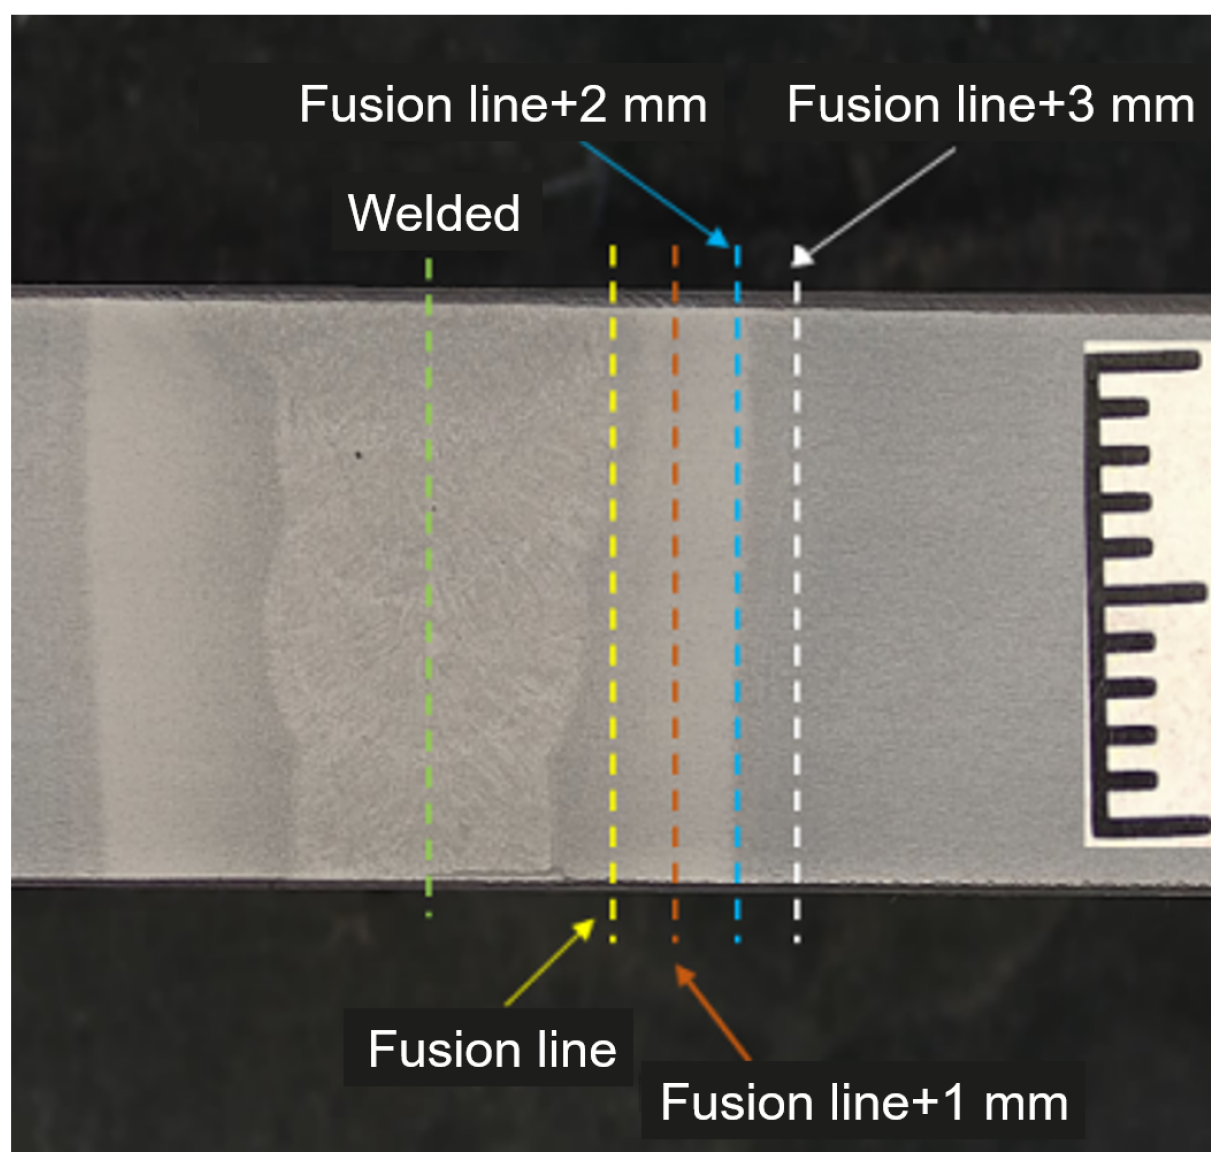
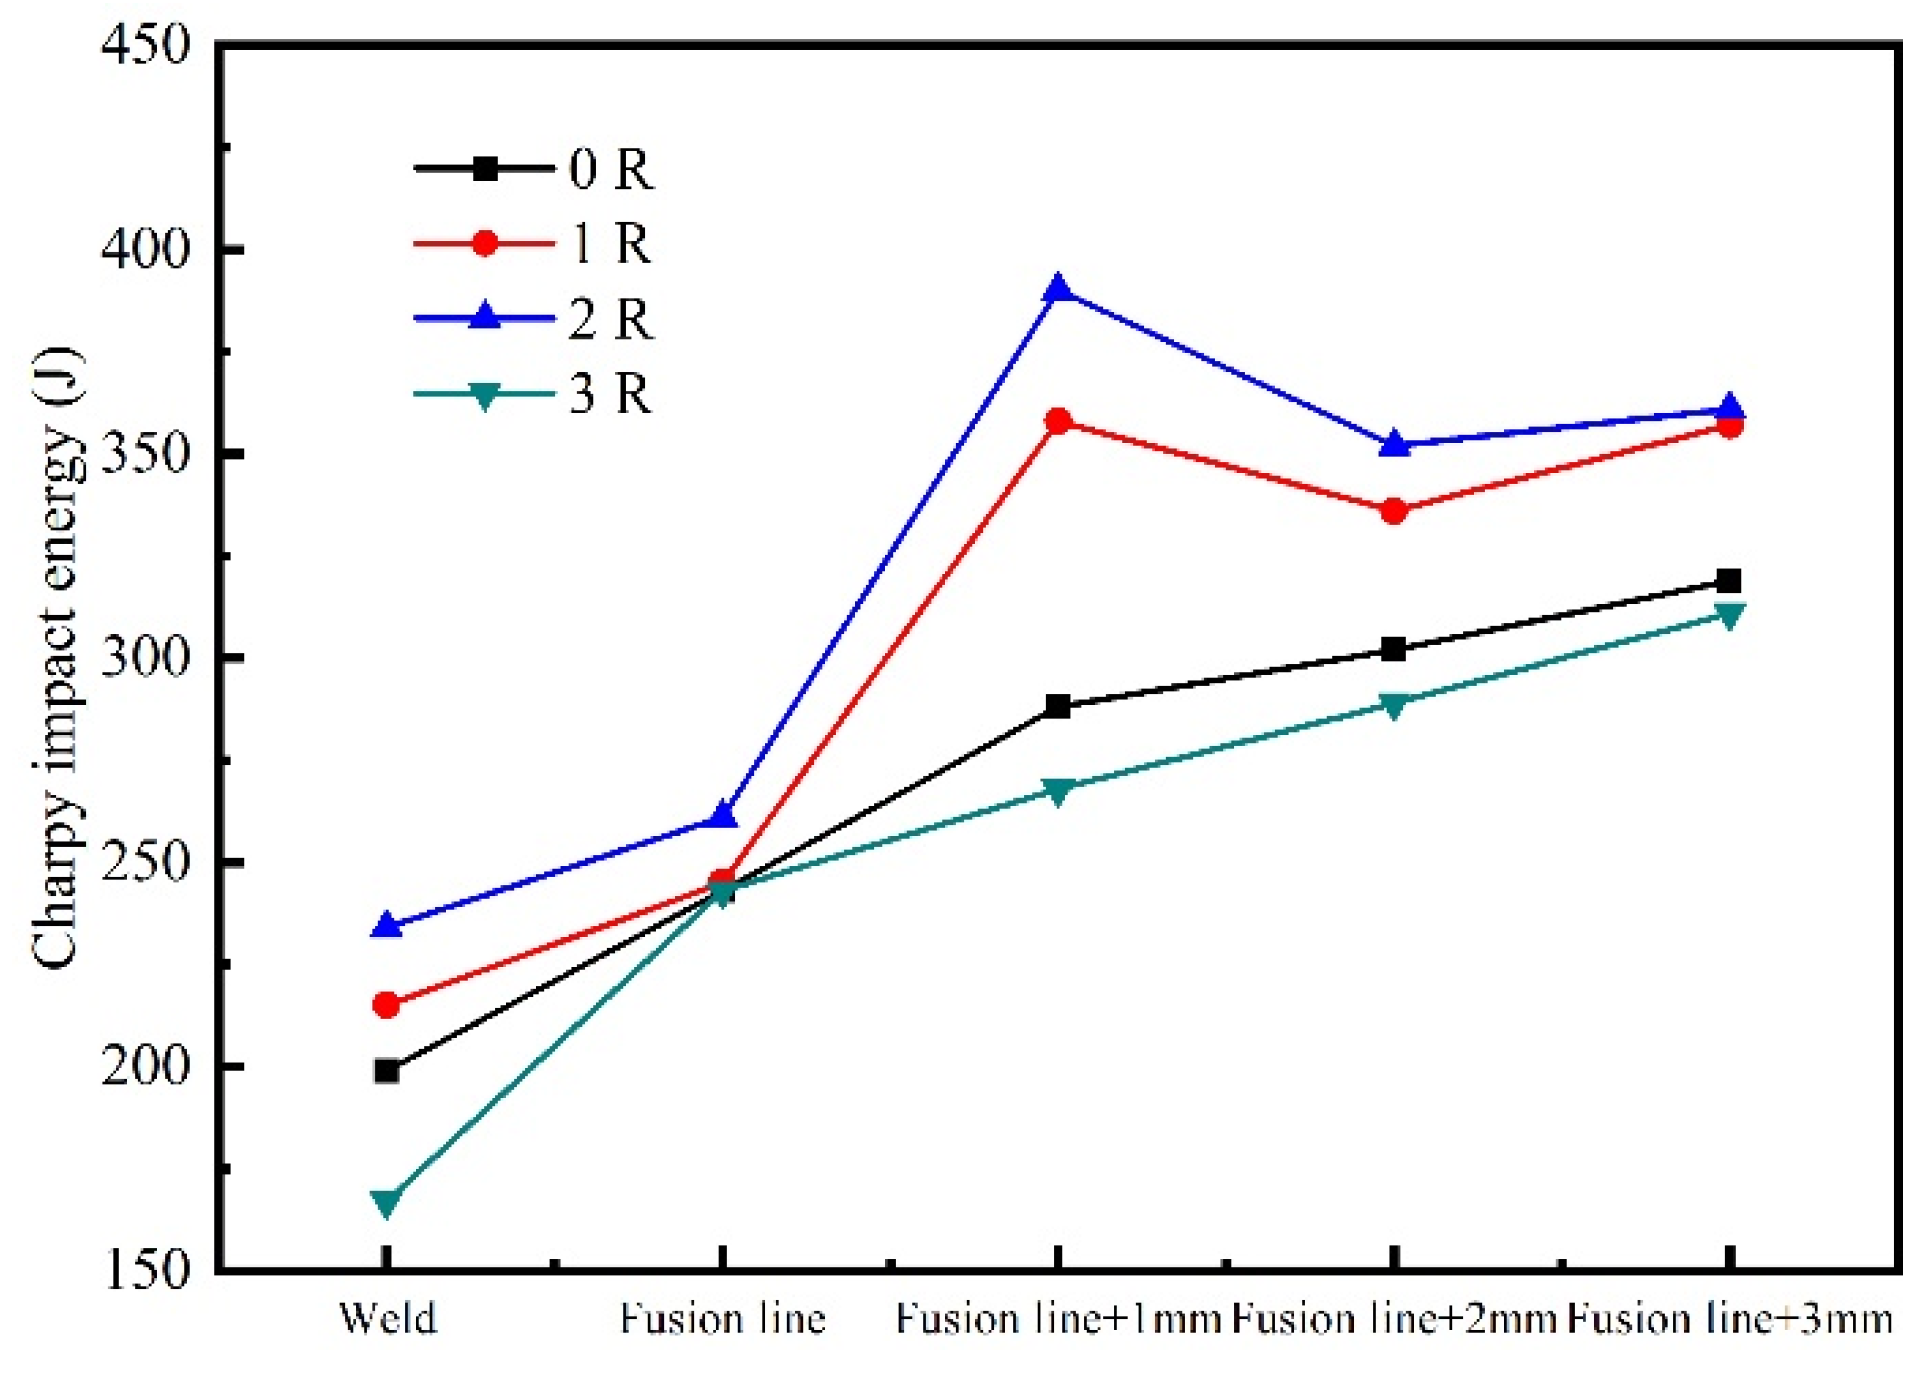
3.2. Toughness
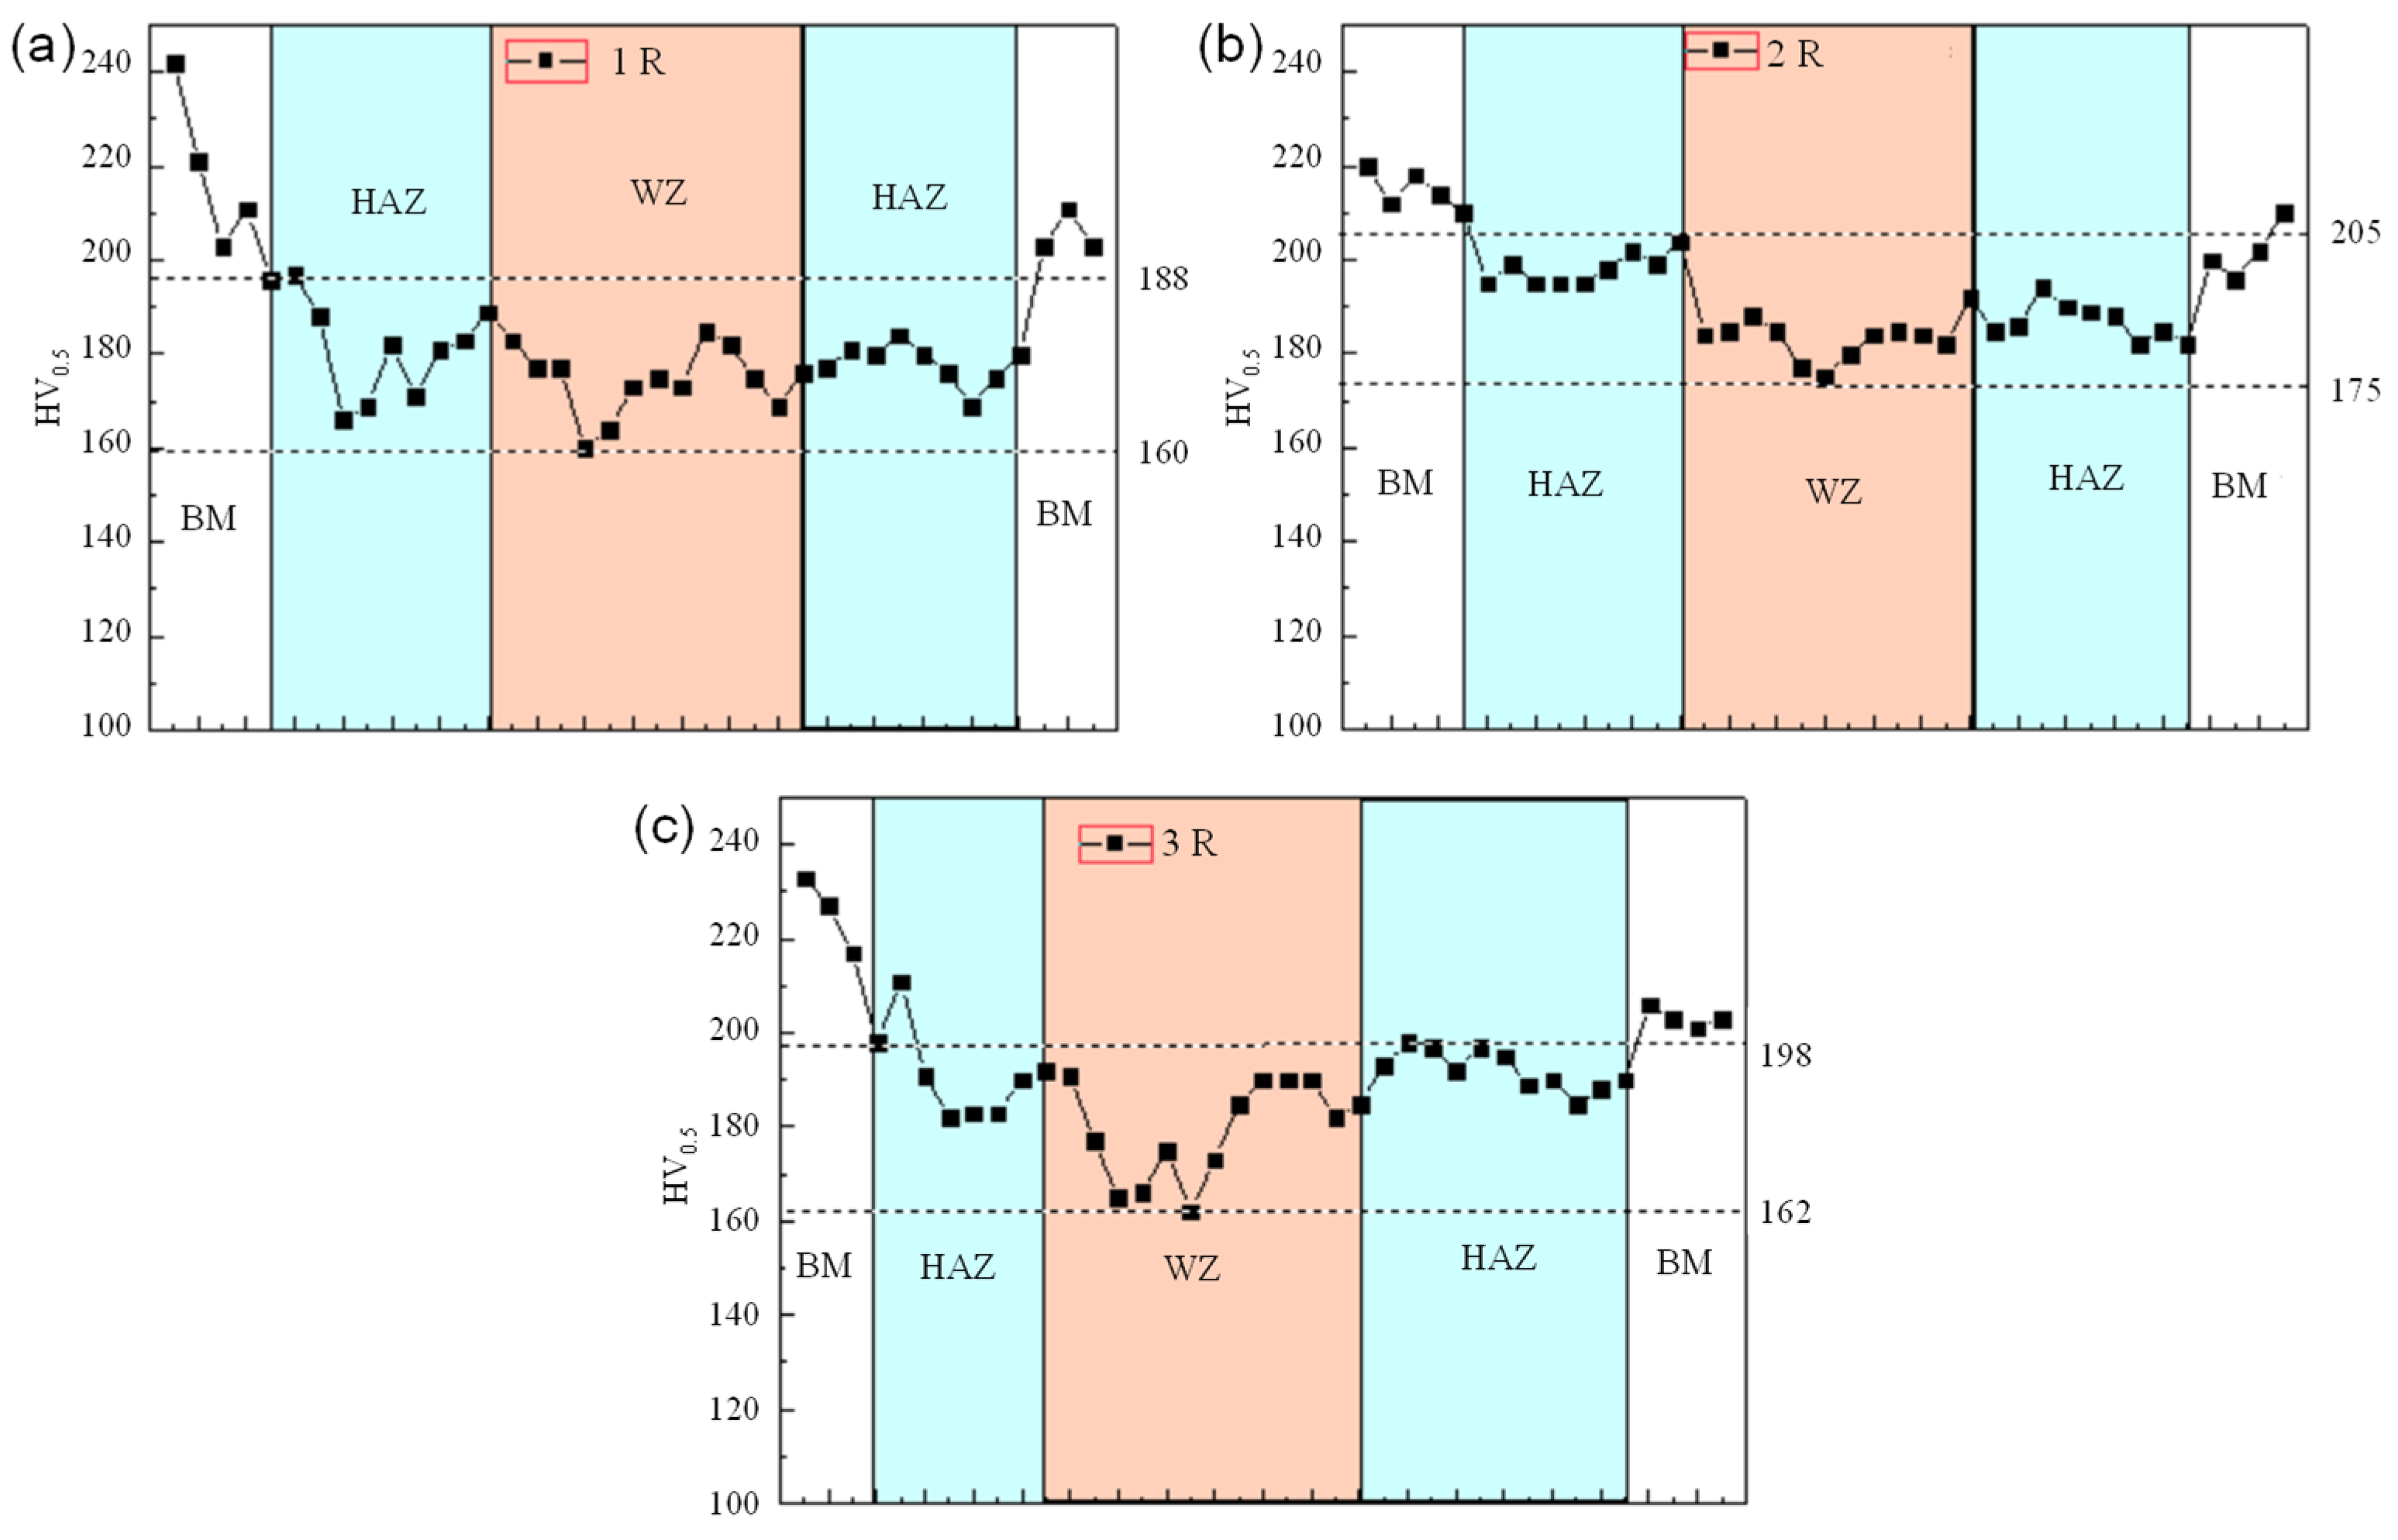
3.3. Hardness
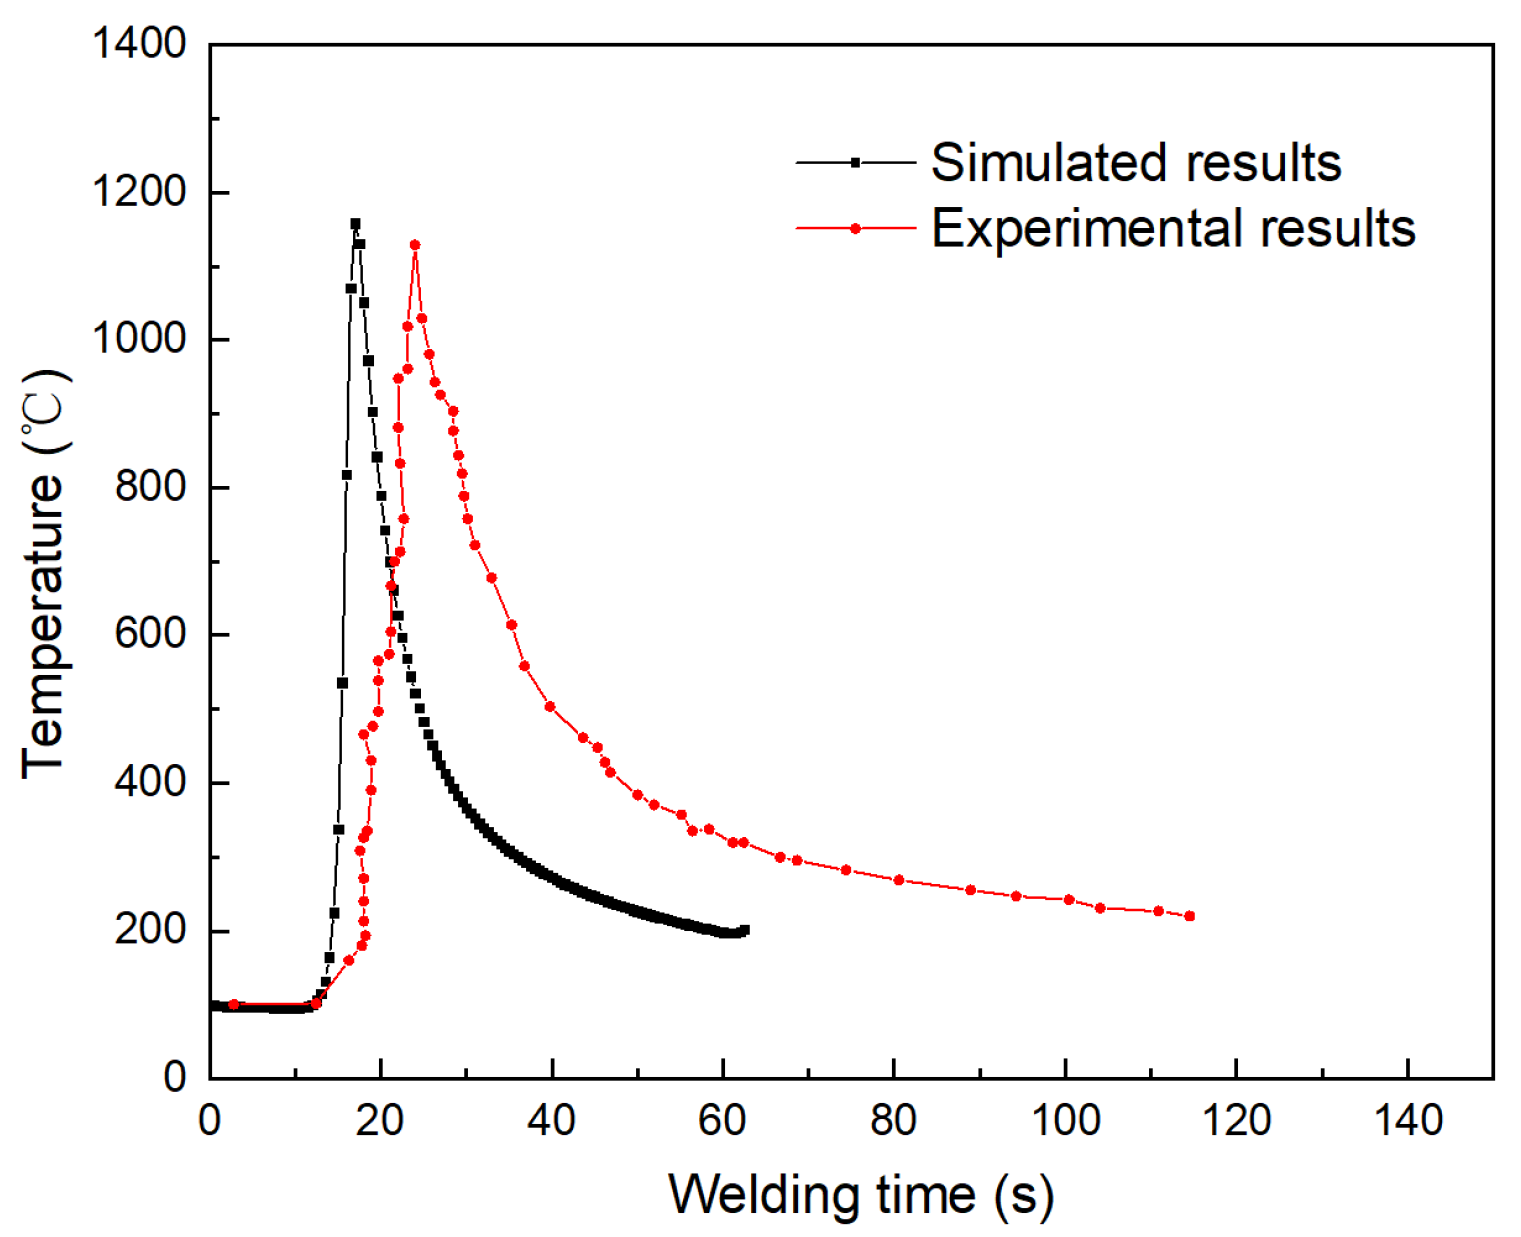
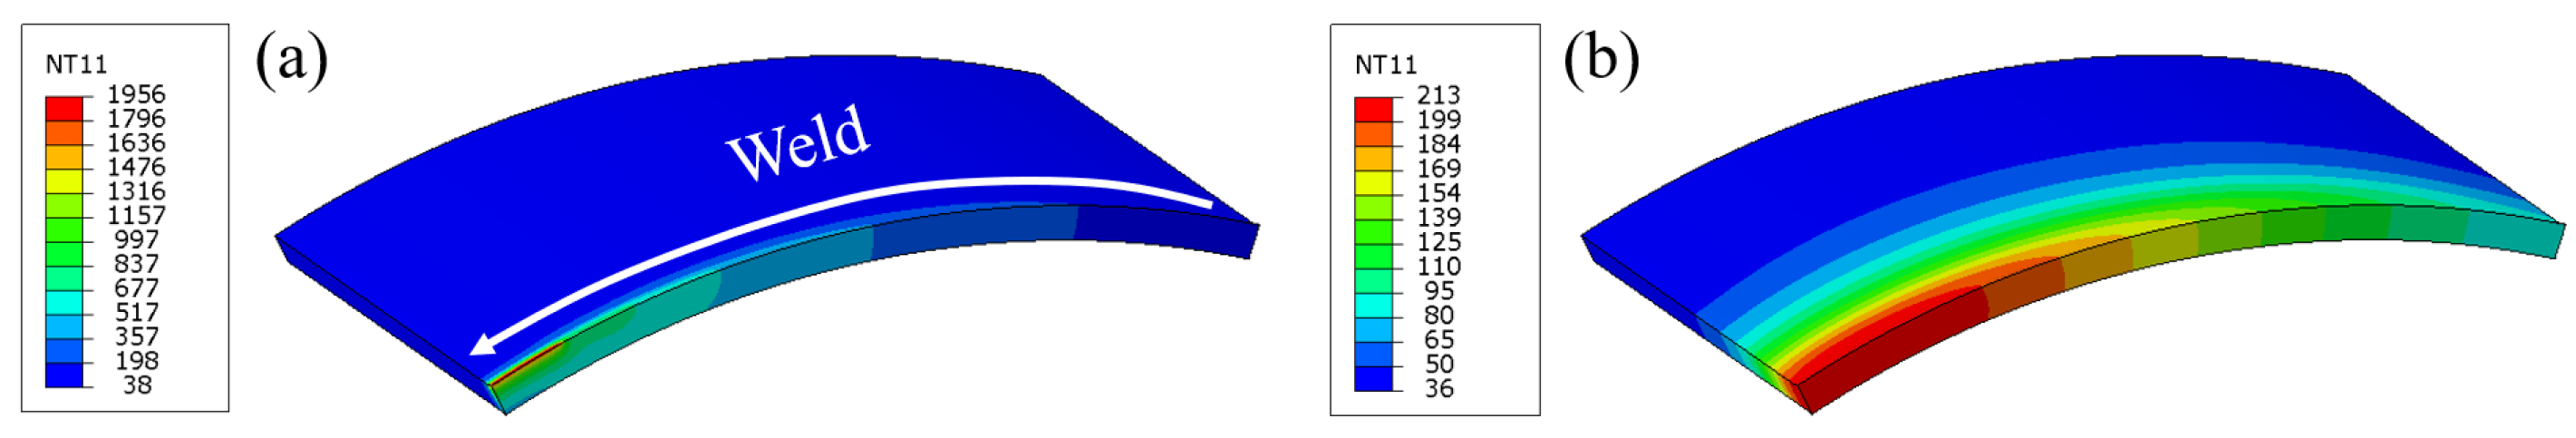
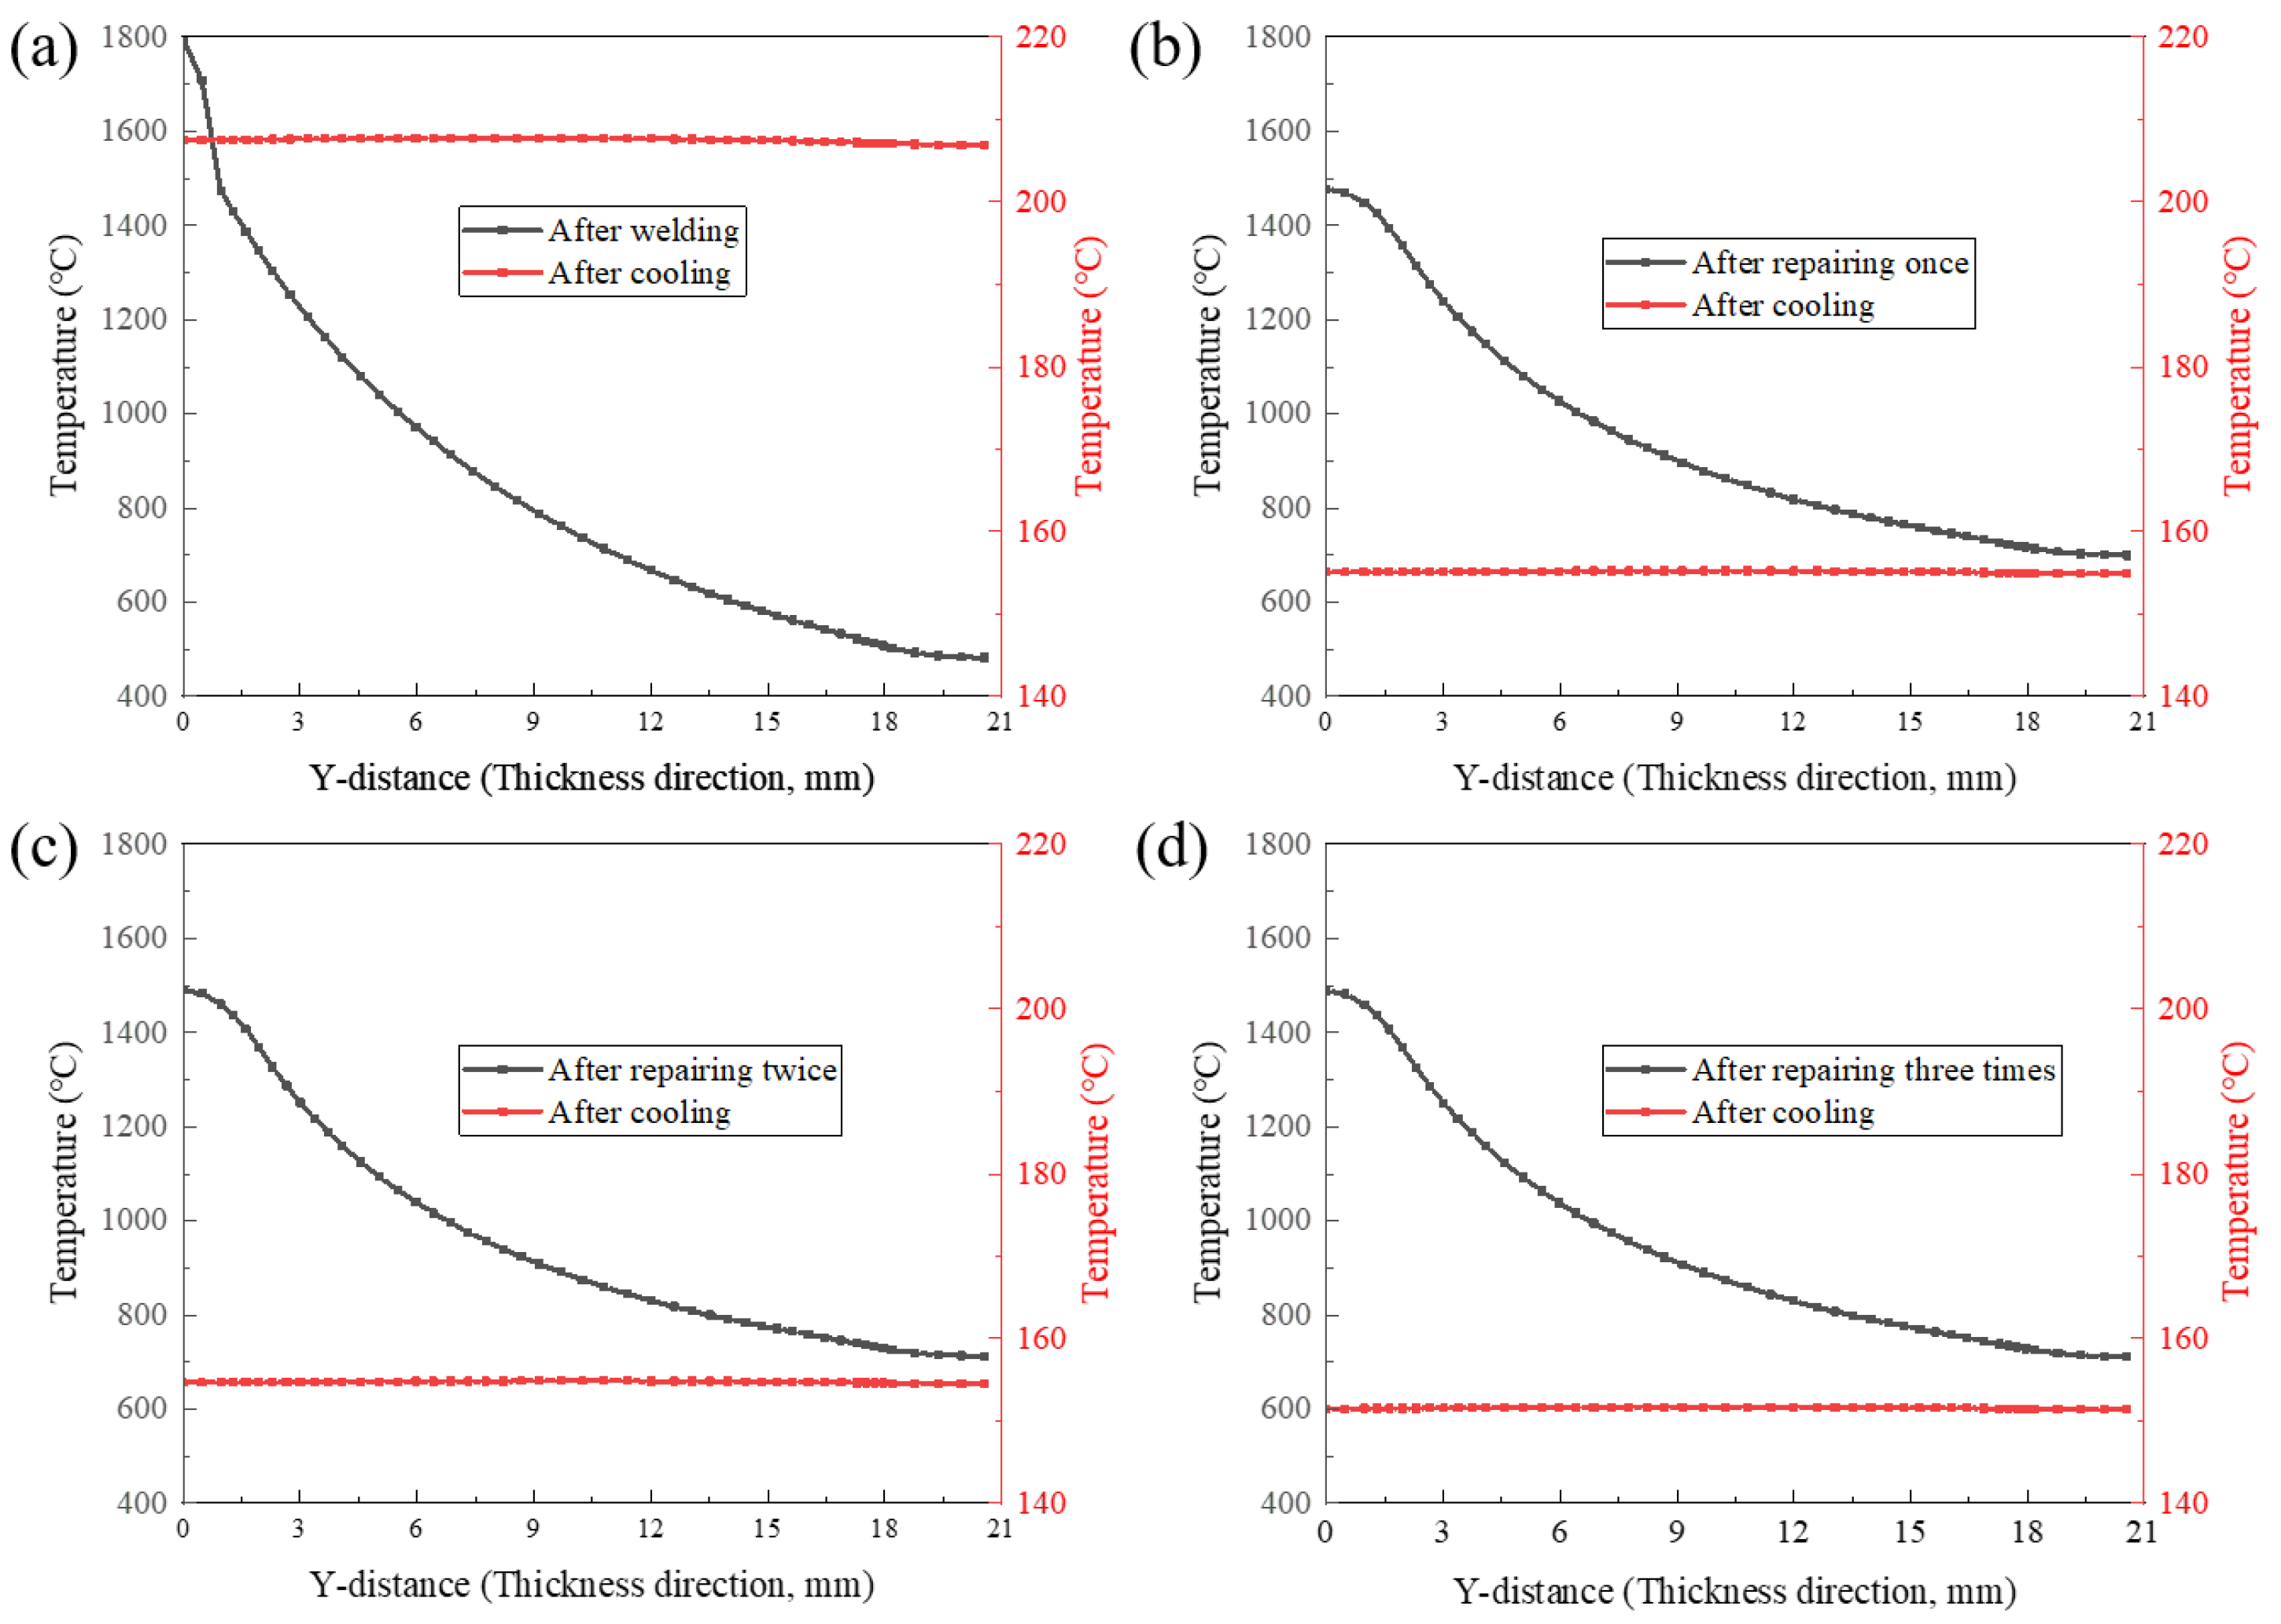
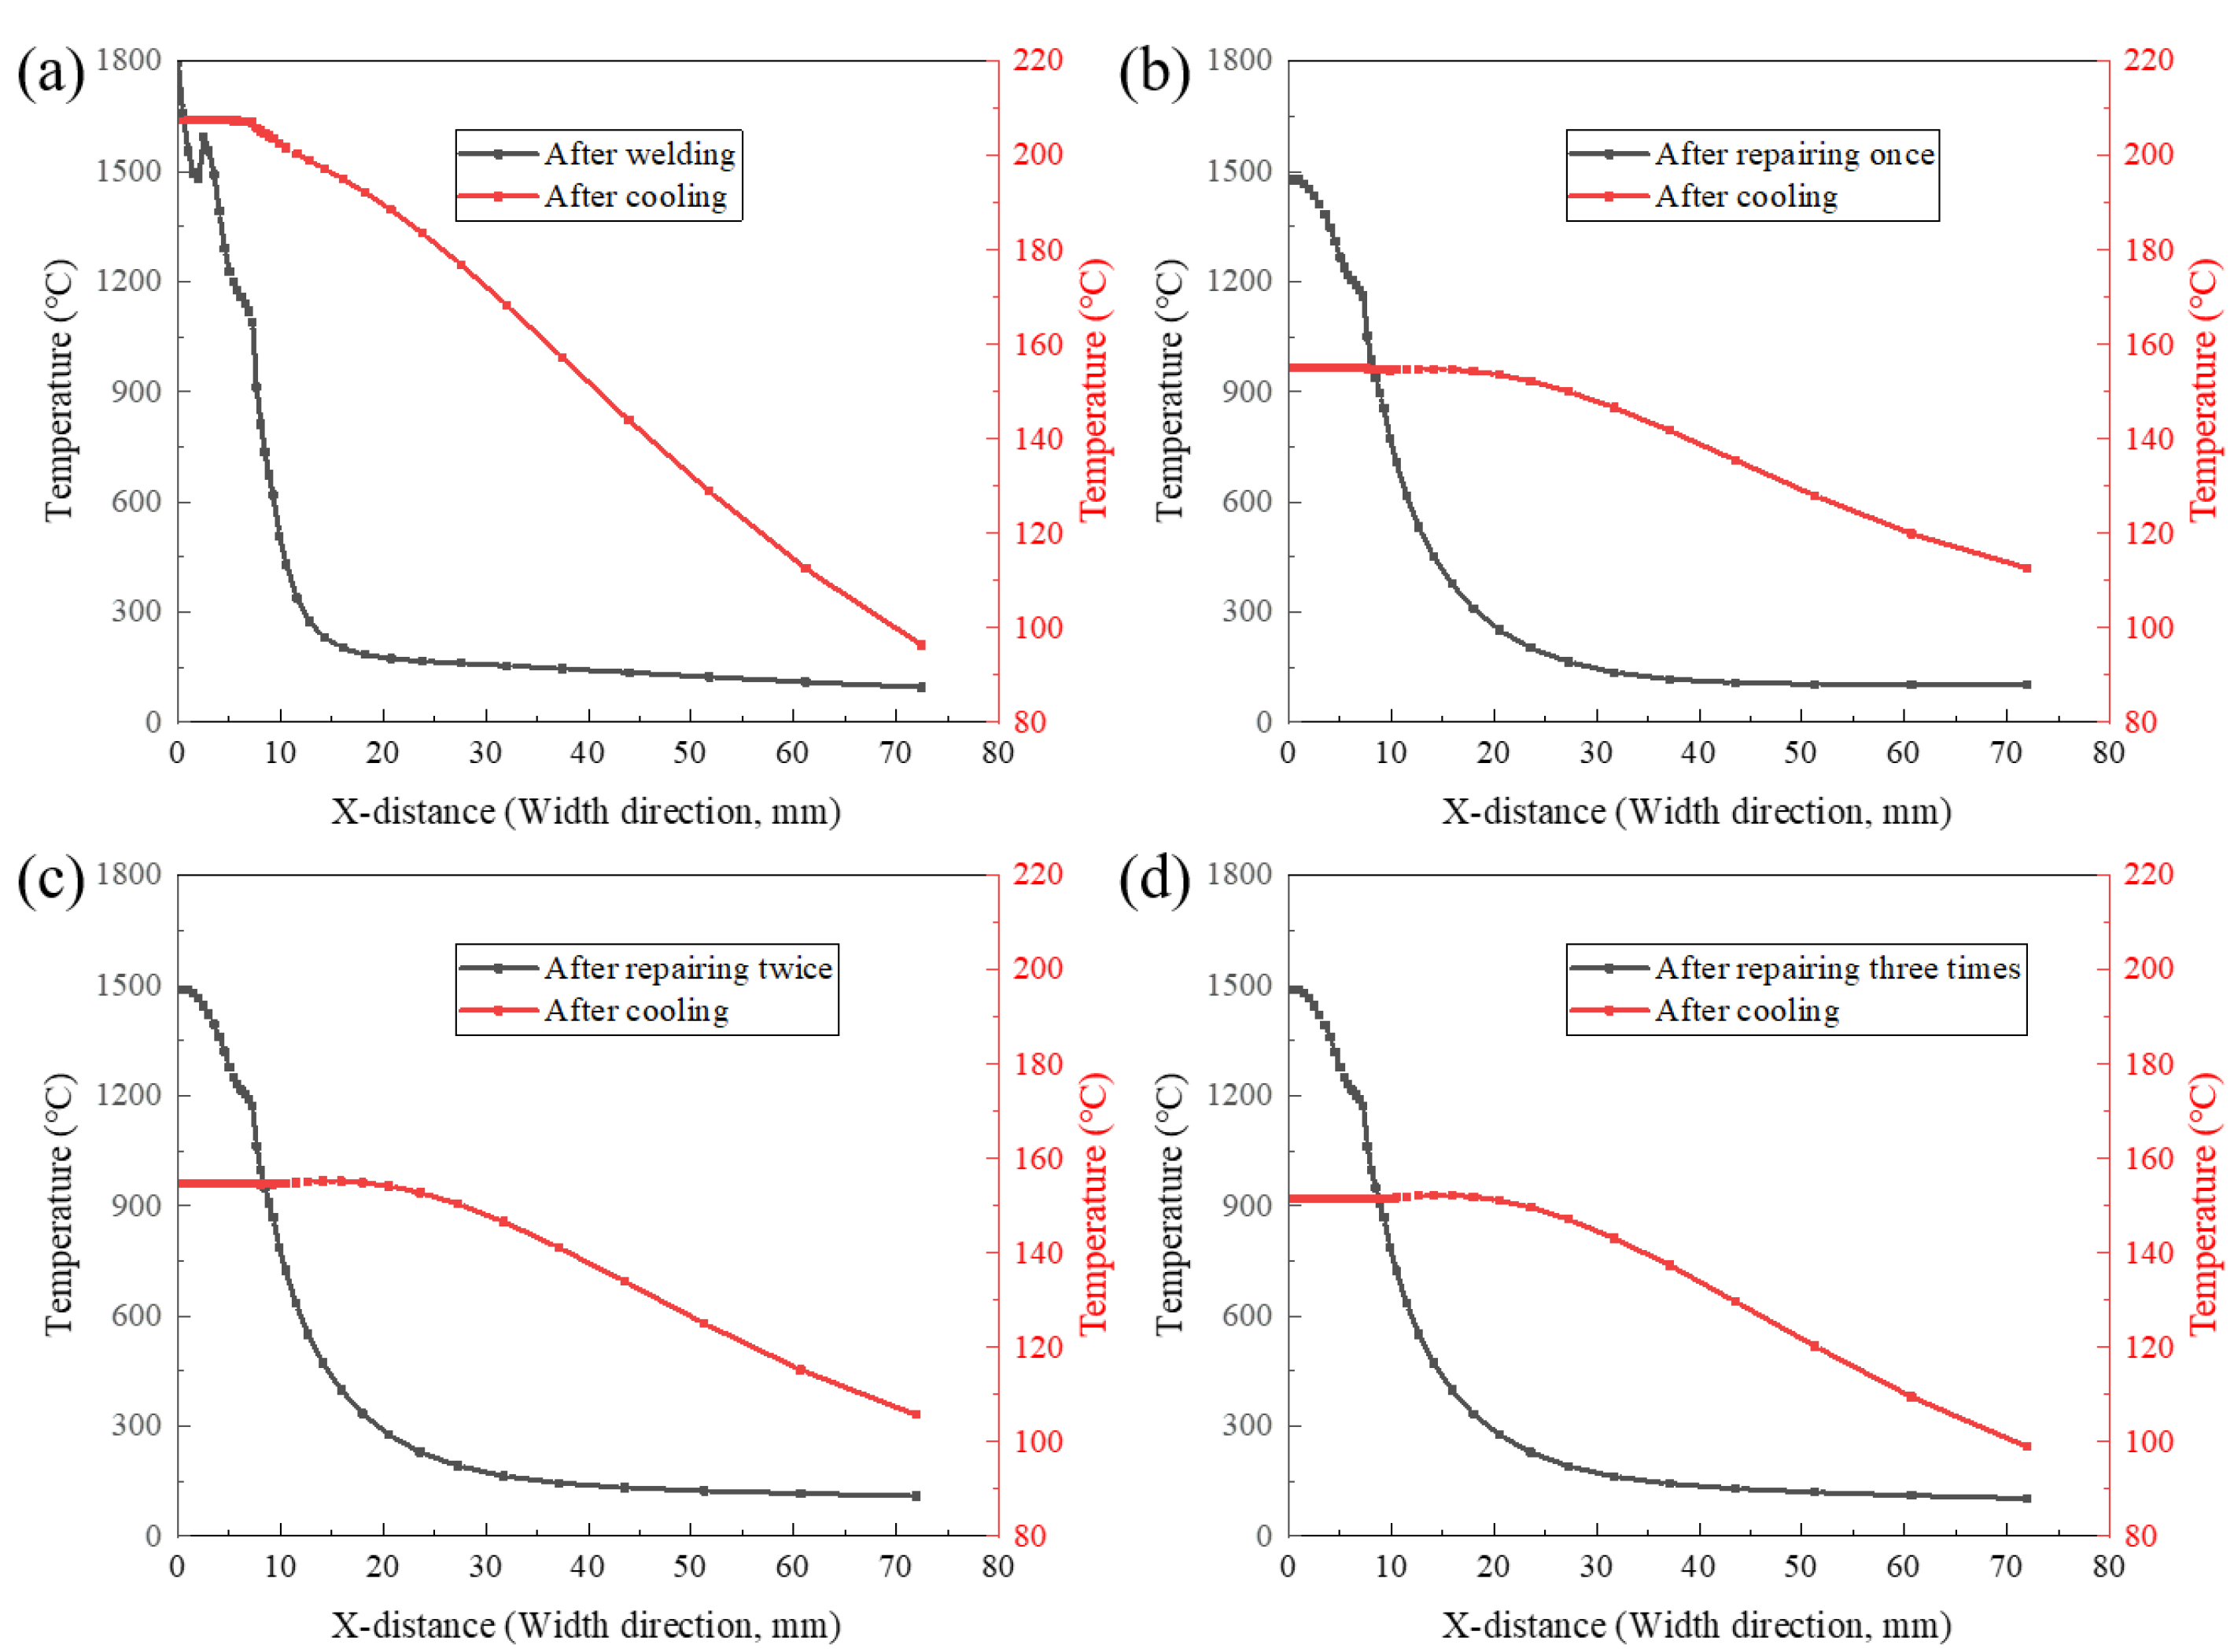
3.4. Temperature Distribution
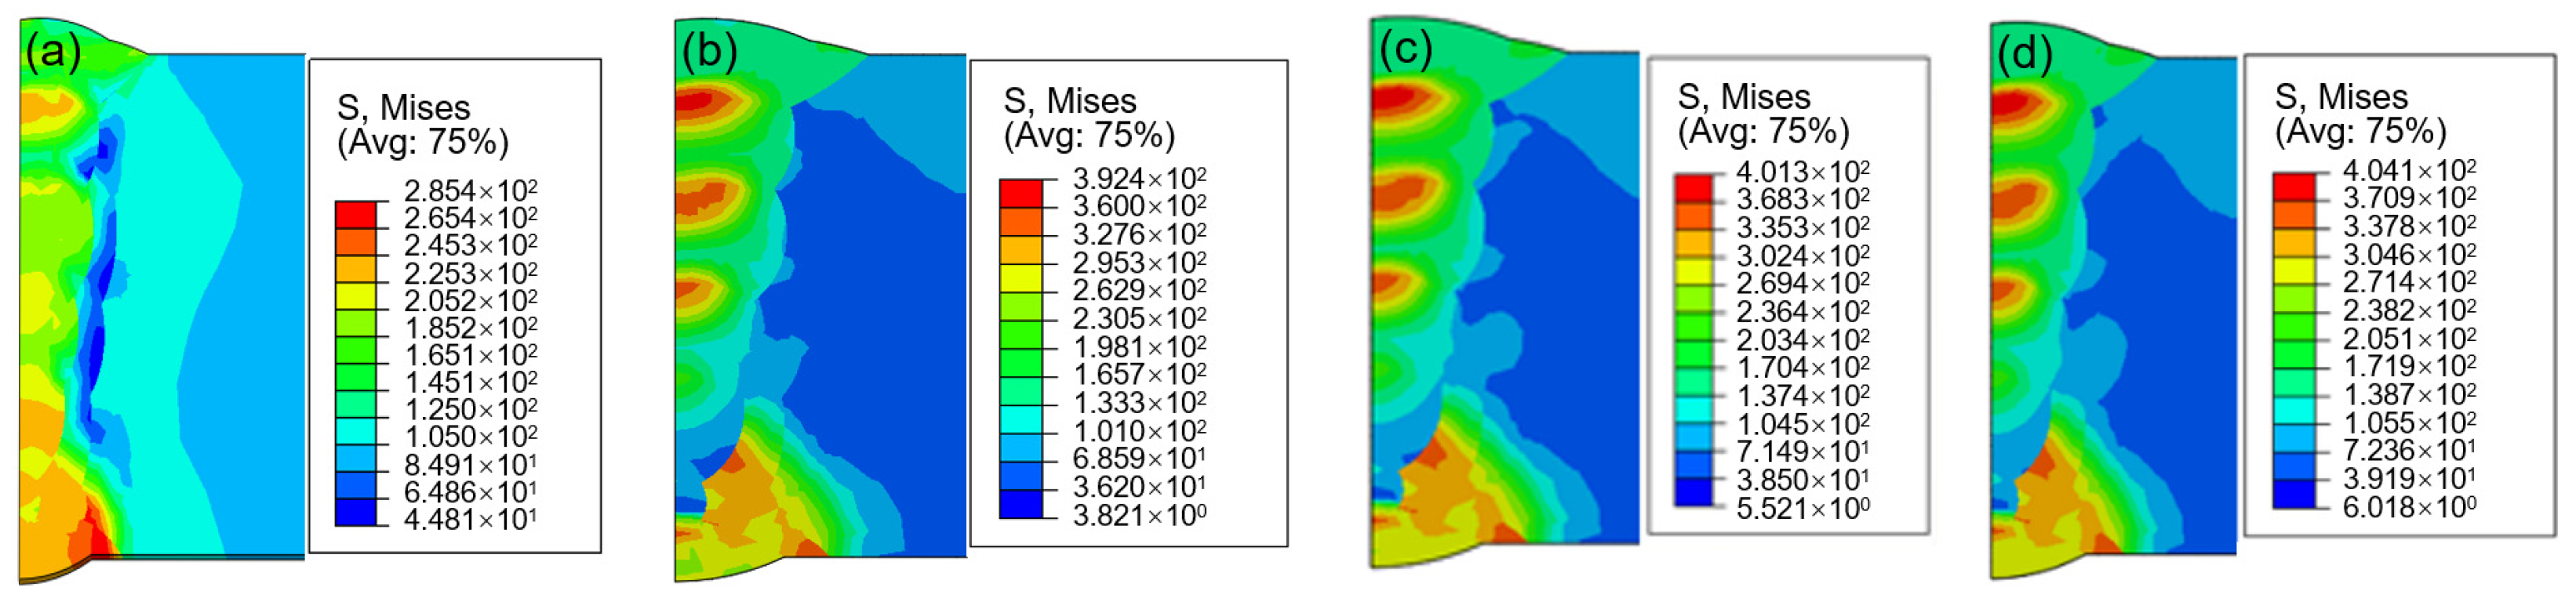
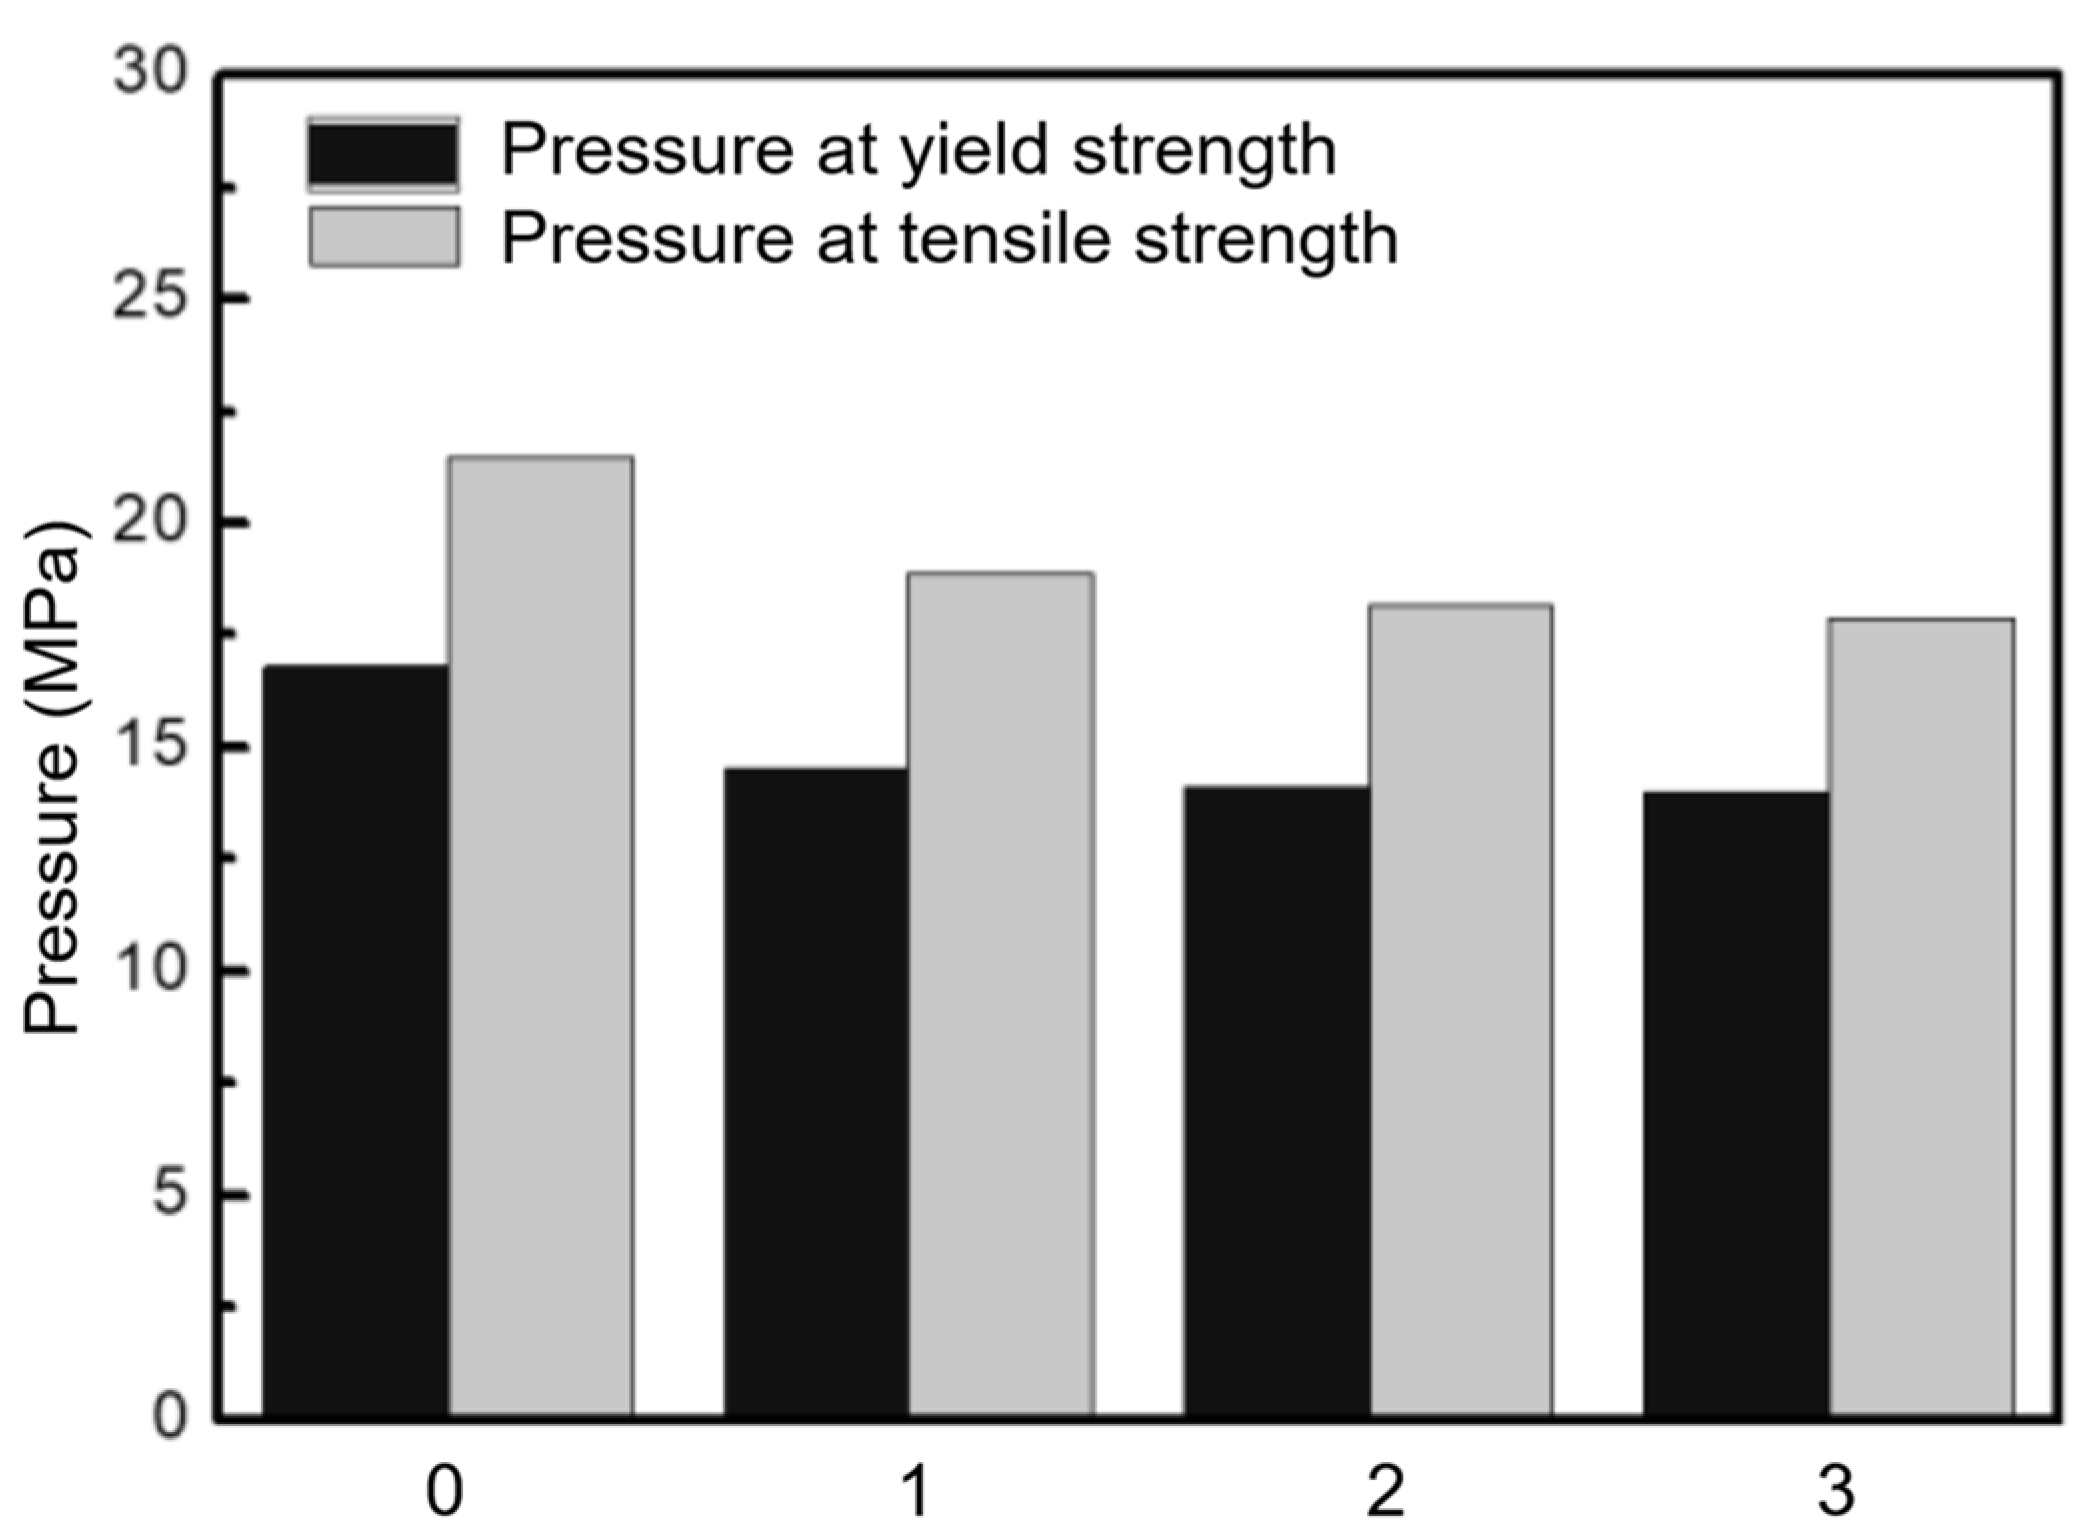
3.5. The Distribution of the Stress Field and Loading Capacity
4. Conclusions
- (1)
- The microstructure of the weld joint remained unchanged across different repair iterations. However, the toughness, optimized by the welding heat input, diminished after three repairs due to grain growth from repeated thermal cycles. Specifically, the impact toughness of the welding line, fusion line, and adjacent areas decreased significantly after three repairs, highlighting the importance of limiting the number of repairs.
- (2)
- The hardness of the weld joint decreased with repairs, and the dispersion of the hardness values increased. While multiple repairs could marginally enhance the hardness relative to the initial repair, the overall trend was a reduction in hardness, with the lowest values observed at the welding line.
- (3)
- The temperature distribution in the thickness direction of the welded joint showed a significant gradient, with the highest temperature found on the upper surface (about 1800 °C) and the lowest on the lower surface (about 510 °C).
- (4)
- The maximum residual stress after repair was found in the filling welding layer and increased with the number of repairs. The loading capacity of the girth weld decreased significantly after the first repair (by 12.1%) and continued to decrease with additional repairs (15.3% after the second repair and 16.7% after the third repair). This indicated that the first repair had the most significant impact on the loading capacity, and subsequent repairs further reduced it.
Author Contributions
Funding
Data Availability Statement
Conflicts of Interest
References
- Savari, A. Crack assessment in spiral-welded pipelines repaired by composite patch: A SMART and failure assessment diagram approach. J. Pipeline Sci. Eng. 2024, 5, 100222. [Google Scholar] [CrossRef]
- Alves, D.T.S.; Alves Lima, G.B. Establishing an onshore pipeline incident database to support operational risk management in Brazil-Part 2: Bowtie proposition and statistics of failure. Process Saf. Environ. Prot. 2021, 155, 80–97. [Google Scholar] [CrossRef]
- Wang, B.; Liu, Q.; Feng, Q.S.; Wang, X.; Yang, Z.; Dai, L.; Huo, X.; Wang, D.; Yu, J.; Chen, J. Influence of welding defects on hydrogen embrittlement sensitivity of girth welds in X80 pipelines. Int. J. Electrochem. Sci. 2024, 19, 100661. [Google Scholar] [CrossRef]
- Vega, O.E.; Hallen, J.M.; Villagomez, A.; Contreras, A. Effect of multiple repairs in girth welds of pipelines on the mechanical properties. Mater. Charact. 2008, 59, 1498–1507. [Google Scholar] [CrossRef]
- API Standard 1104; Welding of Pipelines and Related Facilities. American Petroleum Institute: Washington, DC, USA, 2005.
- Bouchard, P.J.; George, D.; Santisteban, J.R.; Bruno, G.; Dutta, M.; Edwards, L.; Kingston, E.; Smith, D. Measurement of the residual stresses in a stainless-steel pipe girth weld containing long and short repairs. Int. J. Press. Vessel. Pip. 2005, 82, 299–310. [Google Scholar] [CrossRef]
- Kollár, D. Numerical modelling on the influence of repair welding during manufacturing on residual stresses and distortions of T-joints. Results Eng. 2023, 20, 101535. [Google Scholar] [CrossRef]
- Chen, Z.H.; Wang, P.; Wang, H.H.; Xiong, Z. Thermo-mechanical analysis of the repair welding residual stress of AISI 316L pipeline for ECA. Int. J. Press. Vessel. Pip. 2021, 194 Pt B, 104469. [Google Scholar] [CrossRef]
- DNV-ST-F101; Submarine Pipeline Systems. DNV AS: Porsgrunn, Norway, 2021.
- GB/T 50369; Code for Construction and Acceptance of Oil and Gas Long-Distance Pipeline Engineering. China National Standardization Administration: Beijing, China, 2014.
- Moeinifar, S.; Kokabi, A.H.; Hosseini, H.R.M. Effect of tandem submerged arc welding process and parameters of Gleeble simulator thermal cycles on properties of the intercritically reheated heat affected zone. Mater. Des. 2011, 32, 869–876. [Google Scholar] [CrossRef]
- Vitasek, M. Multiple repairs of circumferential welded joints in gas pipelines. Weld. Int. 1989, 3, 168–172. [Google Scholar] [CrossRef]
- Vega-Becerra, O.; Galván-Martínez, R.; Hernández-Mejía, S.L.; Contreras-Cuevas, A. Residual stress assessment of multiple welding repairs of girth welds in pipeline used in oil industry. Mater. Sci. Forum 2014, 793, 93–104. [Google Scholar] [CrossRef]
- Dai, P.Y.; Wang, Y.F.; Li, S.; Lu, S.; Feng, G.; Deng, D. FEM analysis of residual stress induced by repair welding in SUS304 stainless steel pipe butt-welded joint. J. Manuf. Processes 2020, 58, 975–983. [Google Scholar] [CrossRef]
- Keivani, R.; Jahazi, M.; Pham, T.; Khodabandeh, A.R.; Afshar, M.R. Predicting residual stresses and distortion during multisequence welding of large size structures using FEM. Int. J. Adv. Manuf. Technol. 2014, 73, 409–419. [Google Scholar] [CrossRef]
- Huang, X.G.; Liu, H.H.; Huang, C.; Cui, J.; Xiao, Z.; Zhu, X. Creep relaxation to relieve residual stress in girth-butt welded X80 pipelines: Simulation and experiment. Thin-Walled Struct. 2024, 205 Pt C, 112597. [Google Scholar] [CrossRef]
- Fu, C.Z.; Tao, C.C.; Huang, H.J.; Zhou, G.; Lin, X.; Zhang, H.; Chen, L.; Yuan, X. Exploring microstructure evolution and machine-learning methods based on SCAT-CIWOA-BP-DMM theory during hot deformation of 56Ni–32Ti–12Hf alloy. Intermetallics 2024, 171, 108342. [Google Scholar] [CrossRef]
- Zuo, Z.Y.; Ma, H.W.; Yarigarravesh, M.; Assari, A.H.; Tayyebi, M.; Tayebi, M.; Hamawandi, B. Microstructure; fractography, and mechanical properties of Hardox 500 Steel TIG-welded joints by using different filler weld wires. Materials 2022, 15, 8196. [Google Scholar] [CrossRef] [PubMed]


| C | Si | Mn | P | S | Cr | Mo | Ni | Nb | V | Ti | Cu | Al |
|---|---|---|---|---|---|---|---|---|---|---|---|---|
| 0.05 | 0.21 | 1.84 | 0.013 | 0.002 | 0.28 | 0.28 | 0.056 | 0.078 | 0.026 | 0.016 | 0.062 | 0.033 |
| Area | Welded | Repaired Once | Repaired Twice | Repaired Three Times |
|---|---|---|---|---|
| WZ | 25 | 25 | 29 | 27 |
| HAZ | 27 | 44 | 43 | 29 |
| BM | 8 | 39 | 24 | 40 |
Disclaimer/Publisher’s Note: The statements, opinions and data contained in all publications are solely those of the individual author(s) and contributor(s) and not of MDPI and/or the editor(s). MDPI and/or the editor(s) disclaim responsibility for any injury to people or property resulting from any ideas, methods, instructions or products referred to in the content. |
© 2025 by the authors. Licensee MDPI, Basel, Switzerland. This article is an open access article distributed under the terms and conditions of the Creative Commons Attribution (CC BY) license (https://creativecommons.org/licenses/by/4.0/).
Share and Cite
Li, L.; Zhu, L.; Yan, X.; Jia, H.; Xie, S.; Zou, Y. The Impact of Weld Repairs on the Microstructure and Mechanical Integrity of X80 Pipelines in Oil and Gas Transmission. Processes 2025, 13, 512. https://doi.org/10.3390/pr13020512
Li L, Zhu L, Yan X, Jia H, Xie S, Zou Y. The Impact of Weld Repairs on the Microstructure and Mechanical Integrity of X80 Pipelines in Oil and Gas Transmission. Processes. 2025; 13(2):512. https://doi.org/10.3390/pr13020512
Chicago/Turabian StyleLi, Lifeng, Lixia Zhu, Xiangzhen Yan, Haidong Jia, Shuyi Xie, and Yangfan Zou. 2025. "The Impact of Weld Repairs on the Microstructure and Mechanical Integrity of X80 Pipelines in Oil and Gas Transmission" Processes 13, no. 2: 512. https://doi.org/10.3390/pr13020512
APA StyleLi, L., Zhu, L., Yan, X., Jia, H., Xie, S., & Zou, Y. (2025). The Impact of Weld Repairs on the Microstructure and Mechanical Integrity of X80 Pipelines in Oil and Gas Transmission. Processes, 13(2), 512. https://doi.org/10.3390/pr13020512