Abstract
Cold forming offers high dimensional accuracy, energy and cost efficiency in the mass production of highly stressed components but is also associated with high tribological loads. Complex lubrication systems are required to ensure smooth production. As environmental standards rise, traditional zinc phosphate-based lubricants are to be replaced by less harmful single-layer systems. However, these new lubricants are temperature-sensitive, which requires precise knowledge of the temperatures in the forming zone for optimal design. Due to high compressive stress, conventional measuring methods cannot measure temperatures directly in the forming zone. In this work, lubricants are expanded into a temperature sensor using thermochromic pigments so that temperatures can be measured directly in the forming zone. This work outlines the selection and integration of the indicators, the development of a calibration method for thermochromic lubricants to characterize the correlation between colour value and temperature. It is shown that the lubricant behaviour does not deteriorate up to concentrations of 10%. The transfer of the measurement methodology from the laboratory application to the industrial multi-stage process has been successfully implemented and local temperature peaks are measured directly in the contact zone and correspond to the simulation results. The results of the work show an approach to closing the gap identified in existing research work, namely that the temperature cannot be measured directly in the forming zone during cold forging. The measuring system developed can be transferred to various processes in the future and contribute to the identification of correlations between temperature, lubricant failure and wear.
1. Introduction
In the production of large series, the energy input and material consumption are decisive factors for the acceptance and competitiveness of a manufacturing process [1]. Cold forming, in particular, allows maximum material utilization in the production of high-load components in large quantities, which is reflected in high dimensional and shape accuracy [1]. This means that reworking is often no longer necessary, and resources are optimally utilized. As a result, maximum material utilization with a minimum specific energy weight per finished part weight is possible using cold forming [1]. Forming at room temperature is accompanied by high tribological loads in the form of normal contact stresses of up to 3000 N/mm2 and surface enlargements of up to a factor of 9 [2,3]. Complex lubricant systems are necessary to ensure fault-free and reliable production despite the high tribological loads. Since Singer’s patent in 1934, lubricant systems with conversion carrier layers made of zinc phosphate in combination with reactive soaps have been state of the art [4]. In addition to disadvantages from a process engineering point of view when applying the coatings and cleaning the components, zinc phosphate coatings result in high water and chemical consumption, as well as environmentally harmful phosphate sludge [5]. In addition, the energy-intensive phosphate baths and the high disposal costs must be questioned in terms of environmental impact and cost-effectiveness [6]. Bay et al. provides an overview of the development of alternative lubricant systems to achieve zinc phosphate-free metal forming [2]. Phosphate layer-based systems can be replaced by newly developed single-layer lubricant systems. These combine the conversion layer and lubricant layer in one system [6]. The coefficients of friction and failure limits of the newly developed systems are highly temperature-dependent [2,7]. In order to design the systems for the optimum temperature range, precise knowledge of the temperatures and conditions occurring in the contact zone of the cold forging process is essential. However, up to now, industrial cold forming processes have mainly been controlled from a relatively large distance using displacement and force measurements, which should lie within certain envelope curves [8].
Investigations into temperature distribution are primarily carried out on a scientific basis. In various studies, attempts have been made to determine the temperature, heat conduction and heat transfer in the contact zone of solid forming processes. Nashma and Jeswiet use thermocouples inserted into the die at different distances to determine the temperature at the die–workpiece interface [9]. These data can be used to determine heat transfer coefficients, which can be used to draw conclusions about the temperature [9]. Lenard and Devies also used thermocouples in the mould and on the surface to identify the temperature in the interface and point out that an exact, direct measurement is difficult, and recommend estimating the temperature via temperature measurements in the mould [10]. Grötzinger showed that temperature measurement using thin-film sensors on the die close to the forming zone is possible, but that the force sensitivity of the sensor represents a challenge [11]. In addition, Serajzadeh uses a finite element analysis coupled with neural networks to predict the temperature curve during hot forging [12]. Qin et al. also used thermomechanical finite element simulation combined with heat transfer analyses to determine the temperature distribution [13]. Kim et al., Undav et al. and Petrov et al. also estimate the temperature distribution during cold forming using inverse FEM simulations [14,15,16]. The heat transfer coefficient of the interface (IHTC) plays an important role in estimating the temperature. This is primarily estimated. Chang and Bramley investigated it with inserted thermocouples and compared the experimental measurement data with FEM simulations [17]. Malinowski et al. also carried out an inverse estimation of the IHTC by comparing FEM data with experimentally measured data [18]. The focus was on time, temperature and pressure [18]. No temperature measurements were carried out directly in the contact zone in any of the investigations. Only temperature sensors were attached as close as possible to the forming zone and heat transfer coefficients and the temperature distribution were estimated using inverse methods. Measuring the temperature distribution directly in the forming zone is the missing link for validating and optimizing existing models. In addition, short-term temperature peaks, which are assumed to occur in the forming zone and can lead to lubricant failure, cannot be detected by FEM simulation and thermocouples approximated to the forming zone. Function-enhanced lubricants that use irreversible thermochromic colour pigments to measure the temperature at the interface between the tool and the workpiece offer a solution to this problem [8]. The lubricant mixed with thermochromic pigments is located directly in the forming zone and can record the temperatures there by means of a temperature-dependent colour change [19]. A calibration method must be developed to calibrate and interpret the temperature-dependent colour change. The aim of this paper is to develop a test methodology for the temperature calibration of thermochromic indicators so that a precise understanding of temperature and the associated colour change can be established. Furthermore, suitable indicators are to be identified and evaluated with regard to their possible use as sensory lubricants in cold forging. Finally, the measurement system is transferred to an industrial process and analyzed.
Characterization of Lubricant Systems in Cold Forging
According to Volz et al., the less harmful single-layer lubricants show no disadvantages compared to lubricant systems based on zinc phosphate layers with regard to friction coefficients in the sliding compression test [20]. When used in a multi-stage process, however, the conversion layer-free lubricant systems show clear disadvantages [21]. The investigations by Groche et al. showed that the conversion layer-free lubricant systems used (polymer and salt wax) are not able to maintain a sufficient lubricating effect across all process stages [7]. Studies in various research papers show that the coefficients of friction of polymer and salt wax lubricants decrease up to a temperature of 200 °C, before there is a sharp increase in the coefficients of friction above 200 °C, and thus a drop in performance or failure of the systems [7,21,22]. In contrast, zinc phosphate coatings, which are still mostly used in cold forging, are stable up to 600 °C [23]. In order to ensure error-free production and to be able to optimize the design of the lubrication systems used, process monitoring is necessary in cold forming [6,8]. Conventionally, if at all, only the process forces and tool paths are monitored using envelope curves [8]. The process events are only observed inaccurately from a distance [8]. Conventional process monitoring is particularly inadequate for the new, highly temperature-dependent single-layer lubrication systems [7]. The temperature in the contact zone depends largely on the temperatures occurring in the tribo-contacts. The micro-contacts from which the wear and friction processes originate are referred to as tribo-contacts. The temperature increases are characterized by a volume-related heating of the contact partners and a sudden rise in temperature in the micro-contacts. Griffioen, Bair and Winer (1986) were able to measure flash temperatures in the range from a few μs up to 2700 °C using an infrared radiation temperature measurement [24]. Experimental temperature measurement in the contact zone of tribological systems is difficult. Besides the limited accessibility of the contact zone, a further challenge is given by the unintended influences and changes in the tribological system when measuring instruments are placed in the contact zone [25]. Temperature monitoring in the contact zone during cold forging has so far only been possible indirectly and by approaching the contact zone. For example, temperatures of 300–350 °C have been measured in various studies by inserting thermocouples into the die or punch [3,26]. Due to the distance, the actual temperatures occurring in the forming zone can only be estimated. It is assumed that the temperature peaks are in the range of 500 °C to 600 °C [26,27]. One possible approach to measuring temperatures directly in the forming zone is offered by intelligent lubricants, using thermochromic indicators integrated into the lubricant system [6,8]. The indicators must be irreversible so that they record the maximum temperature in the forming zone and can be analyzed afterwards. Thermochromic indicators are based on so-called thermochromism [19]. Thermochromism describes the change in colour as a function of temperature. The colour change can be irreversible or reversible and can occur abruptly or continuously with temperature [19]. Thermochromic properties can occur in monomers, polymers, organic or inorganic compounds or single-component or multi-component systems [19]. The change in the optical appearance is caused by a change in the light reflection, absorption or scattering properties due to a chemical change in state [19]. Precise knowledge of the relationship between temperature and colour is necessary to clearly determine temperatures using thermal indicators. Sensory lubricants for temperature detection are created by adding thermochromic indicators to the lubricant systems used in cold forging. Initial work by Volke and Zang shows that temperature measurement in the contact zone using lubricants mixed with thermochromic indicators is possible in principle [28,29]. In addition to the selection and integration into the lubricant, the calibration of the sensory lubricant is essential.
2. Materials and Methods
2.1. Development of a Standardized Test Method for the Calibration of Thermochromic Indicators
In the initial step, suitable thermochromic indicators are selected and incorporated into a salt wax lubricant, which serves as the example lubricant system. To be used as thermochromic indicators in cold forging, these substances must meet specific requirements derived from the cold forging process itself. During this process, peak temperatures of up to 500 °C are reached within process times of around 1 s [3]. The thermochromic indicators must be capable of capturing and documenting these peak temperatures. Therefore, they require a fast response time of approximately 1 s and the ability to cover the temperature range up to 500 °C. Since direct optical evaluation of the colour changes is not feasible due to limited access to the forming zone, the evaluation has to be carried out after the forming process. However, during this time, the workpieces cool down further. To ensure that the peak temperature is permanently recorded, the colour changes in the indicators must be irreversible. Additionally, the colour change must be distinctly different from the initial colour of the lubricant to allow for clear differentiation. The indicators are mixed into a salt wax-based lubricant, which is applied to the workpieces in an aqueous dispersion. Therefore, it is advantageous for the indicator to be water-soluble. Moreover, since cold forging operates under high tribological loads requiring complex lubrication systems, the indicators must not negatively affect the lubricant’s performance, ensuring the forming process remains safe and reliable.
In summary, the thermochromic indicators must fulfil the following requirements for use in cold forming:
- Solubility in water (solubility in salt wax lubricant);
- No impairment of the lubricating effect;
- Response time in the range of one second;
- Irreversible colour change;
- Homogeneous distribution in the lubricant;
- Clear differentiation between colour before and after colour change;
- Temperature range up to 500 °C.
The main thermochromic indicators are liquid crystals, leuco dyes and colour pigments. Liquid crystals and leuco dyes are only suitable to a limited extent due to their maximum application temperature of 500 °C, as they cannot fully fulfil the requirements for cold forming. Only colour pigments come into question as indicators, as these cover the desired temperature range. From a large number of possible indicators, three colour pigments were identified that meet the requirements: the colour pigments napthol-as-red (indicator 1), pyrazolo-chinazolon (indicator 2) and yellow iron oxide (indicator 3).
2.2. Measurement Setup for Calibrating the Thermochromic Sensory Lubricants
A test methodology is being developed to check the suitability of the sensory lubricants and to calibrate them. This is intended to investigate and document the colouristic behaviour of the indicators as a function of temperature. The essential aspects of the test methodology are the uniform heating to defined temperatures and the uniform evaluation of the resulting colours. The requirements for measuring and heating systems in cold forging are based on the process conditions, whereby short-term peak temperatures of up to 500 °C are assumed [3]. The process times are around one second, which means that the temperatures must also be reached within one second. In order to fulfil this requirement, the heating unit must be able to generate peak temperatures of 500 °C within one second. The temperature rise in the sample must be reproducible so that the temperature curves are sufficiently accurate. At the same time, it must be possible to document the temperature curves, so that the measuring methods used must also have response times of less than one second. In addition to the requirements resulting from cold forging, there are additional requirements resulting from metrological aspects. It must be possible to measure the temperature on the surface where the lubricant is applied, as the surface temperature is assumed to be the reference for the lubricant temperature. For a precise analysis of the temperature distribution, it is desirable to measure the temperature over the entire surface. In addition, a homogeneous temperature field should be formed in order to enable qualitative estimations regarding the uniform behaviour of the lubricant–indicator mixture. Furthermore, it would be desirable if the unit could be controlled and regulated via temperature sensors. Accordingly, it should also be possible to integrate the measurement technology into a control unit. Based on the list of requirements, various options were evaluated, and the final decision was made in favour of induction heating. Step 1 in Figure 1 shows the test setup for heating. This consists of the inductor (TruHeat 5040 MF, TRUMPF, Ditzingen, Germany), the induction coil (Trumpf Hüttinger, Freiburg im Breisgau, Germany), the sample holder (Brandenburger Isoliertechnik GmbH & Co. KG, Landau in der Pfalz, Germany) and the fixtures for temperature measurement. The sample holder ensures repeatable positioning of the sample in the induction coil. Two induction coils are used for precise calibration. The single-coil inductor can be used to set a defined temperature curve over the test length, the evaluation of which is explained in more detail below. With inductor 2, a homogeneous temperature range can be applied over the sample surface so that the correlations between temperature and colour determined with inductor 1 can be specifically validated. The insulation prevents heat conduction into the surrounding components, so that the heat energy introduced remains in the sample and repeatable heating is ensured. A thermal camera (ThermoView® TV40, Fluke, Glottertal, Germany) and a pyrometer (Endurance®, Fluke, Glottertal, Germany) are used to determine the temperature. The thermal camera can be used to determine the entire temperature gradient during heating. The pyrometer is used to control the inductor so that specific temperatures can be controlled.
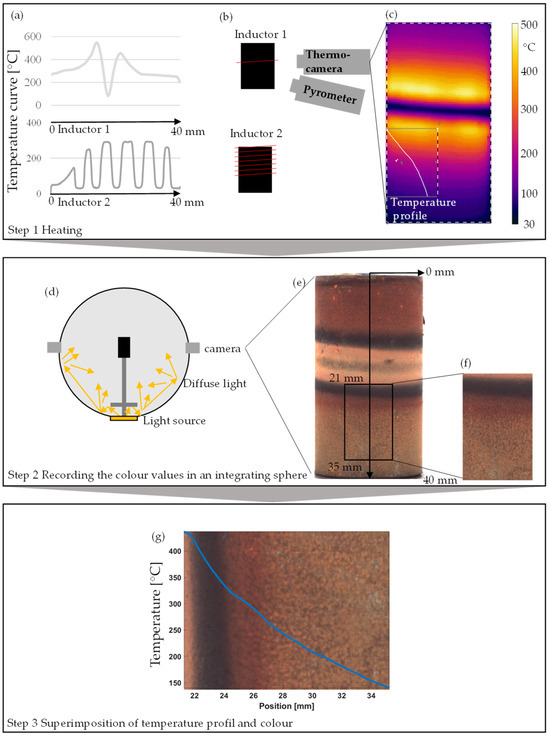
Figure 1.
Calibration principle: Step 1: Heating up with the schematic representation of the setup (a), the temperature curves associated with inductors (b) and the thermographic image of the sample (c). Step 2: Recording the colour values in an integrating sphere (d), colour image (e) with extracted section (f) Step 3: Superimposition of temperature profile and colour (g).
For precise documentation of the temperature distribution, one side of the test specimen is painted black, and the resulting temperature profile is measured with the thermal camera (emission coefficient = 1). Temperatures of 250 °C and 500 °C are controlled at the measuring point of the pyrometer. Heat conduction in the sample produces a surface temperature profile ranging from 100 to 500 °C, with the maximum temperatures visible for each pixel in the profile. The second side of the sample is coated with the sensory lubricant. After the test has been carried out, the side coated with the lubricant is digitized in an integrating sphere under conditions similar to standard light, which ensures uniform and constant illumination between the tests (Figure 1 Step 2). The fact that both sides have the same temperature curve means that direct conclusions can be drawn between the maximum temperature and colour curves by superimposing the temperature and colour curves in the software (ThermoView TV40, Fluke, Glottertal, Germany). To display the position on the sample, a coordinate system is implemented whose origin is in the centre of the sample (Figure 1 Step 3). From there, the straight distance to the lower end of the sample is 40 mm or 110 pixels. One pixel, therefore, corresponds to a length of 0.36 mm. The length can therefore be used to specify a position on the sample relative to the upper edge for each pixel. Due to the congruent positioning of the colour image and the thermal image, the start and end coordinates of the profile in the thermal image correspond to the same coordinates in the colour image. Accordingly, Matlab R2022b (MathWorks, Natick, MA, USA) uses the x-coordinates to extract an area from the colour image that corresponds to the x-coordinates of the profile. The area is enlarged in the y-direction to make the colours more visible (Figure 1). The temperature profile is then placed over the extracted section of the colour image in Matlabso that the colour transitions can be assigned to defined temperatures.
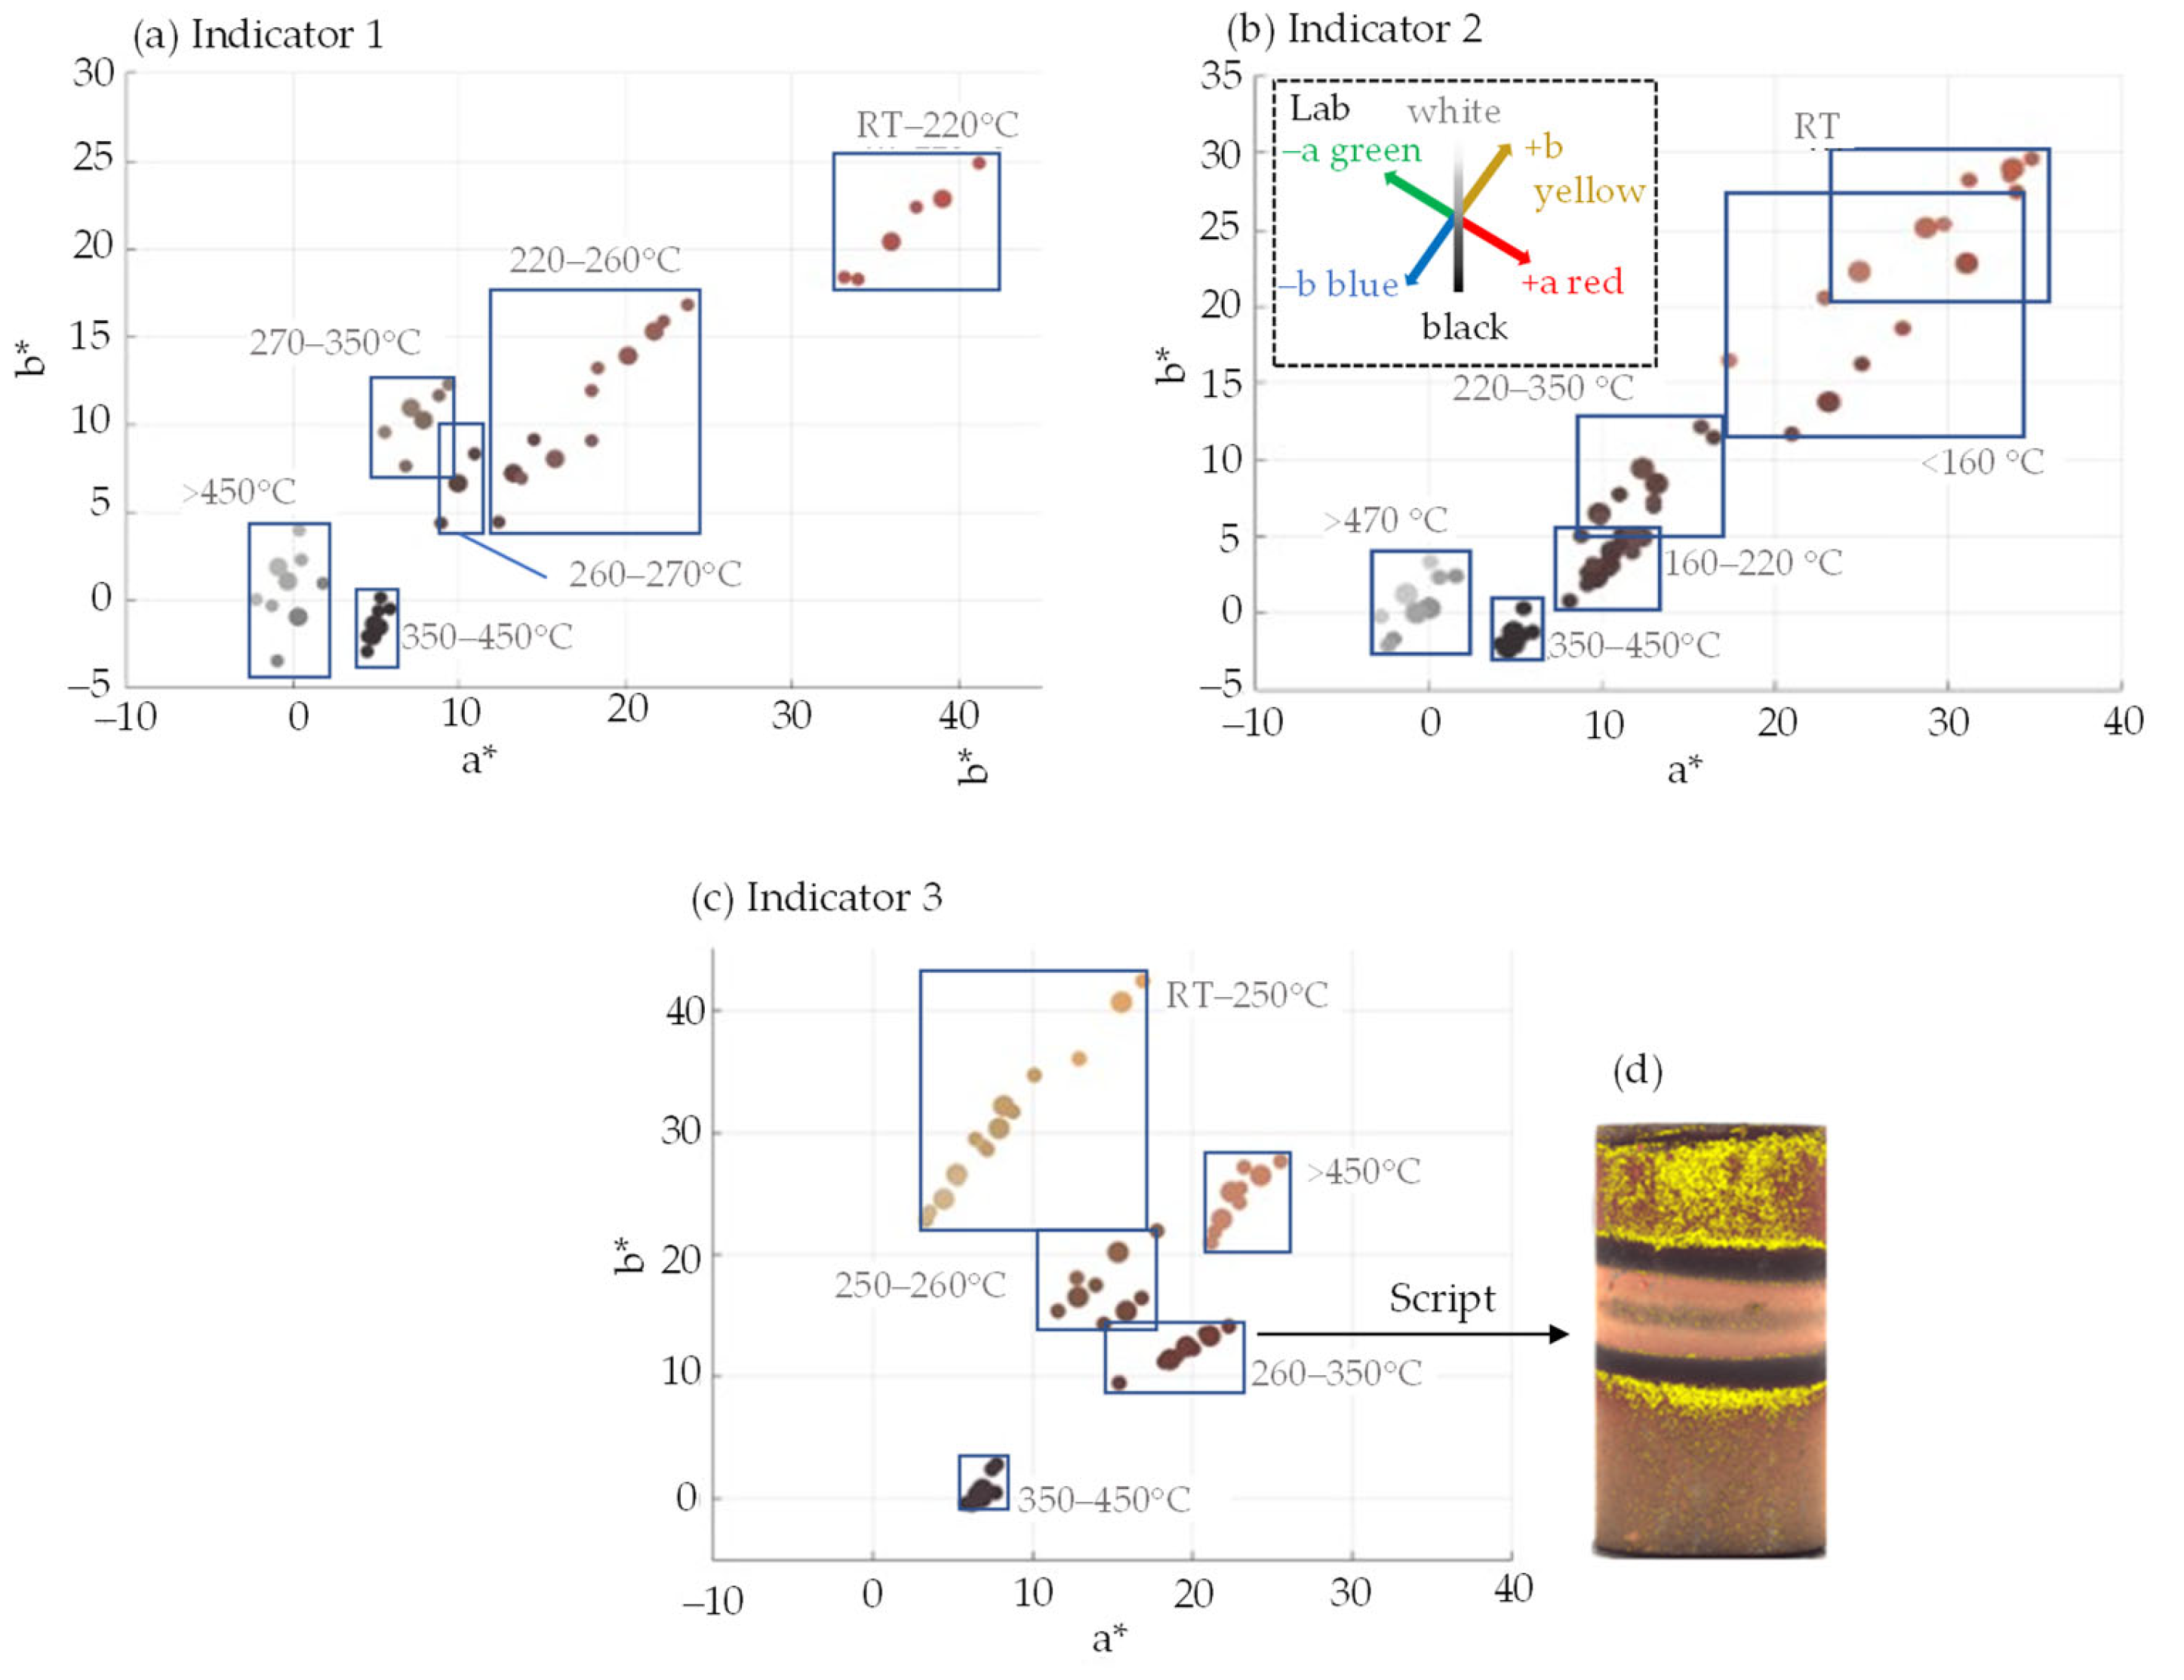
The measurement data are processed and interpreted in the Lab colour space. The Lab colour space is described by the brightness L* and the two colour components a* and b* (see Figure 2). a* stands for the green (−a)–red (+a) axis and b* for the blue (−b)–yellow (+b) axis. L* describes the brightness from 0 (dark) to 100 (light) and is also referred to as the neutral grey axis with the end points white (100) and black (0). Figure 2 shows the corresponding normalization data for the selected indicators (4% share). Colour values in the same temperature range are indicated by blue boxes. The boxes also show the evaluation range for defined temperature ranges. For the temperature evaluation of the samples in the sample process, it is checked whether the colour values of the individual pixels of the sample images can be assigned to a specific evaluation range after the transformation. If the colour values of the pixels match the defined evaluation ranges for the various indicators, the pixels are highlighted in yellow. By assigning the evaluation ranges to the temperatures, it is possible to deduce which temperature has occurred locally in the contact zone or on the sample surface.
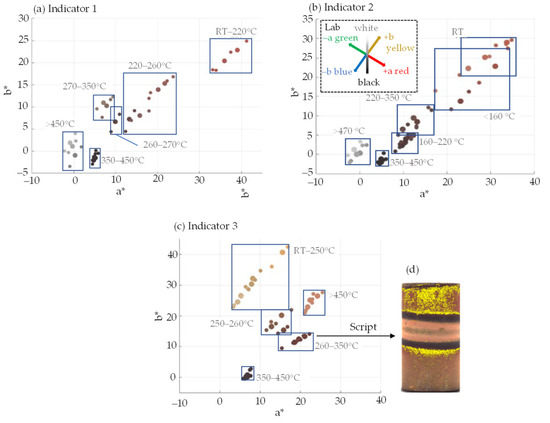
Figure 2.
Evaluation ranges for indicator 1 (a), indicator 2 (b) and indicator 3 (c), and evaluation applied to an example component (d).
3. Experiment Results
3.1. Influence of the Indicators on the Friction Coefficients
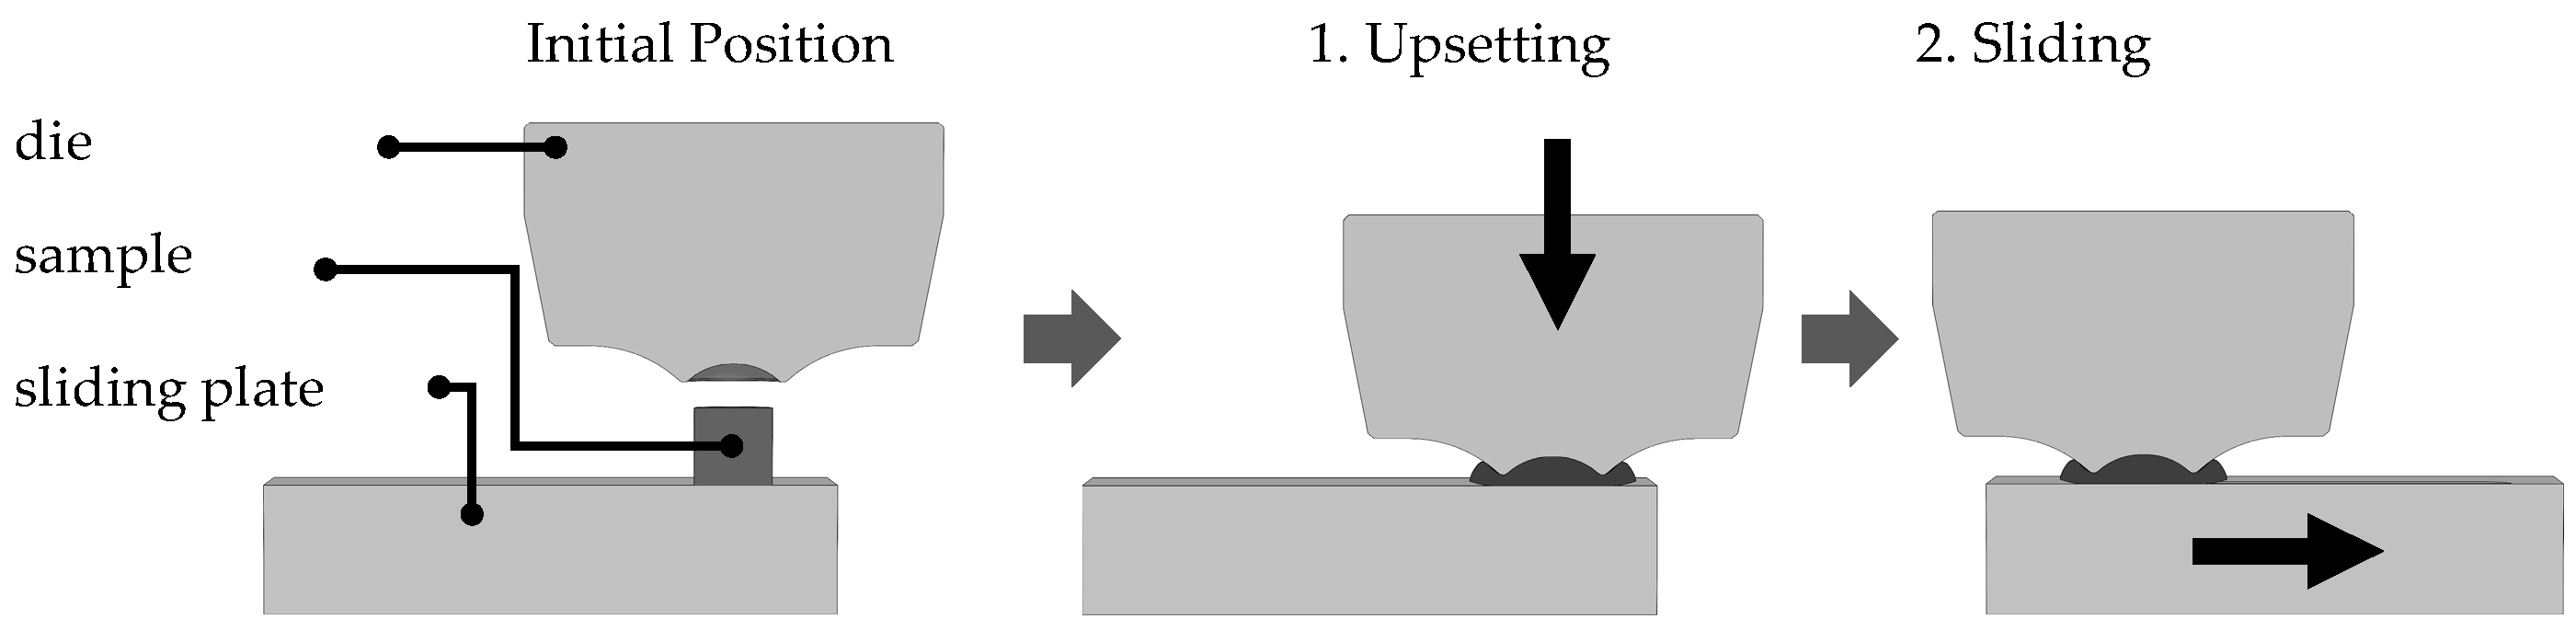
The influence of the indicators on the lubricant system is analyzed to ensure the safe use of the lubricant/indicator mixture in the forming process. The sliding compression test is used to determine the coefficients of friction (CoF) [4]. The sliding compression test separates the upsetting from the sliding, allowing highly variable load spectra to be applied (see Figure 3) [4]. In the first step, the punch upsets the sample until the desired normal contact stress between the sample and the sliding plate is reached and the corresponding surface enlargement of the sample is set. While maintaining the upsetting force, the sliding plate then moves under the sample, and thus generates a relative movement between the sample and the sliding plate. Force sensors are used to record the compression force and the sliding force over the test time and the coefficient of friction according to Coulomb is determined over the entire relative path by calculating the quotient of the sliding force and the normal force.

Figure 3.
Functional principle sliding compression test.
Table 1 shows the specified test parameters for the sliding compression test. All tests use 16MnCr5 specimens that have been blasted with S390 abrasive and then coated with a salt wax lubricant mixture. For all tests, the sliding distance is 60 mm, the sliding speed is 100 mm/s and the pressure speed is 1 mm/s.

Table 1.
Experimental parameters of the sliding compression test.
In the first series of tests, the extent to which the concentration of the thermochromic indicator can be increased without negatively influencing the tribological system was investigated. Indicator concentrations of up to 10 per cent by weight could be mixed homogeneously into the lubricant without causing agglomeration. Higher concentrations could not be mixed in homogeneously. An increase in the indicator concentration led to the improved opacity of the coating. To assess the effects on the tribological system, the coefficient of friction is used as the central evaluation parameter. The tests were carried out with the parameters listed in Table 1, with an additional contact normal stress of 1500 N/mm2 and a surface enlargement by a factor of 1.5. The results shown in Figure 4 show that the coefficient of friction up to an indicator concentration of 4% is within the range of the pure lubricant. From a concentration of 6%, the coefficient of friction increases slightly but not significantly. The results show that a maximum concentration of 4% should be adhered to.
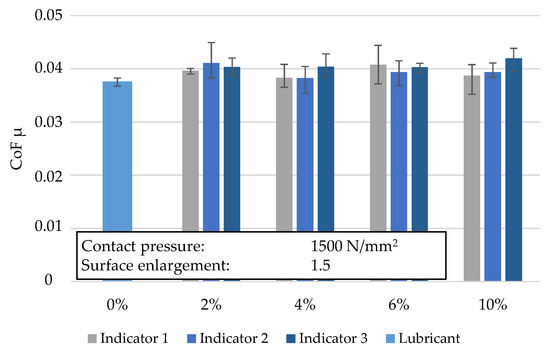
Figure 4.
Influence of the indicator concentration on the CoF (three replicates).
In a second series of tests, the friction properties of the indicators classified as suitable are analyzed. The indicators are each added to the lubricant in a proportion of 4%. The series of tests focusses on the influence of the contact pressure and the associated increase in surface area on the coefficients of friction. A set contact pressure of 1500 N/mm2 results in a surface enlargement of 1.5 (load spectrum 1). If the contact pressure is increased to 2500 N/mm2, a surface enlargement of 15 occurs (load spectrum 2). Figure 5 shows the average coefficients of friction over a sliding distance of 60 mm at a sliding speed of 100 mm/s. For the lubricant, the coefficient of friction is in the range of 0.04 for both load spectra. Only with indicator 1 does the coefficient of friction fall below 0.03 for load spectrum 1 and rise to 0.049 for load spectrum 2. For all others, the coefficients of friction with and without indicators are within the range of error dispersion, which means that the indicators have no negative influence on the friction behaviour. It can also be seen that the coefficient of friction increases with increasing surface area. The reason for this behaviour is presumably the greatly reduced lubricating film thickness when the lubricant is highly diluted. This assumption is confirmed by previous work by Volke, who shows that in the sliding compression test, the lubricant thinning increases with increasing compression force [29]. This could lead to the particle size of the indicator particles exceeding the remaining lubricant layer and the particles acting as wear bodies between the friction surfaces. This can lead to an increase in the coefficient of friction. In principle, the friction coefficients with and without indicators are within the range of error dispersion, which means that the indicators have no negative influence on the friction behaviour under the given load spectra.
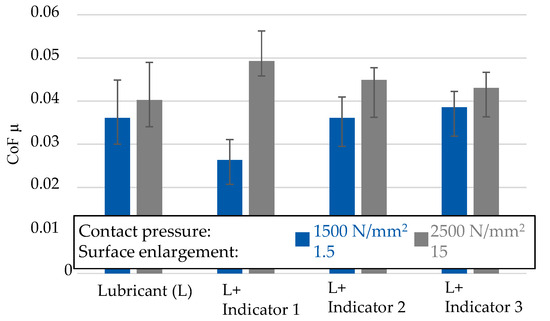
Figure 5.
Coefficients of friction as a dependence of the contact pressure (three replicates).
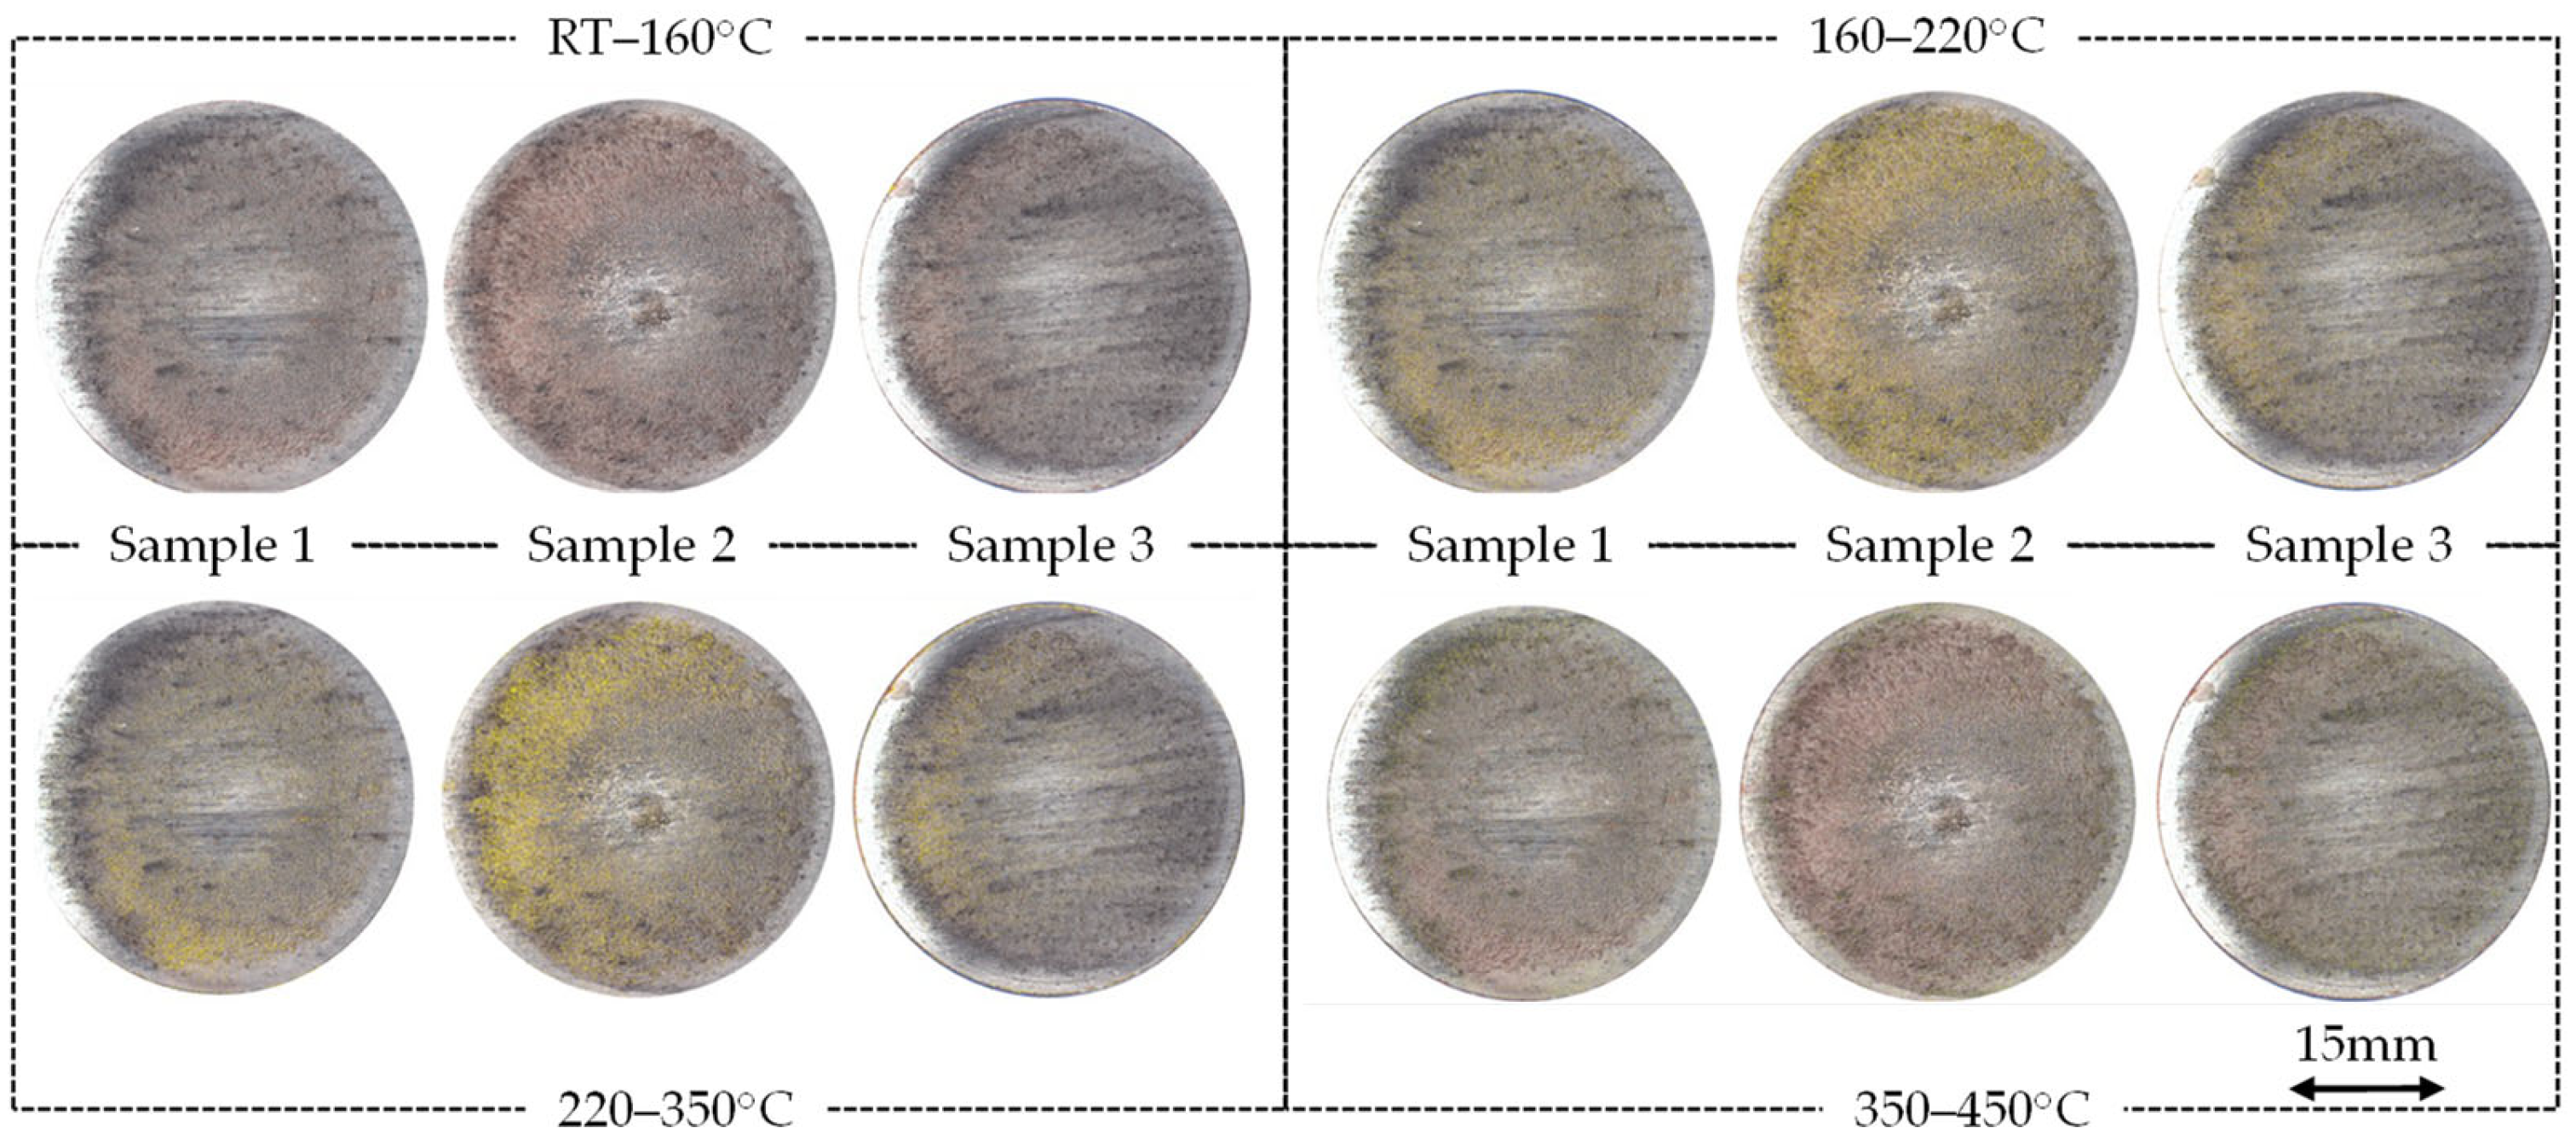
In addition to analyzing the coefficients of friction, the temperature-dependent colour values of the lubricant indicator mixtures used are evaluated on the sliding samples in accordance with the methodology described (Figure 6). Figure 6 shows three tests for Indicator 2, each of which was evaluated according to the temperature ranges. For this purpose, the contact surface of the sliding samples with the sliding plate is digitized in the integrating sphere. During the evaluation, it is noticeable that in large parts of the tests, very little lubricant with indicators remains on the surface of the sliding compression sample. One reason for this is that a lot of lubricant remains on the sliding plate after the tests when the sliding plate and sliding sample are separated. In addition, the total amount of lubricant is limited to the amount that was initially applied to the sample, so that the lubricant is also diluted via the sliding path. The small residual amount of the lubricant-indicator mixture is an indication of a strong thinning of the lubricating film. Due to the lack of lubricant on the sample surface, an evaluation is often not possible. The temperatures acting on the surface can be determined by looking at the colour values and assigning them to the evaluation ranges from the test method. The colour values can be assigned to the temperature ranges 160–220 °C and 220–350 °C. This means that at least 160 °C or 220 °C occurred in the marked areas. More pixels are marked for temperatures in the range 220 °C to 350 °C, meaning that 220 °C prevailed in a larger range. No colour values could be detected for temperatures below 160 °C and above 350 °C. FEM-based work by Volke and Zang shows a differentiated picture with regard to the temperature in the sliding compression test [29,30]. Depending on the estimated heat transfer coefficient, simulated temperatures in the range of 100 °C to 400 °C were determined [29,30]. In combination with the work of Zang and Volke, it can be deduced that the heat transfer coefficients are sensibly selected if the determined temperature is in the range of 160 to 350 °C [29,30].
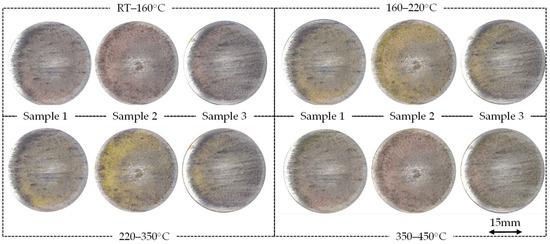
Figure 6.
Detected temperature of the samples after sliding (Contact pressure 1500 kN, sliding velocity 150 mm/s).
3.2. Application in Full Forward Extrusion
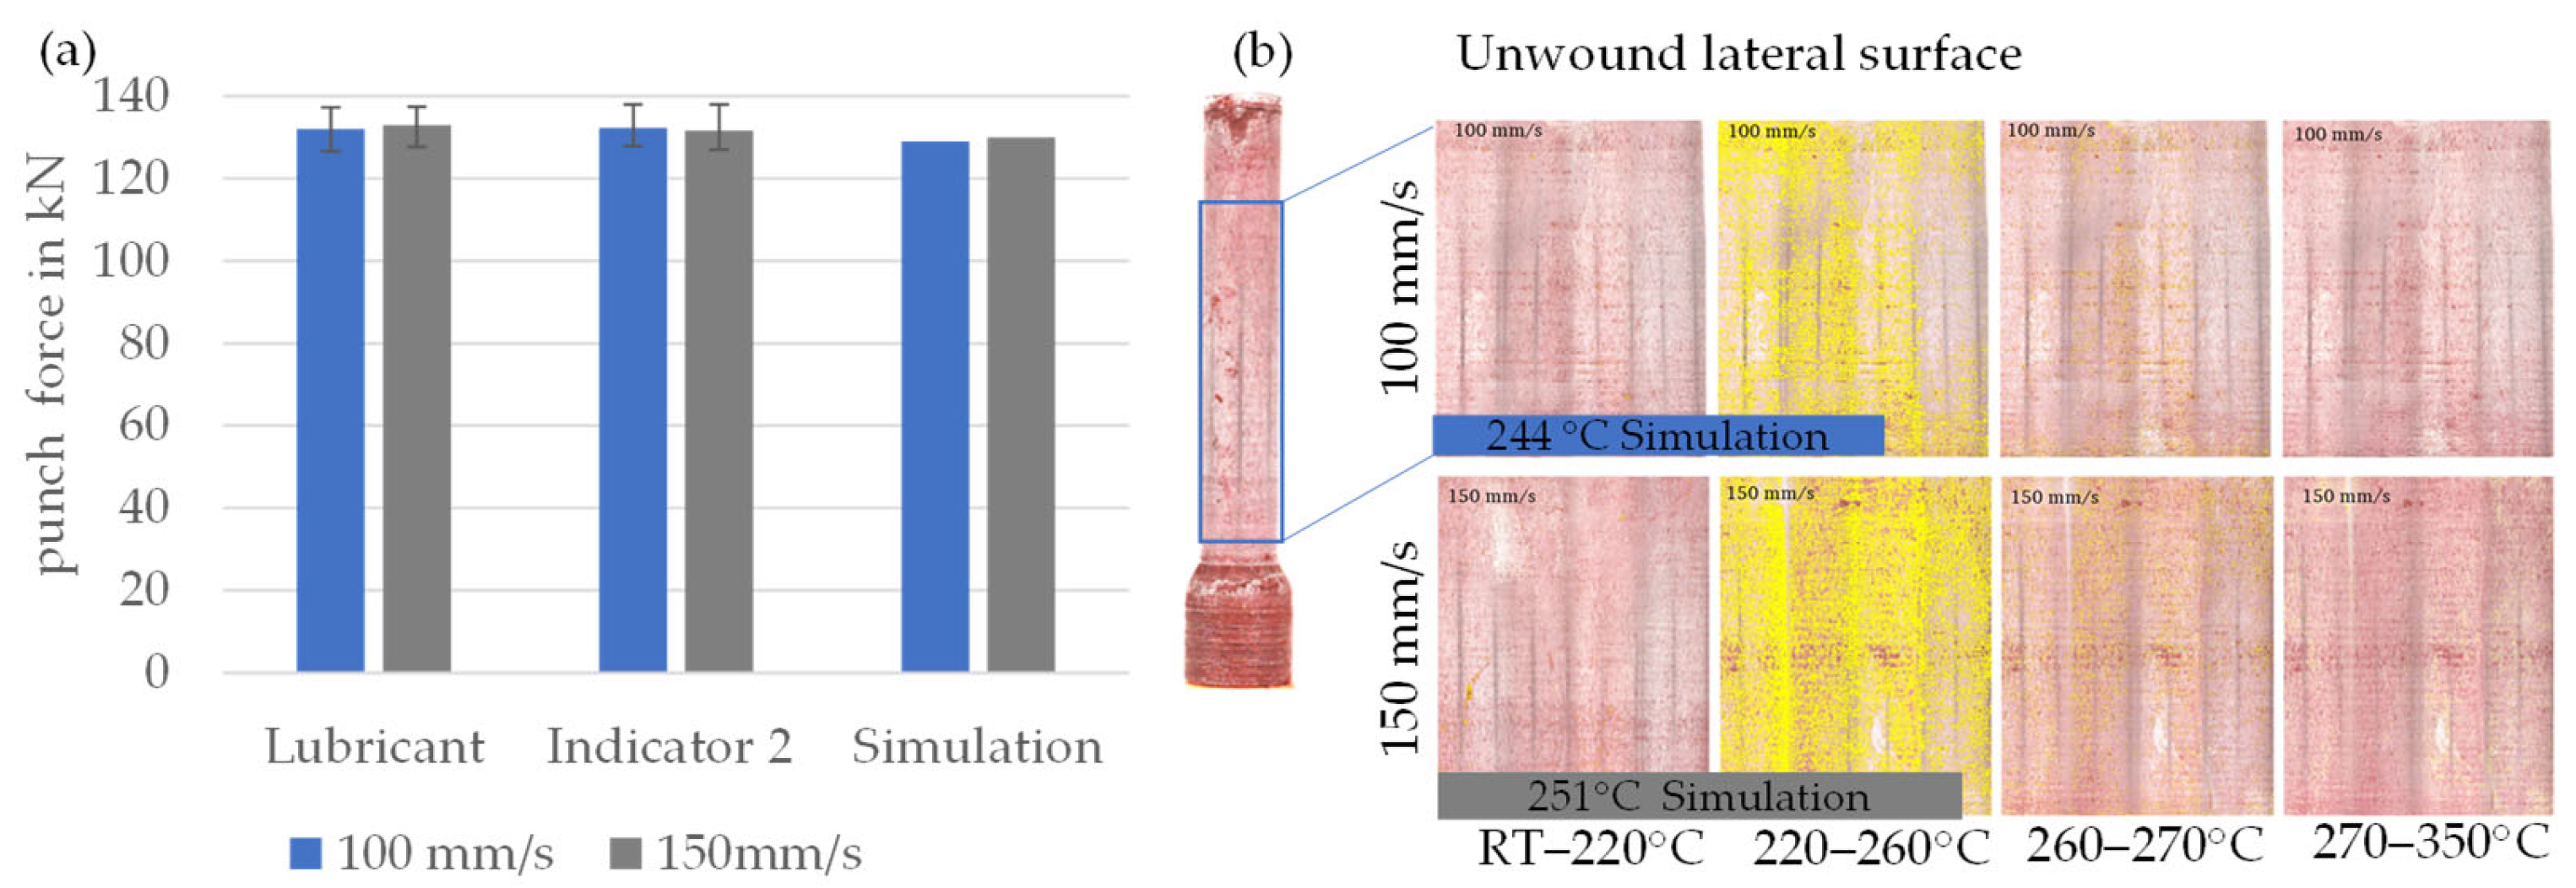
The comparison of simulation (Simufact Forming 2022.1.0, MSC Software GmbH, München, Germany) results and real tests is carried out using a full forward extrusion process. A cylinder made of 16MnCrS5 with a diameter of 14.5 mm and a height of 50 mm is used as the workpiece. Full forward extrusion reduces the diameter to 10.78 mm, which corresponds to a maximum degree of deformation of 0.29. The simulation is 2D axially symmetrical. The forming speed is varied. A coefficient of friction of 0.05, a heat transfer coefficient of 20,000 W/(m2*K) and an initial temperature of 25 °C are assumed. The workpiece is meshed with the Mesher Advancing Front Quad, with an element size of 0.2 mm. As the workpiece undergoes large deformations, the mesh is meshed at a deformation of 0.4. The maximum temperatures are localized in the area of the calibration zone after the extrusion shoulder and are 244 °C (100 mm/s) and 251 °C (150 mm/s). In addition to the temperature, the punch force is also considered as a comparative variable between experiment and simulation (Figure 7).
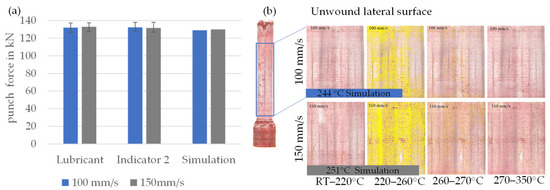
Figure 7.
Comparison of simulated and experimentally determined force (a) and temperature (b).
Indicator 2 is used for the experimental tests and the test parameters are varied according to the parameters of the simulation. The punch force is recorded during the tests. The required punch force or forming force for the pure lubricant and mixed with 4% Indicator 2 is within the range of the simulated pressing forces. In addition to the stamping forces, the colour values of the lubricant–indicator mixture remaining on the sample surface are documented and analyzed (Figure 7). The samples are digitized in the integrating sphere and the lateral surface is unwounded by the software. For the tests at 150 mm/s, almost the entire sample is marked yellow in the range of 220–260 °C, which leads to the conclusion that the temperatures are at least 220 °C. There are also isolated areas in which temperatures of 260 to 270 °C and 270 °C to 350 °C prevailed. The simulation result for the maximum temperature at a stamping speed of 150 mm/s is 251 °C, and therefore exactly in the temperature range determined by the indicator. Similarly, the full forward extrusion tests with a stamping speed of 100 mm/s show that the temperatures are in the range of 220–260 °C. Here, too, the simulated temperatures are in the range of the temperatures determined by the indicator.
4. Transfer to an Industrial Multi-Stage Process
4.1. Multi-Stage Sample Process
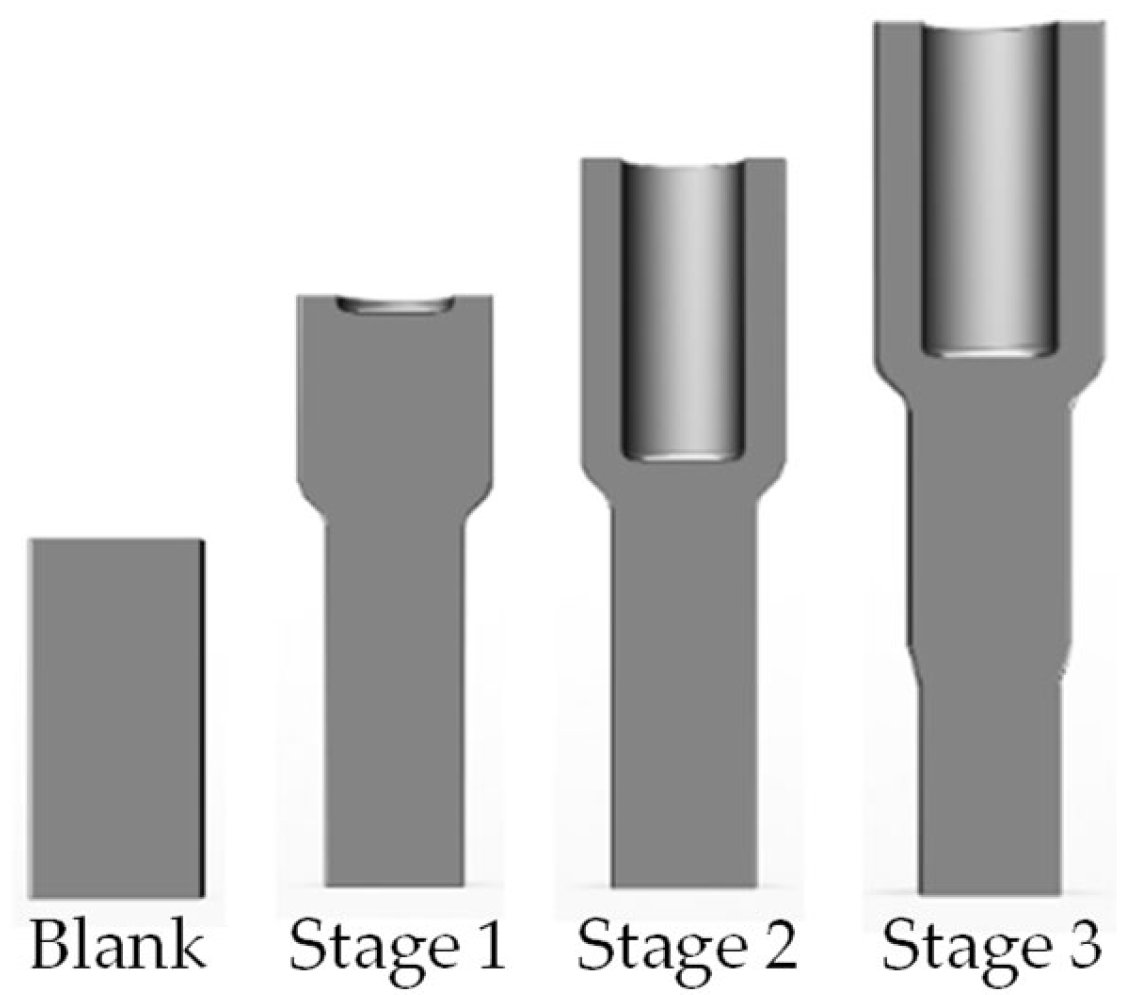
Once the functionality of the measuring principle has been demonstrated in the laboratory environment, the next step is to transfer the principle to a multi-stage forming process. A three-stage cold extrusion process is selected as an industrial sample process (Figure 8). In the first stage, a forward extrusion takes place with a contact normal pressure (CNP) of 2000 MPa and an overall surface enlargement (SE) of 12%. In the second stage, a backward extrusion of the cup follows, whereby the CNP increases to 2450 MPa and the overall SE to 32%. The process ends in stage 3 by tapering the workpiece, resulting in a CNP of 1600 MPa and an overall surface enlargement of 1.5%. The component is transported between the stages using a transfer rail.
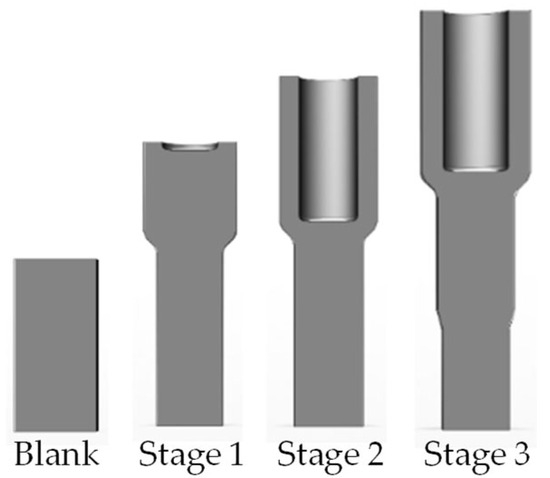
Figure 8.
Stage sequence of the multi-stage process.
4.2. Adaptation of the Measuring Principle for Digitization
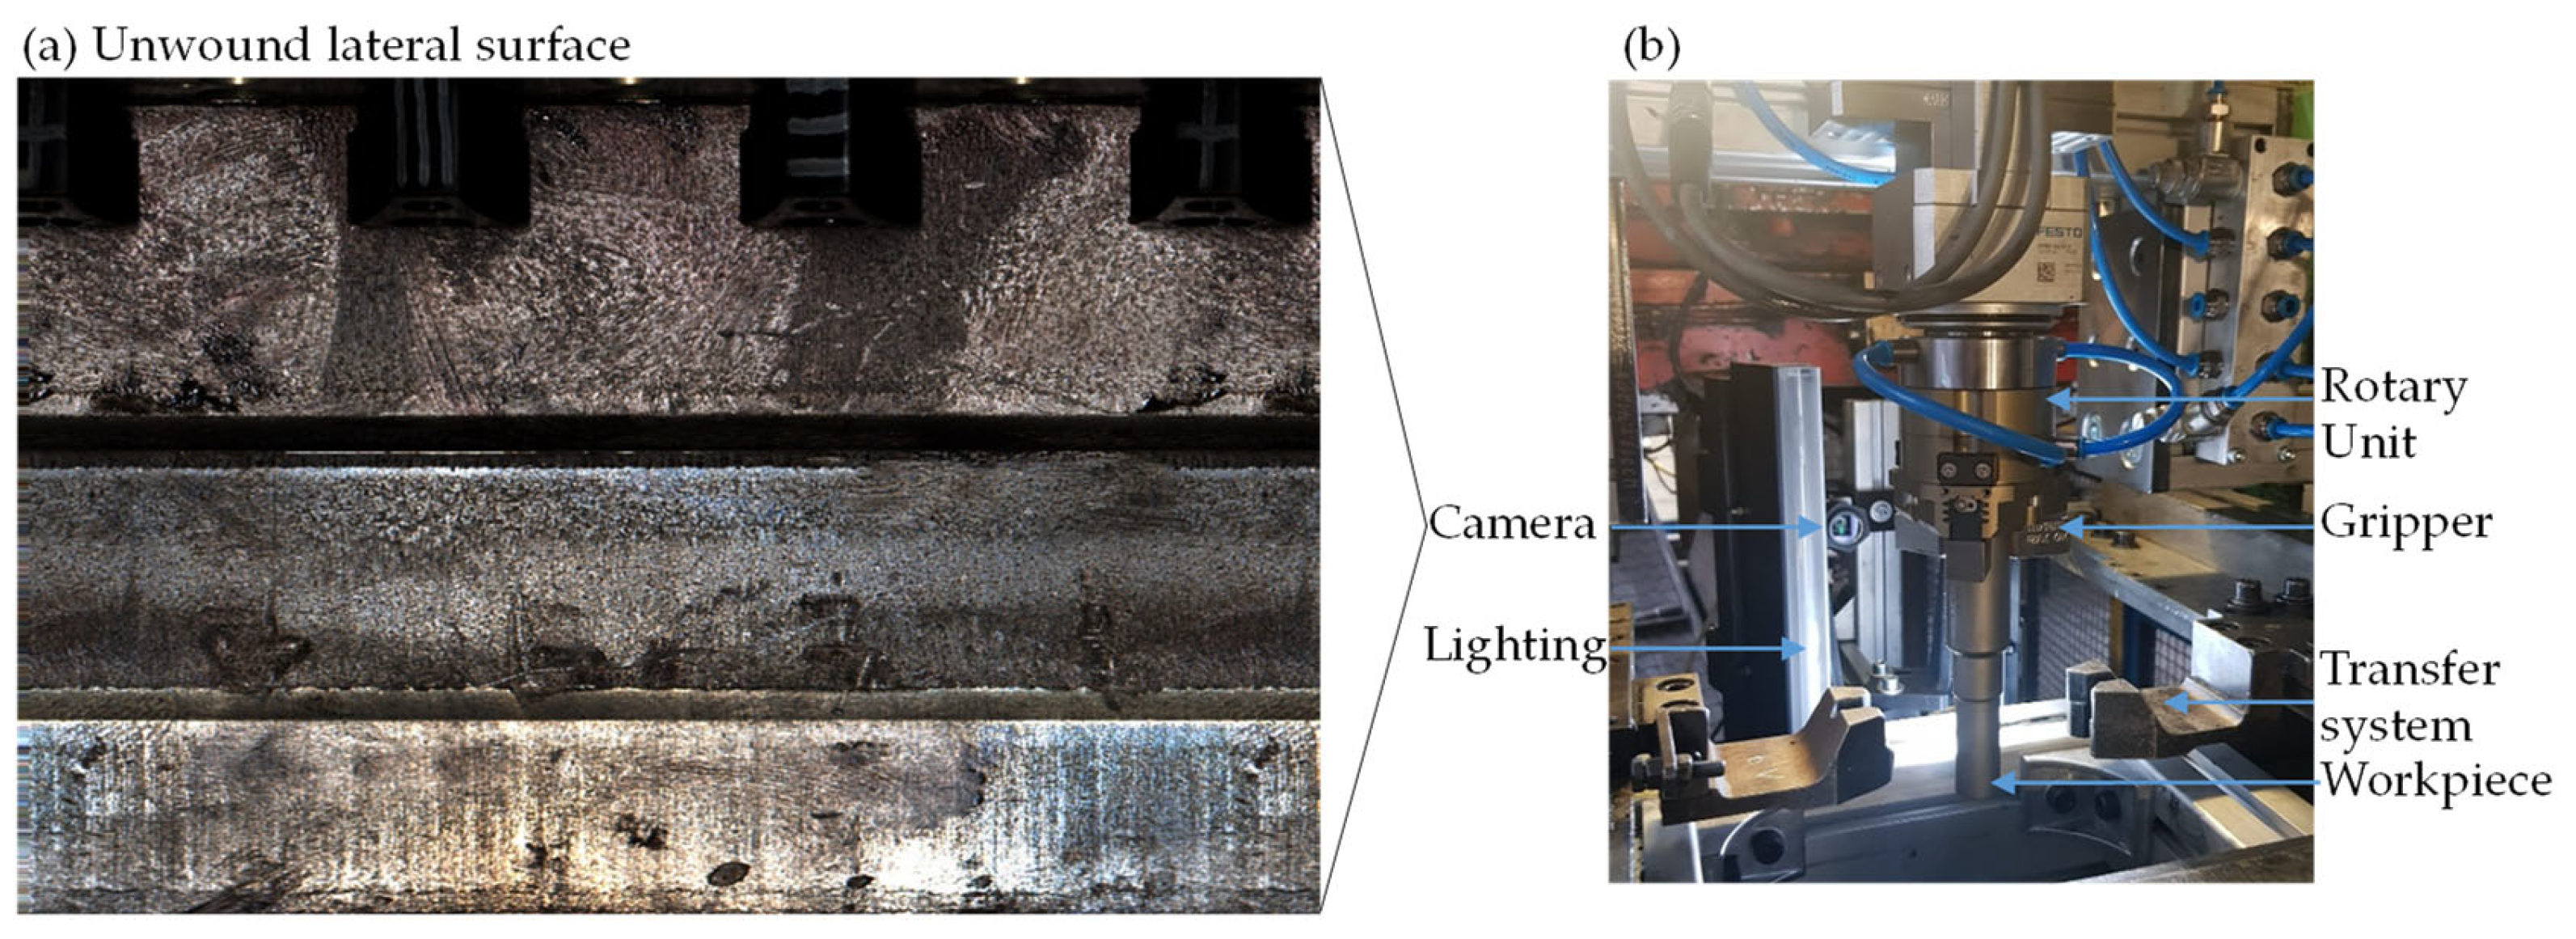
Adaptations are required to integrate the measuring principle into the industrial forming process. Due to the limited installation space and the continuous transfer of the workpieces from one stage to the next, the integrating sphere used in the laboratory is not suitable for digitization in the continuous industrial process. Instead, a line scan camera Basler a2A1920-51gcBAS (Basler Ag, Ahrensburg, Germany) with line lighting Metabright White (Metaphase Technologies Inc., Bristol, PA, USA) and a rotation unit Festo ERMO-16-ST-E (Festo, Esslingen am Neckar, Germany) is integrated into the press to capture the samples. In order to scan the entire lateral surface of the component, it must rotate around its longitudinal axis as precisely as possible. Depending on the number of strokes, a time window 1.2 s is available for this. After the final forming stage, the component is removed from the transfer rail by the rotation unit, which is synchronized with the press stroke. During the subsequent stroke, the component is rotated through 360° and the line scan camera captures the entire surface of the shell. During the recording, the recorded line is illuminated by the line lighting. Figure 9 shows the structure and the unwound lateral surface.
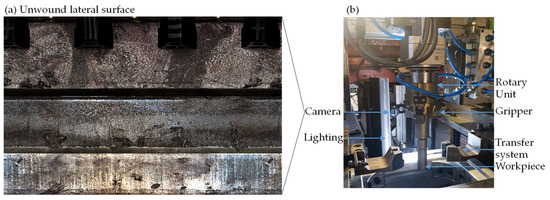
Figure 9.
Structure of the rotating unit (b) and unwound lateral surface (a).
4.3. Simulation of the Multi-Stage Process
A simulation of the sample process is created to determine the temperatures and loads that occur. The simulation was carried out using Simufact Forming with a 2D-axisymmetric setup. The mesh was generated using the Advancing Front Quad method (Quad Type 10), with refinement zones in the forming area, where the element edge length was set to 0.2 mm. The press stroke was used to derive the movement, and the tools were modelled as rigid bodies with heat conduction. The material’s flow curves were temperature-dependent, ranging from 20 °C to 1000 °C, and tested at strain rates of 1.6, 8, and 40. The friction coefficient was defined according to Coulomb’s law with μ = 0.04. When simulating the three forming stages of the example process, the stage sequence of the simulation programme is used to reproduce the forming sequence of the real process. The final geometry of the first stage with all result variables, such as temperature and stress distribution, is read into the second stage as the initial condition. The same procedure is followed from the second to the third stage.
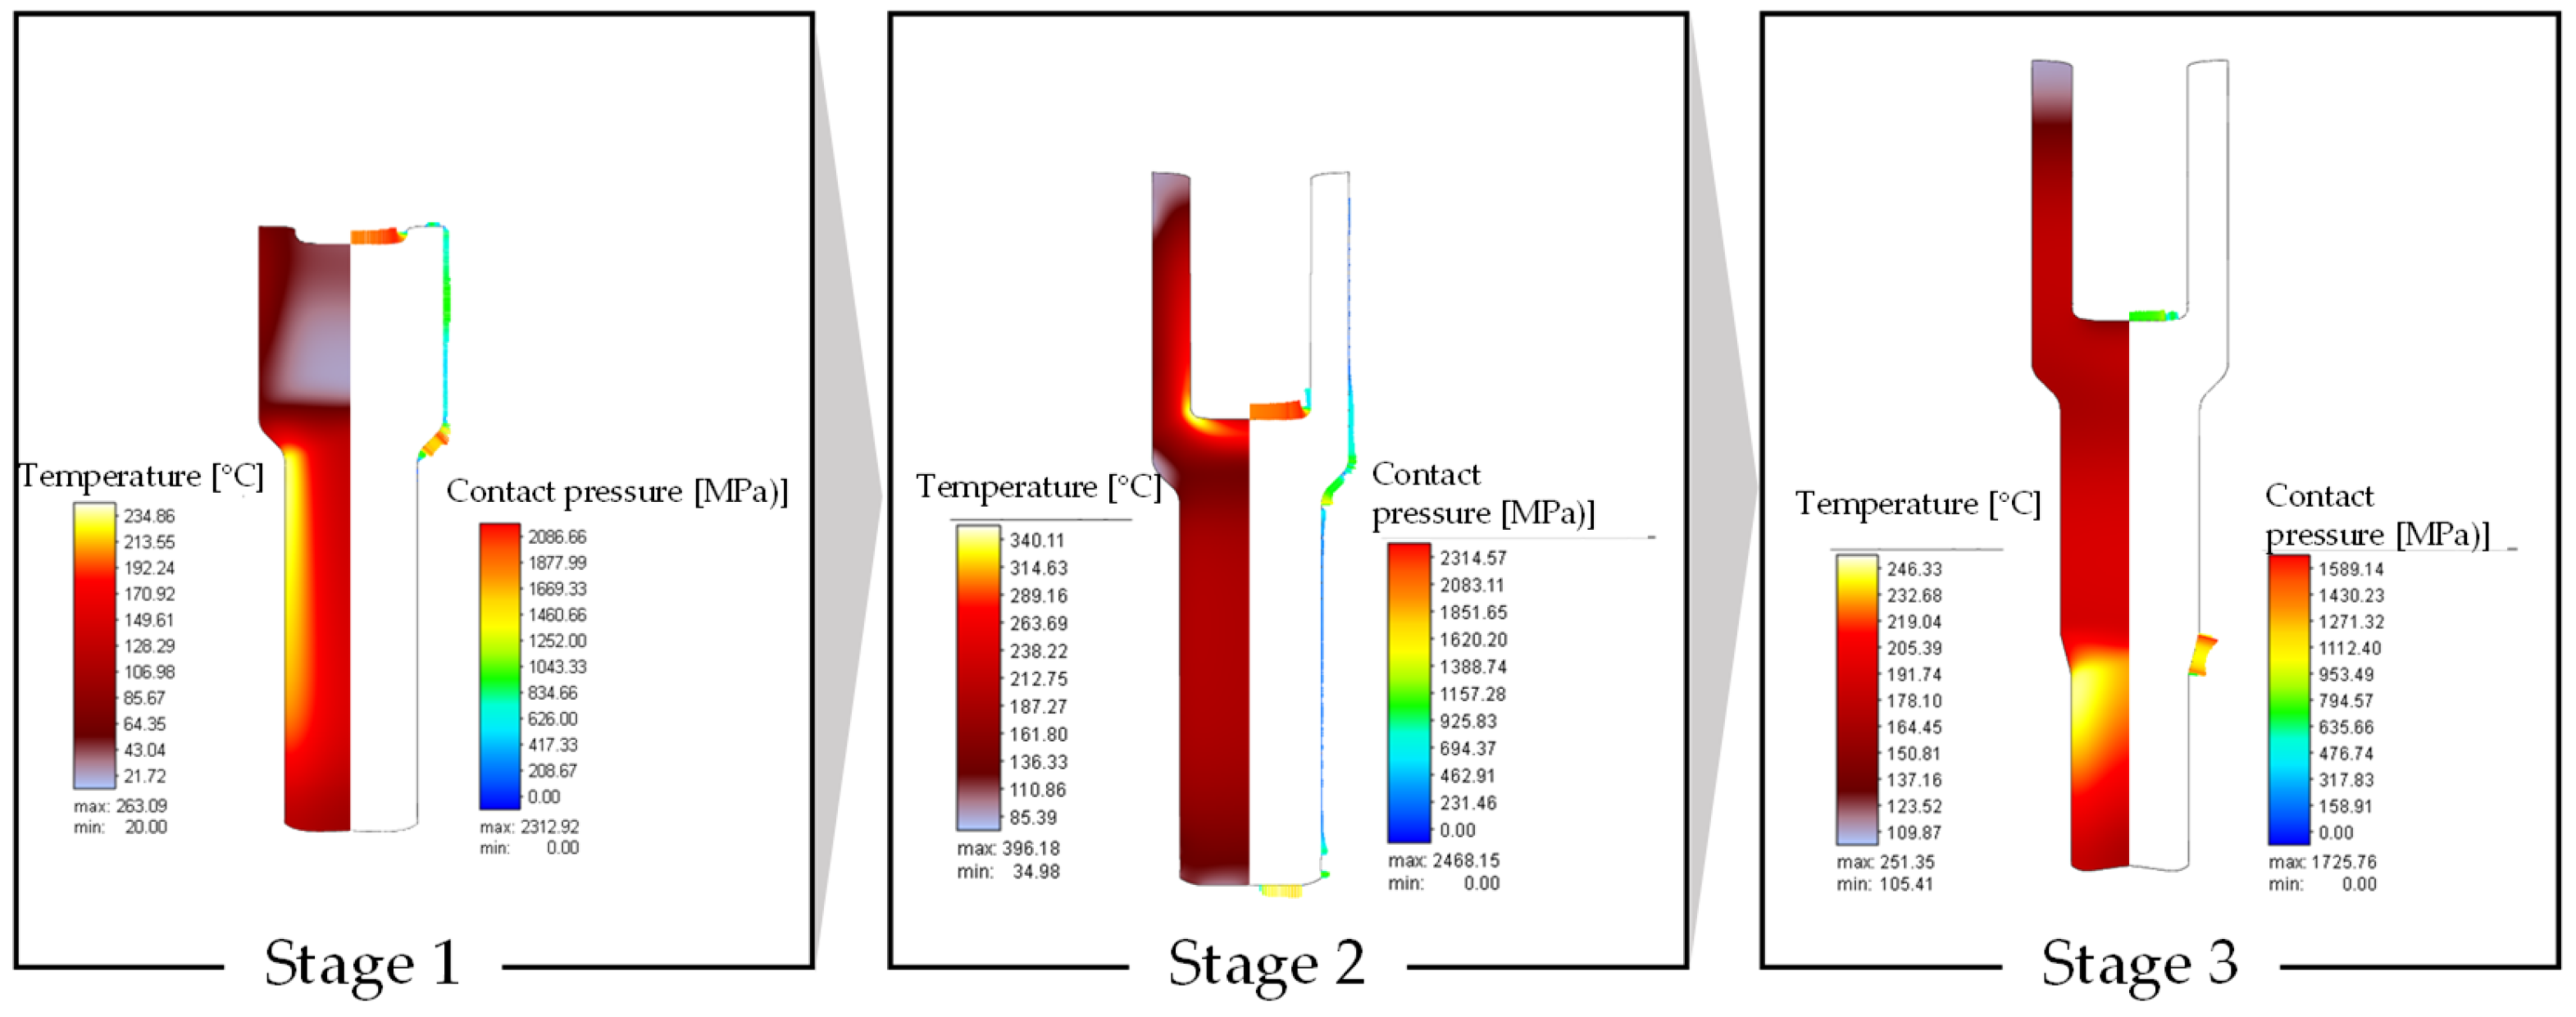
Figure 10 shows the temperature and contact pressure distribution for the sample process. The maximum values are at the main forming zones, the extrusion shoulders and the base of the cup. The highest temperatures as well as CNS and surface enlargements occur in stage 2. The load spectra resulting from the simulation are listed in Table 2.
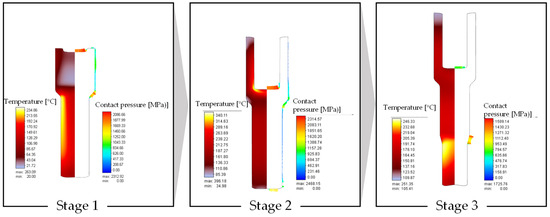
Figure 10.
FEM simulation results for the temperature and the normal contact pressure of the successive stages.
Table 2.
Loads in the sample process.
4.4. Analyzing the Surface Quality
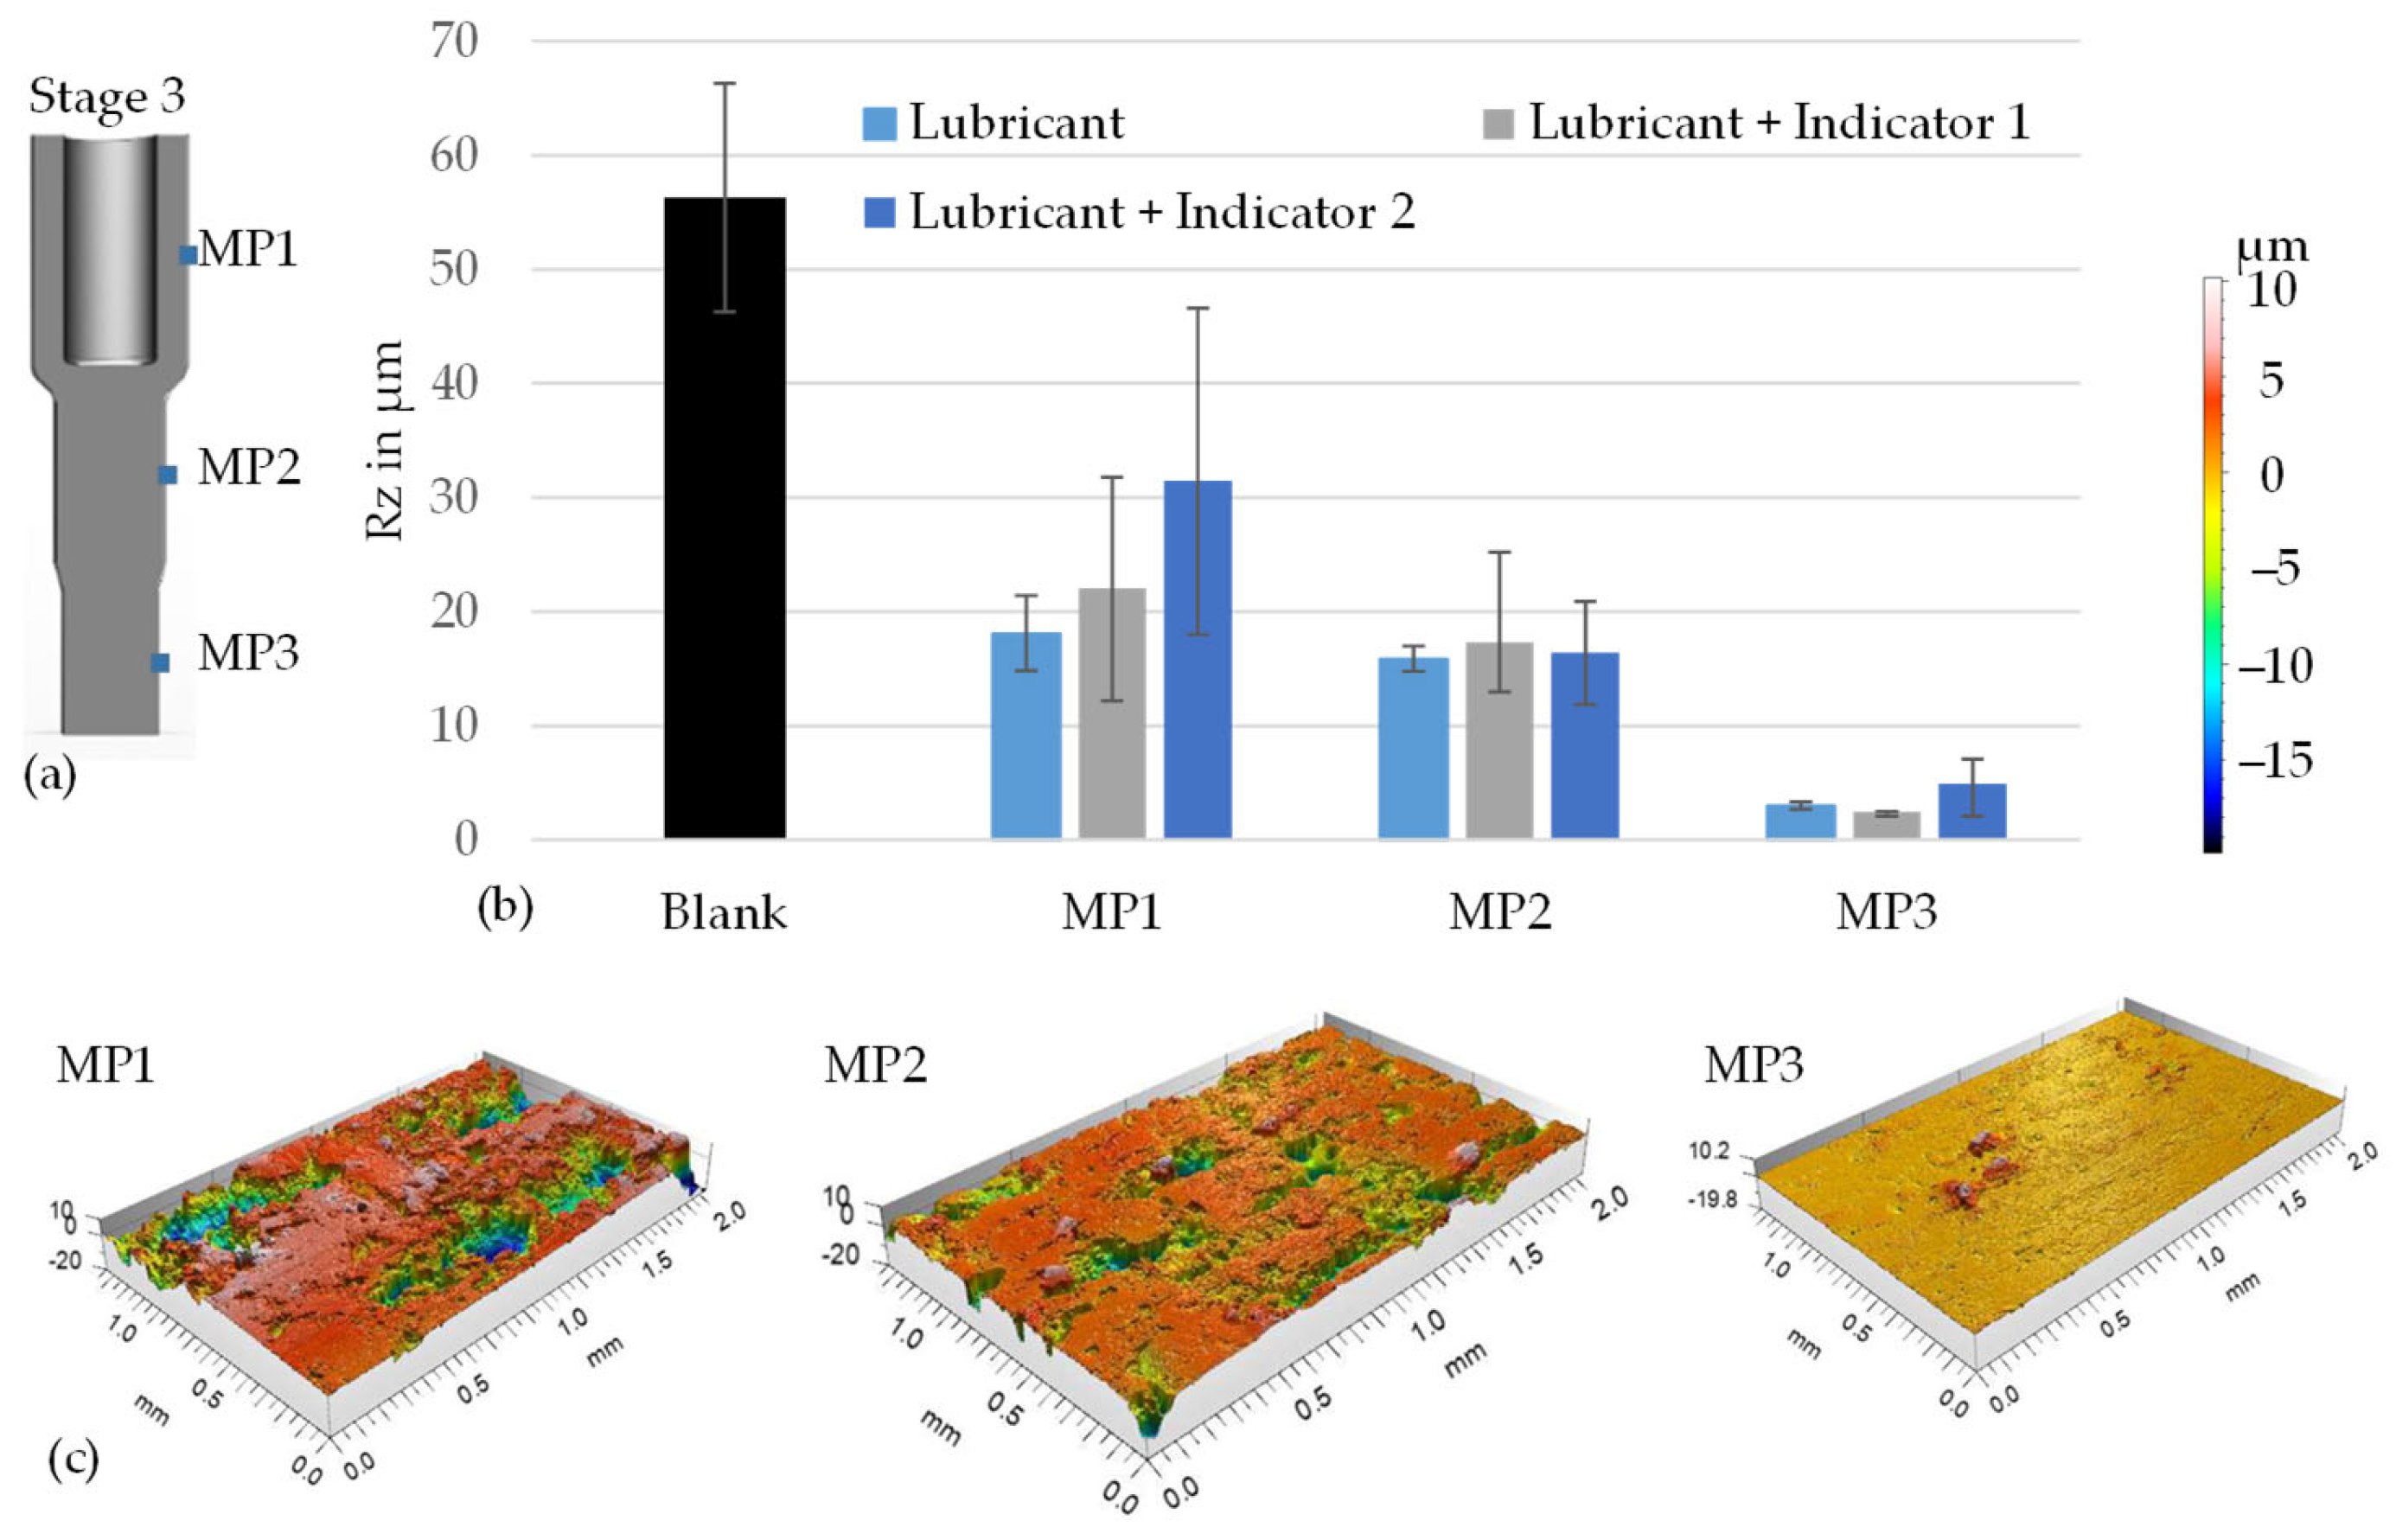
An important quality feature of cold formed components is the high surface quality. To assess the influence of the indicators on the surface quality of the component, the surfaces of the components are measured (µsurf, nanofokus, Germany). The results are shown in Figure 11. The measurements are carried out at three defined measuring points. Measuring point 1 (MP1) is located in the area of the cup back extrusion. Measuring point 2 (MP2) is located on the lateral surface that is created after forward extrusion. Measuring point 3 (MP3) is located on the tapered lateral surface. Three measurements were carried out per area with a measuring field of 1 × 2 mm. Rz was selected as the characteristic value. The reference system of the pure lubricant was compared with the systems with added indicators. The initial values of Rz were also determined. It can be seen that, depending on the forming stages, a strong smoothing of the surface occurs by up to a factor of 10. In MP1, Indicator 2 shows slightly increased Rz values. At the measuring points (MP1 and MP2), the Rz values are at the same level for all combinations. Figure 11 also shows the smoothing based on the 3D surface topography. In combination with the remaining lubricant (Figure 12), it can be assumed that the lubricant no longer adheres to the surface as a result of the smoothing or that there are no more reservoirs. It can be concluded that the thermochromic indicators have no significant influence on the surface quality of the sample component at a concentration of 4%.
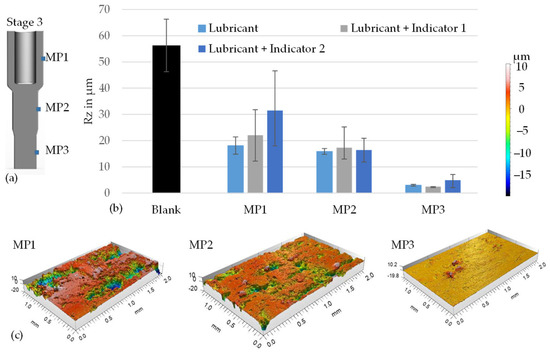
Figure 11.
Position of the measuring points on the sample (a), roughness as a function of the indicators and measuring point before and after forming (b) and exemplary development of the surface topography (c).
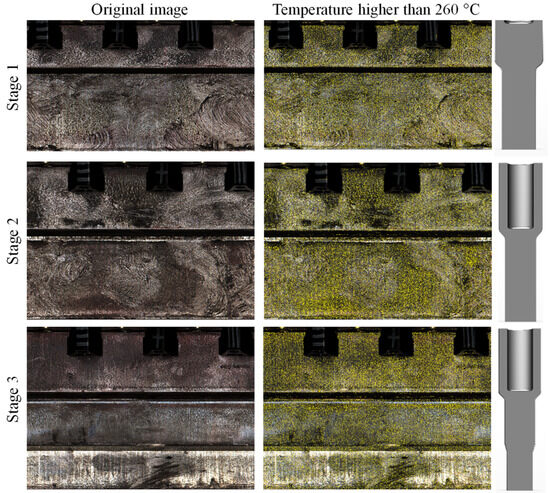
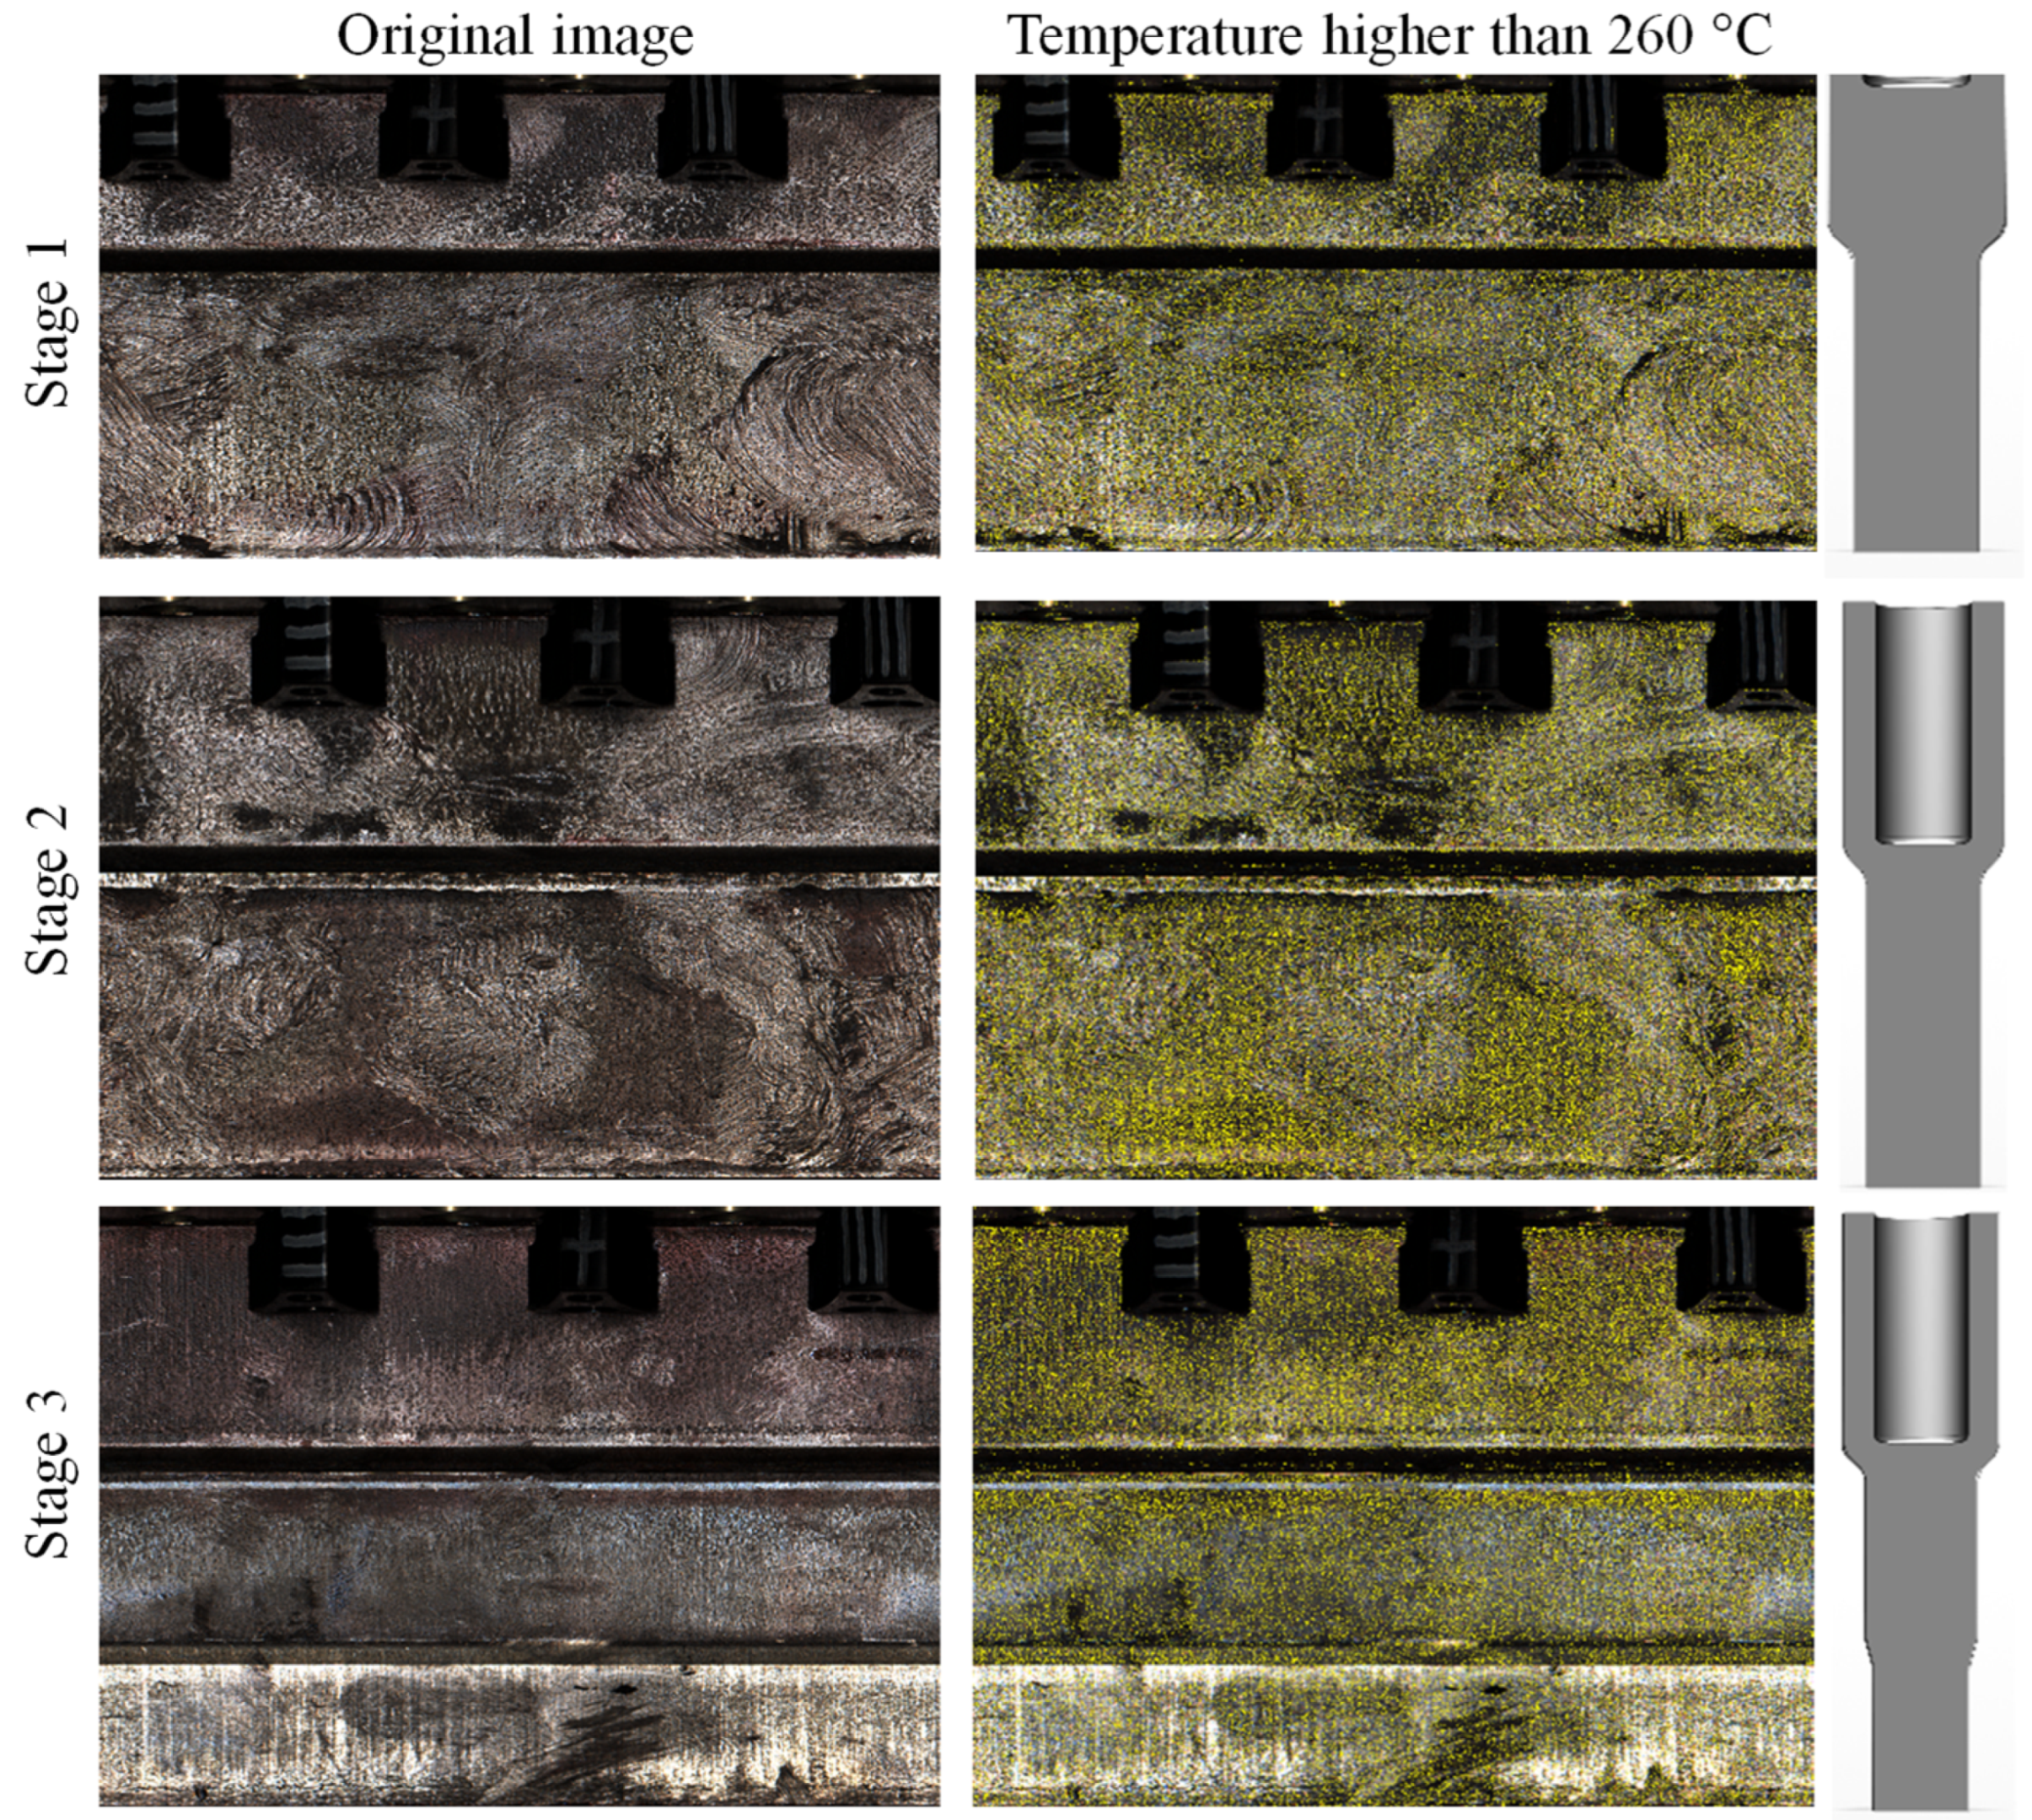
Figure 12.
Original image (left), coloured image for temperatures above 260 °C (middle) and process stages (right).
4.5. Experimental Temperature Determination
Figure 12 on the left shows the surfaces of the workpieces recorded with the line scan camera after the various stages of the forming process. The grippers of the rotation unit can be recognized in the upper area of the images. In order to record the individual process stages separately, the press was stopped after the first stage and the workpieces were manually clamped into the measuring device and digitized. This process was repeated for all further stages so that the lateral surface could be digitized after each stage. The disadvantage is that the extrusion shoulders could not be captured with the setup used, which only utilizes one camera. In future, it is therefore planned to use a second camera positioned perpendicular to the extrusion shoulder in order to digitize this area as well. The images also show that the base material of the workpieces is visible in many places. Particularly on the tapered surface after stage 3, almost no lubricant can be detected. This indicates that only a small amount of lubricant remains on the samples, which corresponds to the investigations on lubricant thinning using UV indicators [28]. The majority of the lubricant remains either in the die or on the punch.
The lubricant–indicator mixture remaining on the surface was analyzed according to the methodology presented. Figure 12 on the right shows that the experimentally measured temperature was between 260 °C and 350 °C (pixels with corresponding colour values are coloured yellow). A finer gradation, as shown in Figure 2 (between 260 °C and 270 °C and 270 °C to 350 °C), was not recognizable due to the lower homogenisation of the light in the industrial measurement setup compared to the integrating sphere. The experimentally measured temperatures of over 260 °C correspond to the maximum temperature values of the simulation from stage 1 (Figure 10). Experimental measurements in the same process show that a stationary temperature of 300 °C is reached after running-in, which is consistent with the measurement results of this work [26]. According to the simulation, the temperature in the area that did not pass through the extrusion shoulder should have been around 100 °C. However, the experimental results show that the temperature in this area must have been above 260 °C as well. Furthermore, no correlation can be established between the simulation results and the experimental measurements for stages 2 and 3, as the highest temperatures already occur in stage 1 and the colour changes are irreversible. To summarize, it can be said that the strong dilution of the lubricant, which is confirmed in [30], makes detailed recording difficult.
5. Conclusions and Outlook
The main aim of the work was to develop a measurement method that can be used to record the temperatures caused by functionally enhanced lubricants directly in the forming zone. In addition, the methodology was to be adapted to an industrial example process and conclusions were to be drawn about the temperatures occurring.
By integrating three thermochromic indicators into a commercial lubricant, it was further developed into a sensory lubricant for temperature detection. With the help of a developed calibration procedure, the temperature-dependent colour changes in the sensory lubricant could be reproducibly characterized. Furthermore, it was shown that the thermochromic indicators have no influence on the friction and wear behaviour or the surface quality of the components up to a concentration of 4%. With the measuring system, temperatures in the range of 220–260 °C could be detected in simple full forward extrusion and validated using FEM-based temperature simulation, and the measuring method was adapted so that it could be used inline in multi-stage industrial processes. This allowed peak temperatures of at least 260 °C to be determined in the industrial process, which could be validated using FEM simulation of the process.
At the same time, the investigations showed that the colour change in the temperature-sensitive lubricants is not continuous but only occurs when certain minimum temperatures are exceeded. In this respect, it is necessary to identify further indicators in future work in order to be able to recognize as many temperature transitions as possible. In addition, a strong dilution of the lubricant was observed, particularly in industrial environments, which reduces the significance of the measuring system. It is therefore necessary to investigate up to which surface enlargement and associated dilution of the lubricant system a comprehensive temperature measurement is possible, and to what extent the limits can be extended using alternative lubricants.
The developed methodology offers the potential to operate IHTC test rigs and inverse temperature determination methods by means of FEM simulations in the range of the handling temperature of the indicators, and to verify the models through the additional information about the temperature directly in the contact zone. Further investigations are recommended.
Author Contributions
Conceptualization, C.K. and P.G.; methodology, C.K. and P.V.; software, C.K. and P.V.; investigation, C.K. and P.V.; resources, C.K.; writing—original draft preparation, C.K.; writing—review and editing, C.K.; visualization, C.K. and P.V.; supervision, P.G.; project administration, C.K., P.V. and P.G. All authors have read and agreed to the published version of the manuscript.
Funding
The results were obtained as part of the joint project InPUT-Inline process monitoring of forming processes using tribological systems (funding code: 03EN2038A), which was funded by the Federal Ministry of Economics and Climate Protection (BMWK) as part of the 7th Energy Research Programme of the Federal Government, based on a resolution of the German Bundestag.
Data Availability Statement
The data presented in this study are available on request from the corresponding author due to privacy.
Acknowledgments
The PtU would like to thank the project sponsor, Forschungszentrum Jülich GmbH and the project partners SCHONDELMAIER GmbH Presswerk, CARL BECHEM GMBH and ISRA VISION AG. This article is a revised and expanded version of a paper entitled Temperature Sensing in Cold Forging with Thermochromically Enhanced Lubrication Systems, which was presented at ICTMP 24, Alcoy/Spain, 26–28 June 2024 [31].
Conflicts of Interest
The authors declare no conflicts of interest. The funders had no role in the design of the study; in the collection, analyses, or interpretation of data; in the writing of the manuscript; or in the decision to publish the results.
References
- Altan, T.; Ngaile, G.; Shen, G.S. Cold and Hot Forging—Fundamentals and Applications. ASM International: Novelty, OH, USA, 2004; ISBN 0871708051. [Google Scholar]
- Bay, N.; Azushima, A.; Groche, P.; Ishibashi, I.; Merklein, M.; Morishita, M.; Nakamura, T.; Schmid, S.; Yoshida, M. Environmentally benign tribo-systems for metal forming. CIRP Annals 2010, 59, 760–780. [Google Scholar] [CrossRef]
- Groche, P.; Müller, C.; Stahlmann, J.; Zang, S. Mechanical conditions in bulk metal forming tribometers—Part one. Tribol. Int. 2013, 62, 223–231. [Google Scholar] [CrossRef]
- Singer, F. Verfahren zur Vorbehandlung von Eisen- und Stahlwerkstücken für die Spanlose Fertigung, z.B. das Ziehen. Patent No. 673405, 1934. [Google Scholar]
- Sagisaka, Y.; Ishibashi, I.; Nakamura, T.; Sekizawa, M.; Sumioka, Y.; Kawano, M. Evaluation of environmentally friendly lubricants for cold forging. J. Mater. Process. Technol. 2012, 212, 1869–1874. [Google Scholar] [CrossRef]
- Schoppe, J.; Zang, S. Lubrication Systems as a Possibility for Process Monitoring in Cold Bulk Forming. Available online: https://tubiblio.ulb.tu-darmstadt.de/75191/ (accessed on 2 December 2024).
- Groche, P.; Zang, S.; Müller, C.; Bodenmüller, D. A study on the performance of environmentally benign lubricants at elevated temperatures in bulk metal forming. J. Manuf. Process. 2015, 20, 425–430. [Google Scholar] [CrossRef]
- Groche, P.; Volke, P.; Gerlitzky, C.; Ostrowski, J. Adaption von Kaltmassivumformprozessen auf Basis einer Temperaturerfassung. In Neuere Entwicklungen in der Massivumformung; Institut für Umformtechnik: Stuttgart, Germany, 2017; pp. 227–236. [Google Scholar]
- Nshama, W.; Jeswiet, J. Evaluation of temperature and heat transfer conditions at the metal-forming interface. CIRP Ann. 1995, 44, 201–204. [Google Scholar] [CrossRef]
- Lenard, J.G.; Davies, M.E. The distribution of temperatures in a hot/cold die set: The effect of the pressure, temperature, and material. Trans. ASME J. Eng. Mater. 1995, 117, 220–227. [Google Scholar] [CrossRef]
- Grötzinger, K.; Schott, A.; Rekowski, M.; Ehrbrecht, B.; Hehn, T.; Gerasimov, D.; Liewald, M. Analysis of tool heating in cold forging using thin-film sensors. Mater. Res. Proc. 2023, 28, 2027–2036. [Google Scholar]
- Serajzadeh, S. Prediction of temperature distribution and required energy in hot forging process by coupling neural networks and finite element analysis. Mater. Lett. 2007, 61, 3296–3300. [Google Scholar] [CrossRef]
- Qin, Y.; Balendra, R.; Chodnikiewicz, K. A method for the simulation of temperature stabilisation in the tools during multi-cycle cold-forging operations. J. Mater. Process. Technol. 2000, 107, 252–259. [Google Scholar] [CrossRef]
- Kim, D.; Kim, S.; Song, I. Finite element analysis for temperature distributions in a cold forging. J. Mech. Sci. Technol. 2013, 27, 2979–2984. [Google Scholar] [CrossRef]
- Dixit, U.S.; Raj, A.; Petrov, P.A. Determination of temperature distribution in cold forging with the support of inverse analysis. Measurement 2022, 187, 110270. [Google Scholar] [CrossRef]
- Petrov, P.; Matveev, A.; Kulikov, M.; Stepanov, B.; Petrov, M.; Burlakov, I.; Dixit, U.S. Finite-Element Modelling of Forging with Torsion: Investigation of Heat Effect. Procedia Manuf. 2020, 47, 274–281. [Google Scholar] [CrossRef]
- Chang, C.C.; Bramley, A.N. Determination of the heat transfer coefficient at the workpiece—Die interface for the forging process. Proc. Inst. Mech. Eng. Part B J. Eng. Manuf. 2002, 216, 1179–1186. [Google Scholar] [CrossRef]
- Malinowski, Z.; Lenard, J.G.; Davies, M.E. A study of the heat-transfer coefficient as a function of temperature and pressure. J. Mater. Process. Technol. 1994, 41, 125–142. [Google Scholar] [CrossRef]
- Seeboth, A.; Lötzsch, D. Thermochromic and Thermotropic Materials; Pan Stanford Publishing: Singapore, 2014. [Google Scholar]
- Volz, S.; Launhardt, J.; Bay, N.; Hu, C.; Moreau, P.; Dubar, L.; Nielsen, C.; Hayakawa, K.; Kitamaura, K.; Groche, P. International round robin test of environmentally benign lubricants for cold forging. CIRP Ann. Manuf. Technol. 2023, 72, 245–250. [Google Scholar] [CrossRef]
- Wang, Z.G.; Komiyama, S.; Yoshikawa, Y.; Suzuki, T.; Osakada, K. Evaluation of lubricants without zinc phosphate precoat in multi-stage cold forging. CIRP Ann. 2015, 64, 285–288. [Google Scholar] [CrossRef]
- Groche, P.; Zang, S.; Kramer, P.; Müller, C.; Rezanov, V. Influence of a heat treatment prior to cold forging operations on the performance of lubricants. Tribol. Int. 2015, 92, 67–71. [Google Scholar] [CrossRef]
- Narayanan, S. Surface Pretreatment by phosphate conversion coatings. Rev. Adv. Mater. Sci. 2005, 9, 130–177. [Google Scholar]
- Griffioen, J.A.; Bair, S.; Winer, W.O. Infrared surface temperature measurements in a sliding ceramic-ceramic contact. In Proceedings of the 12th Leeds-Lyon Symposium on Tribology 1985, Lyon, France, 3–6 September 1985; DolI’son, D., Ed.; Elesvier: Amsterdam, The Netherlands, 1986. [Google Scholar]
- Nitzsche, G. Reduzierung des Adhäsionsverschleißes beim Umformen von Aluminiumblechen. Ph.D. Thesis, Shaker Verlag, Aachen, Germany, 2007. [Google Scholar]
- Müller, C.; Filzek, J.; Groche, P.; Oehler, O.; Scherzinger, P.; Twickler, M. Temperaturentstehung und die tribologischen Folgen bei Produktionsbeginn der Kaltmassivumformung. Schmiede J. 2014, 9, 28–32. [Google Scholar]
- Bay, N.; Nakamura, T.; Schmid, S. Green Lubricants for Metal Forming. In Tribology of Manufacturing Processes, Proceedings of the 4th International Conference on Tribology in Manufacturing Processes, Nice, France, 13–15 June 2010; Ecole des Mines: Nice, France, 2010. [Google Scholar]
- Volke, P. Einsatz Konversionsschichtfreier Schmierstoffe bei der Kaltmassivumformung Rostfreier Stähle. Ph.D. Thesis, Technische Universität Darmstadt, Darmstadt, Germany, 2023. [Google Scholar]
- Zang, S. Bestimmung von Temperaturen und Deren Einflüsse auf Tribologische Systeme der Kaltmassivumformung. Ph.D. Thesis, Shaker Verlag, Aachen, Germany, 2016. [Google Scholar]
- Kuhn, C.; Groche, P. Monitoring lubricant distribution in industrial cold forging with function-enhanced lubrication systems. In Proceedings of the JSTP International Seminar on Precision Forging (9th ISPF), Kyoto, Japan, 11–14 March 2024. [Google Scholar]
- Kuhn, C.; Groche, P. Temperature sensing in cold forging with thermochromically enhanced lubrication systems. In Proceedings of the ICTMP 2024 in Key Engineering Materials, Alcoy, Spain, 26–28 June 2024. [Google Scholar]


Disclaimer/Publisher’s Note: The statements, opinions and data contained in all publications are solely those of the individual author(s) and contributor(s) and not of MDPI and/or the editor(s). MDPI and/or the editor(s) disclaim responsibility for any injury to people or property resulting from any ideas, methods, instructions or products referred to in the content. |
© 2025 by the authors. Licensee MDPI, Basel, Switzerland. This article is an open access article distributed under the terms and conditions of the Creative Commons Attribution (CC BY) license (https://creativecommons.org/licenses/by/4.0/).