


Abstract
CO2 miscible flooding provides dual advantages in enhancing oil recovery and facilitating geological sequestration, and has become a key technical approach for developing low-permeability oil reservoirs and carbon emission reduction. The pore-scale flow mechanisms governing CO2 behavior during miscible flooding are crucial for achieving efficient oil recovery and secure geological storage of CO2. In this study, pore-scale two-phase flow simulations of CO2 miscible flooding in porous media are performed using a coupled laminar-flow and diluted-species-transport framework. The model captures the effects of diffusion, concentration distribution, and pore structure on the behavior of CO2 miscible displacement. The results indicate that: (1) during miscible flooding, CO2 preferentially displaces oil in larger pore throats and subsequently invades smaller throats, significantly improving the mobilization of oil trapped in small pores; (2) increasing the injection velocity accelerates the displacement front and improves oil utilization in dead-end and trailing regions, but a “velocity saturation effect” is observed—when the inject velocity exceeds 0.02 m/s, the displacement pattern stabilizes and further gains in ultimate recovery become limited; (3) higher injected CO2 concentration accelerates CO2 accumulation within the pores, enlarges the miscible sweep area, promotes a more uniform concentration field, leads to a smoother displacement front, and reduces high-gradient regions, thereby suppressing local instabilities, and improves displacement efficiency, although its effect on overall recovery remains modest; (4) CO2 dynamic viscosity strongly influences flow stability: low-viscosity conditions promote viscous fingering and severe local bypassing, whereas higher viscosity stabilizes flow but increases injection pressure drop and energy consumption, indicating a necessary trade-off between flow stability and operational efficiency.
1. Introduction
With the continued acceleration of global industrialization, fossil energy consumption has risen sharply, leading to a substantial increase in CO2 emissions. This trend has intensified the greenhouse effect and contributed to more frequent extreme climate events, posing serious challenges to human security and sustainable development [1,2,3,4,5,6]. Among the available emission-reduction pathways, CO2 capture, utilization, and storage (CCUS) is widely regarded as one of the most promising and feasible strategies for mitigating climate change [7,8]. In oilfield operations, CO2 flooding not only enables geological sequestration but also significantly enhances recovery in low-permeability oil reservoirs, thereby offering dual strategic benefits [9,10,11,12,13,14].
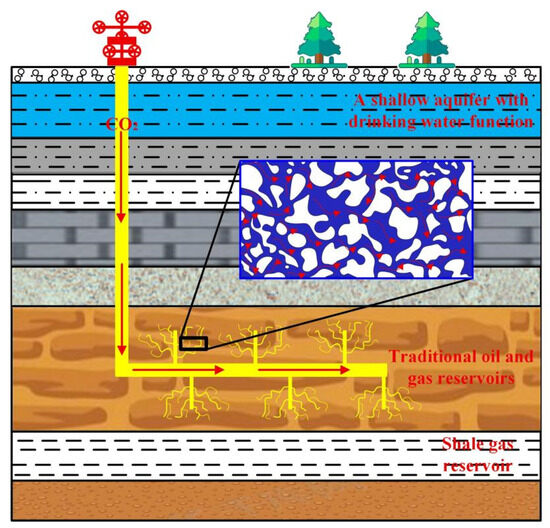
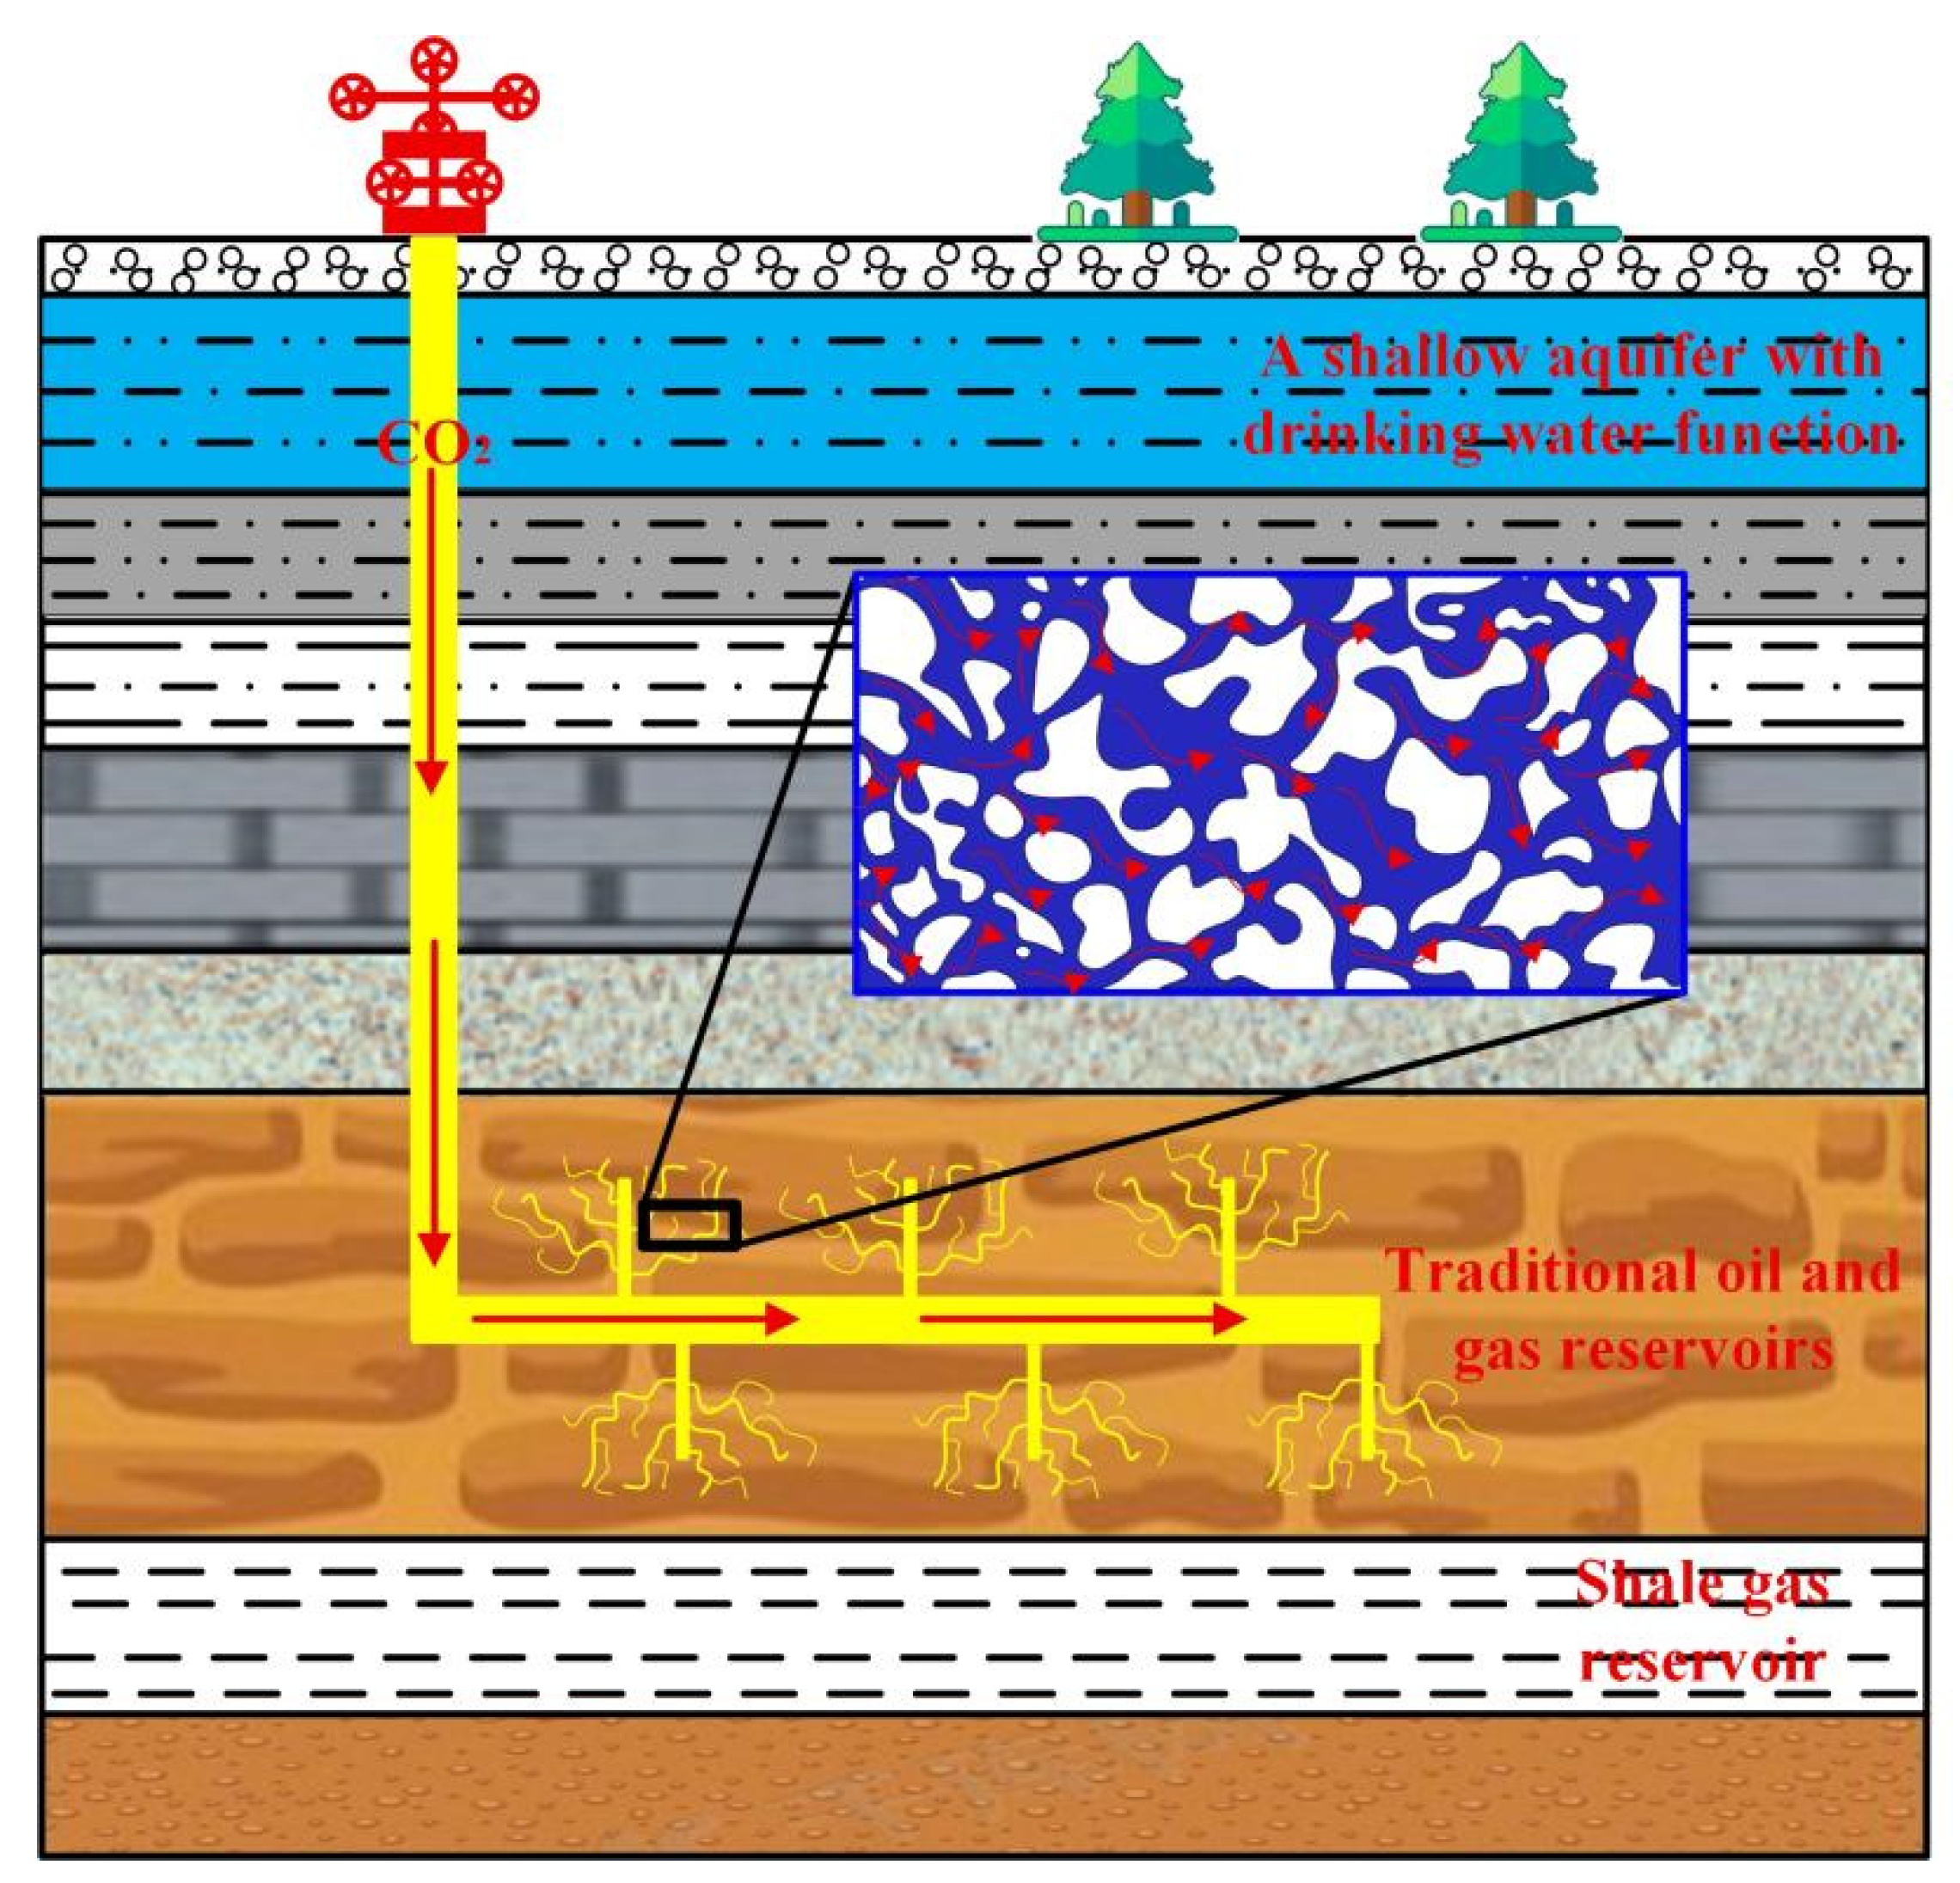
Depending on reservoir temperature, pressure, and crude oil composition, CO2 flooding can be classified into miscible, immiscible, and near-miscible displacement modes [15,16]. When the reservoir pressure exceeds the minimum miscibility pressure, CO2 and crude oil form a single-phase system, and the displacement process transitions into the miscible stage. Under miscible conditions, transport of the CO2–oil system in porous media is mainly governed by convection and diffusion [17]. A portion of the injected CO2 dissolves into the oil phase, forming a miscible zone that reduces oil viscosity and density, lowers interfacial tension, and thereby improves oil mobility and displacement efficiency [18,19,20,21,22]. Figure 1 illustrates a simplified schematic of the CO2 flooding process: CO2 passes through the pore structure, undergoes mass transfer, and interacts with the oil phase, forming a miscible region that propagates along pore channels and progressively displaces the oil.
Figure 1.
Simplified schematic of the CO2 flooding process.
However, during CO2 miscible flooding, a series of pore-scale displacement phenomena such as viscous fingering, preferential flow paths, limited sweep area, oil trapping, and pore blockage are frequently observed [8,23,24]. These non-uniform displacement behaviors significantly restrict macroscopic sweep efficiency. While most existing studies focus on the diffusion and dissolution of CO2 into crude oil, comparatively less attention has been devoted to the detailed transport behavior of CO2 within porous media [25,26,27,28]. Therefore, elucidating the multiphase flow characteristics of the CO2–oil system at the pore scale is of great significance for deepening the understanding of the displacement mechanisms and optimizing CO2 injection strategies.
Numerical simulation provides an effective tool for investigating multiphase fluid flow in porous media at the pore scale [29,30,31,32,33,34,35]. Commonly used pore-scale modeling approaches include artificially constructed pore network models [31] and pore structures reconstructed from 2D or 3D images of real cores obtained through various scanning techniques [33,34,36]. Among these, generating artificial pore structures and numerically solving the governing equations has emerged as a promising approach for simulating CO2 flooding in porous media [37,38,39]. Typical numerical methods include the finite difference method (FDM), finite volume method (FVM), finite element method (FEM), lattice Boltzmann method (LBM), phase-field method, and the “laminar flow + diluted species transport” approach [40,41,42]. Zhu et al. [31] employed a phase-field method to numerically simulate immiscible CO2 displacement in a homogeneous porous medium. They found that once CO2 breaks through the outlet, the pressure along the primary CO2 channel drops significantly, leading to oil flowing back into pores previously occupied by CO2. Song et al. [43] applied the “laminar flow + diluted species transport” method to investigate the key factors influencing CO2 miscible flooding and demonstrated that pore structure markedly affects displacement efficiency, leading to the formation of multiple types of residual oil; furthermore, variations in CO2 density and injection velocity can reshape effective flow channels and regulate the spatial distribution of residual oil. Zhang et al. [23] performed numerical simulations of liquid CO2 flooding using two heterogeneous pore-network models with contrasting permeability zones and found that, at low injection velocities, the displacement mechanism transitions from capillary fingering to viscous fingering as the injection rate increases. Shi et al. [30] employed LBM to systematically study the effects of viscosity, wettability, and gravity on the flow behavior of non-Newtonian fluids in porous media. Wang Yuxia et al. [44] developed a transient numerical model for immiscible CO2 displacement in low-permeability sandstone reservoirs, incorporating CO2 dissolution and gas slippage mechanisms. Ma Qingsong [42] applied the “laminar flow + diluted species transport” method to simulate CO2–Oil displacement under miscible, near-miscible, and immiscible conditions, showing that under miscible conditions, CO2 preferentially displaces oil from larger pore throats and subsequently invades smaller throats, thereby significantly improving the mobilization of oil trapped in narrow pores. Overall, comparative studies indicate that the “laminar flow + diluted species transport” method offers advantages in computational accuracy, numerical stability, and efficiency, and can effectively capture fluid transport and mass-transfer processes. It is therefore suitable for simulating multiphysics coupling processes, such as fluid flow and mass transfer, in low- and ultra-low-permeability reservoirs with complex pore structures [45,46,47,48].
Based on the above understanding, this study develops a pore-scale CO2 miscible displacement model to quantitatively analyze the migration and displacement behavior of CO2 in crude oil within a two-dimensional randomly packed porous medium. The model adopts a coupled “laminar flow + diluted species transport” framework to solve the incompressible flow field and CO2 concentration field within the pore network, thereby capturing the convection–diffusion coupling mechanism that governs miscible flooding. CO2 injection velocity, injection concentration, and dynamic viscosity are selected as the primary control variables. Their effects on CO2 migration rate, concentration distribution, and displacement-front propagation are systematically investigated, and their contributions to ultimate oil recovery are evaluated. The results provide a theoretical basis for clarifying pore-scale displacement mechanisms and optimizing CO2 injection parameters for field development.
2. Materials and Methods
2.1. Physical Model
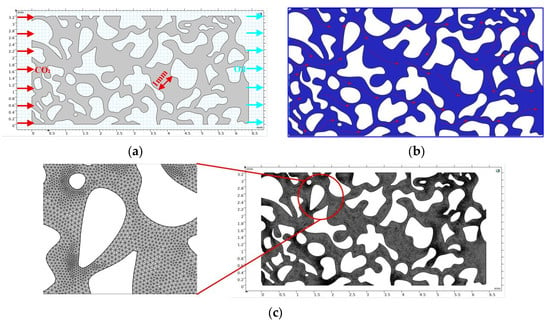
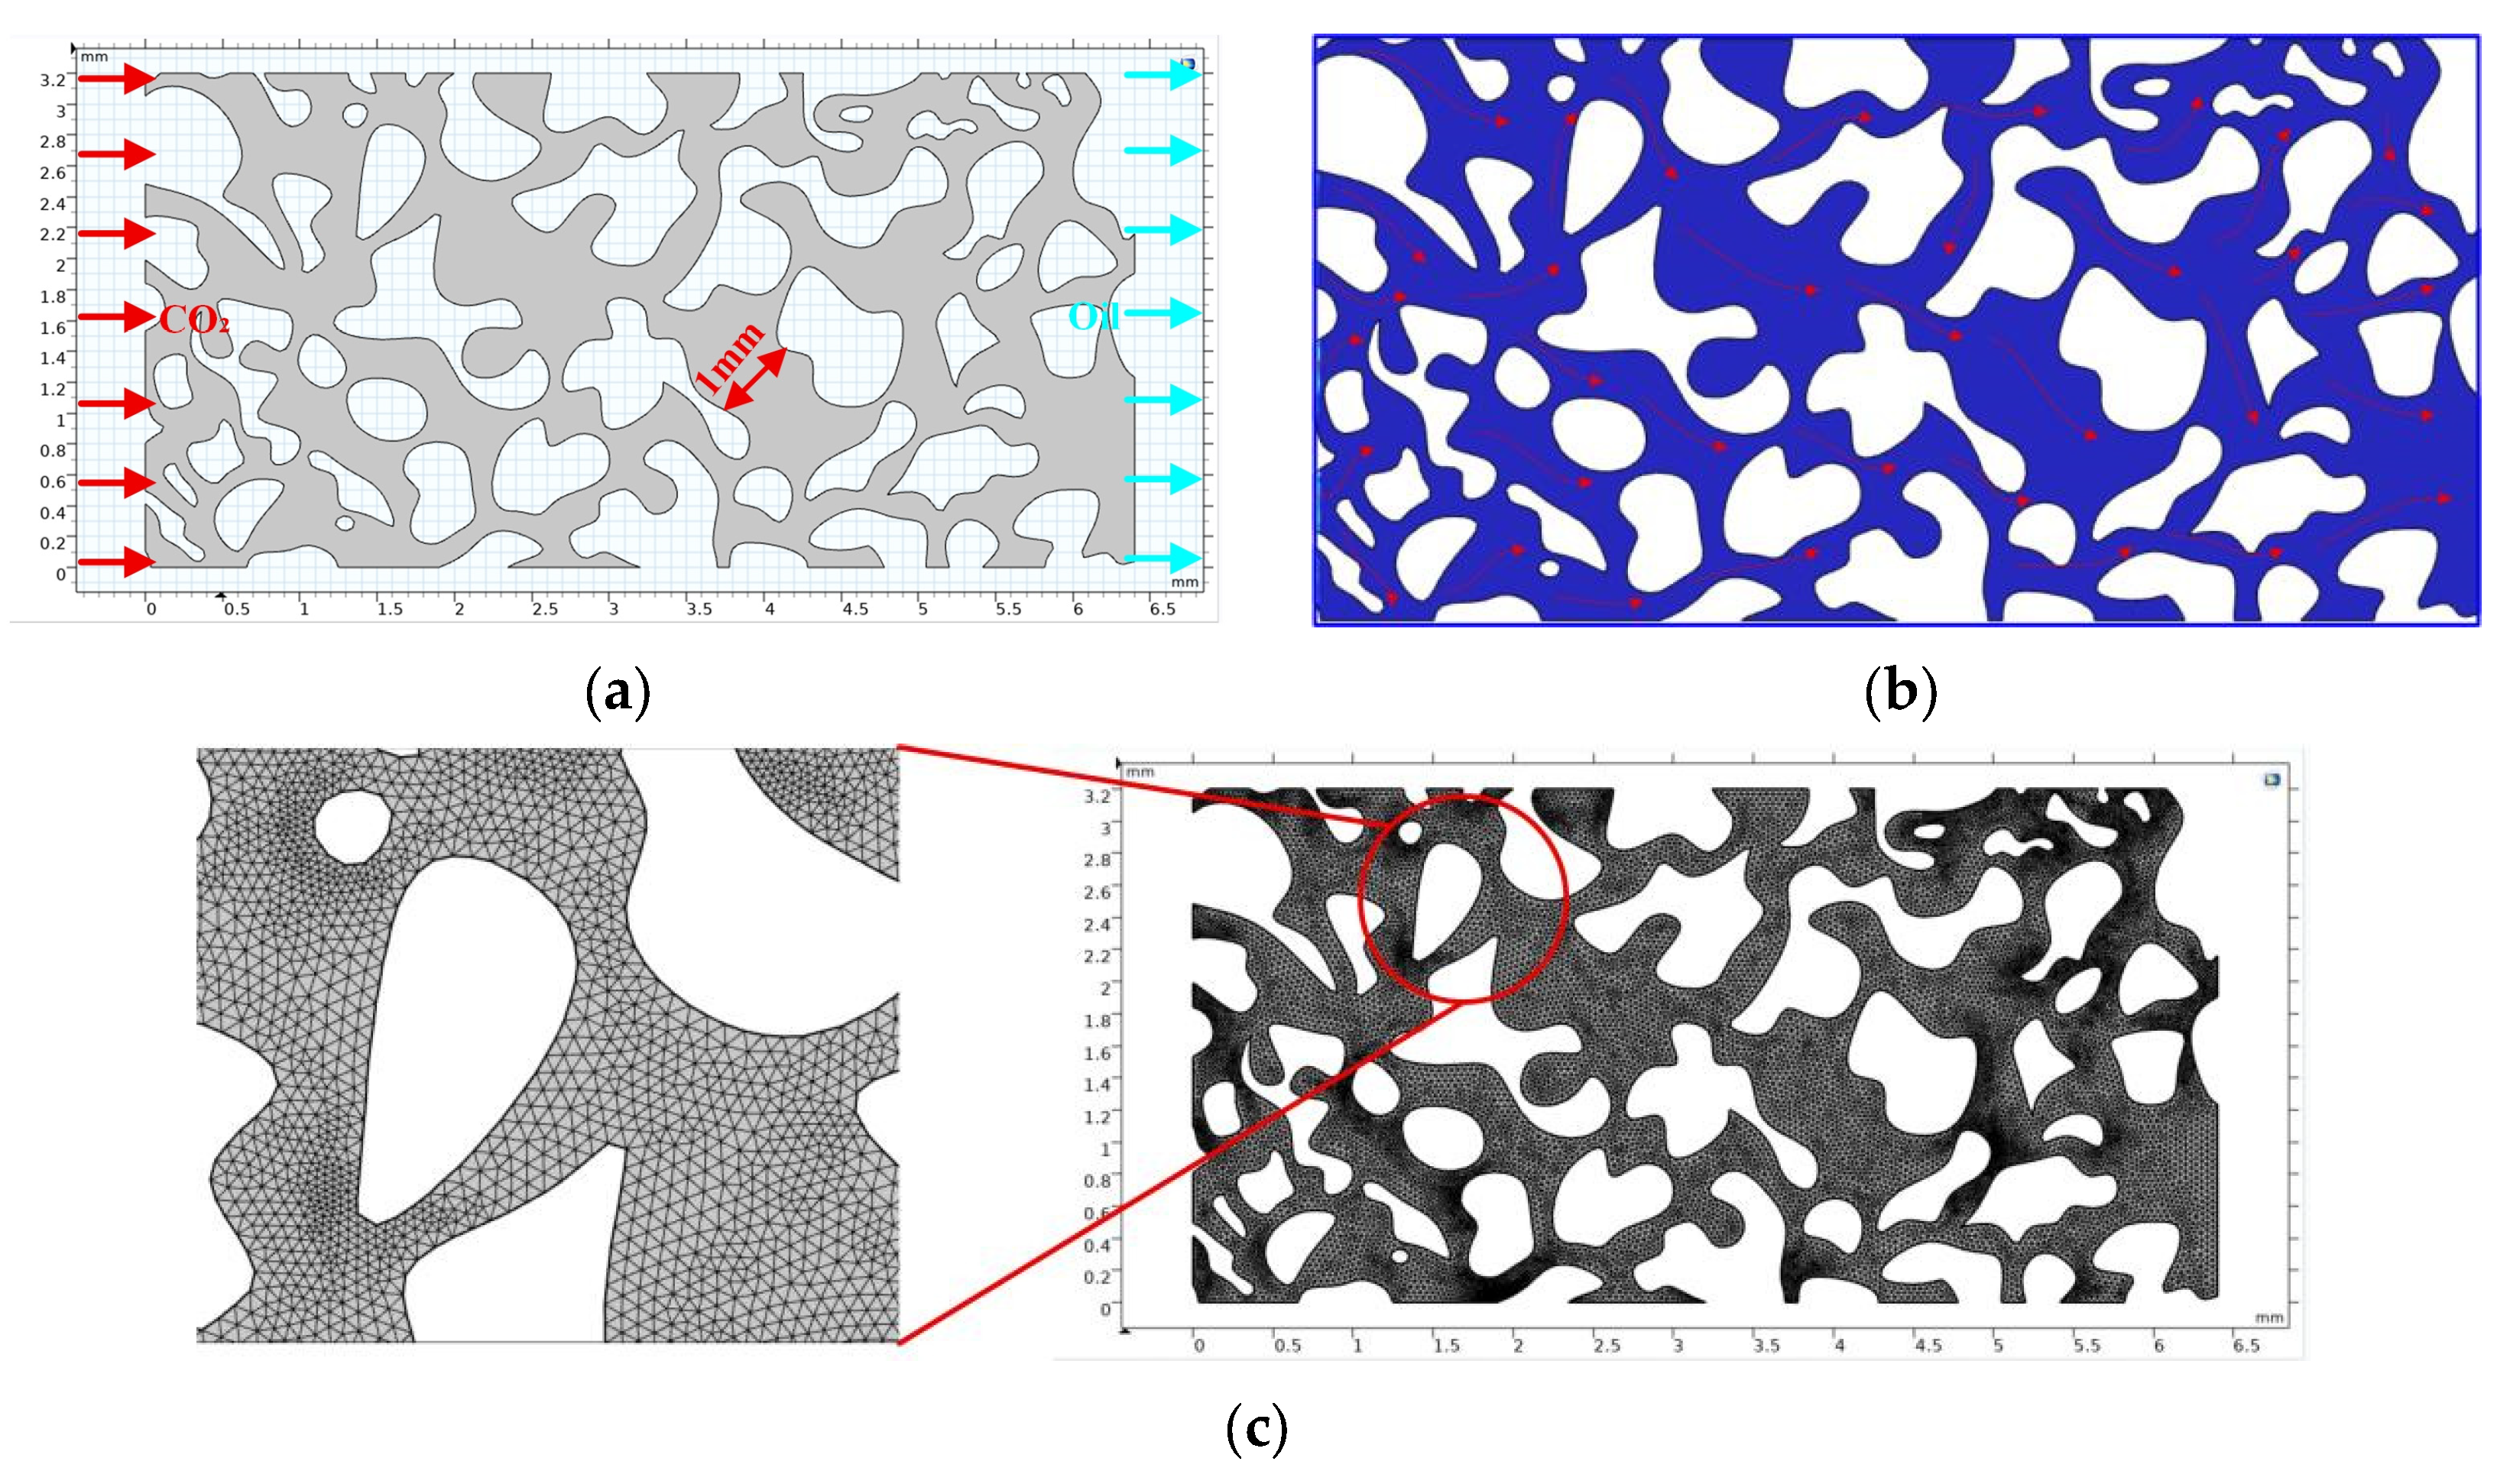
The geometric model shown in Figure 2a consists of a randomly generated by COMSOL Multiphysics 6.0 (Stockholm, Sweden), two-dimensional pore-channel structure with an outer boundary size of 6.2 mm × 3.2 mm. Figure 2b illustrates the initial state of the porous medium, in which all pore space is fully saturated with crude oil. The computational domain is discretized using an unstructured triangular mesh comprising 31,182 cells; the final mesh layout is shown in Figure 2c. A prescribed inlet pressure is applied at the left boundary, and zero-pressure outlet conditions are imposed on the right boundaries of the model. In contrast, no-slip boundary conditions are applied along the pore walls. Due to the strong geometric randomness of the pore structure, the channel widths and connectivity exhibit pronounced non-uniform spatial distribution, and the relevant parameters are summarized in Table 1. During the simulation, CO2 is injected from the left side of the model and migrates toward the outlet on the right, displacing the resident oil along the pore channels and ultimately producing a corresponding volume of oil at the outlet.
Figure 2.
Schematic of the 2D pore-channel physical model. (a) The geometric model; (b) All pore space is fully saturated with crude oil; (c) The final mesh layout of the model.
Table 1.
Boundary conditions of the model.
2.2. Mathematical Model
In CO2 flooding of low- and ultra-low-permeability reservoirs, the migration and interaction of CO2 and crude oil within porous media are complex processes governed by coupled convection and diffusion. At the pore scale, this process cannot be accurately described using simple algebraic equations or empirical correlations. Nevertheless, the continuity equation and the governing equations of mass and momentum conservation remain valid. Accordingly, a pore-scale flow model is established in this study, and a numerical framework combining laminar flow and diluted species transport is employed to solve the coupled flow and mass-transfer processes. This approach provides favorable numerical stability, high computational accuracy, and good efficiency, enabling reliable characterization of fluid displacement dynamics. Compared with alternative methods, the present framework directly couples pore-scale flow with two-phase transport without requiring explicit interface tracking [41,42,44,49]. The analysis focuses on three key control parameters: CO2 injection velocity, CO2 concentration, and dynamic viscosity. These parameters directly influence the driving force of fluid motion, the diffusive capability, and the flow resistance, respectively, thereby significantly affecting displacement efficiency and ultimate oil recovery, providing a basis for optimal design of CO2 flooding parameters.
The pore-scale miscible CO2 flooding process involves highly complex flow and mass-transfer behavior, making numerical modeling computationally intensive and intricate. To simplify the simulations and improve computational efficiency while maintaining physical plausibility, the following assumptions are adopted:
- (1)
- During the oil displacement process, molecular diffusion of CO2 in the oil phase is relatively slow; moreover, within the pressure–temperature range considered in this study, the influence of compositional variations on the diffusion coefficient is secondary. Therefore, the variation in the CO2 diffusion coefficient in the oil phase is neglected [15].
- (2)
- Both the CO2 phase and the crude oil phase are treated as incompressible Newtonian fluids; that is, their density and viscosity do not vary appreciably with pressure and/or concentration, and the shear stress is linearly proportional to the shear rate [42].
- (3)
- CO2 flow in the porous medium is assumed to follow Darcy’s law, and inertial effects as well as potential non-Darcy terms that may arise under high flow rates or in the near-wellbore region are neglected [50].
- (4)
- Two-phase CO2–oil flow within the porous medium is assumed to be isothermal; thus, the Joule–Thomson effect, heat release/absorption associated with dissolution and/or miscible mixing, and viscosity–density variations induced by temperature gradients are ignored [51].
- (5)
- When the pressure reaches or exceeds the minimum miscibility pressure (MMP) and miscibility is achieved, the interfacial tension is assumed to approach zero, so capillary forces are not explicitly considered. In addition, oil swelling, extraction/exchange of light components, phase behavior/compositional evolution, and chemical reactions induced by miscible conditions are treated as secondary effects and therefore neglected; the displacement behavior is represented using an “effective miscibility” approximation [15,52].
2.2.1. Fluid Flow Equations
In the numerical simulations of this study, the Reynolds number of the flow system is Re < 1 (), indicating that the model operates in a typical viscosity-dominated laminar flow regime throughout. Under these conditions, inertial effects are neglected, and fluid motion is primarily controlled by viscous resistance. Therefore, the fluid dynamics during the displacement process can be described using the principles of mass and momentum conservation. By resolving the spatial and temporal distributions of fluid velocity, density, pressure, and dynamic viscosity, the flow behavior of fluids within complex porous media can be elucidated [53]:
In the governing equations, the variables and parameters are defined as follows: is the fluid density (kg/m3); u is the fluid velocity (m/s); t is time (s); p is the reservoir pressure (MPa); I is the unit vector; is the dynamic viscosity of the fluid (mPa·s); F is the interfacial tension (N/m3); K is the viscous stress tensor.
2.2.2. Convection–Diffusion Equation
The convection–diffusion equation is widely used to describe the coupled processes of fluid flow and chemical species transport, and is well suited for simulating mass transport in porous media. This equation describes solute transport in a fluid when the solid skeleton remains stationary, and can also represent convection and diffusion within a gaseous medium under the assumption of a stationary gas phase. Based on the principles of mass conservation and dispersion (diffusion), the convection–diffusion process can be expressed as [54]:
In the governing equations, is the CO2 concentration (mol/m3); is the diffusive flux (m/s); is the source term; is the diffusion coefficient.
During the displacement process under miscible conditions, the continuity equation, flow (momentum) equation, and convection–diffusion equation can be written as follows [50]:
In the governing equations, denotes the velocity (m/s); is the density (kg/m3).
In the governing equations, is the viscosity of CO2 (mPa·s); is the CO2 concentration in the pore space of the rock matrix (mol/m3).
In the governing equations, D is the diffusion coefficient of CO2 in the sandstone pore channels (m2/s).
2.3. Numerical Verification
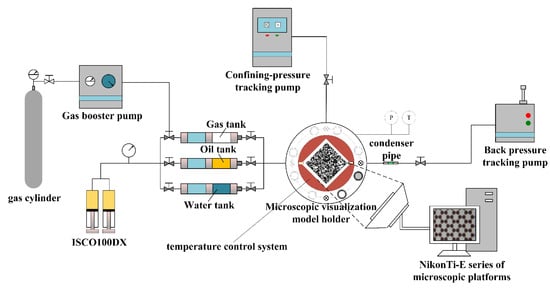
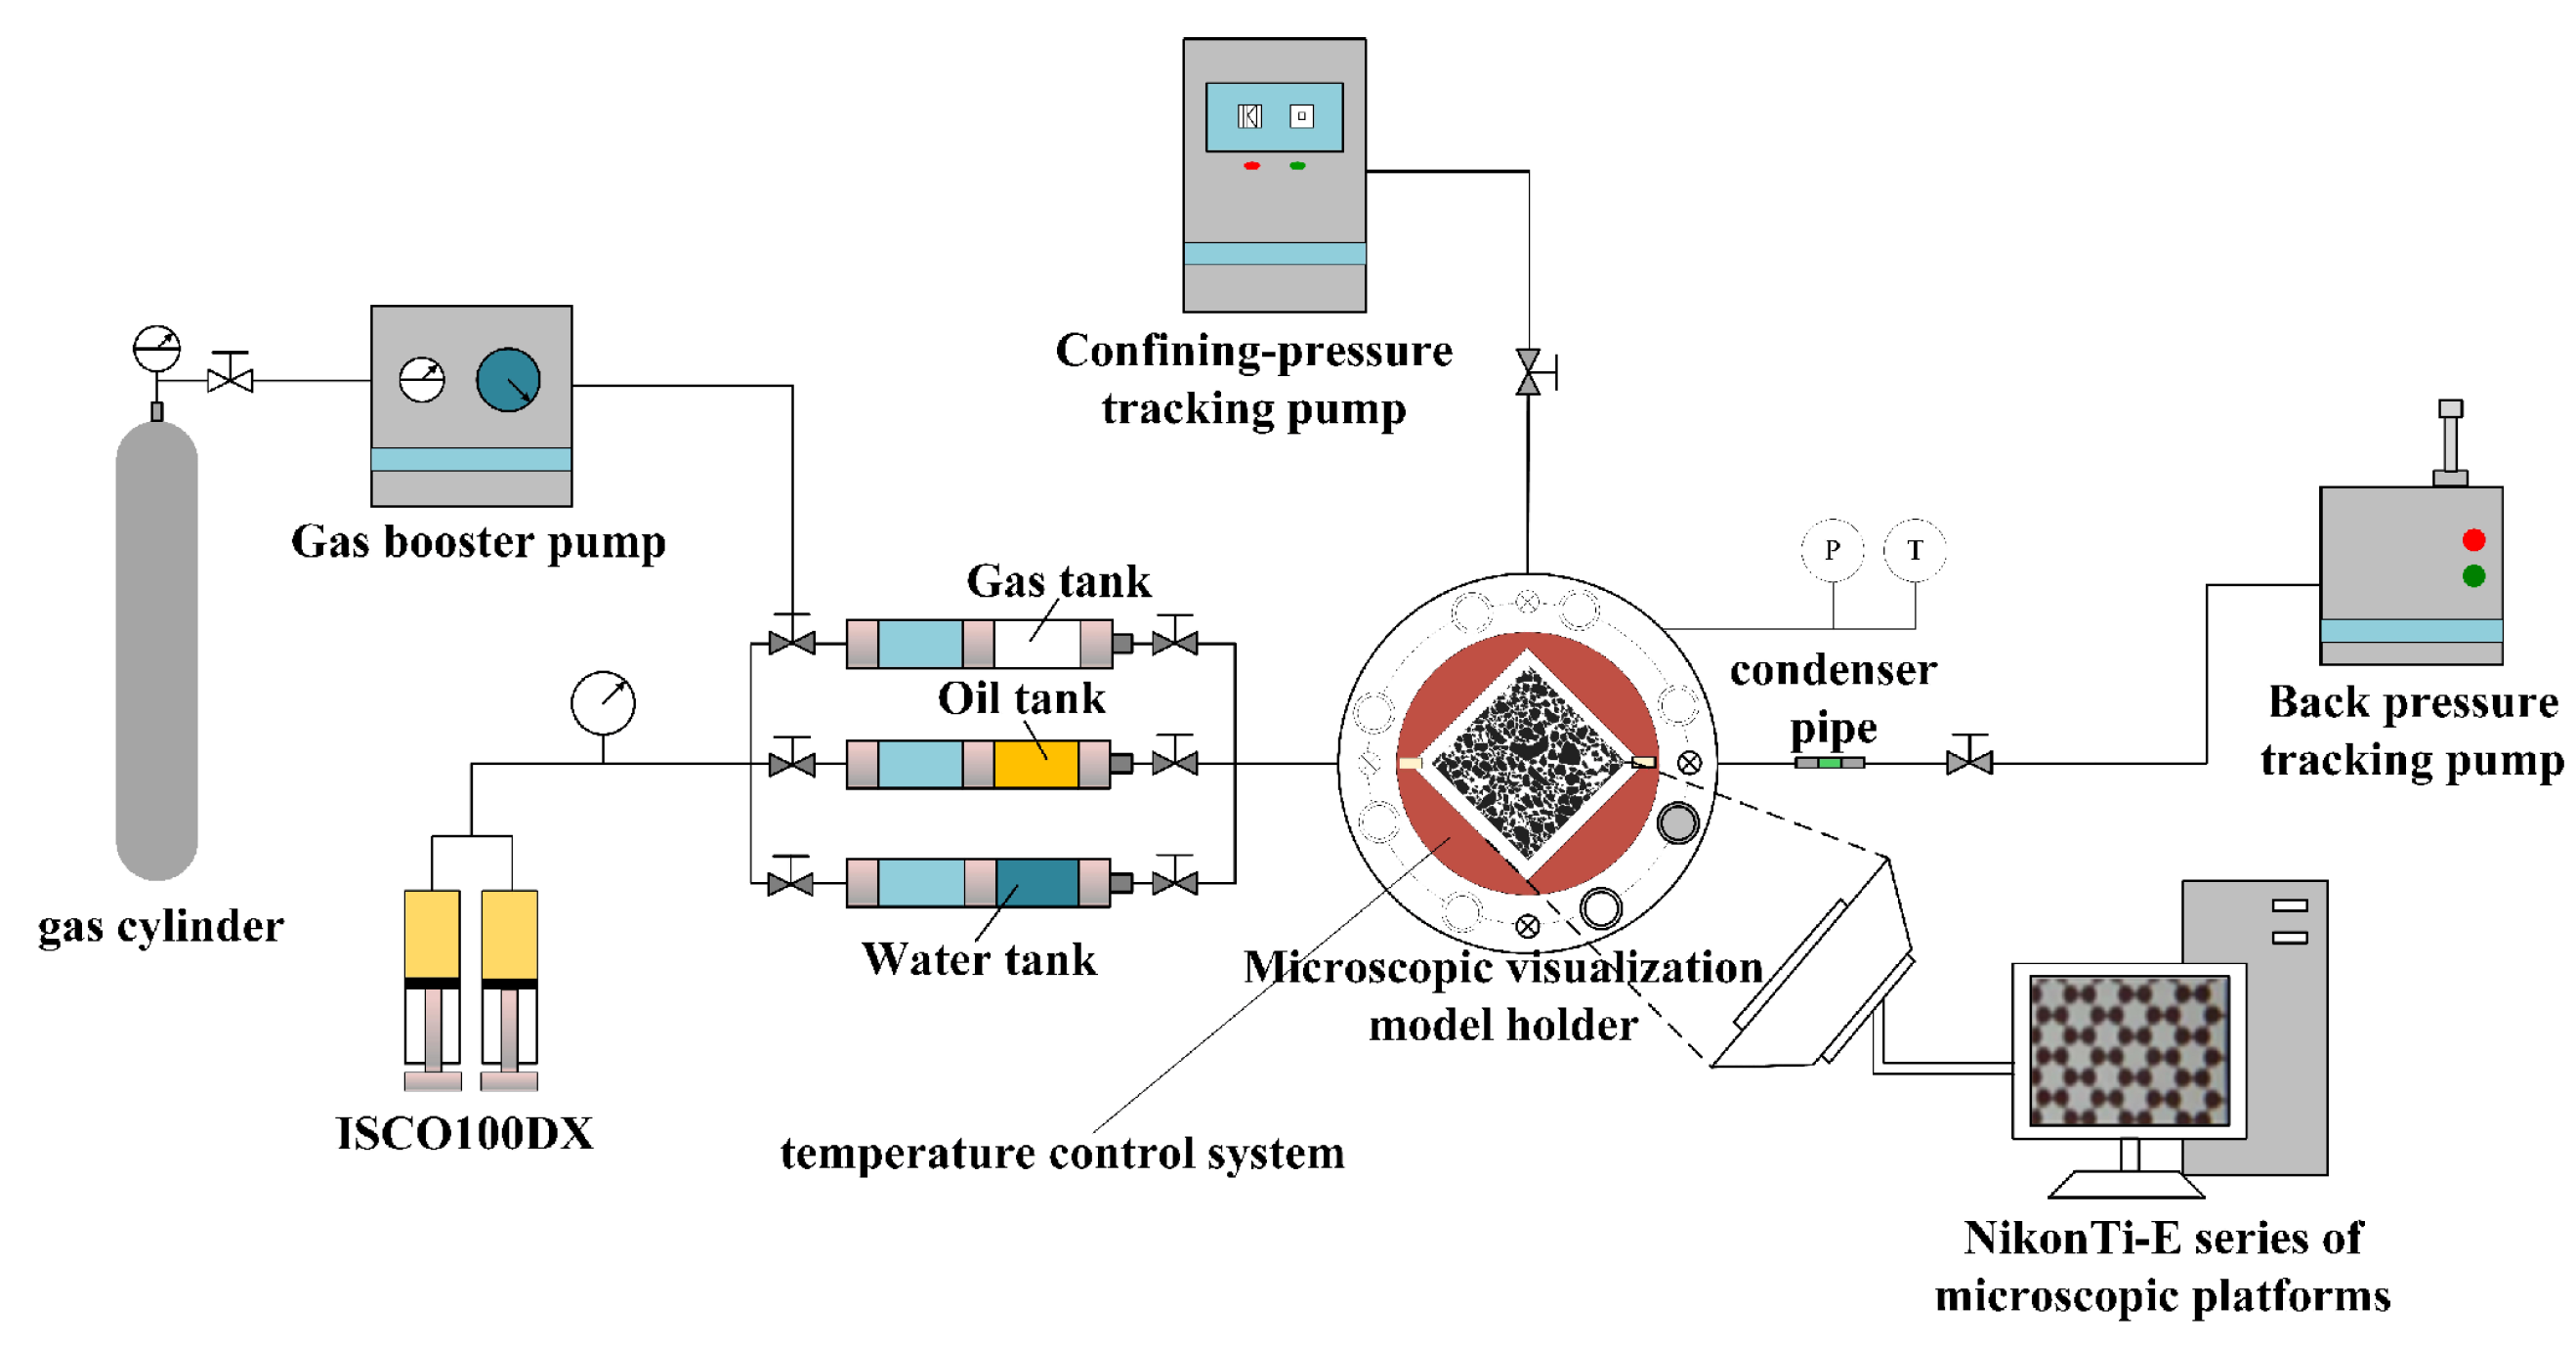
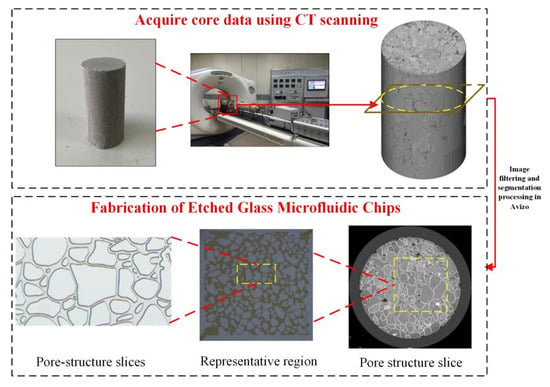
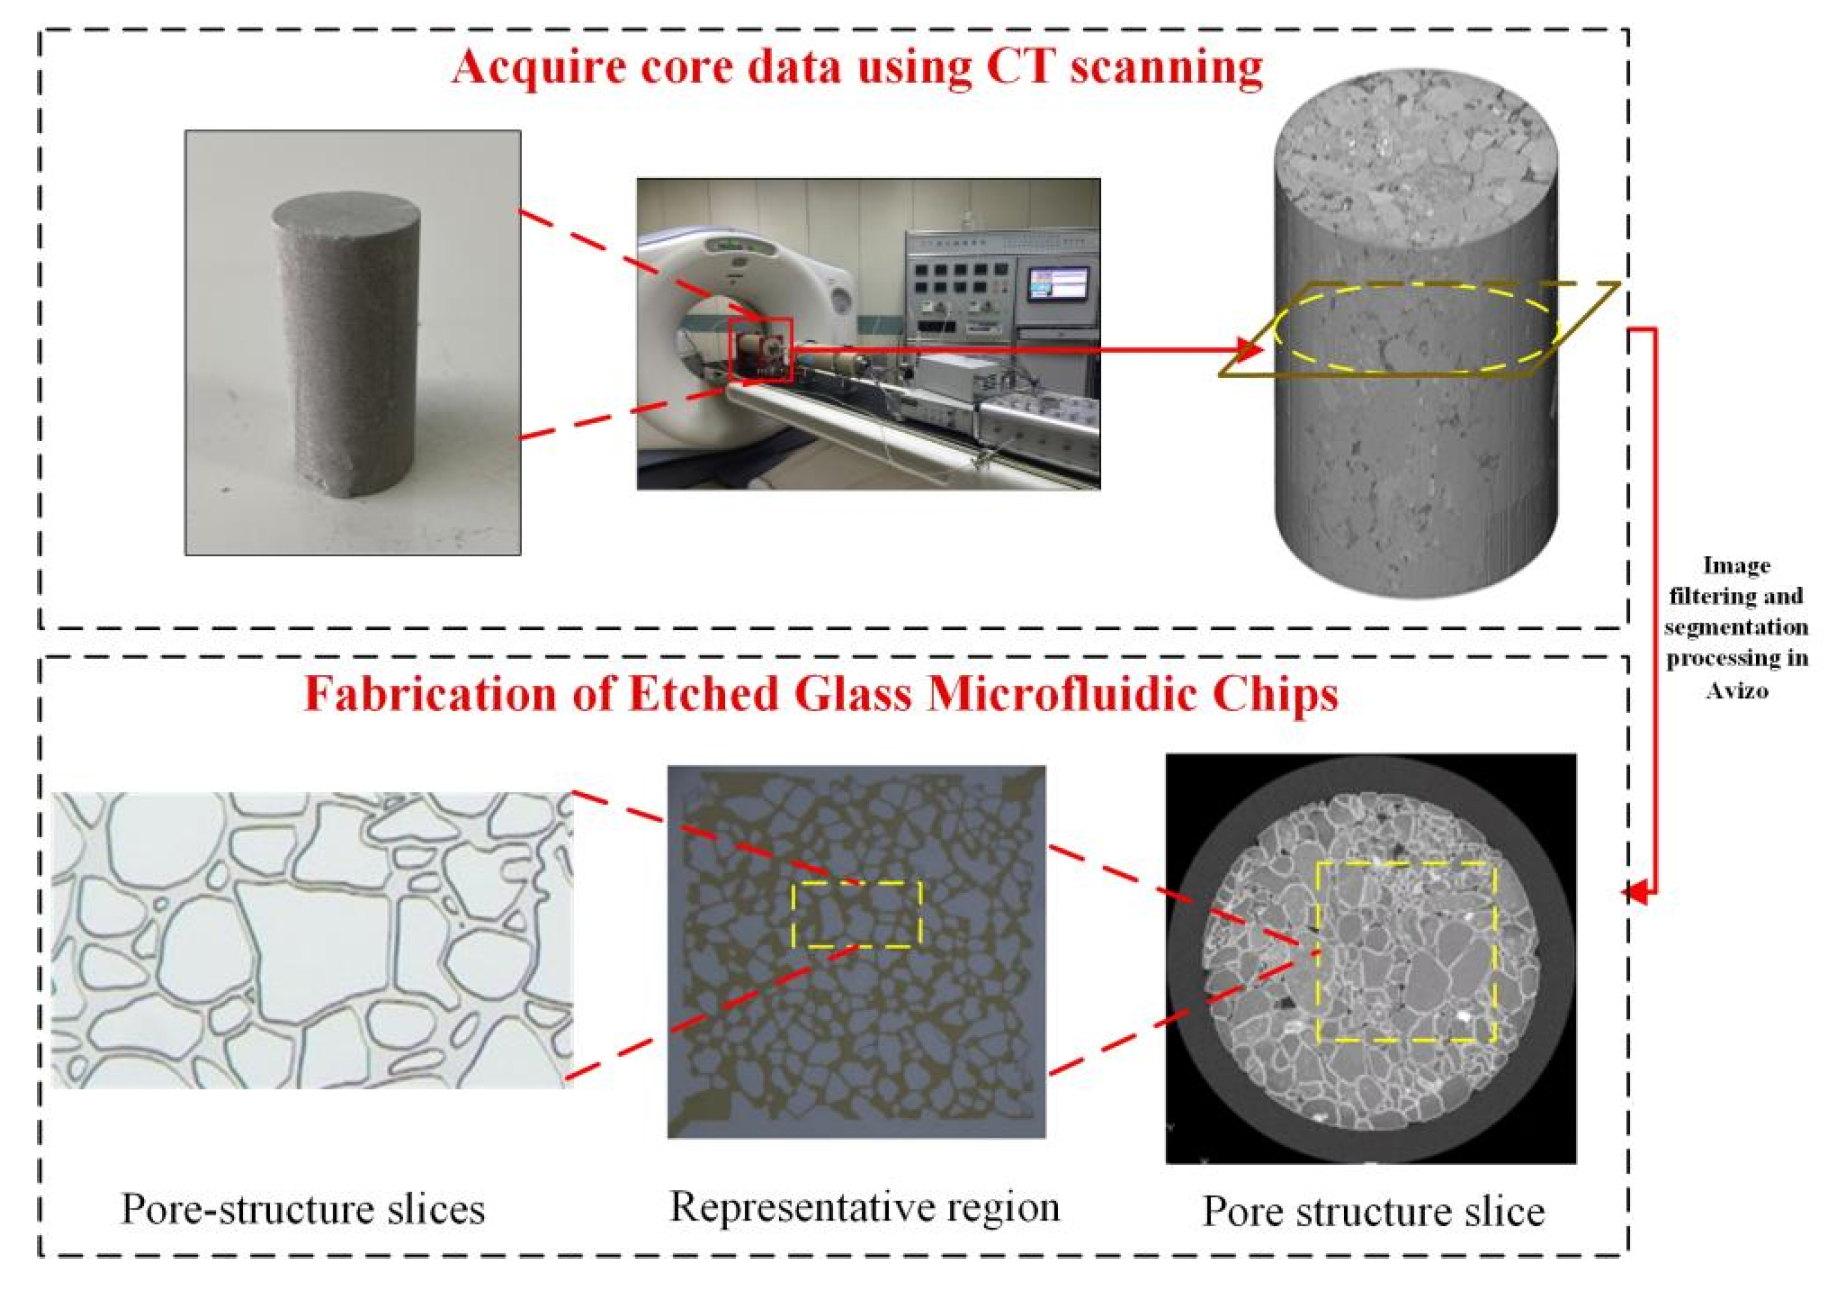
To ensure the reliability and applicability of the constructed pore-scale numerical model, a combined numerical analysis and physical-experiment approach was employed. The experimental component consisted of pore-scale microfluidic CO2 flooding tests, with the experimental setup shown in Figure 3. The microfluidic chip was fabricated based on the real pore structure obtained from CT scanning of reservoir cores from a field demonstration area in the Yanchang Oilfield, China. The pore geometry was subsequently processed via glass-etching techniques to produce a two-dimensional pore network whose geometric morphology and scale closely match those of the numerical model (Changyuan Oilfield, Shaanxi, China); the detailed fabrication procedure is illustrated in Figure 4. To validate the pore-scale model, a glass-etched chip with the same pore structure as in the numerical simulations was selected for microfluidic experiments. The key parameters used in both experiments and simulations are summarized in Table 2.
Figure 3.
Schematic of the microfluidic experimental setup [55].
Figure 4.
Fabrication procedure of the glass-etched microfluidic chip.
Table 2.
Input parameters used in the physical experiments and numerical simulations.
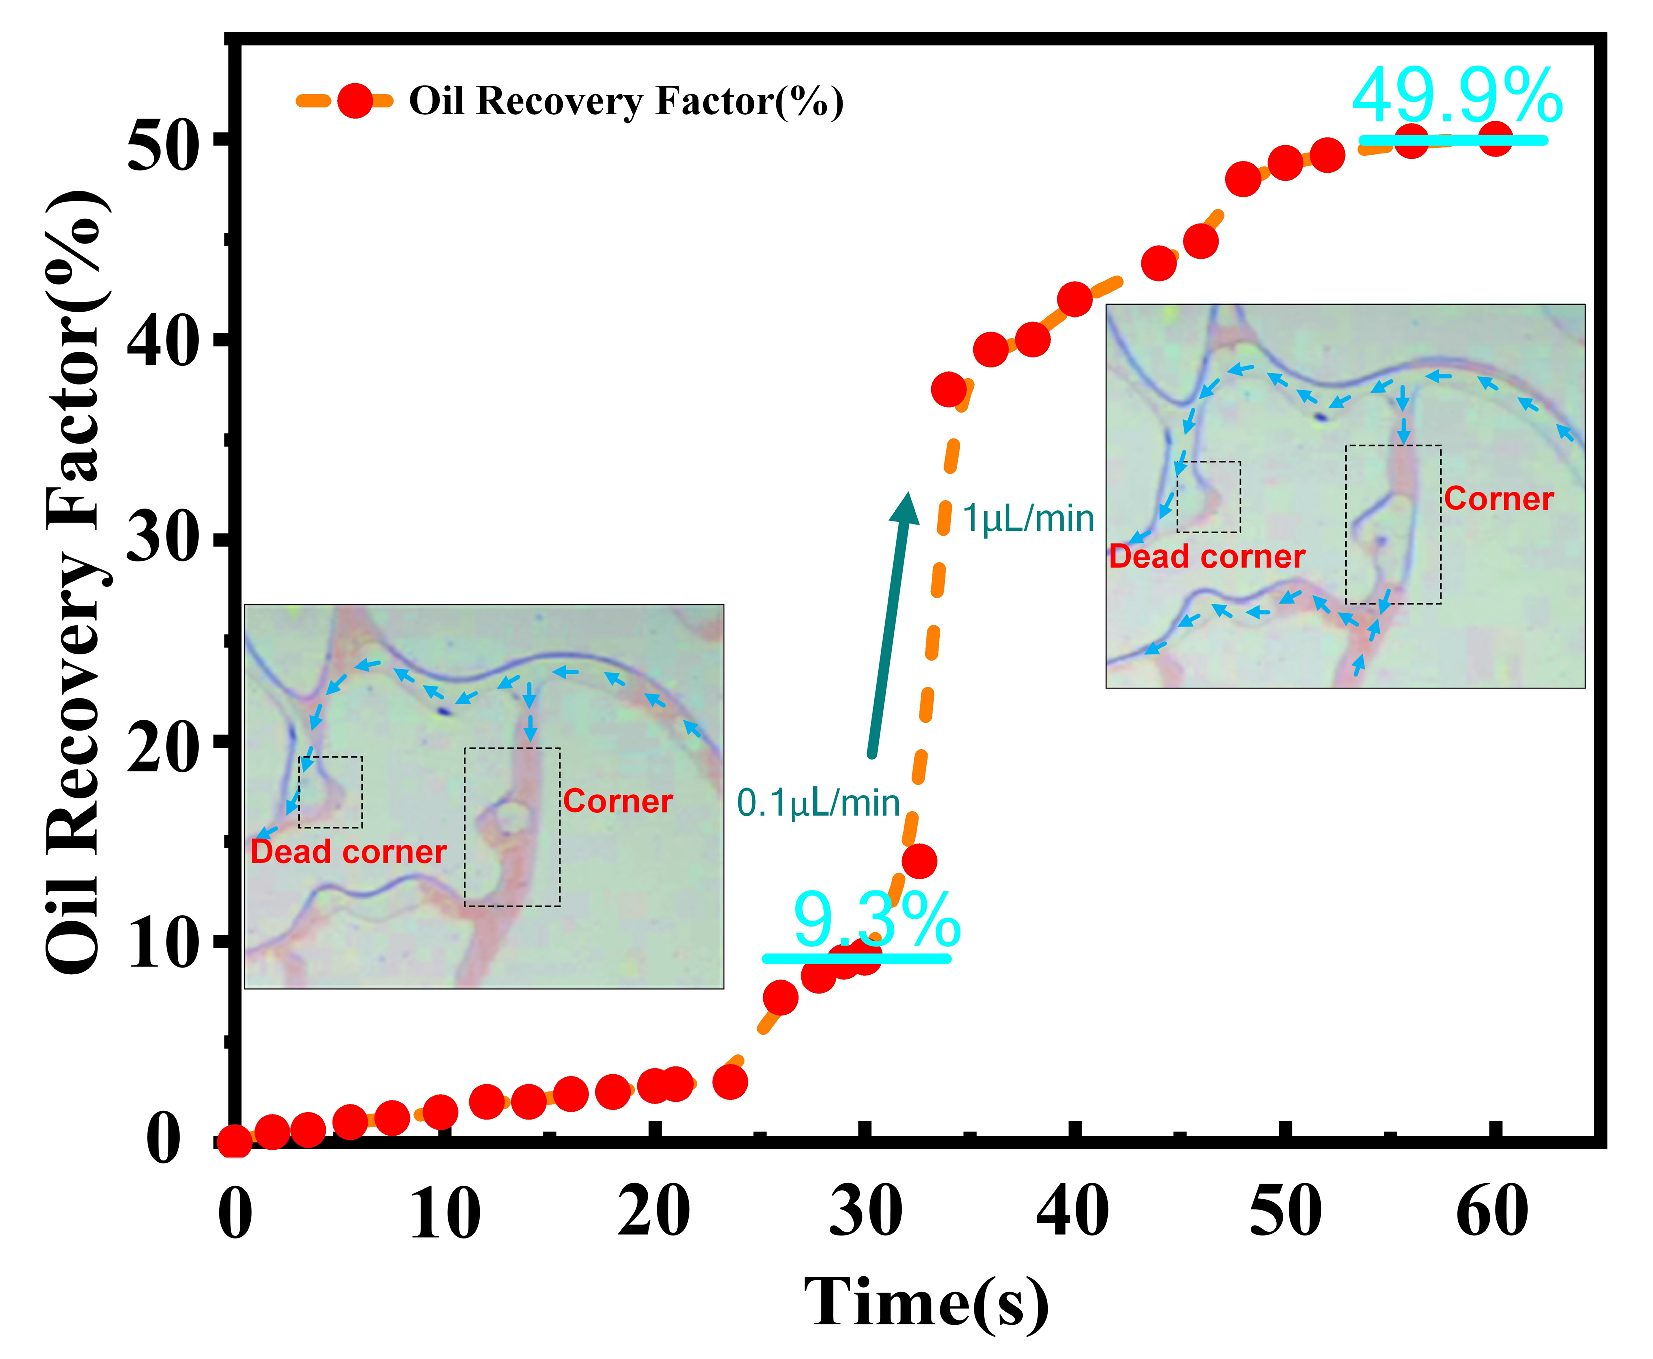
During the experiments, the glass-etched chip was mounted in a micro-visualization model holder and saturated with crude oil under a confining pressure of 8 MPa and a temperature of 50 °C. CO2 was injected at flow rates of 0.1 μL/min and 1 μL/min, respectively, until no additional oil was produced at the outlet. Based on this, the oil recovery under different injection rates was calculated, as shown in Figure 5.
Figure 5.
Experimental oil recovery as a function of CO2 injection rate.
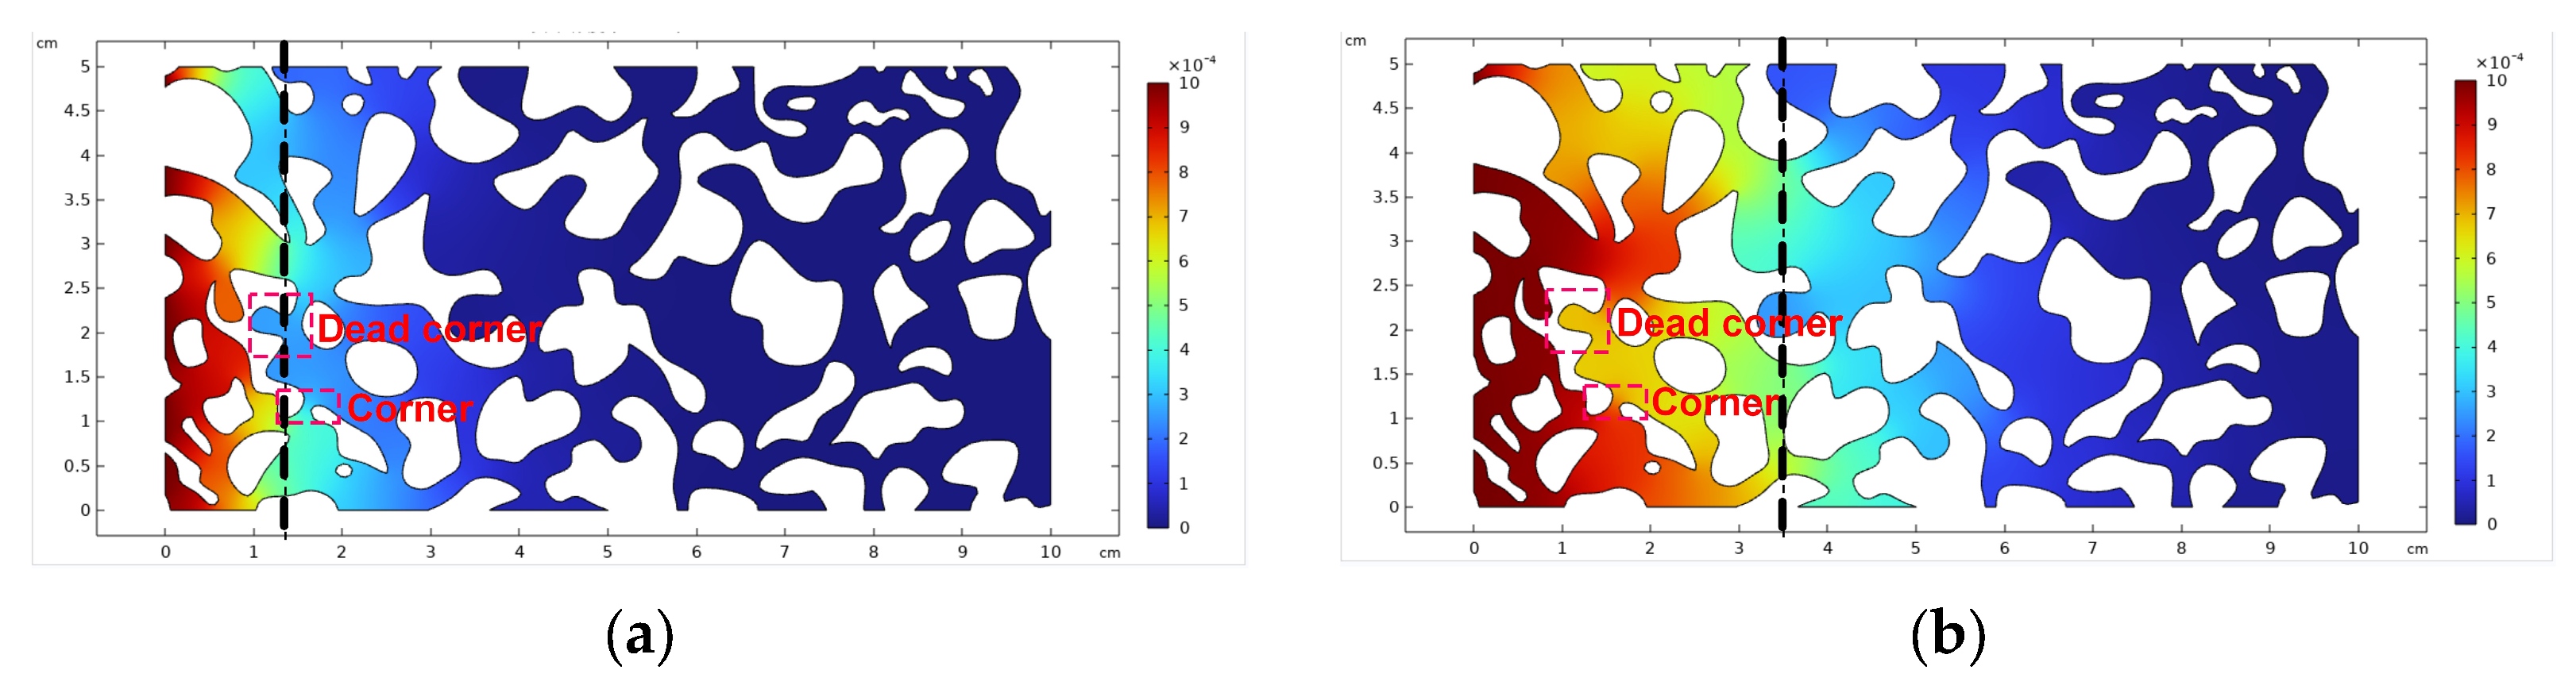
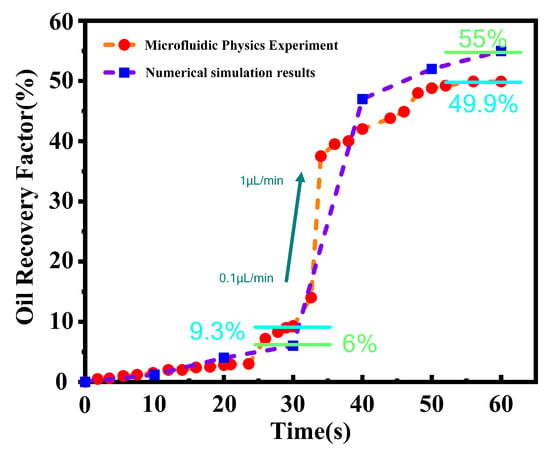
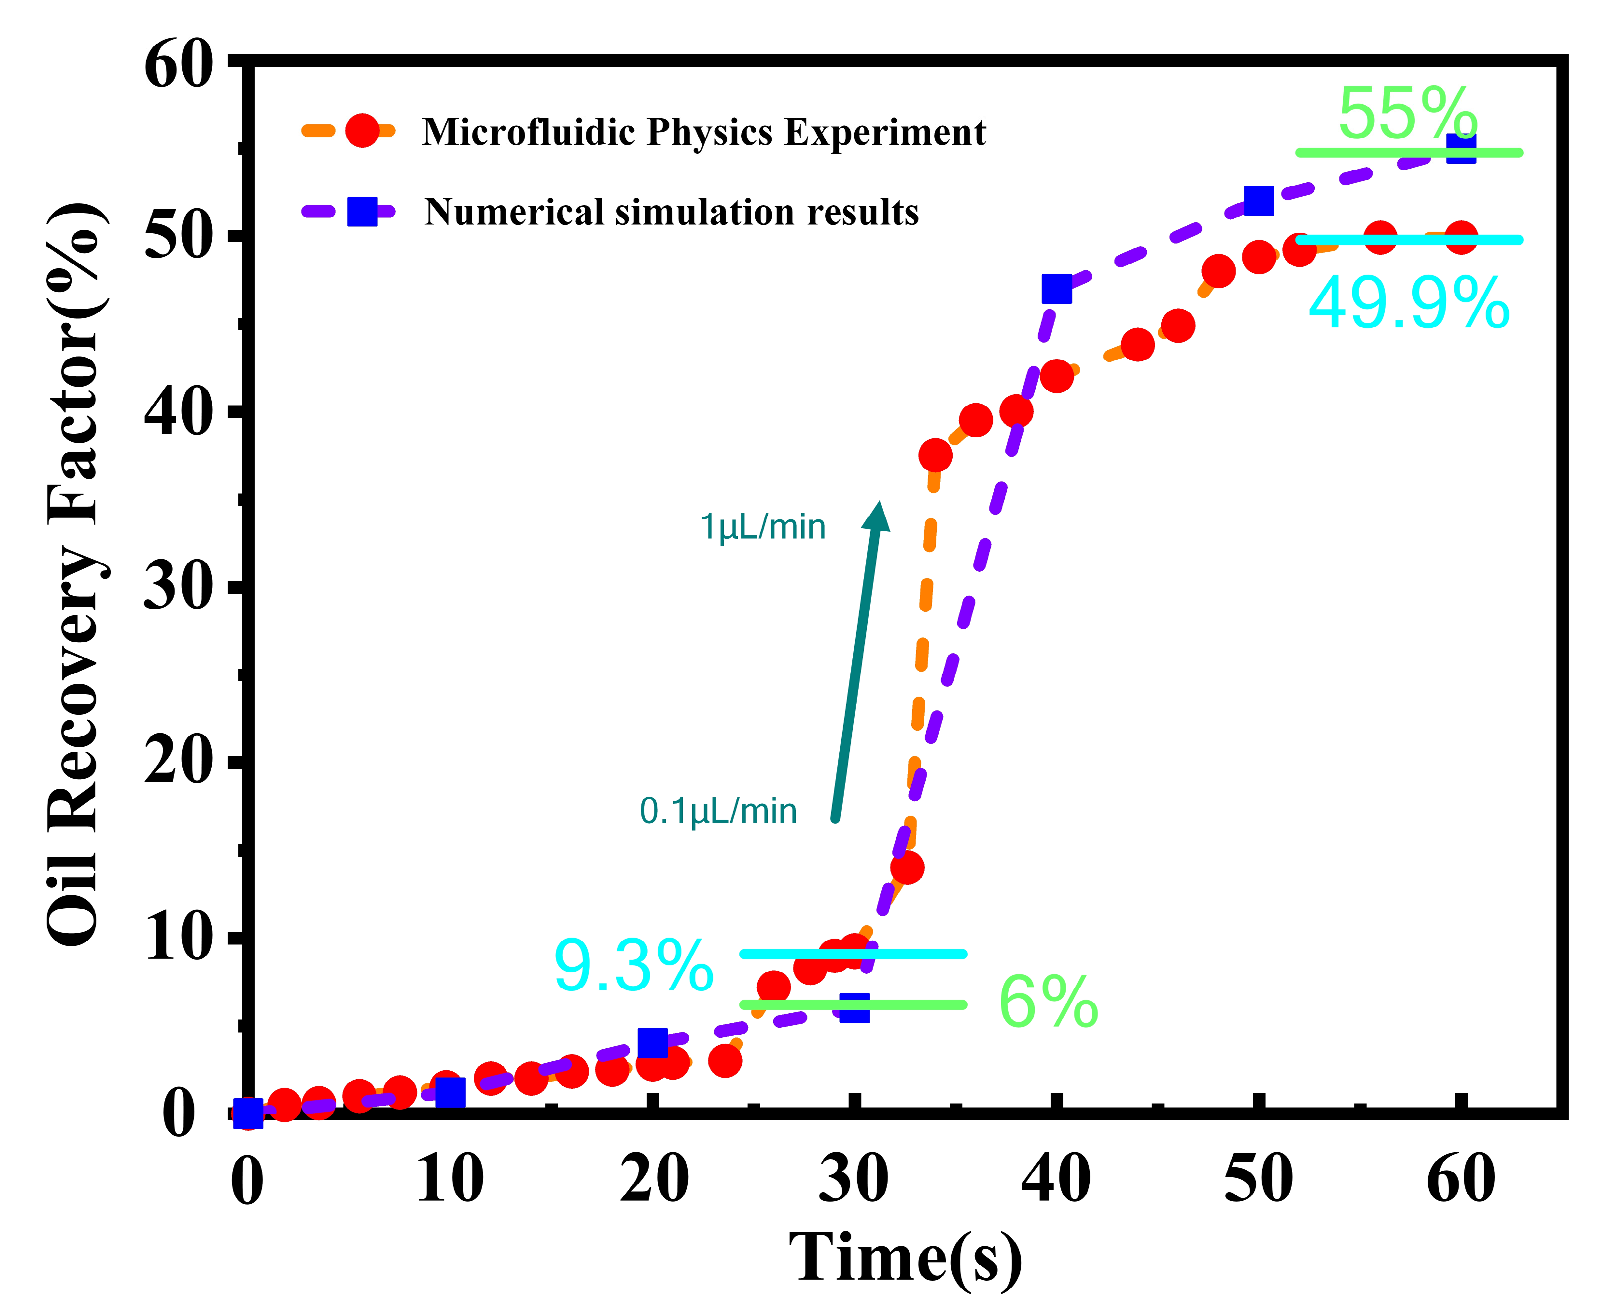
Figure 6 presents the numerical simulation results under the same operating conditions. A comparison between the residual oil spatial distributions obtained from microfluidic experiments and simulations after flooding indicates that, with increasing injection rate, the mobilization of residual oil in dead-end pores and corner regions is significantly enhanced, and the simulated trends align well with the experimental observations. The oil recovery at different injection rates is determined by using Adobe Photoshop to extract and quantify the oil-colored pixels in the final images and combining this with the oil-colored area extracted from the initial fully oil-saturated image. Furthermore, as shown in Figure 7, the relative error between simulated and experimental oil recovery remains within 10%. These results demonstrate that the developed pore-scale numerical model effectively captures flow behavior and residual oil distribution during miscible CO2 flooding, thereby confirming the model’s accuracy and feasibility.
Figure 6.
The variation in recovery rate with injection rate (the black line in the figure represents the same time). (a) The inset shows the CO2 flooding pattern at an injection rate of 0.1 µL/min; (b) The inset shows the CO2 flooding pattern at an injection rate of 1 µL/min.
Figure 7.
Comparison of simulated and experimental oil recovery as a function of CO2 injection rate.
3. Results
The numerical investigation is divided into three groups of simulation cases.
- (a)
- In the first group, the effects of injection rate on the displacement mechanism and oil recovery are examined at a fixed CO2 concentration and dynamic viscosities of 0.001 mol·m−3 and 15 mPa·s, respectively (A1–A9, Table 3).Table 3. Numerical simulation schemes.
- (b)
- The second group investigates the influence of CO2 injection concentration on the displacement process at a constant injection velocity of 0.01 m·s−1 and a continuous dynamic viscosity of 15 mPa·s (B1–B9, Table 3).
- (c)
- The third group analyzes the effect of CO2 dynamic viscosity on oil recovery under fixed injection velocity and CO2 concentration (C1–C9, Table 3).
3.1. Effect of CO2 Injection Velocity on Displacement Performance
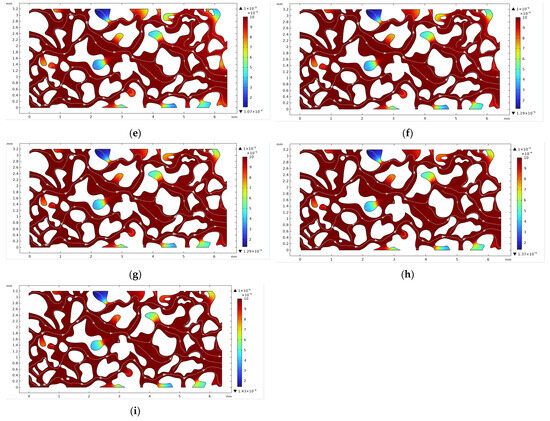
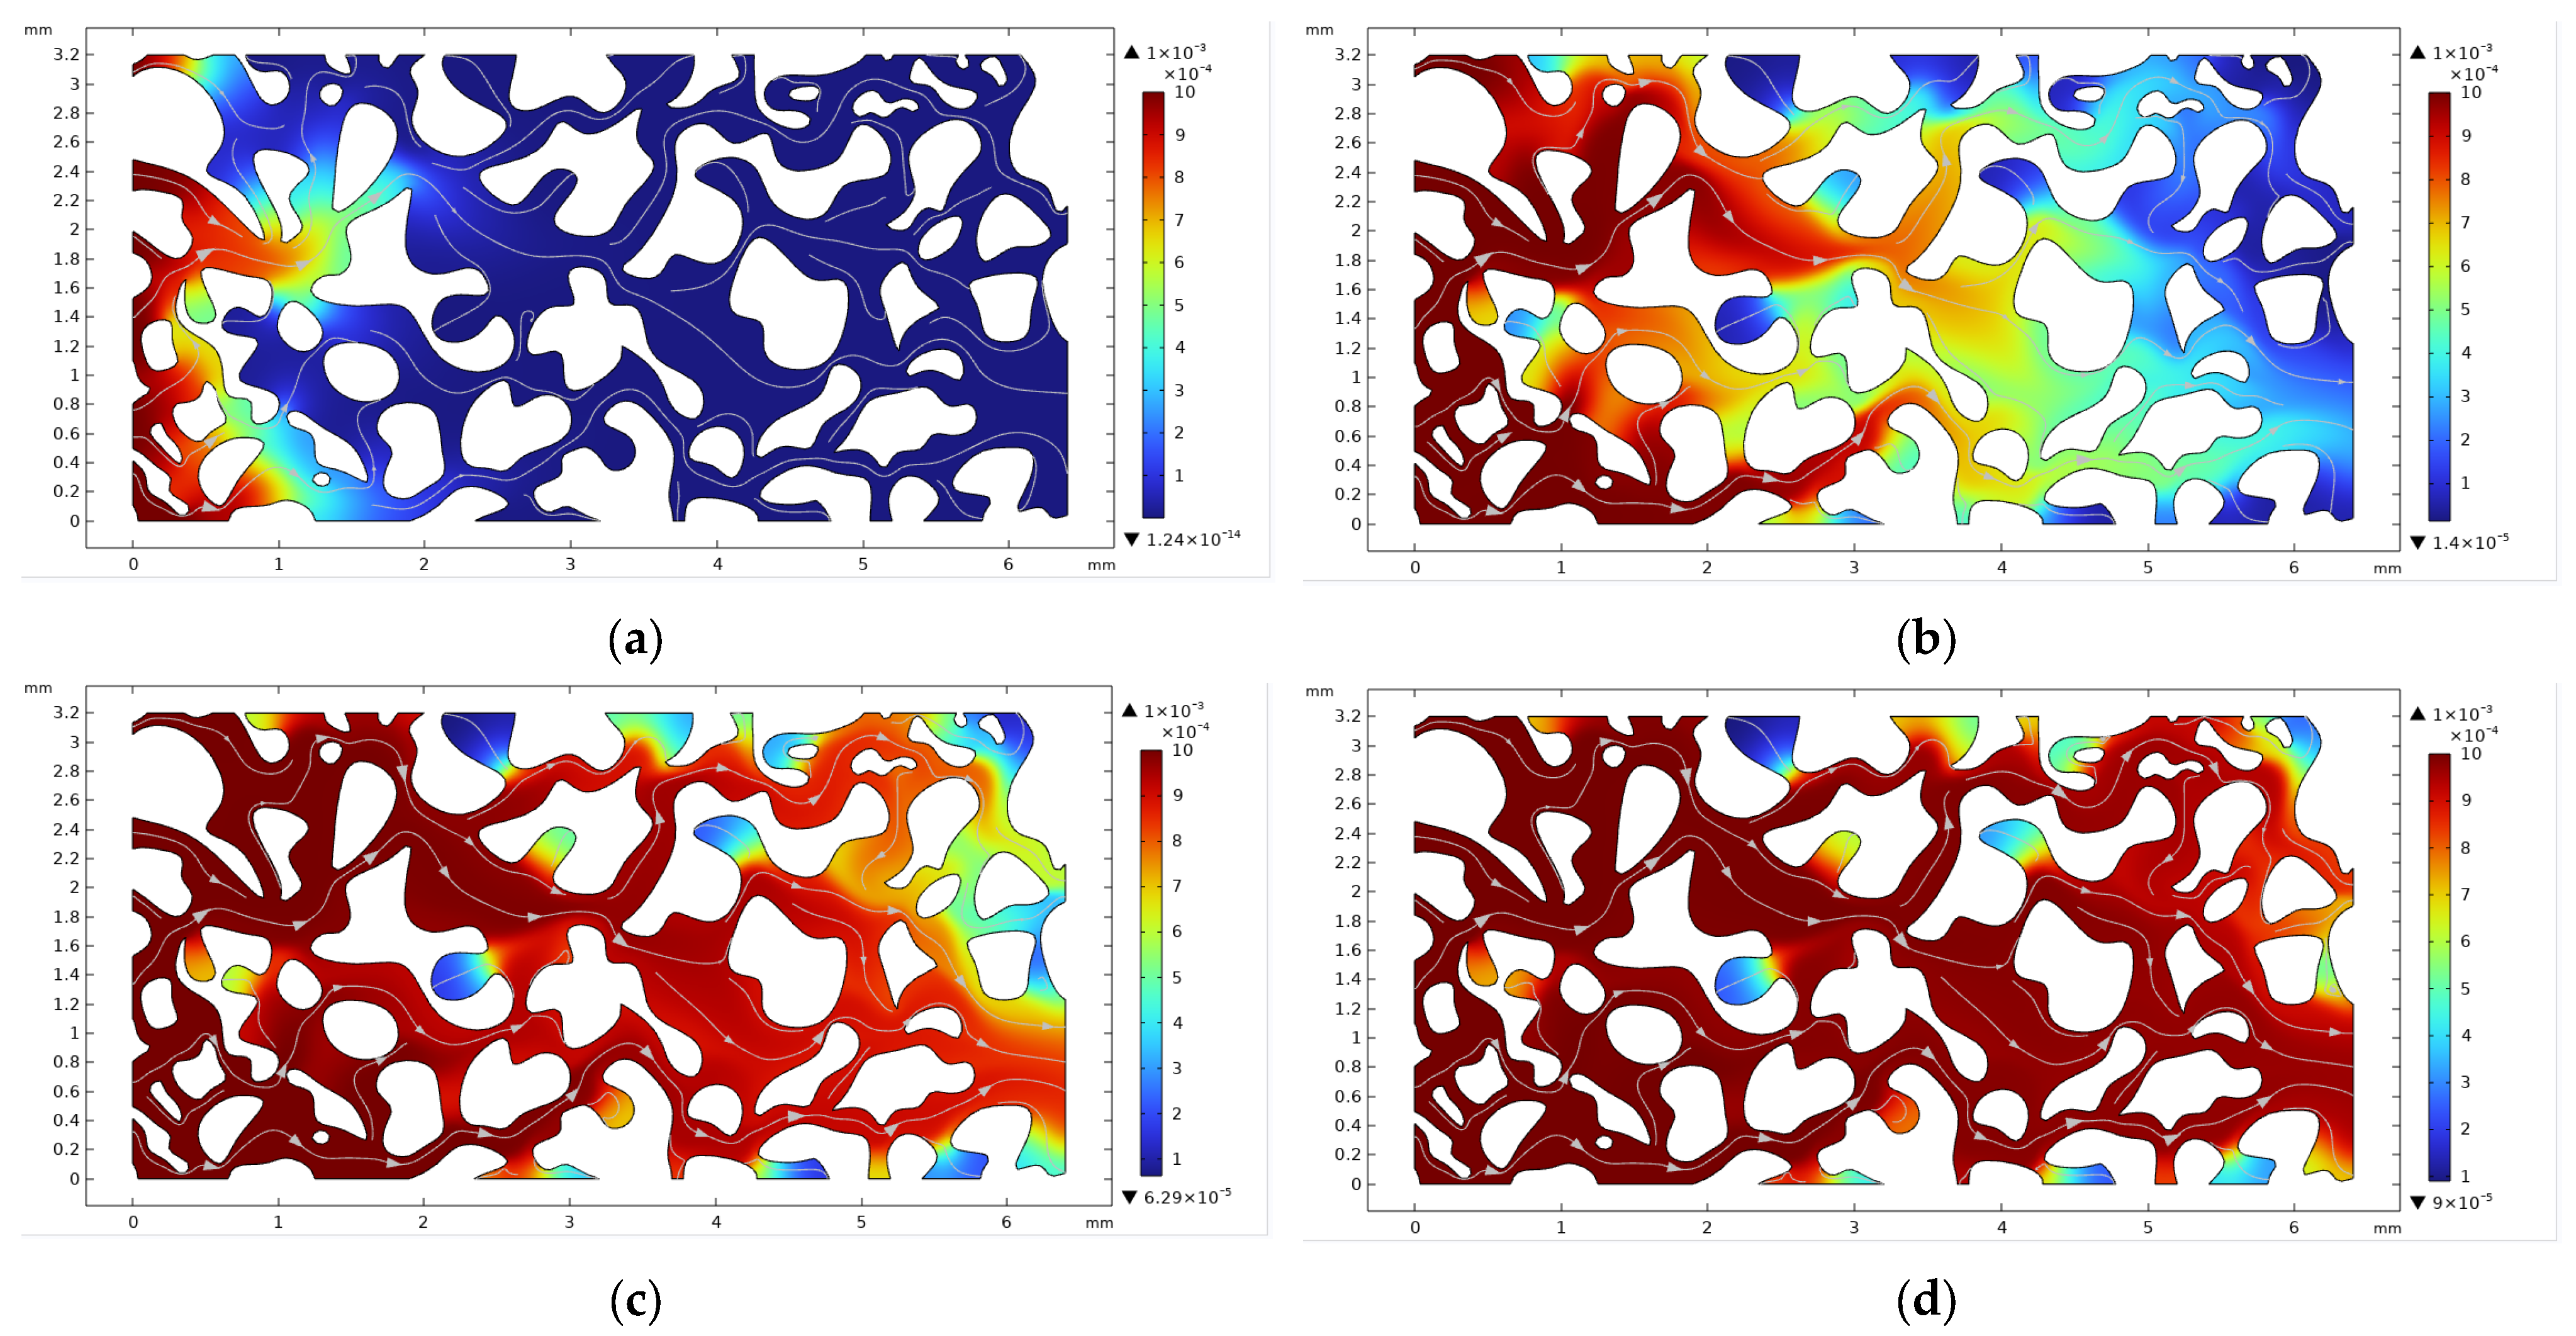
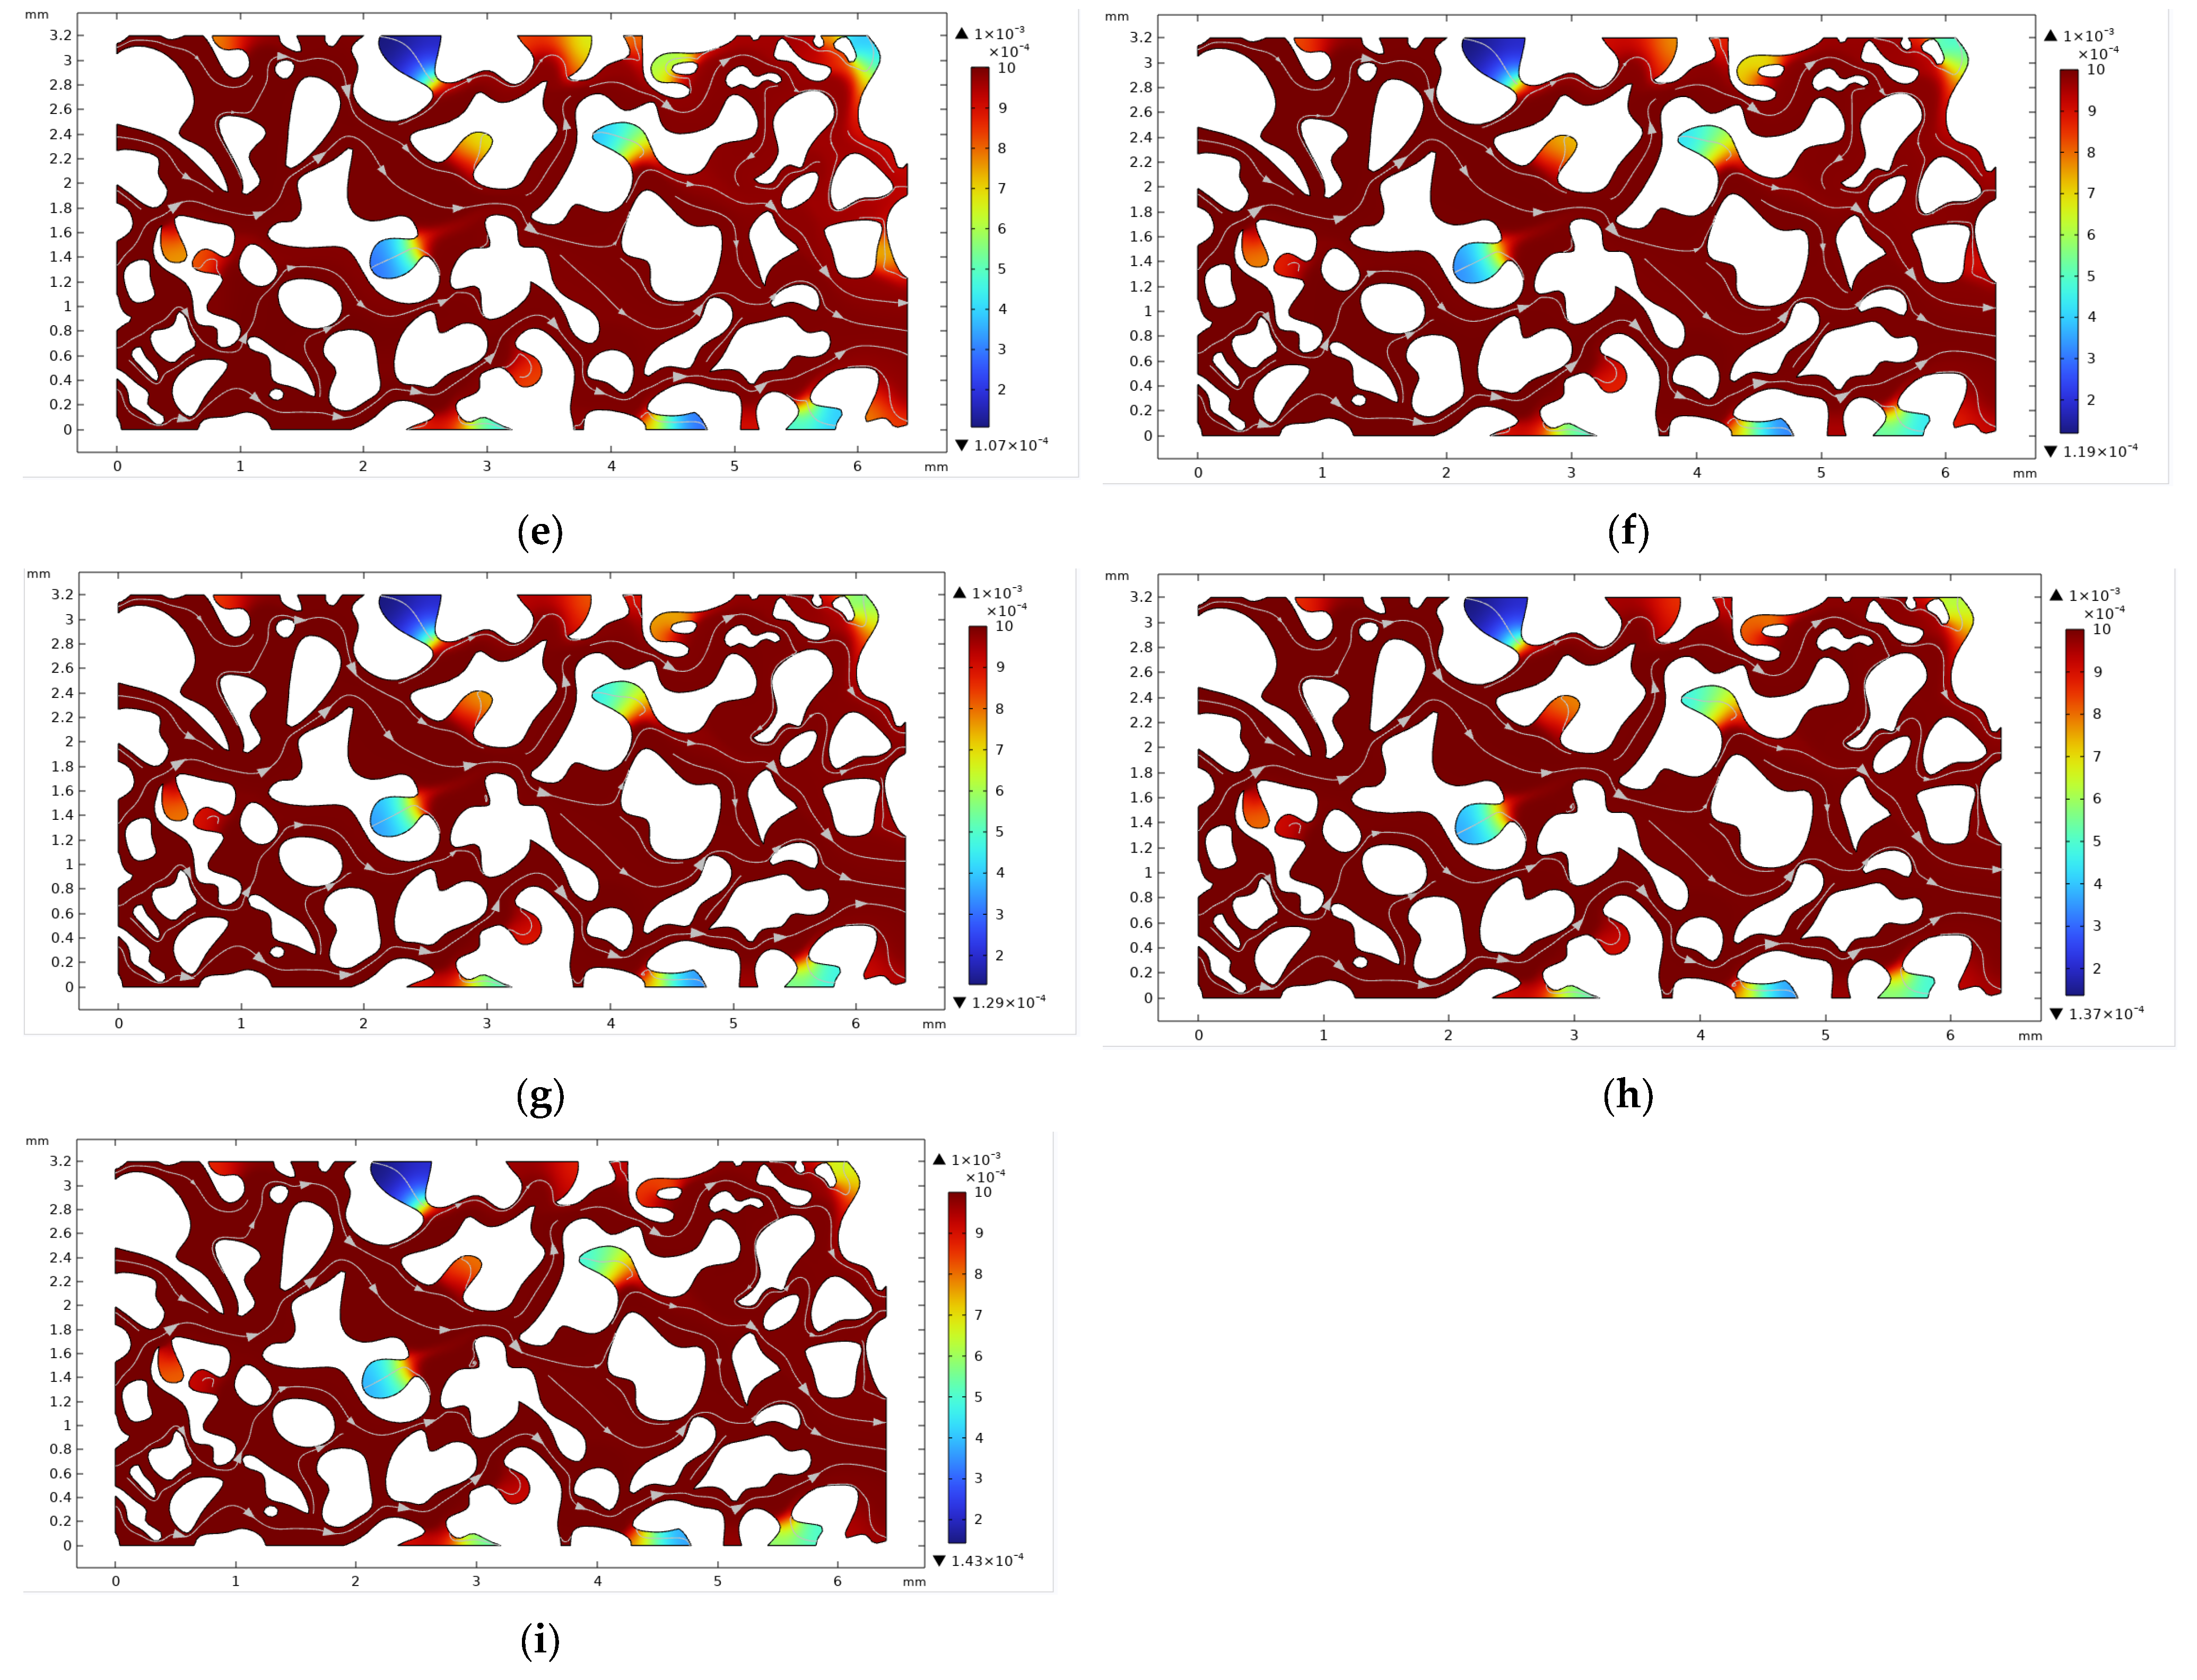
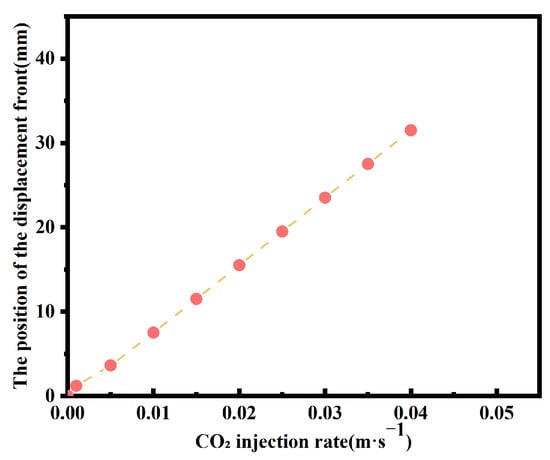
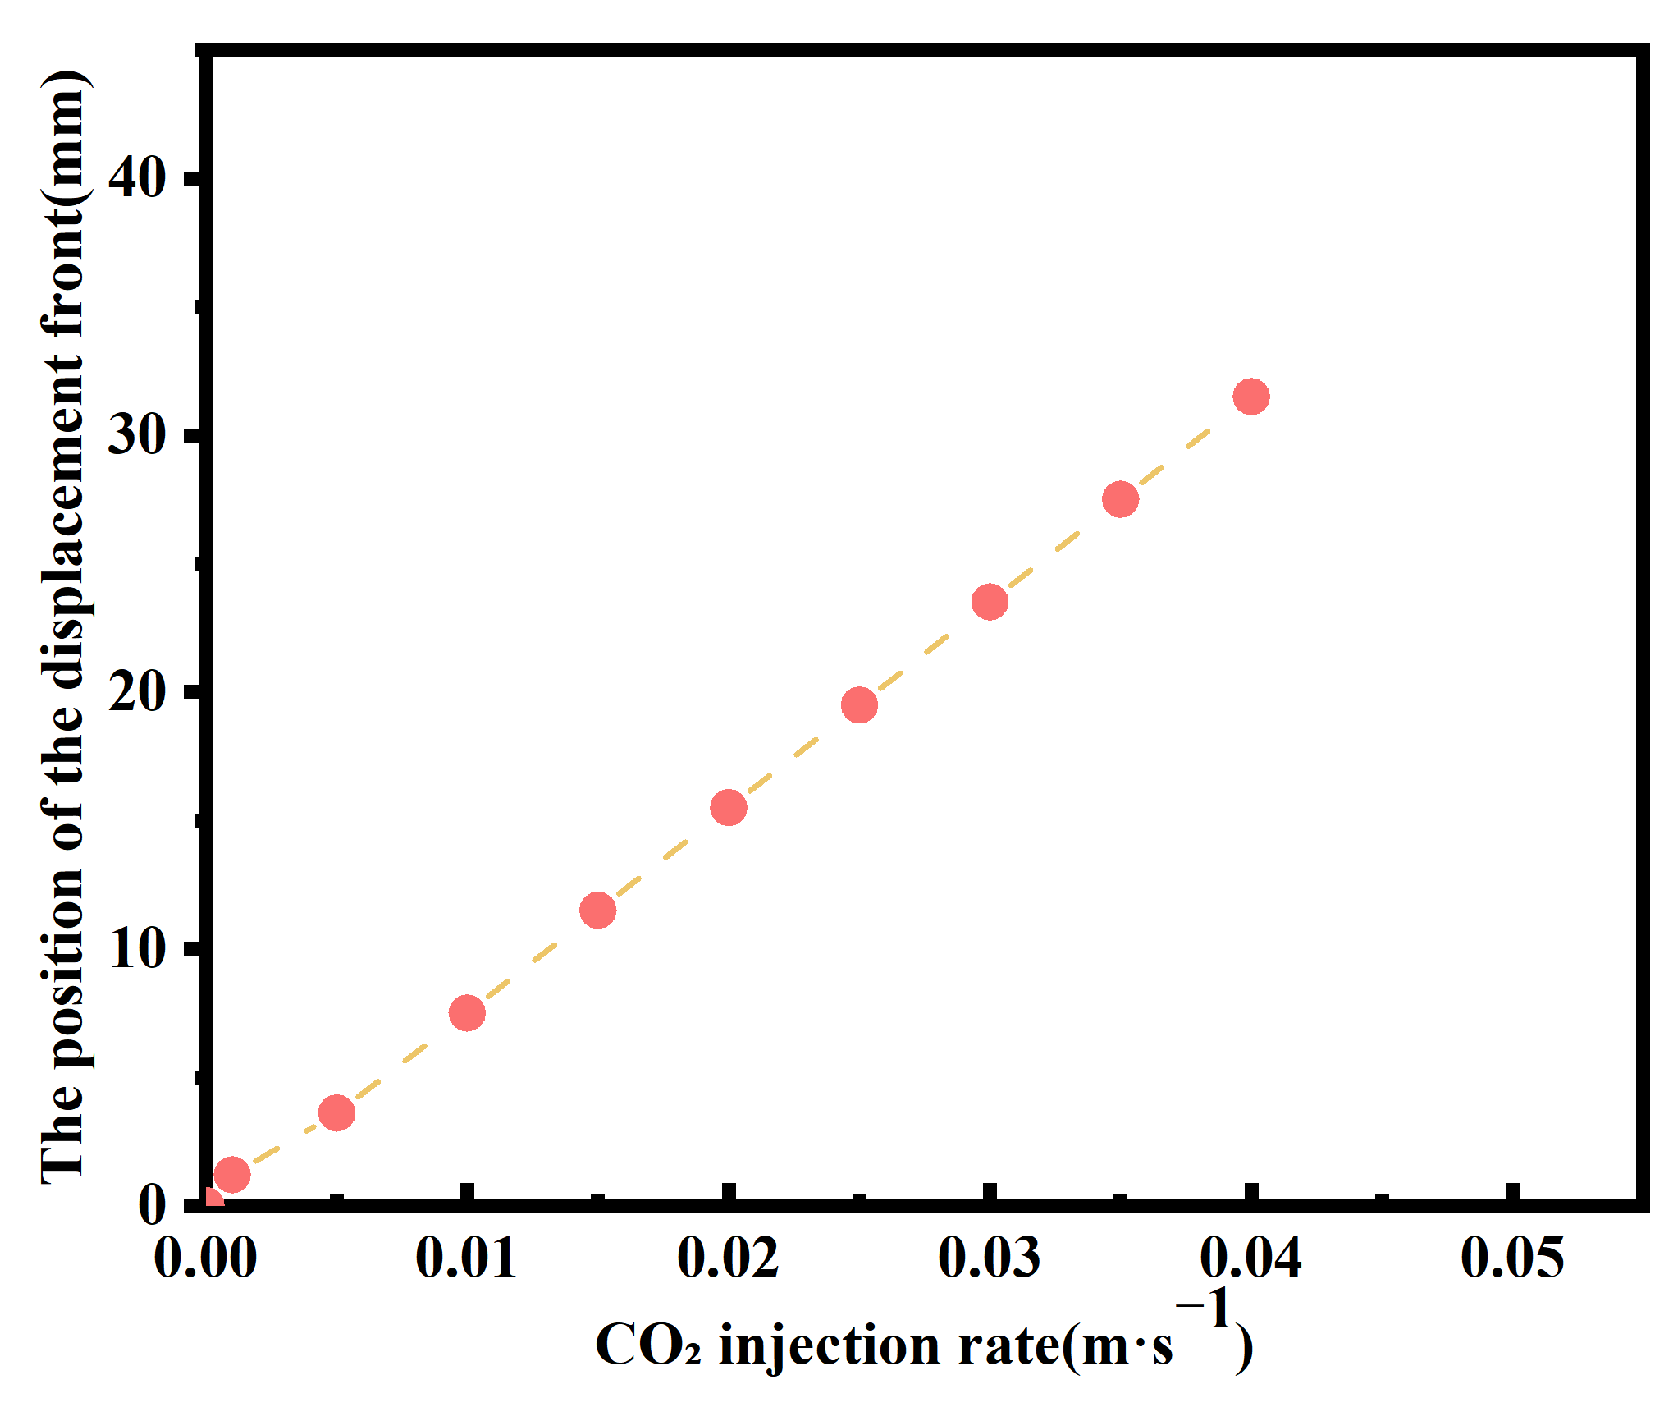
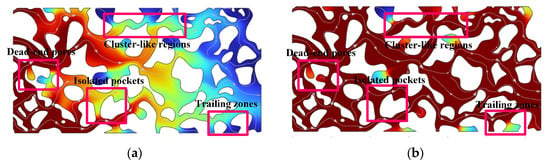
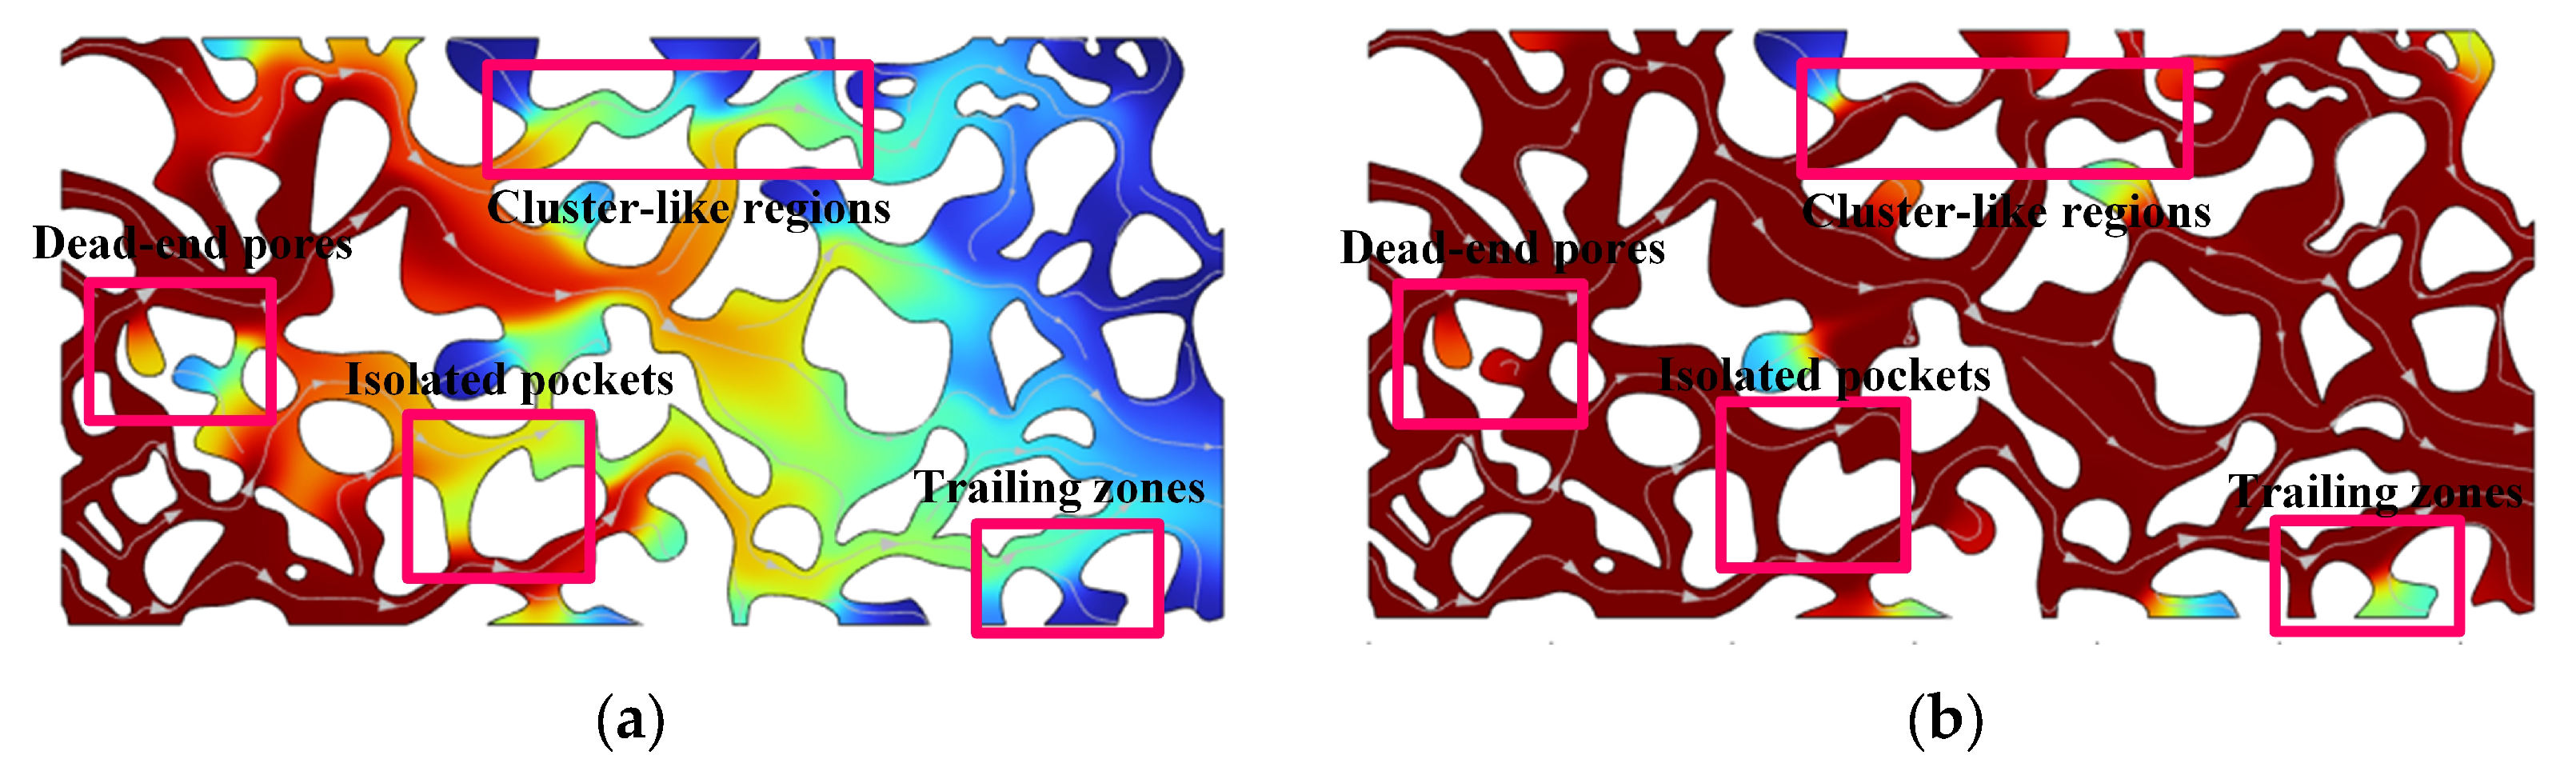
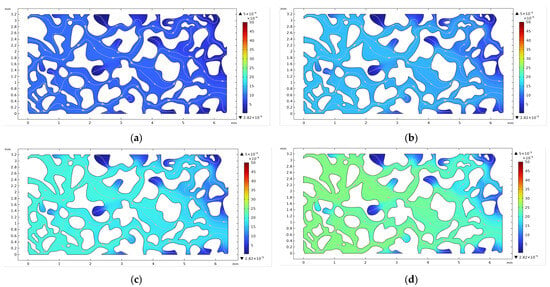
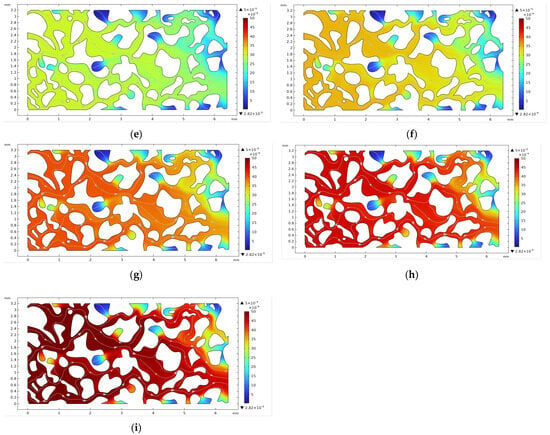
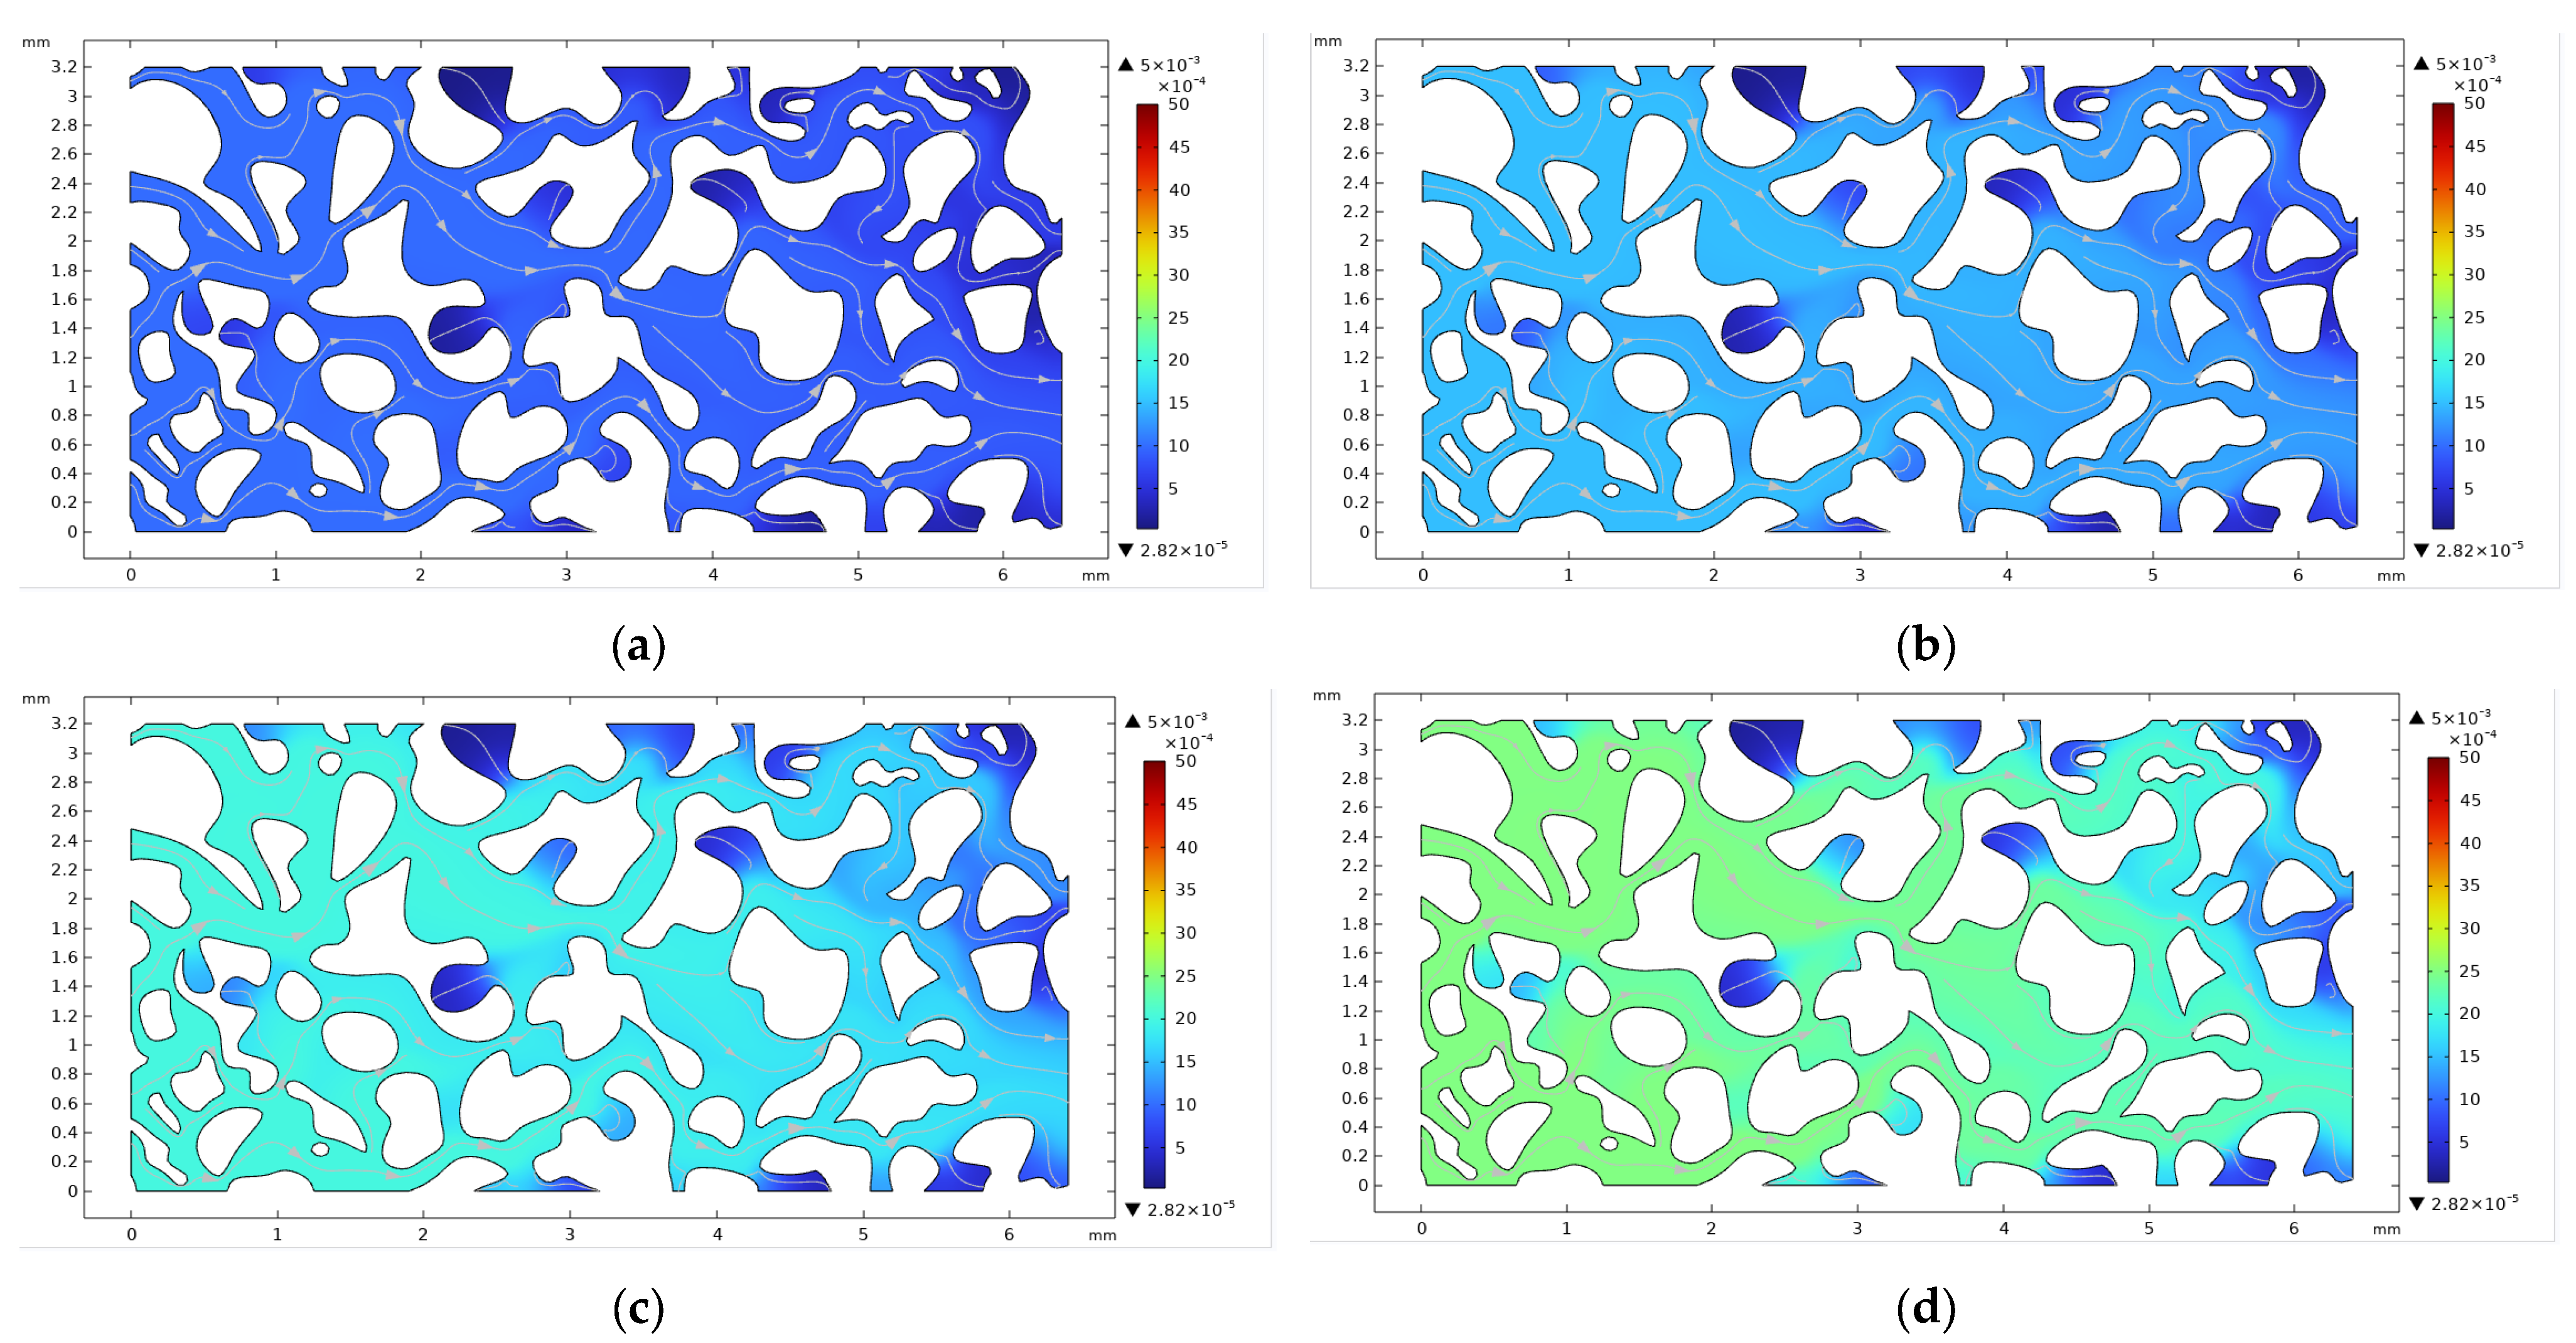
The injection velocity reflects the driving force exerted by CO2 during flooding. The distribution of CO2 concentration was analyzed at different injection velocities ranging from 0.001 to 0.04 m/s. As shown in Figure 8, within the miscible zone, CO2 concentration increases more rapidly with higher injection velocities. However, when the CO2 injection velocity is ≥0.02 m/s, the final displacement pattern shows only minor differences. As shown in Figure 9, at higher injection velocities, the residence time of CO2 in the flow region is relatively short, leading to earlier breakthrough. The displacement front position exhibits an approximately linear relationship with the CO2 injection velocity. As illustrated in Figure 10, increasing injection velocity enhances the displacement driving force: more CO2 enters the porous medium, the spatial extent of CO2 distribution expands, and the mobilization of residual oil in dead-end pores, cluster-like regions, isolated pockets, and trailing zones within the miscible region is significantly enhanced. This phenomenon is particularly pronounced in larger pore channels, whereas in porous media with smaller pores, displacement predominantly follows the dominant flow paths.
Figure 8.
CO2 concentration distribution at different injection velocities. (a) CO2 injection velocity 0.001 m/s; (b) CO2 injection velocity 0.005 m/s; (c) CO2 injection velocity 0.01 m/s; (d) CO2 injection velocity 0.015 m/s; (e) CO2 injection velocity 0.02 m/s; (f) CO2 injection velocity 0.025 m/s; (g) CO2 injection velocity 0.03 m/s; (h) CO2 injection velocity 0.035 m/s; (i) CO2 injection velocity 0.04 m/s.
Figure 9.
Relationship between displacement front position and CO2 injection velocity.
Figure 10.
Residual oil distribution at injection velocities of 0.005 m/s and 0.04 m/s. (a) CO2 injection velocity 0.005 m/s; (b) CO2 injection velocity 0.04 m/s.
3.2. Effect of CO2 Injection Concentration on Displacement Performance
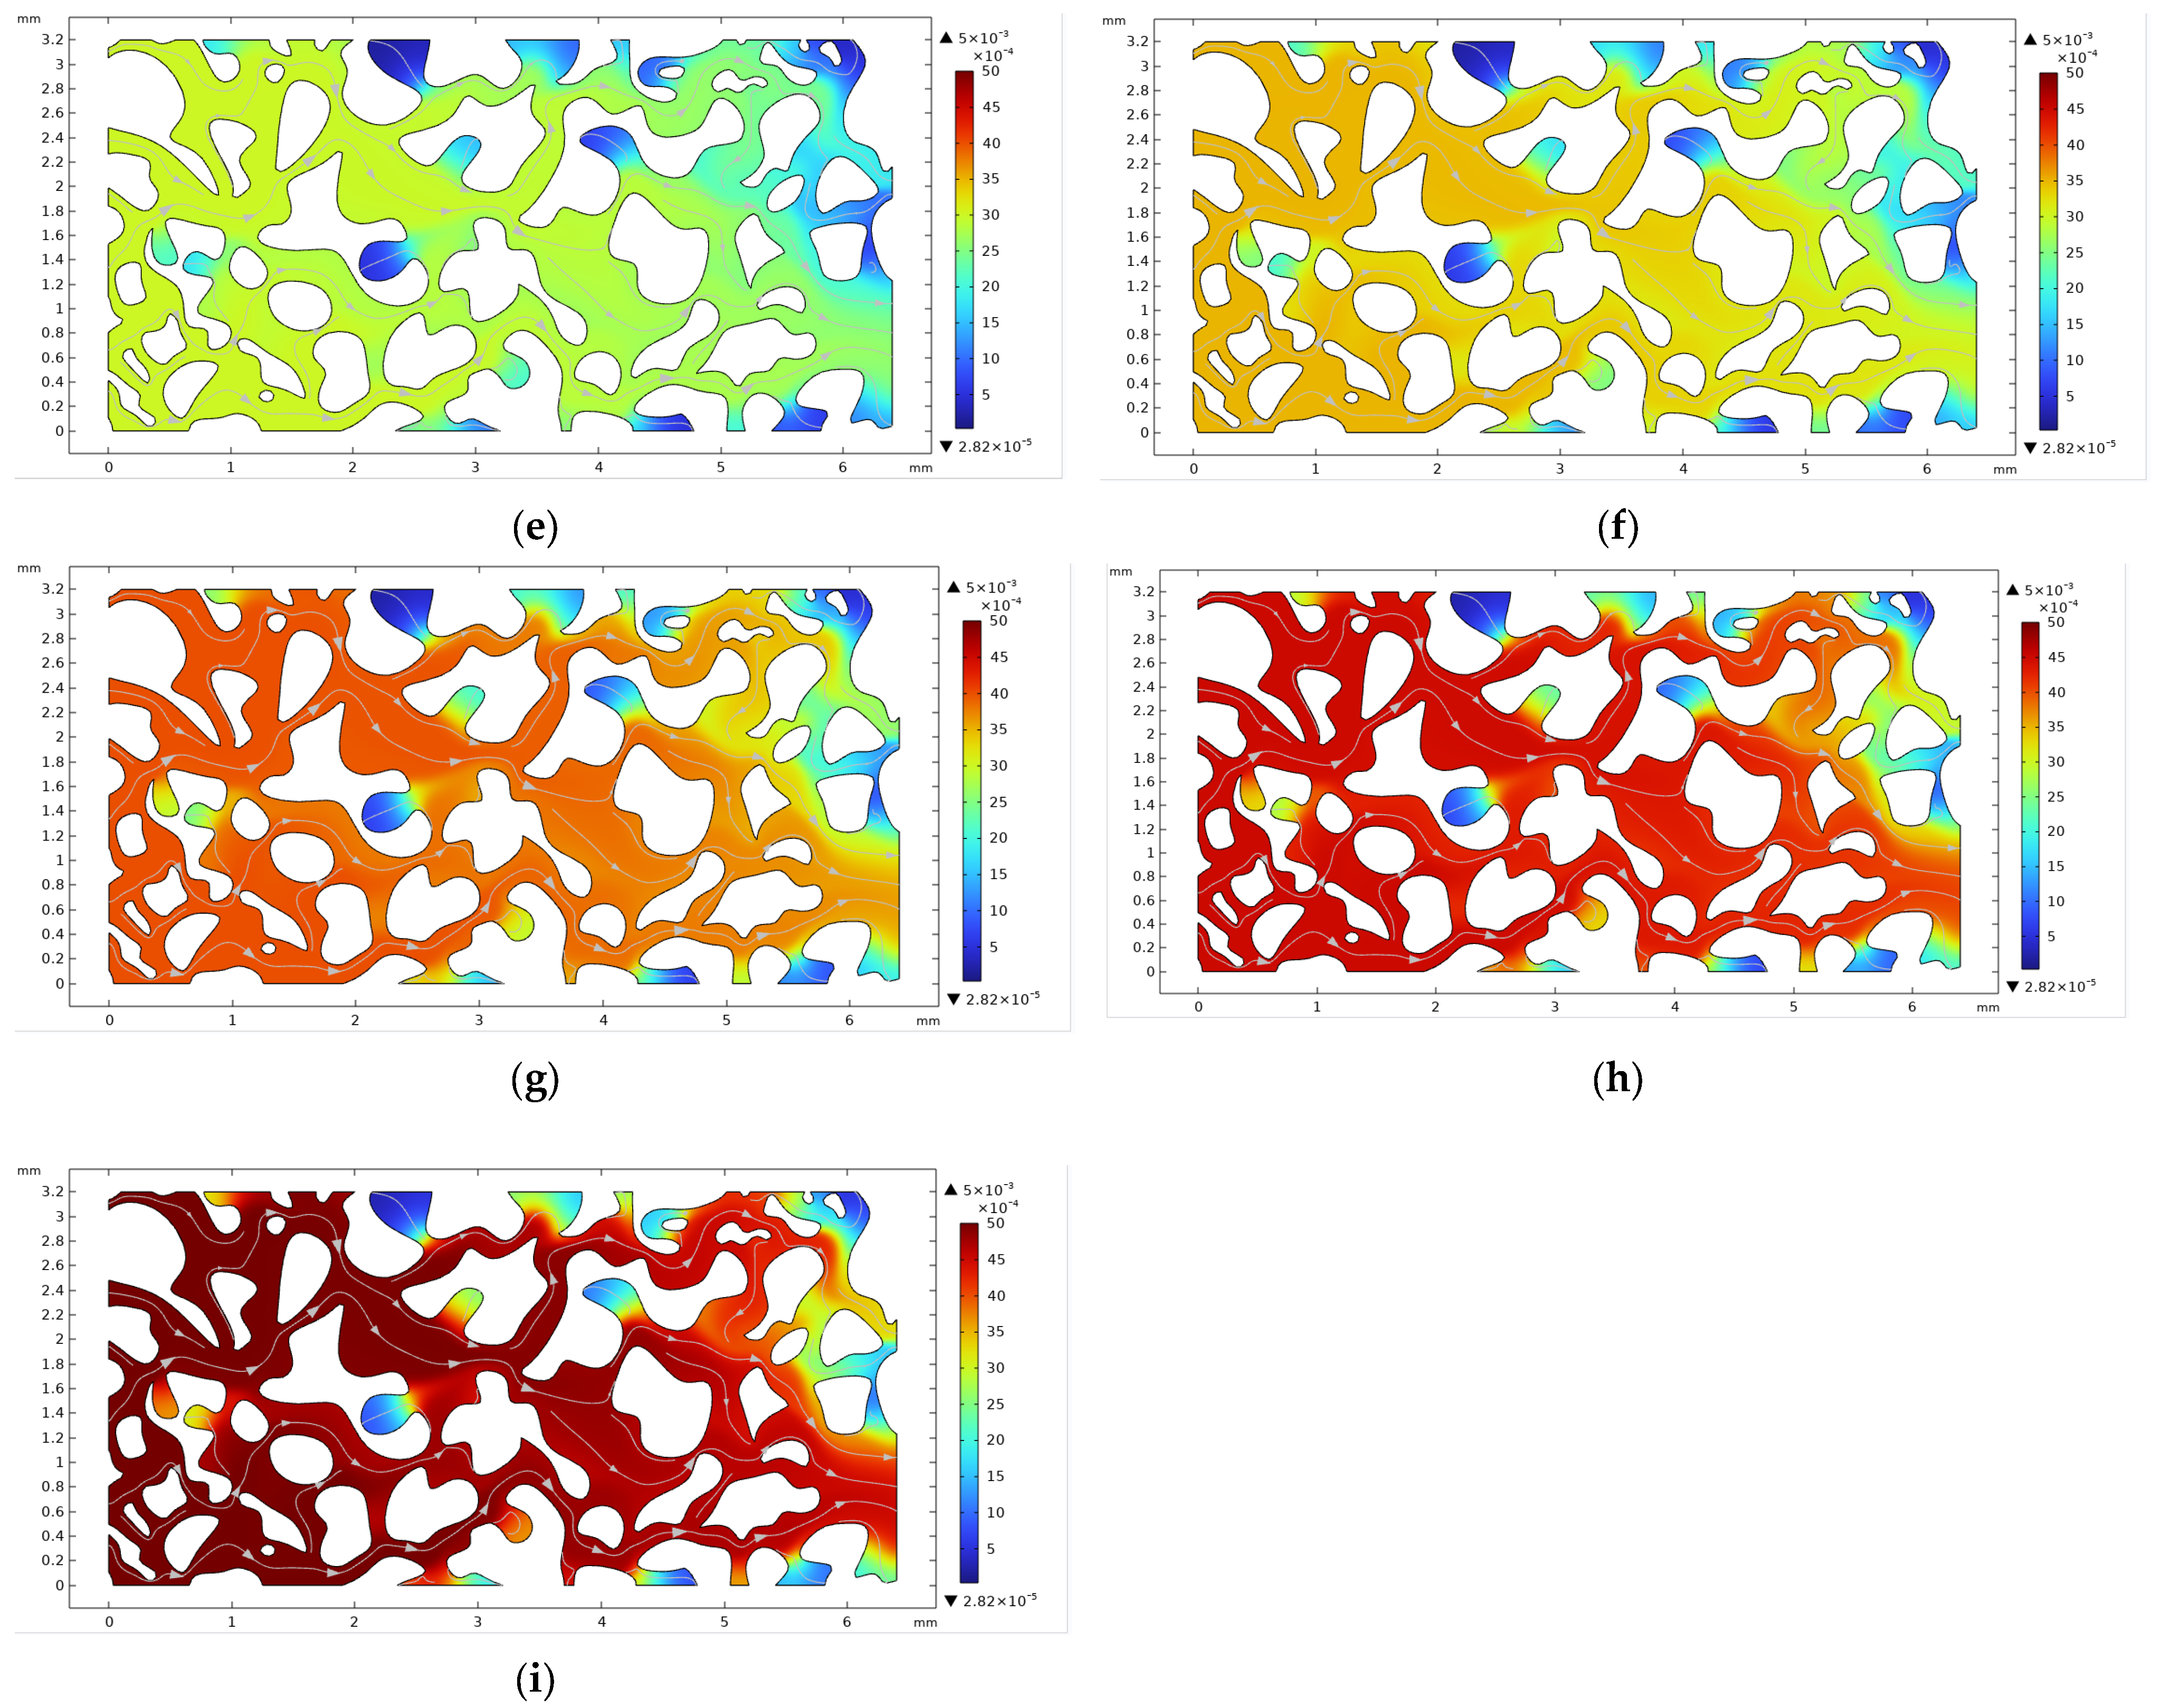
A parametric sweep of CO2 injection concentration was conducted to simulate miscible CO2 flooding in porous media, with different injection concentrations ranging from 0.001 mol/m3 to 0.005 mol/m3. As shown in Figure 11, higher CO2 injection concentrations lead to faster CO2 accumulation within the domain and produce a significantly larger swept area over the same time period.
Figure 11.
Numerical simulation results for different CO2 injection concentrations. (a) CO2 injection concentration 0.001 mol/m3; (b) CO2 injection concentration 0.0015 mol/m3; (c) CO2 injection concentration 0.002 mol/m3; (d) CO2 injection concentration 0.0025 mol/m3; (e) CO2 injection concentration 0.003 mol/m3; (f) CO2 injection concentration 0.0035 mol/m3; (g) CO2 injection concentration 0.004 mol/m3; (h) CO2 injection concentration 0.0045 mol/m3; (i) CO2 injection concentration 0.005 mol/m3.
According to Equation (7), increasing the CO2 injection concentration decreases the spatial variance of the concentration field, indicating more uniform mixing and a higher overall CO2 concentration within the porous medium. Although the contrast concentration fields differ markedly across cases, the resulting CO2 flooding efficiency and the final displacement pattern show only minor differences. At high CO2 injection concentrations, the displacement front advances more smoothly, with reduced fluctuations in front velocity and a smaller proportion of high-gradient regions. These trends suggest that higher CO2 concentration is beneficial for suppressing local instabilities in the displacement front and enhancing miscible flooding efficiency. It should be emphasized, however, that these findings are inferred indirectly from the evolution of the concentration field. Quantitative conclusions regarding ultimate oil recovery require further evaluation based on saturation distributions or material-balance calculations.
In the governing equations, denotes the spatial region of the reservoir domain; is the area of the domain; is the local CO2 concentration at the spatial position ; is the spatial mean CO2 concentration within the domain; is the infinitesimal area element.
In the governing equations, is the spatial variance of the concentration field.
3.3. Effect of CO2 Dynamic Viscosity on Displacement Performance
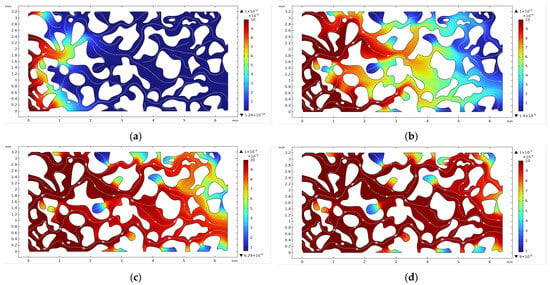
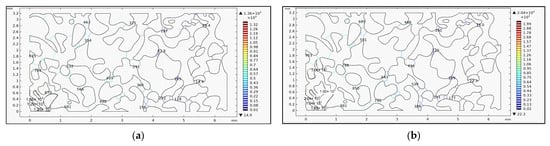
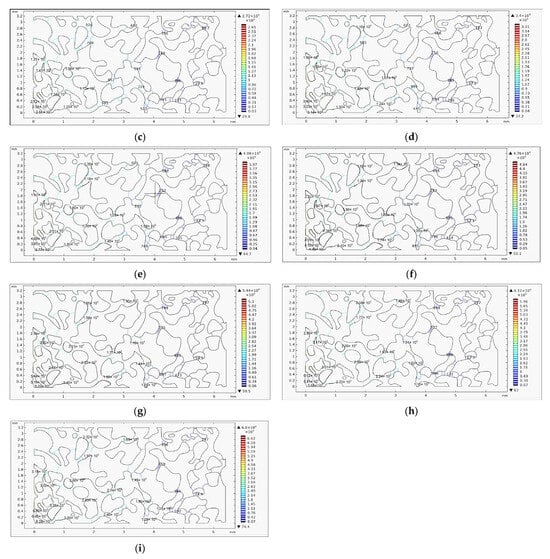
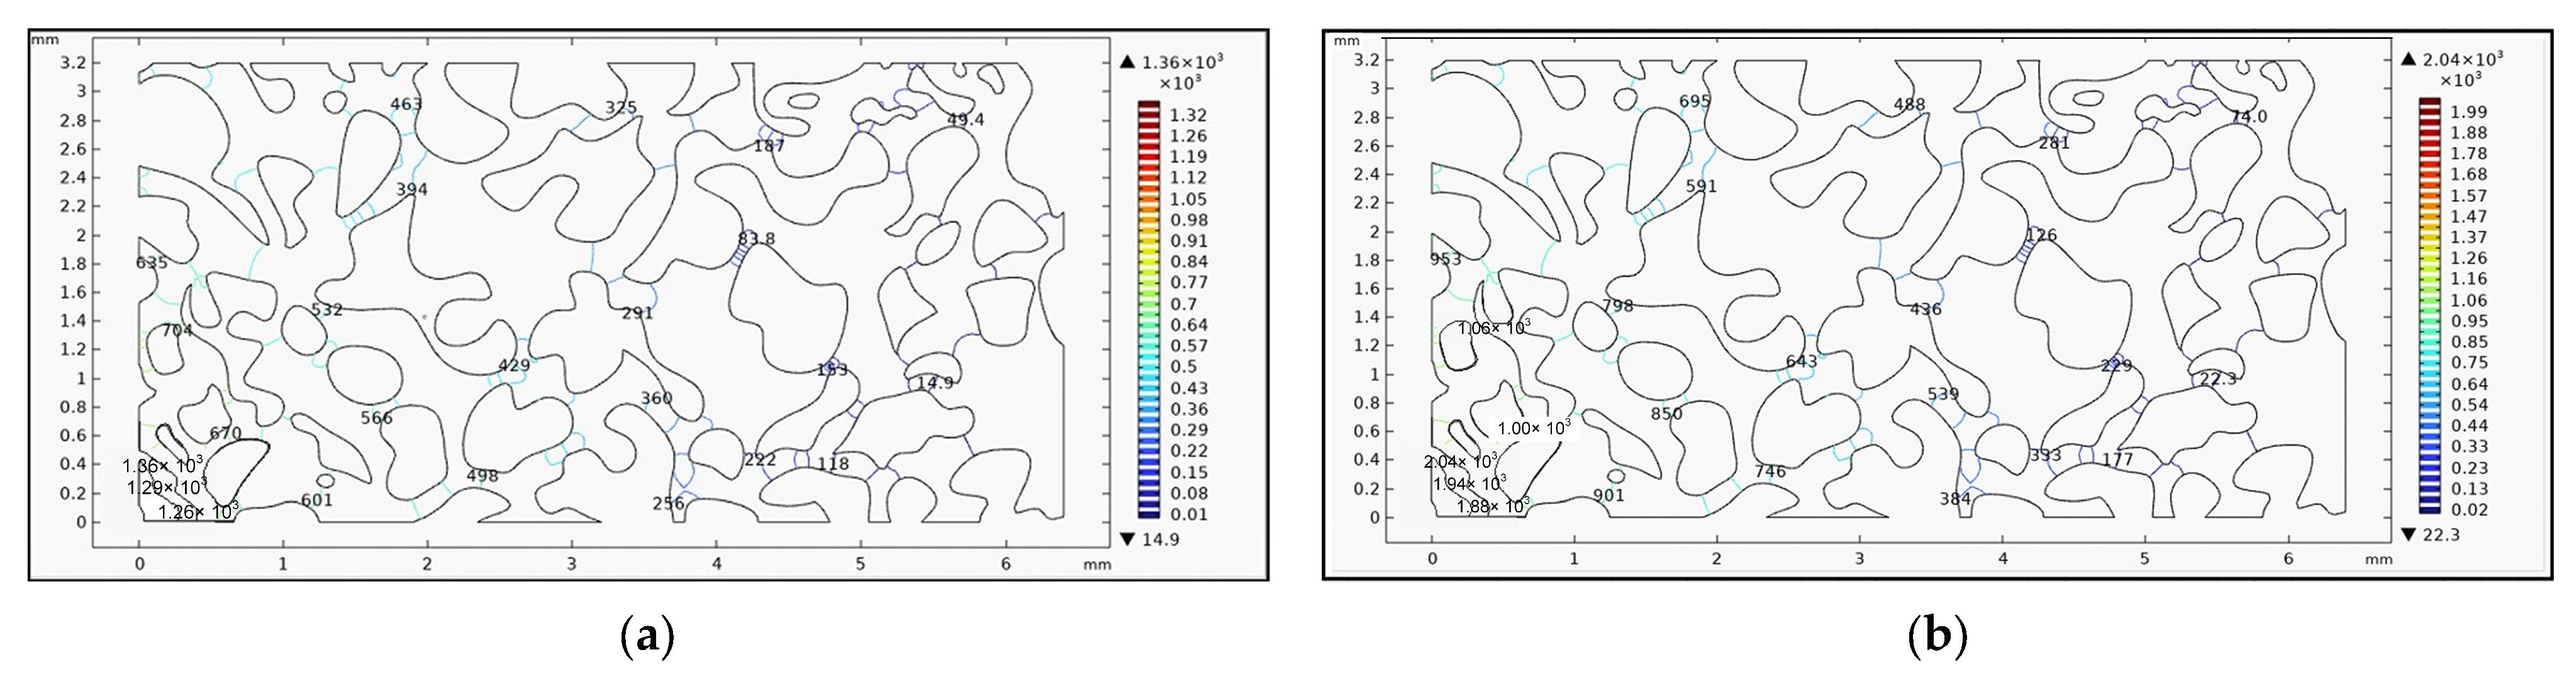
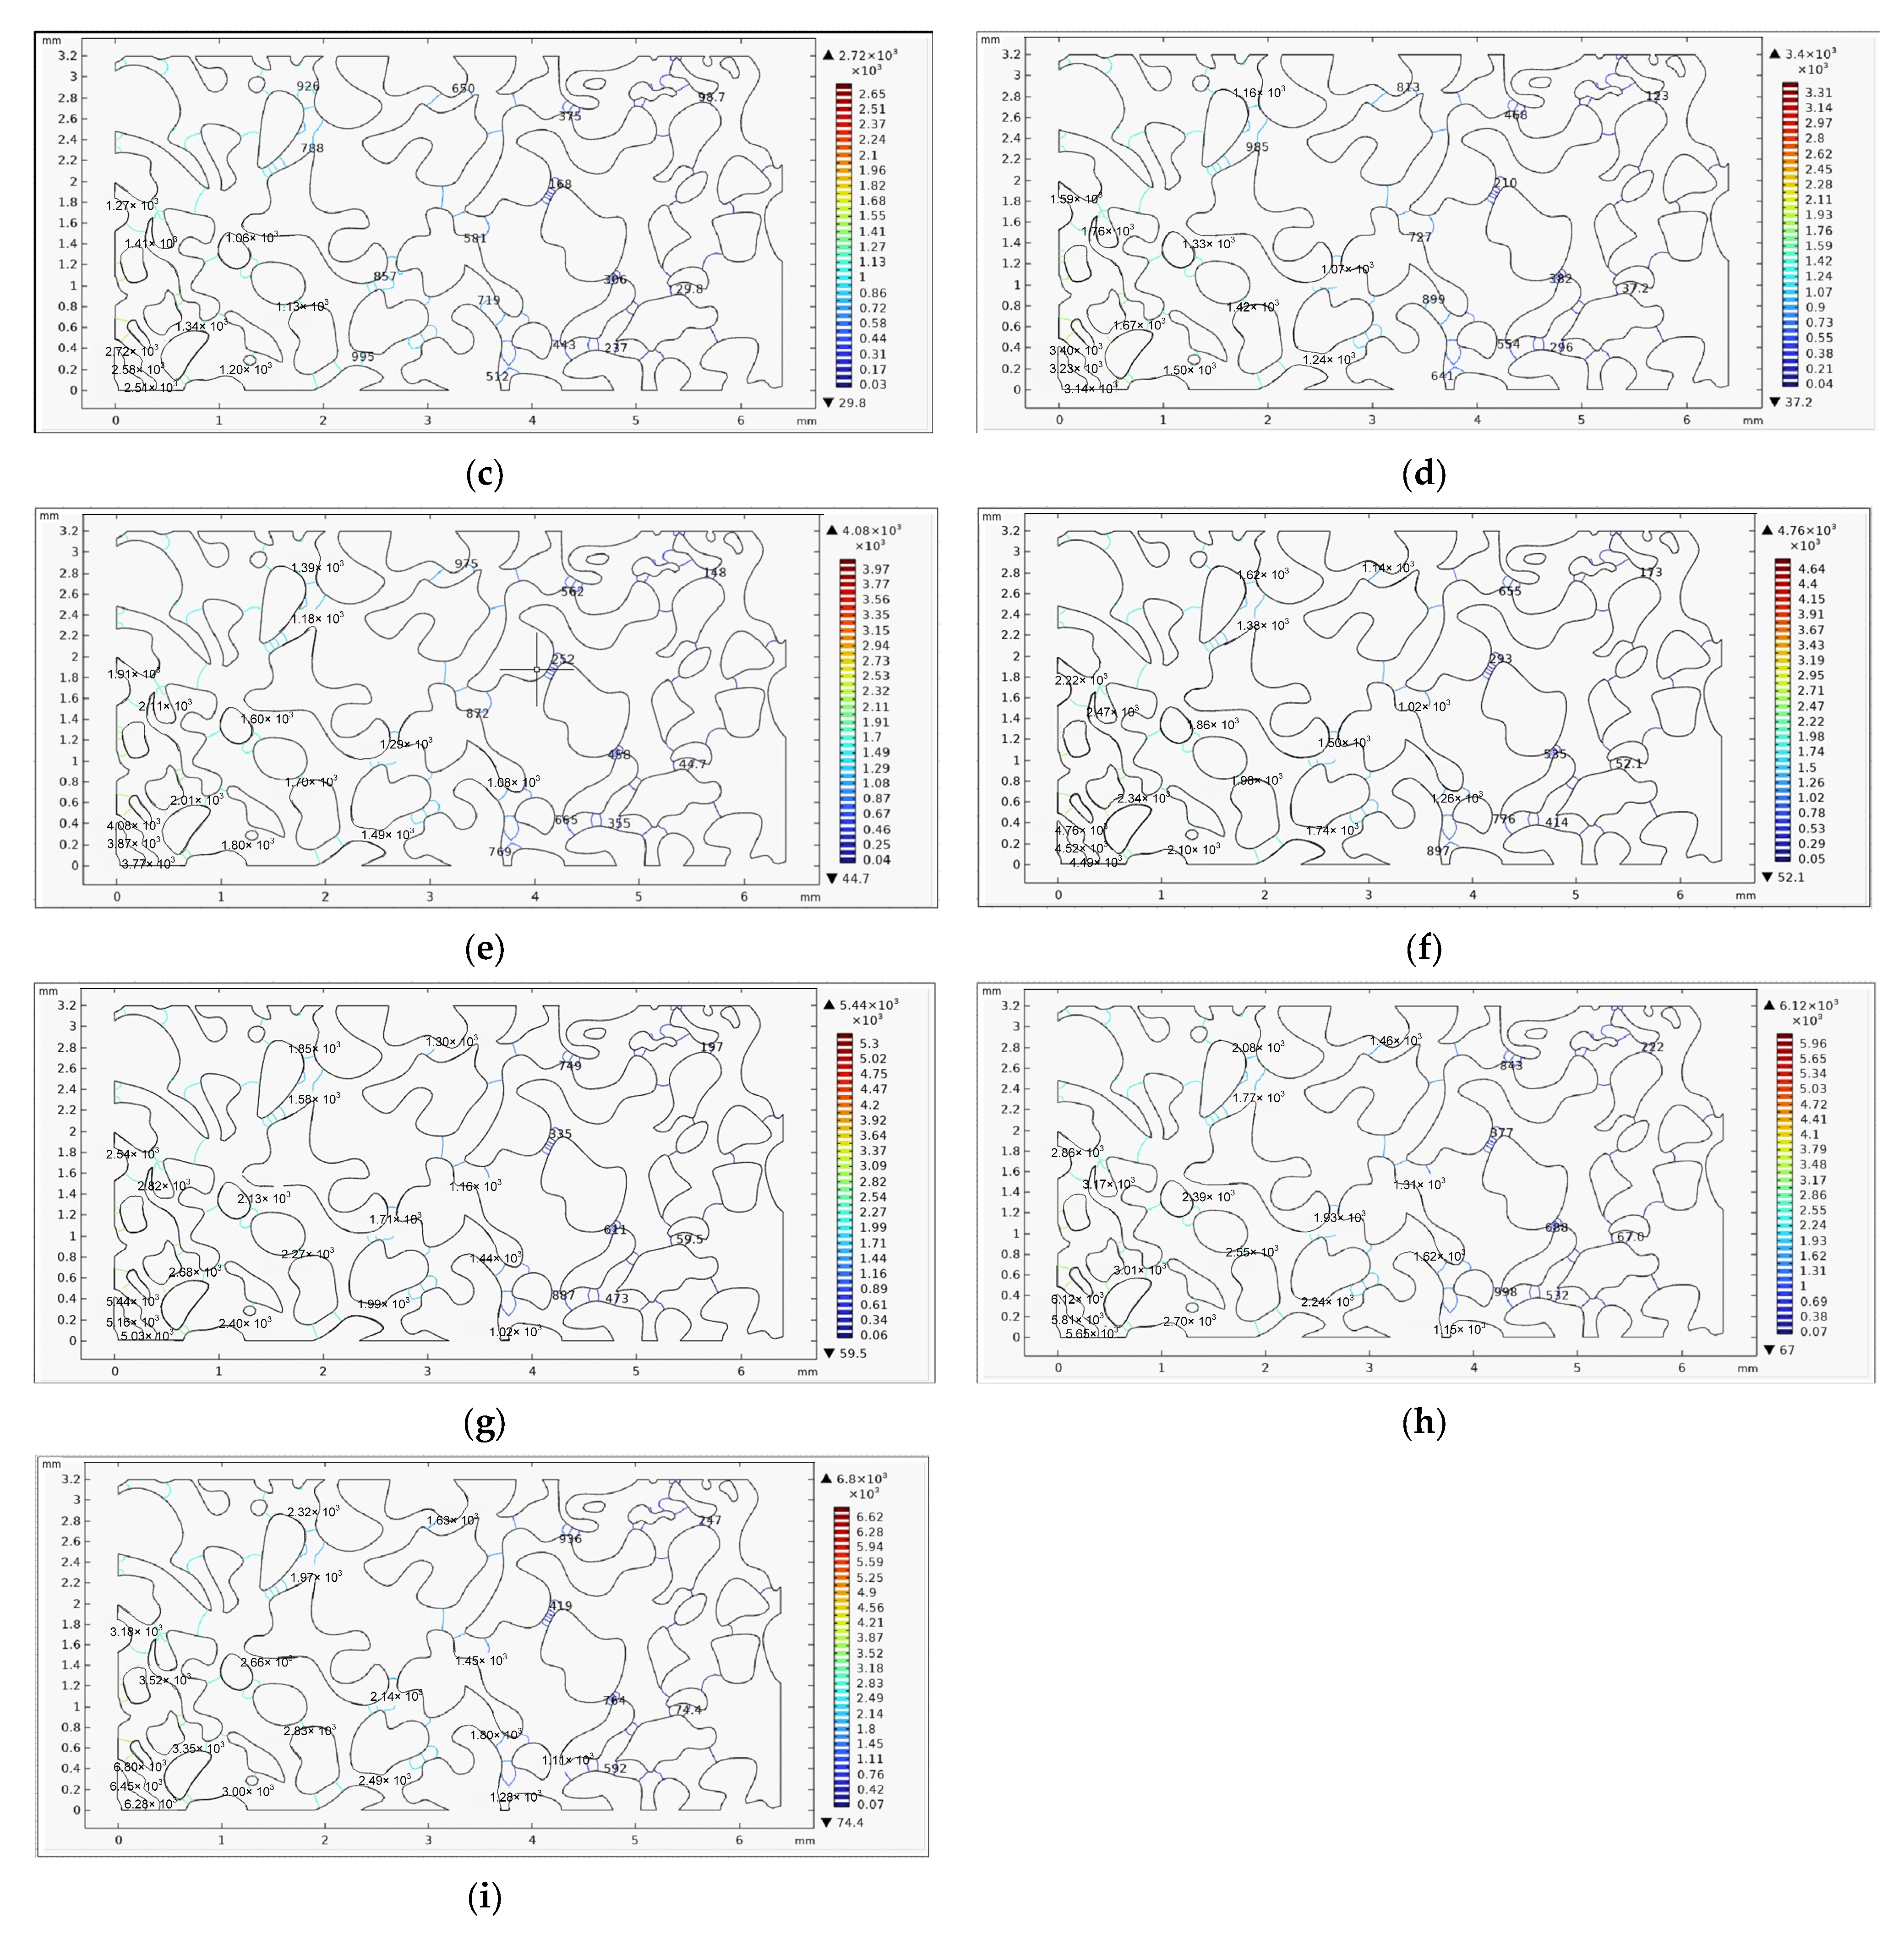
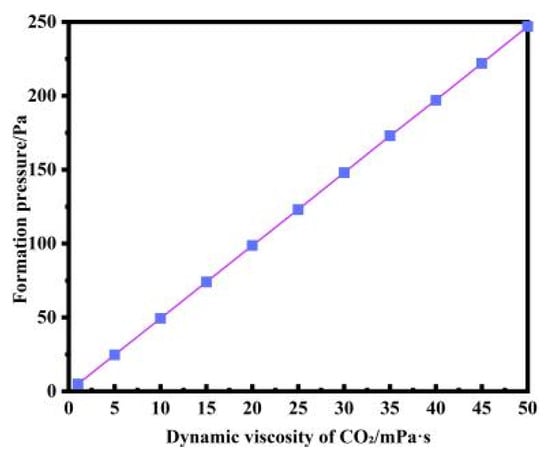
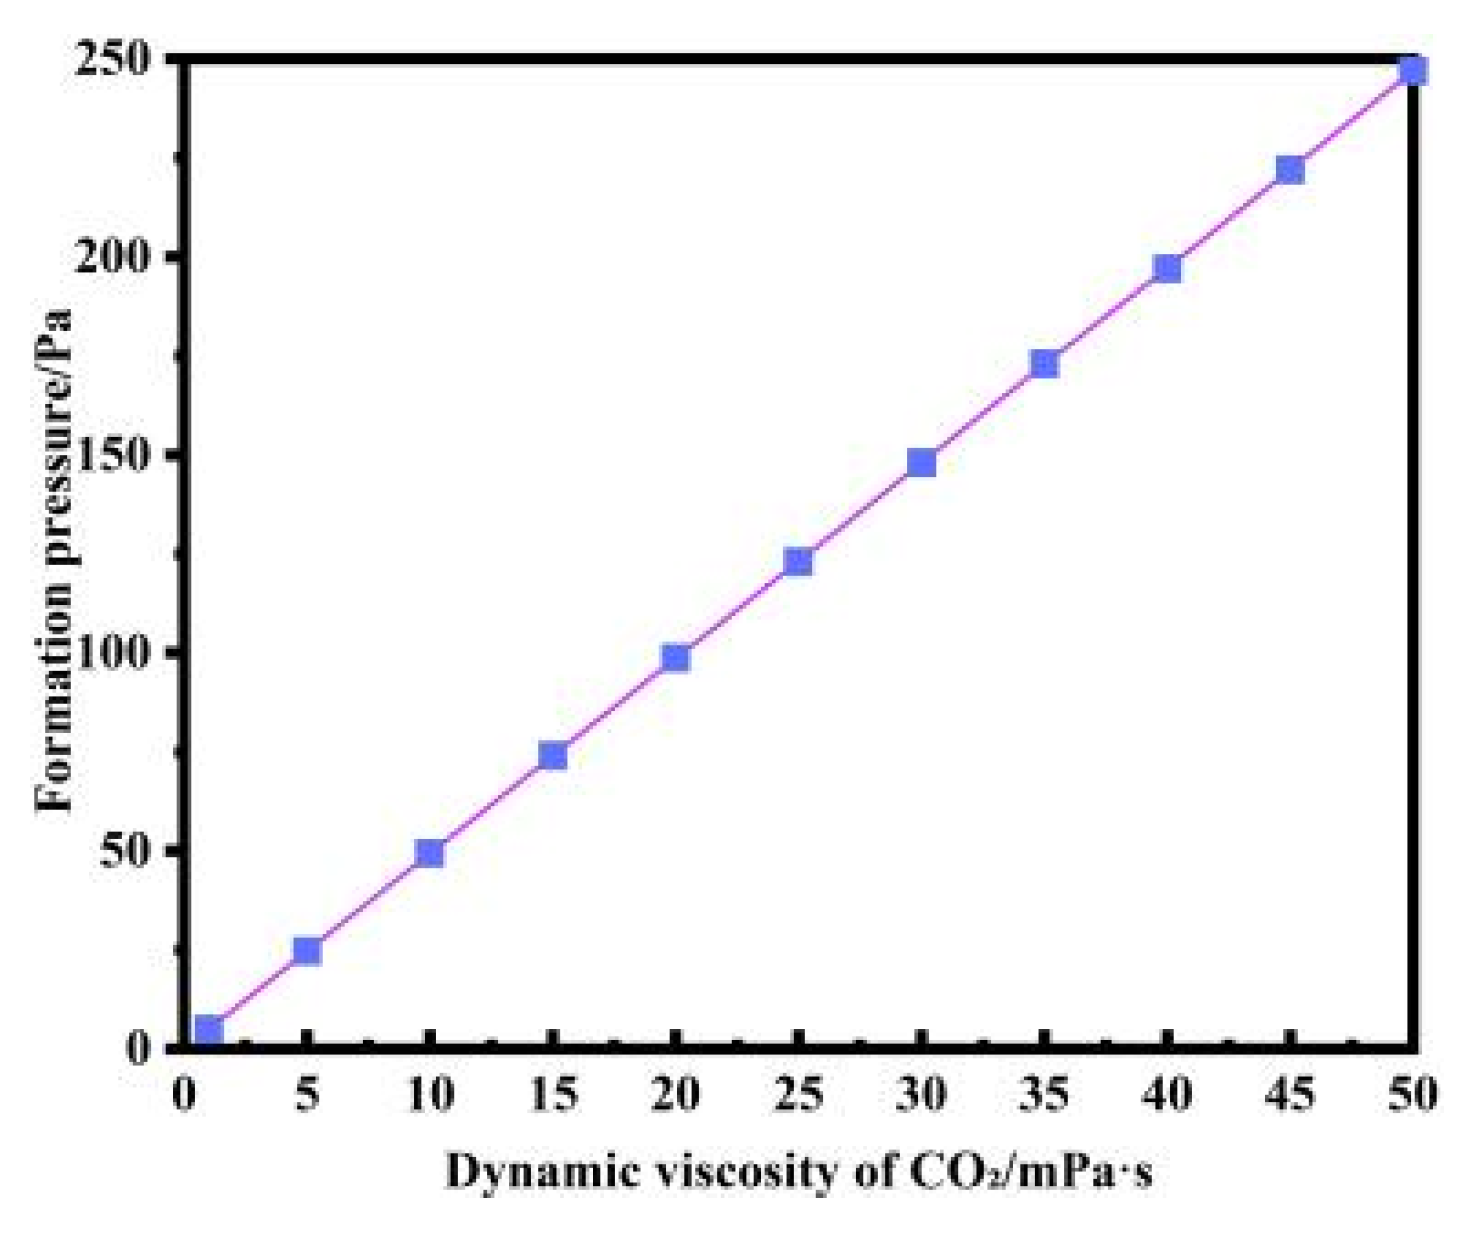
During miscible displacement of crude oil by CO2, interfacial effects become negligible, and fluid dynamics govern the flow behavior. To assess the influence of CO2 viscosity, simulations were performed over a viscosity range of 0.001–0.005 mol/m3, while simultaneously monitoring the corresponding reservoir pressure response. As shown in Figure 12, CO2 dynamic viscosity strongly affects the smoothness of the pressure field and the distribution of pressure gradients. At lower CO2 viscosity, the mobility ratio M increases (), indicating stronger pressure heterogeneity and more pronounced local high-gradient zones. As the displacement front advances through the porous medium, viscous fingering is more likely to occur, leading to an unstable front, aggravated channeling, enlarged unswept regions, and consequently reduced macroscopic oil recovery. With increasing CO2 dynamic viscosity, the mobility ratio of the displacement system improves, the spatial distribution of the pressure field becomes more uniform, pressure fluctuations are reduced, flow stability is enhanced, viscous fingering is significantly suppressed, and the local sweep area increases. As shown in Figure 13, reservoir pressure in the porous medium exhibits an approximately linear relationship with CO2 dynamic viscosity. However, excessively high CO2 viscosity increases formation pressure, resulting in a larger injection pressure drop and higher energy consumption, which can be detrimental to oil recovery at a fixed injection velocity. Therefore, in engineering applications, an optimal viscosity should be selected by balancing displacement stability against injection energy consumption.
Figure 12.
Numerical simulation results of reservoir pressure under different CO2 dynamic viscosities. (a) CO2 dynamic viscosity 10 mPa·s; (b) CO2 dynamic viscosity 15 mPa·s; (c) CO2 dynamic viscosity 20 mPa·s; (d) CO2 dynamic viscosity 25 mPa·s; (e) CO2 dynamic viscosity 30 mPa·s; (f) CO2 dynamic viscosity 35 mPa·s; (g) CO2 dynamic viscosity 40 mPa·s; (h) CO2 dynamic viscosity 45 mPa·s; (i) CO2 dynamic viscosity 50 mPa·s.
Figure 13.
Relationship between reservoir pressure and CO2 dynamic viscosity.
4. Discussion
In this study, a pore-scale miscible CO2 flooding model was developed based on a coupled “laminar flow + diluted species transport” framework, and the effects of CO2 injection velocity, CO2 injection concentration, and CO2 dynamic viscosity on miscible displacement behavior were systematically analyzed. By combining numerical simulations with microfluidic experiments, the mechanisms of miscible CO2 flooding and implications for engineering optimization are discussed as follows:
- 1.
- Increasing CO2 injection velocity accelerates the propagation of the displacement front and enhances the mobilization of residual oil in dead-end pores and trailing zones. However, a velocity saturation effect is observed. When the injection velocity exceeds 0.02 m/s, the displacement pattern tends to stabilize, indicating that further increases in injection velocity yield only marginal improvements in ultimate oil recovery.
- 2.
- Higher CO2 injection concentration leads to faster CO2 accumulation within the pore space, a substantial enlargement of the miscible swept area, greater spatial uniformity of the concentration field, and smoother advancement of the displacement front. At higher concentrations, front-velocity fluctuations are reduced, and the proportion of high-gradient regions decreases, suggesting that higher injection concentration helps suppress local instability of the displacement front and enhances miscible flooding efficiency. However, the final displacement configuration and overall displacement efficiency showed only minor variation across the concentration range considered.
- 3.
- CO2 dynamic viscosity strongly influences flow stability. Low viscosity promotes viscous fingering, resulting in channeling and bypassing of oil. Conversely, excessively high viscosity improves flow stability and suppresses fingering, but increases injection pressure drops and higher energy consumption. Therefore, an optimal viscosity must balance improved displacement stability against the operational cost associated with higher injection pressures.
In summary, injection velocity, dynamic viscosity, and injection concentration collectively control the flow and displacement characteristics of CO2 in porous media. Injection velocity primarily governs the driving force for front advancement, viscosity regulates flow resistance, and concentration controls solute transport behavior. This study integrates pore-scale numerical simulations and microfluidic experiments to elucidate, from a microscopic perspective, the flow mechanisms and key controlling factors of CO2 miscible flooding, thereby providing a basis for understanding macroscopic displacement behavior and for model development. Meanwhile, we also recognize that extending pore-scale insights to reservoir-scale applications typically requires a multiscale framework and parameter upscaling. To this end, future work will focus on multiscale modeling and parameter transfer, using the key mechanisms identified at the pore scale to assist in determining critical parameters in reservoir-scale models. This will strengthen the linkage between mechanistic understanding and engineering application, and provide more targeted theoretical support for optimizing gas-injection development parameters.
Author Contributions
Conceptualization, T.L. and S.W.; methodology, J.L.; software, T.L.; validation, T.L., D.W., Z.T. and Y.W.; formal analysis, S.W.; investigation, T.L.; resources, J.L.; data curation, T.L.; writing—original draft preparation, T.L.; writing—review and editing, J.L.; supervision, S.W.; project administration, J.L.; funding acquisition, S.W. All authors have read and agreed to the published version of the manuscript.
Funding
This work is supported by the National Key Research and Development Program of China under grant (2022YFE0206700), the Youth Fund Project of the National Natural Science Foundation of China (No. 52404027) and the Postdoctoral fund of Heilongjiang Province (LBH-Z24098), CNPC Innovation Found (2024DQ02-0128) and the National Natural Science Foundation of China (Grant Number: 52274036).
Data Availability Statement
The original contributions presented in this study are included in the article. Further inquiries can be directed to the corresponding author.
Conflicts of Interest
Author Zhiheng Tao was employed by Offshore Oil Engineering Co., Ltd. The remaining authors declare that the research was conducted in the absence of any commercial or financial relationships that could be construed as a potential conflict of interest.
References
- Chang, Y.W.; Feng, N.C. Development Countermeasures for Oil and Gas Industry Under the Background of “Carbon Peaking and Carbon Neutrality”. Xinjiang Pet. Geol. 2022, 43, 235–240. Available online: https://www.zgxjpg.com/CN/10.7657/XJPG20220216 (accessed on 1 December 2025).
- Zhang, X.; Li, X.; Ma, Q.; Liu, L.N. Development of Carbon Capture, Utilization and Storage Technology in China. Chin. Eng. Sci. 2021, 23, 70–80. [Google Scholar] [CrossRef] [Scilit]
- Zhang, L.H.; Cao, C.; Wen, S.M.; Zhao, Y.L.; Peng, X.; Wu, J.F. Thoughts on the developmengt of CO2-EGR under the background of carbon peak and carbon neutrality. Nat. Gas Ind. 2023, 10, 383–392. [Google Scholar] [CrossRef] [Scilit]
- Peng, X.T.; Lu, H.D.; Zhang, H. Interpretation of IPCC AR6 report on carbon capture, utilization and storage (CCUS) technology development. Adv. Clim. Change Res. 2022, 18, 580–590. Available online: https://www.climatechange.cn/article/2022/1673-1719/1673-1719-18-5-580.shtml (accessed on 1 December 2025).
- Xing, Y.; Hou, L.; Du, M.; Jia, N.H.; Lu, W.F. Research progress and development prospect of CCUS-EOR technologies in China. Pet. Geol. Recovery Effic. 2023, 30, 1–17. [Google Scholar] [CrossRef]
- Wang, J.Y.; Kong, Y.L.; Duan, Z.F.; Zhang, J.X.; Luo, X.L.; Huang, Y.H.; Luo, N.N.; Cheng, Y.Z.; Zhou, N.; Zhang, W.Z.; et al. Geothermal energy exploitation and storage in coal field under the dual carbon goal. Coal Geol. Explor. 2023, 51, 1–11. [Google Scholar] [CrossRef]
- Hoegh-Guldberg, O.; Bruno, J. The impact of climate change on the world’s marine ecosystems. Science 2010, 328, 1523–1528. [Google Scholar] [CrossRef] [Scilit]
- Song, R.; Wang, Y.; Tang, Y.; Liu, J.; Yang, C. 3D Printing of natural sandstone at pore scale and comparative analysis on micro-structure and single/two-phase flow properties. Energy 2022, 261, 125226. [Google Scholar] [CrossRef] [Scilit]
- Song, R.; Liu, J.; Cui, M. A new method to reconstruct structured mesh model from micro-computed tomography images of porous media and its application. Int. J. Heat Mass Trans. 2017, 109, 705–715. [Google Scholar] [CrossRef] [Scilit]
- Bode, S.; Jung, M. Carbon dioxide capture and storage—Liability for non-permanence under the UNFCCC. Int. Environ. Agreem. Politics Law Econ. 2006, 6, 173–186. [Google Scholar] [CrossRef] [Scilit]
- Cao, S.; Dai, S.; Jung, J. Supercritical CO2 and brine displacement in geological carbon sequestration: Micromodel and pore network simulation studies. Int. J. Greenh. Gas Control 2016, 44, 104–114. [Google Scholar] [CrossRef] [Scilit]
- Lu, J.; Hawthorne, S.; Sorensen, J.; Pekot, L.; Kurz, B.; Smith, S.; Loreal, H.; Volker, H.; Nicholas, B.; José, T.; et al. Advancing CO2 enhanced oil recovery and storage in unconventional oil play—Experimental studies on Bakken shales. Appl. Energy 2017, 208, 171–183. [Google Scholar] [CrossRef] [Scilit]
- Rogala, A.; Ksiezniak, K.; Krzysiek, J.; Hupka, J. Carbon dioxide sequestration during shale gas recovery. Phys. Probl. Miner. Process. 2014, 50, 681–692. [Google Scholar] [CrossRef] [Scilit]
- Parker, M.E.; Meyer, J.P.; Meadows, S.R. Carbon dioxide enhanced oil recovery injection operations technologies. Energy Procedia 2009, 1, 3141–3148. [Google Scholar] [CrossRef] [Scilit]
- Green, D.W.; Willhite, G.P. Enhanced Oil Recovery, 2nd ed.; Henry, L., Ed.; Doherty Memorial Fund of AIME, Society of Petroleum Engineers: Richardson, TX, USA, 2018. [Google Scholar] [CrossRef] [Scilit]
- Wang, X.Q.; Gu, Y.A. Oil recovery and permeability reduction of a tight sandstone reservoir in immiscible and miscible CO2 flooding processes. Ind. Eng. Chem. Res. 2011, 50, 2388–2399. [Google Scholar] [CrossRef] [Scilit]
- Hao, Y.; Li, Z.; Su, Y.; Kong, C.; Chen, H.; Meng, Y. Experimental investigation of CO2 storage and oil production of different CO2 injection methods at pore-scale and core-scale. Energy 2022, 254, 124349. [Google Scholar] [CrossRef] [Scilit]
- Taber, J.J.; Martin, D.F. Technical screening guides for the enhanced recovery of oil. In Proceedings of the SPE Annual Technical Conference and Exhibition, San Francisco, CA, USA, 5–8 October 1983. [Google Scholar] [CrossRef]
- Song, R.; Wang, Y.; Liu, J.; Cui, M.; Lei, Y. Comparative analysis on pore-scale permeability prediction on micro-CT images of rock using numerical and empirical approaches. Energy Sci. Eng. 2019, 7, 2842–2854. [Google Scholar] [CrossRef] [Scilit]
- Peng, X.Y.; Wang, Y.Y.; Diao, Y.Q.; Zhang, L.; Yazid, I.M.; Ren, S.R. Experimental investigation on the operation parameters of carbon dioxide huff-n-puff process in ultralow permeability oil reservoirs. J. Pet. Sci. Eng. 2019, 174, 903–912. [Google Scholar] [CrossRef] [Scilit]
- Yang, Y.Z.; Liao, G.Z.; Wu, Y.; Ma, X.L.; Dong, Z.Z.; Li, W.R.; Wei, J.G. Displacement efficiency and storage characteristics of CO2 in low permeability reservoirs: An experimental work. Energy Explor. Exploit. 2023, 41, 601–618. [Google Scholar] [CrossRef] [Scilit]
- Yang, S.G.; Cai, M.Y.; Zhang, K.F.; Cao, D.D.; Zhao, X.L.; Liu, S.X. Research progress and prospect of CO2-water-rock interaction on petrophysical properties of CO2 geological sequestration. Pet. Geol. Recovery Effic. 2023, 30, 80–91. [Google Scholar] [CrossRef]
- Zhang, C.Y.; Oostrom, M.; Grate, J.; Wietsma, T.; Warner, M. Liquid CO2 displacement of water in a dual-permeability pore network micromodel. Environ. Sci. Technol. 2011, 45, 7581–7588. [Google Scholar] [CrossRef] [Scilit]
- Liu, H.H.; Valocchi, A.J.; Werth, C.; Kang, Q.J.; Oostrom, M. Pore-scale simulation of liquid CO2 displacement of water using a two-phase lattice Boltzmann model. Adv. Water Resour. 2014, 73, 144–158. [Google Scholar] [CrossRef] [Scilit]
- Zheng, S.X.; Li, H.A.; Sun, H.J.; Yang, D.Y. Determination of diffusion coefficient for alkane solvent—CO2 mixtures in heavy oil with consideration of swelling effect. Ind. Eng. Chem. Res. 2016, 55, 1533–1549. [Google Scholar] [CrossRef] [Scilit]
- Wang, H.; Su, Y.L.; Wang, W.D.; Jin, Z.H.; Chen, H. CO2-oil diffusion, adsorption and miscible flow in nanoporous media from pore-scale perspectives. Chem. Eng. J. 2022, 450, 137957. [Google Scholar] [CrossRef] [Scilit]
- Yang, D.; Gu, Y. Determination of diffusion coefficients and interface mass-transfer coefficients of the crude oil–CO2 system by analysis of the dynamic and equilibrium interfacial tensions. Ind. Eng. Chem. Res. 2008, 47, 5447–5455. [Google Scholar] [CrossRef] [Scilit]
- Sachs, W. The diffusional transport of methane in liquid water: Method and result of experimental investigation at elevated pressure. J. Petrol. Sci. Eng. 1998, 21, 153–164. [Google Scholar] [CrossRef] [Scilit]
- Zhu, Q.L.; Zhou, Q.L.; Li, X.C. Numerical simulation of displacement characteristics of CO2 injected in pore-scale porous media. J. Rock Mech. Geotech. Eng. 2016, 8, 87–92. [Google Scholar] [CrossRef] [Scilit]
- Shi, Y.; Tang, G.H. Non-Newtonian rheology property for two-phase flow on fingering phenomenon in porous media using the lattice Boltzmann method. J. Non-Newton. Fluid Mech. 2016, 229, 86–95. [Google Scholar] [CrossRef] [Scilit]
- Zhu, G.P.; Yao, J.; Li, A.E.; Sun, H.; Zhang, L. Pore-scale investigation of carbon dioxide-enhanced oil recovery. Energy Fuel 2017, 31, 5324–5332. [Google Scholar] [CrossRef] [Scilit]
- Basirat, F.; Yang, Z.; Niemi, A. Pore-scale modeling of wettability effects on CO2–brine displacement during geological storage. Adv. Water Resour. 2017, 109, 181–195. [Google Scholar] [CrossRef] [Scilit]
- Rokhforouz, M.R.; Amiri, H.A. Effects of grain size and shape distribution on pore-scale numerical simulation of two-phase flow in a heterogeneous porous medium. Adv. Water Resour. 2019, 124, 84–95. [Google Scholar] [CrossRef] [Scilit]
- Ma, Q.; Zheng, Z.; Fan, J.; Jia, J.; Bi, J.; Hu, P.; Wang, Q.; Li, M.; Wei, W.; Wang, D. Pore-scale simulations of CO2/oil flow behavior in heterogeneous porous media under various conditions. Energies 2021, 14, 533. [Google Scholar] [CrossRef] [Scilit]
- Zou, Q.L.; Liu, H.; Jiang, Z.B.; Wu, X.A. Gas flow laws in coal subjected to hydraulic slotting and a prediction model for its permeability-enhancing effect. Energy Sources Part A Recovery Util. Environ. Eff. 2025, 47, 8628–8642. [Google Scholar] [CrossRef] [Scilit]
- Wang, Y.; Song, R.; Liu, J.; Cui, M.; Ranjith, P. Pore scale investigation on scaling-up micro-macro capillary number and wettability on trapping and mobilization of residual fluid. J. Contam. Hydrol. 2019, 225, 103499. [Google Scholar] [CrossRef] [Scilit]
- Zhang, L.; Kang, Q.; Yao, J.; Gao, Y.; Sun, Z. Pore scale simulation of liquid and gas two-phase flow based on digital core technology. Sci. China Technol. Sci. 2015, 58, 1375–1384. [Google Scholar] [CrossRef] [Scilit]
- Shen, J.; Yang, X. Decoupled, energy stable schemes for phase-field models of two-phase incompressible flows. SIAM J. Numer. Anal. 2015, 53, 279–296. [Google Scholar] [CrossRef] [Scilit]
- Chaudhary, K.; Bayani, C.; Wolfe, W.; Maisano, A.; Ketcham, A.; Bennett, C. Pore-scale trapping of supercritical CO2 and the role of grain wettability and shape. Geophys. Res. Lett. 2013, 40, 3878–3882. [Google Scholar] [CrossRef] [Scilit]
- Chen, H.; Li, B.; Duncan, I.; Elkhider, M.; Liu, X. Empirical correlations for prediction of minimum miscible pressure and near-miscible pressure interval for oil and CO2 systems. Fuel 2020, 278, 118272. [Google Scholar] [CrossRef] [Scilit]
- Frisch, U.; Hasslacher, B.; Pomeau, Y. Lattice-Gas Automata for the Navier-Stokes Equation. Phys. Rev. Lett. 1986, 56, 1505–1508. [Google Scholar] [CrossRef] [Scilit]
- Wang, Y.X.; Zhou, L.F.; Jiao, Z.S.; Shang, Q.H. Relative permeability calculation model of CO2 immiscible flooding in low permeability reservoir based on the three parameter nonlinear seepage. J. Northwest Univ. (Nat. Sci. Ed.) 2018, 48, 107–114+131. Available online: https://jglobal.jst.go.jp/en/detail?JGLOBAL_ID=201802289879151589 (accessed on 1 December 2025).
- Antanovskii, L.K. A phase field model of capillarity. Phys. Fluids 1995, 7, 747–753. [Google Scholar] [CrossRef] [Scilit]
- Song, X.K.; Liu, Y.T.; Yang, X.W.; Fang, P.T.; Liu, X.J. Numerical simulation of CO2 miscible displacement at pore scale. Pet. Geol. Recovery Effic. 2024, 31, 140–152. [Google Scholar] [CrossRef]
- Mang, Q.S. Application of Complex Digital Core Modeling in CO2-EOR Simulation. Master’s Thesis, Dalian University of Technology, Dalian, China, 2021. [Google Scholar] [CrossRef]
- Sun, Y.L.; Gao, B.; Tong, Z.Q.; Wang, J.W.; Gu, M.J.; Wang, Z.; Liu, Q.M. Experimental study of slippage effects and Knudsen diffusion in shale nanopores. Geol. Resour. 2024, 33, 671–679. [Google Scholar] [CrossRef]
- Zhao, K.Y. A Model for Multi-component Shale Gas Transport in Nanopores with Multiple Mechenisms Coupling. Chin. J. Undergr. Space Eng. 2022, 18, 57–64+82. [Google Scholar] [CrossRef]
- Yang, G.; Sun, H.H.; Tu, H.J.; Ang, Y.F.; Yin, L.M.; Xv, S.H. Application of methane carbon isotope in the productivity prediction of shale gas wells in Weiyuan area, southern Sichuan. Mud Logging Eng. 2025, 36, 27–33. [Google Scholar]
- Wu, K.L.; Li, X.F.; Chen, Z.X. A model for gas transport through nanopores of shale gas reservoirs. Acta Pet. Sin. 2015, 36, 837–848+889. [Google Scholar] [CrossRef]
- Garmeh, G.; Johns, R.T.; Lake, L.W. Pore-scale simulation of dispersion in porous media. SPE J. 2009, 14, 559–567. [Google Scholar] [CrossRef] [Scilit]
- Hoteit, H. Modeling diffusion and gas-oil mass transfer in fractured reservoirs. J. Petrol. Sci. Eng. 2013, 105, 1–17. [Google Scholar] [CrossRef] [Scilit]
- Kuljabekov, A.; Ashirbekov, A.; Wang, L.; Monaco, E.; Royer, J.J.; Rojas-Solórzano, L.R. Isothermal CO2 injection into water-saturated porous media: Lattice-Boltzmann modelling of pulsatile flow with porosity, tortuosity, and optimal frequency characterization. Therm. Sci. Eng. Prog. 2023, 43, 101949. [Google Scholar] [CrossRef] [Scilit]
- Guo, Y.H.; Cai, S.Y.; Li, D.J.; Zhang, L.; Sun, H.; Yang, Y.F.; Zhu, G.P.; Xu, Z.; Bao, B. The influence and mechanism analysis of heterogeneous properties of porous media on the non-miscible displacement of water and oil. Sci. China Technol. Sci. 2022, 52, 807–818. [Google Scholar] [CrossRef] [Scilit]
- Li, N.; Cheng, L.S. Study of fluid-solid coupling model considering convective diffusion of CO2 miscible flooding in low permeability reservoir. J. Rock Mech. Geotech. Eng. 2012, 31, 3055–3060. [Google Scholar]
- Li, T.T.; Wang, S.L.; Li, J.B.; Dong, K.X.; Wen, Z.N. Experimental study of pore-scale flow mechanism of immiscible CO2 flooding under in-situ temperature-pressure coupling conditions. PLoS ONE 2025, 20, 0321527. [Google Scholar] [CrossRef] [Scilit]

Disclaimer/Publisher’s Note: The statements, opinions and data contained in all publications are solely those of the individual author(s) and contributor(s) and not of MDPI and/or the editor(s). MDPI and/or the editor(s) disclaim responsibility for any injury to people or property resulting from any ideas, methods, instructions or products referred to in the content. |
© 2025 by the authors. Licensee MDPI, Basel, Switzerland. This article is an open access article distributed under the terms and conditions of the Creative Commons Attribution (CC BY) license (https://creativecommons.org/licenses/by/4.0/).