1. Introduction
The current practice for geotechnical analysis of foundations consists of using analytical solutions in terms of bearing capacity factors to calculate the ultimate bearing pressure, which is used with a safety factor to calculate the bearing capacity [
1]. The initial development of the bearing capacity factors was (i) for a vertically loaded shallow footing on homogenous soil under level ground surface; (ii) based on modeling the mechanical behavior of the subsurface materials in terms of failure driven by shear at the ultimate state; and (iii) based on solving for limit equilibrium of the foundation loading and self-weight of materials against the shear resistance on a postulated failure surface [
2,
3,
4,
5]. The limit equilibrium analysis implies an incompressible soil model based on the assumption that slip on the shear surfaces is the only deformational motion. This assumption is important in comparing numerical model results against calculations based on the limit equilibrium solution. The effects of the assumption on the calculated bearing capacity were examined in relation to the associated or non-associated flow rules of the plasticity theory [
6,
7,
8,
9].
Subsequent developments eliminated the need for a postulated failure surface by using the method of characteristics or methods based on slip-line theory [
10,
11,
12] but still relied on modeling soil failure at the ultimate state in terms of shear failure alone. Several other variations in the soil and loading conditions have been evaluated to modify the bearing capacity factors, such as for eccentric and inclined loading [
13], wedge-shaped foundation [
14], and foundations on slopes [
15]. The bearing capacity factors for each variation were calculated by modeling soil failure at the ultimate state in terms of shear failure alone. However, the effects of the variations on potential occurrence of tensile failure mechanisms were not evaluated. Analyses of the bearing capacity factors using numerical modeling were also provided but relied on material models that assume shearing as the only failure mechanism [
16,
17,
18,
19,
20].
This paper provides analysis that recognizes that geologic materials can fail in shear, tension, or hybrid shear and tension [
21,
22], depending on the occurrence of compressive and tensile stresses, as influenced by internal and external geometries and applied forces. Potential tensile participation in foundation failure mechanisms appears relevant for foundations on sloping ground because of the well-known occurrence of tensile stresses in soil under slopes, which at times manifest as tension cracks parallel and close to the slope crest. To address potential failure of the subsurface materials in shear or tension, this paper provides foundation analysis using a model of the subsurface materials that evaluates the occurrence of shear and tensile failure mechanisms explicitly. Potential mechanical damage of the subsurface materials is modeled in terms of the initiation, propagation, and deformation of shear and tensile failure surfaces (also known as fractures). The analysis uses fracture-based continuum modeling (FBCM), whereby the mechanical behavior of the subsurface domain is modeled as consisting of the elastic processes, pore compaction, and discrete shear and tensile fracturing, using a continuum framework that models individual fractures explicitly by automating the creation and use of fracture geometry. FBCM uses mechanical properties based on data from oedometer and triaxial compression testing or correlations based on other laboratory or field data [
23,
24].
The paper provides numerical model calculations to show substantial tensile participation in the failure mechanisms for foundations on sloping ground. The results make a case that a foundation analysis based on modeling only the shear failure mechanisms could be inadequate and provide misleading results for foundations that cause significant induced tension in the subsurface materials. Foundations likely to cause induced tension in the subsurface materials include those that apply high loading and are sited on sloping ground, subsurface materials with complex geometry, or other conditions that do not conform to the assumption of shear-dominant failure that is the basis for foundation analysis used in current practice. The calculations illustrate an approach for geotechnical analysis of foundations by full-scale load testing of the foundation design using a computer code that implements FBCM.
FBCM combines the ease of continuum modeling with the potential accuracy of modeling discrete fractures and fracturing explicitly for characterizing the mechanical behavior of the subsurface materials. Pore compaction was added to update FBCM for foundation analysis, being a key difference in mechanical behavior between rocks and soils. Typically, pore compaction occurs more in soil deformation than rock, for compressive stresses smaller than the ultimate strength. The formulation for pore compaction is described in this paper. The formulations for tensile and shear fracturing are described in previous publications [
23,
24] and incorporated here by reference.
The paper provides foundation analysis using numerically simulated full-scale load testing of the foundation design, which provides the bearing pressure versus settlement relationship, including the peak and post-peak behavior, thus providing the ultimate bearing pressure that can be combined with a safety factor in a conventional approach to determine the bearing capacity. Additionally, the analysis provides a characterization of mechanical damage in terms of fractures versus settlement that shows the number of fractured domain elements and the fracture types (tensile or shear fractures). The damage characterization provides an alternative approach for evaluating the bearing capacity, based on calculating the greatest bearing pressure too small to cause mechanical damage to the subsurface materials. This paper provides several cases of full-scale load testing for a shallow foundation at the top of a slope. The cases differ by the foundation setback distance from the slope crest. Additionally, the paper provides load testing for two textbook foundation design examples: one for a shallow footing on homogenous soil under level ground surface and another for a single pile in a multi-layer soil. The two examples verify the FBCM foundation analysis by comparing with results from textbook examples.
2. Materials and Methods: Fracture-Based Continuum Modeling
In FBCM, the mechanical behavior of the subsurface materials is modeled as a continuum with stress deformation states based on modeling the elastic processes, pore compaction, and discrete shear and tensile fracturing. FBCM models preexisting and induced fractures. Individual fractures are modeled explicitly as piecewise planar. Thus, a fracture model consists of connected three-dimensional planar segments, each embedded in a continuum domain element. Preexisting fractures are discretized into the continuum elements based on their intersection with the elements. Induced (tensile or shear) fractures are generated segment by segment based on the mechanical conditions in the elements. Thus, each domain element can host up to six fracture segments (cf. ref. [
24], Figure 1) consisting of up to four preexisting fractures and two new fractures. Typically, preexisting fractures do not occur in soil foundations but could occur in rock foundations.
A domain element represents a sub-volume of the of the model domain (the subsurface materials in the case of foundations) physically. As a mathematical entity, following the principle of object-oriented numerical design, the element is modeled as a class that holds properties to describe the location, geometry, and other properties of fractures that intersect the element, as well as functions that use the properties to calculate the fracture geometry and behavior. Thus, FBCM uses the continuum element to encapsulate and automate the creation and use of fracture geometry. Each fracture segment in an element is instantiated mathematically as a transformation matrix used to calculate the fracture geometrical parameters when needed [
24]. To simplify the element–fracture relationships, each fracture segment in an element (i) intersects the element centroid and represents the mechanical conditions of the element through one calculation point; (ii) terminates on four element faces; and (iii) has constant dip, dip direction, and aperture. However, the dip, dip direction, and aperture of a fracture can vary between elements.
A new fracture segment is generated in an element when the mechanical conditions of the element satisfy the tensile or shear criteria for fracture initiation [
23]. The orientation of the fracture segment is calculated at initiation based upon the element stress state. Fracture aperture is initiated with the fracture segment and updated incrementally thereafter. A new fracture is generated as either tensile or shear and can deform subsequently in opening mode or slip mode. Because the behavior of a fracture segment is controlled by mechanical conditions in the host element, fracture initiation and deformation are determined entirely by conditions in the element, which are influenced by conditions in neighboring elements through inter-element interactions. Following this approach, fracturing is modeled using the domain discretization established at the beginning of the analysis, i.e., no remeshing. Also, fracture tip phenomena, propagation, and coalescence are not prescribed but evolve as determined by interactions among the domain elements. The interactions use tensorial aggregations of the behavior of fractures and unfractured matter in each element. Thus, the stress–strain relationships evolve as fractures initiate and deform.
Shear and tensile fracturing are controlled by the shear and tensile failure criteria of the intact material [
23]. The shear failure criterion is prescribed in terms of the unconfined compressive strength and friction angle. The tensile failure criterion is prescribed in terms of the tensile strength, which can be evaluated as a fraction of the unconfined compressive strength [
25,
26].
FBCM has been implemented to run as a user-defined plugin in a general-purpose engineering analysis software (FLAC3D, available from
https://www.itascacg.com/software/flac3d, accessed on 26 October 2025) [
23]. The implementation has been used to provide verification analysis regarding fracture initiation and propagation, fracture orientations, and overall mechanical behavior. The verification evaluated FBCM against typical laboratory test conditions such as triaxial compression, triaxial extension, and Brazilian testing (diametral compression of a rock disc), with or without preexisting fractures. The discussion of the verification in reference [
23,
24] is incorporated here by reference and shows that FBCM can be relied upon for understanding and predicting the mechanical behavior of geologic materials, including fracture initiation and propagation. Additionally, this paper discusses the verification of FBCM for foundation analysis.
2.1. Materials and Methods: Pore Compaction
The strain contribution due to pressure-induced pore compaction can be important in soil behavior but is usually insignificant for rock behavior. The volumetric strain increment contribution due to compaction (
) can be related to the change in void ratio (
), which is related to the incremental pressure (
), through the following equations [
27].
where
is the void ratio at the beginning of the increment;
and
are the re-compaction and virgin-compaction slopes, respectively, from the laboratory oedometer test;
is the current pressure (mean stress), calculated as the average of the three components of direct stress [
] and given a negative sign such that a compressive stress component (negative) increases pressure whereas a tensile component (positive) decreases pressure; and
is the previous maximum compaction pressure (also known as preconsolidation pressure). The compaction strain is not modeled explicitly. Instead, FBCM accounts for compaction through a non-linear elastic stiffness that includes compaction effects. The equivalent bulk modulus (
) is defined by the following relationship [
23].
is combined with an equivalent Poisson’s ratio (either a constant or known variable) to complete the non-linear elastic stiffness definition. Because of pore compaction, the results of the simulated load tests described subsequently in this paper show a mildly S-shaped bearing pressure versus settlement relationship: the system stiffness increases at a decreasing rate with settlement, up to a maximum, and decreases thereafter as the soil fractures and causes the load resistance of the foundation to decrease.
2.2. Materials and Methods: Model Description for Geotechnical Analysis of Shallow Foundation Atop A Slope
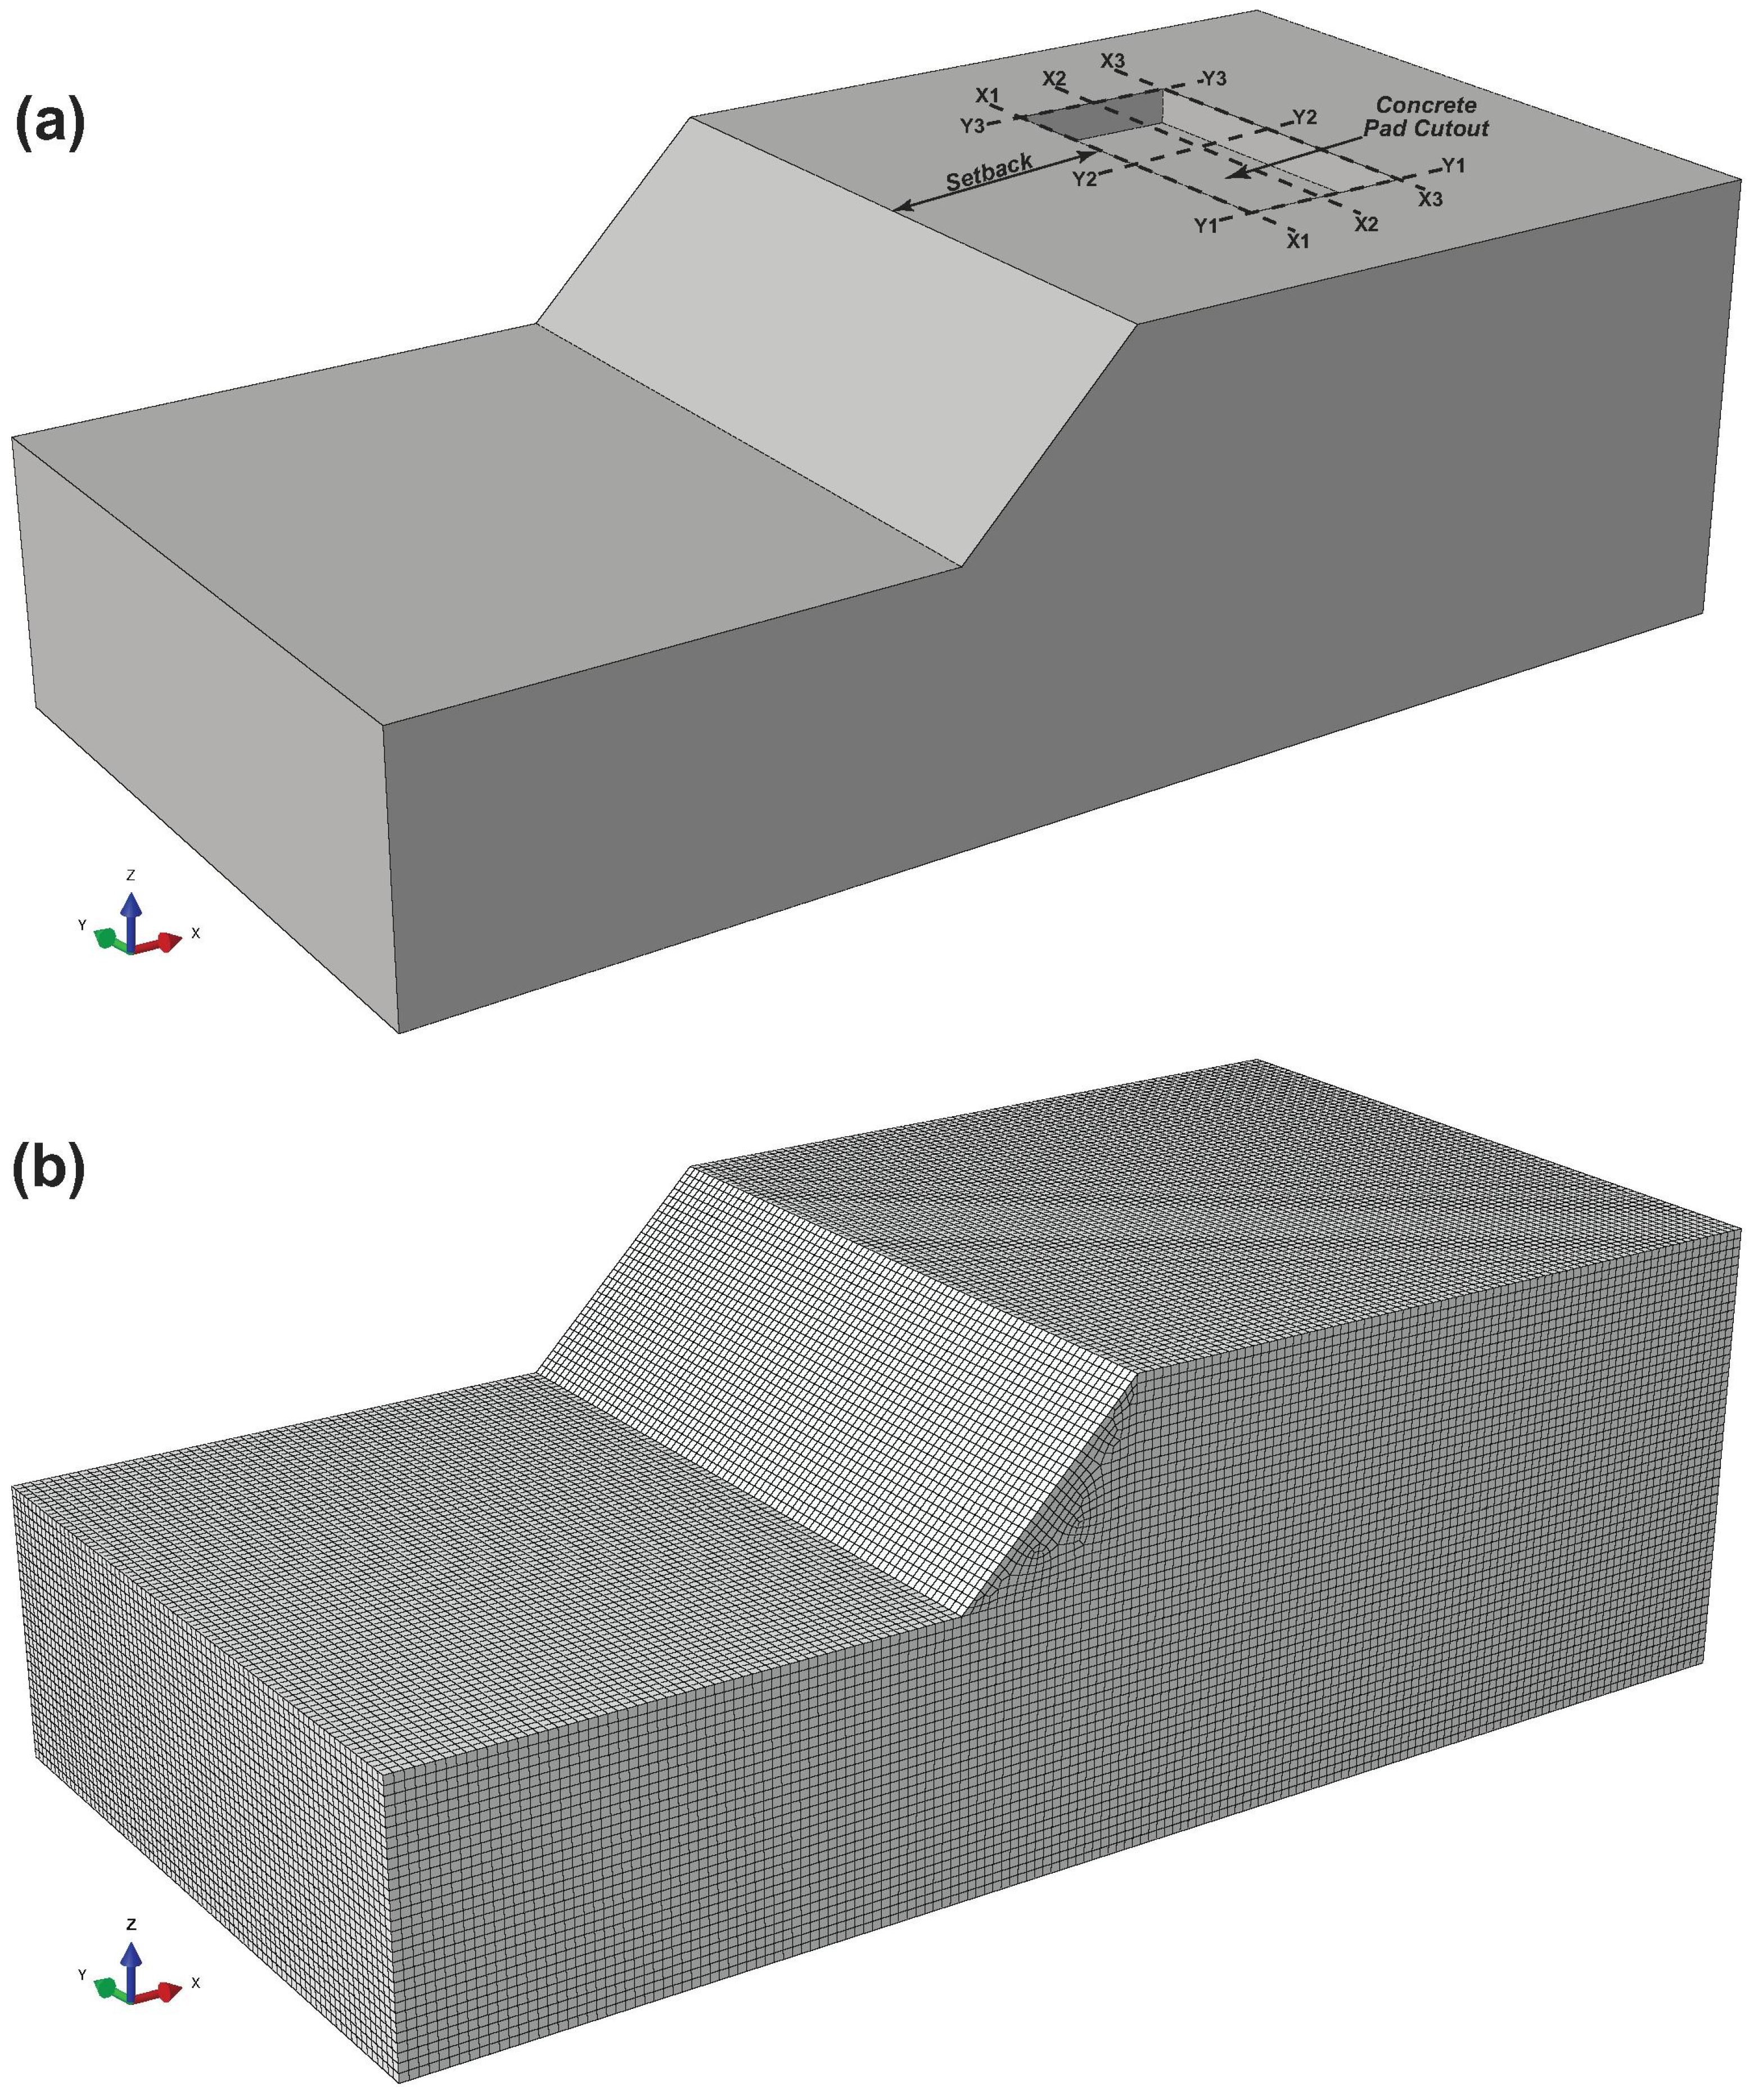
The model domain consists of a rectangular block with an open cut at a 45° slope (
Figure 1).
The model dimensions (m) are
left to right,
front to back,
in the open cut, and
in the uncut area. The slope crest is at
and the toe at
. The model block represents the soil (subsurface material) and concrete pad (foundation). The concrete pad,
(m), was placed near the top of the model (
) at a distance from the slope crest that represents the foundation setback for each model case (
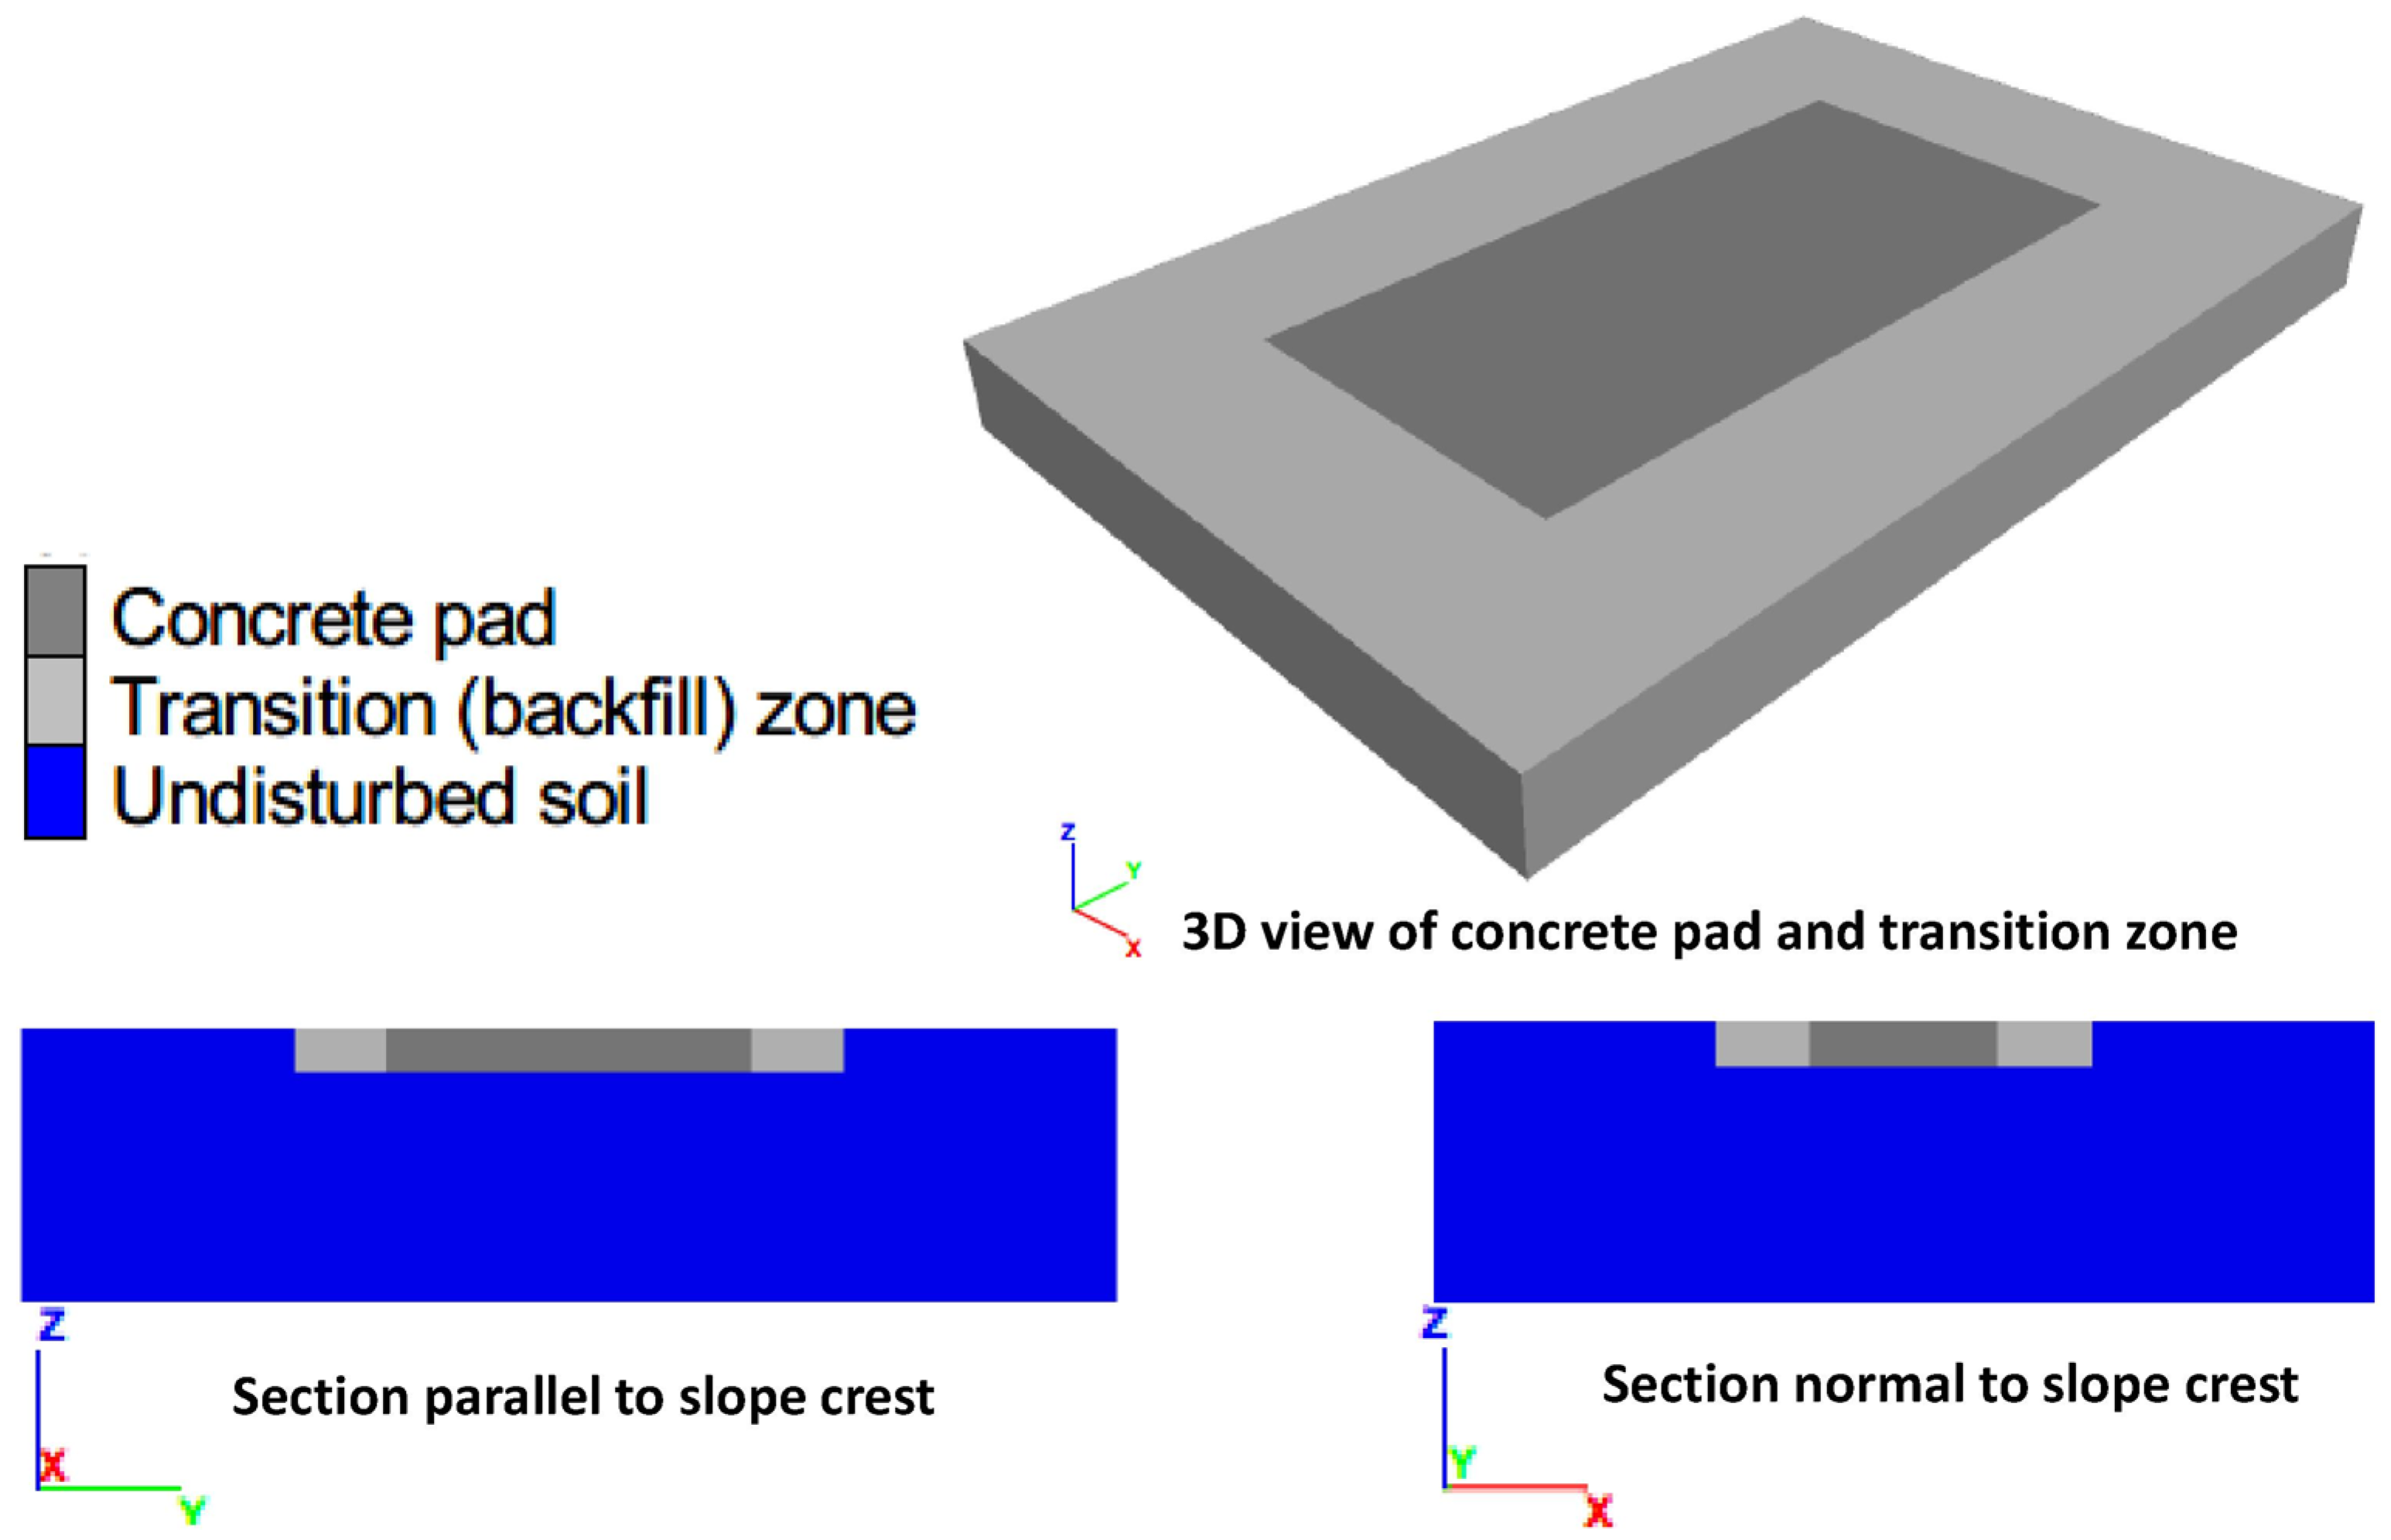
Figure 1a). The pad was modeled using the same mesh as the soil but different element properties. Eight model cases were analyzed for setback distances of 18, 16, 14, 12, 10, 8, 6, and 4 m, respectively. A lateral transition zone (two element dimensions, i.e., 1.0 m) between the concrete pad and soil (
Figure 2) could fracture in tension or shear to simulate the lateral interface between the concrete pad and soil. The transition zone was assigned smaller tensile and shear strength than the soil.
The transition zone uses the same mesh as the soil and concrete but different element properties as described. FBCM uses such transition zones to simulate interface behavior and does not need a dedicated interface model (such as interface elements). Using the same elements for soil, concrete, and transition zones enhances modeling flexibility. In this work, for example, the foundation setback was modified by changing the element properties to relocate the concrete slab and transition zones in the model without remeshing.
The material properties for the soil and concrete are shown in
Table 1. The soil parameters represent a generic cohesive frictional soil. The transition zone material was assigned the same property values as soil, except for
and tensile strength, which were assigned half the value for soil.
The boundary conditions consist of zero normal velocity at the model base and exterior vertical boundary surfaces. An initial stress was specified based on a density of 1.76 (in units of thousand kg/m3, consistent with stress in kPa), gravitational acceleration of 9.8 m/s2, and lateral-to-vertical stress ratio of 0.54. A surcharge pressure of 21 kPa was included in the initial stress definition, which represents a foundation depth of ~1.2 m.
The calculation sequence for each model case started with establishing the initial static equilibrium state with the initial stress and boundary conditions. Thereafter, to simulate a foundation loading sequence, a small downward vertical velocity was applied at the top surface of the concrete pad for a specified (large) number of calculation steps, and the foundation loading and soil fracturing were calculated to describe the system response.
3. Results and Discussion: Calculated Behavior of Shallow Foundation Atop A Slope
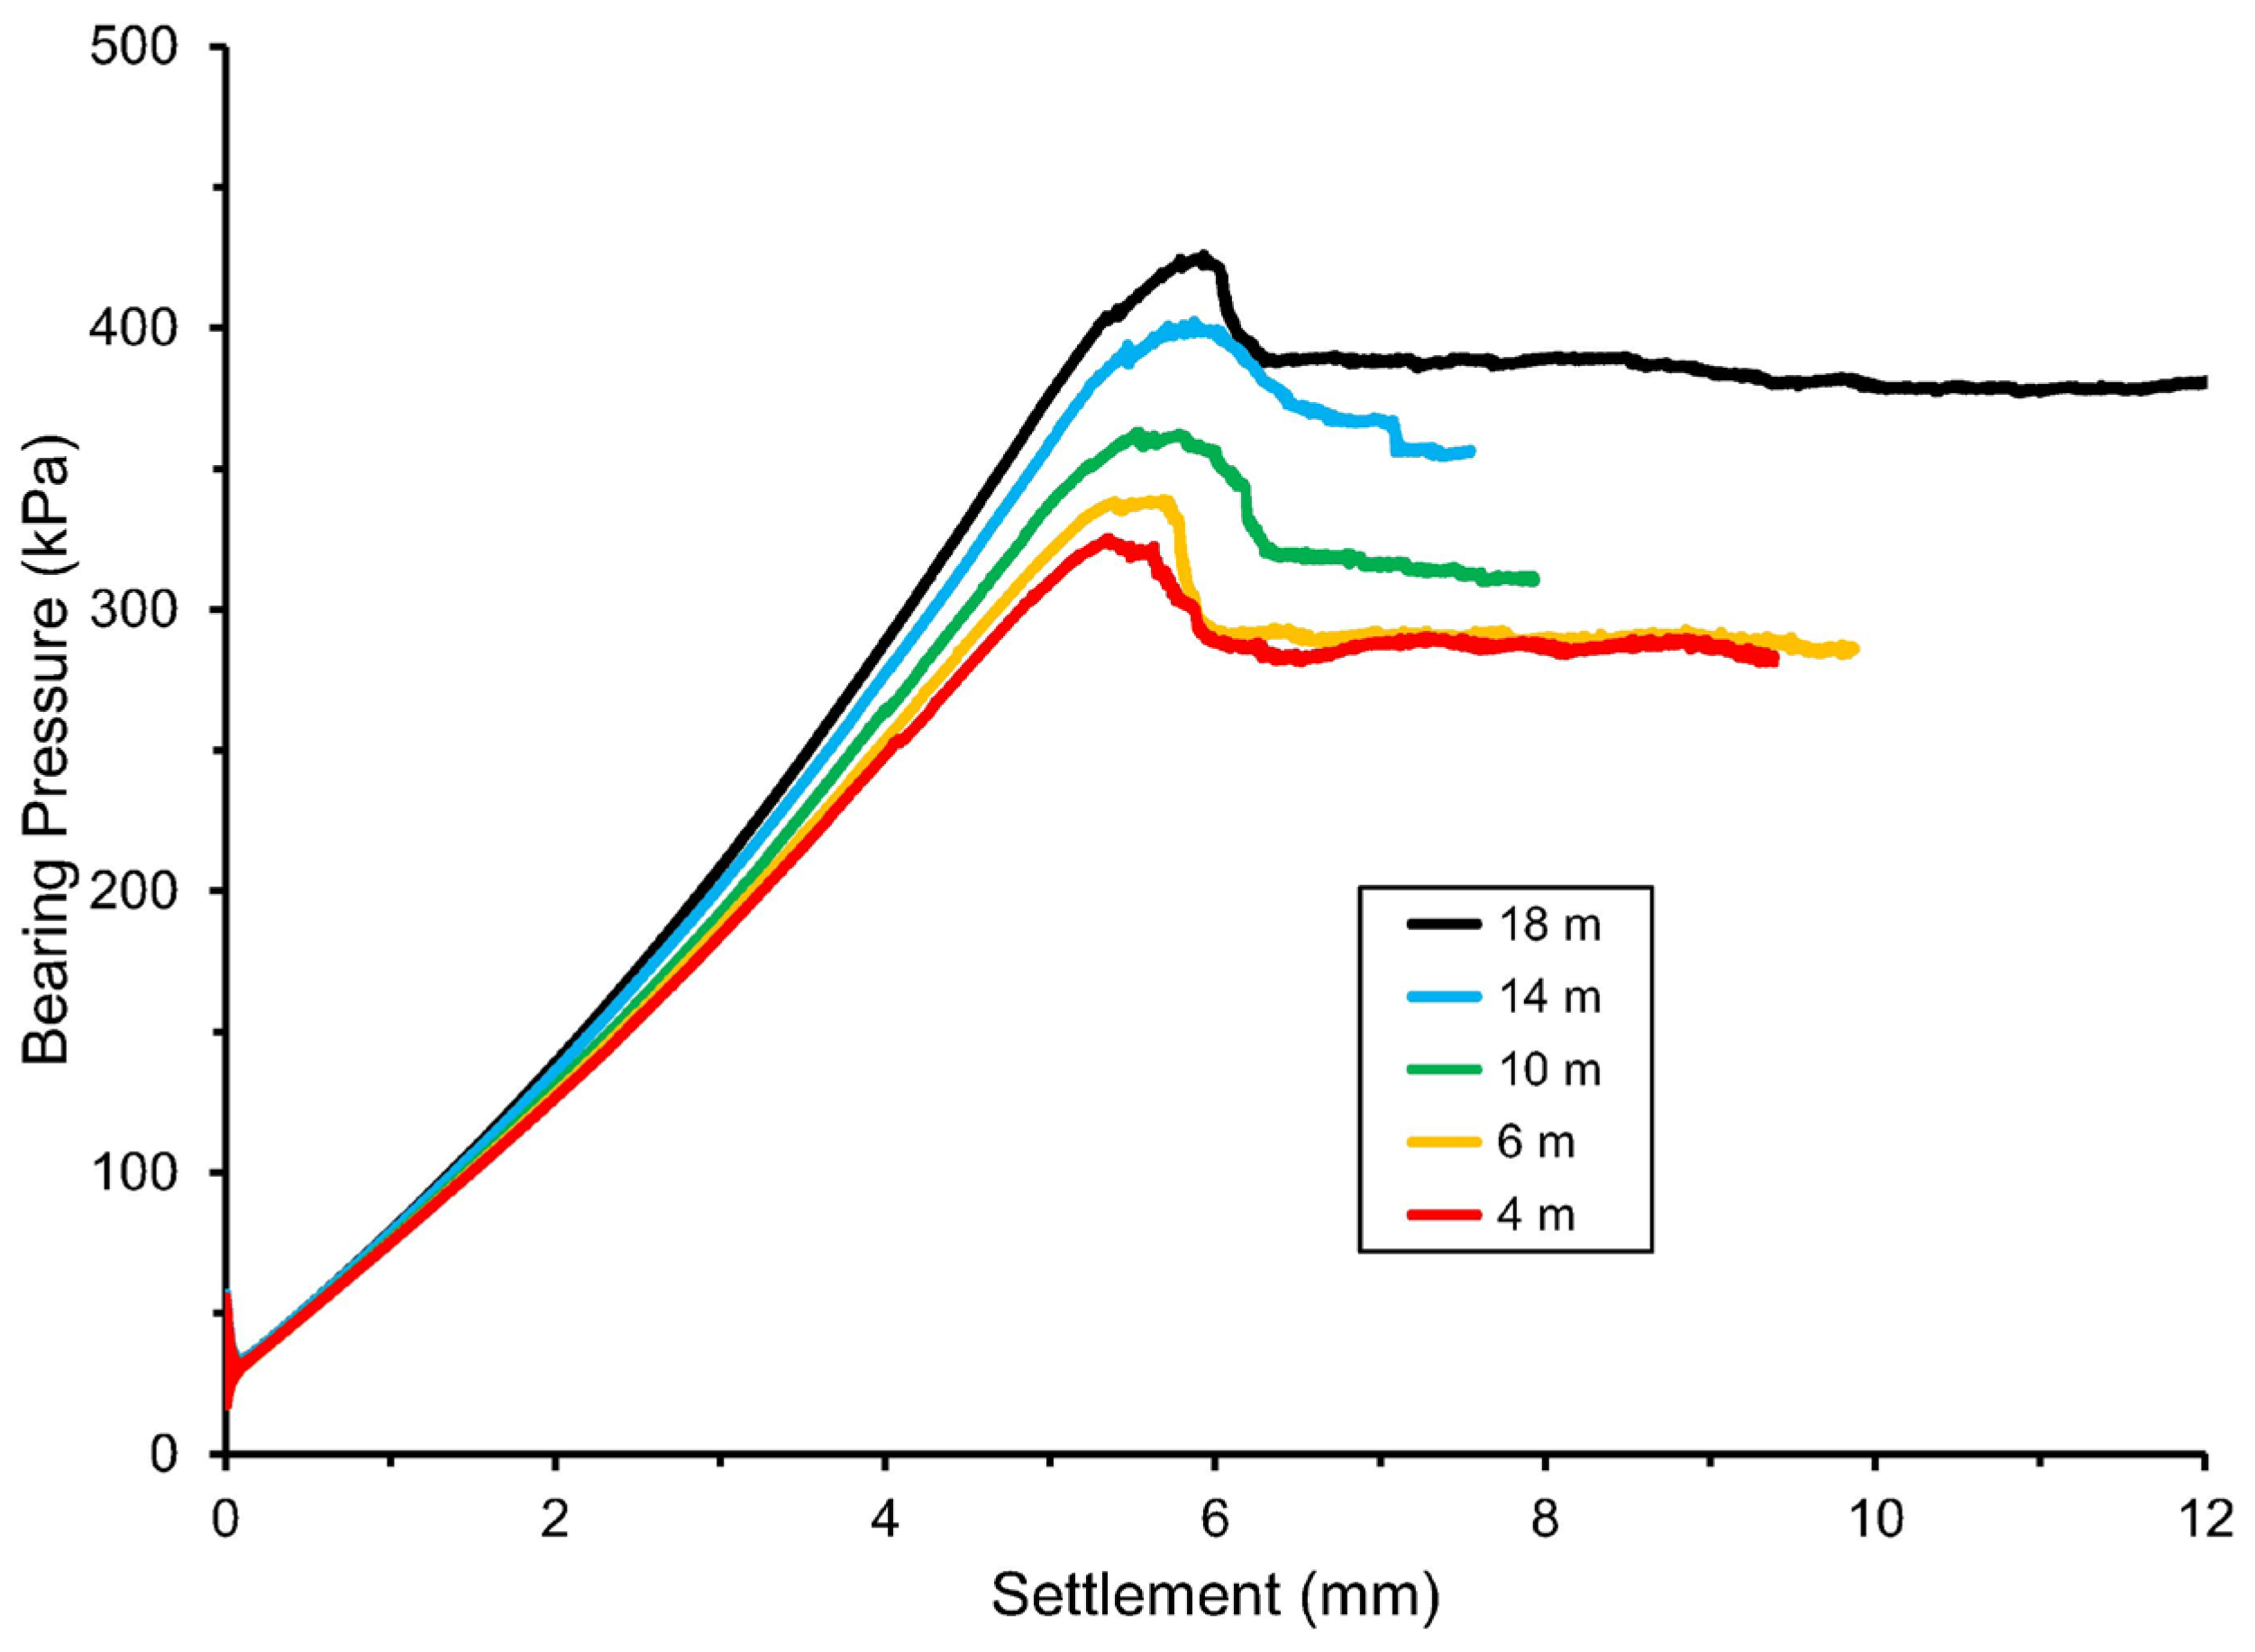
The foundation loading sequence and system response represent a full-scale load test of a foundation design to describe the bearing pressure versus settlement relationship (e.g.,
Figure 3). The plots in
Figure 3 show an S-shaped relationship as the foundation system stiffness increases with settlement to a maximum and decreases thereafter. The initial increase in stiffness is due to pore compaction, whereas the decrease in stiffness thereafter is due to soil fracturing. The state of decreasing stiffness identifies the ultimate state, which is characterized by a peak bearing pressure and post-peak behavior. The calculated relationship includes initial oscillations near zero bearing pressure that can be ignored because the relationship stabilizes thereafter to a monotonically increasing bearing pressure versus settlement.
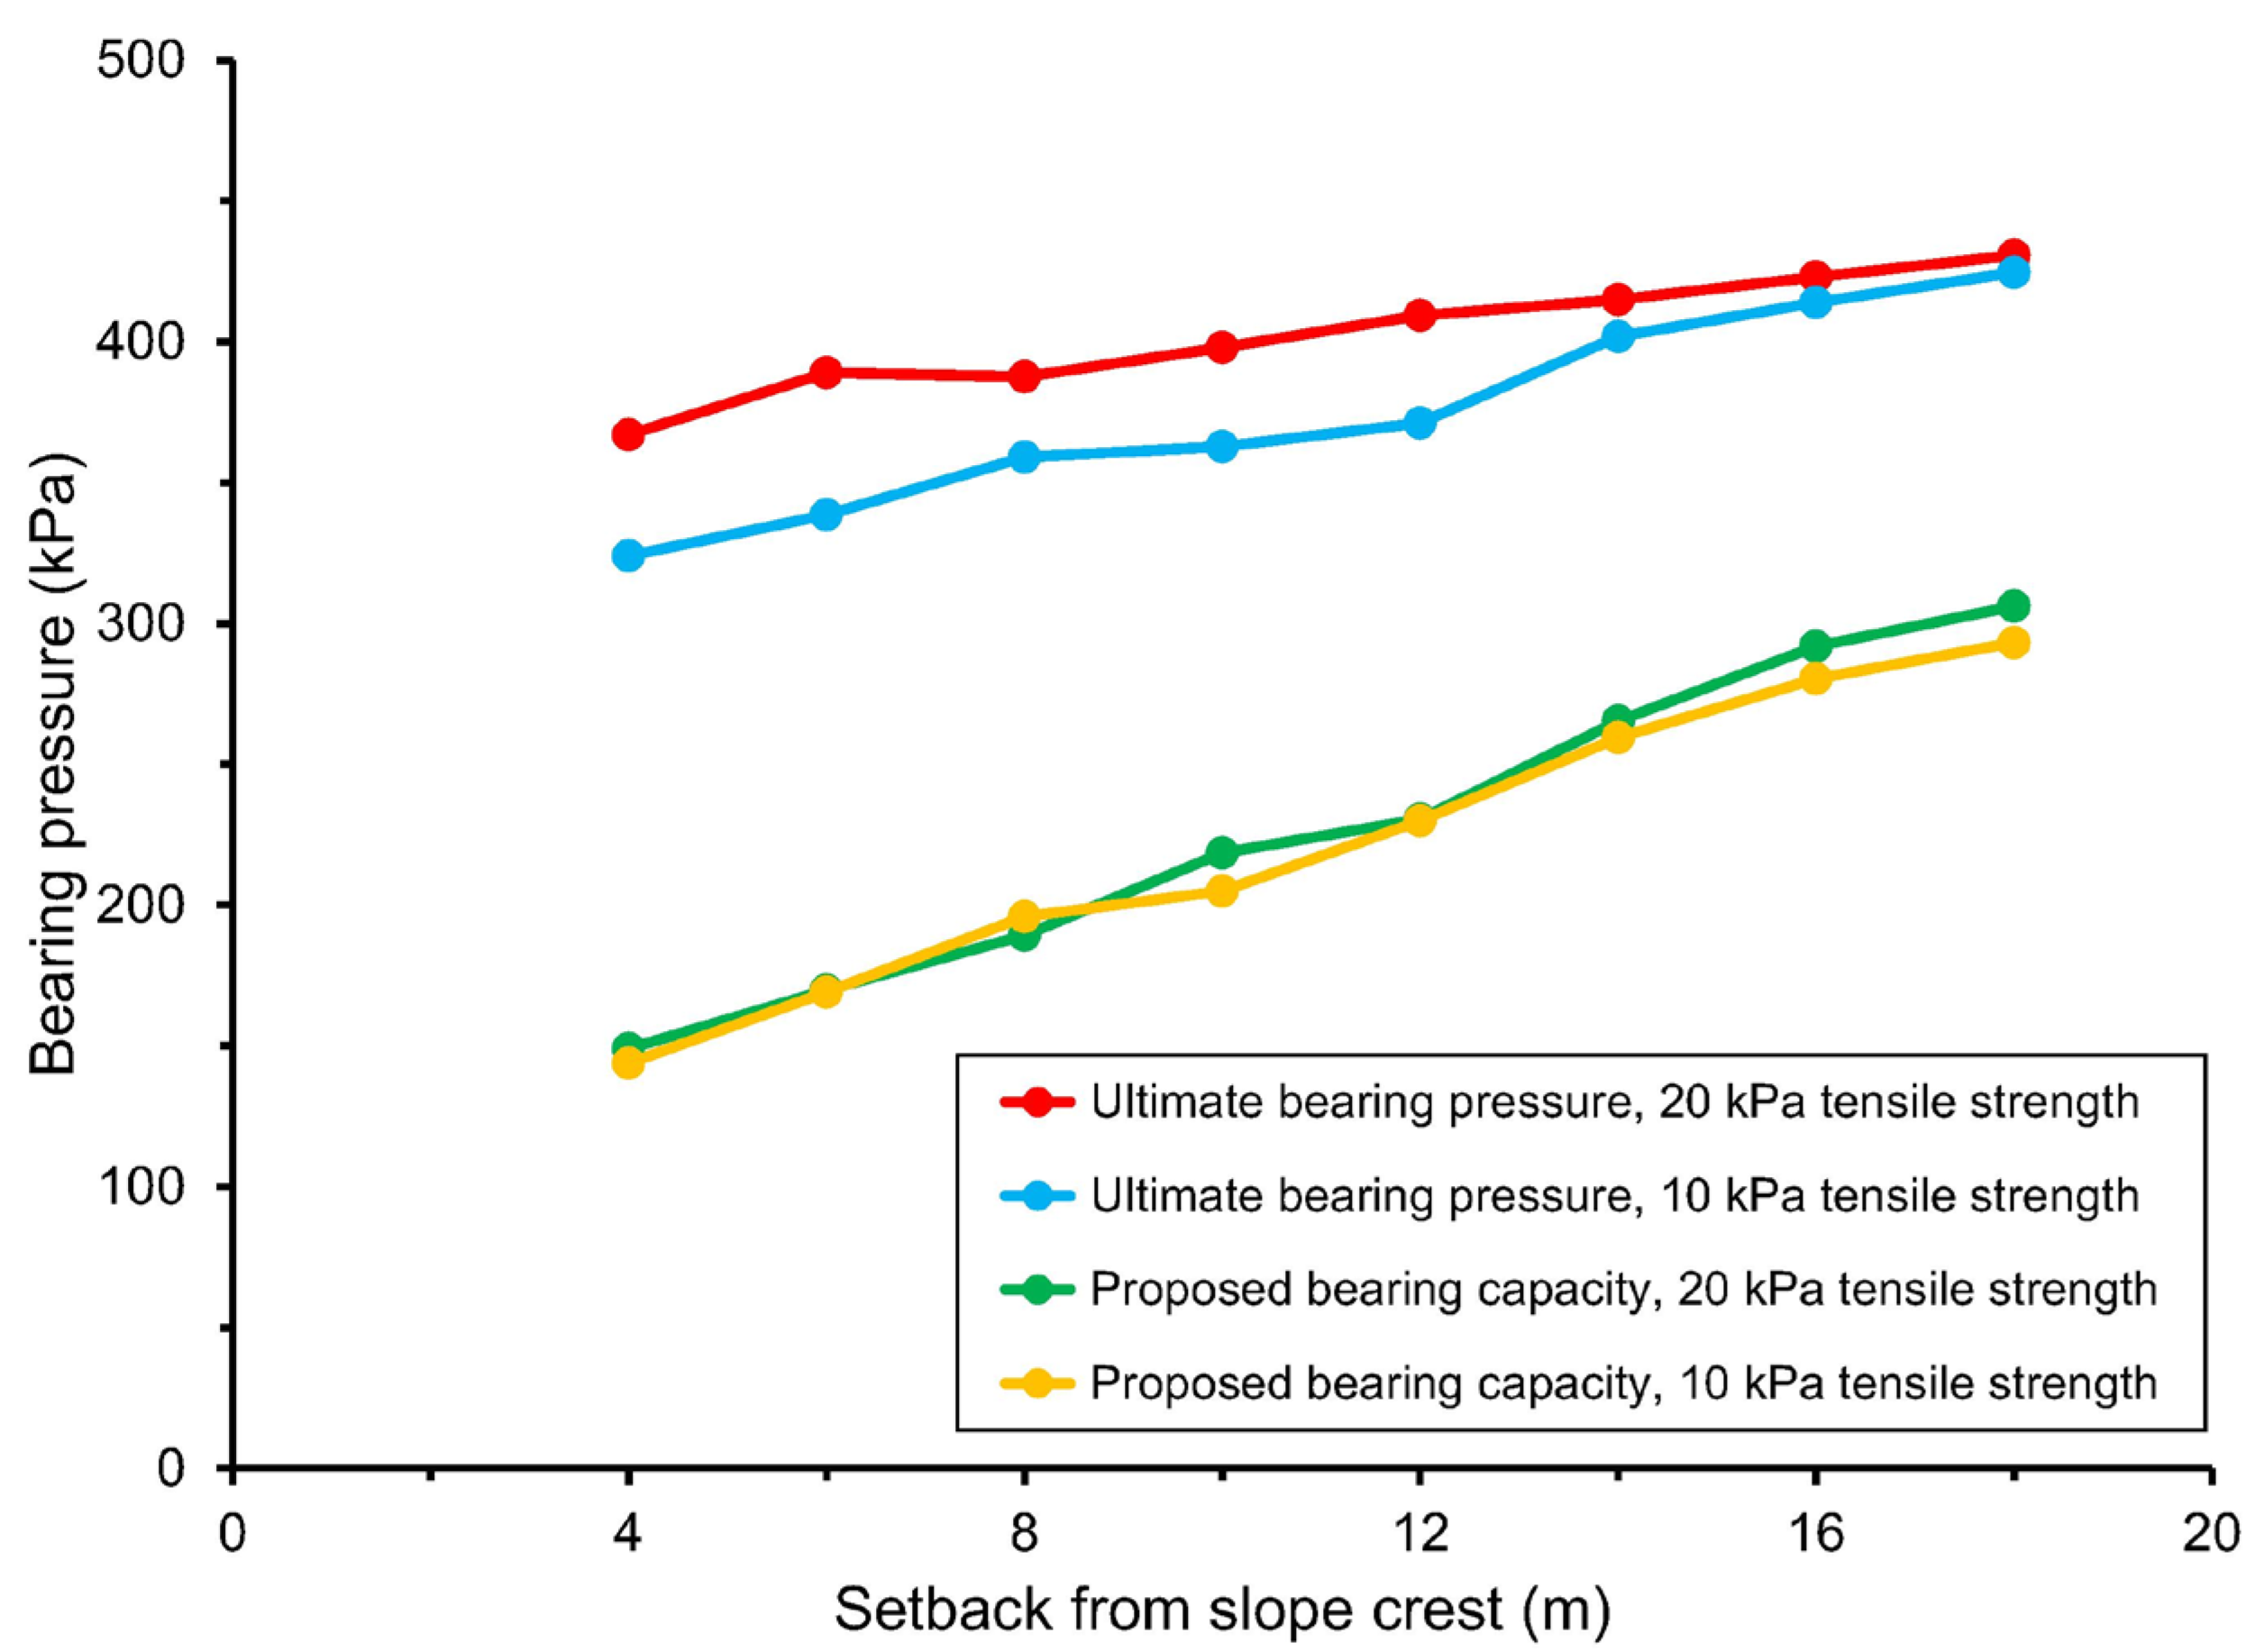
The peak (or ultimate) bearing pressure characterizes the foundation design and can be combined with a safety factor to determine the bearing capacity. The peak bearing pressure decreases as the setback from the slope crest decreases. Also, soil models with greater tensile strength result in a greater peak bearing pressure. As shown in
Figure 4, the peak bearing pressure for cases with a soil tensile strength of 20 kPa is consistently greater than the peak bearing pressure for corresponding cases with tensile strength of 10 kPa, with a difference that increases as the setback from the slope crest decreases.
3.1. Results and Discussion: Bearing Capacity
Following the traditional approach for foundation analysis, the bearing capacity can be determined by applying a safety factor to the ultimate bearing pressure (top two curves of
Figure 4) calculated in the numerical simulations. However, a different approach is proposed in this paper (bottom two curves of
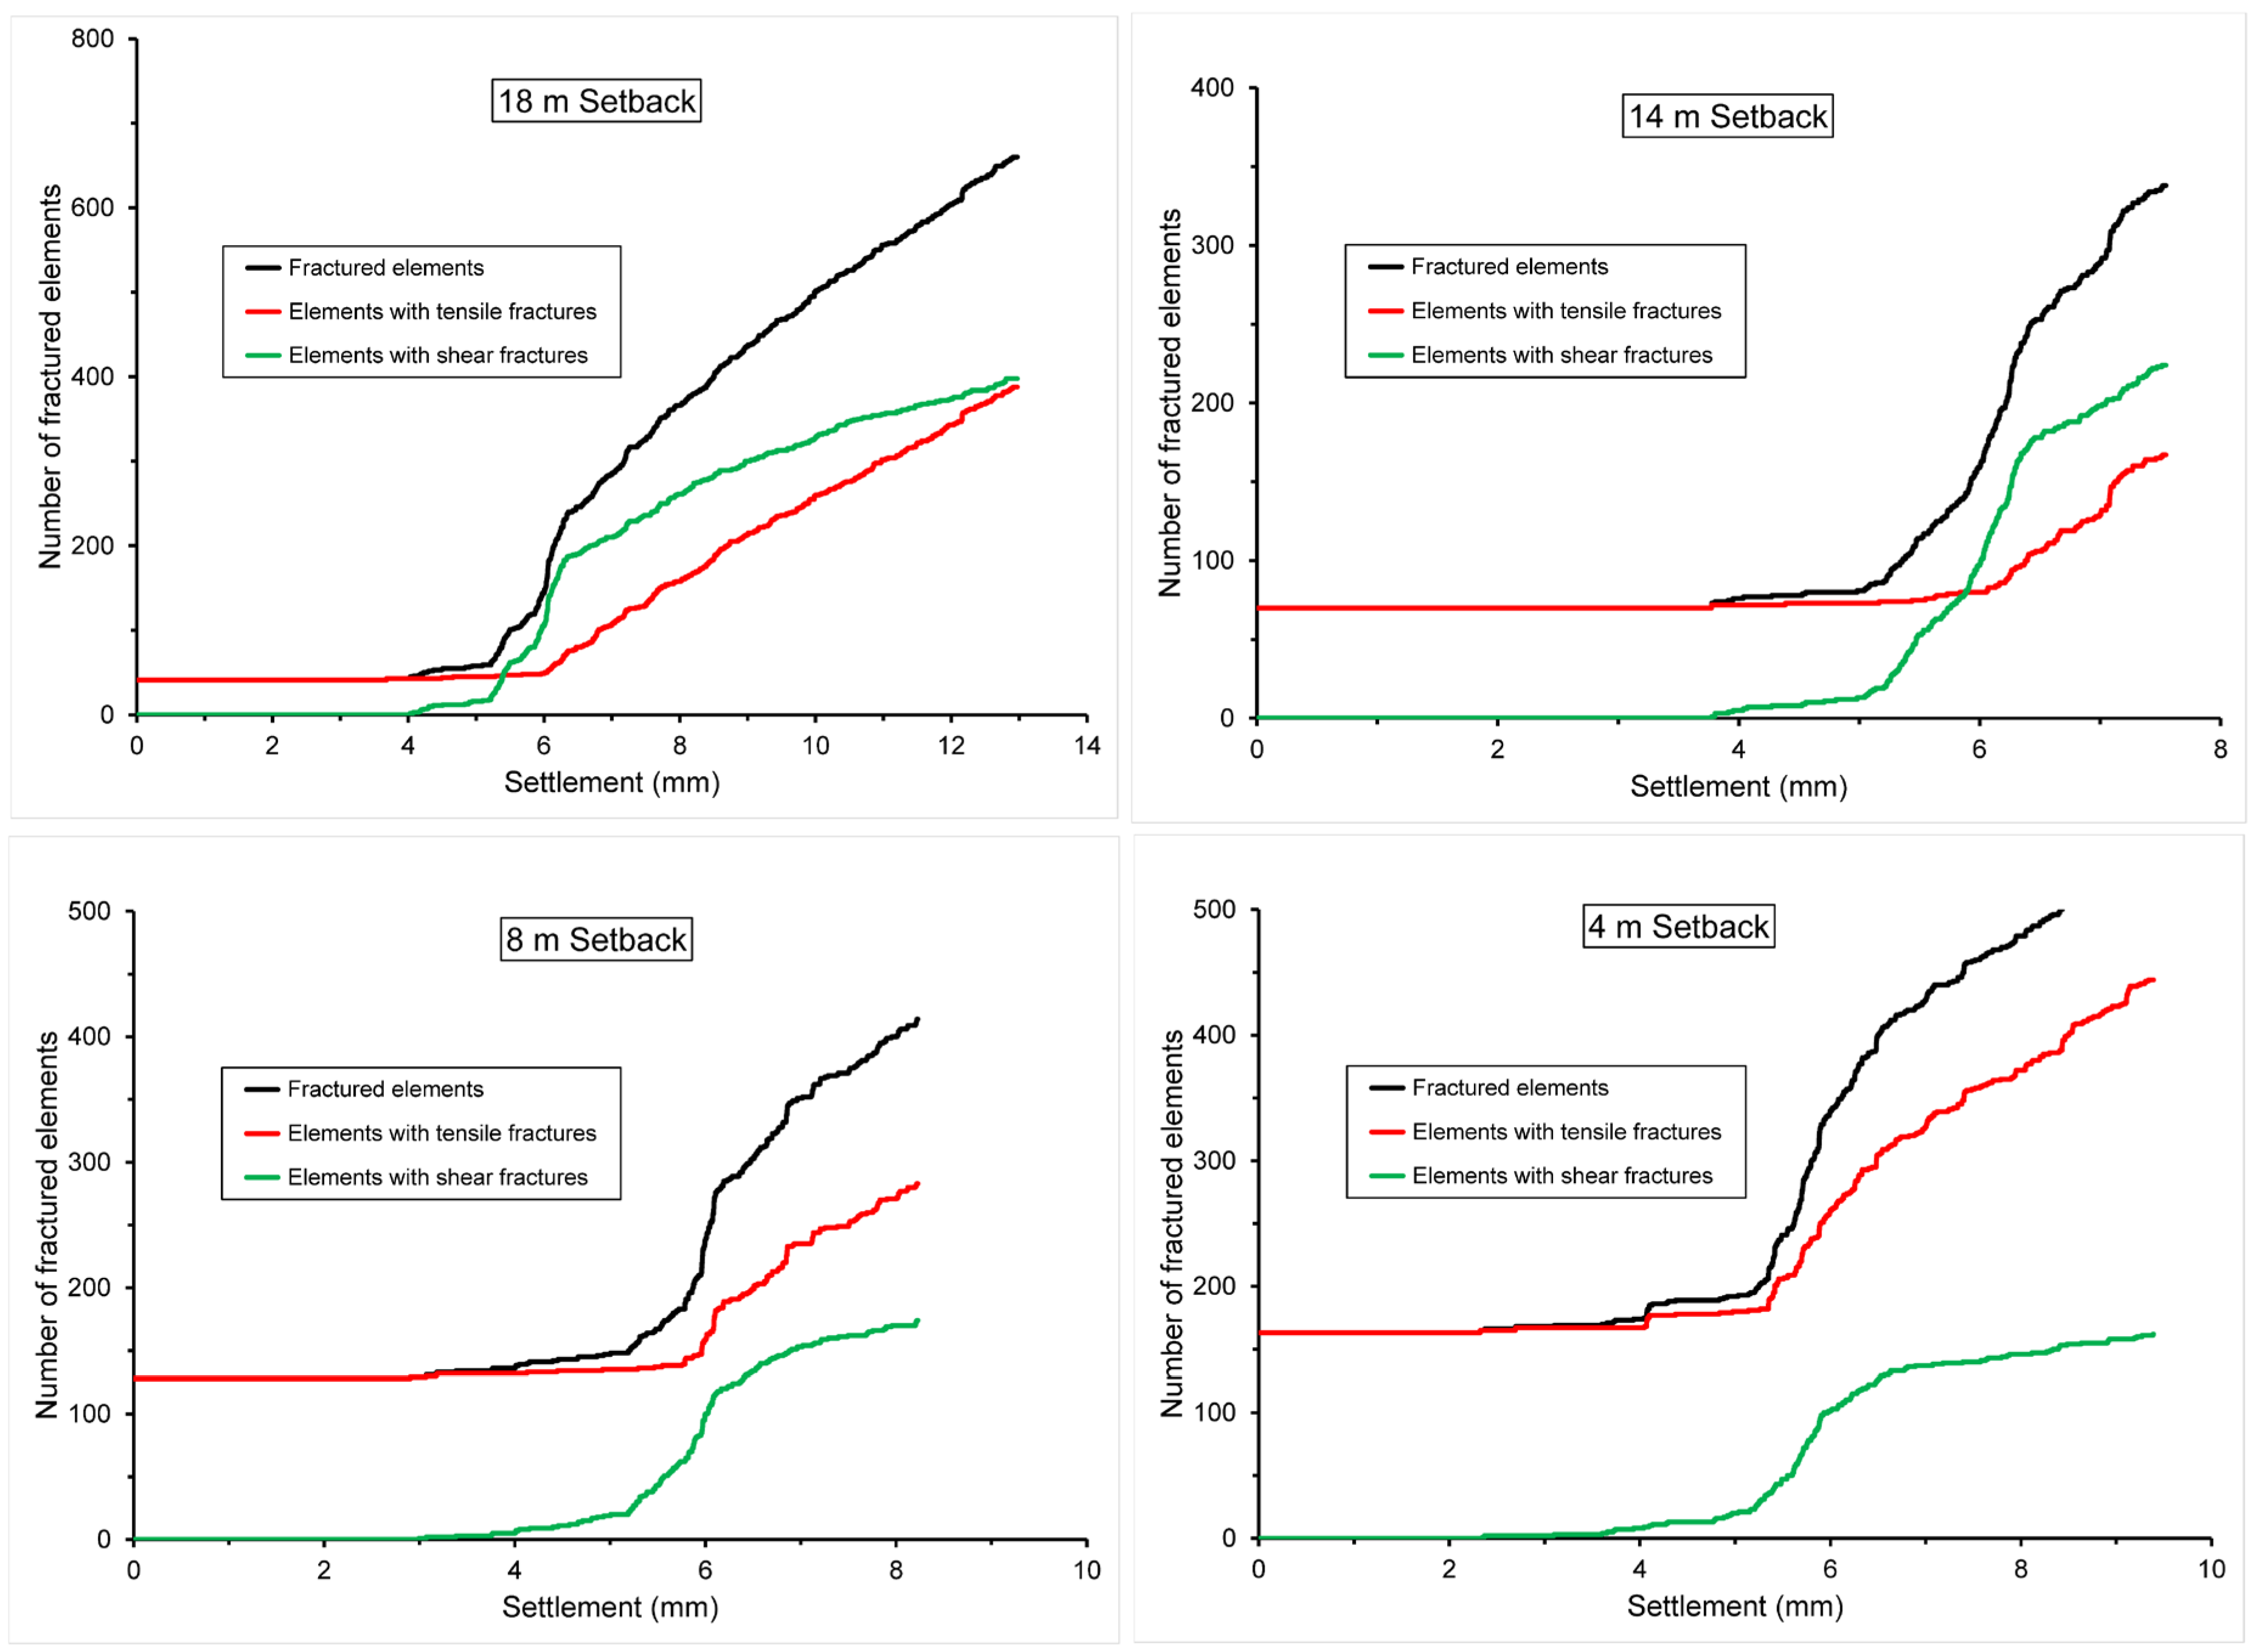
Figure 4) by using the mechanical damage behavior to determine bearing capacity without using the ultimate bearing pressure. This “damage-based bearing capacity” is determined using a characterization of soil mechanical damage that FBCM provides in terms of the number of fractured domain elements, which is proportional to the volume of fractured soil because the element volume is essentially constant (
Figure 1b). As shown in
Figure 5, the damage characterization describes the number of fractured elements (i.e., volume of fractured soil), number of elements with tensile fractures (i.e., volume of soil damaged in tension), and number of elements with shear fractures (i.e., volume of soil damaged in shear). Because the foundation was subjected to progressive loading, the soil shows progressive damage in shear or tension. The damage characterization plots (
Figure 5) show a threshold settlement for the occurrence of damage due to foundation loading. The bearing pressure that corresponds to the threshold settlement is the minimum bearing pressure that will cause mechanical damage. Damage does not occur if the bearing pressure is smaller than the minimum (i.e., if settlement is smaller than the threshold). A bearing pressure greater than the minimum (i.e., settlement greater than the threshold) causes greater mechanical damage.
The approach proposed in this paper for the evaluation of bearing capacity uses the threshold settlement and consists of two steps. The first step is to determine the threshold settlement for the occurrence of mechanical damage using the damage characterization (i.e., fracture versus settlement) plots (
Figure 5). The second is to use the threshold settlement with the bearing pressure versus settlement relationship to determine the minimum bearing pressure sufficient to cause mechanical damage (i.e., the greatest bearing pressure too small to cause mechanical damage).
The threshold settlement for mechanical damage manifests in
Figure 5 as the first increase above the initial condition for the number of fractured elements (dark curve). For example,
Figure 5 shows a threshold settlement of ~4 mm in the model case with setback of 18 m. The threshold settlement for damage (
Table 2 and
Table 3) was used with the bearing pressure versus settlement relationships to determine the bearing capacity as proposed (bottom curves of
Figure 4). By comparing with the ultimate bearing pressure (top curves of
Figure 4), the proposed bearing capacity implies a safety factor that increases as the foundation setback decreases (
Table 2 and
Table 3 and
Figure 4).
3.2. Results and Discussion: Failure Mechanisms of the Subsurface Materials
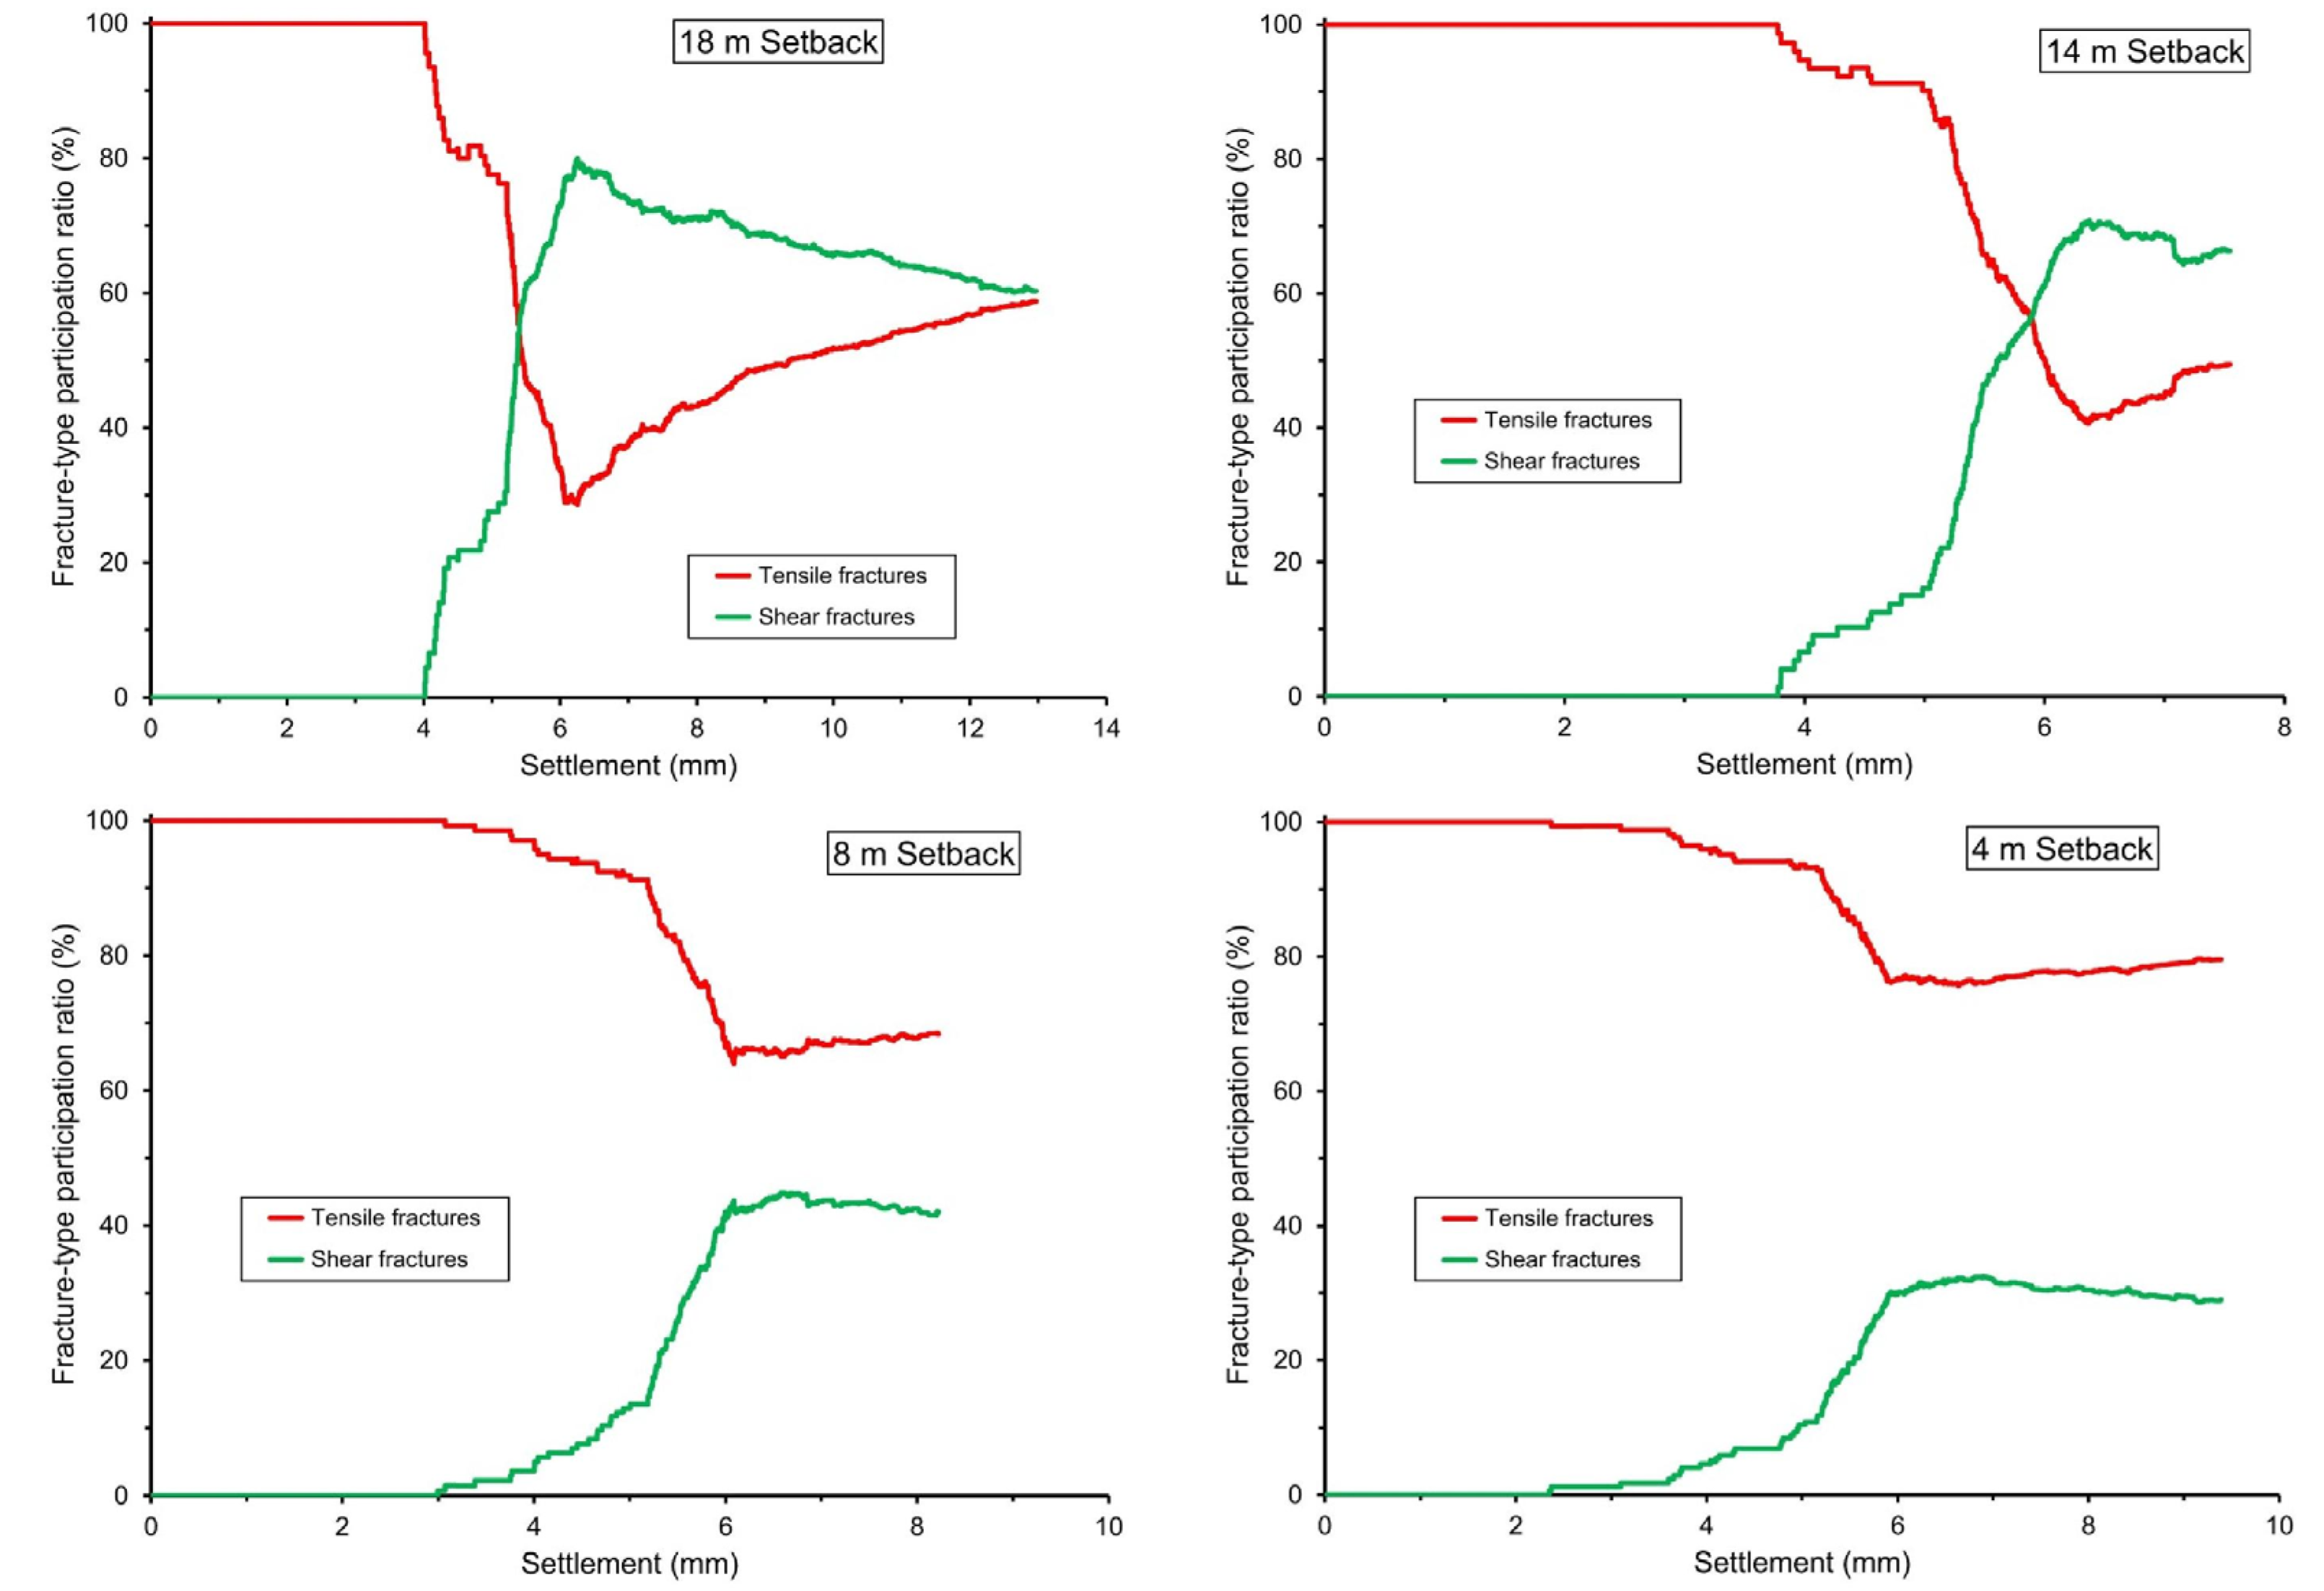
To understand the failure mechanisms of the subsurface materials, the soil mechanical damage characterization is re-examined in terms of the participation of tensile and shear damage mechanisms, where participation is defined as the ratio of the volume of soil (number of elements) with a fracture type divided by the volume of fractured soil (
Figure 6). Because of the initial-state fractures in the transition zone, tensile participation begins with a value of 100%. In contrast, shear participation begins with a zero value at the initial state and increases when settlement reaches the threshold value. Thus, in this example, the settlement at the first occurrence of non-zero shear participation coincides with the threshold settlement (and minimum bearing pressure) for the occurrence of soil mechanical damage.
After foundation loading reaches the state of threshold settlement, the tensile participation decreases as the shear participation increases, because the volume of soil with shear fractures is increasing while the volume of soil with tensile fractures either remains unchanged for foundations at large setback (setback greater than ~12 m) or increases at a slower rate for foundations at small setback (setback smaller than ~12 m). When mechanical damage of the subsurface material occurs, tensile participation decreases to a minimum value and increases thereafter, whereas shear participation increases to a maximum value and decreases thereafter. The minimum tensile participation and maximum shear participation from each load test are used as characteristic values to describe the subsurface material failure mechanisms due to foundation loading.
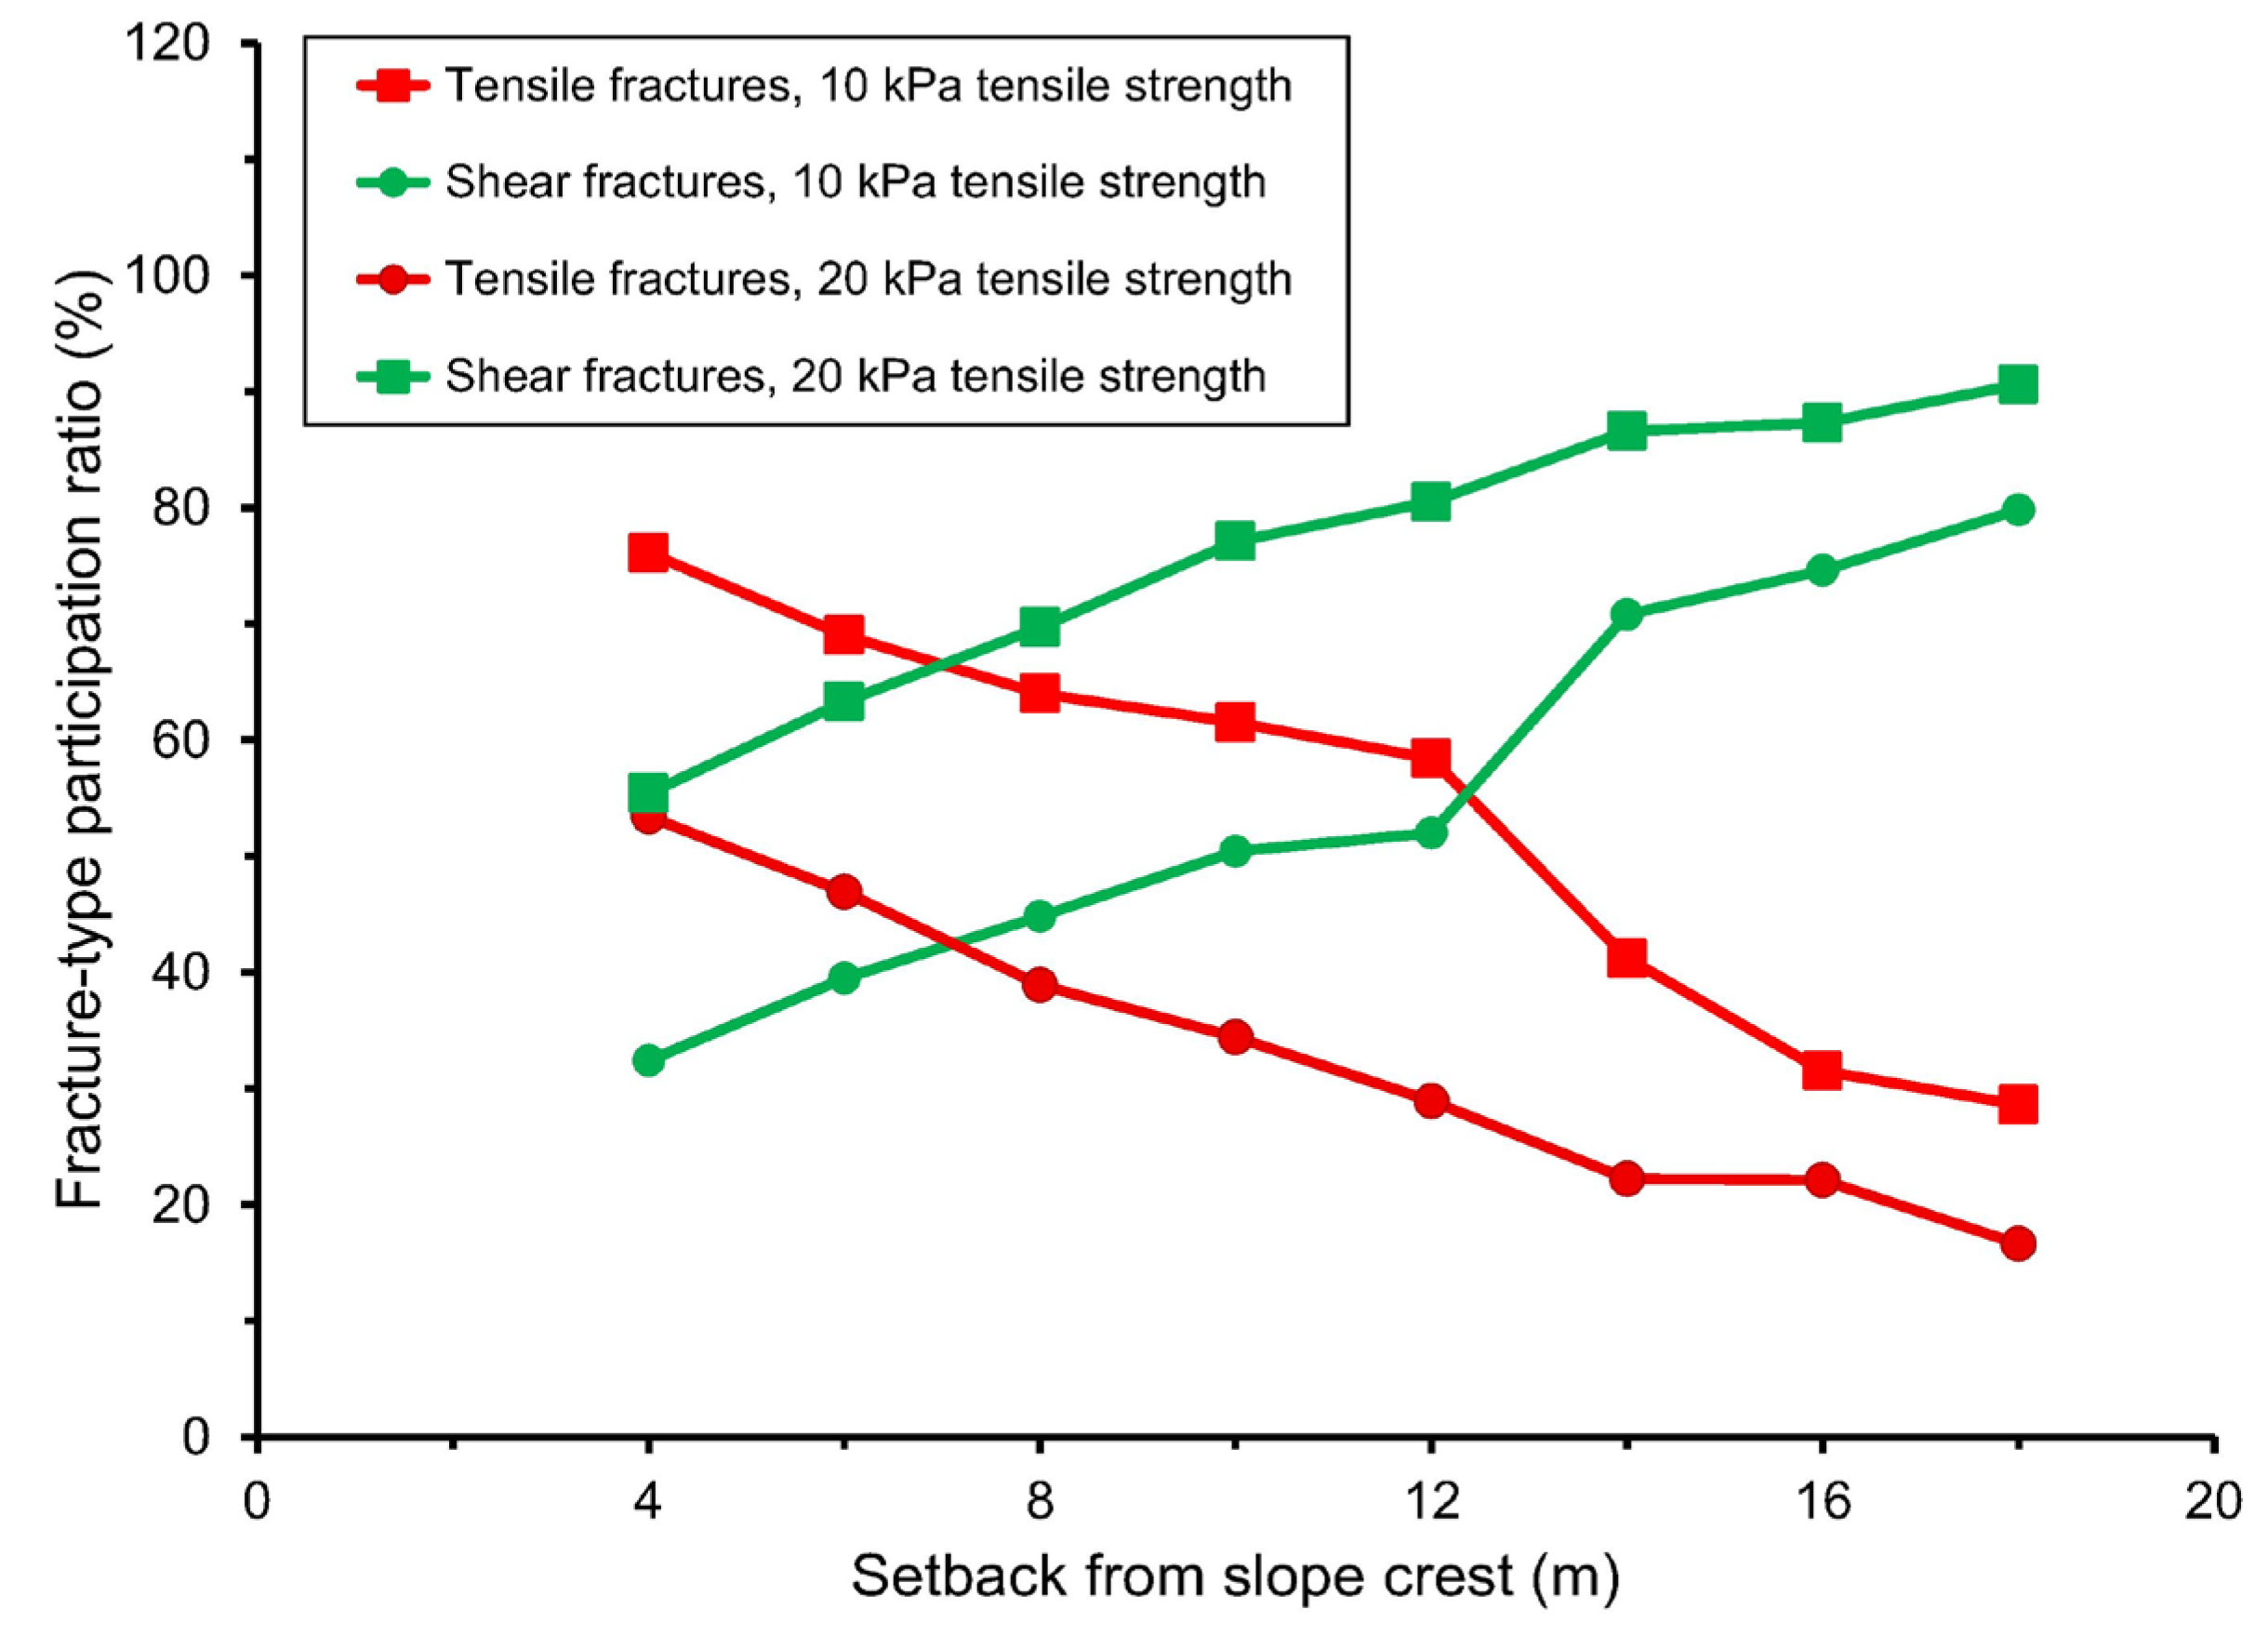
The results (
Figure 7) show that tensile participation in the foundation failure mechanism increases as the foundation setback decreases. Also, greater tensile strength produces smaller tensile participation. For the models with smaller tensile strength (10 kPa), the minimum tensile participation varies from approximately 80% for a foundation setback of 4 m to approximately 30% for a setback of 18 m. The models with greater tensile strength (20 kPa) experienced smaller tensile participation, showing minimum values of approximately 50% for a setback of 4 m to smaller than 20% for a setback of 18 m. Shear failure was the dominant mechanism for foundation failure in models with a soil tensile strength of 20 kPa, except for foundation setbacks of 4–6 m, where the shear and tensile mechanisms were equally important. In contrast, tensile failure was the dominant mechanism for foundation failure in models with a soil tensile strength of 10 kPa and foundation setback smaller than approximately 12 m.
The results show that both tensile and shear failure mechanisms contribute to the behavior of foundations on sloping ground. The two mechanisms determine the geometry of potential failure surfaces and the type of soil resistance against mechanical damage. In contrast, the development of bearing capacity factors used in current practice was postulated on a failure surface geometry and soil resistance based on modeling shear failure as the only failure mechanism [
1]. Because the contributions of the tensile failure mechanisms were not included in the analytical formulation, the bearing capacity factors used in current practice could provide misleading predictions for foundations that induce significant tensile stress in the subsurface materials, such as foundations that apply high loading and are sited on sloping ground, subsurface materials with complex geometry, or other conditions where the subsurface materials include external and internal surfaces inclined to the direction of foundation loading.
3.3. Results and Discussion: Spatial Distribution of Mechanical Damage
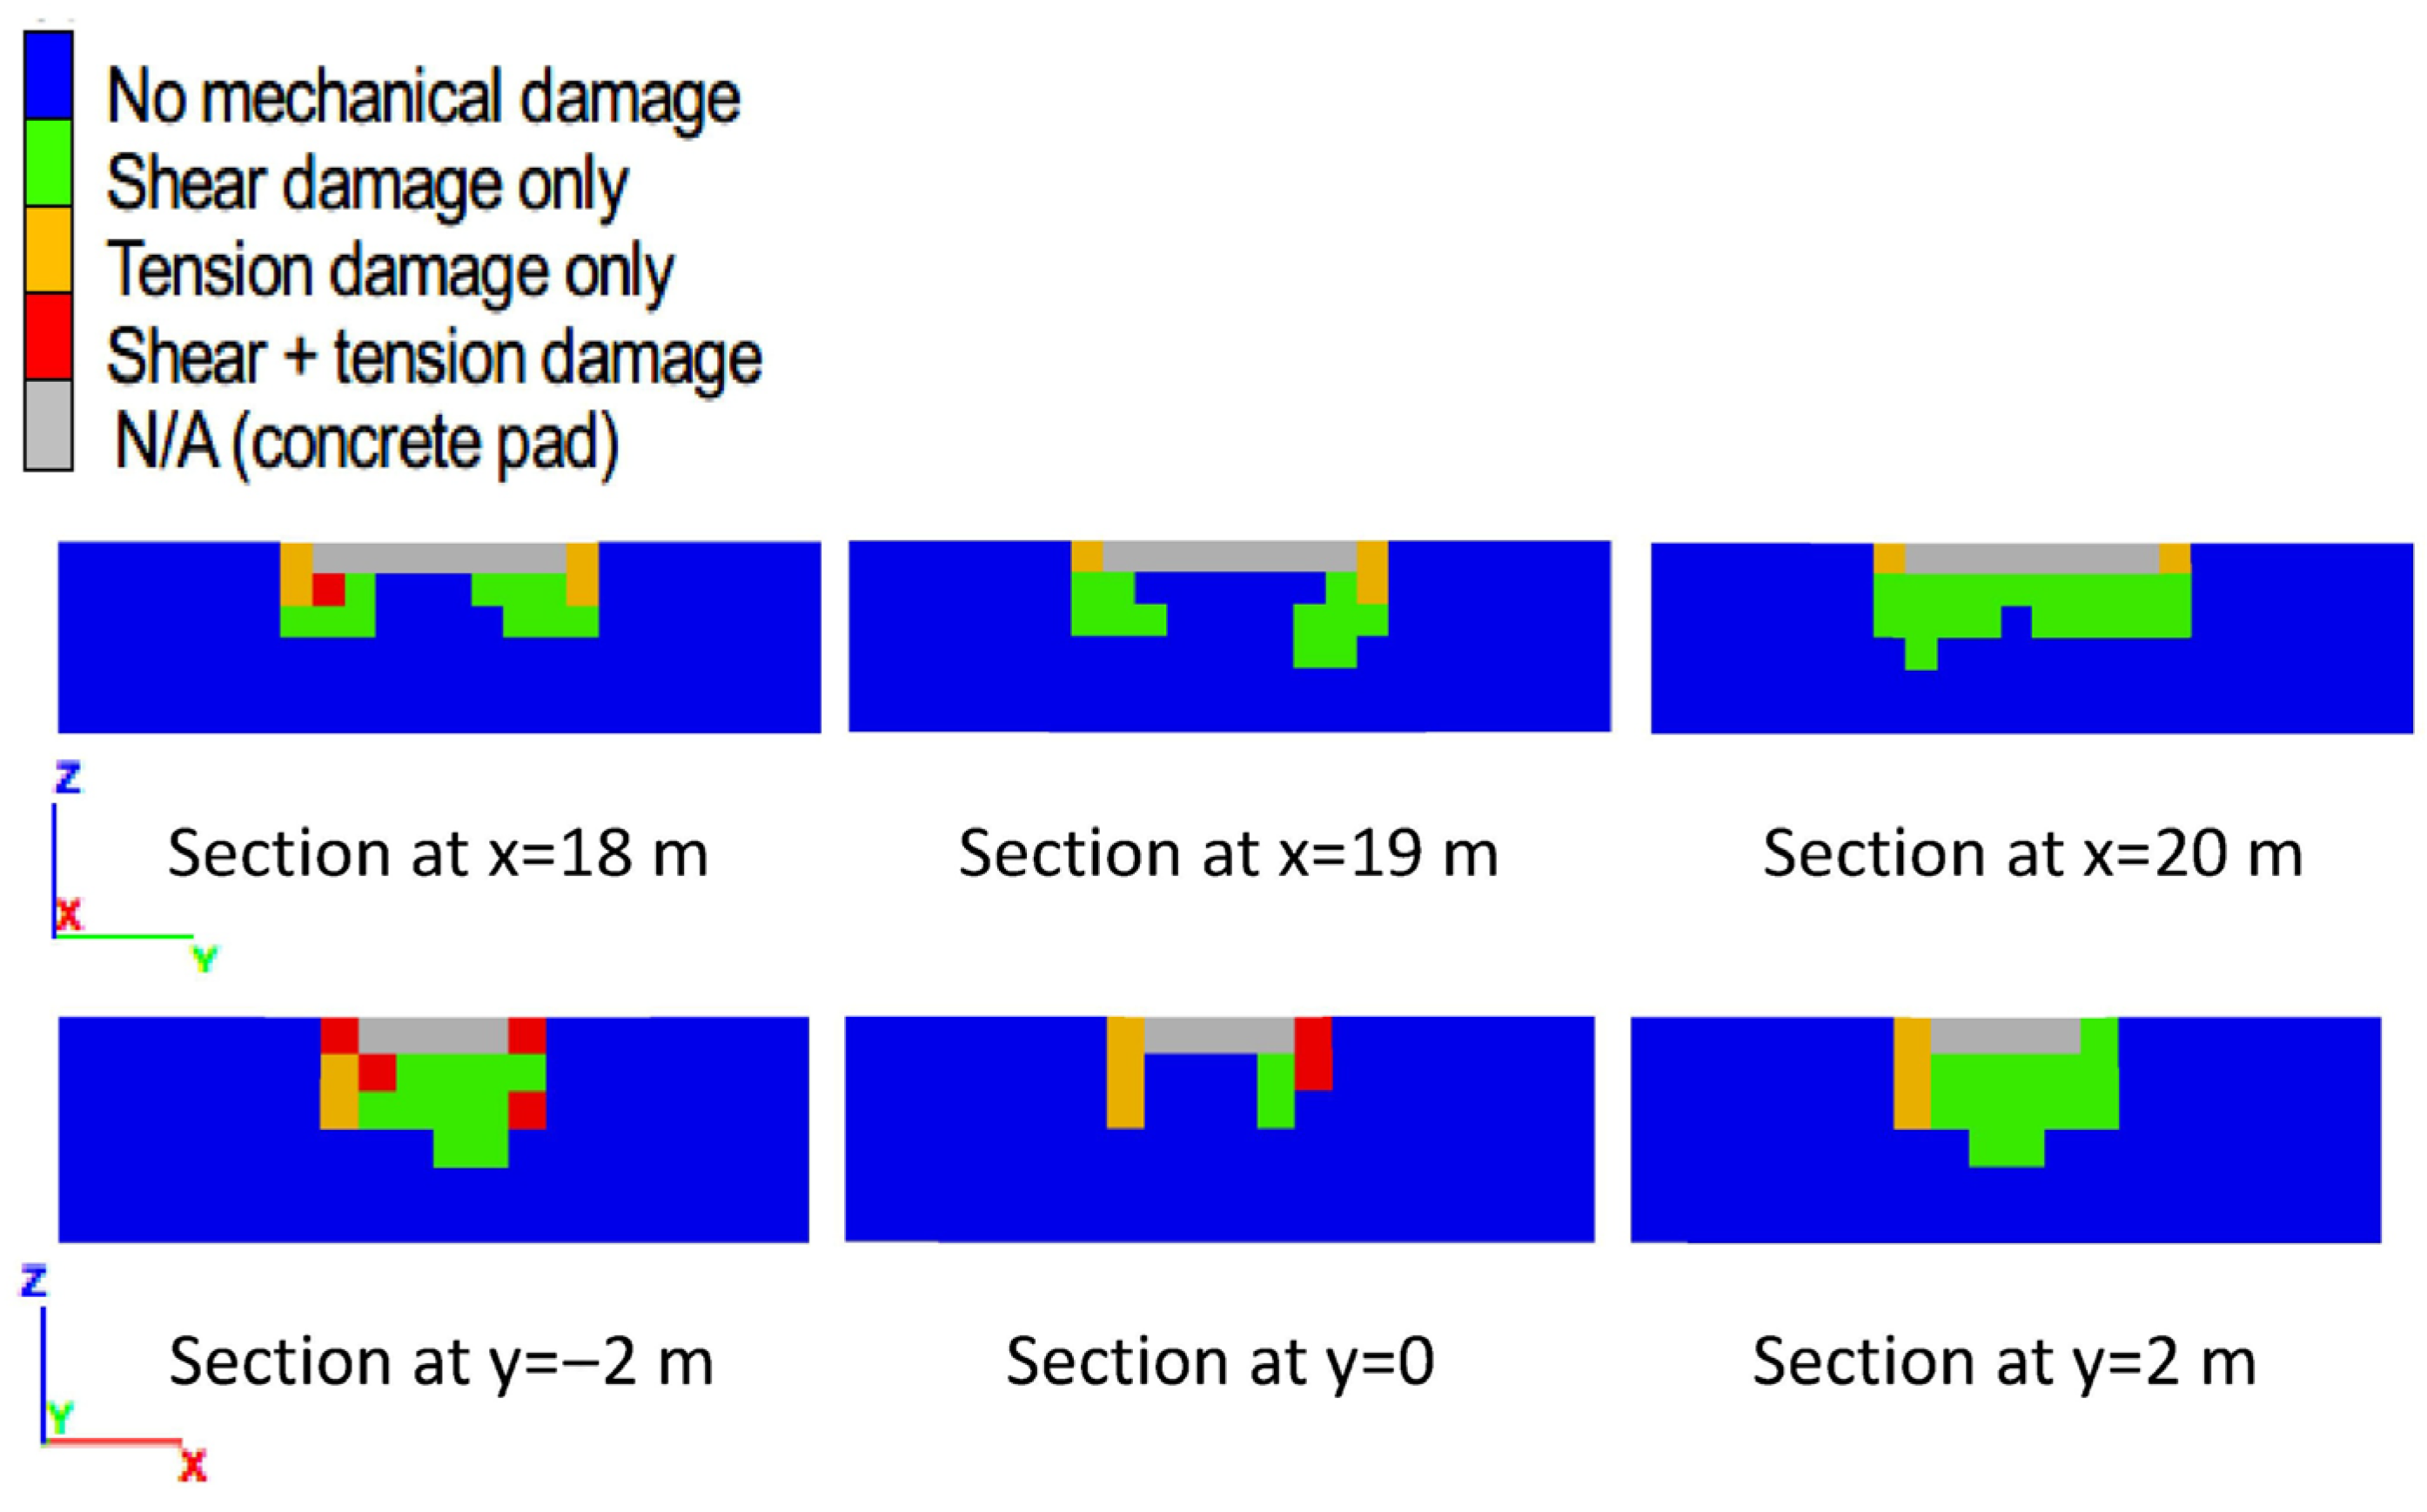
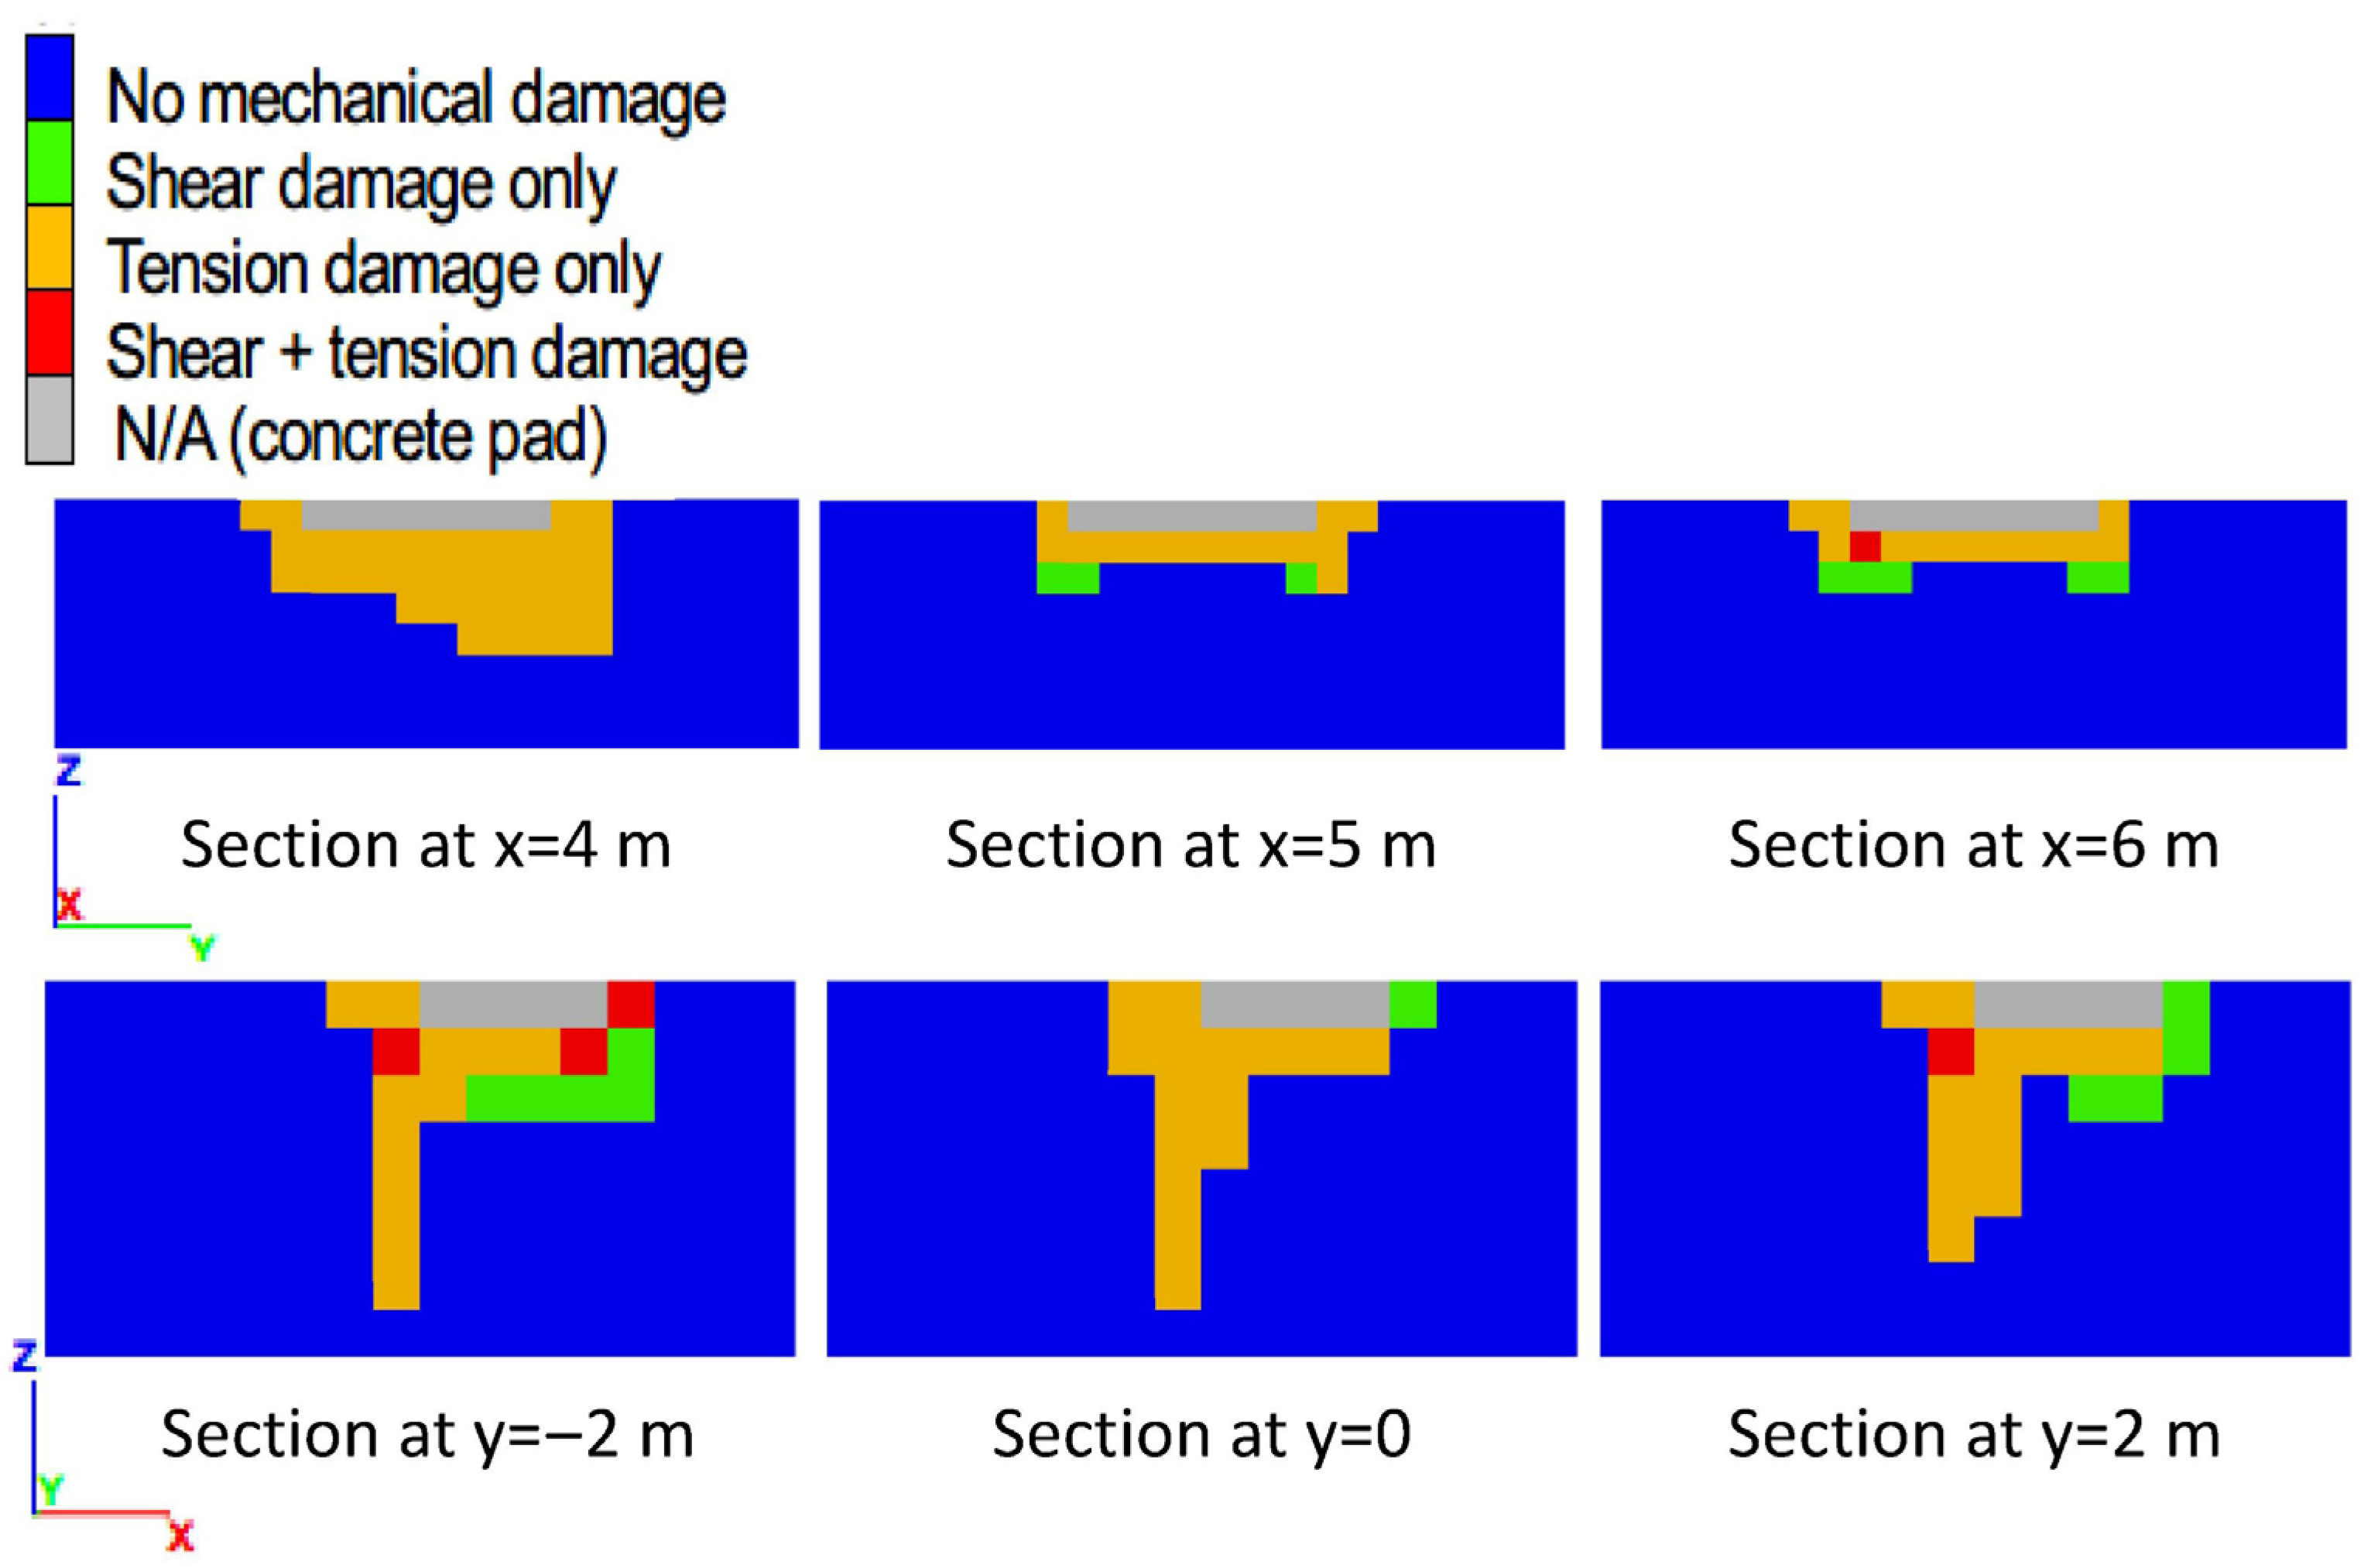
Mechanical damage of the subsurface materials at the state of peak bearing pressure is described using six vertical sections for each foundation model, three sections parallel to the slope crest [
sections X1…X1, X2…X2, and X3…X3 (
Figure 1a)], and three sections normal to the slope crest [
sections Y1…Y1, Y2…Y2, and Y3…Y3 (
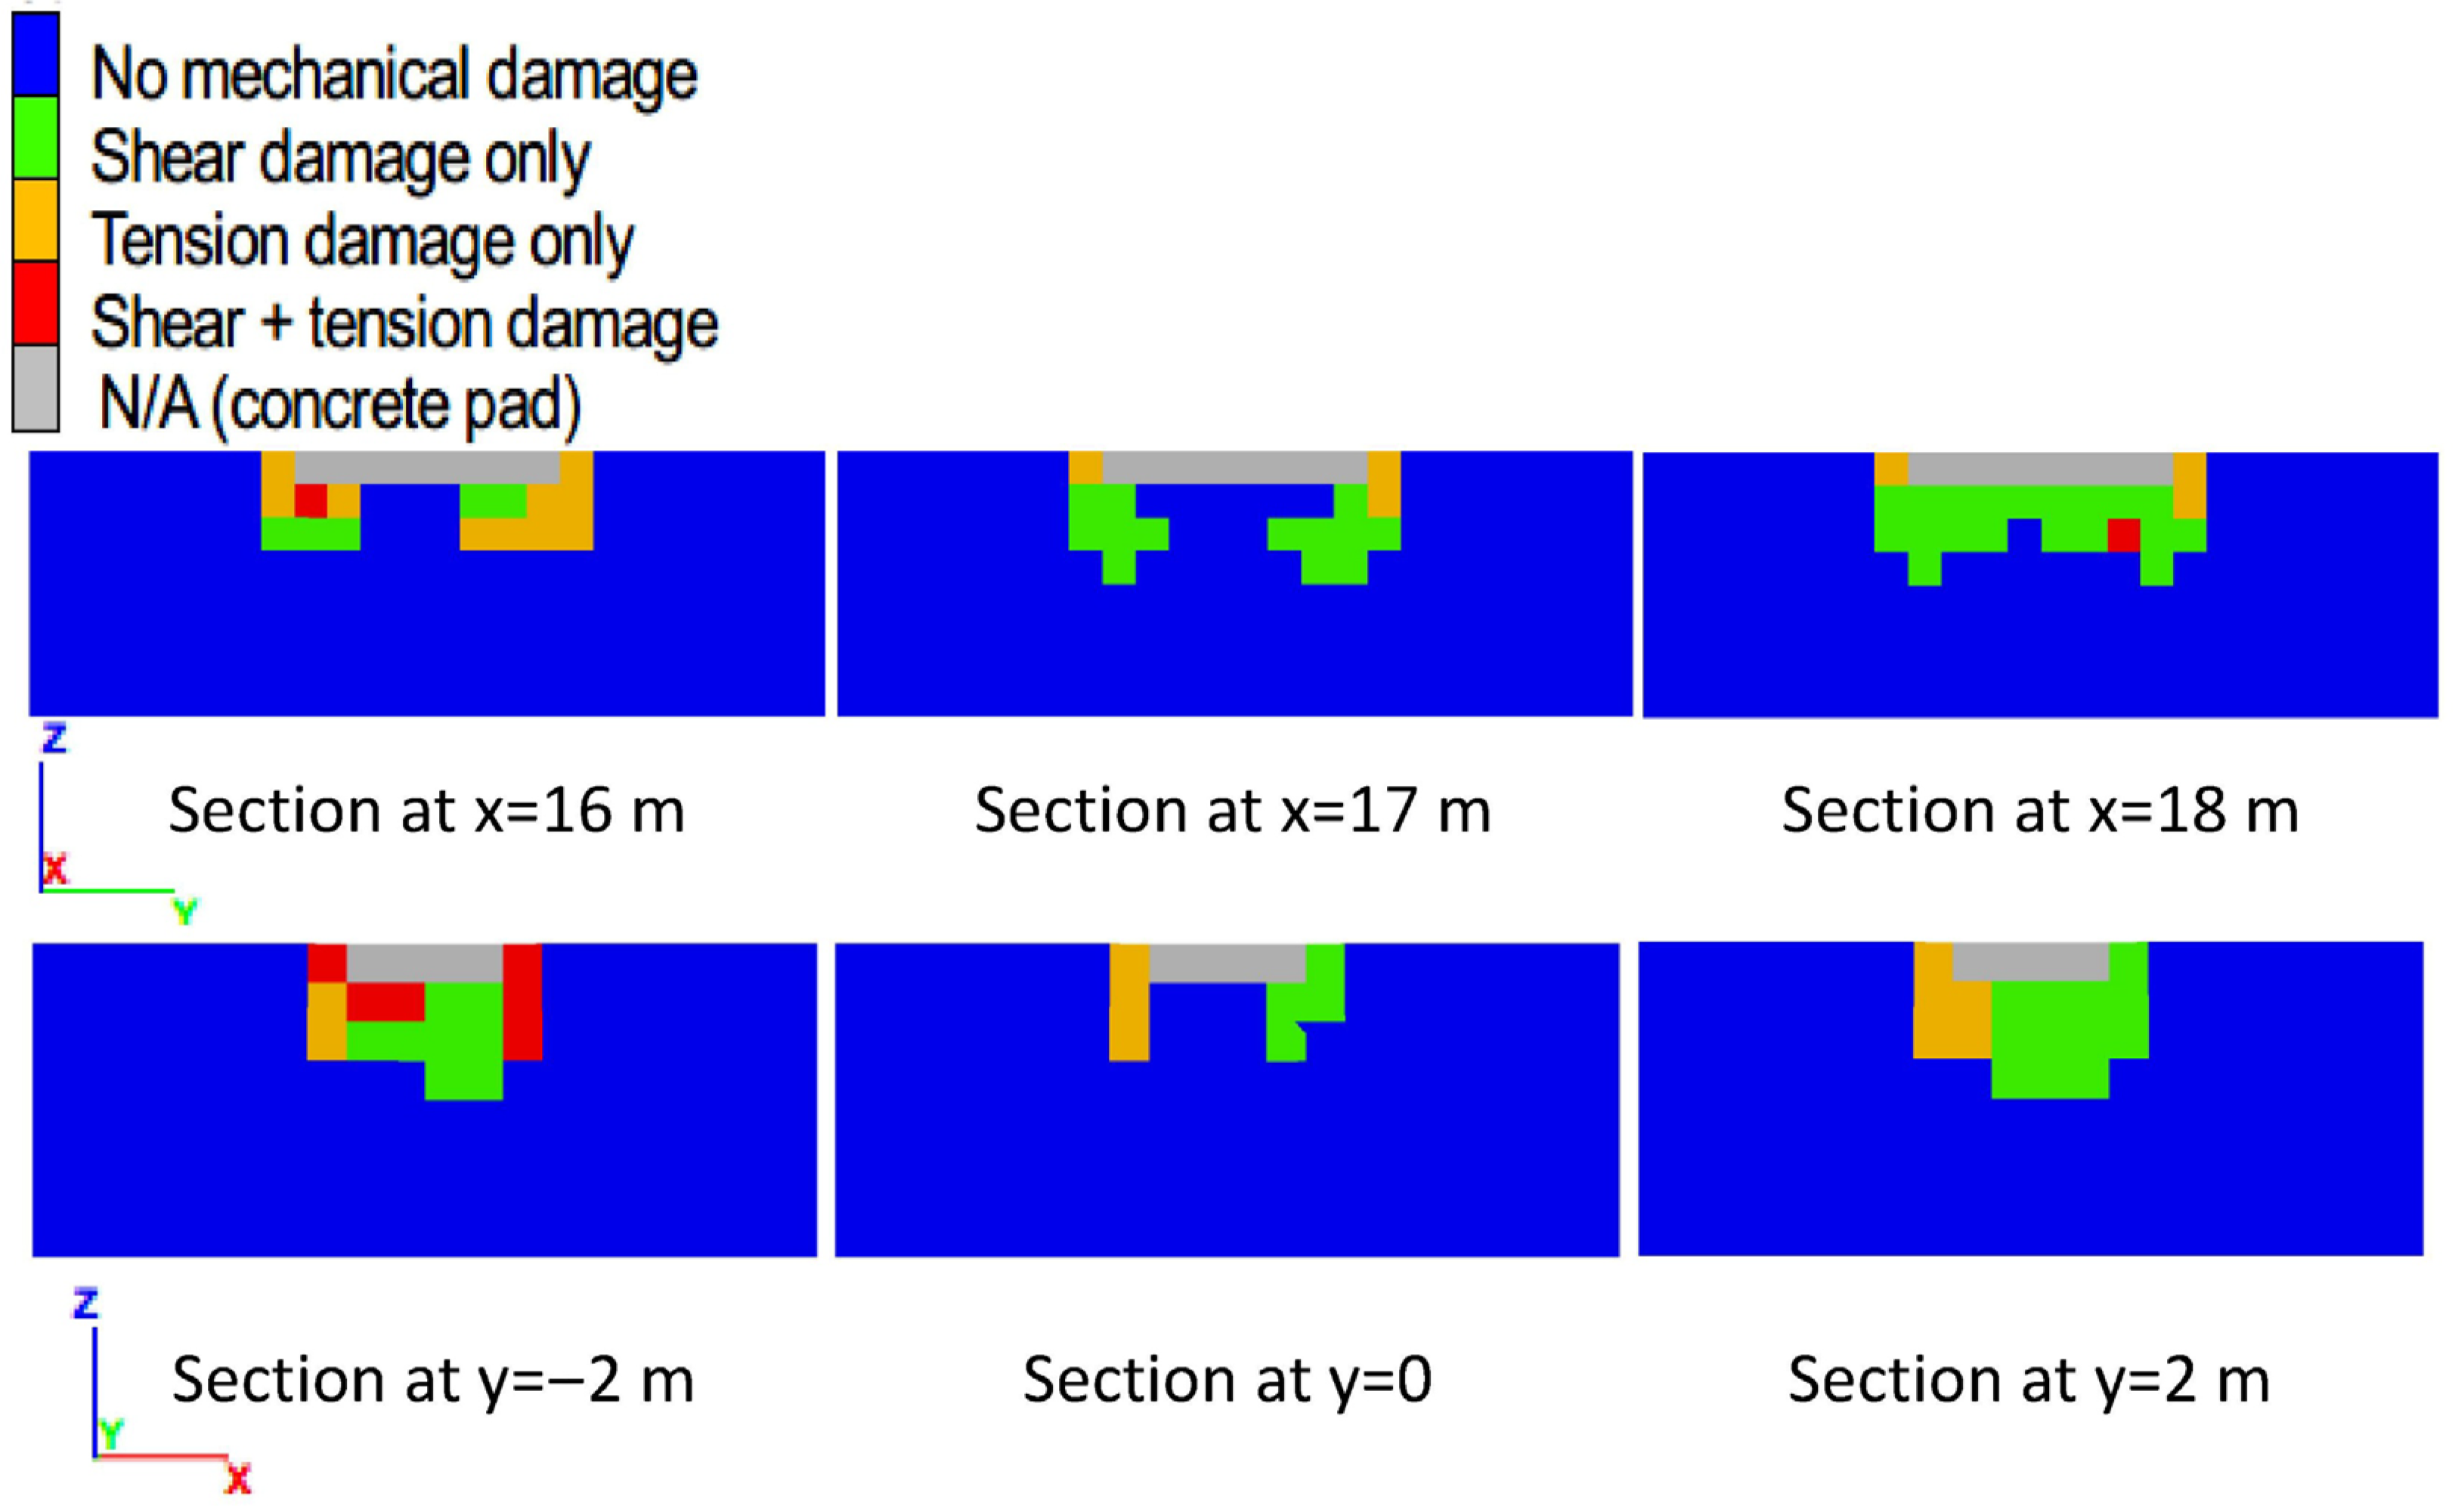
Figure 1a)]. The section plots are provided for models with a setback distance of 18 m (
Figure 8), 4 m (
Figure 9), and 8, 12, and 16 m (in
Appendix A;
Figure A1,
Figure A2 and
Figure A3, respectively). The
sections are parallel to the
-axis and consist of a section through the center of the concrete pad and two sections at the opposite edges. The
sections are parallel to the
-axis and consist of a section through the center of the concrete pad at
and two sections at the opposite edges. For scale, the concrete slab is 2 m long in the
sections and 4 m long in the
sections and has a thickness (
dimension) of 0.5 m.
The sections show soil with mechanical damage due to shear (green), tension (orange), hybrid shear and tension (red), or no damage (blue). As the plots show, tension damage is dominant for foundations with a setback of 12 m or smaller (
Figure 9,
Figure A1 and
Figure A2), whereas shear damage is dominant for foundations with a greater setback (
Figure 8 and
Figure A3). The maximum depth of shear damage is approximately 2 m (i.e., controlled by the foundation width), which is consistent with the analytical solution for bearing capacity (e.g., ref. [
1]: Figures 4-1 and 4-2). In contrast, the maximum depth of tension damage appears independent of the foundation dimensions and increases as the foundation setback decreases. For example,
Figure 9 shows tension damage to a maximum depth of 3–4 m for the foundation with a 4 m setback. In tension damage, the soil grains are pulled apart along steeply dipping failure surfaces parallel to the slope crest.
The spatial distribution of damage from models with a foundation setback of 18 m and 16 m (which are closest to conditions for foundations on level ground) show two aspects that are consistent with the analytical solution models (e.g., ref. [
1]: Figures 4-1 and 4-2). First, the maximum depth of shear damage is controlled by the foundation width, as discussed previously. Second, as the middle sections in
Figure 8 and
Figure A3 show, a plug of undamaged soil occurs under the concrete slab for these foundation models. The occurrence of such a plug is consistent with the analytical solution models. Such consistencies with the analytical solution contribute to verifying the validity of the FBCM analysis of foundations. Additional verification is presented in the following sections.
4. Materials and Methods: Verification of FBCM for Foundation Analysis: Shallow Foundation on Homogenous Soil Under Level Ground Surface
An isolated column footing on homogenous cohesive soil under a level ground surface presents conditions consistent with the analytical solution models, such that the bearing capacity calculated using the conventional approach can be compared with numerical model results to evaluate FBCM’s performance for such conditions. A textbook example of such a column footing, for soil with Mohr–Coulomb strength parameters of
and
kPa, obtained an ultimate bearing pressure of 600–660 kPa for a footing width B of 1.5–3 m (ref. [
1]: Example 4-1, Figure E4-1). The example was modeled for this paper using FBCM, with
m, a footing thickness of 0.5 m, and soil strength parameters as described.
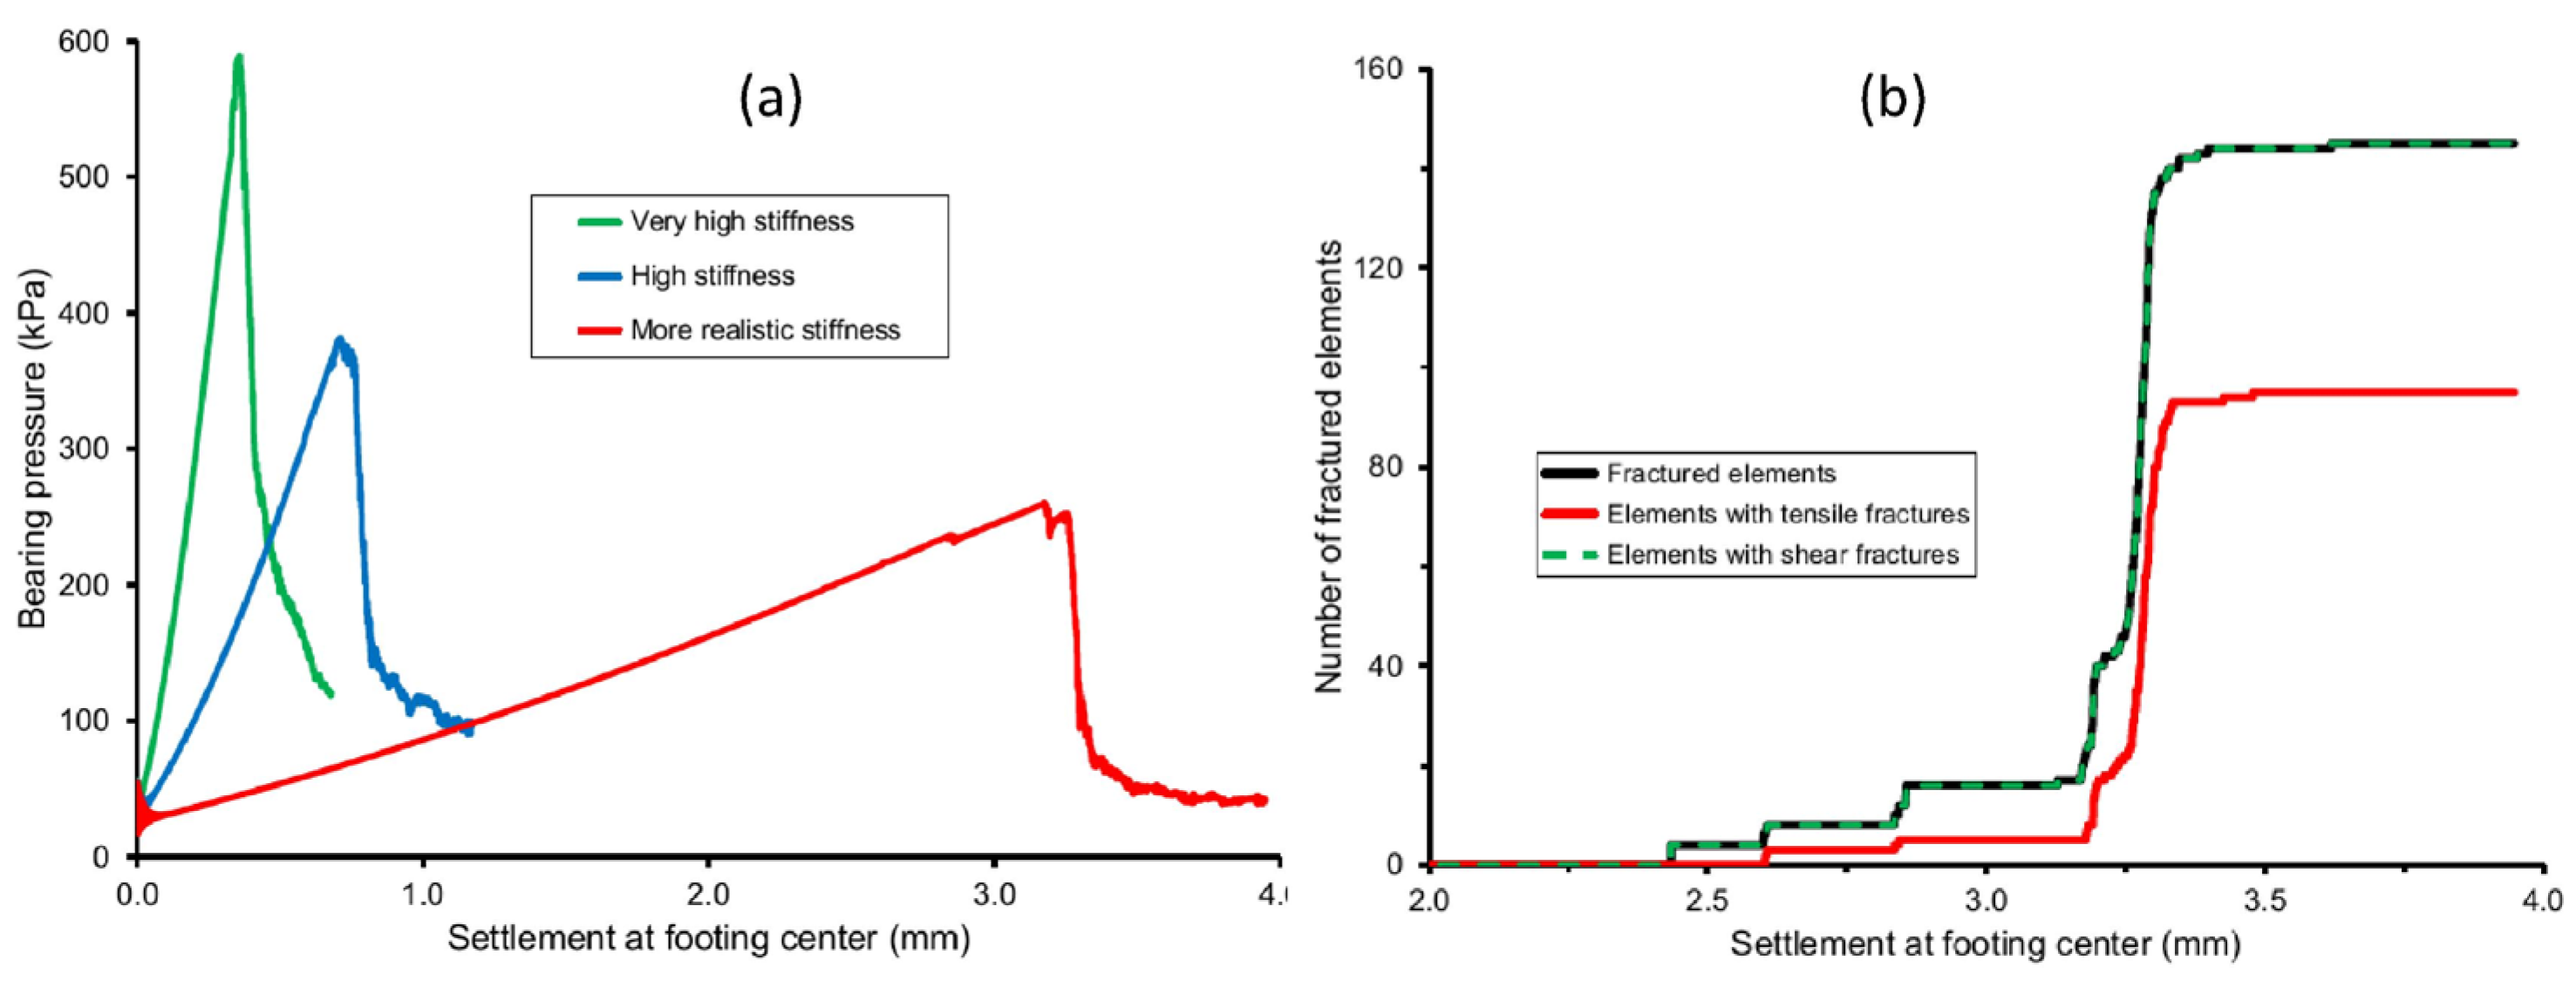
Soil stiffness parameters were not provided in the textbook example, which used standard bearing capacity analysis (based on an incompressible soil model). Three cases of soil stiffness were analyzed in the numerical model (
Table 4). The case described as “more realistic stiffness” was intended to represent the site-specific soil stiffness and used laboratory test data for a bentonite–sand mixture [
27]. The case described as “very high stiffness” was modified from the “more realistic stiffness” case to simulate essentially incompressible soil such as that used in the analytical solution for bearing capacity. The case described as “high stiffness” was used to verify that a soil of intermediate stiffness would result in intermediate behavior.
The model domain for the column footing analysis consists of a rectangular block of (m), with the smaller dimension being vertical and representing the depth of soil below the foundation level. The column footing was modeled as a concrete pad with dimensions of (m), flush with the top surface of the model and centered laterally. The boundary conditions were zero normal velocity at the base and exterior vertical boundaries. The initial stress consists of vertical stress based on a soil unit weight of 17.3 kN/m3, a lateral-to-vertical stress ratio of 0.54, and a surcharge of 21 kPa at the top surface of the model to represent the foundation depth of 1.2 m. Foundation loading was increased progressively by applying a small downward velocity at the top surface of the concrete pad.
Results and Discussion: Verification of FBCM for Foundation Analysis: Shallow Foundation on Homogenous Soil Under a Level Ground Surface
The model results (
Figure 10) show that the model with “very high stiffness” gave an ultimate bearing pressure of approximately 600 kPa, which matches the textbook solution. The calculation for the “very high stiffness” case was not intended to provide settlement because the soil is modeled as essentially incompressible to simulate the condition used in the analytical solution. The base-case model (i.e., “more realistic stiffness”) provides the bearing capacity directly using the damage-based definition of bearing capacity. The threshold settlement for mechanical damage was determined as 2.44 mm (
Figure 10b), which provides a bearing capacity of 200 kPa, consistent with the textbook solution for a safety factor of 3.0. Therefore, the FBCM analysis matches the analytical solution from the textbook example of a column footing on homogenous soil under a level ground surface.
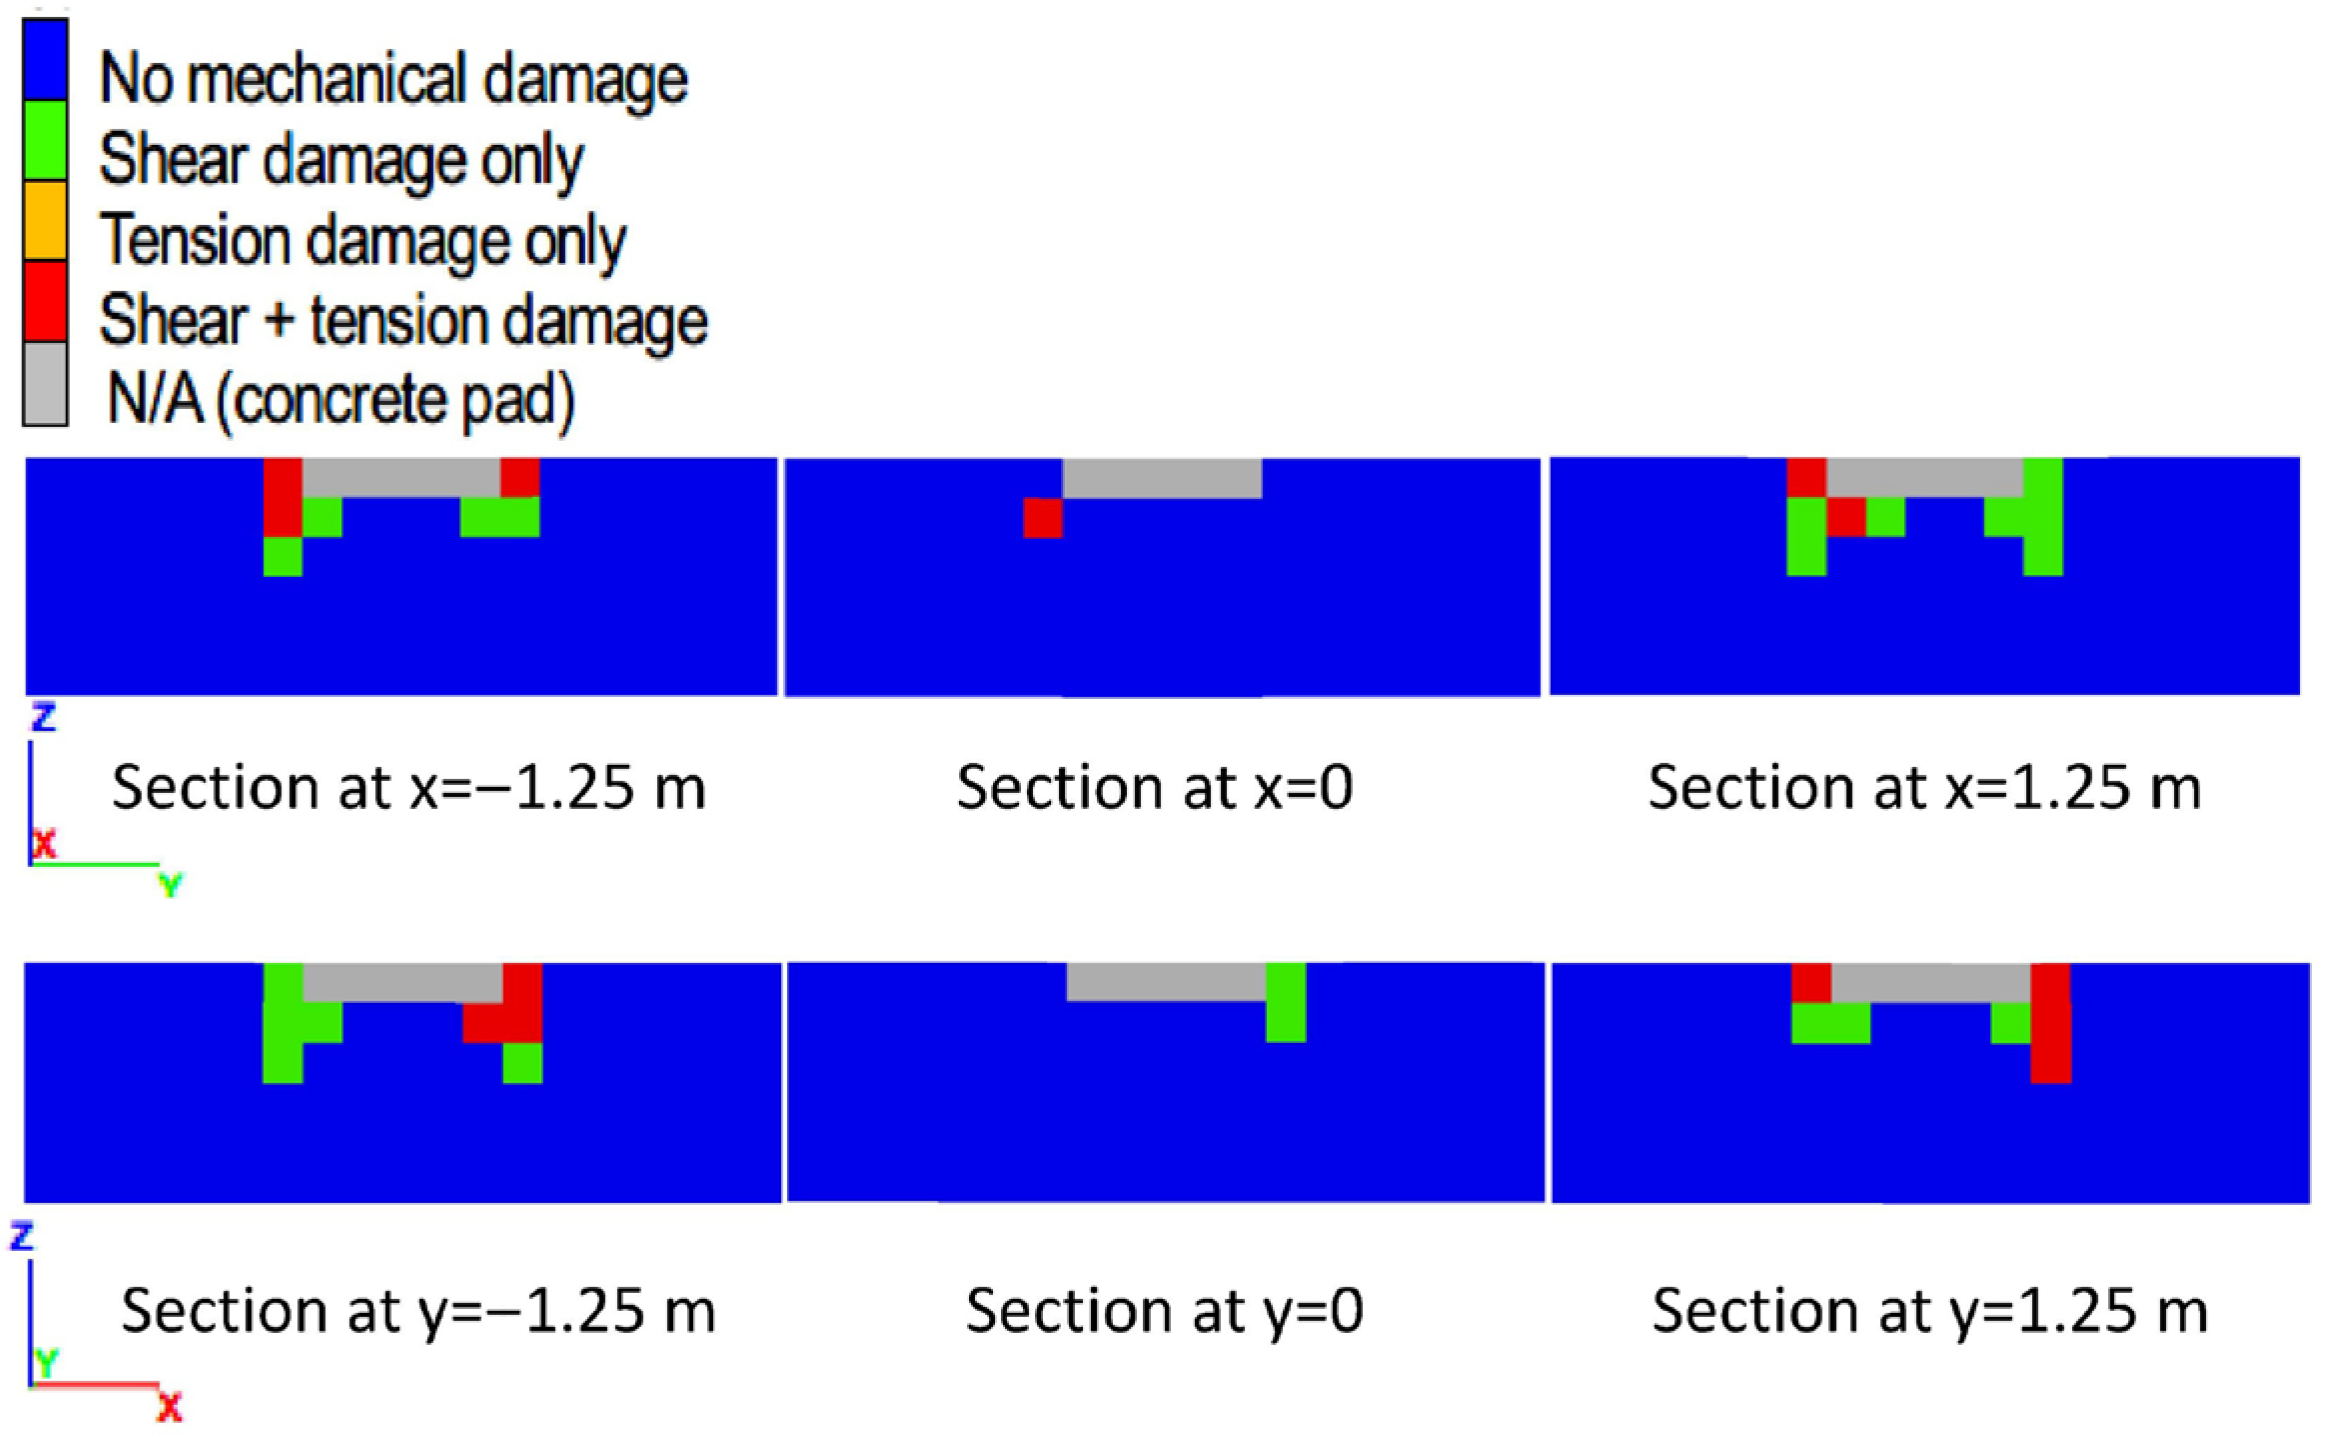
For this example of a shallow footing on homogenous soil under a level ground surface, the spatial distribution of damage at the state of peak bearing pressure (
Figure 11) indicates that every soil element that sustained mechanical damage was damaged in shear or hybrid shear and tension. Independent tension damage did not occur. Tension damage occurred only as an adjunct damage mechanism, to aid the separation of failure masses demarcated in shear. For this reason, the number of fractured elements is equal to the number of elements with shear fractures and not affected by the number of elements with tensile fractures (
Figure 10b).
Therefore, for the specific condition of a shallow footing on homogenous soil under a level ground surface, shear failure is the driving mechanism for foundation failure. An FBCM analysis of the specific condition should and does provide the same results as a calculation based on the analytical solution, such as the textbook example.
5. Materials and Methods: Verification of FBCM for Foundation Analysis: Single Pile in Multilayer Soil
An example of a single pile in multilayer soil was analyzed to compare with a textbook example for a pile foundation (ref. [
1]: Example 16-7). The soil consists of six layers: five sand layers and an underlying relatively stiff clay layer. The soil strength properties were taken from the textbook example, whereas the stiffness properties were estimated from the literature (
Table 5). The ultimate loads for the pile foundation based on field load tests are in the range of 979–1054 kN (220–237 kips), based on reference [
1] (Example 16-7).
The model geometry for the analysis of the single-pile foundation consists of a rectangular block (m) laterally and 22.8 m vertically. The pile is centered laterally, extends 15.24 m (50 ft) vertically from the top of the model, and has a square H cross-section [ (m)] with soil-to-soil contact with the surrounding soil on the web surfaces and soil-to-steel contact on the flange surfaces. The boundary conditions consisted of zero normal velocity at the model base and exterior vertical surfaces and zero normal stress at the model top, except the pile top. Pile loading was displacement-controlled and consisted of a steady downward velocity at the top of the pile. The monitored conditions consisted of the vertical pressure and displacement at the pile top and soil fracturing everywhere.
Results and Discussion: Verification of FBCM for Foundation Analysis: Single Pile in Multilayer Soil
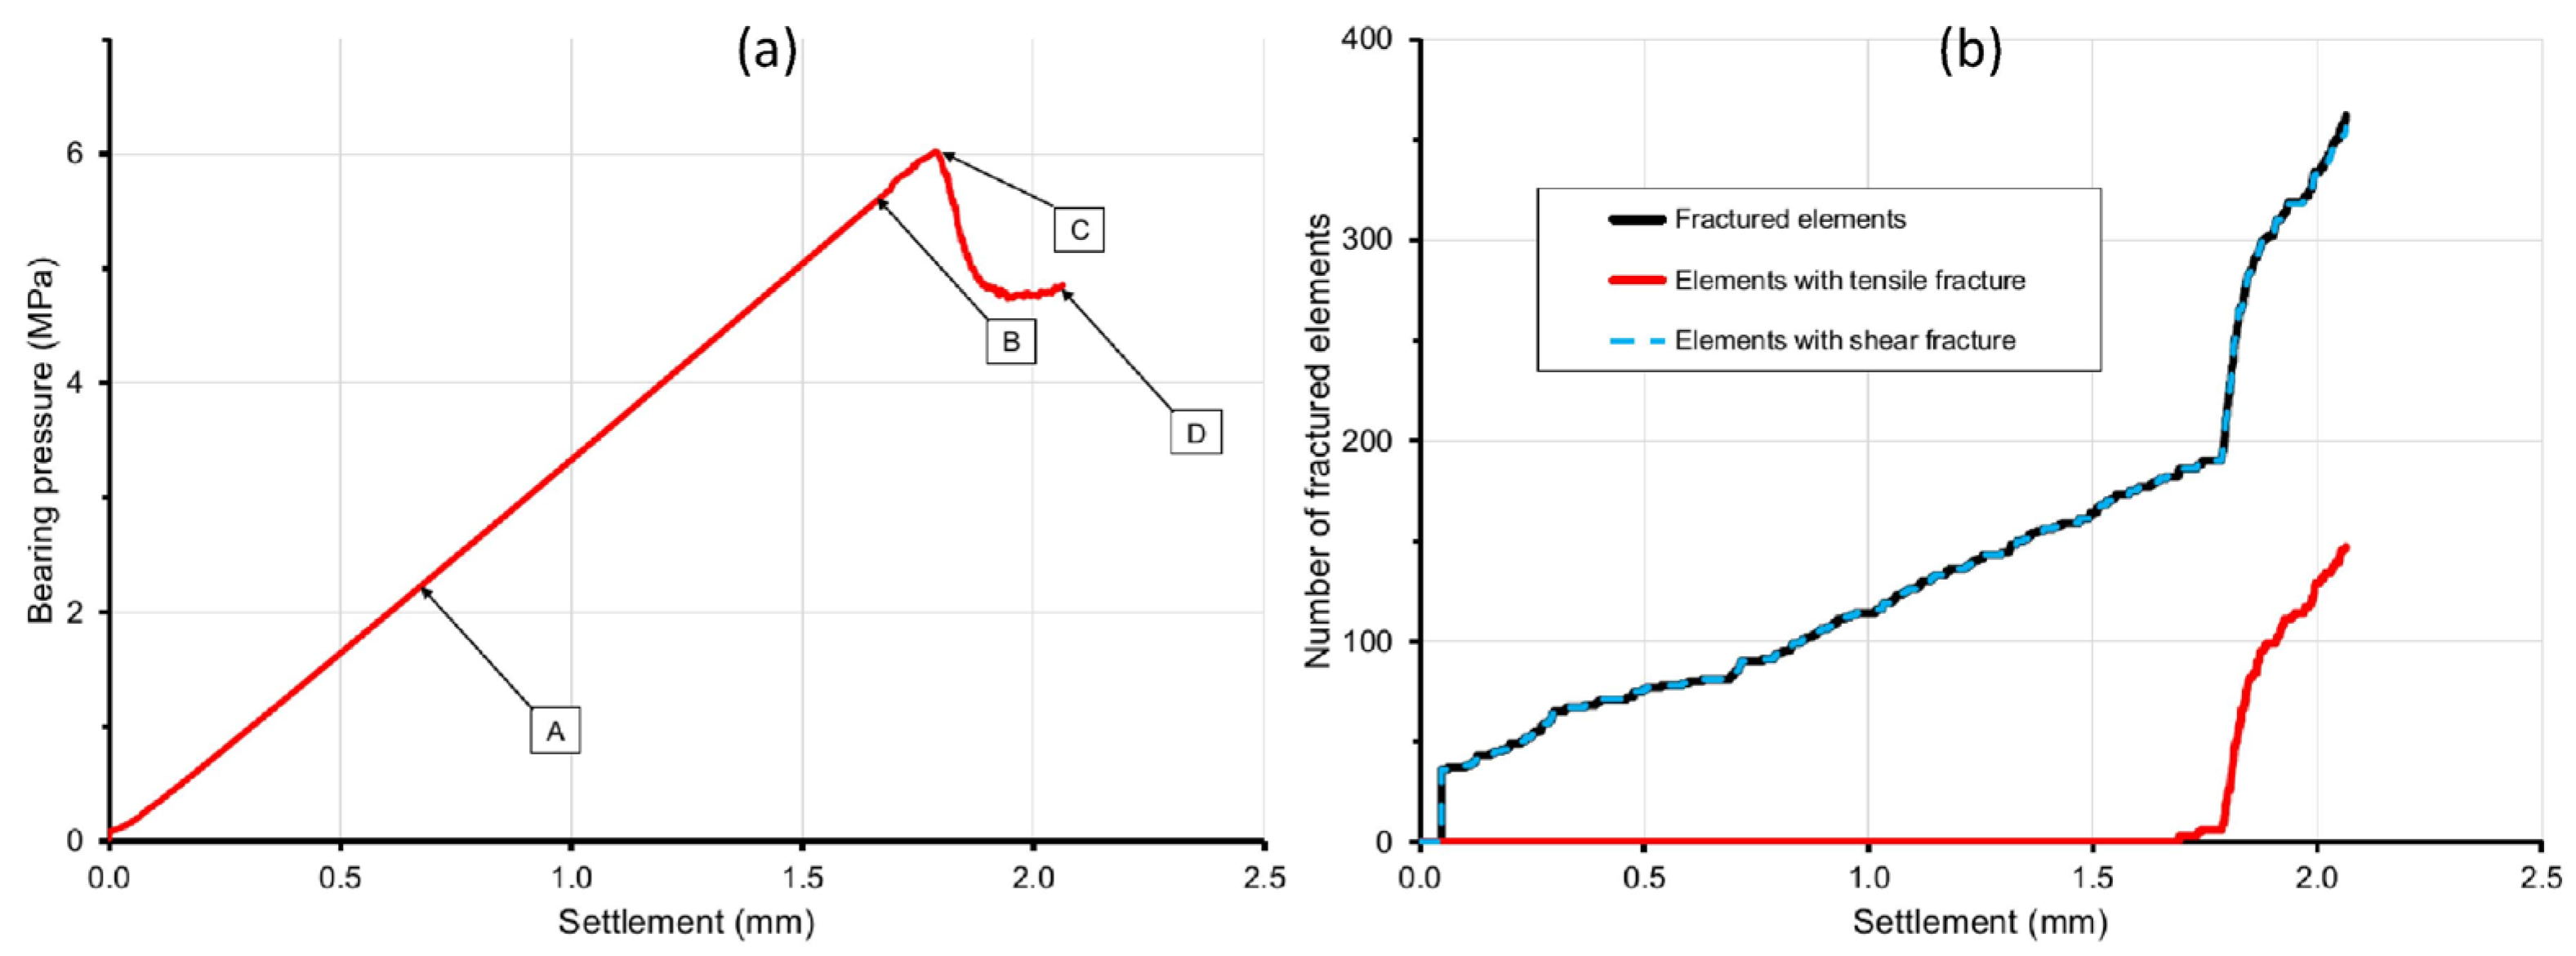
The model results show an ultimate bearing pressure of 6 MPa (
Figure 12a), equivalent to an ultimate pile load capacity of 962 kN, which compares well with the values of 979–1054 kN based on field measurements. The damage characterization plots (
Figure 12b) indicate that every element that sustained mechanical damage was damaged in shear or hybrid shear and tension. Tension damage started near the ultimate state (at a pile settlement of 1.7 mm or greater) and occurred primarily as an adjunct damage mechanism to aid the separation of failure masses demarcated in shear around the pile skin. For this reason, the number of fractured elements is equal to the number of elements with shear fractures (
Figure 12b).
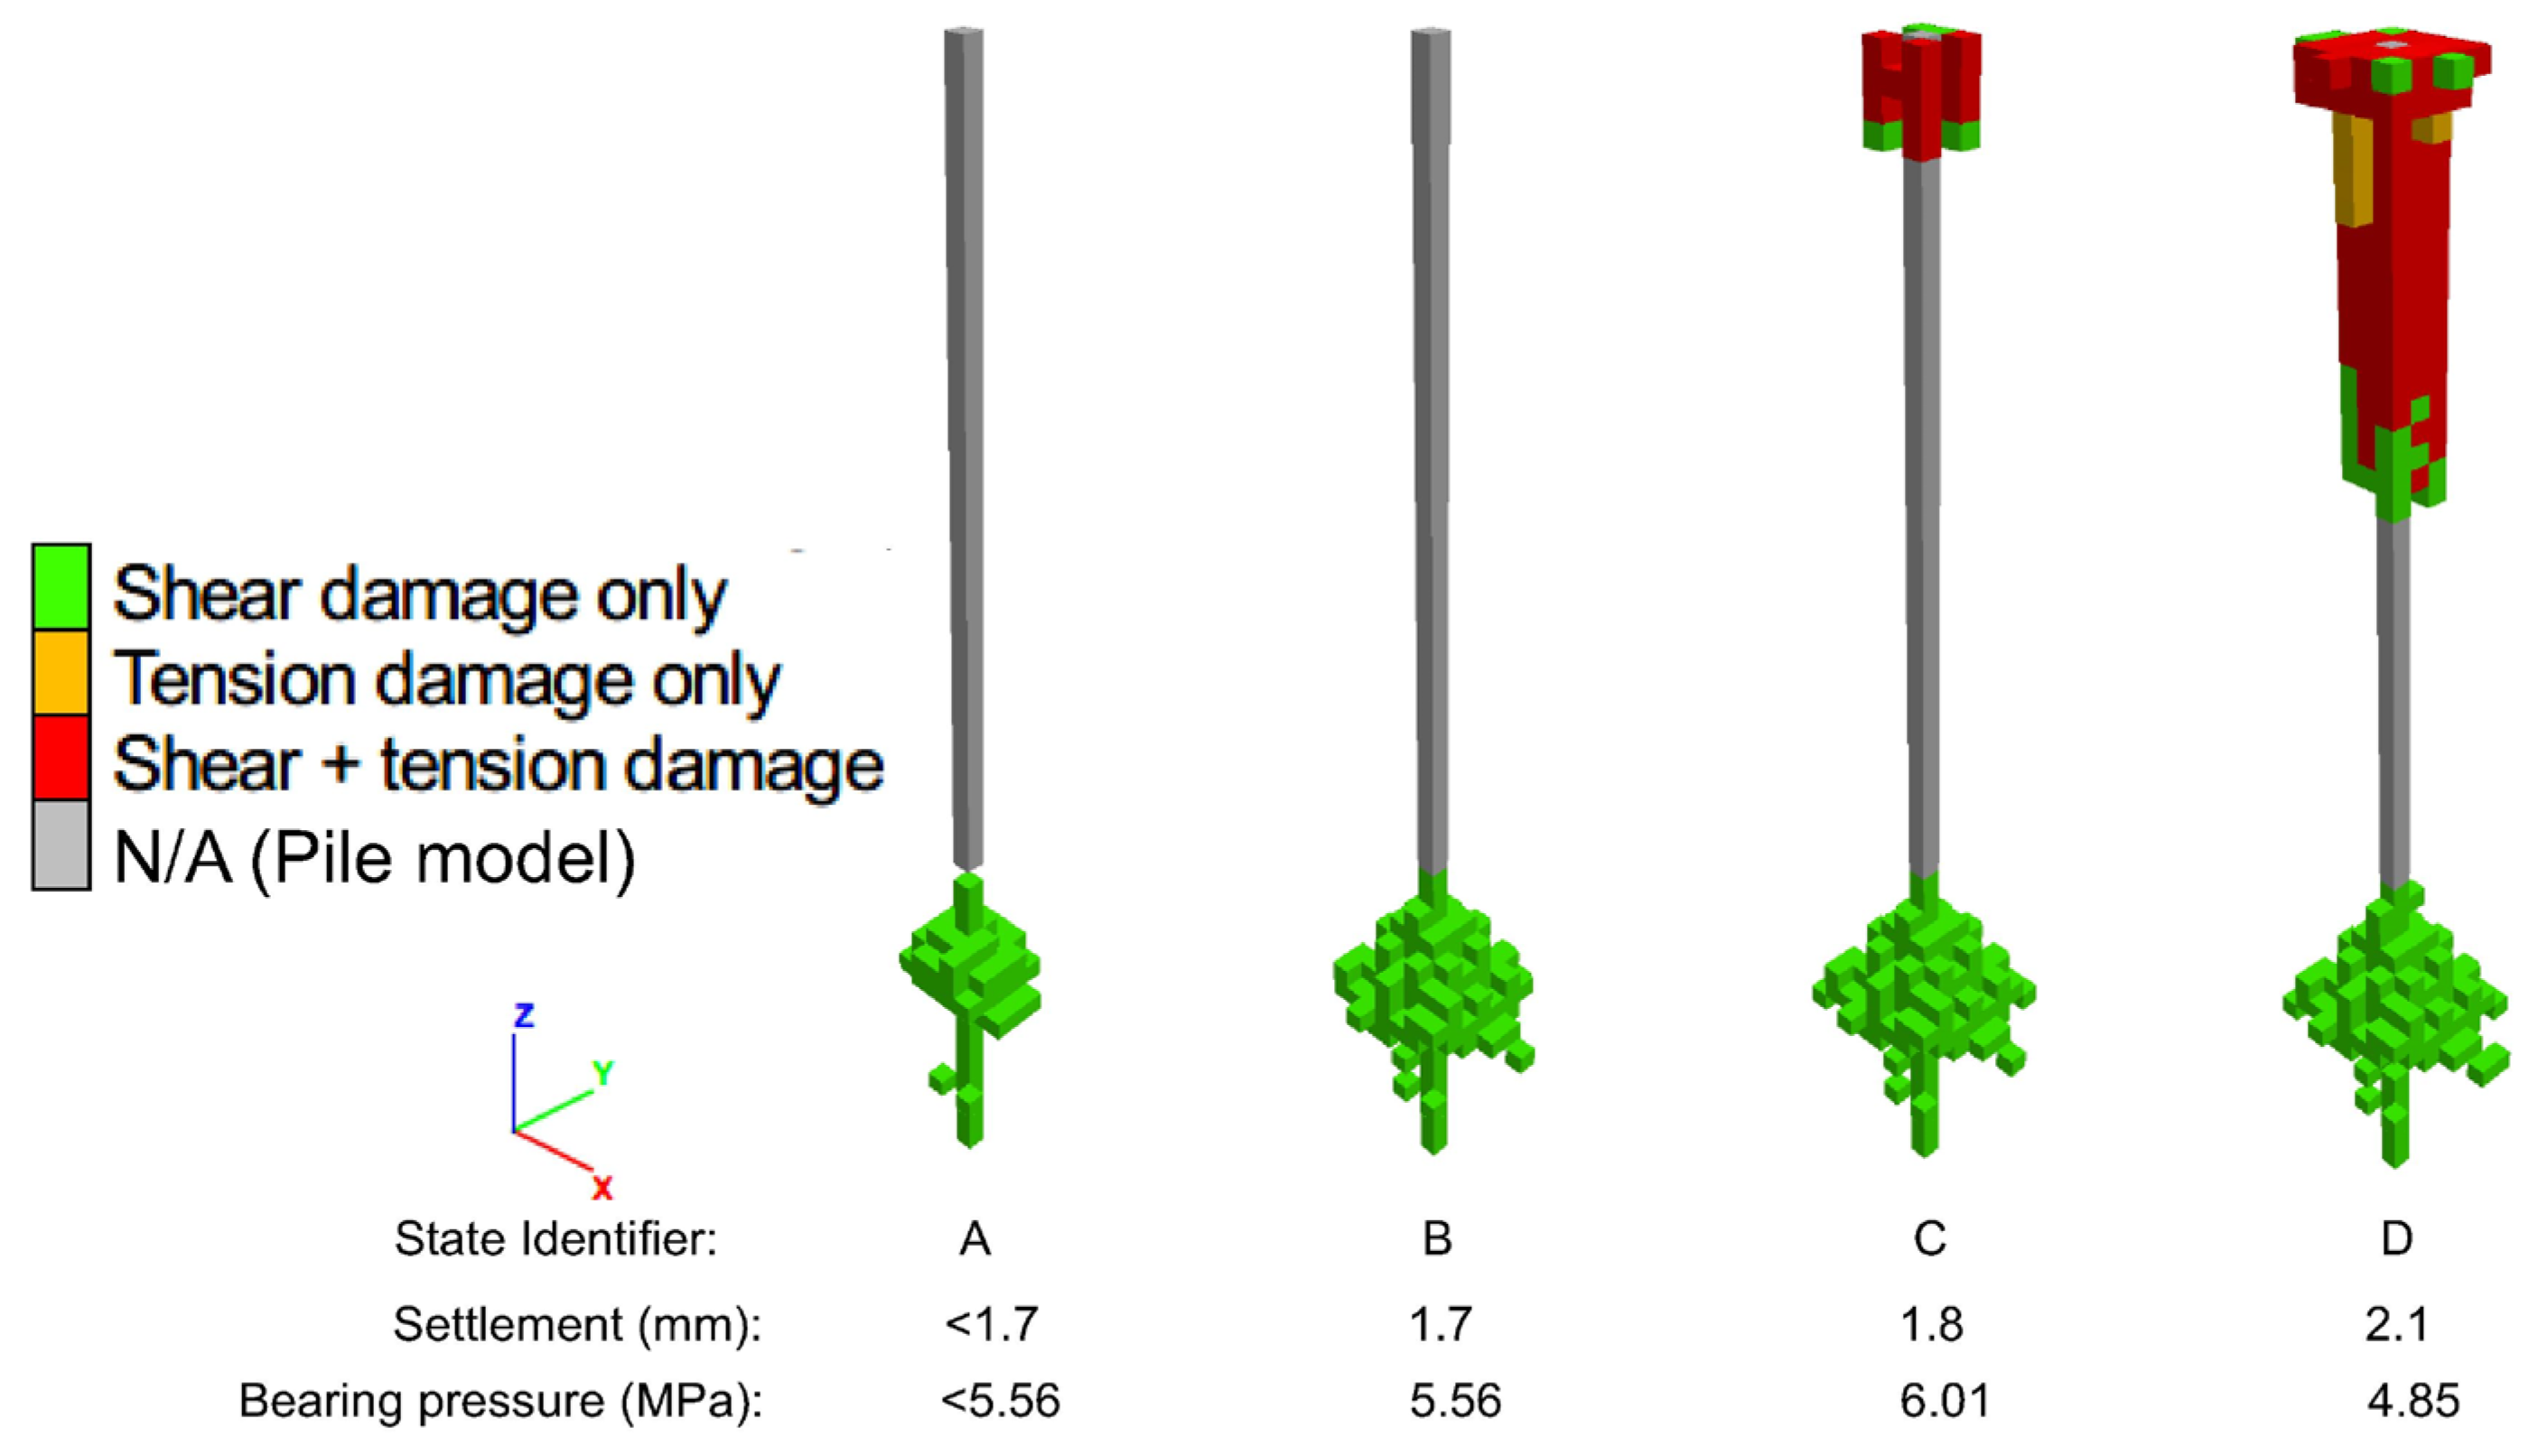
The spatial distribution of damage (
Figure 13) shows that mechanical damage of the soil occurred in two separate zones. First, shear fractures developed in a bulbous zone below the base of the pile as the pile was loaded to a bearing pressure of approximately 5.6 MPa (pile load of approximately 896 kN), represented by point B in
Figure 12a. During the loading up to point B, the pile formed an elastic unit with the surrounding soil to transmit load to the bulbous zone (also referred to as the bearing bulb). Stable shear fracturing occurred in the bearing bulb as the pile load increased to point B.
Second, a zone of shear and tension damage developed around the pile skin near the top of the pile. The pile behavior during this loading phase is represented by the transition through points B and C (
Figure 12a), when the bearing bulb could not support additional load and a segment of the pile skin provided skin friction support until the surrounding soil failed in hybrid shear and tension (
Figure 13). The bearing pressure increased during this loading phase to approximately 6.0 MPa (pile load of approximately 962 kN), represented by point C in
Figure 12a. Additional mechanical damage of the soil around the pile skin (shear, tension, and hybrid shear and tension) occurred between points C and D (
Figure 13), representing the post-failure behavior, which is irrelevant to the pile load capacity.
Notice that the contribution of the bearing bulb to the pile load capacity cannot be evaluated using limit equilibrium analysis because the geometry of the bearing bulb is not known a priori. Also, the skin friction contribution to the pile load capacity between points B and C cannot be evaluated using limit equilibrium analysis because the length and position of the pile skin section are not known a priori. This analysis verifies FBCM analysis of a pile foundation and provides an understanding of the source of pile resistance to loading for the case of a pile in cohesionless soil and underlying cohesive soil. Pile resistance arises primarily from base support in the cohesive soil.
6. Conclusions
This paper assesses the effects of induced tensile stress on foundation behavior for a shallow foundation atop a slope, where the setback from the slope crest is varied to generate several foundation designs. Each design was subjected to full-scale load testing to assess the effects of setback. The analysis used numerical simulations using fracture-based continuum modeling (FBCM) and leads to the following observations.
First, the bearing capacity of a shallow foundation atop a slope decreases as the foundation setback from the slope crest decreases. Foundations at a large setback have the greatest bearing capacity, because such foundations are essentially outside the influence zone of the slope. In contrast, foundations at a small setback have smaller bearing capacity that decreases as the setback decreases.
Second, both shear and tensile damage mechanisms contribute to potential mechanical damage of the subsurface materials and, therefore, potential foundation failure. For shallow foundations atop a slope, shear and tension participation in damage varies with the foundation setback. Shear mechanisms dominate for foundations at a large setback, whereas tensile mechanisms dominate for foundations at a small setback. However, the two mechanisms occur for practical values of foundation setback, such that both mechanisms need to be evaluated in foundation analysis. A foundation analysis that does not account for both tension and shear damage mechanisms will likely provide misleading predictions of the ultimate bearing pressure for foundations on sloping ground or other subsurface conditions that include internal and external surfaces inclined to the foundation loading. Such conditions do not conform to the assumption of shear-dominant failure and could occur for foundations on sloping ground or subsurface materials with complex geometry.
Third, when the foundation setback is large enough that the mechanical effects of the slope are negligible, FBCM foundation analysis produces results that are consistent with the conventional foundation analysis. In the FBCM results for a shallow footing at a large setback, foundation failure is driven by shear, the maximum depth of shear damage is approximately two times the foundation width, and an undamaged soil plug occurs immediately below the footing, all of which are consistent with the analytical model used for bearing capacity analysis in current practice.
FBCM is an innovative technique for modeling the mechanical behavior of geologic media based on modeling potential mechanical damage in terms of the initiation and propagation of discrete shear and tensile failure surfaces (fractures). For foundation analysis, FBCM provides a damage characterization of the subsurface materials and uses the information to determine the threshold settlement for damage occurrence. The threshold settlement is applied in the bearing pressure versus settlement relationship to evaluate a damage-based bearing capacity, defined and evaluated as the greatest bearing pressure too small to cause mechanical damage of the subsurface materials.
This analysis of foundations provided in the paper shows an approach for evaluating the bearing capacity of foundations through full-scale load testing of the foundation design by numerical simulations using FBCM. The load test provides bearing pressure versus settlement and soil damage versus settlement, which can be combined to determine the damage-based bearing capacity or conventional bearing capacity.
Additionally, this paper provides calculations to verify FBCM’ foundation analysis, using two textbook analytical examples: one for a shallow footing on homogenous cohesive soil under a level ground surface and the other for a single pile in multilayered soil. The FBCM results match the analytical solution in both cases. For the shallow footing case, the analytical solution is based on an incompressible soil model. Therefore, a soil stiffness great enough to simulate incompressible soil was used in the FBCM analysis. For the pile foundation, FBCM analysis provides insight regarding the source of pile resistance. For the analyzed soil profile, the results show that base resistance arises from a “load-bearing bulb” below the pile, whereas skin resistance is mobilized only in a pile skin section shorter than the entire pile skin length. Limit-equilibrium evaluation of the base resistance, as used in current practice, could be misleading because the geometry of the bearing bulb is not known a priori. Similarly, limit-equilibrium evaluation of the skin resistance could be misleading because the length and position of the pile skin section over which resistance is mobilized are not known a priori.
Overall, this paper makes a case that tensile stress induced by foundation loading needs to be considered in geotechnical analysis for foundations that apply high loading and are sited on sloping ground, subsurface materials with complex geometry, or other conditions that do not conform to the assumption of shear-dominant failure. Also, the paper shows that FBCM is well-suited for full-scale load testing of a foundation design to determine the bearing capacity of the foundation, irrespective of the complexity of the subsurface geology and ground surface morphology. FBCM foundation analysis provides a significant technological leap over the conventional approach that was developed for shallow foundations in homogenous soil under a level ground surface, where shear damage can be assumed to be the only mechanism for foundation failure. In contrast, FBCM accounts for shear, tension, and hybrid shear–tension damage mechanisms.
Author Contributions
Conceptualization, G.I.O. and B.D.; methodology, G.I.O., K.J.S. and B.D.; software, G.I.O.; validation, G.I.O.; formal analysis, G.I.O. and K.J.S.; investigation, G.I.O.; resources, G.I.O. and B.D.; data curation, G.I.O. and K.J.S.; writing—original draft preparation, G.I.O.; writing—review and editing, G.I.O., K.J.S. and B.D.; visualization, G.I.O.; supervision, G.I.O.; project administration, G.I.O. and B.D.; funding acquisition, Not applicable. All authors have read and agreed to the published version of the manuscript.
Funding
This research received no external funding.
Data Availability Statement
The original contributions presented in this study are included in the article. Further inquiries can be directed to the corresponding author.
Acknowledgments
The authors thank W. VanVeen of Ontario, Canada, for his review of the manuscript.
Conflicts of Interest
Author Goodluck I. Ofoegbu was employed by the company GNO Modeling Research LLC of San Antonio, TX, USA. Authors Kevin J. Smart and Biswajit Dasgupta were employed by the company Southwest Research Institute of San Antonio, TX, USA. The authors declare that the research was conducted in the absence of any commercial or financial relationships that could be construed as a potential conflict of interest.
Abbreviations
The following abbreviation is used in this manuscript:
| FBCM | Fracture-Based Continuum Modeling |
Appendix A. Additional Information Regarding Spatial Distribution of Damage
This appendix provides three additional figures (
Figure A1,
Figure A2 and
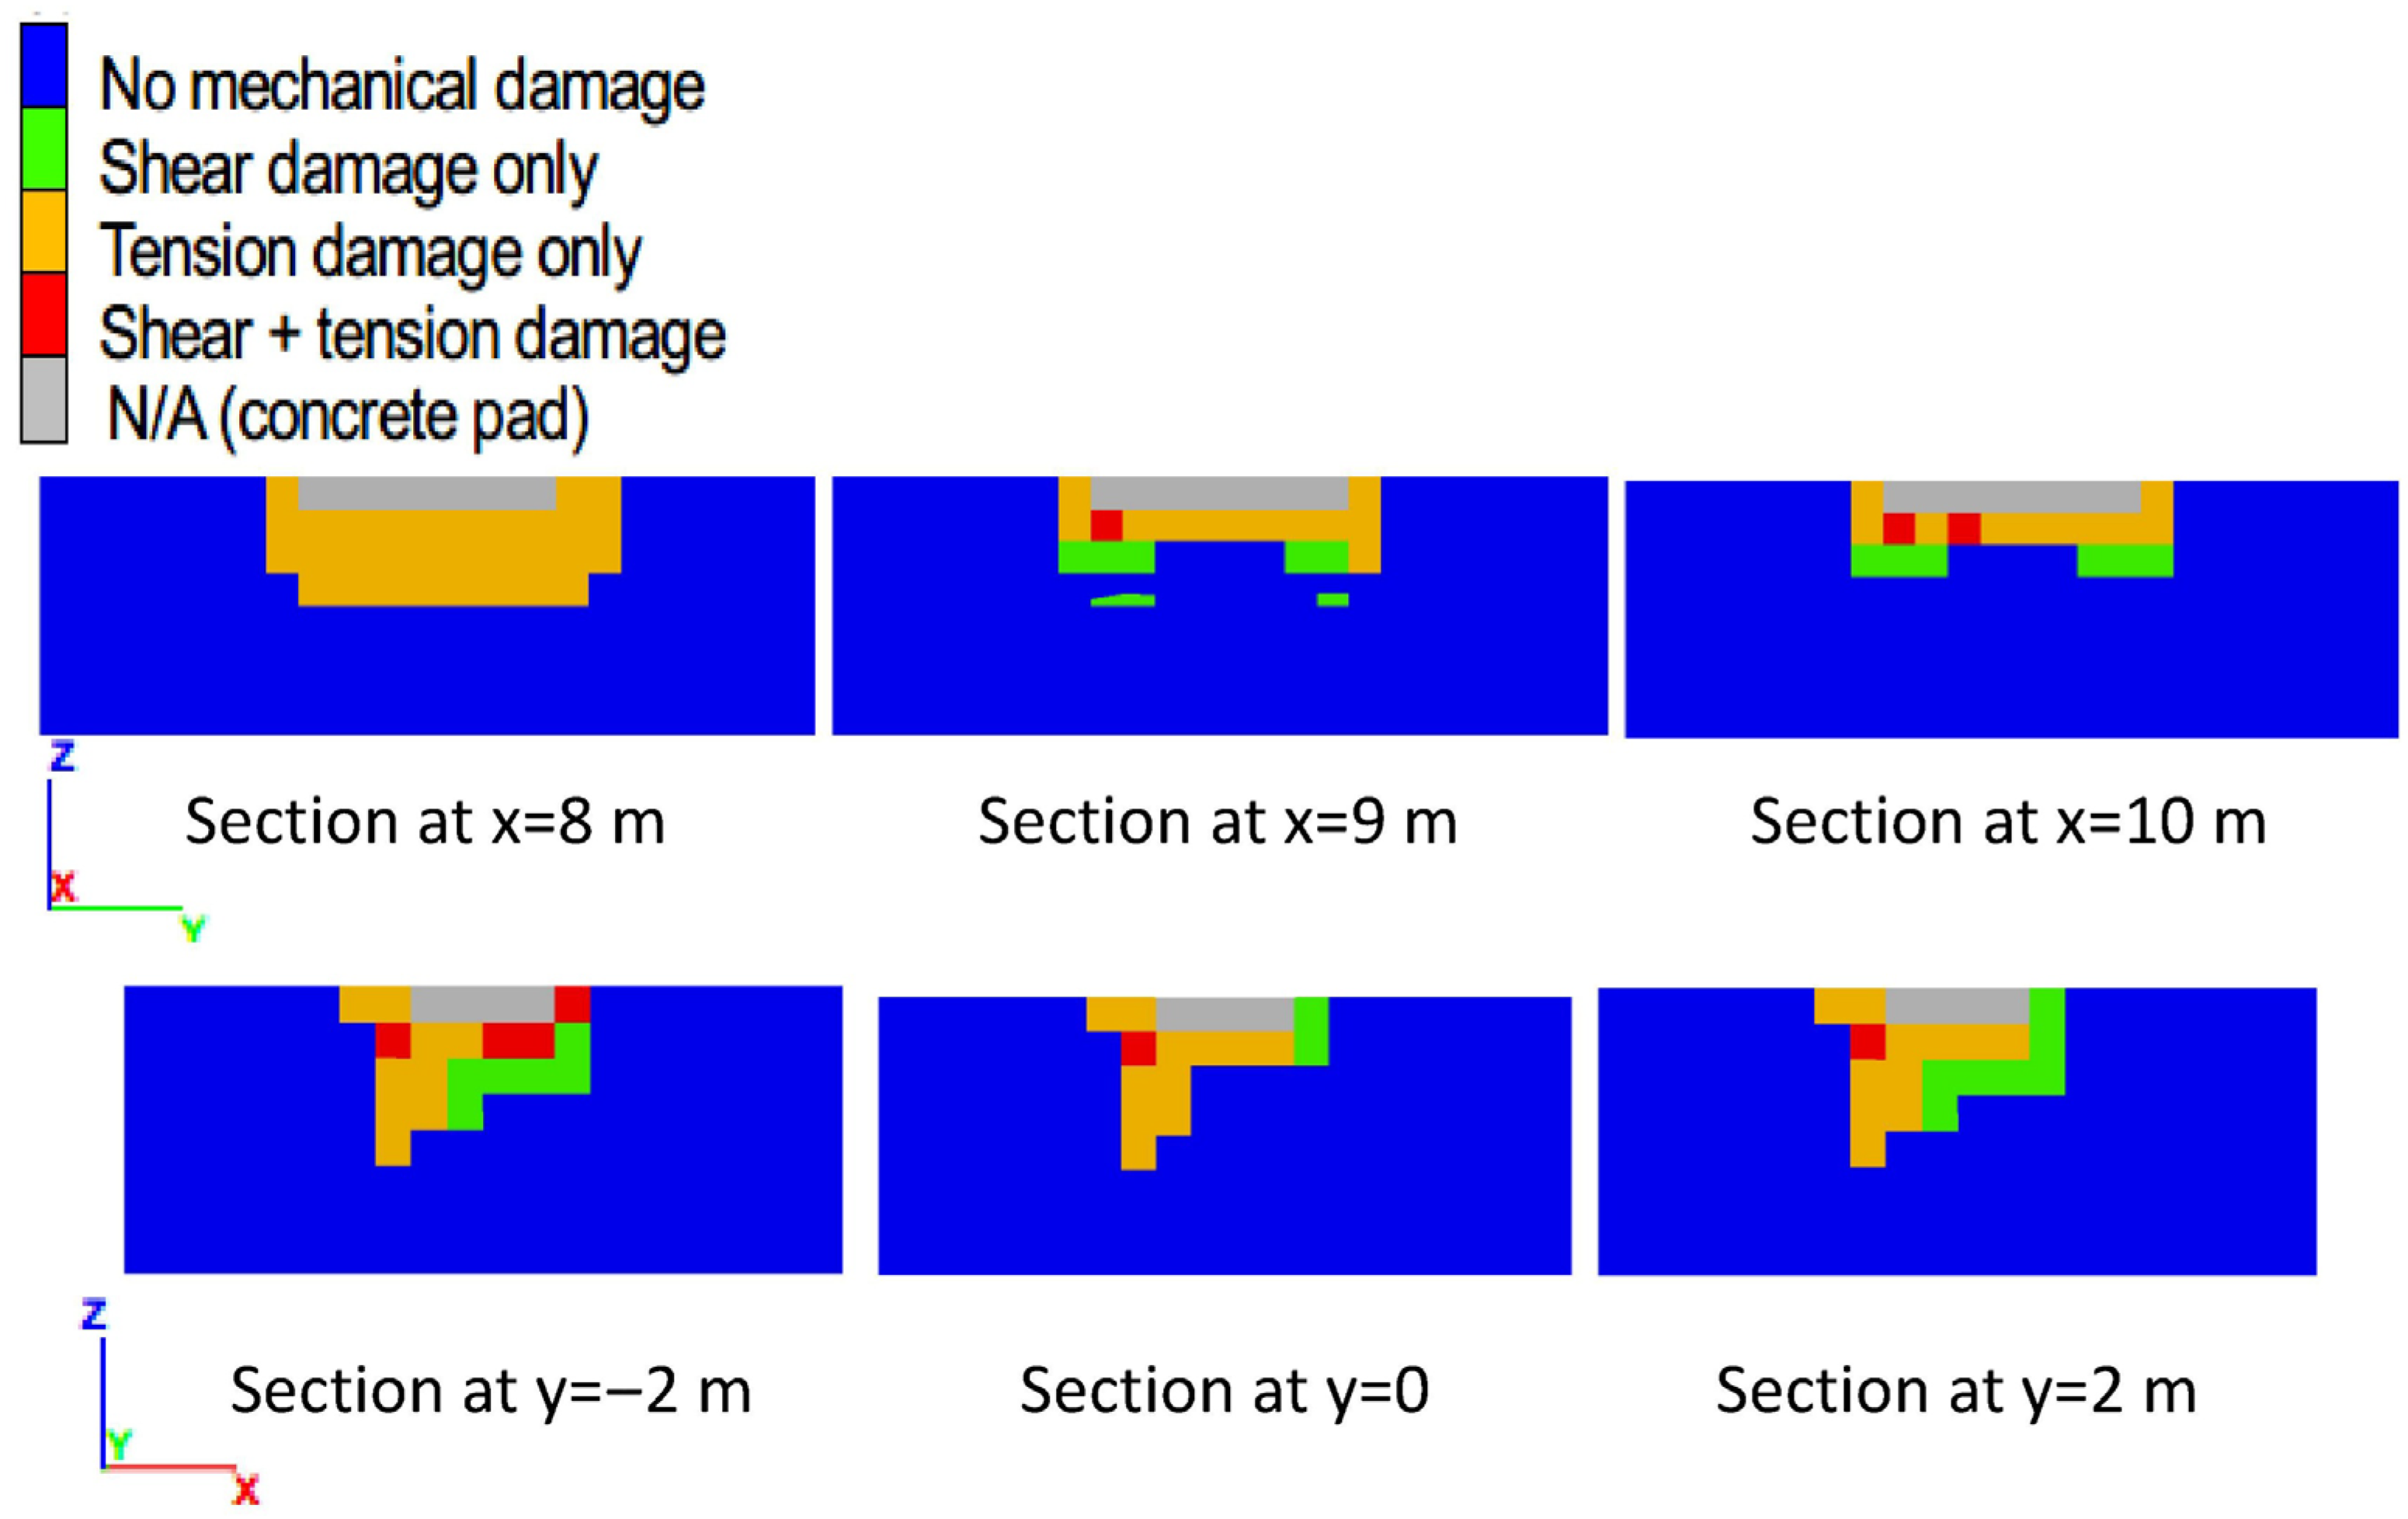
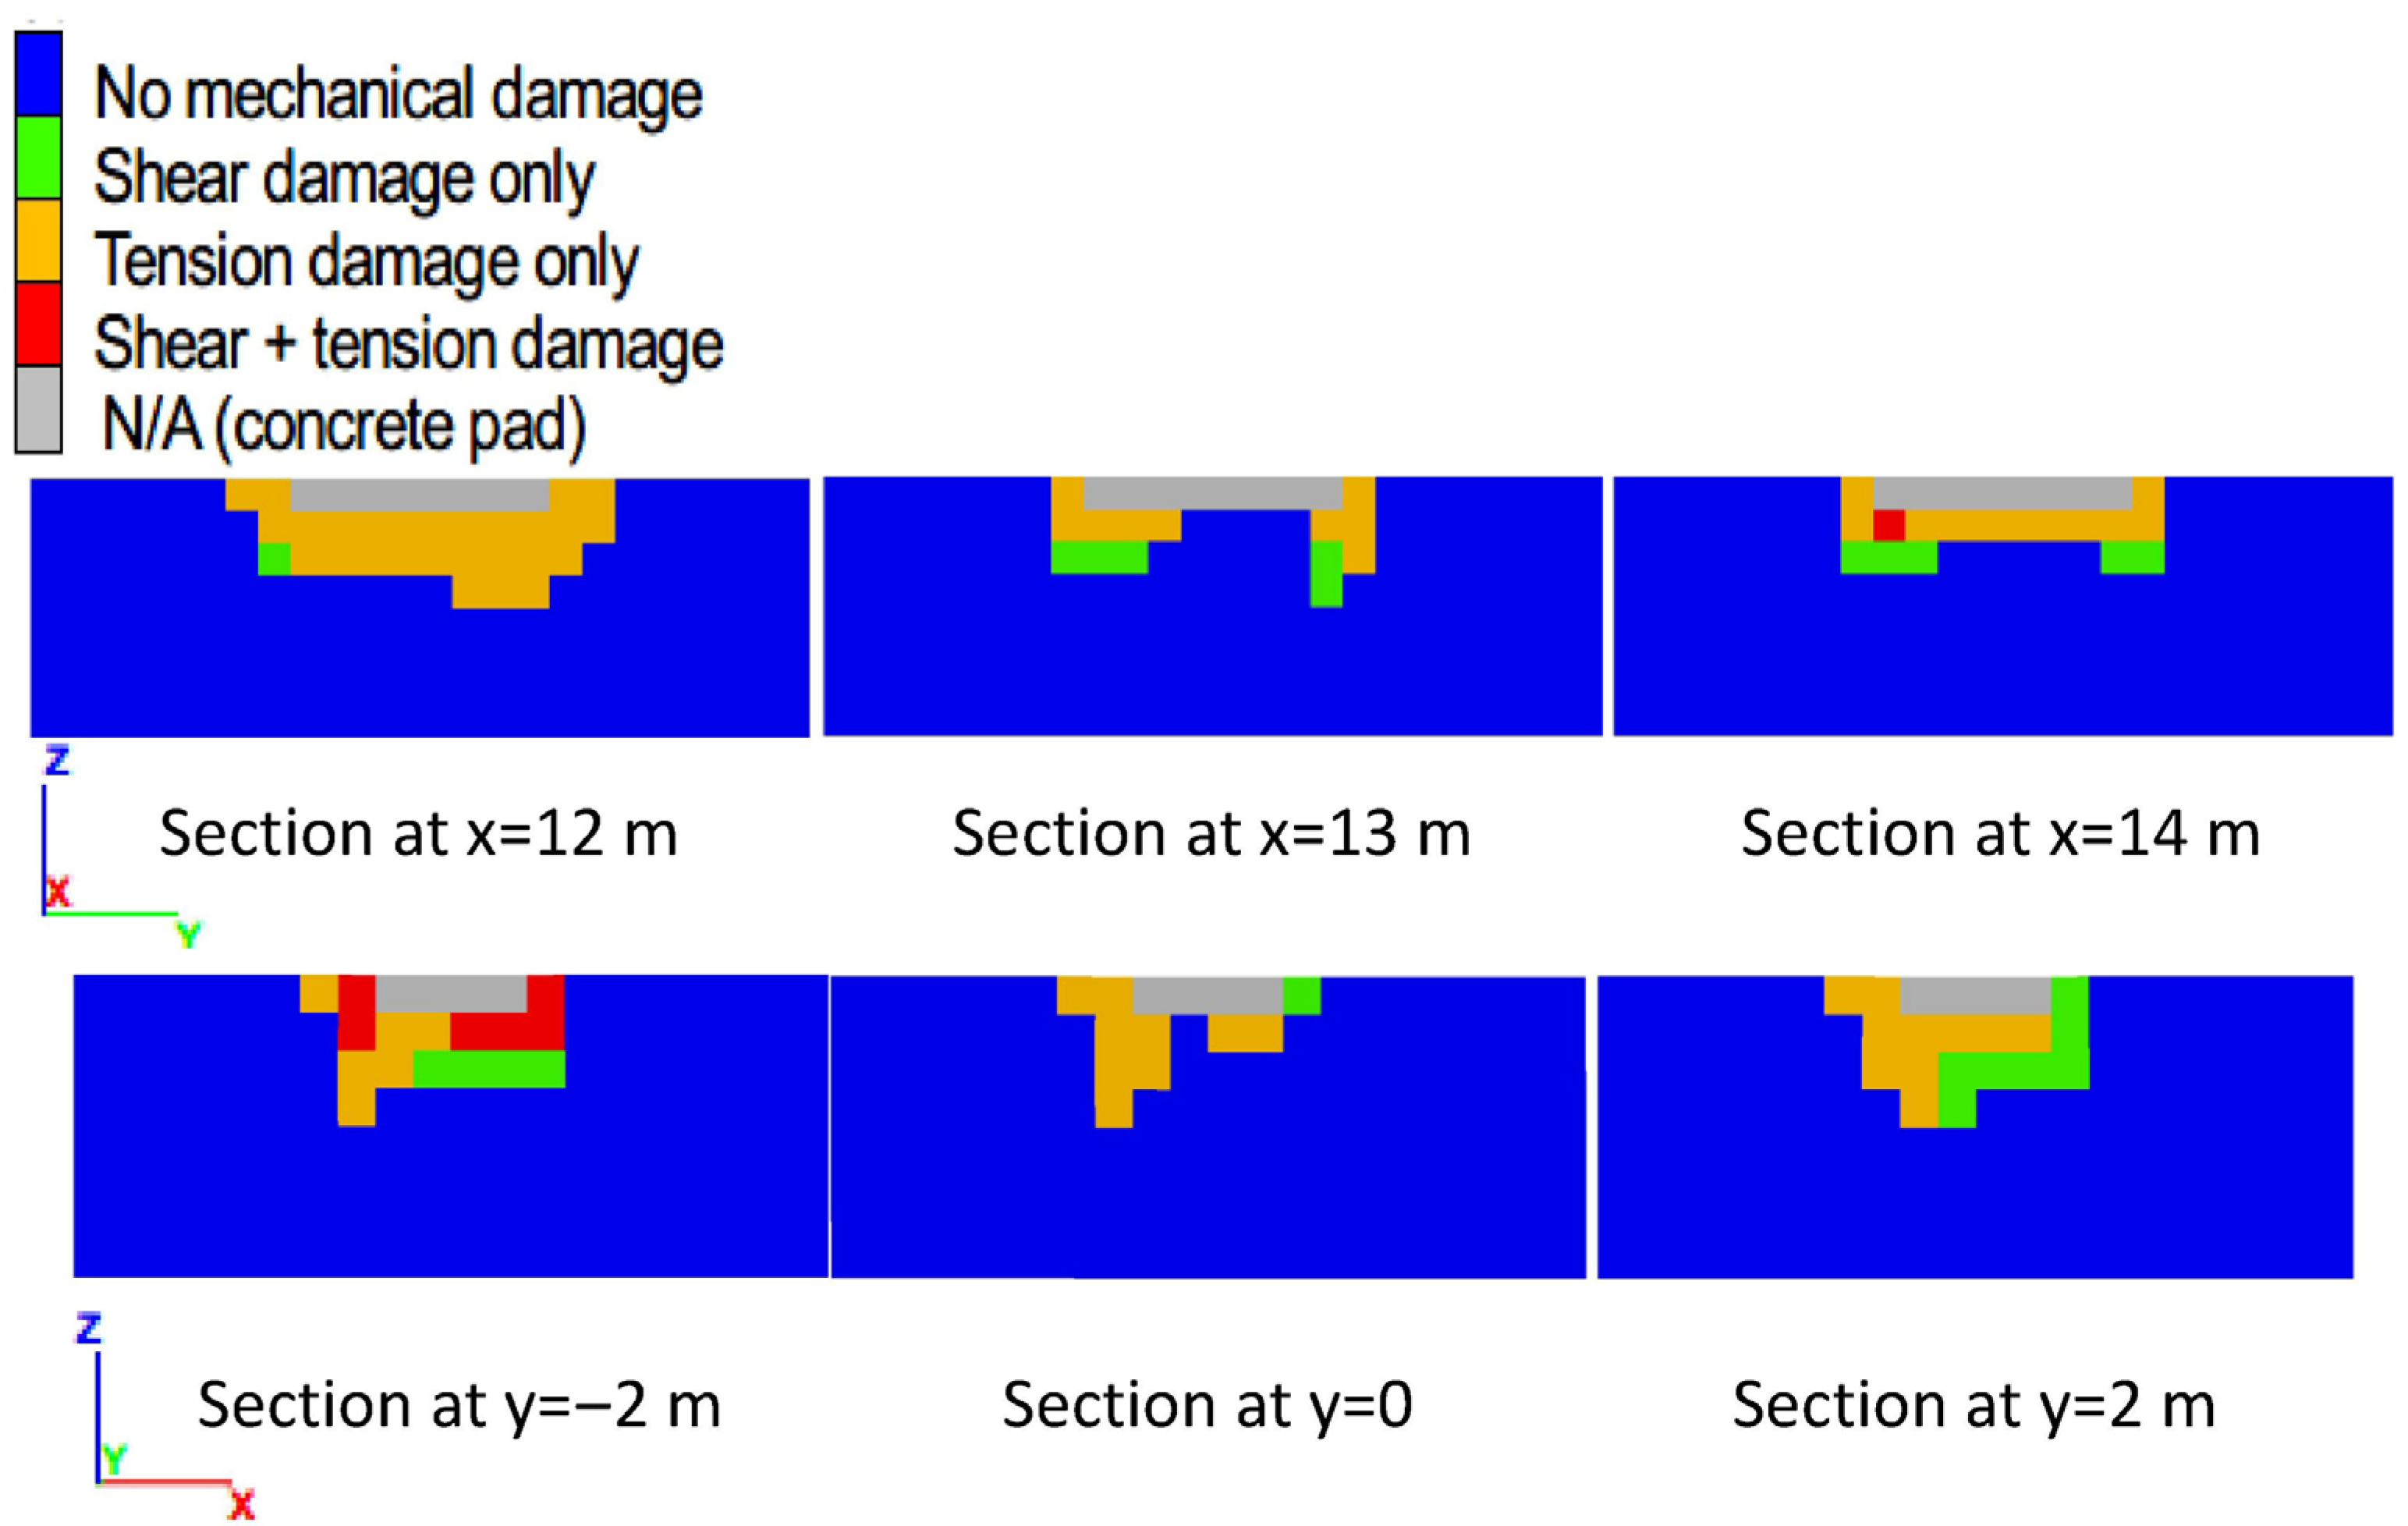
Figure A3) describing the spatial distribution of mechanical damage at the state of peak bearing pressure, from models of a shallow foundation at the top of a slope, with foundation setback of 8, 12, and 16 m from the slope crest. The figures provide additional information that could help understand the main text regarding the spatial distribution of damage.
Figure A1.
Two perpendicular sections through the concrete pad, showing the spatial distribution of damage at the state of peak bearing pressure, from the model of shallow foundation atop a slope with a foundation setback of 8 m and soil tensile strength of 10 kPa.
Figure A1.
Two perpendicular sections through the concrete pad, showing the spatial distribution of damage at the state of peak bearing pressure, from the model of shallow foundation atop a slope with a foundation setback of 8 m and soil tensile strength of 10 kPa.
Figure A2.
Two perpendicular sections through the concrete pad, showing the spatial distribution of damage at the state of peak bearing pressure, from the model of shallow foundation atop a slope with a foundation setback of 12 m and soil tensile strength of 10 kPa.
Figure A2.
Two perpendicular sections through the concrete pad, showing the spatial distribution of damage at the state of peak bearing pressure, from the model of shallow foundation atop a slope with a foundation setback of 12 m and soil tensile strength of 10 kPa.
Figure A3.
Two perpendicular sections through the concrete pad, showing the spatial distribution of damage at the state of peak bearing pressure, from the model of shallow foundation atop a slope with a foundation setback of 16 m and soil tensile strength of 10 kPa.
Figure A3.
Two perpendicular sections through the concrete pad, showing the spatial distribution of damage at the state of peak bearing pressure, from the model of shallow foundation atop a slope with a foundation setback of 16 m and soil tensile strength of 10 kPa.
References
- Bowles, J.E. Foundation Analysis and Design, 5th ed.; The McGraw-Hill Companies, Inc.: New York, NY, USA, 1996. [Google Scholar]
- Terzaghi, K. Theoretical Soil Mechanics; John Wiley & Sons: New York, NY, USA, 1943. [Google Scholar]
- Meyerhof, G.G. The ultimate bearing capacity of foundations. Géotechnique 1951, 2, 301–331. [Google Scholar] [CrossRef]
- Hansen, J.B. Hansen, J.B. A Revised and Extended Formula for Bearing Capacity; Bulletin No. 28; Danish Geotechnical Institute: Kongens Lyngby, Denmark, 1970. [Google Scholar]
- Vesic, A.S. Analysis of ultimate loads of shallow foundations. J. Soil Mech. Found. Div. 1973, 99, 45–73. [Google Scholar] [CrossRef]
- Davis, E.H.; Booker, J.R. The bearing capacity of strip footings from the standpoint of plasticity theory. In Proceedings of the 1st Australia—New Zealand Conference on Geomechanics, Melbourne, VIC, Australia, 9–13 August 1971. [Google Scholar]
- Davis, E.H. A discussion of theories of plasticity and limit analysis in relation to the failure of soil masses. In Proceedings of the 5th Australia—New Zealand Conference on Soil Mechanics and Foundation Engineering, Auckland, New Zealand, 13–17 February 1967. [Google Scholar]
- Davis, E.H. Theories of plasticity and the failure of soil masses. In Soil Mechanics Selected Topics; Lee, I.K., Ed.; Butterworths: Sydney, NSW, Australia, 1968. [Google Scholar]
- Booker, J.R. Applications of Theories of Plasticity to Cohesive Frictional Soils. Ph.D. Thesis, University of Sydney, Sydney, NSW, Australia, 1970. [Google Scholar]
- Bolton, M.D.; Lau, C.K. Vertical bearing capacity factors for circular and strip footings on Mohr–Coulomb soil. Can. Geotech. J. 1993, 30, 1024–1033. [Google Scholar] [CrossRef]
- Cheng, Y.M.; Au, S.K. Solution of the bearing capacity problem by the slip line method. Can. Geotech. J. 2005, 42, 1232–1241. [Google Scholar] [CrossRef]
- Peng, M.-X.; Peng, H.-X. The ultimate bearing capacity of shallow strip footings using slip-line method. Soils Found. 2019, 59, 601–616. [Google Scholar] [CrossRef]
- Meyerhof, G.G. The bearing capacity of foundations under eccentric and inclined loads. In Proceedings of the 3rd International Conference Soil Mechanics and Foundation Engineering, Zurich, Switzerland, 16–27 August 1953. [Google Scholar]
- Meyerhof, G.G. The ultimate bearing capacity of foundations on slopes. In Proceedings of the 4th International Conference Soil Mechanics and Foundation Engineering, London, UK, 12–24 August 1957. [Google Scholar]
- Meyerhof, G.G. The ultimate bearing capacity of wedge-shaped foundations. In Proceedings of the 4th International Conference Soil Mechanics and Foundation Engineering, Paris, France, 17–22 July 1961. [Google Scholar]
- Manoharan, N.; Dasgupta, S.P. Bearing capacity of surface footings by finite elements. Comput. Struct. 1995, 54, 563–586. [Google Scholar] [CrossRef]
- Frydman, S.; Burd, H.J. Numerical studies of bearing capacity factor . J. Geotech. Geoenviron. Eng. 1997, 123, 20–29. [Google Scholar]
- Hjiaj, M.; Lyamin, A.V.; Sloan, S.W. Numerical limit analysis solutions for the bearing capacity factor . Int. J. Solids Struct. 2005, 42, 5–6. [Google Scholar] [CrossRef]
- Loukidis, D.; Salgado, R. Bearing capacity of strip and circular footings in sand using finite elements. Comput. Geotech. 2009, 26, 871–879. [Google Scholar] [CrossRef]
- Griffiths, D.V. Computation of bearing capacity factors using finite elements. Géotechnique 2015, 32, 195–202. [Google Scholar] [CrossRef]
- Ramsey, J.M.; Chester, F.M. Hybrid fracture and the transition from extension fracture to shear fracture. Nature 2004, 428, 63–66. [Google Scholar] [CrossRef] [PubMed]
- Ferrill, D.A.; McGinnis, R.N.; Morris, A.P.; Smart, K.J. Hybrid failure: Field evidence and influence on fault reactivation. J. Struct. Geol. 2012, 42, 140–150. [Google Scholar] [CrossRef]
- Ofoegbu, G.I.; Smart, K.J. Modeling discrete fractures in continuum analysis and insights for fracture propagation and mechanical behavior of fractured rock. Results Eng. 2019, 4, 100070. [Google Scholar] [CrossRef]
- Ofoegbu, G.I. Using fracture-based continuum modeling of coupled geomechanical-hydrological processes for numerical simulation of hydraulic fracturing. J. Rock Mech. Geotech. Eng. 2024, 16, 1582–1599. [Google Scholar] [CrossRef]
- Kabilan, N.; Muttharam, M. Correlation between unconfined compressive strength and indirect tensile strength for jointed rocks. Int. J. Res. Eng. Technol. 2016, 5, 157–161. [Google Scholar] [CrossRef]
- Ibrahim, A.F.; Hiba, M.; Elkatatny, S.; Ali, A. Estimation of tensile and uniaxial compressive strength of carbonate rocks from well-logging data: Artificial intelligence approach. J. Pet. Explor. Prod. Technol. 2024, 14, 317–329. [Google Scholar] [CrossRef]
- Ofoegbu, G.I.; Dasgupta, B.; Manepally, C.; Stothoff, S.A.; Fedors, R. Modeling the mechanical behavior of unsaturated expansive soils based on Bishop principle of effective stress. Environ. Earth Sci. 2017, 76, 555. [Google Scholar] [CrossRef]
Figure 1.
Model for foundation atop a slope, showing (a) model geometry and (b) volume discretization (finite difference mesh). The model geometry shows a cutout representing the concrete pad, the definition of foundation setback, and six section lines across the concrete pad. The mesh consists of brick-shaped elements with length dimensions of 0.5 m everywhere, except near the slope where the element dimensions vary to follow the slope geometry. The model domain extends an additional 10 m (with the same mesh) below the figure plot.
Figure 2.
A close-up view of the model concrete pad, transition zone, and surrounding soil, showing a three-dimensional (3D) view and two vertical sections.
Figure 2.
A close-up view of the model concrete pad, transition zone, and surrounding soil, showing a three-dimensional (3D) view and two vertical sections.
Figure 3.
Calculated bearing pressure versus settlement for a rectangular footing at the top of a slope, from models with soil tensile strength of 10 kPa, showing results for models with foundation setback (defined in
Figure 1a) of 18, 14, 10, 6, and 4 m.
Figure 3.
Calculated bearing pressure versus settlement for a rectangular footing at the top of a slope, from models with soil tensile strength of 10 kPa, showing results for models with foundation setback (defined in
Figure 1a) of 18, 14, 10, 6, and 4 m.
Figure 4.
Ultimate (peak) bearing pressure and proposed (damage-based) bearing capacity, showing the effects of foundation setback and soil tensile strength, based on the foundation-atop-slope model calculations.
Figure 4.
Ultimate (peak) bearing pressure and proposed (damage-based) bearing capacity, showing the effects of foundation setback and soil tensile strength, based on the foundation-atop-slope model calculations.
Figure 5.
Volume of fractured soil (0.125 m
3 per element) versus settlement, from soil model with tensile strength of 10 kPa for foundation models with a setback of 18, 14, and 8, and tensile fractures that occurred in the transition zone (
Figure 2) at the initial state, which manifest as a non-zero horizontal line in the fracture versus settlement plots (
Figure 5), are not part of the system response to foundation loading, and should not be considered in determining the threshold settlement for damage. The transition zone fractures indicate preexisting tensile stress in the soil prior to foundation loading and are a model feature that provides lateral mechanical separation of the concrete pad from the soil to ensure that load transmission from the pad to the soil is mostly vertical.
Figure 6.
Fracture type participation ratio versus settlement, from soil model with tensile strength of 10 kPa for foundation models with a setback of 18, 14, 8, and 4 m from the slope crest.
Figure 6.
Fracture type participation ratio versus settlement, from soil model with tensile strength of 10 kPa for foundation models with a setback of 18, 14, 8, and 4 m from the slope crest.
Figure 7.
Fracture type participation ratio, showing the effects of foundation setback and soil tensile strength, based on the foundation-atop-slope model calculations.
Figure 7.
Fracture type participation ratio, showing the effects of foundation setback and soil tensile strength, based on the foundation-atop-slope model calculations.
Figure 8.
Two perpendicular sections through the concrete pad, showing the spatial distribution of damage at the state of peak bearing pressure, for the model with a foundation setback of 18 m and soil tensile strength of 10 kPa.
Figure 8.
Two perpendicular sections through the concrete pad, showing the spatial distribution of damage at the state of peak bearing pressure, for the model with a foundation setback of 18 m and soil tensile strength of 10 kPa.
Figure 9.
Two perpendicular sections through the concrete pad, showing the spatial distribution of damage at the state of peak bearing pressure for the model with a foundation setback of 4 m and soil tensile strength of 10 kPa.
Figure 9.
Two perpendicular sections through the concrete pad, showing the spatial distribution of damage at the state of peak bearing pressure for the model with a foundation setback of 4 m and soil tensile strength of 10 kPa.
Figure 10.
Results from the verification analysis of a shallow foundation on homogenous soil under a level ground surface: (a) bearing pressure versus settlement for three soil stiffness models and (b) fractures versus settlement for the “more realistic stiffness” model.
Figure 10.
Results from the verification analysis of a shallow foundation on homogenous soil under a level ground surface: (a) bearing pressure versus settlement for three soil stiffness models and (b) fractures versus settlement for the “more realistic stiffness” model.
Figure 11.
Two perpendicular sections through the concrete pad, showing the spatial distribution of damage at the state of peak bearing pressure, from the verification analysis of a shallow foundation on homogenous soil under a level ground surface.
Figure 11.
Two perpendicular sections through the concrete pad, showing the spatial distribution of damage at the state of peak bearing pressure, from the verification analysis of a shallow foundation on homogenous soil under a level ground surface.
Figure 12.
(
a) Bearing pressure versus settlement and (
b) fractures versus settlement, from the verification analysis of a pile foundation in multilayer soil. The bearing pressure plot shows states A, B, C, and D, for which the spatial distribution of damage is described in
Figure 13.
Figure 12.
(
a) Bearing pressure versus settlement and (
b) fractures versus settlement, from the verification analysis of a pile foundation in multilayer soil. The bearing pressure plot shows states A, B, C, and D, for which the spatial distribution of damage is described in
Figure 13.
Figure 13.
Spatial distribution of damage from the verification analysis of a pile foundation in multilayer soil, showing the damage distribution at states A, B, C, and D, as identified in
Figure 12a.
Figure 13.
Spatial distribution of damage from the verification analysis of a pile foundation in multilayer soil, showing the damage distribution at states A, B, C, and D, as identified in
Figure 12a.
Table 1.
Material properties for foundation atop slope models.
Table 1.
Material properties for foundation atop slope models.
| Parameter Description | Value |
|---|
| Soil Properties | |
| Unconfined compressive strength (kPa) | 200 |
| Friction angle (°) | 20 |
| Tensile strength case 1 () (kPa) | 10 |
| Tensile strength case 2 () (kPa) | 20 |
| Initial void ratio () | 0.6 |
| Preconsolidation pressure (kPa) | |
| Compressibility parameter | 0.0005 |
| Compressibility parameter | 0.012 |
| Concrete Pad Properties (Linear Elastic) | |
| Bulk modulus (kPa) | |
| Shear modulus (kPa) | |
Table 2.
Summary of bearing pressure and settlement from models with 10 kPa tensile strength.
Table 2.
Summary of bearing pressure and settlement from models with 10 kPa tensile strength.
| Setback (m) | Threshold Settlement for Mechanical
Damage (mm) | Minimum Bearing
Pressure for Mechanical Damage (kPa) | Ultimate Bearing Pressure (kPa) | Implied Safety Factor |
|---|
| 18 | 4.06 | 293.2 | 424.6 | 1.45 |
| 16 | 3.97 | 280.4 | 414.0 | 1.48 |
| 14 | 3.78 | 259.4 | 401.8 | 1.55 |
| 12 | 3.50 | 229.9 | 371.2 | 1.61 |
| 10 | 3.19 | 204.9 | 362.8 | 1.77 |
| 8 | 3.10 | 195.8 | 359.1 | 1.83 |
| 6 | 2.71 | 169.0 | 338.5 | 2.00 |
| 4 | 2.32 | 143.8 | 324.0 | 2.25 |
Table 3.
Summary of bearing pressure and settlement from models with 20 kPa tensile strength.
Table 3.
Summary of bearing pressure and settlement from models with 20 kPa tensile strength.
| Setback (m) | Threshold Settlement for Mechanical
Damage (mm) | Minimum Bearing
Pressure for Mechanical Damage (kPa) | Ultimate Bearing Pressure (kPa) | Implied Safety Factor |
|---|
| 18 | 4.16 | 306.1 | 430.7 | 1.41 |
| 16 | 4.06 | 291.9 | 423.1 | 1.45 |
| 14 | 3.77 | 265.4 | 414.9 | 1.56 |
| 12 | 3.39 | 230.5 | 409.4 | 1.78 |
| 10 | 3.27 | 218.5 | 398.0 | 1.82 |
| 8 | 2.90 | 189.2 | 387.6 | 2.05 |
| 6 | 2.61 | 169.7 | 389.0 | 2.29 |
| 4 | 2.32 | 149.0 | 367.0 | 2.46 |
Table 4.
Soil stiffness parameters for numerical (FBCM) modeling of column footing on homogeneous soil under a level ground surface.
Table 4.
Soil stiffness parameters for numerical (FBCM) modeling of column footing on homogeneous soil under a level ground surface.
| Parameter Description | More Realistic Stiffness | High Stiffness | Very High Stiffness |
|---|
| Initial void ratio () | 0.6 | 0.5 | 0.5 |
| Preconsolidation pressure (kPa) | |
| Compressibility parameter | | | |
| Compressibility parameter | | | |
Table 5.
Soil strength and stiffness parameters for single pile in multilayer soil.
Table 5.
Soil strength and stiffness parameters for single pile in multilayer soil.
| Parameter Description | Soil Layer | Value |
|---|
| Unconfined compressive strength (kPa) | Sand layer 1 (top) | 0.1 |
| Friction angle (°) | Sand layer 1 (top) | 25 |
| (kPa) | Sand layer 2 (from top) | 0.1 |
| () | Sand layer 2 (from top) | 36 |
| (kPa) | Sand layer 3 (from top) | 0.1 |
| () | Sand layer 3 (from top) | 32 |
| (kPa) | Sand layer 4 (from top) | 0.1 |
| () | Sand layer 4 (from top) | 36 |
| (kPa) | Sand layer 5 (from top) | 0.1 |
| () | Sand layer 5 (from top) | 36 |
| (kPa) | Base clay layer | 92.4 |
| () | Base clay layer | 0.1 |
| Tensile strength | All soil layers | |
| Initial void ratio () | All soil layers | 0.6 |
| Preconsolidation pressure (kPa) | All soil layers | 11.9769 |
| Compressibility parameter | All soil layers | |
| Compressibility parameter | All soil layers | |
| Disclaimer/Publisher’s Note: The statements, opinions and data contained in all publications are solely those of the individual author(s) and contributor(s) and not of MDPI and/or the editor(s). MDPI and/or the editor(s) disclaim responsibility for any injury to people or property resulting from any ideas, methods, instructions or products referred to in the content. |
© 2025 by the authors. Licensee MDPI, Basel, Switzerland. This article is an open access article distributed under the terms and conditions of the Creative Commons Attribution (CC BY) license (https://creativecommons.org/licenses/by/4.0/).
