1. Introduction
Rare-Earth Elements (REEs) are vital for creating sustainable technologies to enhance living standards and are often classified as critical minerals. REEs encompass the lanthanide series (atomic numbers 57–71, from Lanthanum to Lutetium) in the periodic table’s IIIB group. Scandium (atomic number 21) and yttrium (atomic number 39) are frequently included in the REE group due to their presence in REE-bearing minerals and similar properties, though some debate excludes scandium due to its differing ionic radius. Traditionally, REEs are divided into the Ceric group (La to Eu) and the Yttric group (Gd to Lu, including Y), based on solubility differences. For industrial purposes, metallurgists categorize REEs into three groups: light REEs (Lanthanum to Neodymium), middle or medium REEs (Samarium to Gadolinium), and heavy REEs (Dysprosium to Lutetium) [
1].
Nearly all REEs coexist in the same mineral deposits, making their separation and extraction vital for industrial applications. Due to their closely related physical and chemical properties, isolating individual elements is complex. These similarities stem from gradual electron changes in the 4f sublevels, leading to the classification of REEs into light (LREEs), middle (MREEs), and heavy (HREEs) [
1]. The challenge of separating individual REEs arises from their nearly identical electronic structures, with only minor variations in ionic radii (0.01–0.03 Å between consecutive elements) [
1,
2,
3]. Consequently, separating REEs using precipitation techniques is intricate and difficult.
A 2011 USGS report [
4] infers that hundreds of mineral resources contain REEs, which are grouped into three categories:
Cerium-dominant: Includes Bastnasite, Monazite, Allanite, and others.
Yttrium-dominant: Includes Euxenite and Samarskite.
Other resources: Includes Apatite, Xenotime, Carbonatites, and Ion adsorption clays.
Economic constraints limit commercial extraction to key deposits like carbonatites (Bastnasite and Monazite) in the USA, Australia, China, and Mongolia, with 2–10% REE content by weight [
5]. Placer deposits in India, Sri Lanka, Australia, and the southern USA have lower REE concentrations (<0.5% by weight). Ion adsorption clays, another viable source, offer preconcentrated REEs with low-radioactivity waste [
5]. Research continues to extract low-REE-content deposits.
Secondary Resources: To address environmental concerns and global metal demand, industries are adopting metal life cycle assessments and recycling left-to-recycle (LTR) materials like metal scraps, electronic waste, and phosphors [
6]. Recycling supports sustainability by creating jobs, advancing technology, and reducing waste in landfills and oceans. Key secondary REE sources include:
Coal combustion ash, rich in REEs.
Dross, slags, and red mud from metal processing and bauxite residue.
Gold beneficiation tailings, containing LREEs (Ce, La, Nd).
Recyclable items like Neodymium–Iron–Boron magnets, phosphors, fluorescent lamps, Nickel–Metal-Hydride batteries, motors, and fluid cracking catalysts.
Considering that light REE ions have marginally larger ionic radii than heavy REE ions and other ions in mine tailings [
7], effective separation requires designing frameworks with specific pore sizes or enhanced binding interactions. Although MOFs show promise to separate REEs, only a few studies have demonstrated their use. Recently, MOFs with 0.8 nm hydroxyl-rich hexagonal channels were developed for selective lanthanide extraction via solid-phase methods, achieving a separation factor below 2 due to limited REE-hydroxyl interactions [
7]. Wu et al. created a Zn-BTC MOF/NG through in situ solid-phase synthesis, which exhibited superior REE selectivity by leveraging the combined effects of MOF’s 3D pore structure and NG’s 2D pore system [
8]. Previous findings indicate that adding electron-donating (–NH
2) and electron-withdrawing (–CN) groups to Zn-BTC MOFs through ligand functionalization substantially alters the electronic characteristics of the original BTC MOF. So, modifications of MOFs can further alter the properties and associated adsorption capacity [
9]. Ahn et al. synthesized a chromium-based MOF (Cr-MIL-101) and its variants with diverse organic functional groups to adsorb REE ions [
10,
11]. These materials, featuring carboxylate (−COO
−), phosphonic (−PO
32−), and nitrogen-containing groups, showed strong binding affinity for REE ions [
12]. However, their large pore sizes (1.2–2.2 nm) limited their effectiveness in separating different REEs [
12]. Studies indicate that crown ether (18-C-6) or other macrocyclic molecules with ~3.2 Å cavity diameters exhibit high selectivity for larger Ln
3+ ions, as their cavity size closely matches the ion diameters [
7,
13,
14]. Researchers proposed that immobilizing an REE nanotrap within MOFs of optimized pore size could enhance both the capture of REE ions and the isolation of pure individual REEs [
7,
15].
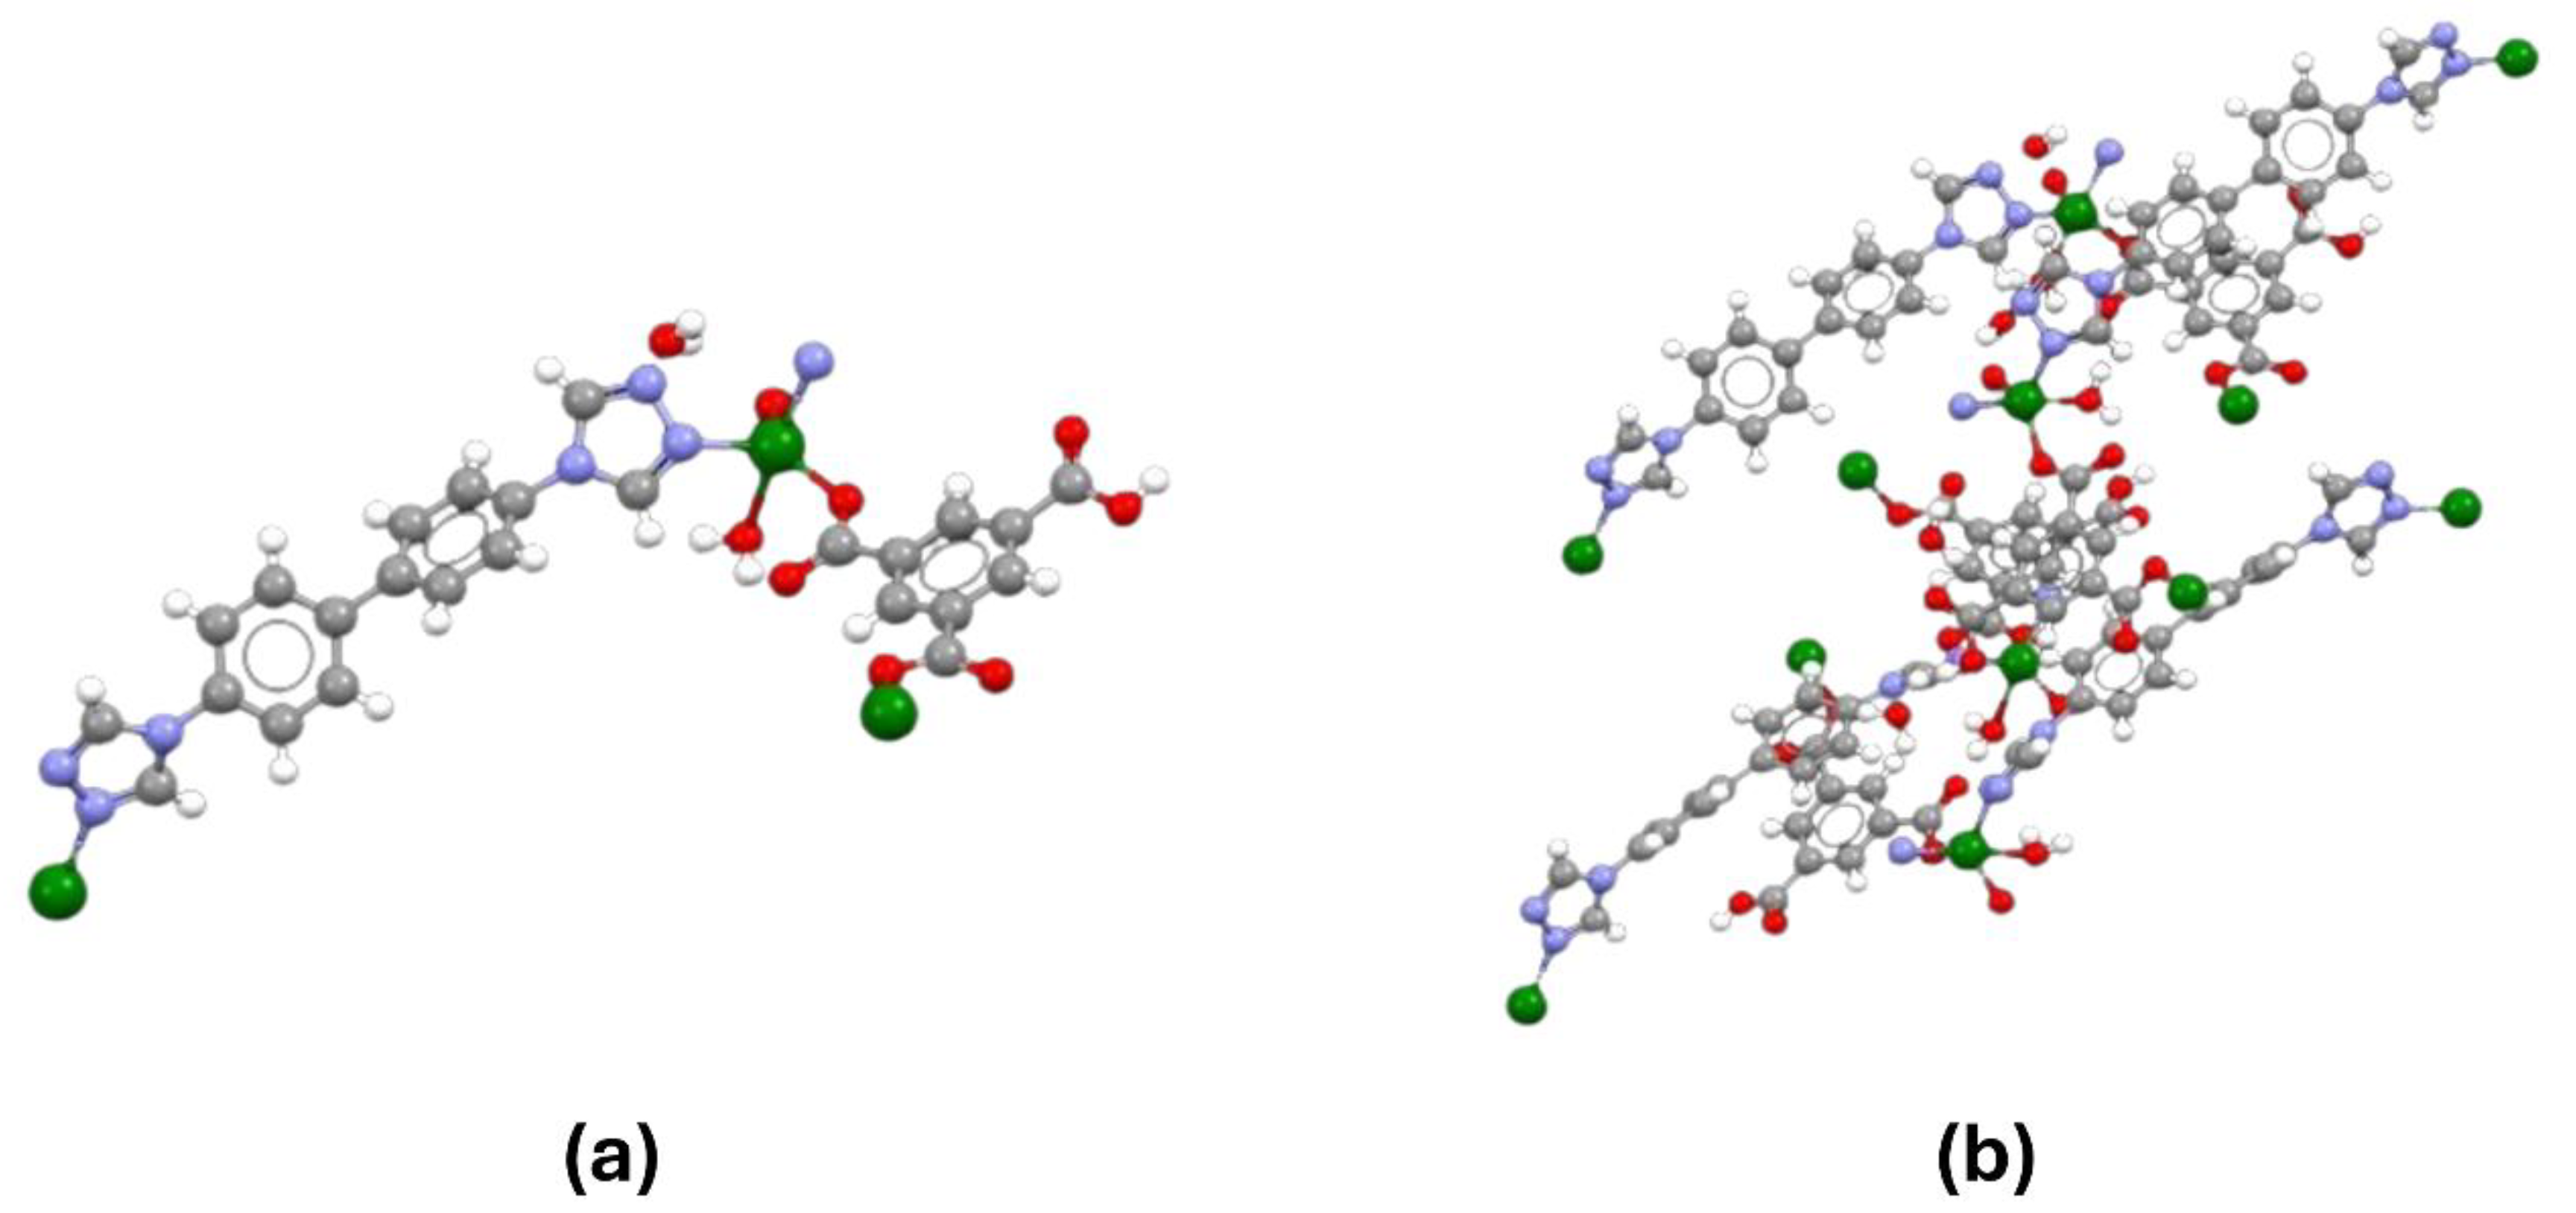
To test this hypothesis, researchers synthesized a novel 2D metal–organic framework (NCU-1) with abundant uncoordinated carboxyl groups and triazole N atoms, creating an environment favorable for REE binding [
7]. Both a single unit of NCU-1 and its crystal packing [
16] are shown (
Figure 1). The twofold interpenetration of NCU-1 generates multiple small cavities (~3.2 Å), closely aligned with the size and shape of light REE ions. Consequently, the combined effect of optimized pore sizes and multiple functional sites in these unique REE nanotraps enables exceptional uptake of light REE ions and a high separation factor for light versus heavy REEs in a single step. Researchers analyzed NCU-1’s performance in capturing REE ions using XPS and Cryo-EM. XPS showed successful adsorption of Pr
3+ (Pr 3d5/2 peak at 933.95 eV) and Nd
3+ (Nd 3d5/2 and 3d3/2 peaks at 982.95 eV and 1005.59 eV, with a 0.85 eV blue shift from Nd(NO
3)
3) [
17]. The O 1s spectrum indicated strong -COOH interactions [
18] (531.36 eV peak shifted by 0.60 eV for Pr
3+, 0.18 eV for Nd
3+) and water involvement (533.01 eV peak shifted by 0.49 eV and 0.37 eV) [
7]. Triazolium nitrogen (-NH at 399.98 eV shifted by 0.40 eV and 0.36 eV; -C=N- adjusted to 401.28 eV and 401.36 eV) also coordinated with REEs. FTIR briefly confirmed these interactions via shifts in -COOH and triazole signals [
7,
19]. Cryo-EM revealed NCU-1’s crystalline structure (0.192 nm lattice spacing) and oxide formation post-adsorption (Pr
2O
3 at 0.231 nm, Nd
2O
3 at 0.320 nm) [
7,
20]. These findings attribute NCU-1’s high REE uptake to coordinated binding with carboxyl, triazolium nitrogen, and water, aided by ~3.2 Å cavities selective for light REEs.
Bader charge analysis [
21] reveals charges of +2.09 e for Al
3+, +2.17 e for Dy
3+, and +2.31 e for Pr
3+ in NCU-1, indicating stronger binding for higher charges [
22]. Thus, NCU-1 binds Pr
3+ > Dy
3+ > Al
3+, favoring light REEs due to enhanced electron transfer. DFT calculations show REEs adsorb at nanotraps, with Pr
3+ coordinating to two carboxyl oxygens (1.79 Å, 2.73 Å) and one water molecule (1.94 Å), and Nd
3+ exhibits a similar trend (1.66 Å, 2.76 Å, 1.86 Å) [
23]. Adsorption energies are −3.29 eV (Pr
3+), −2.58 eV (Dy
3+), and −1.66 eV (Al
3+), reflecting stronger binding for larger ions like Pr
3+ (0.99 Å) that match NCU-1’s nanotraps better than Dy
3+ (0.91 Å) or Al
3+ (0.50 Å). Light REEs form stable complexes with carboxyl and nitrogen groups, while smaller or heavier ions bind weakly, enabling selective light REE separation [
8].
This research expands on the previous work done by Hu et al. to evaluate the performance of NCU-1 in separating REEs [
7]. The previous work used filtered acid mine tailings from Ganzhou City, China, without a reported characterization as the basis of its feedstock. The sulfate and nitrate ions likely present will present different sorbent performance than other systems such as pure chloride systems. Additionally, loading behavior below pH 2 and leaching efficiency were not mentioned.
2. Experiments
The authors synthesized multiple batches of NCU-1 by combining trimesic acid (0.21.0 mg, 0.10 mmol), 4,4-di(4H-1,2,4-triazol-4-yl)-1,1-biphenyl (28.8 mg, 0.10 mmol), Zn(NO3)·6H2O (29.5 mg, 0.1 mmol), 2 mL of MeCN, and 8 mL of water in a PTFE reactor. The mixture was heated at 140 °C for 3 days, then cooled slowly at 5 °C/h to room temperature. Light brown crystals suitable for X-ray analysis were obtained and air-dried. The powder X-ray diffraction (PXRD) pattern of the crystals after grinding in a mortar and pestle matched the simulated pattern, confirming that NCU-1 synthesis is straightforward and scalable. The authors followed previously established methods for small-scale synthesis of NCU-1 material in 20 mL vessels. NCU-1 has previously been described as “light brown crystals,” which matched the description of the product collected throughout this research.
Scanning electron microscopy (SEM) and energy-dispersive X-ray spectroscopy (EDS) analyses were performed on an FEI Quanta 600 FEG (Hillsboro, OR, USA). PXRD and XRD of the materials were performed on a Bruker Discover D8 (Karlsruhe, Germany) using a Cu-Kα at 40 kV and 40 mA with a TRIO 2 mm Göbel mirror and 20 × 20 scatter guard. The NCU-1 was ground into a fine powder and loaded into a silicon sample holder. The patterns were recorded under ambient conditions from 2θ measurements of 5° to 50° with a step size of 0.04° and a scan speed of 0.08 sec/step. Only the regions found to be of interest (from 5° to 50°) are reported. Raman spectroscopy was performed using an Ocean Optics DH-2000-BAL UV-Vis-NIR light source (Orlando, FL, USA) and a Raman Systems R-3000QE detector (Woburn, MA, USA).
Solutions were analyzed via an Agilent 5800 (Penang, Malaysia) inductively coupled plasma optical emission spectroscopy device (ICP-OES). Samples were diluted using a 5% solution of nitric acid.
Synthetic REE solutions were created by adding REE chloride hydrate salts to deionized water (18.2 MΩ at 25 °C, Millipore Simplicity® UV (Darmstadt, Germany)). pH was lowered by adding different volumes of concentrated hydrochloric acid, and the pH of the resulting solution was measured using a Thermo Scientific Orion Star A211 pH meter and associated probe (Jakarta, Indonesia).
Yttrium (III) chloride hexahydrate 99.99%, Lanthanum (III) chloride heptahydrate (ACS Reagent), Praseodymium (III) chloride hydrate (99.9% trace metals basis), Neodymium (III) chloride hexahydrate (99.9% trace metals basis), Samarium (III) chloride hexahydrate (>99%), and Dysprosium (III) chloride hexahydrate (99.9% trace metals basis) were purchased from Sigma Aldrich (St. Louis, MO, USA). Europium (III) chloride hydrate (REacton), Terbium (III) chloride hexahydrate (REacton), and Gadolinium (III) chloride hexahydrate (REacton) were purchased from Thermo Fisher Scientific (Russian Federation and Turkey).
Adsorption experiments were performed by loading 0.025 g of NCU ground in a mortar and pestle into 5 mL of synthetic REE solution in a beaker and mixing at 200 rpm on a shaker table. Final solutions were centrifuged at 1300 RPM, decanted, and the recovered NCU-1 was dried. Effluent was analyzed by ICP-OES.
Desorption experiments were performed on dried NCU-1 from the loading experiments. 0.02 g of loaded NCU-1 was mixed with 5 mL stripping solutions prepared from concentrated hydrochloric acid, then mixed at 200 rpm on a shaker table. Final solutions were centrifuged at 1300 RPM, decanted, and the effluent was analyzed by ICP-OES.
3. Results and Discussion
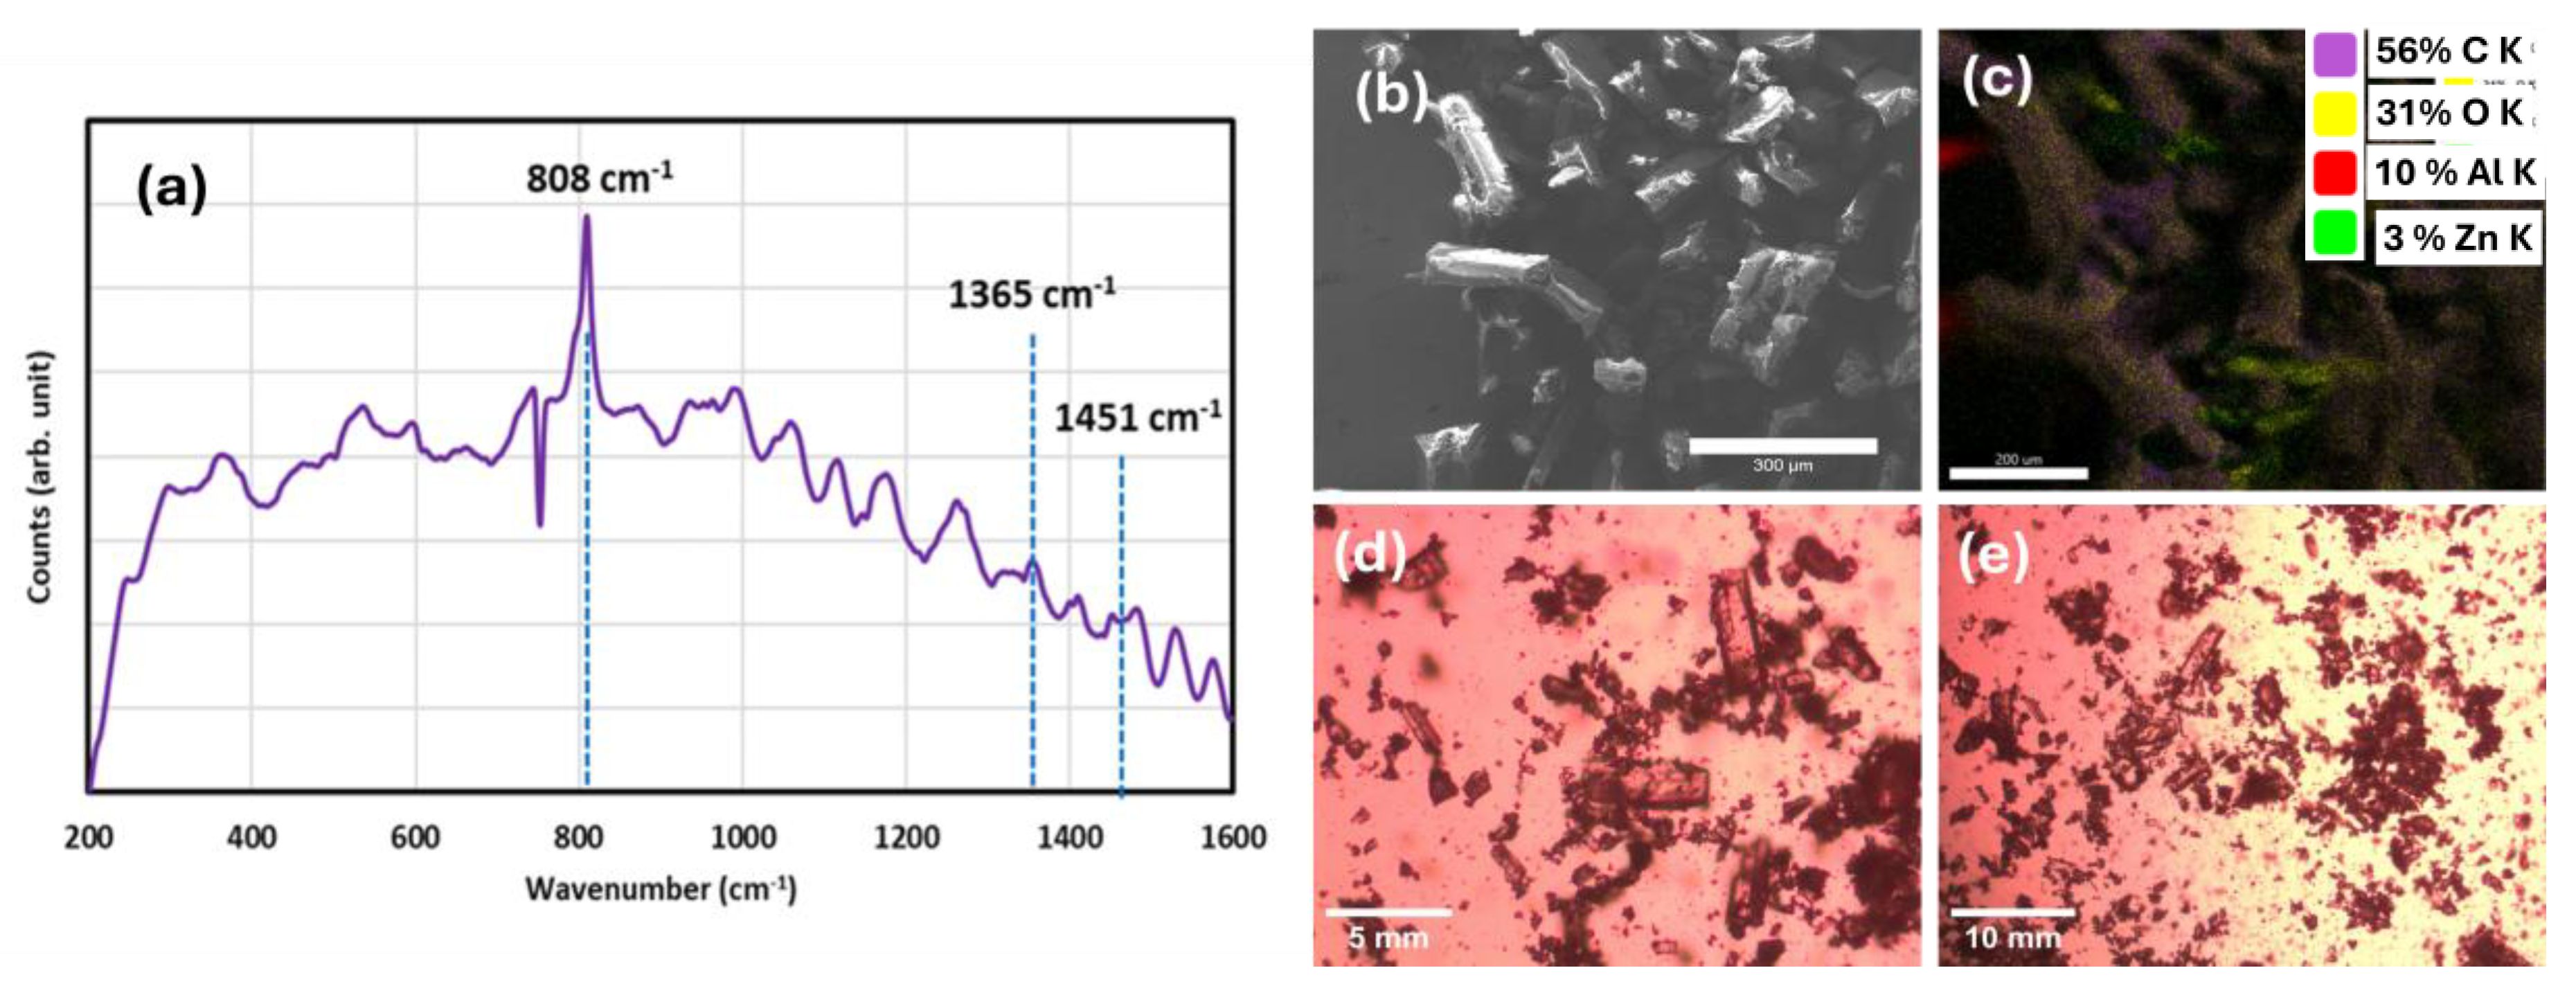
After synthesis, the NCU-1 crystals were characterized using SEM and optical microscopy. The typical crystal dimensions were approximately 200–300 µm in length and about 50 µm in thickness. The crystals exhibited a brown crystalline morphology (
Figure 2). An observation not reported by previous researchers was the formation of a fibrous white-gray, glassy byproduct associated with NCU-1, found in the PTFE reactor following hydrothermal synthesis. Due to significant static charge accumulation during SEM imaging, both secondary and backscattered electron modes provided limited contrast; however, EDS analysis confirmed that the fibrous material was primarily carbon-based. XRD analysis further indicated that the synthesized NCU-1 crystals possessed a high degree of crystallinity. A Raman spectrum of NCU-1 exhibits various peaks, but peaks at 1365 cm
−1 and 1451 cm
−1 match very well with previously reported Raman spectra of triazole (corresponding to the ν(C–N)) based MOFs [
24,
25]. The peak at 1555 cm
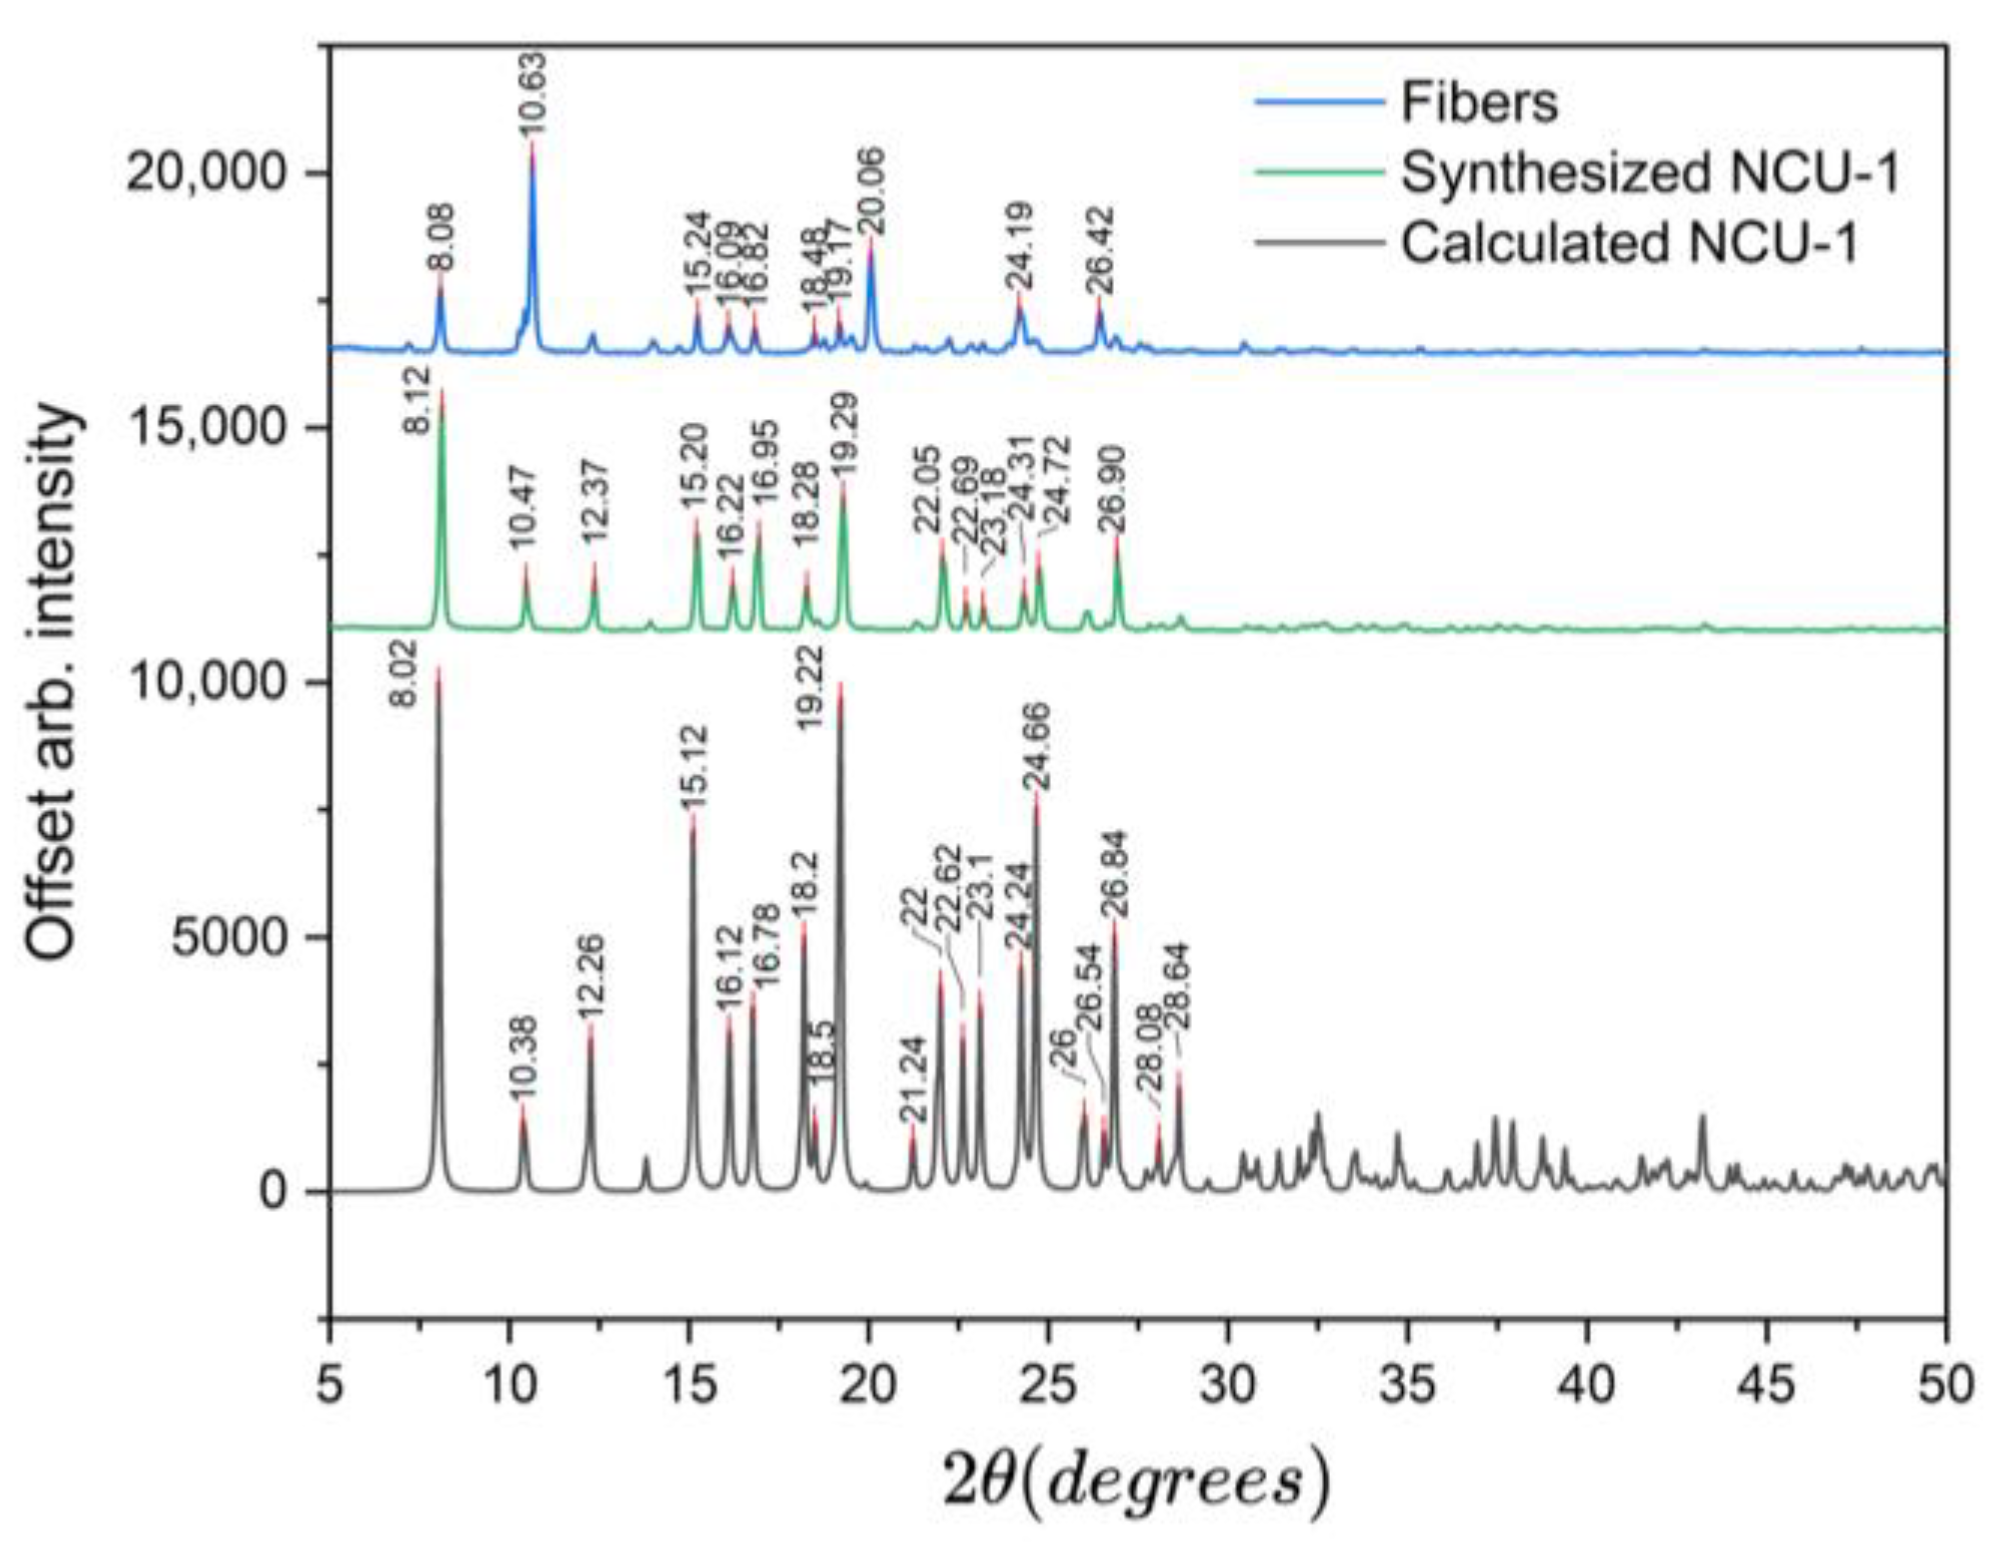
−1 is due to the -COOH group. PXRD analysis of NCU-1 showed peaks on or very near to those of the calculated peaks generated by previous researchers [
7]. The observed peaks at 8.12°, 10.38°, 15.12°, 16.22°, 16.78°, 18.28°, 19.20°, 22.20°, 24.30°, and 26.80° closely correspond to the calculated diffraction pattern of the reported NCU-1 structure (
Figure 3). Similar peak heights indicate crystal growth that is to be expected [
26].
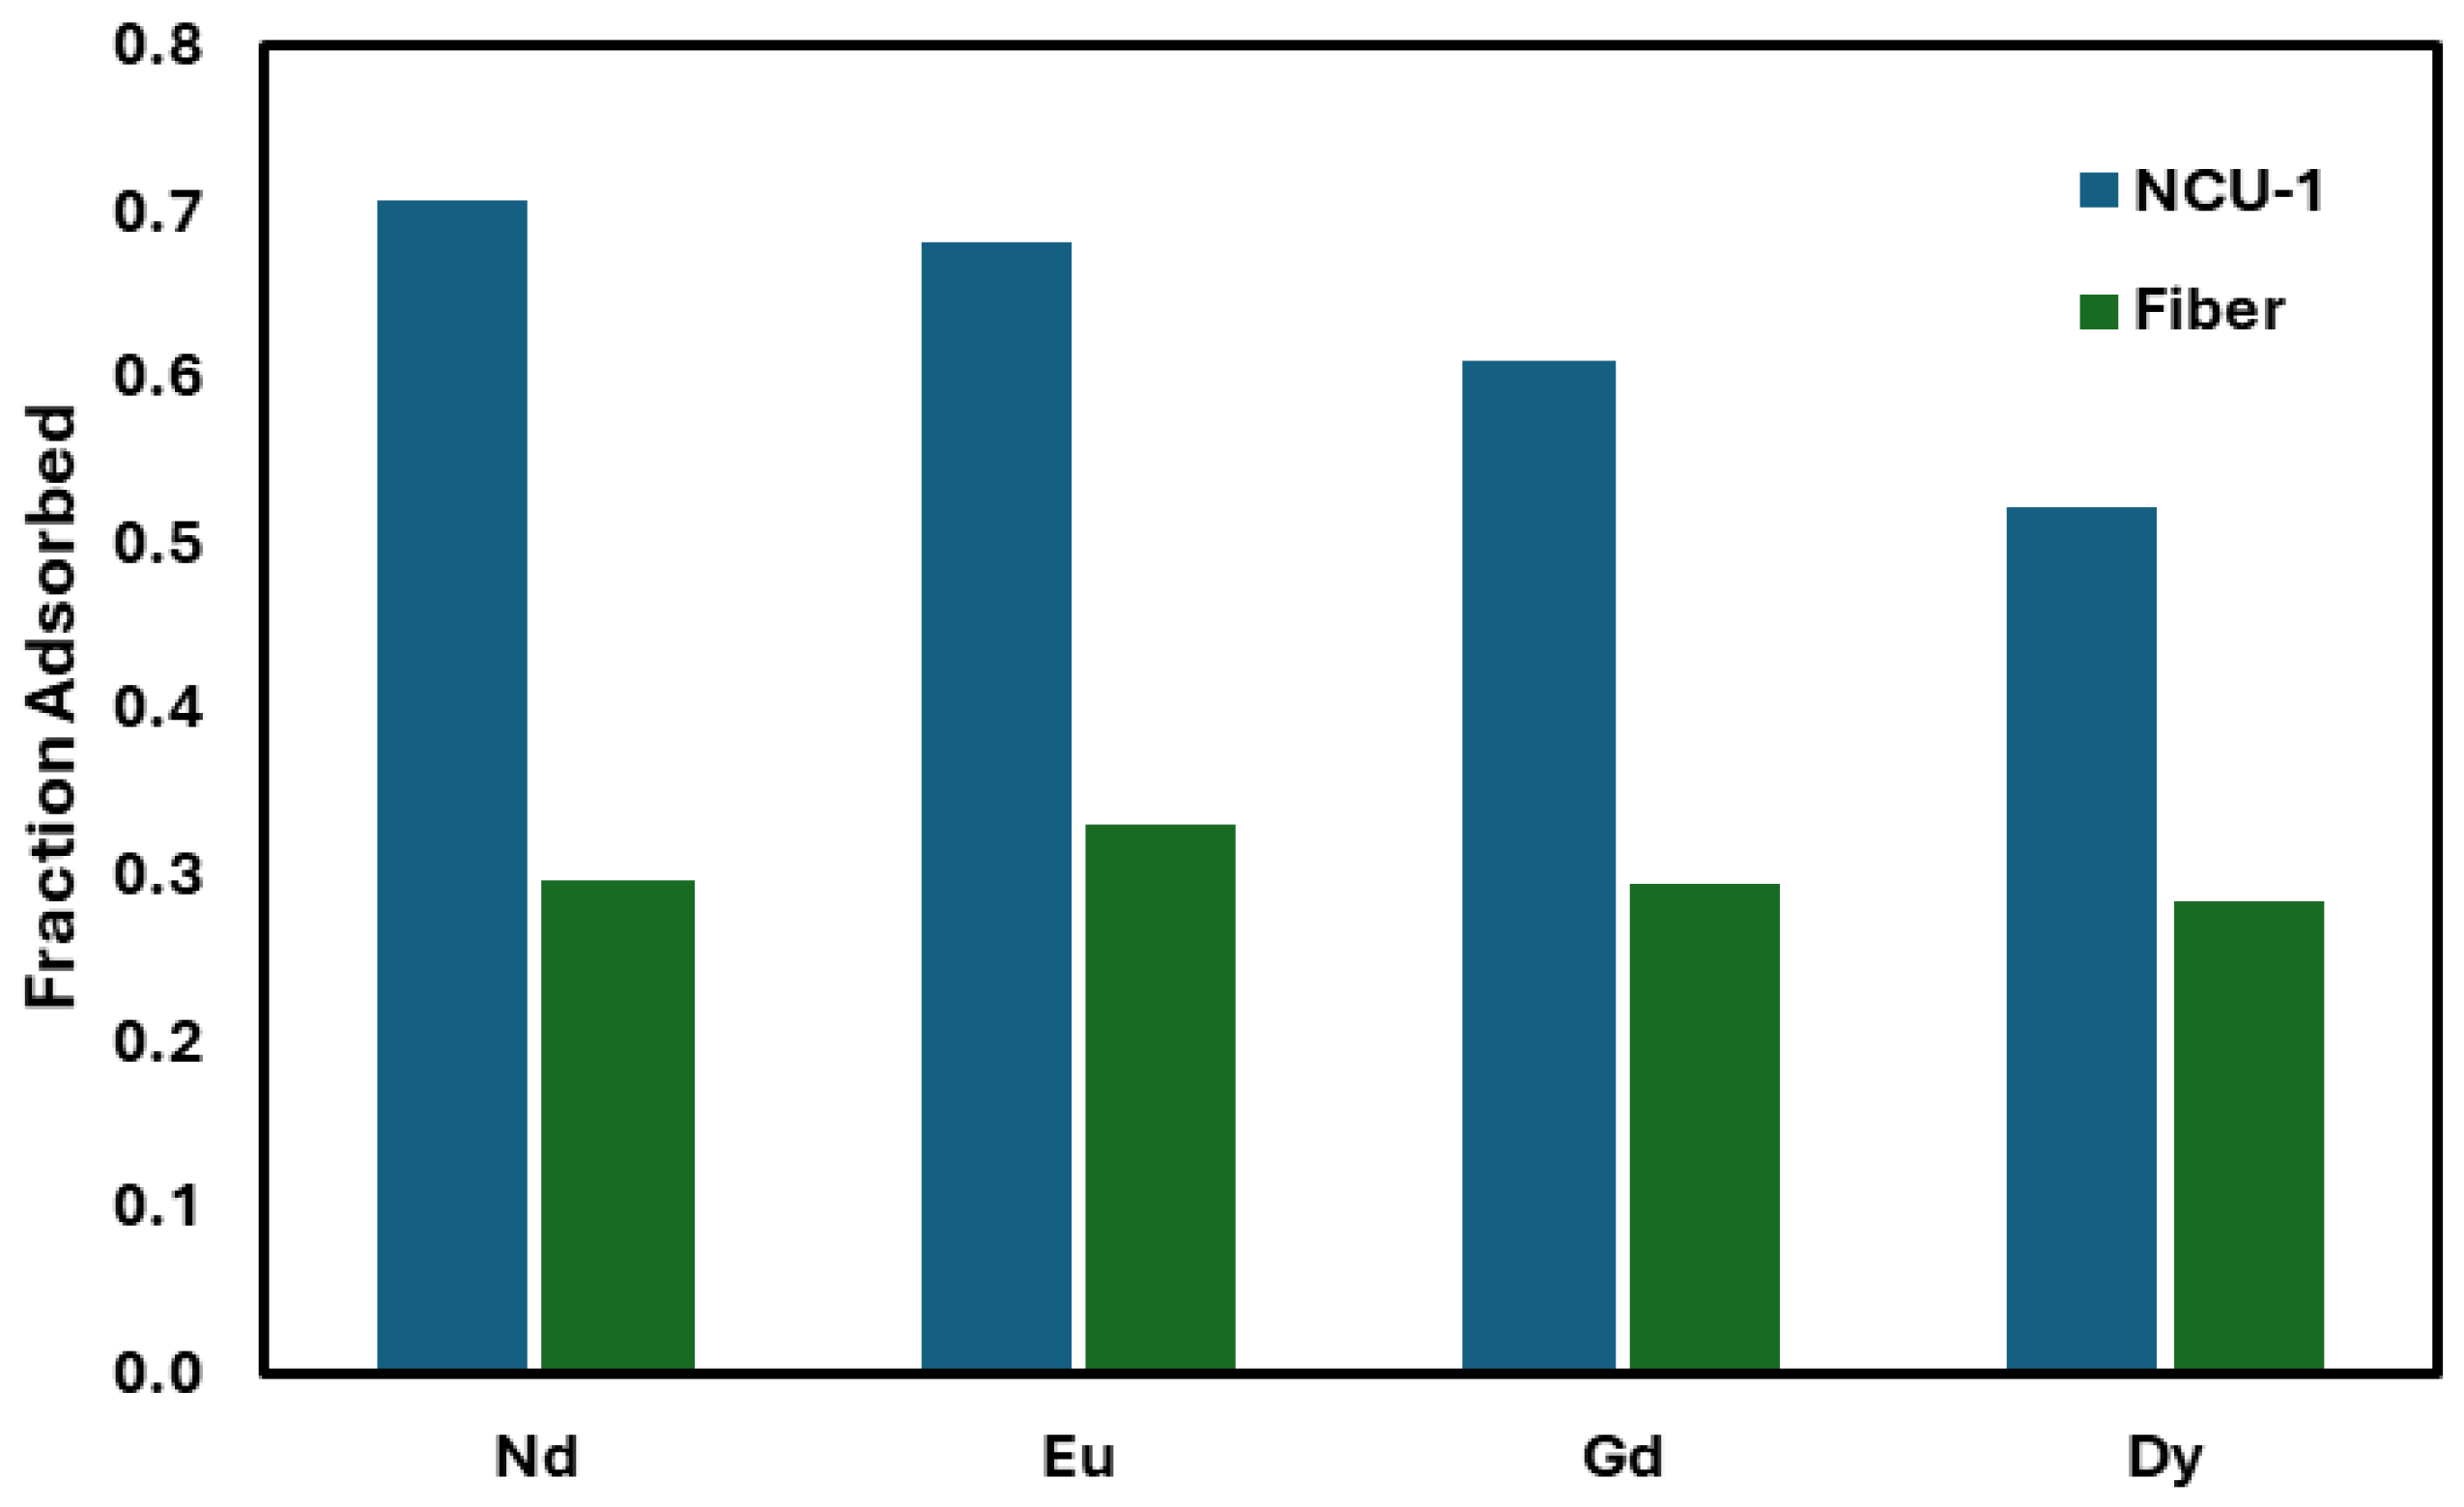
A batch loading test was performed on both NCU-1 and the fibrous material (
Figure 4). The fibers were shown to load at about half the capacity of the NCU-1 with less of a pronounced separation between lanthanides.
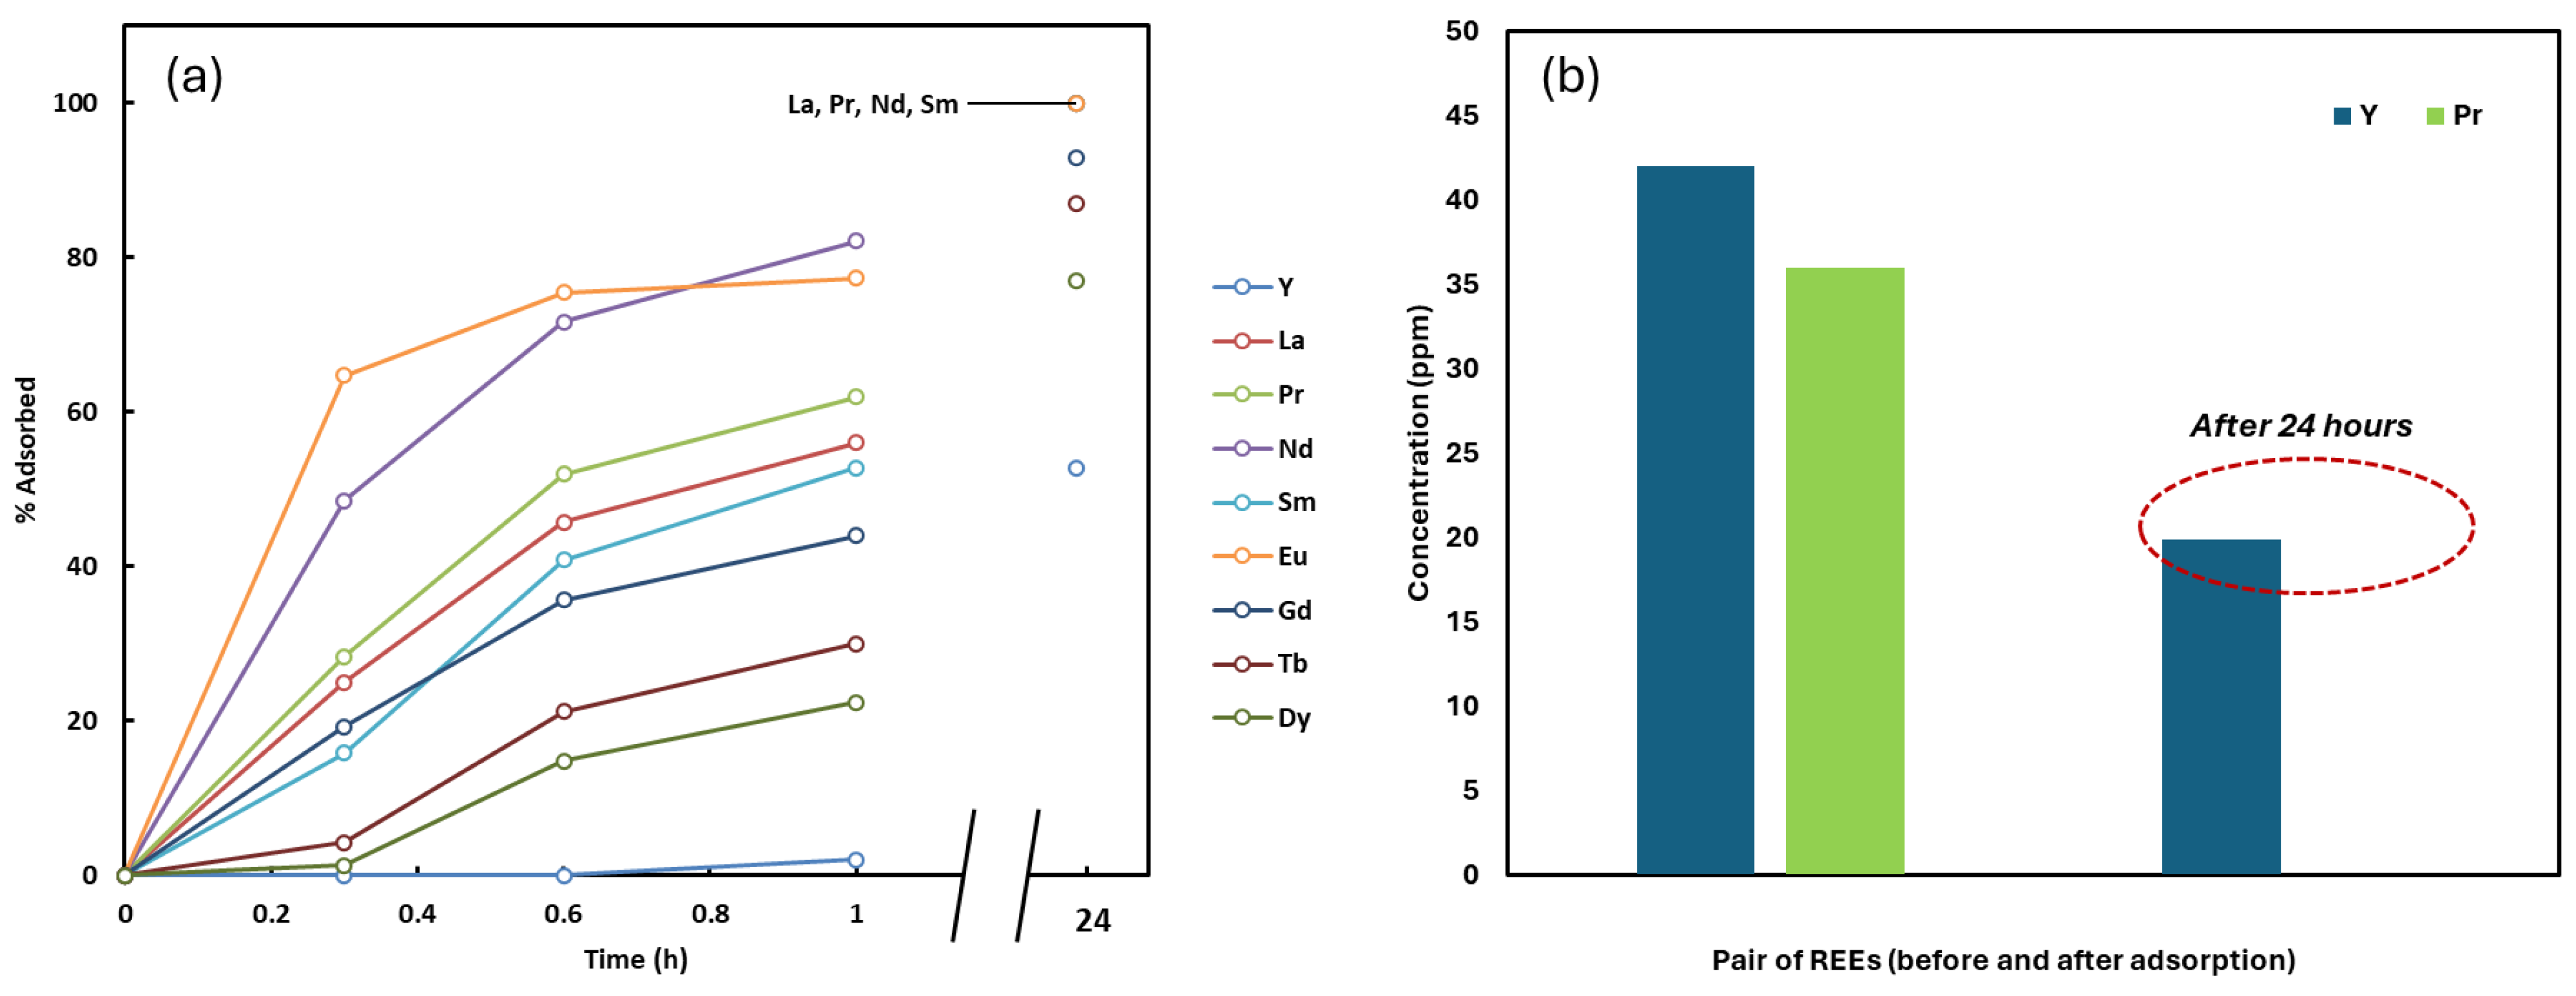
A total of 0.03 g of NCU-1 was introduced into 5 mL of a 50 ppm multicomponent solution containing Y, La, Pr, Nd, Sm, Eu, Gd, Tb, and Dy. The suspension was agitated at 200 RPM, and aliquots were collected after 20, 40, and 60 min, as well as after 24 h of contact (
Figure 5).
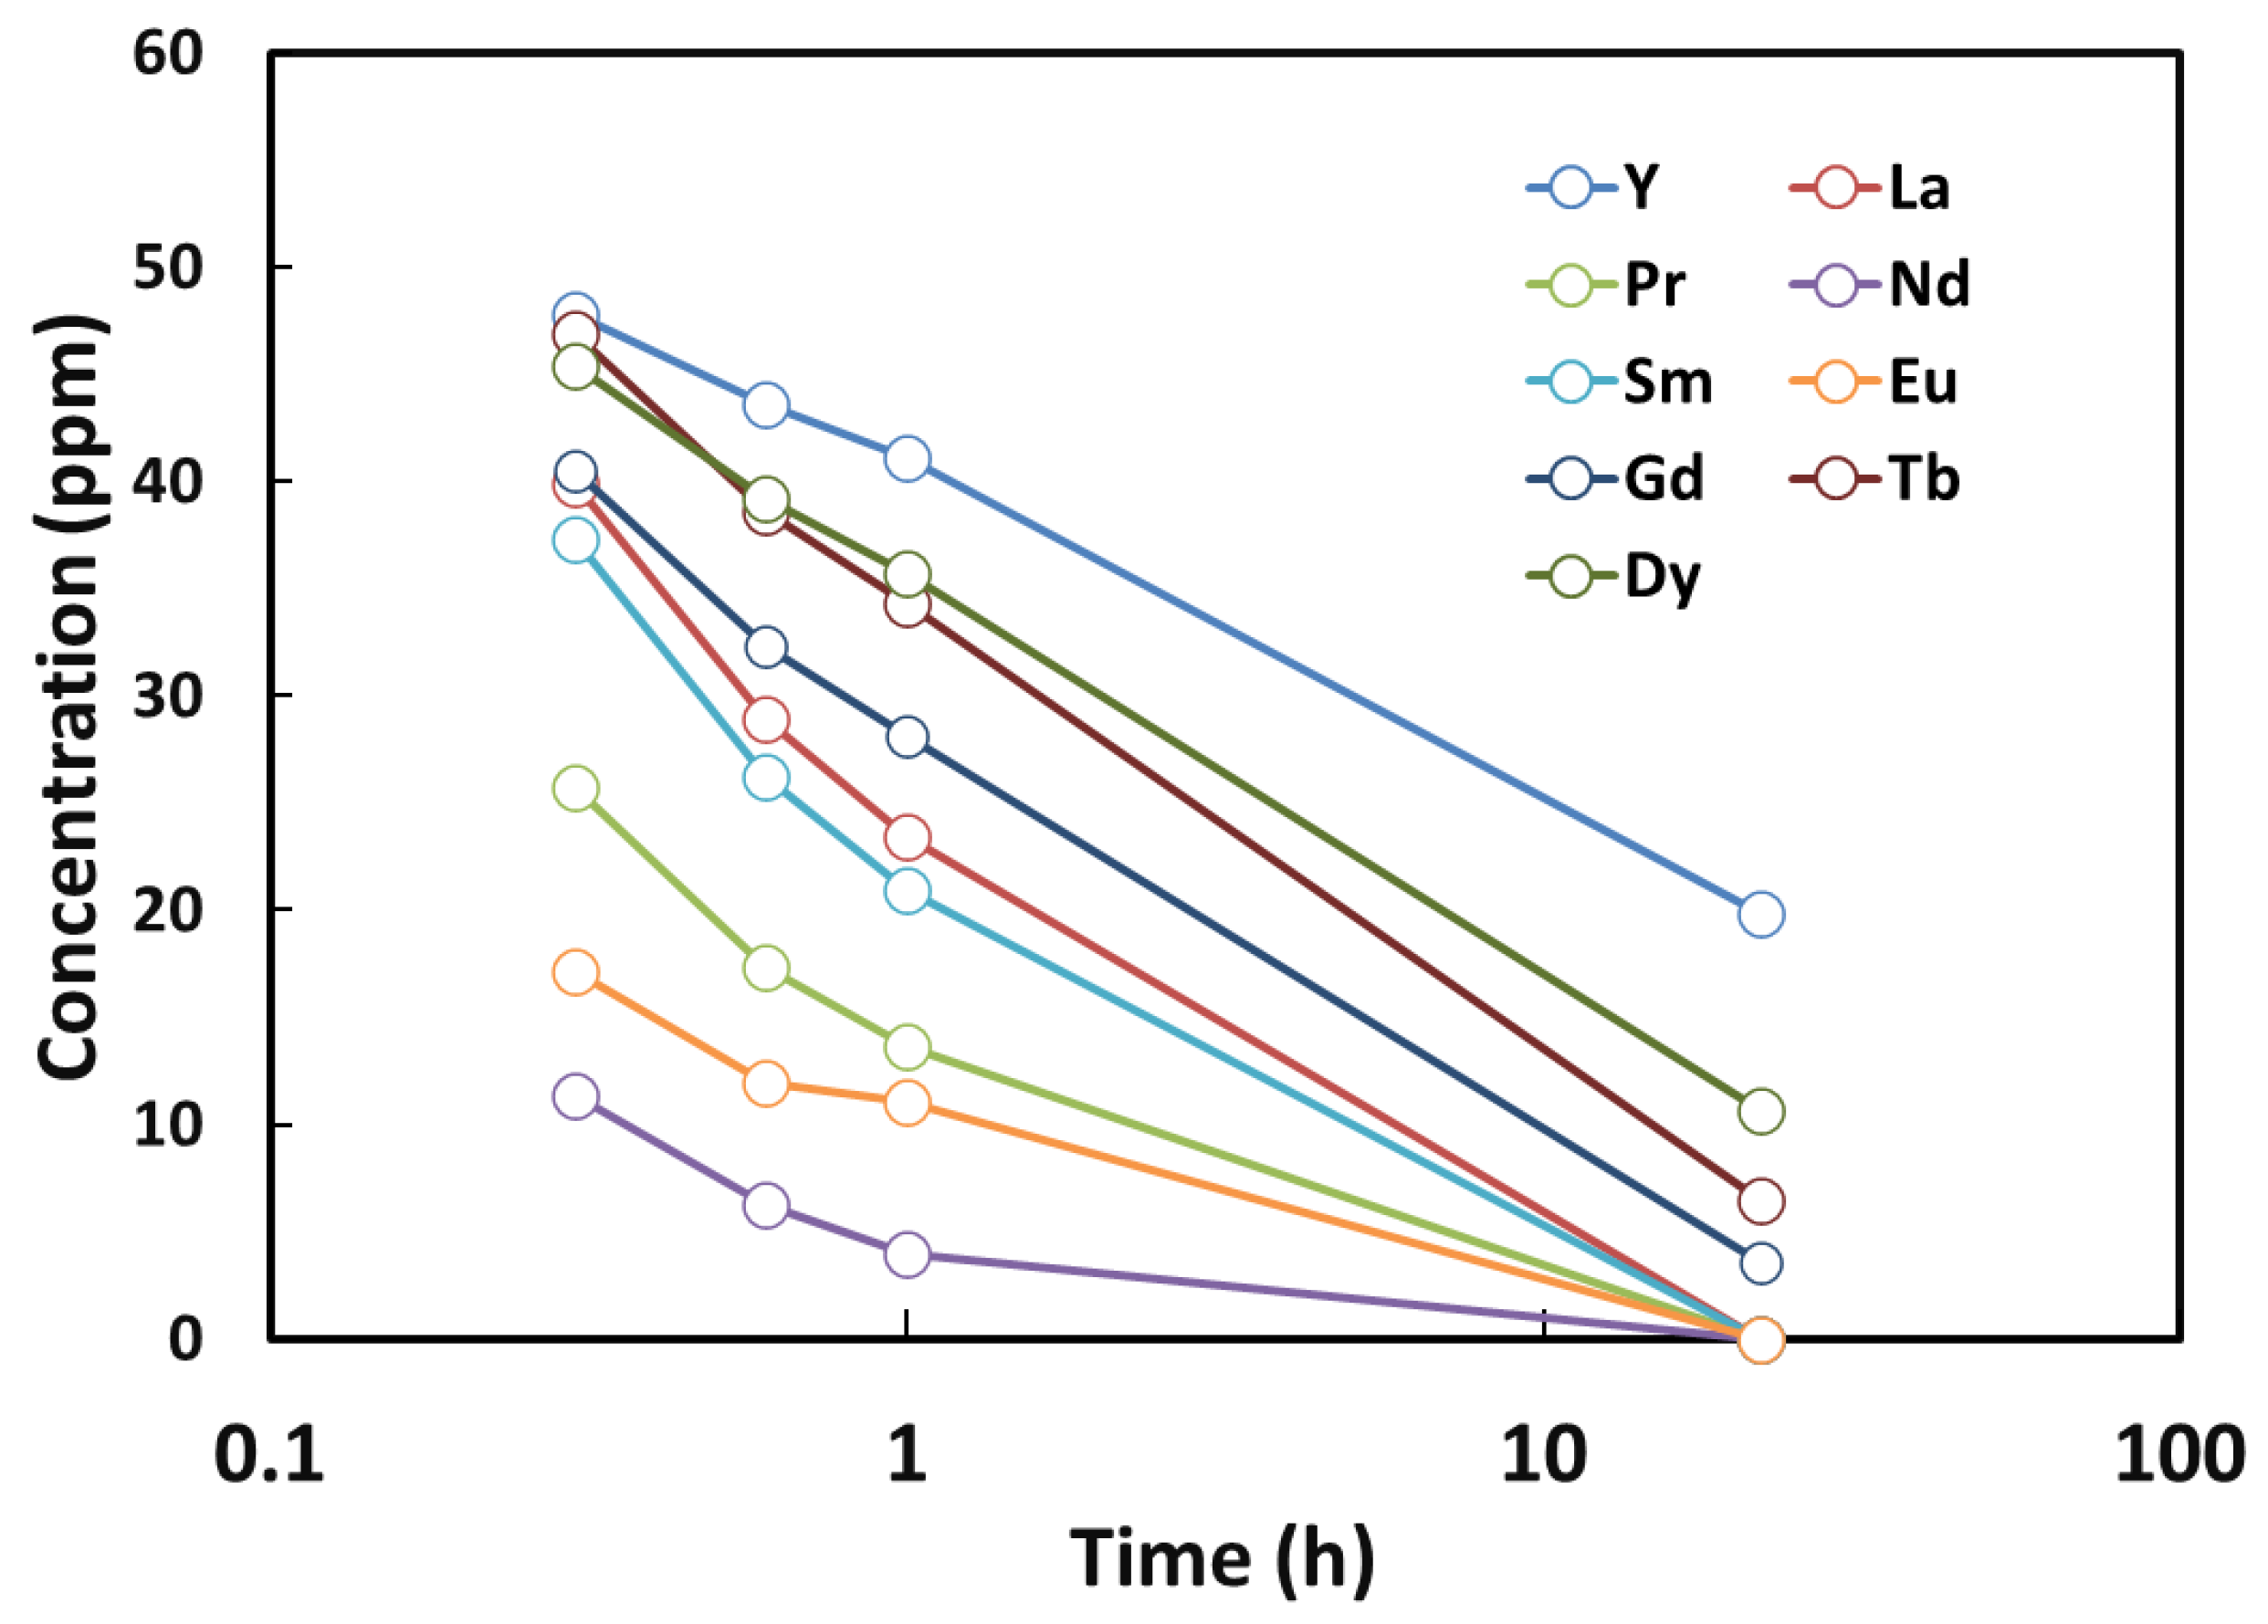
An interesting observation was made when starting with a mixed solution containing Nd, Eu, Pr, Sm, La, Gd, Tb, Dy, and Y. After 24 h of adsorption, a distinct separation behavior was observed. Nd, Eu, Pr, Sm, and La were completely adsorbed into the NCU crystals, whereas Y, Dy, Tb, and Gd remained partially unadsorbed and were still present in the solution phase. In other words, the adsorption rate appeared to be proportional to their initial concentrations, as indicated by the linear relationship observed when plotting concentration versus log(time) (
Figure 6). This selective adsorption behavior suggests that the process could be effectively utilized for the separation of Y, Dy, Tb, and Gd from Nd, Eu, Pr, Sm, and La under similar concentration conditions as demonstrated in our study.
The adsorption profiles revealed a systematic preference following the order:
During the initial adsorption phase (0–1 h), this order remained largely consistent, reflecting a structured progression in uptake (
Figure 6). However, after 24 h, nearly complete adsorption of La, Pr, Eu, and Nd was observed, while Y, Dy, Tb, Gd, and Sm remained partially adsorbed.
This adsorption behavior correlates closely with ionic radius trends of the rare-earth elements, given by:
Accordingly, ions with larger radii (La, Pr, Nd, Eu) exhibited preferential uptake, while ions with smaller radii (Dy, Tb, Gd) showed reduced affinity. Two mechanistic factors may explain this observation:
Steric compatibility within NCU-1 pores: Ions with larger radii may have better compatibility with the pore geometry and available adsorption sites, allowing for stronger interaction with carboxylate and triazole donor sites within the framework. Higher donor site interaction increases the dehydration of the adsorbed ions [
27].
Hydration energy effects: Ions with smaller radii (e.g., Dy3+) typically possess higher charge density, leading to stronger hydration shells. This makes them less likely to dehydrate and interact with the NCU-1 surface, thereby reducing their adsorption efficiency.
The adsorption results obtained with NCU-1 align well with previously known trends in REE3+ coordination chemistry. Specifically, the preferential uptake of larger, light rare-earth ions (La, Pr, Nd, Eu) over smaller, heavy rare-earth ions (Dy, Tb, Gd) can be rationalized in terms of steric and hydration effects, similar to those reported for REE3+ inner sphere chloroaqua complexes. In hydrothermal systems, steric hindrance reduces chloride coordination as ionic radius decreases, leading to greater stability and preferential transport of light REE3+. By analogy, the enhanced adsorption of larger REE3+ ions on NCU-1 suggests that steric accessibility within the framework pores and reduced hydration energy favor light REE3+ binding.
The sorbent characterization provides further insight into the adsorption mechanism of REEs. Hu et al. used XPS and FTIR spectra to reveal the presence of oxygen-containing functional groups that act as primary binding sites for REE ions [
7]. Their post-sorption SEM-EDX analysis confirms the surface distribution of adsorbed metals, while L3-edge XANES measurements verify that all adsorbed REEs remain in the trivalent oxidation state. Moreover, their EXAFS analysis demonstrates direct coordination between REE ions and oxygen functionalities, confirming inner-sphere complexation on the sorbent surface [
7,
28]. Interestingly, adsorption capacity was found to increase with increasing ionic radius (La > Dy > Lu), consistent with the trend of decreasing charge density and hydration energy across the REE series. Distribution coefficient calculations highlight that this effect is most pronounced at lower solution concentrations, where binding sites are most available. Together, these results underscore the dual role of structural and electronic factors in governing REE uptake on the sorbent surface.
Taken together, these results highlight that cation size and hydration behavior are critical factors governing selective adsorption on NCU-1. The strong correlation between ionic radius and uptake suggests that this material could be exploited for radius-dependent separation of rare-earth elements.
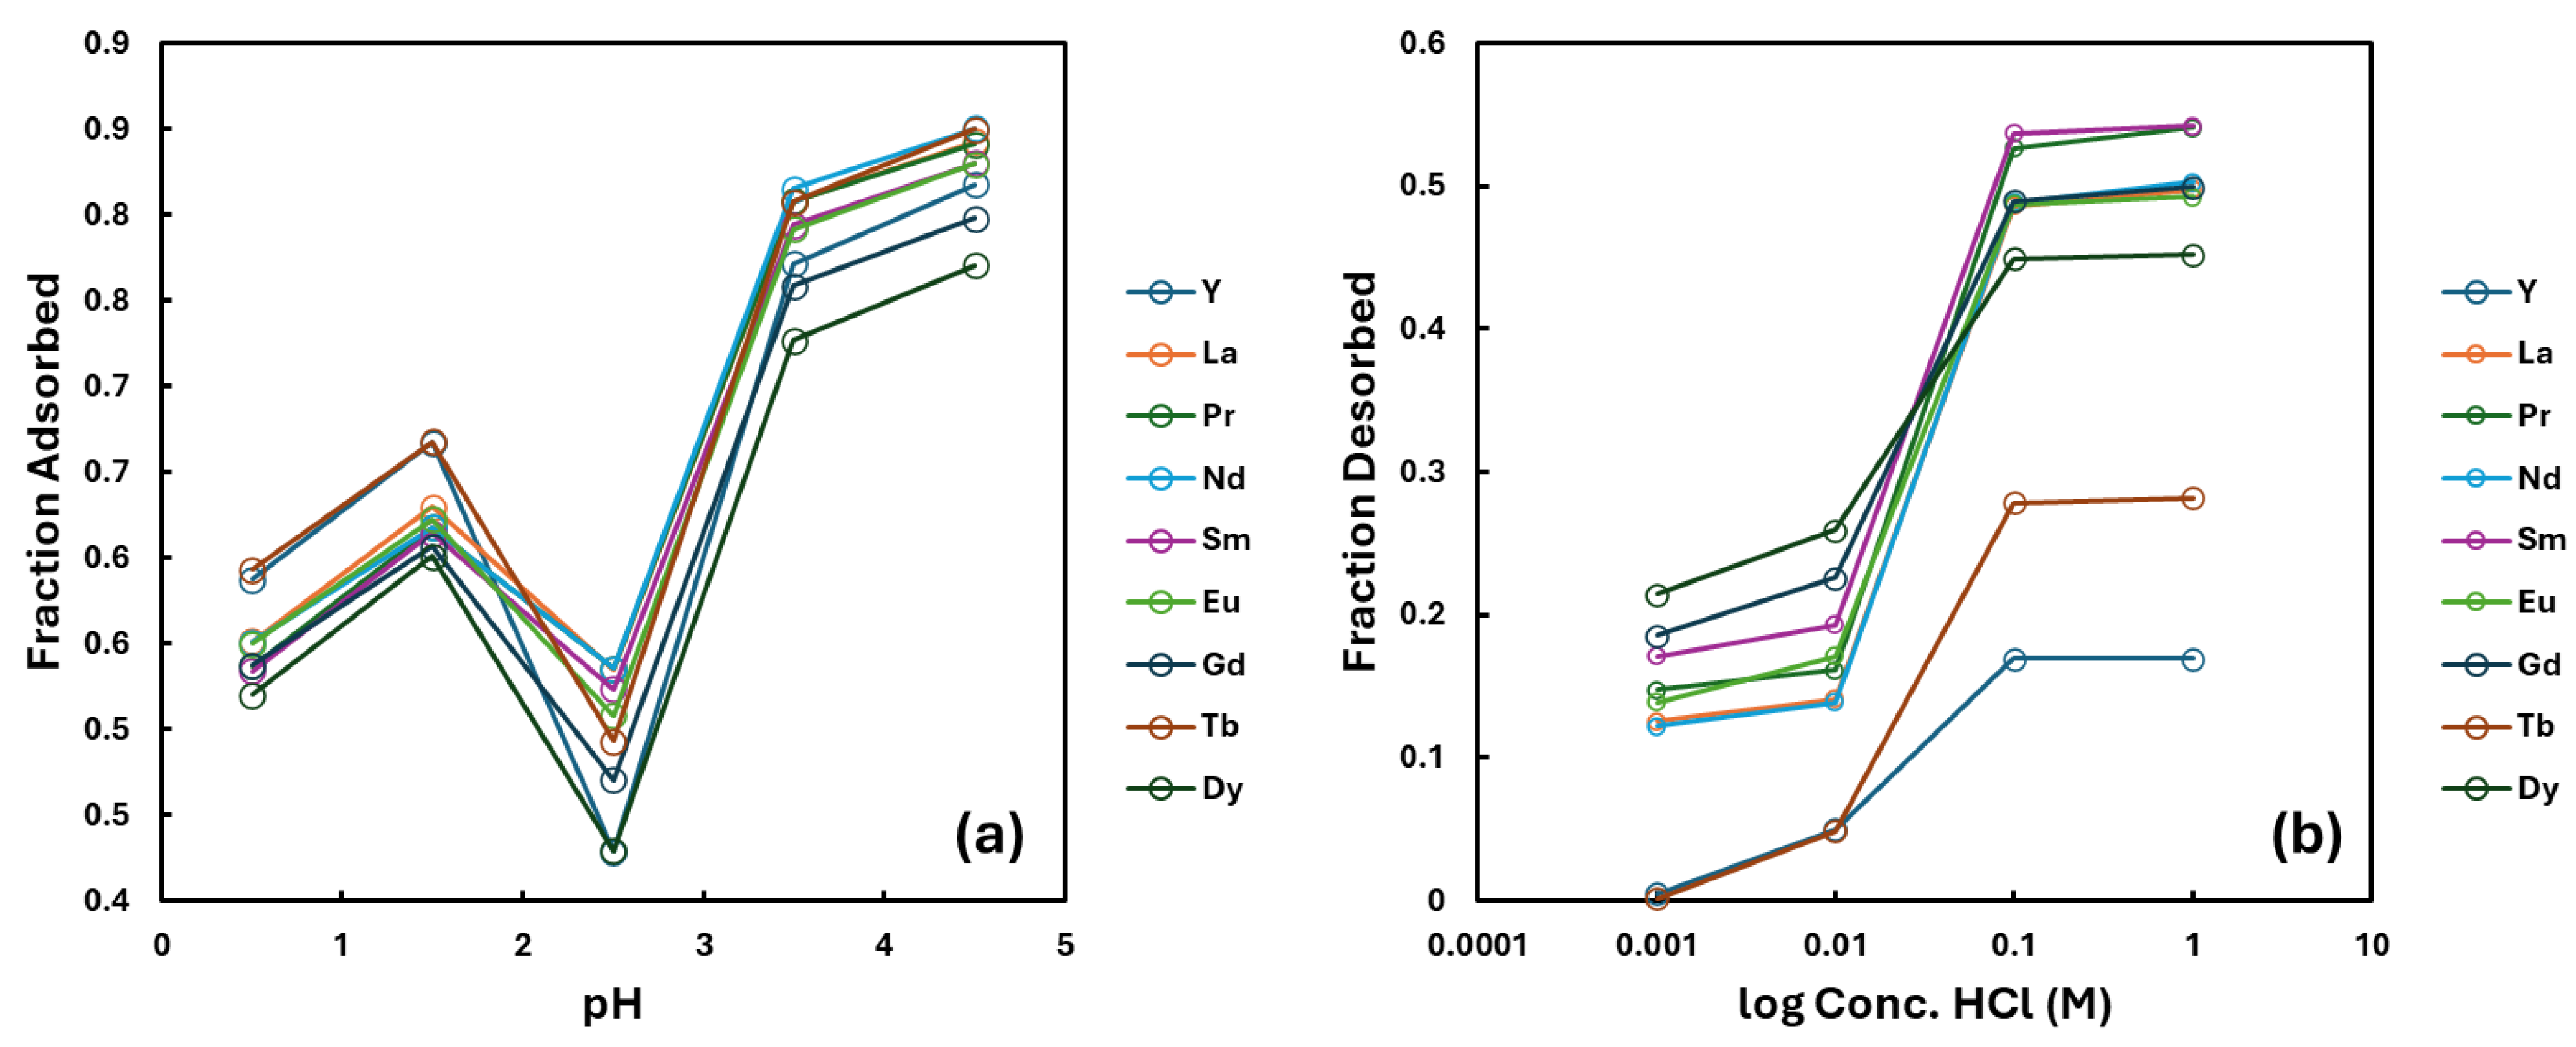
Following general adsorption trends, NCU-1 showed increased selectivity for Y and Tb with decreasing pH (
Figure 7). The large drop in adsorption near pH 2.5 can be attributed to structural instability of NCU-1 near that pH, causing partial dissolution or restructuring. Samples at pH 2.5 containing NCU-1 developed noticeable turbidity, consistent with material degradation. No turbidity was visible under other pH conditions. Additionally, researchers previously reported XRD scans of NCU-1 that showed a strong reduction in the height of some peaks after exposure to a solution of pH 2 [
4].
Less than 30% of each REE was desorbed at hydrochloric acid concentrations of 0.01 M or lower, and at 0.001 M, almost no Tb or Dy was released (
Figure 7). When the acid concentration was increased to 0.1 M or higher, the desorption of REEs lighter than Tb rose to above 40%, while Tb and Dy reached approximately 30% and over 16%, respectively.
Pseudo-first Order (PFO) Kinetics
The pseudo-first-order (PFO) model is one of the simplest and most widely used models to describe adsorption kinetics [
29]. It assumes that the rate of adsorption at any given time is directly proportional to the number of unoccupied adsorption sites on the sorbent surface.
The rate equation can be given as:
where
Upon integration and rearrangement, we obtain the linear form:
Thus, if adsorption follows the PFO model:
Note that it makes the model easy to apply experimentally and provides insights into how quickly a system approaches equilibrium. However, PFO often works best for the early stage of adsorption, especially when adsorption occurs through physisorption (weak interactions) rather than chemisorption.
Pseudo-second Order (PSO) Kinetics:
The adsorption kinetics were further analyzed using the pseudo-second order (PSO) model [
30], which assumes that the rate-limiting step may be chemical adsorption involving valence forces through sharing or exchange of electrons between sorbent and sorbate [
31].
where
To apply this model, experimental t versus
qt data from
Table 1 were plotted as t/
qt against t. The slope of the linear fit yields 1/
qe, while the intercept provides 1/(
k2qe2). From these, both
qe and
k2 were calculated for each rare-earth element.
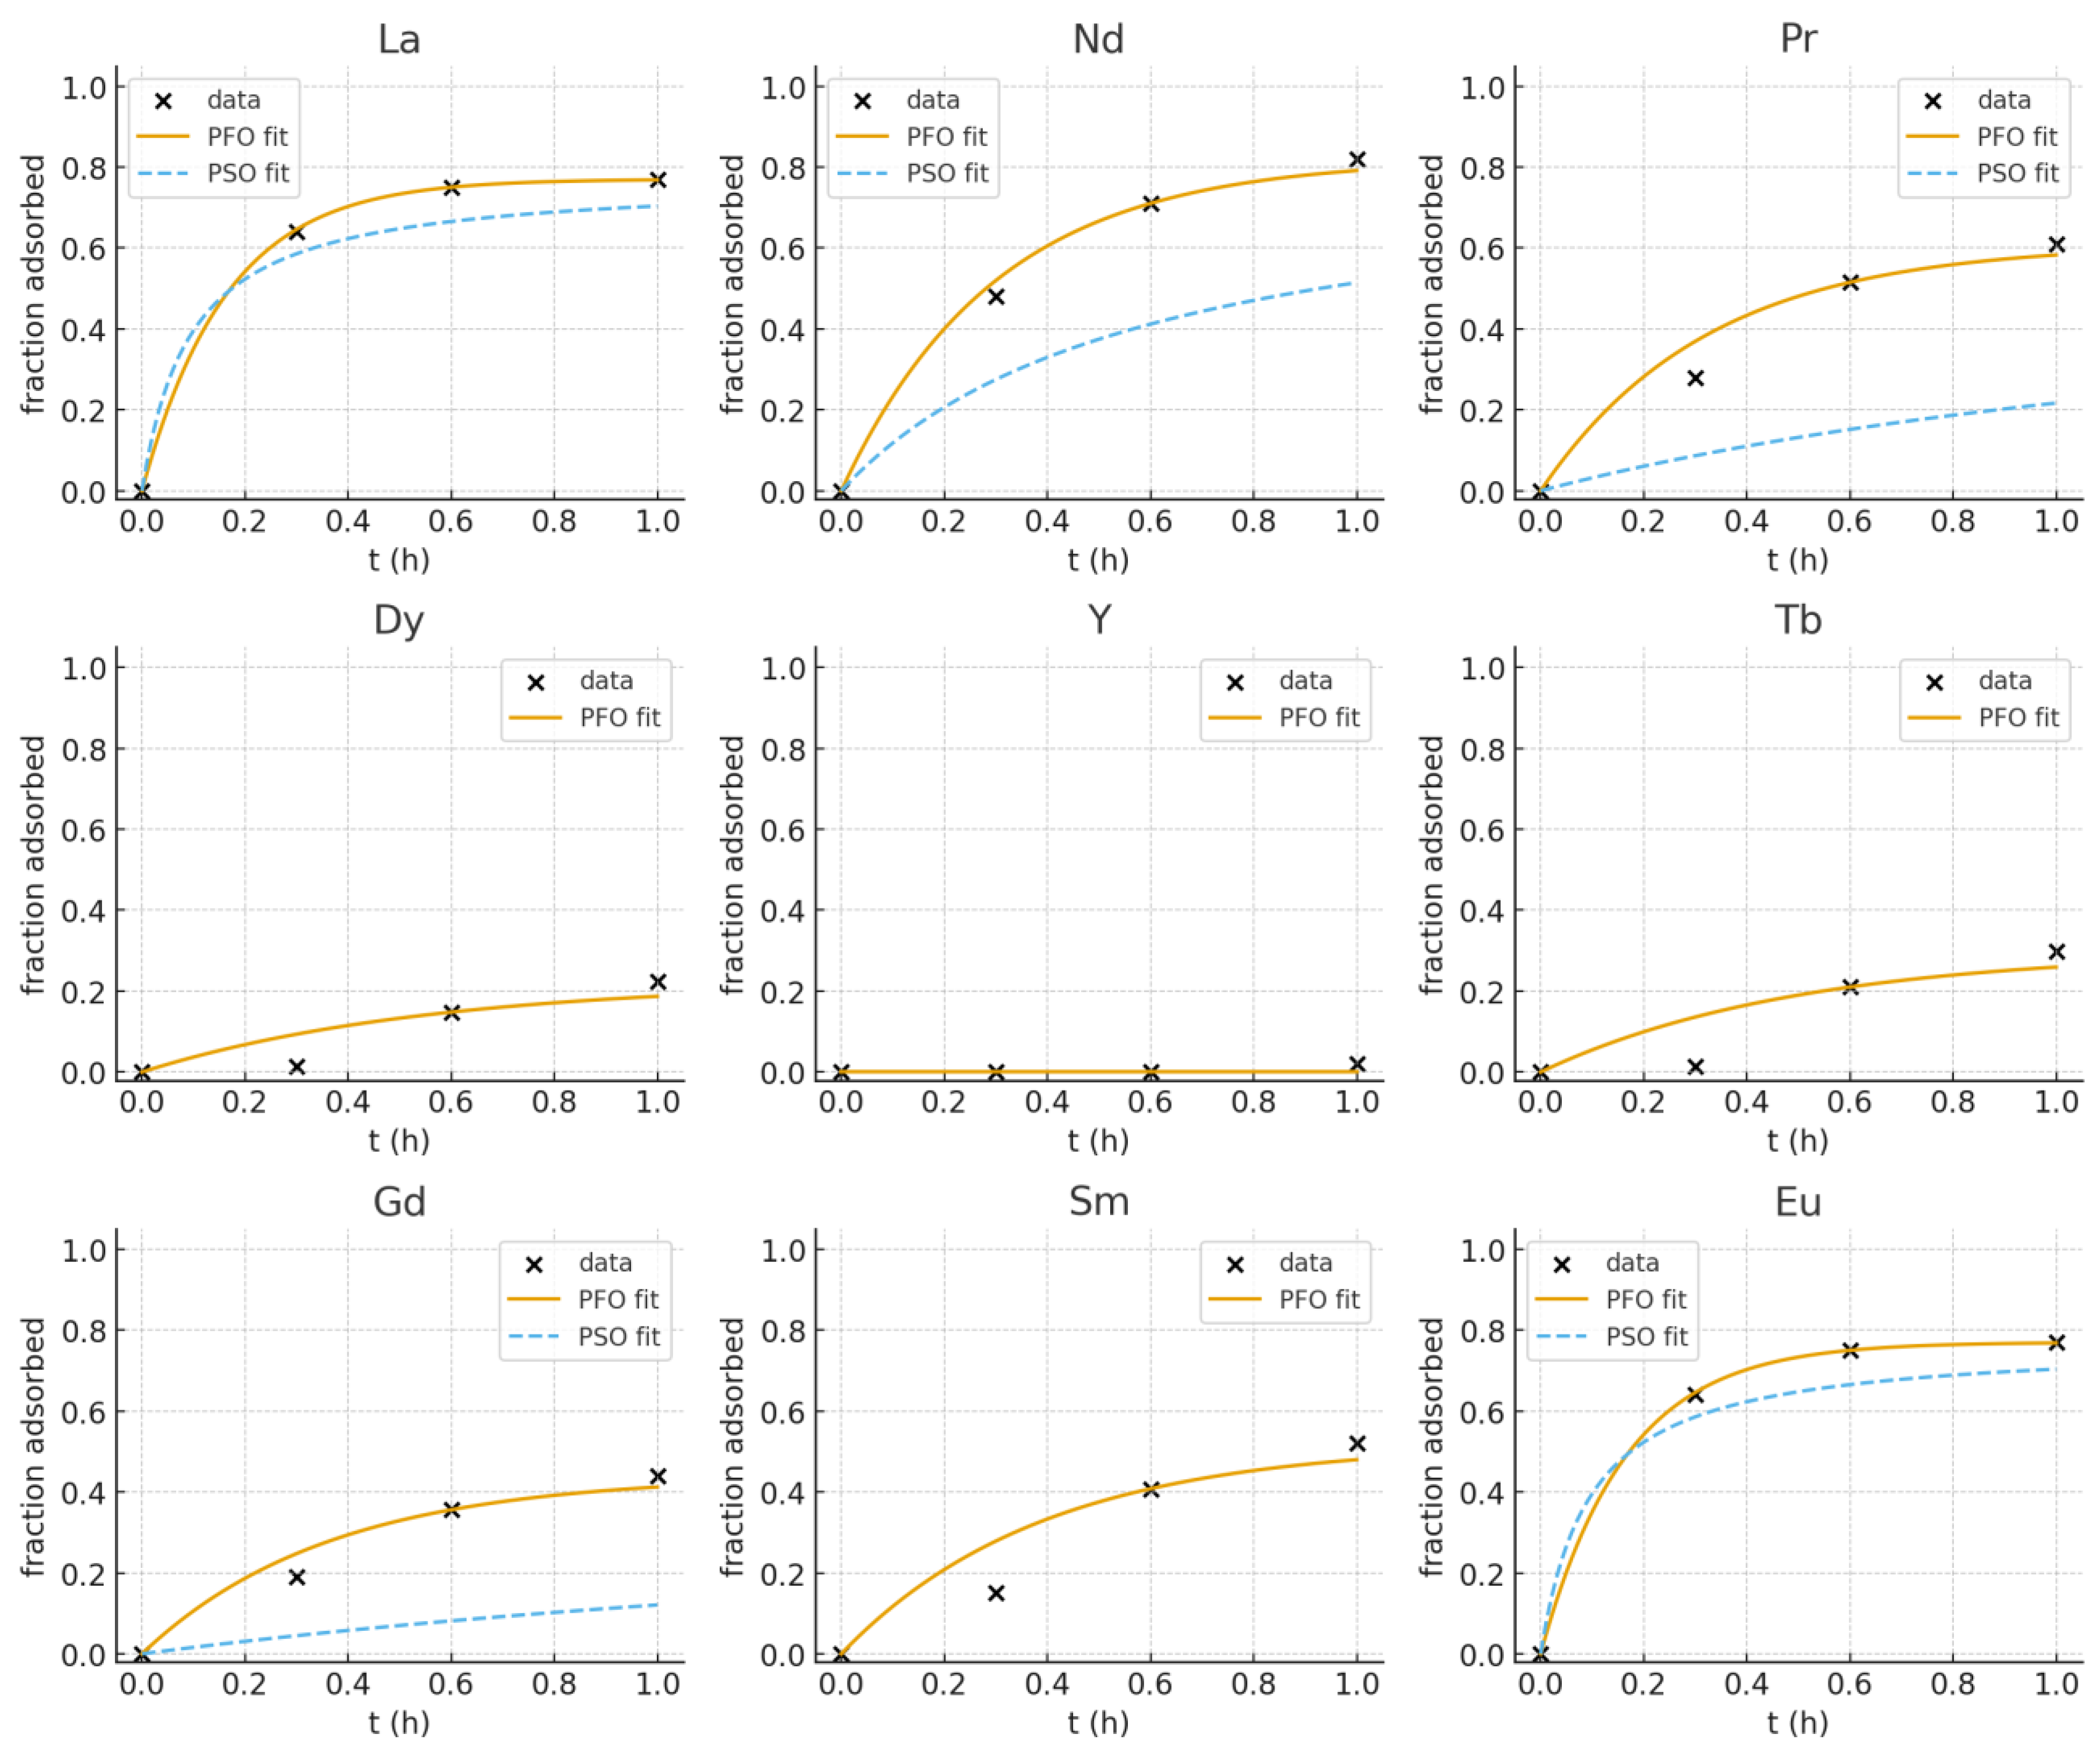
Adsorption kinetics of REE3+ on the mesoporous NCU sorbent were evaluated using both pseudo-first order (PFO) and pseudo-second order (PSO) models. Linear PFO fits (ln(qe − qt) vs. t) provided consistently better descriptions of the measured uptake curves across the analytes studied, with particularly strong single-exponential behavior observed for La and Eu (k1 ≈ 6.08 h−1, R2 ~ 0.9998). Nd3+ and Pr3+ exhibited moderately fast kinetics (k1 ≈ 3.35 and 3.10 h−1). Gd3+, Sm, and Tb exhibited intermediate rates (k1 ≈ 2.0–2.8 h−1), while Dy3+ adsorbed more slowly (k1 ~ 1.8 h−1) and Y showed significantly less uptake under the present conditions. PSO linearization occasionally produced nonphysical parameter estimates for low-uptake series; therefore, PFO is reported as the preferred empirical kinetic model for this dataset. The kinetic trend (La ~ Eu > Nd ≈ Pr > Gd ≈ Sm ≈ Tb > Dy > Y) supports a mechanism in which adsorption affinity and rate correlate with REE ionic radius and surface interaction strength. Future work with extended time series and denser early-time sampling is recommended to resolve potential multi-step transport limitations.
The adsorption kinetics of REEs on NCU structures followed distinct trends. La and Nd showed rapid uptake, with equilibrium reached within 1 h and pseudo-first-order rate constants (k
1) of ~6.3 h
−1 and ~3.8 h
−1, respectively. Pr presented a moderate adsorption rate (k
1 ≈ 2.5 h
−1), while Dy and Y adsorbed only weakly, with rate constants below 1 h
−1. These observations suggest that lighter rare-earth elements (La, Nd, Pr), having relatively larger ionic radii, interact more strongly with the sorbent surface than heavier REEs (Dy, Y). The kinetic data thus supports the hypothesis that adsorption is size-driven, favoring larger ions. The trend is shown (matplotlib generated plots from original data) in
Figure 8.
