Article

Role of Shear-Thinning-Induced Viscosity Heterogeneity in Regulating Fingering Transition of CO2 Flooding Within Porous Media

1
CNPC Tubular Goods Research Institute, Xi′an 710077, China
2
College of Mechanical and Electrical Engineering, Shaanxi University of Science and Technology, Xi’an 710021, China
*
Author to whom correspondence should be addressed.
Processes 2025, 13(12), 3771; https://doi.org/10.3390/pr13123771
Submission received: 22 October 2025 / Revised: 12 November 2025 / Accepted: 13 November 2025 / Published: 21 November 2025
(This article belongs to the Section Chemical Processes and Systems)

Abstract

During the process of CO2 displacing shear-thinning oil, the occurrence of fingering is a key factor contributing to a reduction in both displacement and sequestration efficiency. Existing studies typically use the average viscosity to calculate the viscosity ratio M for shear-thinning oil, overlooking the non-uniform viscosity distribution resulting from uneven shear stress. Consequently, a phase diagram based on M fails to accurately capture the underlying mechanism influencing fingering. We investigate the influence of shear-thinning on fingering patterns by analyzing viscosity heterogeneity during immiscible CO2 flooding in porous media. The results showed the following: (1) An increase in zero-shear viscosity (μ0) resulted in a greater viscosity difference between the two phases, which intensified interface instability, and the power-law index (n) diminished the shear-thinning effect, promoted fingering formation, and significantly reduced displacement efficiency, with a maximum reduction of 28.6% observed in this study. (2) Shear-thinning oil was more prone to capillary fingering compared to Newtonian oil under the same capillary number Ca and viscosity ratio M. (3) Intense pressure fluctuations at the displacement front combined with non-uniform viscosity distribution exacerbate interfacial instability and make shear-thinning oil more prone to capillary fingering. This study provides guidance for optimizing displacement strategies for shear-thinning fluids and advancing the practical implementation of CO2 flooding technology.

1. Introduction

China is a major producer of coal and oil [1]. Carbon capture, utilization, and storage (CCUS) technology has emerged as a critical pathway toward achieving carbon neutrality [2,3,4,5]. Within the CCUS framework, CO2 flooding has garnered significant attention due to the dual advantages of enhancing oil recovery and enabling carbon sequestration [6,7,8,9,10,11]. However, during the displacement process, the pronounced differences in physical properties between CO2 and reservoir fluids often trigger interfacial instabilities, resulting in the development of fingering patterns that substantially reduce displacement efficiency [12,13,14,15,16,17]. A major challenge is posed to the effective implementation of CO2 flooding. Consequently, a thorough understanding of the mechanisms governing fingering formation and evolution is essential for CO2 flooding.
In existing research on the fingering of CO2 flooding, the oil phase is typically simplified as a Newtonian oil, and the two-phase flow dynamics of CO2 displacing Newtonian oil have been extensively investigated [18,19,20]. Early experimental studies employed a Hele-Shaw device composed of two parallel transparent plates, which first revealed the characteristic finger-like displacement pattern [21,22]. Subsequent investigations using transparent etched glass micromodels systematically explored two-phase displacement behaviors [23,24]. These studies demonstrated that displacement patterns are governed by the capillary number (Ca) and viscosity ratio (M) of CO2 and oil and can be classified into three regimes: capillary fingering, viscous fingering, and stable displacement [25,26,27,28]. A phase diagram constructed in the log Ca − log M parameter space delineates the boundaries among these regimes, and a transitional region exhibiting “crossing” behavior associated with multiple fingering modes is observed in the intermediate zone [29,30]. At high Ca, interfacial instability is reduced, promoting a more stable displacement mode. Conversely, at low Ca and high M, the occurrence of fingering is more likely. These findings comprehensively confirmed that the formation of fingering during the CO2 displacement of Newtonian oil is governed by the synergistic interaction between capillary and viscous forces.
Under reservoir conditions, underground crude oil contains paraffin, surfactants, suspended particles, and other substances, leading to pronounced non-Newtonian behavior, particularly exhibiting shear-thinning characteristics [31,32,33]. This rheological property causes fluid viscosity to vary dynamically with shear stress, significantly influencing the stability of the two-phase displacement front [34,35]. The characteristics of fluids and reservoir conditions have a profound impact on reservoir modification [36]. Differences in fluid viscosity, wettability, and factors such as the pore structure and permeability of the reservoir significantly affect the flow behavior of fluids in porous media and displacement efficiency [37]. Therefore, a thorough understanding of the interactions among these factors is essential for optimizing CO2 flooding technology and enhancing recovery rates [38]. Previous studies have shown that during the CO2 displacement of shear-thinning fluids, the power-law index (n) and zero-shear viscosity (μ0), as two critical rheological parameters, jointly determine the viscosity response to variations in shear stress and exert effects on interfacial stability. Specifically, as either n or μ0 increases, the shear-thinning effect becomes weaker, thereby making the occurrence of fingering more likely [39]. In previous studies, the viscosity of shear-thinning fluids was typically simplified as an average value. Through the analysis of the viscosity ratio between CO2 and shear-thinning fluids, it was found that the shear-thinning behavior results in a higher viscosity ratio M. Based on this, a Ca-M fingering phase diagram can be constructed for shear-thinning fluids, and the resulting pattern transition characteristics are similar to those observed in shear-thinning fluids [40]. Omrani developed a computational approach to evaluate and upscale the dispersion of a solute in the flow of a shear-thinning (ST) fluid in a heterogeneous porous medium [41]. And Al-Qenae created a porous medium using glass micromodels to verify spatially variable viscosity [42]. However, the most commonly adopted approach to calculating M in CO2–shear-thinning fluid systems relies on the effective viscosity of shear-thinning fluids, which neglects the viscosity heterogeneity arising from the non-uniform shear stress distribution during displacement in porous media. However, the unevenness of the viscosity distribution can further enhance the disturbances and instabilities in the two-phase flow during displacement, which is a key factor affecting the formation and development of fingering [43,44]. Analyzing the viscosity distribution can help address the shortcomings in existing research regarding fingering in shear-thinning fluids. Consequently, the Ca-M phase diagram based on effective viscosity cannot fully capture the influence of shear-thinning behavior on fingering dynamics.
In this study, to investigate the influence of the viscosity heterogeneity of shear-thinning oil on fingering patterns and their transitions, CO2 flooding processes were simulated with varying power-law indices (n) and zero-shear viscosities (μ0). The variance in fingering transitions under Newtonian and shear-thinning oil was compared, and corresponding phase diagrams were constructed. Through a detailed analysis of the pressure fields and the viscosity distributions along the displacement direction, the underlying mechanisms driving the formation of distinct fingering modes for shear-thinning fluids were revealed. These findings hold significant implications for optimizing shear-thinning oil flooding strategies and advancing the practical implementation of CO2 enhanced oil recovery technologies.

2. Numerical Modeling

2.1. Geometric Model

To simulate CO2 flooding, the model utilized in this study comprises a porous medium measuring 14.6 × 9 mm2 (as depicted in Figure 1). Within this model, cylinders represent solids, while purple areas denote flow regions. The centers of adjacent cylinders form an equilateral triangle array. Each cylinder has a diameter of 1 mm, with a spacing of 1.15 mm between adjacent cylinder centers, and the angle between two cylinders in adjacent columns is 60°. To introduce non-uniformity and randomness, 10 cylinders marked in pink are randomly selected, and their diameters are increased by 10%. The resulting model has a porosity of approximately 0.34. Initially, the porous medium is saturated with oil, which presents shear-thinning. The entire computational domain is discretized using a free triangular mesh. CO2 is then injected through the inlet at a certain pressure Pin, displacing the oil phase towards the outlet. Similar geometric models have been proven in previous experiments and numerical studies (such as Hele-Shaw [21] or microscopic model systems) to effectively reveal the fundamental mechanism of multiphase flow.

2.2. Governing Equations

For two-phase fluids, the velocity and pressure fields are determined using the same set of Navier–Stokes equations [45]:
t ρ u + · ρ u u = p + [ μ ( u + u T ) ] + F s t
· u = 0
where u is velocity, p is pressure, ρ and μ are density and dynamic viscosity, and Fst is the momentum source term generated by surface tension at the interface between two fluids. The phase field method was employed to track the interface, and the phase field variable constraints were satisfied:
ϕ t + u · ϕ = · γ λ ε 2 ψ
ψ = · ε 2 ϕ + ϕ 2 1 ϕ + ε 2 λ f ϕ
F s t = G f ϕ ϕ
where γ is mobility, ψ is a phase field auxiliary variable, λ* is mixing energy density, f is the total free energy of the system, and ε is a capillary width that scales with the thickness of the interface. Each phase is represented by a phase field variable ϕ, where ϕ = ±1 denotes the two distinct phases, and −1 < ϕ < 1 denotes the phase interface. The chemical potential G is derived from the total energy equation:
G = λ 2 ϕ + ϕ ( ϕ 2 1 ) ε 2 + f ϕ
For shear-thinning oil, the Carreau model is employed to characterize rheological behavior, effectively capturing the shear-thinning oil properties across a broad spectrum of shear rates [46]:
μ γ ˙ = μ + μ 0 μ 1 + ( λ γ ˙ ) 2 n 1 2
where γ ˙ is the shear rate of the fluid, n is the power-law index (n < 1), λ is the relaxation time (controls the characteristic shear rate at which the fluid deviates from the zero-shear plateau), μ0 is zero-shear viscosity, and μ is infinite-shear viscosity (sets the viscosity limit at extremely high shear rates).
The coupled equations were numerically solved using the proven finite element method in the commercial software COMSOL Multiphysics 6.0.

2.3. Boundary and Initial Conditions

In this model, the left boundary was designated as pressure inlet Pin and the right boundary as pressure outlet Pout. The upper and lower boundaries were defined as symmetric. The capillary number Ca was calculated as Ca = μgug/σ (where μg represents the viscosity of CO2, ug represents the average velocity of single-phase CO2 in porous media, and σ signifies the interface tension). The viscosity ratio M was defined as M = μg/μoil, where μoil represents the viscosity of shear-thinning oil. Since the viscosity of shear-thinning oil varies with shear rate, the viscosity ratio M is defined as the ratio of CO2 viscosity to the equivalent viscosity of the oil phase at the breakthrough moment. This is because using the initial viscosity as a baseline does not accurately reflect the rheological characteristics of the oil phase during the actual displacement process. By taking the average viscosity of the oil phase at breakthrough as the denominator for calculating the viscosity ratio, we can better characterize the “effective viscosity difference” corresponding to interfacial instability. Here, the equivalent viscosity of the oil phase is defined as the average viscosity of the oil phase within the simulation domain at the breakthrough moment. The surface of cylinders acts as a non-slip wall with a fixed contact angle θw = 90°. To ensure that crude oil and CO2 remain immiscible, the physical properties of both fluids were selected at a temperature of 343 K and a pressure of 7 MPa [7,47,48]. The detailed parameter settings are listed in Table 1.

2.4. Model Validation

To confirm the precision and effectiveness of the simulation outcomes, the working conditions of capillary number Ca = 3.16 × 10⁻⁴ and viscosity ratio M = 3.14 × 10⁻⁴ were selected for grid independent verification (see Figure S1 in the Supplementary Materials). We compared the breakthrough time t* (defined as the time when CO2 reaches the outlet boundary) and the residual oil saturation So at the breakthrough moment while also calculating the value of convergence rate RG to assess the convergence behavior during the mesh refinement process. When RG < 0, it indicates oscillatory convergence; when 0 ≤ RG ≤ 1, it indicates monotonic convergence; and when RG > 1, it indicates divergence [49,50]. We found that during the refinement process, the calculations exhibited monotonic convergence, as both t* and So had RG values between 0 and 1, specifically 0.5 and 0.75, respectively. And when the number of grids increases from 105,242 to 121,098, the number and distribution of fingers at the breakthrough moment remain consistent, with changes in So and t* both within 1%. Therefore, the grid number of 105,242 was selected for subsequent calculations.
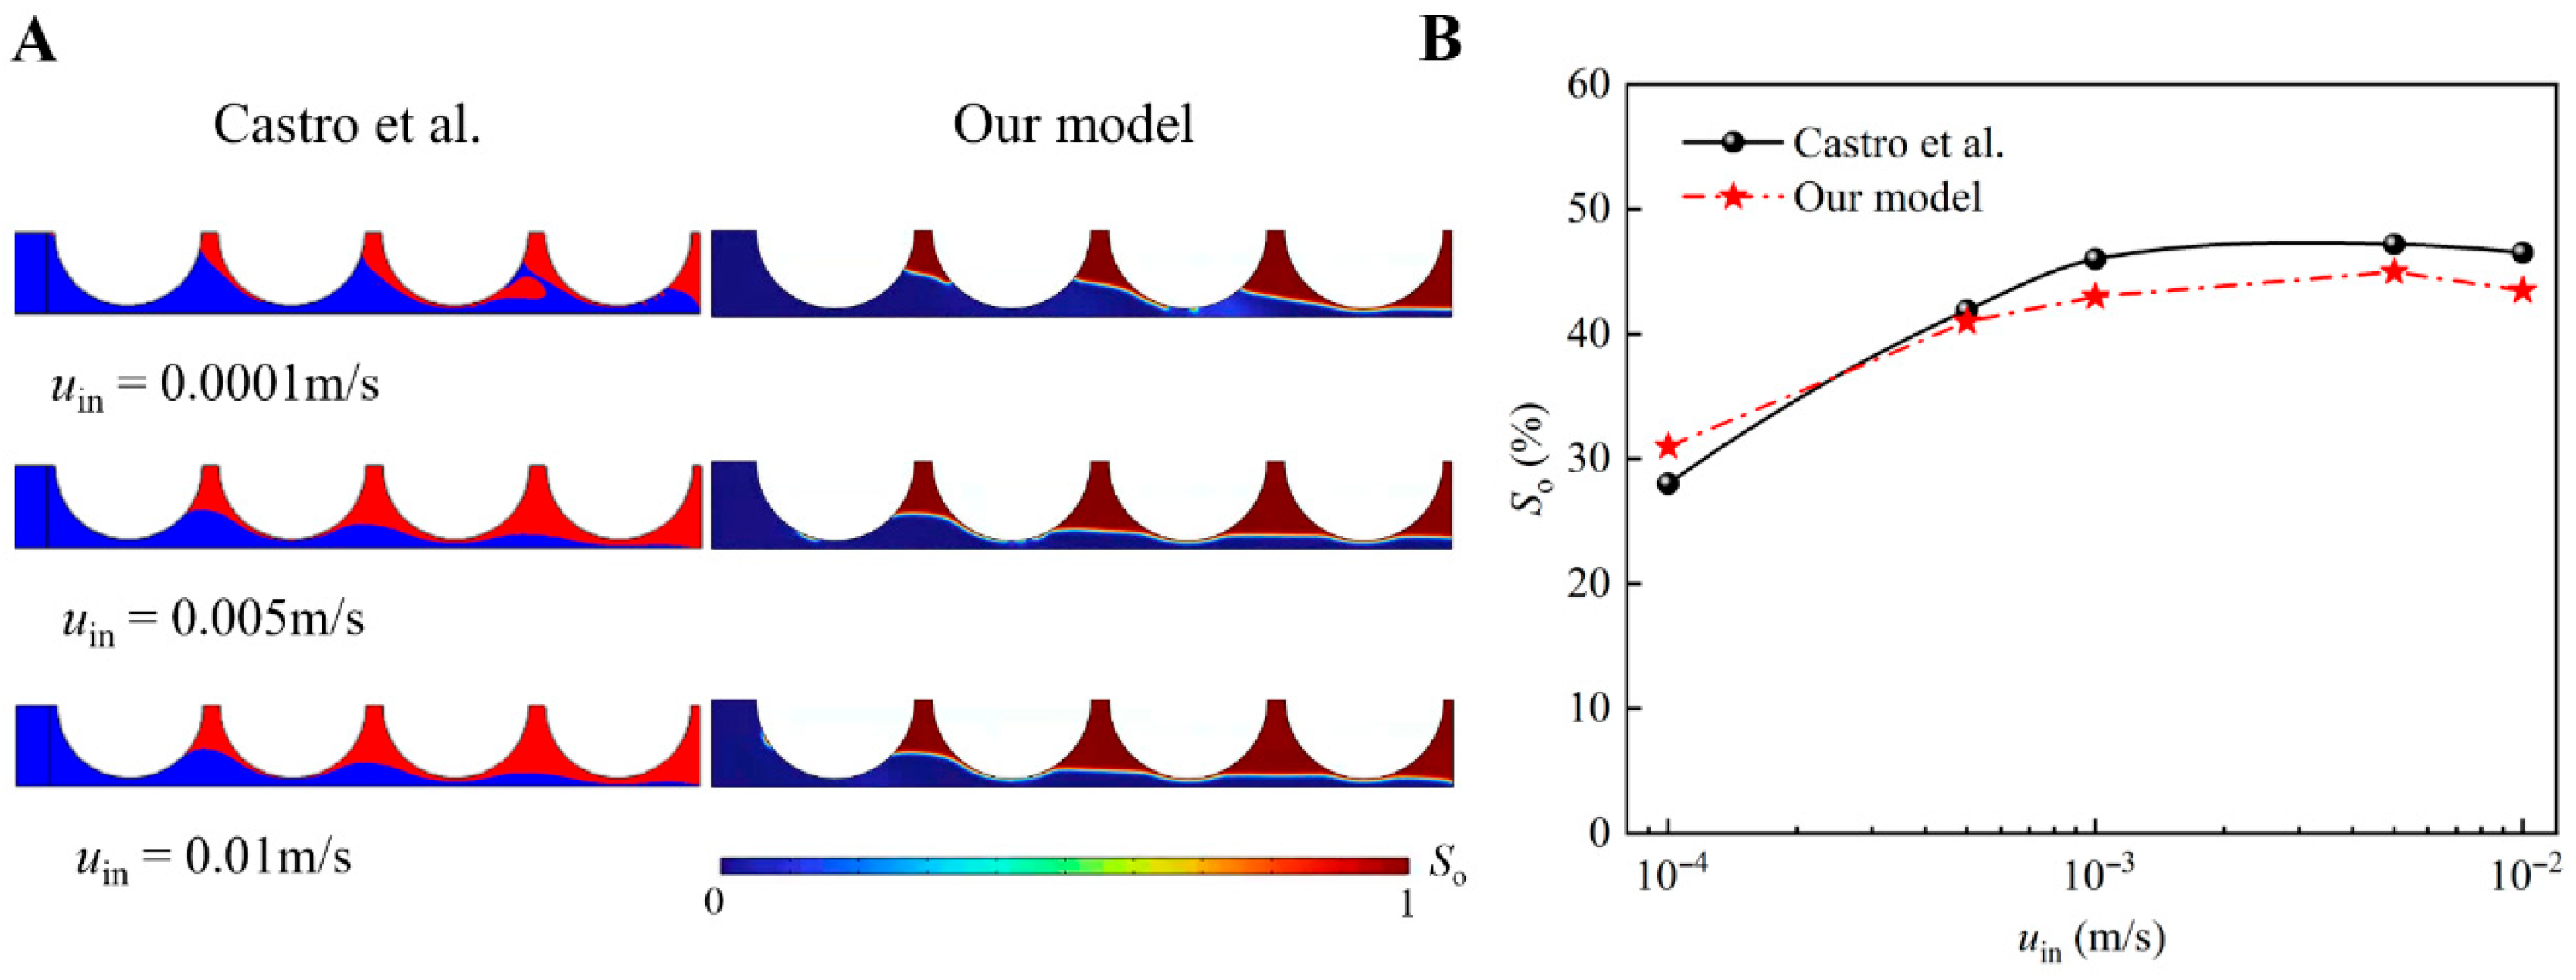
To validate the accuracy of our numerical model, the shear-thinning oil model proposed by Castro et al. [51] was employed as a benchmark to simulate the displacement of a Newtonian oil by a shear-thinning fluid under varying injection rates (uin). Figure 2A illustrates the distribution of the two-phase fluids at the breakthrough moment. As uin increased, the area occupied by the displacing fluid decreased, leaving more of the displaced phase trapped within the pore space and resulting in significantly lower displacement efficiency. This occurs because the viscosity of the shear-thinning fluid decreases with increasing uin. The similarity in flow patterns at the breakthrough moment under different uin demonstrated the consistency of the results. Furthermore, a quantitative analysis of residual oil saturation (So) at different injection rates (Figure 2B) revealed that So consistently increased with increasing uin. The maximum deviation remains within 3%, confirming the accuracy of the proposed model.

3. Results and Discussion

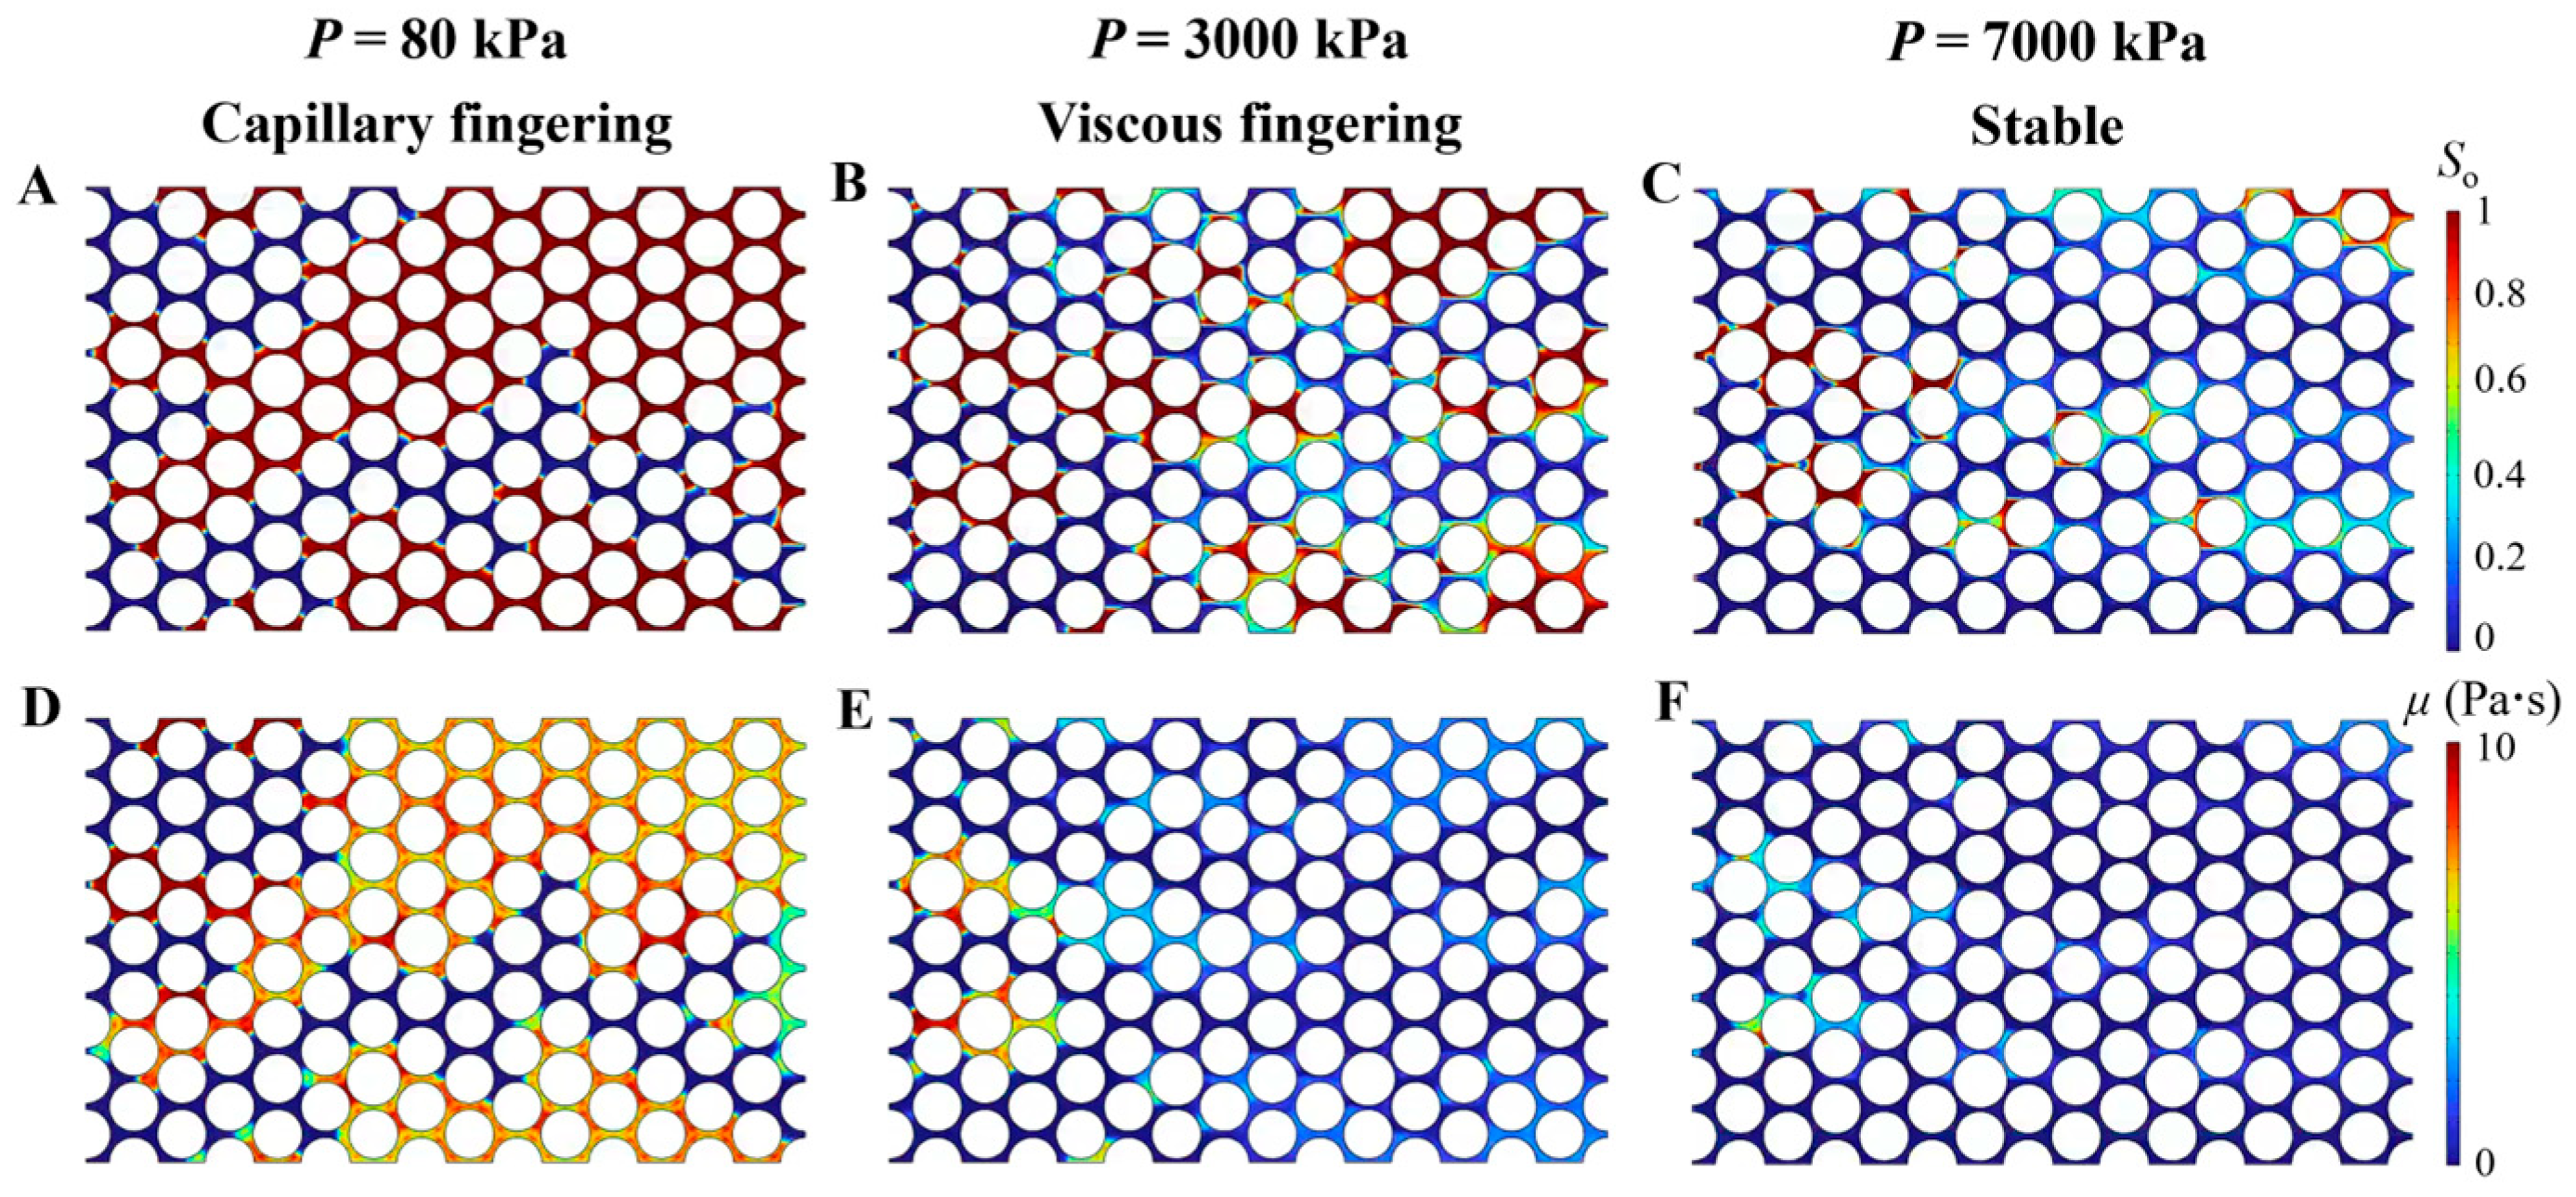
To study the typical flow modes during the CO2 displacement of shear-thinning oil, displacement patterns and viscosity distributions under various injection pressure P with n = 0.6 and μ0 = 10 Pa·s were examined, as shown in Figure 3. When P = 80 kPa, owing to the dominance of capillary forces, the resulting fingers are isolated and slender, a phenomenon referred to as capillary fingering. Capillary force mainly determines the direction of finger penetration. If there is a phenomenon that is opposite to the injection direction, this phenomenon is called “reflux” [8]. When P increases to 3000 kPa, under the dominance of viscous forces, CO2 quickly invades adjacent pores after partially filling the existing ones, forming an interconnected flow structure, which is termed viscous fingering. When P reaches 7000 kPa, the interface between CO2 and oil becomes relatively flat, and the displacement front appears stable and uniform, with no distinct fingering patterns in the flow field, and the displacement efficiency reaches the maximum, which is referred to as stable displacement. The corresponding viscosity distributions under these fingering patterns are shown in Figure 3D–F. Across all these displacement modes, the viscosity in the channels where fingering occurs is relatively low, approximately 2 × 10⁻⁵ Pa·s, while the viscosity in the regions not swept by CO2 varies considerably. Specifically, the average viscosity in the unswept region is relatively high in capillary fingering, approximately 6.2 Pa·s. As the displacement mode gradually transitions to viscous fingering and stable displacement, the average oil viscosity in the unswept region progressively decreases to 1.4 Pa·s, indicating a significant viscosity reduction effect.
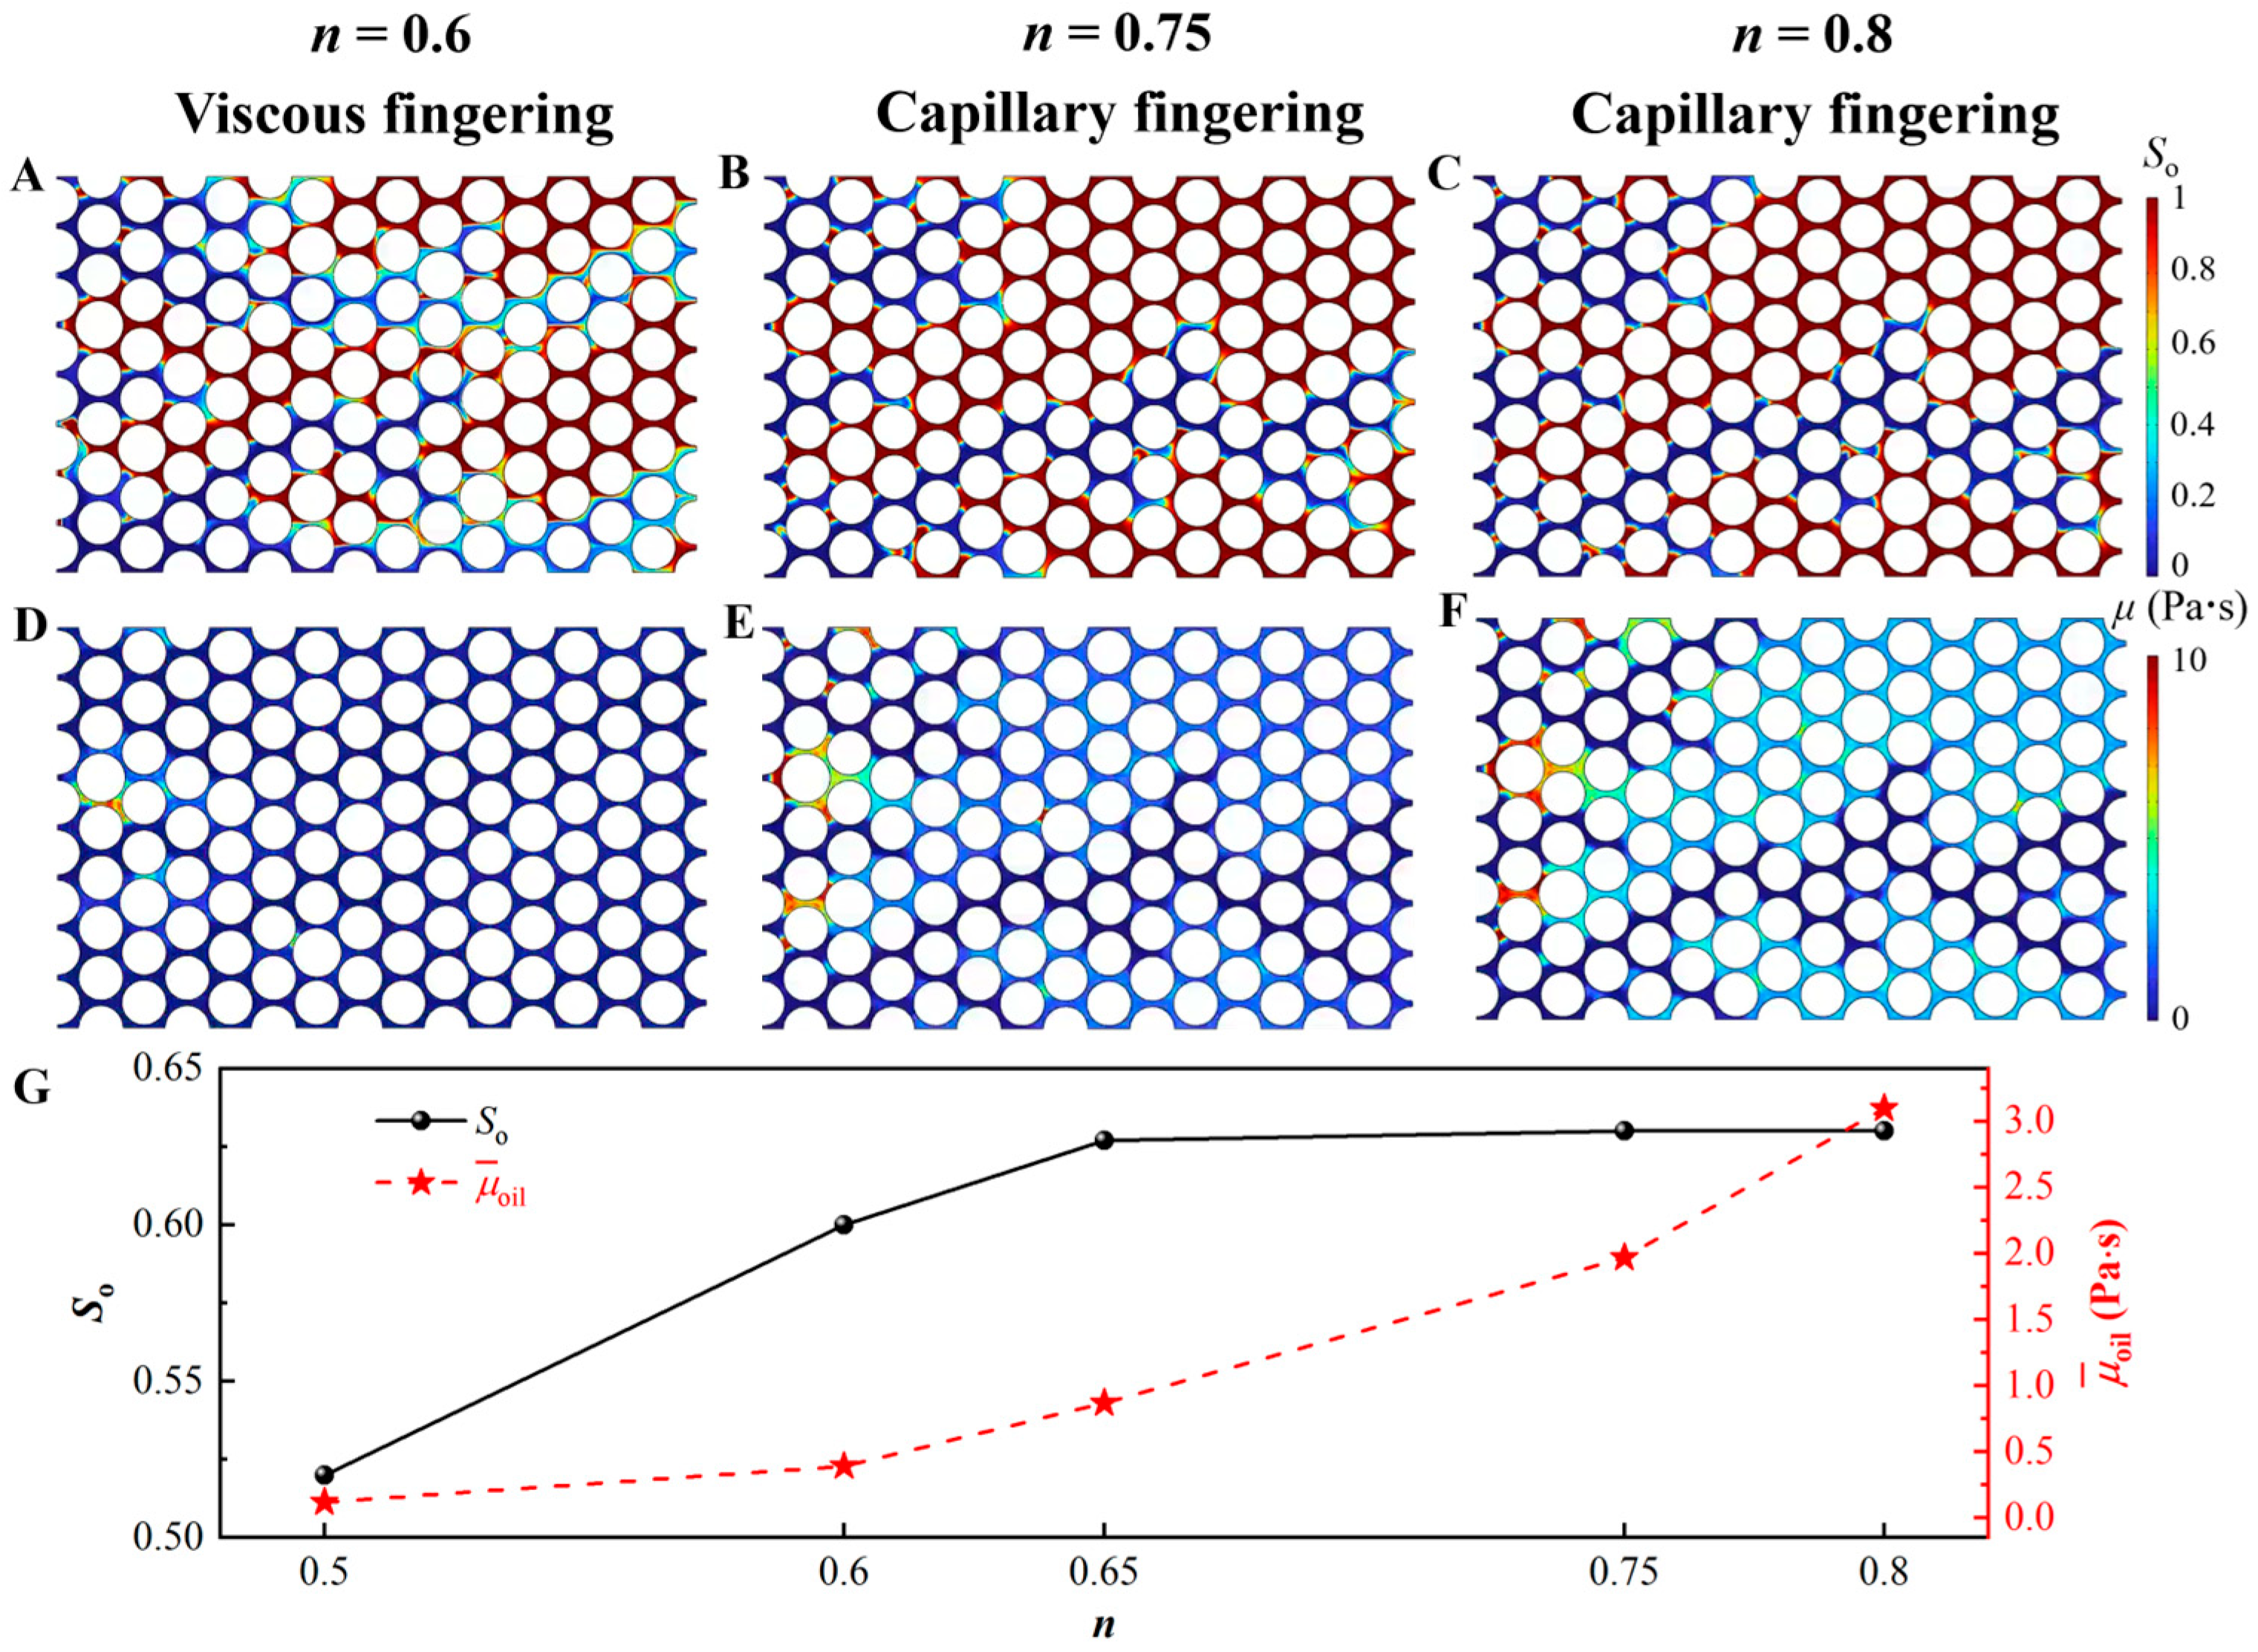
To investigate the effect of the power-law index (n) on the CO2 displacement of shear-thinning oil, Figure 4 illustrates the distributions of fluids and viscosities at Ca = 0.24; μ0 = 10 Pa·s; and n = 0.6, 0.75, and 0.8. Meanwhile, the variations in residual oil saturation (So) and average oil viscosity ( μ ¯ o i l ) at the breakthrough moment were analyzed. When n = 0.6, the fingers are relatively wide and partially interconnected, indicating a typical viscous fingering regime. As n increases, the fingers become slender and isolated, and the displacement mode gradually transitions from viscous fingering to capillary fingering, with a significantly larger area occupied by the oil phase. Correspondingly, Figure 4G shows that So gradually increases with n and eventually stabilizes, indicating that a higher n reduces displacement efficiency. Figure 4D–F displays the viscosity distributions at different n. As n increases, the viscosity in the region swept by CO2 remains consistently low, approximately 2 × 10⁻⁵ Pa·s. In contrast, the viscosity of oil in regions unswept by CO2 increases progressively owing to the transition to capillary fingering. As illustrated in Figure 4G, μ ¯ o i l in unswept regions rises from 0.4 Pa·s to 3.1 Pa·s, indicating a significant decline in the viscosity reduction effect with increasing n.
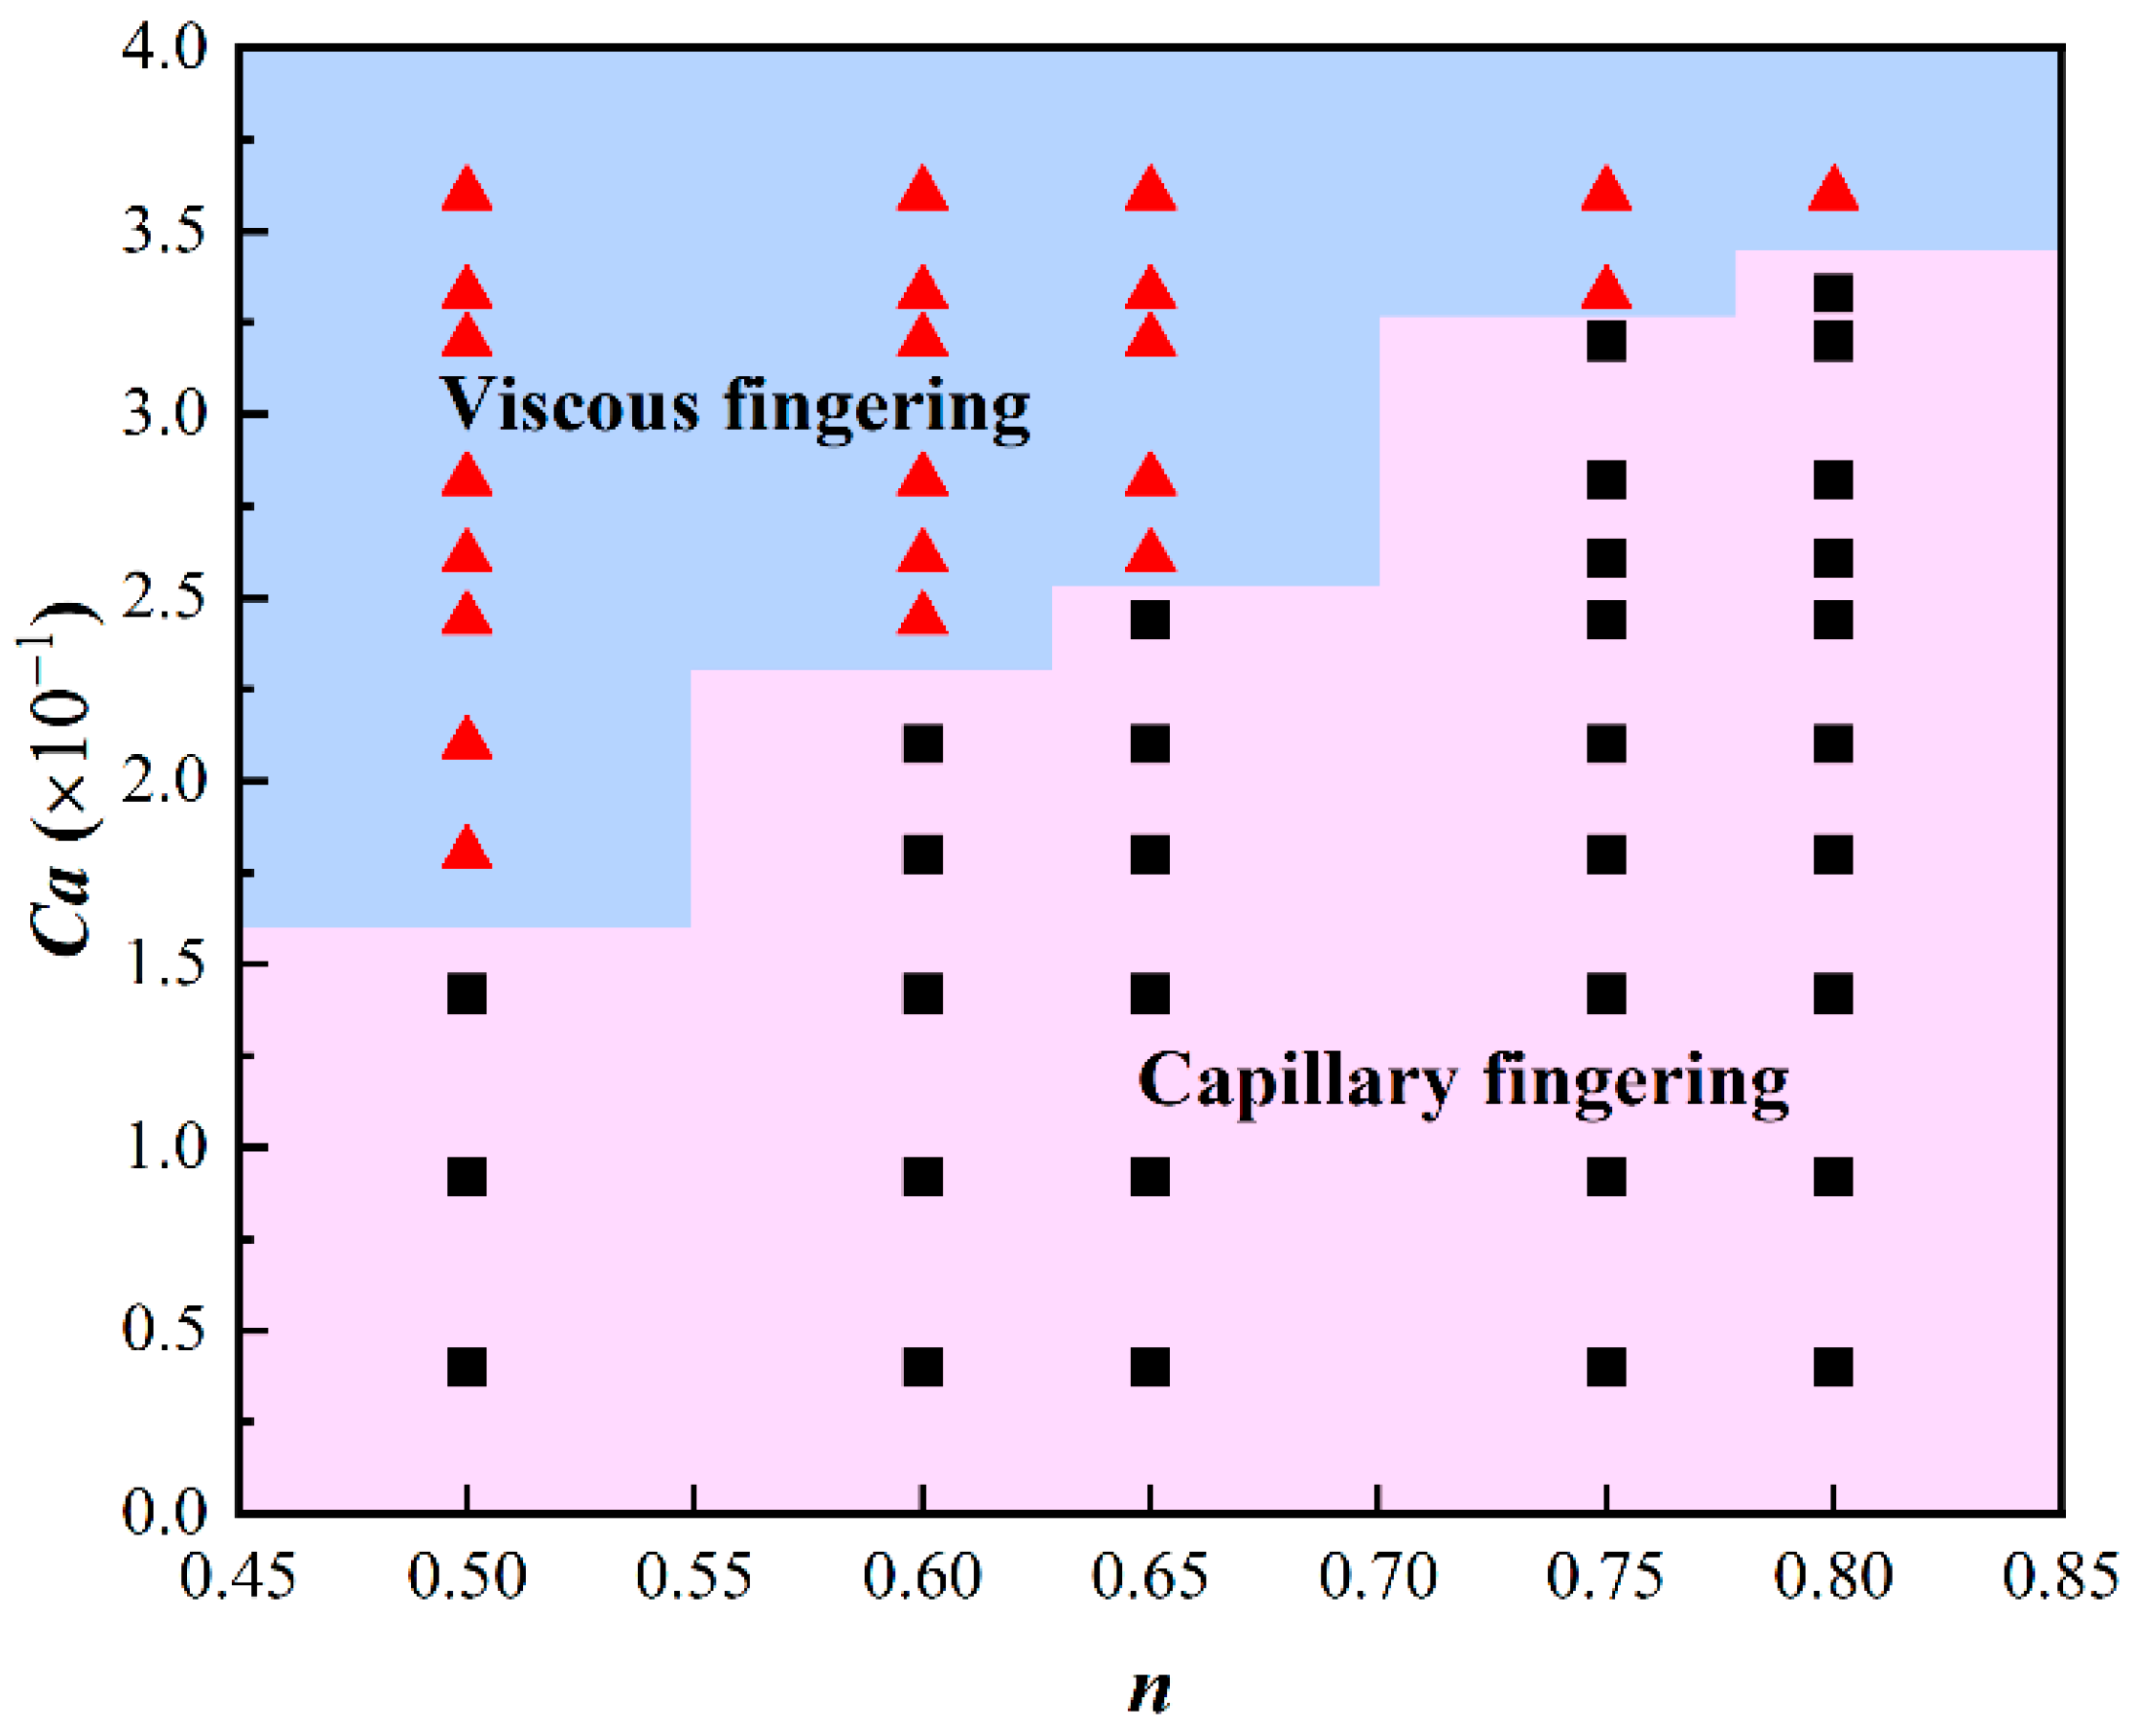
To investigate the influence of n on fingering modes, CO2 displacement at μ0 = 10 Pa·s under various Ca and n was simulated. Fingering phase diagrams were constructed, as shown in Figure 5. With variations in Ca and n, two typical displacement patterns were observed: capillary fingering and viscous fingering. The critical state between different fingering modes is determined by selecting the midpoint between two adjacent data points representing distinct modes. Increasing Ca leads to a transition from capillary fingering to viscous fingering. However, as n increases, the critical Ca for this transition also increases. n directly affects the shear-thinning behavior of oil, thereby controlling the transition between fingering modes. Lower n corresponds to stronger shear-thinning effects, which promote the development of viscous fingering. In contrast, higher n weakens shear-thinning, favoring the occurrence of capillary fingering.
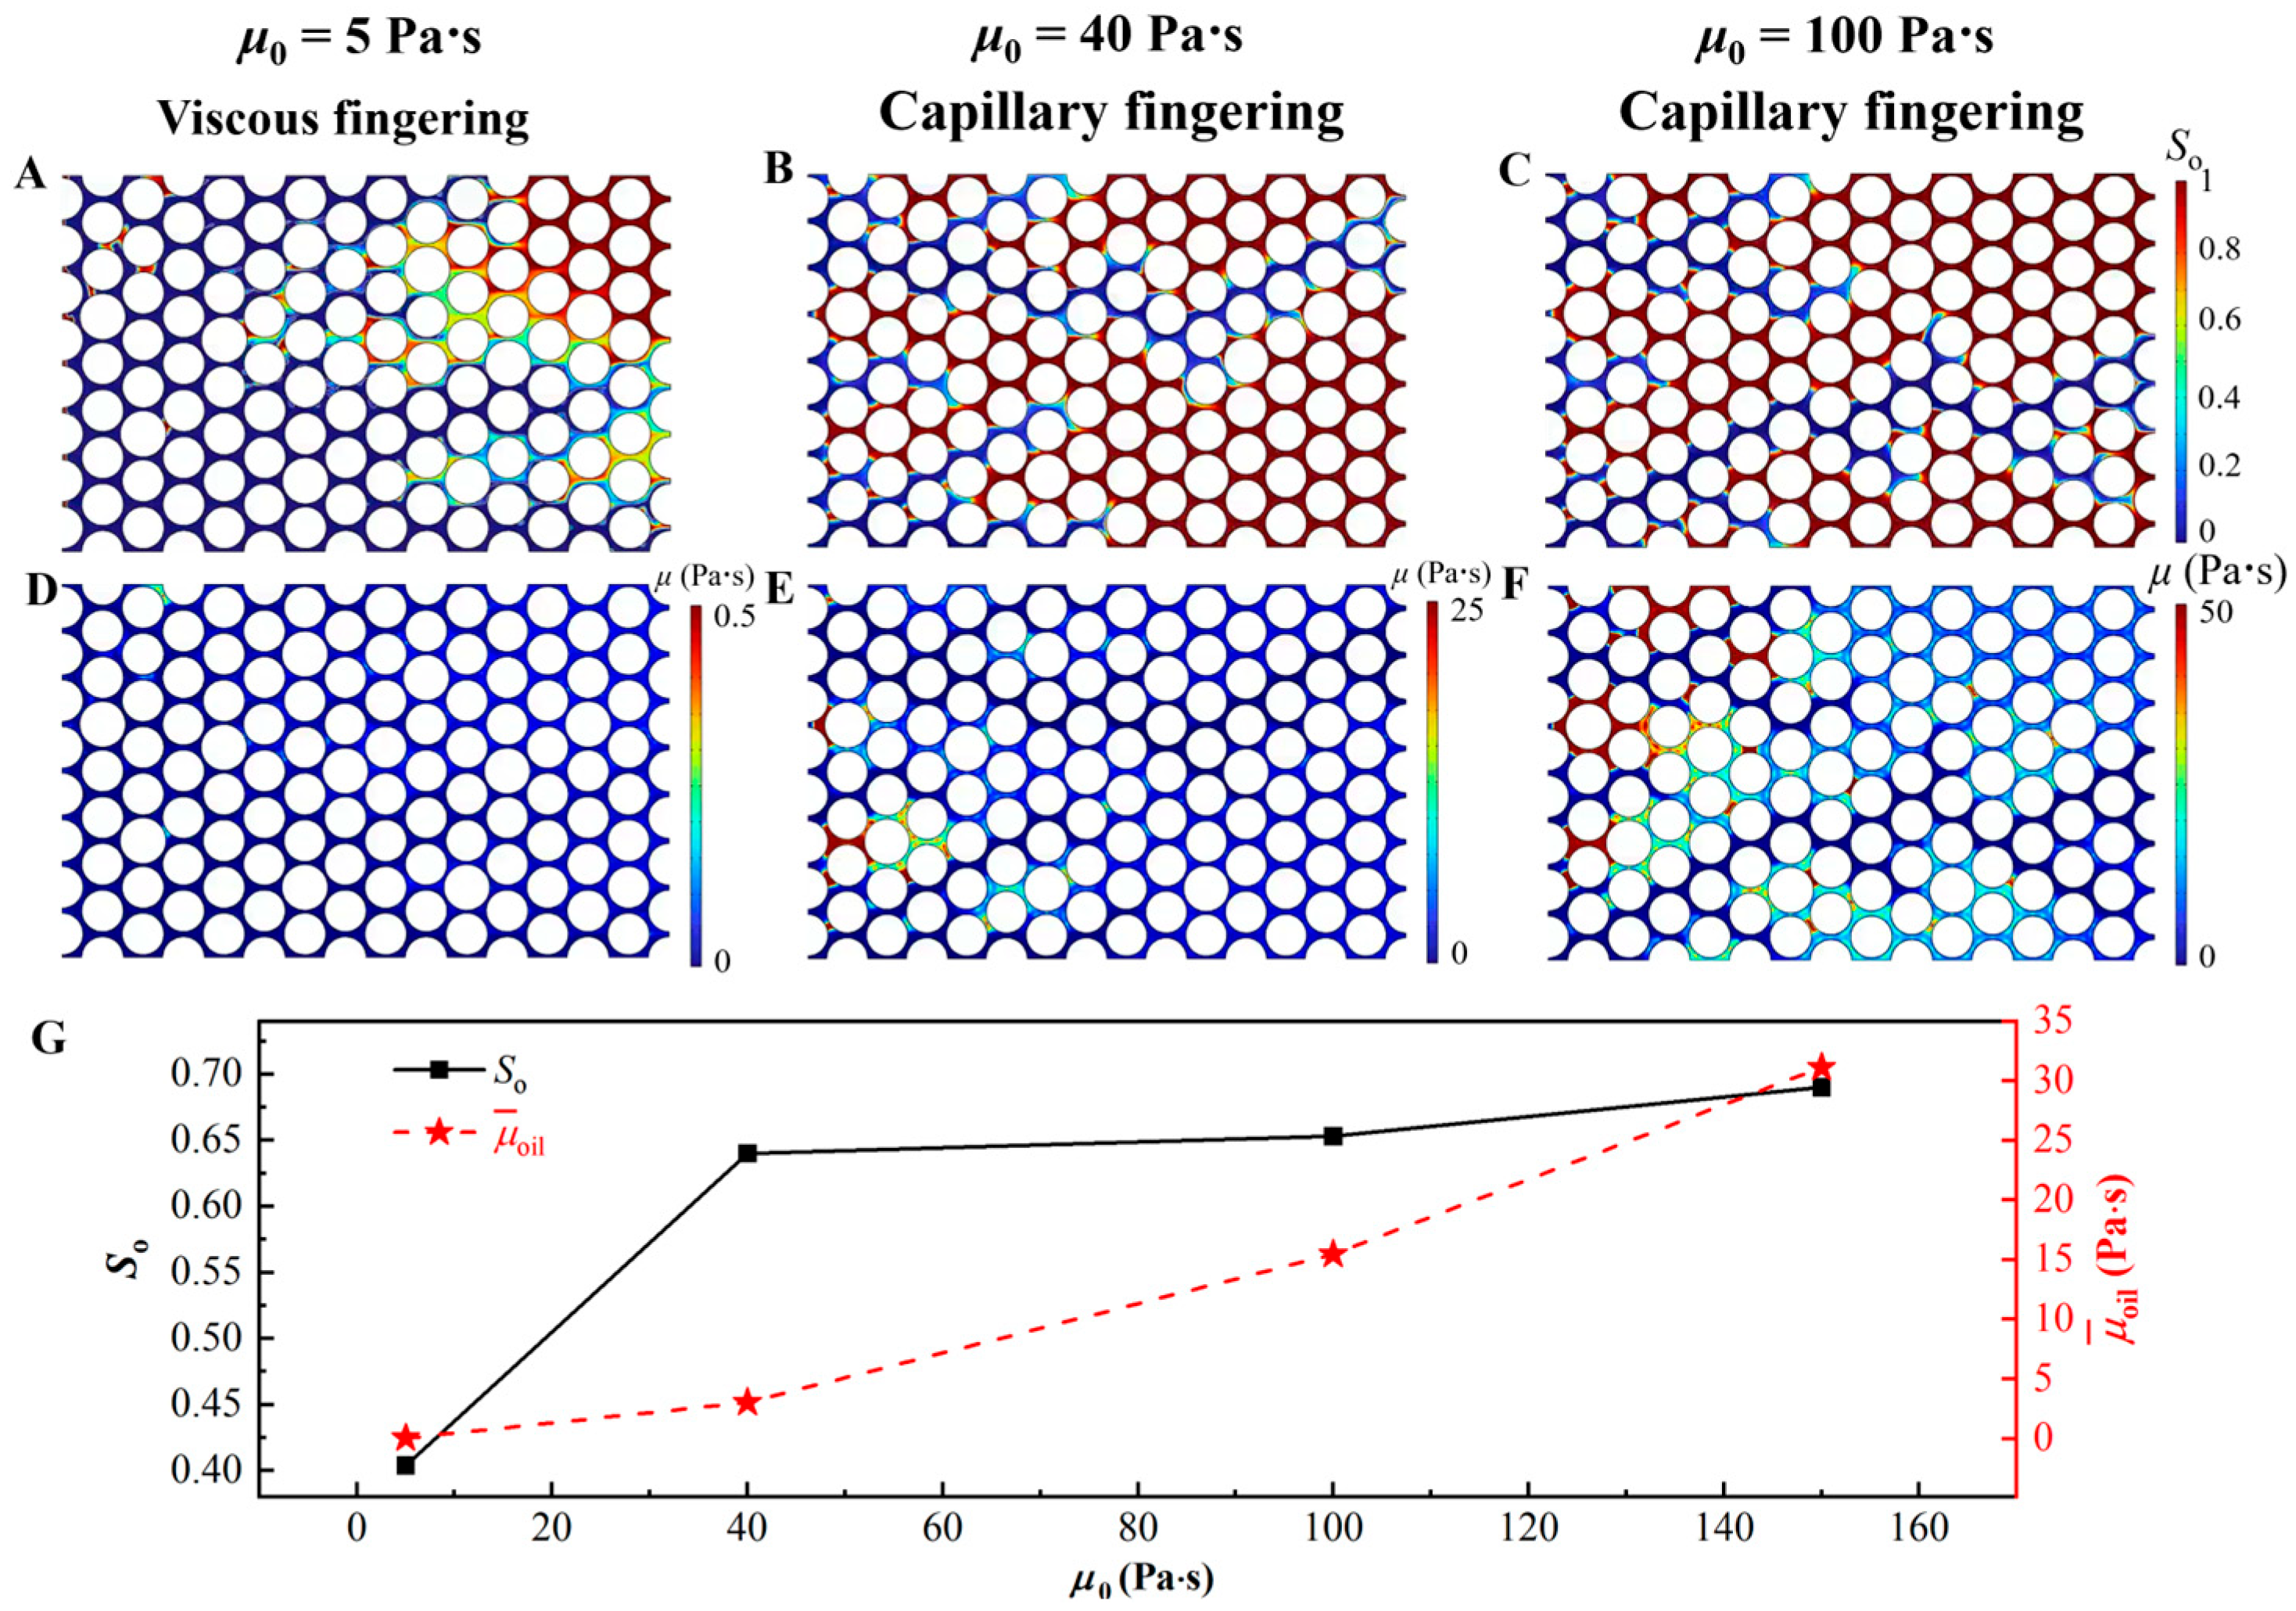
To investigate the effect of the zero-shear viscosity μ0 on the CO2 displacement of shear-thinning oil, Figure 6 illustrates the distributions of fluids and viscosity fields under the conditions of Ca = 0.24 and n = 0.6 for μ0 = 5, 40, and 100 Pa·s. The variations in residual oil saturation (So) and average oil viscosity ( μ ¯ o i l ) at the breakthrough moment were quantitatively analyzed. When μ0 = 5 Pa·s, CO2 occupies most area of the porous media, showing a viscous fingering pattern. As μ0 increases, the area occupied by CO2 gradually decreases, and the displacement mode gradually transitions from viscous fingering to capillary fingering, as shown in Figure 6A–C. Correspondingly, Figure 6G shows that So increases with increasing μ0, indicating a decline in displacement efficiency. Figure 6D–F display the viscosity distributions under various μ0. The viscosity in the region swept by CO2 remains consistently low, approximately 2 × 10⁻⁵ Pa·s. In contrast, the viscosity of the oil in regions unswept by CO2 increases progressively, as μ0 increases. As illustrated in Figure 6G, μ ¯ o i l in unswept regions rises from 0.1 Pa·s to 33 Pa·s, indicating a significant decline in the viscosity reduction effect.
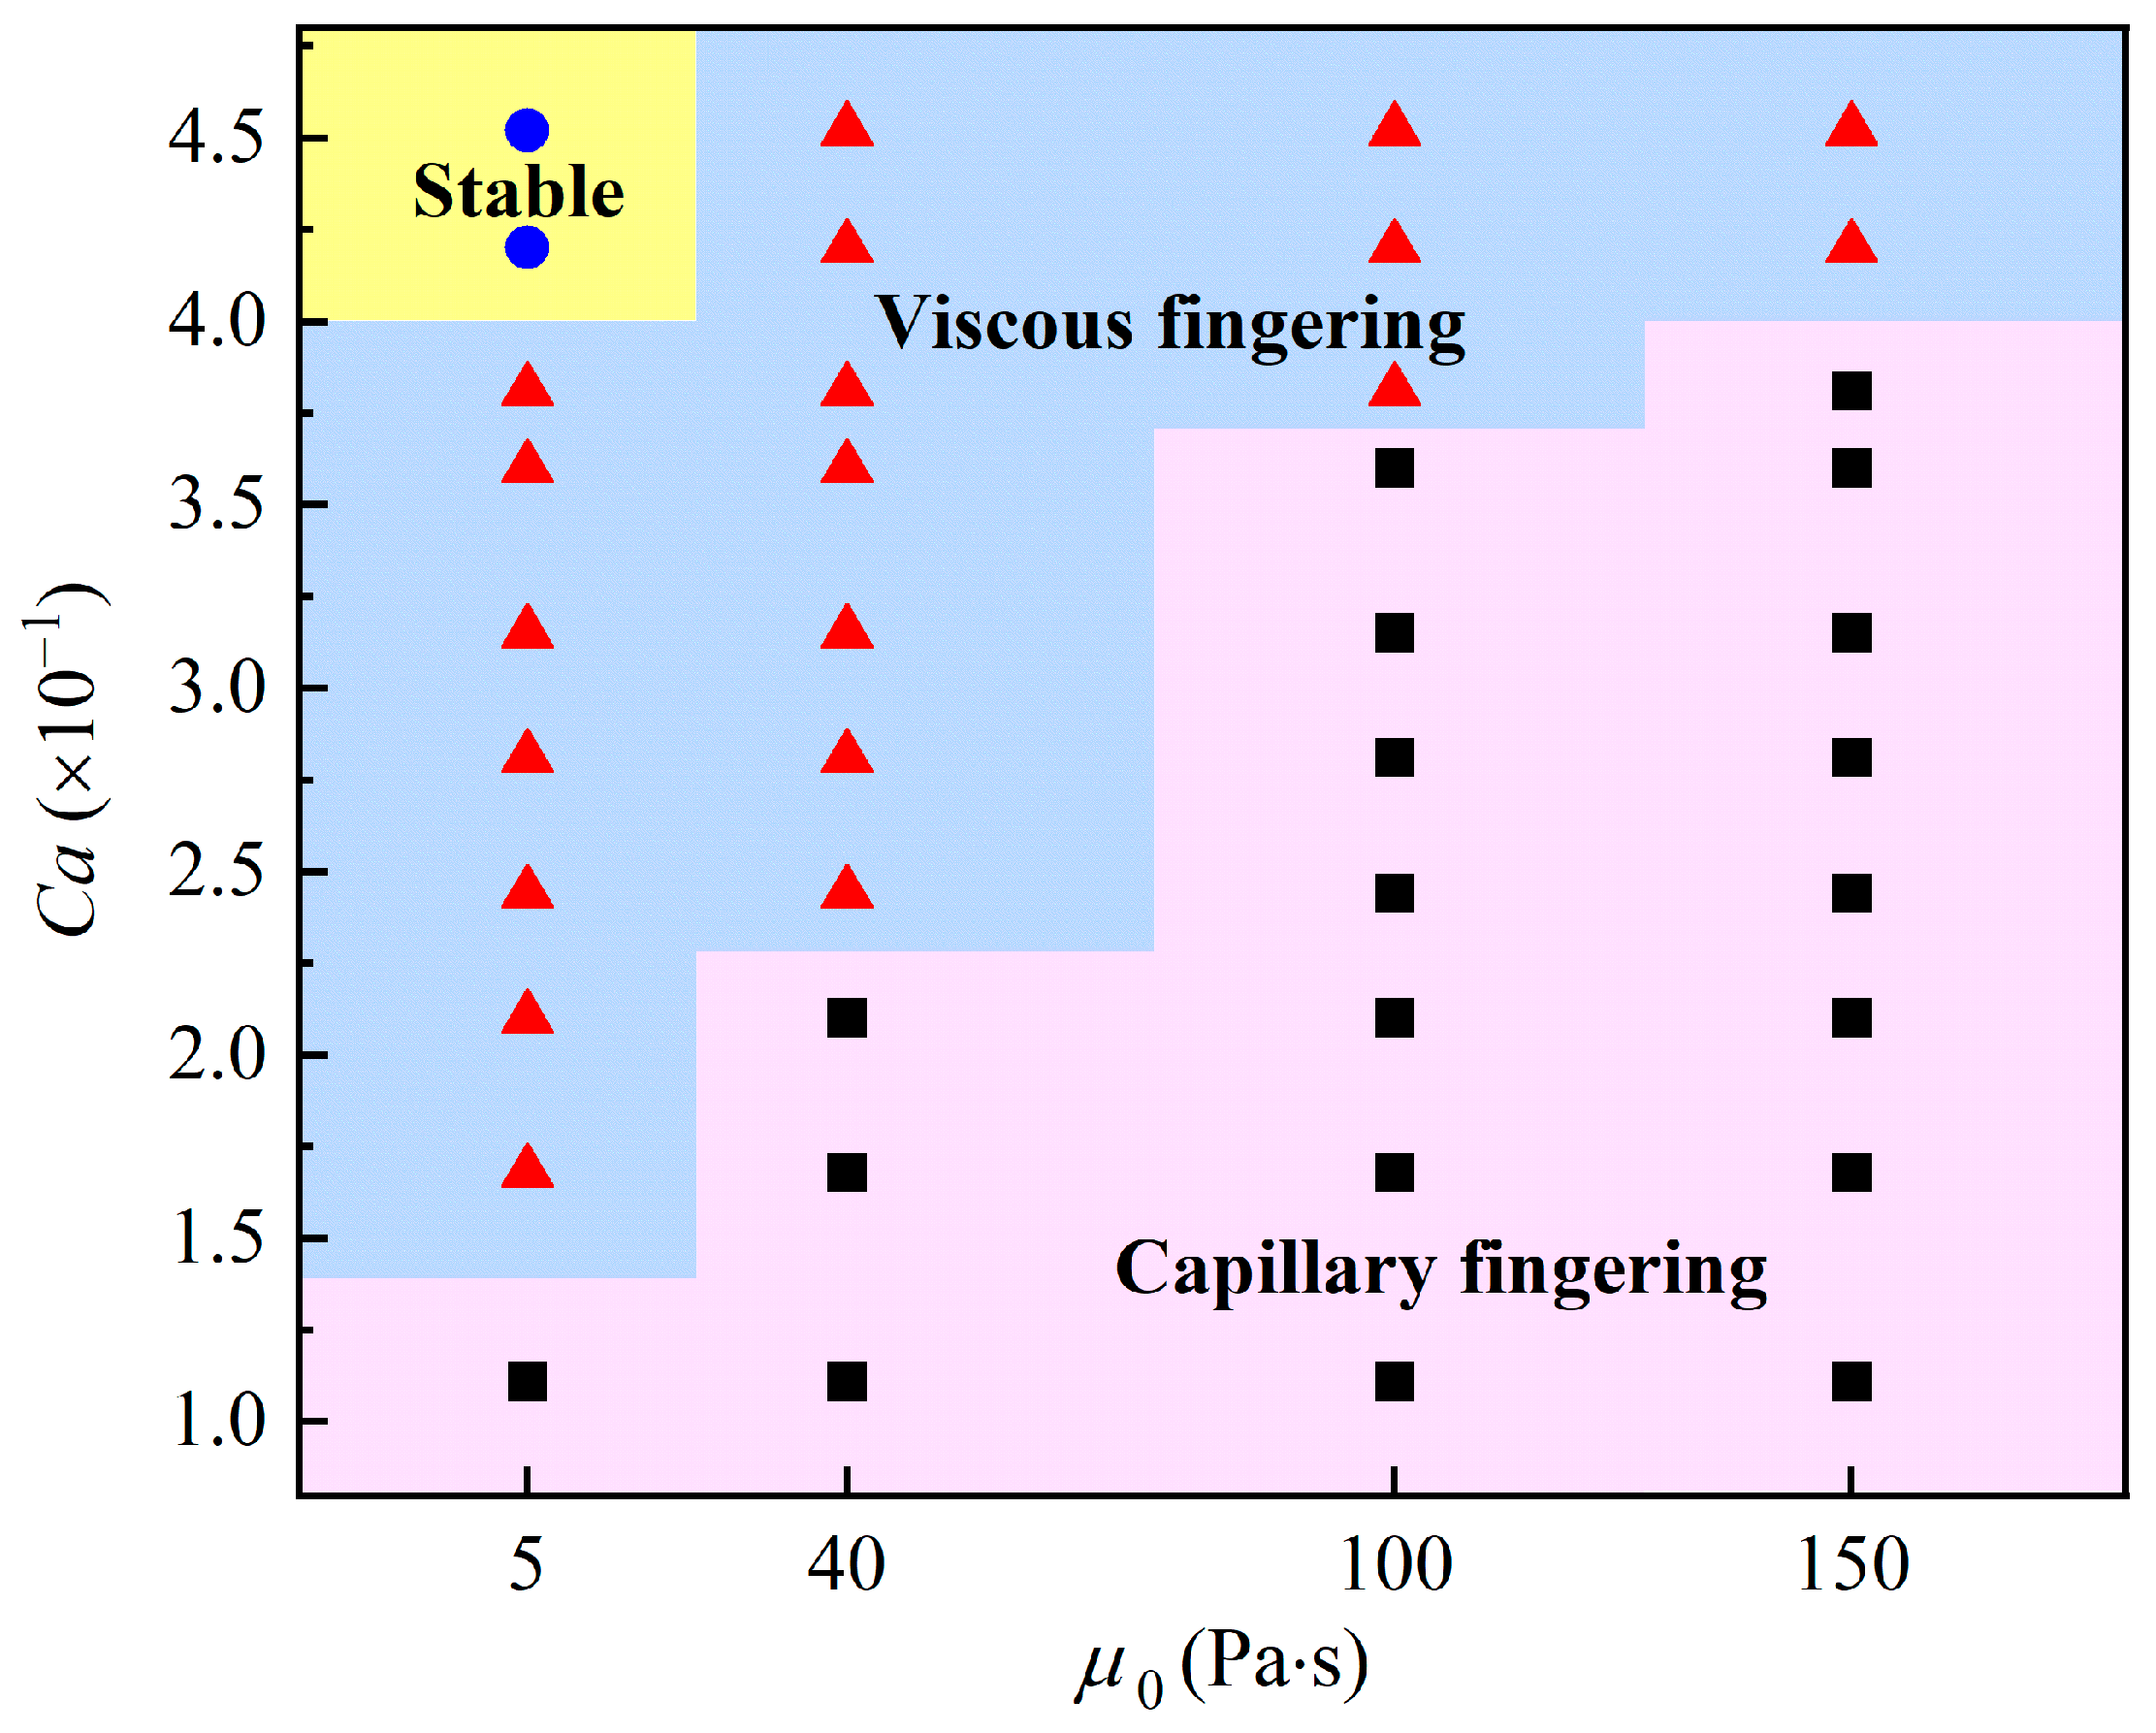
To investigate the influence of μ0 on fingering pattern transitions during the CO2 displacement of shear-thinning oil, fingering phase diagrams were constructed under varying Ca and μ0, as shown in Figure 7. When Ca = 0.11, capillary fingering is observed regardless of μ0, which indicates that at low Ca, the displacement front is primarily governed by capillary forces, while viscous effects are relatively weak. As Ca increases and μ0 decreases, the fingering mode gradually transitions from capillary fingering to viscous fingering and eventually to stable displacement. The critical Ca for the transition from capillary fingering to viscous fingering lies between 0.13 and 0.4. With increasing μ0, the critical Ca for this transition also increases. Stable displacement occurs only when μ0 reaches 5 Pa·s and Ca exceeds 0.42.
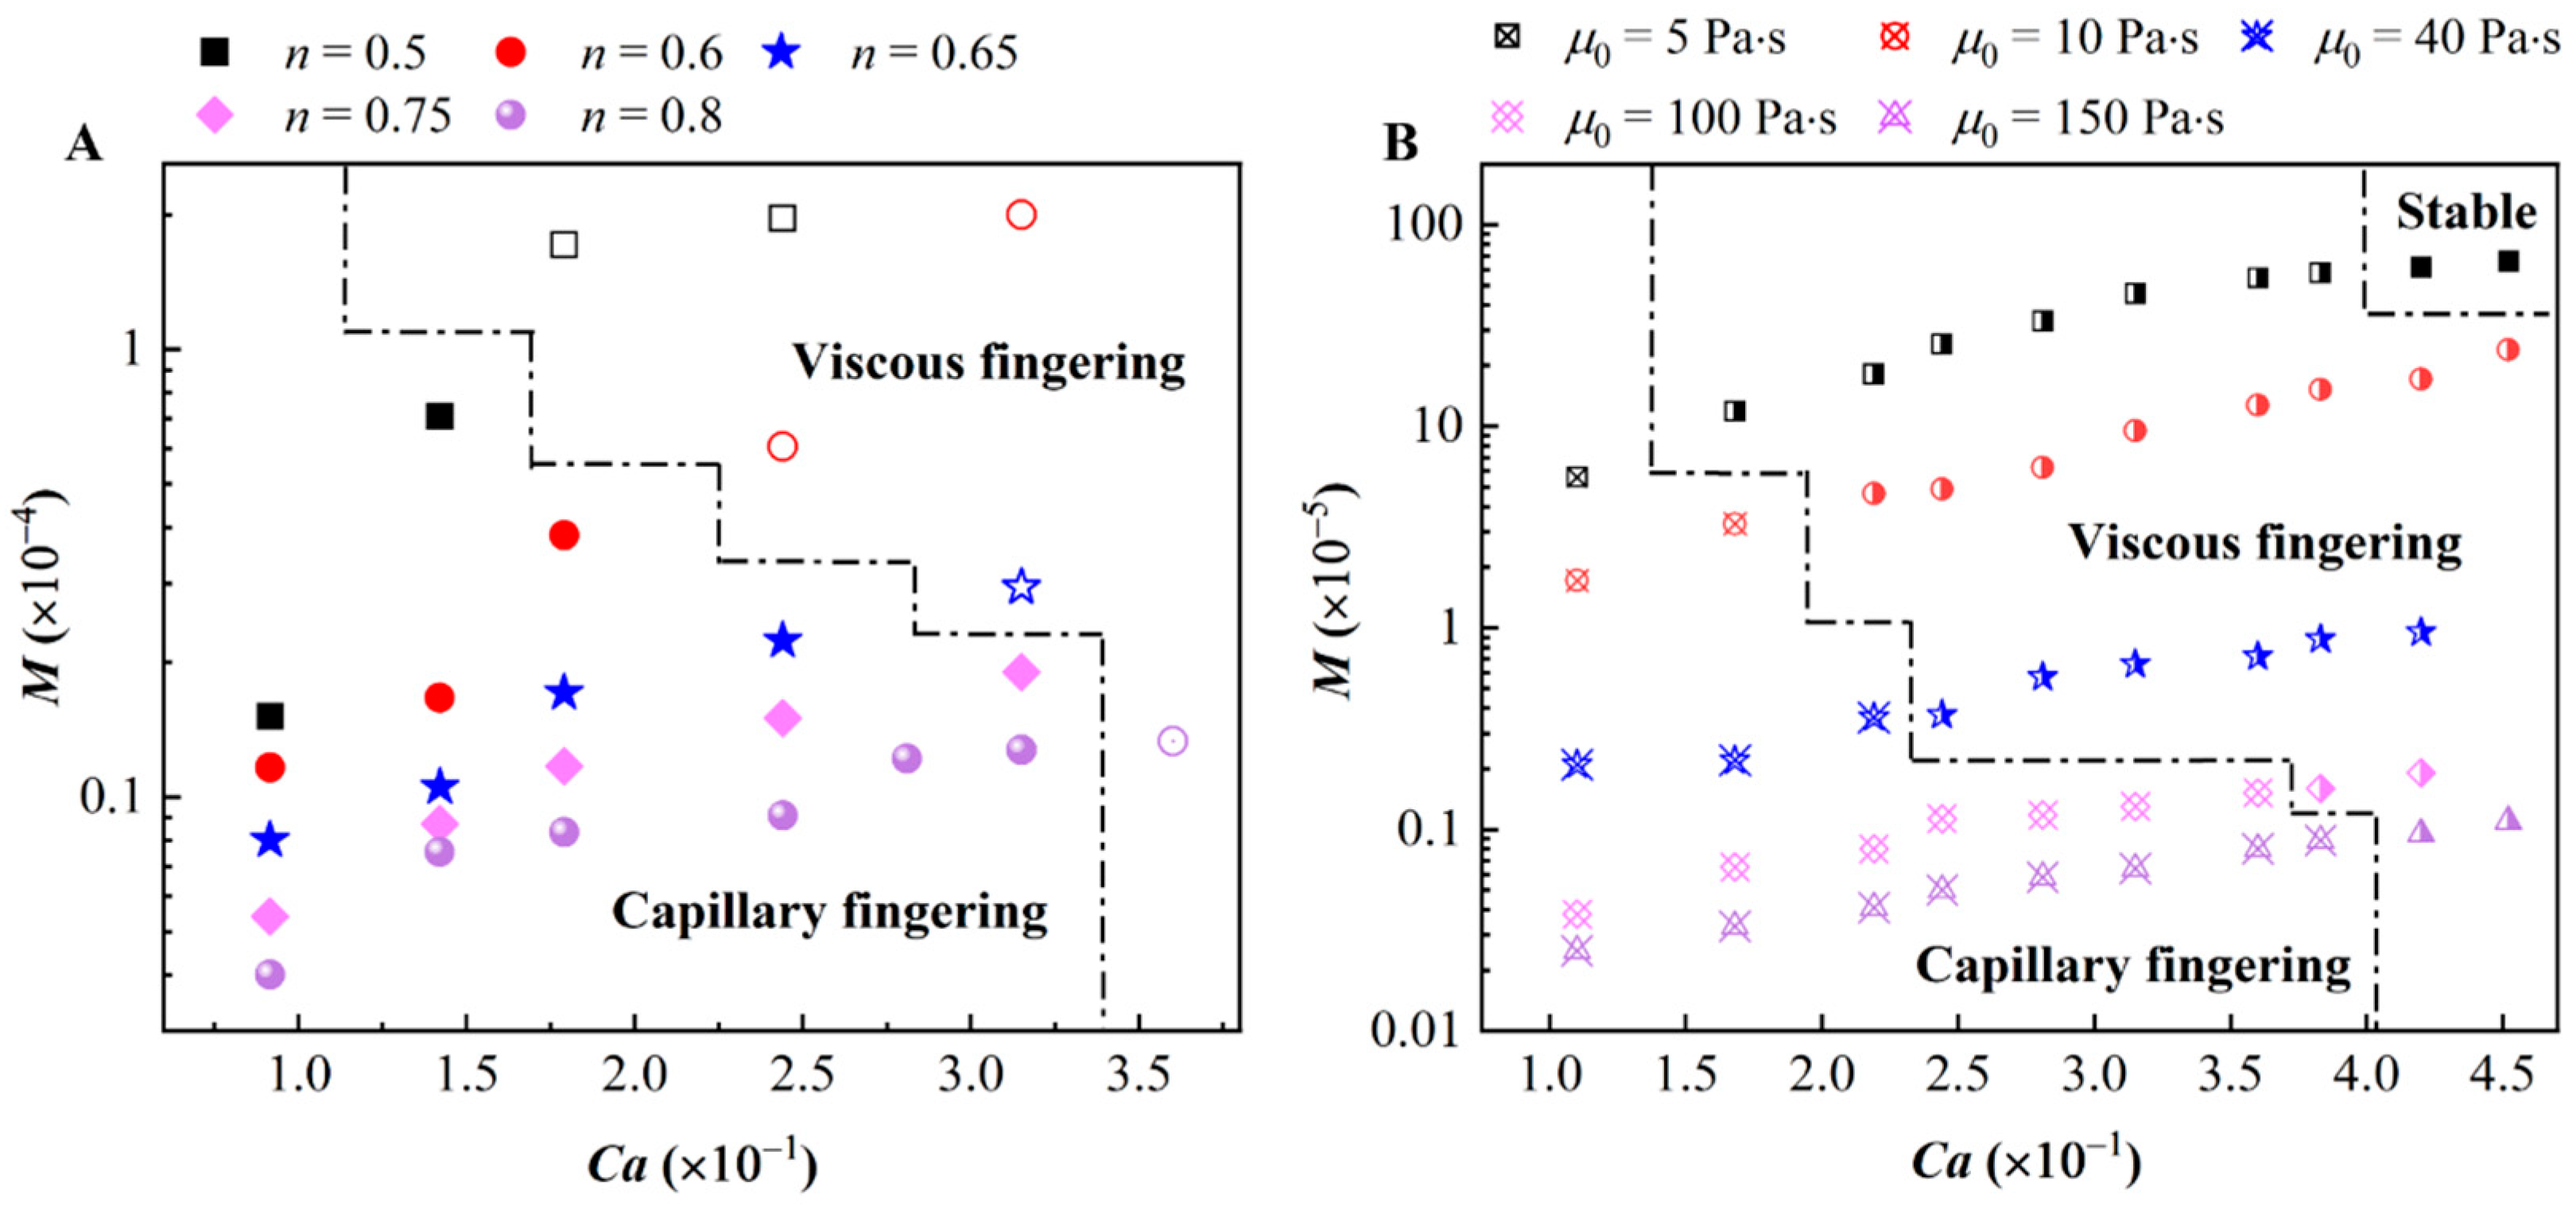
The capillary number (Ca) and viscosity ratio (M) are key parameters controlling fingering patterns and transitions in Newtonian oil displacement. For comparison, Ca and M were used to characterize shear-thinning oil systems. Considering the viscosity of shear-thinning oil depends on the shear rate. M was defined as the ratio of CO2 viscosity to the average oil viscosity at the breakthrough time, enabling a comparison of fingering phase diagrams between Newtonian and shear-thinning oil. First, we established fingering phase diagrams under various Ca and M for different n, as shown in Figure 8A. The results indicated that capillary fingering and viscous fingering can be observed by adjusting Ca and M. Specifically, capillary fingering primarily occurs at low M and Ca, whereas viscous fingering emerges at high M and Ca. The influence of μ0 on the fingering transition was further examined. As illustrated in Figure 8B, three distinct displacement regimes were identified by varying Ca and M, which are capillary fingering, viscous fingering, and stable displacement. The effects of Ca and M on the transition behavior exhibit a trend similar to that observed with variations in n. Notably, stable displacement emerges when Ca and M are sufficiently high, marking a key distinction from the behavior governed by n.
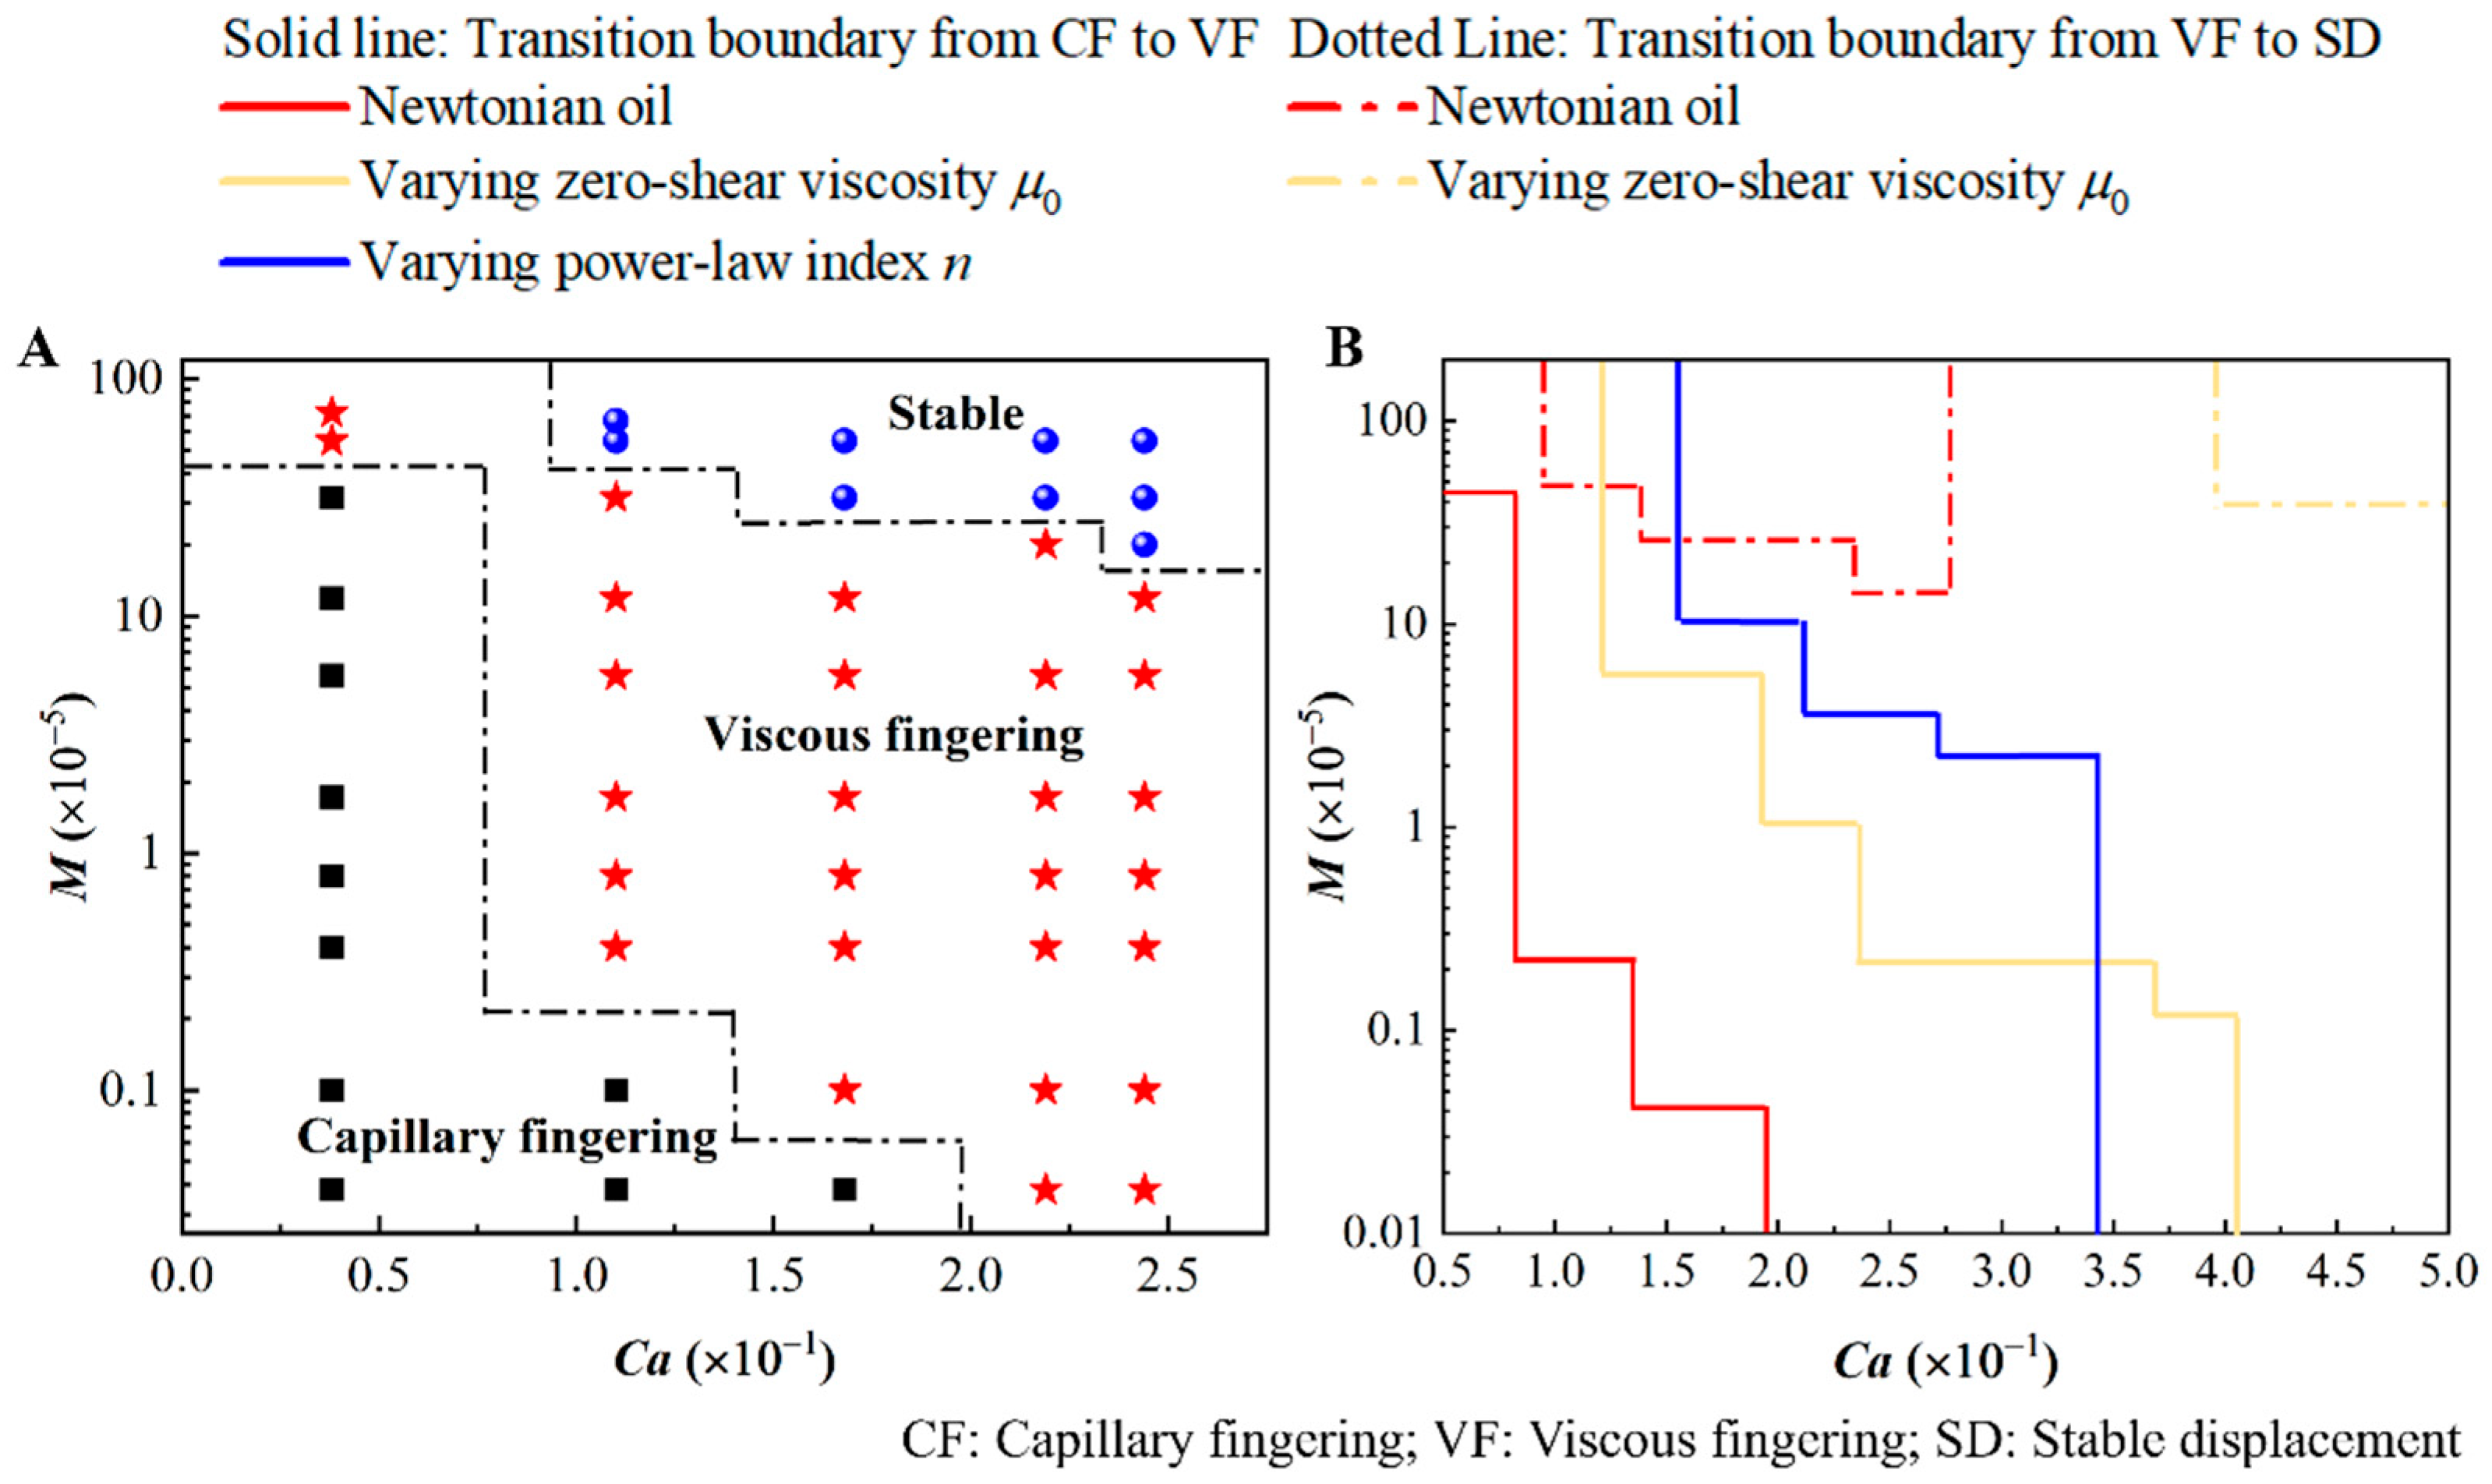
To compare the differences in fingering pattern transitions between Newtonian and shear-thinning oil under the influence of Ca and M, a fingering phase diagram for Newtonian oil was first constructed under various Ca and M, as shown in Figure 9A. Although the effects of Ca and M on the trend in the fingering transition of Newtonian and shear-thinning oil are similar, their quantitative fingering transition boundaries differ significantly. An intuitive comparison of fingering transitions between Newtonian and shear-thinning oil under varying Ca and M is shown in Figure 9B. The solid lines represent the transition boundaries from capillary fingering to viscous fingering. The results indicated that Newtonian oil exhibits the lowest critical Ca and M, making it more prone to presenting capillary fingering. The dotted lines denote the transition boundaries from viscous fingering to stable displacement. In this case, shear-thinning oil requires higher Ca and M to achieve the transition, indicating a more unstable displacement process. It is evident that M calculated based on average oil viscosity cannot fully characterize the properties of shear-thinning oil, as it overlooks the non-uniform viscosity distribution. As a result, Newtonian and shear-thinning oils with varying n or μ0 exhibit different fingering behaviors under the same M.
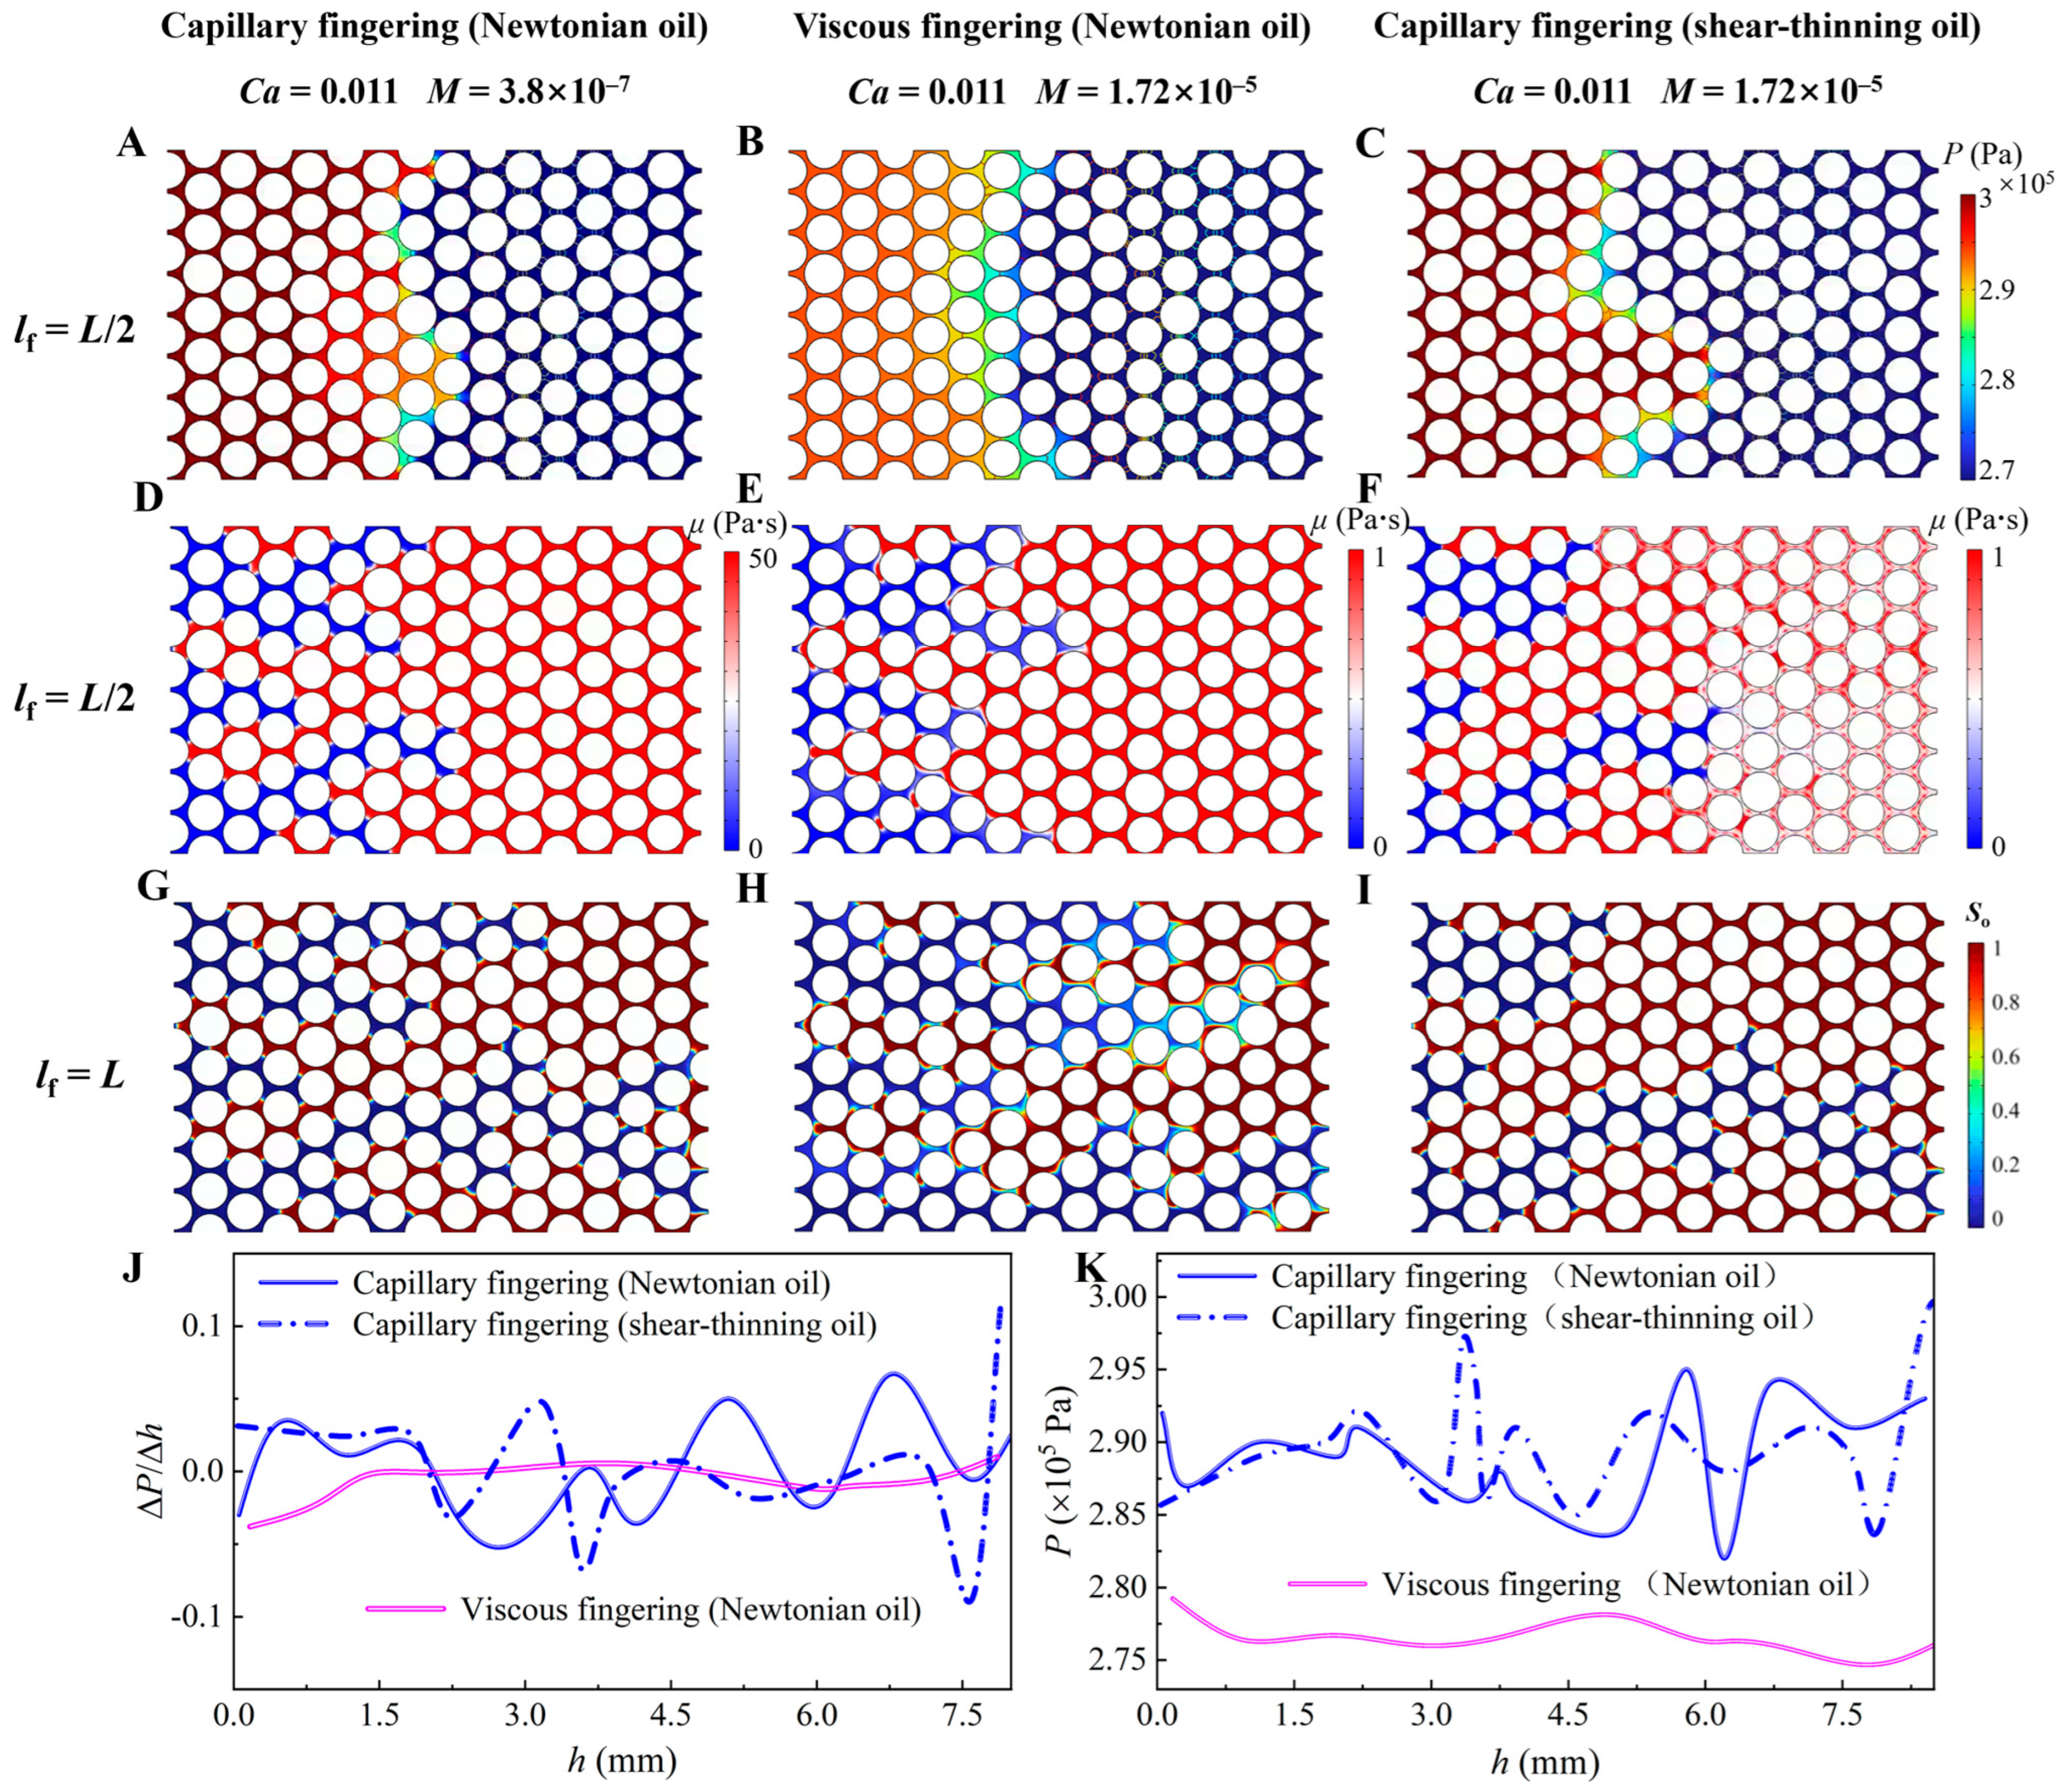
To clarify the underlying mechanism behind the fingering differences between Newtonian and shear-thinning oil, Figure 10A–C present the pressure distributions when the displacement front lf reaches the midpoint of the porous media (lf = L/2). It should be noted that the pressure distribution curve along the vertical cross-section is not strictly extracted from the midpoint (lf = L/2) but rather from a vertical line that passes through the location of the most significant pressure fluctuations at the interface. In contrast, under viscous fingering (Figure 10B), a smoother front pressure profile and lower pressure gradients were observed. Figure 10D–F present the apparent viscosity distributions when the displacement front reaches the midpoint of the porous medium (lf = L/2). Regions with larger pressure gradients are generally accompanied by more pronounced viscosity variations. This correlation arises because higher pressure gradients induce stronger local shear rates, leading to a reduction in apparent viscosity for the shear-thinning fluids. Figure 10G–I display the corresponding fluid saturation distributions at the breakthrough moment (lf = L), which evolves from the pressure fields shown in Figure 10A–C. Under the same M, Newtonian oil ultimately exhibits viscous fingering, whereas shear-thinning oil tends to develop capillary fingering. This difference arises from the irregular, jagged pressure distribution along the vertical section of the displacement front. Figure 10J,K present the pressure profiles at the displacement front and corresponding gradients along the vertical cross-section for the cases shown in Figure 10A–C. Under the same Ca and M, the pressure variation in the shear-thinning oil exhibits more pronounced fluctuations, whereas the Newtonian oil shows a comparatively smoother profile, as shown in Figure 10J. Figure 10K further illustrates this difference where the pressure gradient of the shear-thinning fluid shows larger oscillations. In contrast, the gradient of Newtonian oil is smaller and remains closer to 0 overall, which reflects a more stable displacement front.
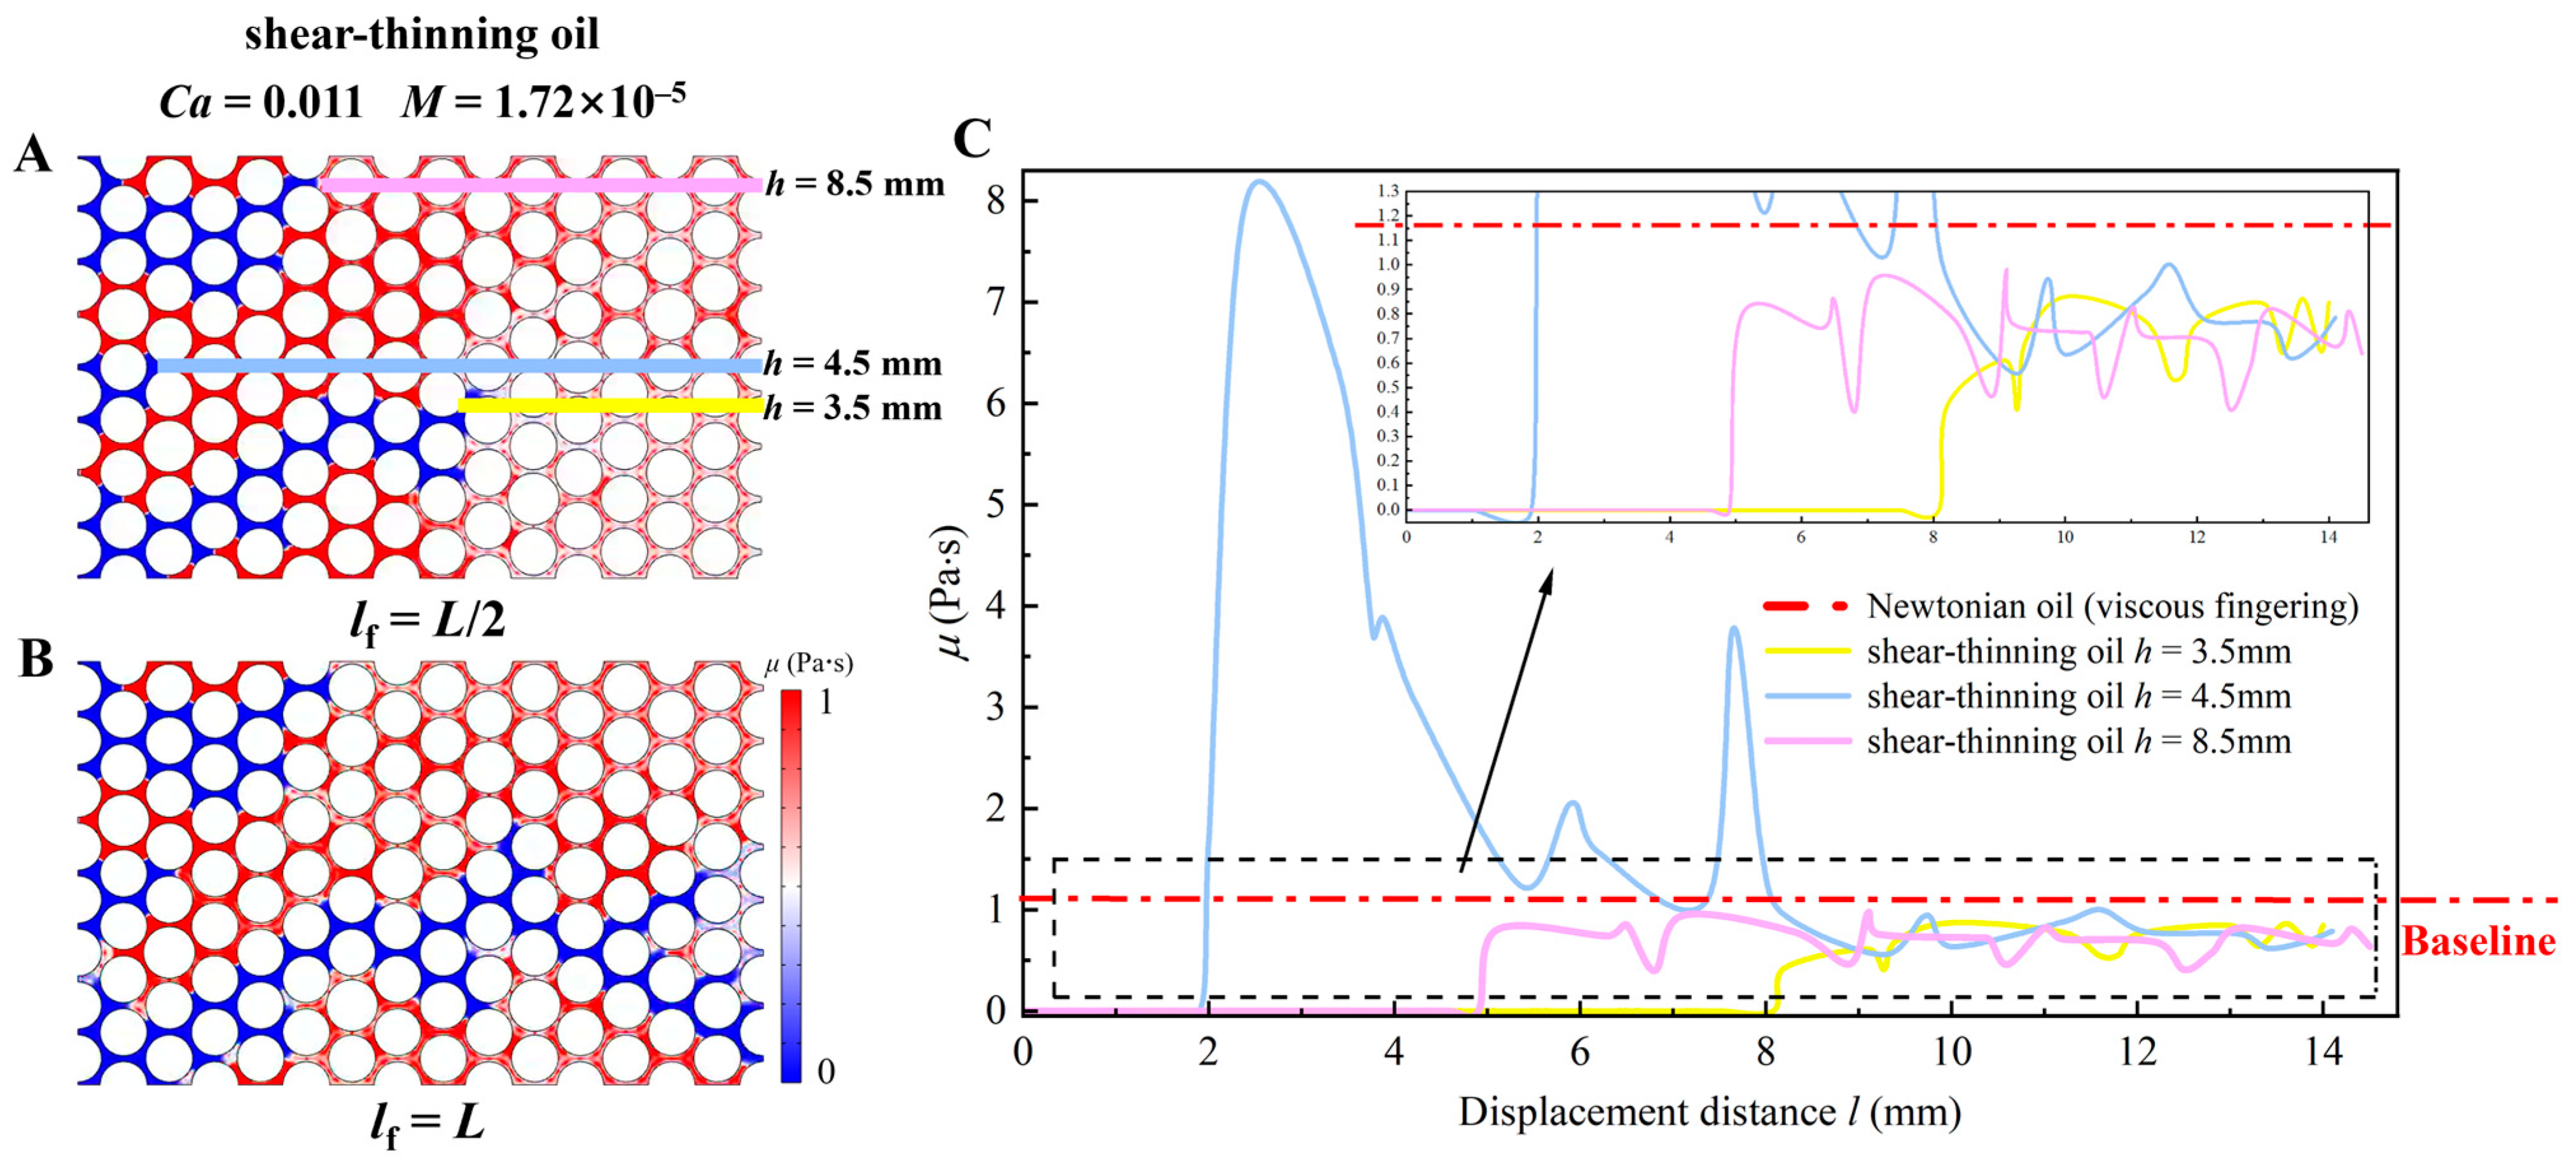
To elucidate the dramatic pressure drop fluctuations at the displacement front of the shear-thinning oil, the viscosity distributions when lf = L/2 and lf = L are illustrated in Figure 11A and B, respectively. As shown in Figure 11A, the viscosity at the front of different fingers differs markedly, exhibiting a clear non-uniform distribution. To investigate the correlation between viscosity distribution and finger evolution, three representative fingers were selected to characterize the distinct development behaviors observed under identical flow conditions: one finger that ultimately extended to the outlet (h = 3.5 mm), one that ceased advancing during this stage (h = 4.5 mm), and one that exhibited limited further advancement but did not reach the outlet (h = 8.5 mm). By comparing these with the fingering morphology at the breakthrough moment in Figure 11B, it is evident that fingers with lower viscosity at the front experience reduced flow resistance, which favors continuous advancement. In contrast, fingers with higher viscosity at the displacement front increased flow resistance, thereby inhibiting further advancement. The viscosity variations along the flow paths of these three selected fingers were quantitatively analyzed, using the Newtonian oil with constant viscosity throughout the displacement process as a reference (indicated by the red dashed line), as shown in Figure 11C. In the shear-thinning oil, the fingers that extend toward the outlet consistently exhibit lower viscosity than the Newtonian baseline, whereas the stagnant finger exhibits significantly higher viscosity compared to the surrounding flow channels. This indicated that changes in shear rate result in a non-uniform viscosity distribution, where regions with lower viscosity advance more readily, while those with higher viscosity tend to remain stationary. The resulting local viscosity imbalance enhances interfacial instability and facilitates the occurrence of capillary fingering in shear-thinning oil under the same Ca and M.

4. Conclusions

In this study, numerical simulations were conducted to examine the effect of shear-thinning on fingering patterns during immiscible CO2 displacement in porous media. The influence of the power-law index (n) and zero-shear viscosity (μ0) on displacement patterns and residual oil saturation were specifically investigated. Corresponding fingering transition phase diagrams were established and compared with those of Newtonian oil, and notable differences were identified. It was found that increases in n and μ0 led to a weakened shear-thinning effect, which promoted the development of fingering and resulted in a significant reduction in displacement efficiency. In addition, under the same Ca and M, shear-thinning oil was found to exhibit a greater tendency for capillary fingering compared to Newtonian oil. This phenomenon was further interpreted through an analysis of the pressure and viscosity fields and was mainly attributed to the viscosity heterogeneity induced by shear-thinning behavior.
Previous studies on CO2 displacement in shear-thinning oil mainly relied on effective viscosity to characterize the flow behavior of shear-thinning oil and to investigate the effect of the viscosity ratio between oil and CO2 on fingering. However, this approach neglects the spatial viscosity heterogeneity caused by the uneven distribution of shear stress. During the CO2 displacement of shear-thinning oil, oil viscosity significantly decreases, and representing the average viscosity often fails to accurately reflect the evolution of fingering. In contrast, using the oil viscosity distribution instead of average viscosity can more accurately represent the influence of shear-thinning behavior on fingering development. This result facilitates the construction of more reasonable fingering transition phase diagrams for shear-thinning oil and provides theoretical guidance for advancing the practical application of CO2 flooding. Although the present study provides valuable insights into the transition mechanisms between capillary and viscous fingering during CO2 immiscible flooding, it should be noted that the findings are based on pore-scale simulations under idealized conditions. Therefore, direct extrapolation to field-scale CO2 flooding should be made with caution. Future work will focus on incorporating larger-scale heterogeneity and reservoir-specific parameters to improve the practical applicability of the results. In addition, our future research will focus on the influence of shear-thinning on fingering under different wettability conditions, including oil-wet, water-wet, and wettability-gradient scenarios. We will examine the flow characteristics of fluids and the changes in capillary effects to provide more theoretical support for optimizing CO2 flooding technologies.

Supplementary Materials

The following supporting information can be downloaded at https://www.mdpi.com/article/10.3390/pr13123771/s1, Figure S1: Independence verification of grid numbers. See the Supplementary Materials for the independence verification of grids.

Author Contributions

W.S.: Conceptualization; Methodology; Investigation; Formal analysis; Writing—original draft. W.H.: Conceptualization; Methodology; Investigation; Formal analysis; Writing—original draft. F.Z.: Methodology; Formal analysis. L.H.: Conceptualization; Methodology; Investigation; Formal analysis; Writing—review and editing; Supervision; Funding acquisition; Project administration. All authors have read and agreed to the published version of the manuscript.

Funding

This work was supported by the National Natural Science Foundation of China (Grant No. 52106204).

Data Availability Statement

The data that support the findings of this study are available from the corresponding author upon reasonable request.

Conflicts of Interest

Author Wei Shi was employed by the CNPC Tubular Goods Research Institute. The remaining authors declare that the research was conducted in the absence of any commercial or financial relationships that could be construed as a potential conflict of interest. The company had no role in the design of the study; in the collection, analyses, or interpretation of data; in the writing of the manuscript, or in the decision to publish the results.

References

  1. Li, L.; Ma, S.; Liu, X.; Liu, J.; Lu, Y.; Zhao, P.; Kassabi, N.; Hamdi, E.; Elsworth, D. Coal measure gas resources matter in China: Review, challenges, and perspective. Phys. Fluids 2024, 36, 071301. [Google Scholar] [CrossRef]
  2. Lu, H.; Xi, D.; Cheng, Y.F. Hydrogen production in integration with CCUS: A realistic strategy towards net zero. Energy 2025, 315, 134398. [Google Scholar] [CrossRef]
  3. Jiang, K.; Ashworth, P.; Zhang, S.; Liang, X.; Sun, Y.; Angus, D. China’s carbon capture, utilization and storage (CCUS) policy: A critical review. Renew. Sustain. Energy Rev. 2020, 119, 109601. [Google Scholar] [CrossRef]
  4. He, L.; He, W.; Wang, S.; Lou, R.; Ren, T.; Cui, H.; Tao, Y.; Yuan, Y. Transport dynamics of droplets encapsulated by an elastic interface in pore throats. Phys. Fluids 2024, 36, 092101. [Google Scholar] [CrossRef]
  5. Qian, C.; Rui, Z.; Liu, Y.; Zhou, K.; Du, K.; Zhao, Y.; Zou, J.; Song, K.; Li, X. Microfluidic investigation on microscopic flow and displacement behavior of CO2 multiphase system for CCUS-EOR in heterogeneous porous media. Chem. Eng. J. 2025, 505, 159135. [Google Scholar] [CrossRef]
  6. Wang, L.; He, Y.; Wang, Q.; Liu, M.; Jin, X. Multiphase flow characteristics and EOR mechanism of immiscible CO2 water-alternating-gas injection after continuous CO2 injection: A micro-scale visual investigation. Fuel 2020, 282, 118689. [Google Scholar] [CrossRef]
  7. Hill, L.B.; Li, X.; Wei, N. CO2-EOR in China: A comparative review. Int. J. Greenh. Gas Control. 2020, 103, 103173. [Google Scholar] [CrossRef]
  8. He, L.; Ren, S.; Zhang, H. Fingering crossover and enhanced oil recovery mechanism of water-alternating-CO2 injection. Phys. Fluids 2023, 35, 053322. [Google Scholar] [CrossRef]
  9. Zhang, N.; Wei, M.; Bai, B. Statistical and analytical review of worldwide CO2 immiscible field applications. Fuel 2018, 220, 89–100. [Google Scholar] [CrossRef]
  10. Salmo, I.C.; Sorbie, K.S.; Skauge, A.; Alzaabi, M.A. Immiscible Viscous Fingering: Modelling Unstable Water–Oil Displacement Experiments in Porous Media. Transp. Porous Media 2022, 145, 291–322. [Google Scholar] [CrossRef]
  11. Ren, J.; Xiao, W.; Pu, W.; Tang, Y.; Bernabé, Y.; Cheng, Q.; Zheng, L. Characterization of CO2 miscible/immiscible flooding in low-permeability sandstones using NMR and the VOF simulation method. Energy 2024, 297, 131211. [Google Scholar] [CrossRef]
  12. Zakirov, T.R.; Khramchenkov, M.G. Pore-scale study of the anisotropic effect on immiscible displacement in porous media under different wetting conditions and capillary numbers. J. Pet. Sci. Eng. 2022, 208, 109484. [Google Scholar] [CrossRef]
  13. Xiao, L.; Zhu, G.; Zhang, L.; Yao, J.; Sun, H. Effects of pore-size disorder and wettability on forced imbibition in porous media. J. Pet. Sci. Eng. 2021, 201, 108485. [Google Scholar] [CrossRef]
  14. Wu, D.S.; Hu, R.; Lan, T.; Chen, Y.F. Role of Pore-Scale Disorder in Fluid Displacement: Experiments and Theoretical Model. Water Resour. Res. 2021, 57, e2020WR028004. [Google Scholar] [CrossRef]
  15. He, L.; Zhao, F.; He, W.; Ren, S.K.; Lou, R.; Song, B.Y. Fingering inhibition triggered by CO2 dissolution and viscosity reduction in water-alternating-CO2 injection. Int. J. Heat Fluid Flow 2024, 110, 109646. [Google Scholar] [CrossRef]
  16. He, L.; Wang, S.; Yuan, Y. Deformation dynamics of rear concave droplet enclosed by nanoparticle surfactants in a capillary. Phys. Fluids 2023, 35, 122112. [Google Scholar] [CrossRef]
  17. Zhang, M.; Li, B.; Zheng, L.; Xin, Y.; Xing, W.; Li, Z. Experimental study on CO2 flooding within a fractured low-permeability reservoir: Impact of high injection rate. Fuel 2025, 384, 134002. [Google Scholar] [CrossRef]
  18. Suo, S.; Liu, M.C.; Gan, Y. Fingering patterns in hierarchical porous media. Phys. Rev. Fluids 2020, 5, 034301. [Google Scholar] [CrossRef]
  19. Sorbie, K.S.; Al Ghafri, A.Y.; Skauge, A.; Mackay, E.J. On the Modelling of Immiscible Viscous Fingering in Two-Phase Flow in Porous Media. Transp. Porous Media 2020, 135, 331–359. [Google Scholar] [CrossRef]
  20. Chang, C.; Kneafsey, T.J.; Tokunaga, T.K.; Wan, J.; Nakagawa, S. Impacts of Pore Network-Scale Wettability Heterogeneity on Immiscible Fluid Displacement: A Micromodel Study. Water Resour. Res. 2021, 57, e2021WR030302. [Google Scholar] [CrossRef]
  21. Saffman, P.G.; Taylor, G.I. The penetration of a fluid into a porous medium or Hele-Shaw cell containing a more viscous liquid. Proc. R. Soc. Lond. Ser. A Math. Phys. Sci. 1958, 245, 312–329. [Google Scholar] [CrossRef]
  22. Verma, P.; Hung, S.-W.; Mao, J.-J.; Chen, C.-Y. Impact of an intermediate layer on immiscible viscous fingering instability in radial Hele-Shaw cell. Int. J. Heat Mass Transf. 2025, 245, 127010. [Google Scholar] [CrossRef]
  23. Lenormand, R.; Touboul, E.; Zarcone, C. Numerical models and experiments on immiscible displacements in porous media. J. Fluid Mech. 2006, 189, 165–187. [Google Scholar] [CrossRef]
  24. Chen, K.; Zhang, Y.; Yin, M.; Zhang, S.; Song, Y.; Zhao, Y. Fluorescence visualization dynamics of carbonated water injection processes in homogeneous glass micromodels. J. Mol. Liq. 2024, 414, 126164. [Google Scholar] [CrossRef]
  25. Beteta, A.; Sorbie, K.; Skauge, A.; Skauge, T. Immiscible viscous fingering: The effects of wettability/capillarity and scaling. Transp. Porous Media 2024, 151, 85–118. [Google Scholar] [CrossRef]
  26. Li, Y.; Liu, H.-Q.; Peng, C.; Jiao, P.; Loh, W.L.; Wang, Q. Insight into evolution of invasive patterns on fingering phenomenon during immiscible two-phase flow through pore structure. Pet. Sci. 2024, 21, 3307–3325. [Google Scholar] [CrossRef]
  27. Singh, P.; Mondal, S. Role of the process conditions on three-dimensional viscous fingering: Impact on enhanced oil recovery and geological storage. Int. J. Multiph. Flow 2025, 184, 105110. [Google Scholar] [CrossRef]
  28. Yang, J.; Mukunoki, T.; Oxarango, L. 3D Visualization of Viscous Fingering in Miscible Fluids Flow in Porous Materials. Transp. Porous Media 2025, 152, 21. [Google Scholar] [CrossRef]
  29. Tsuji, T.; Jiang, F.; Christensen, K.T. Characterization of immiscible fluid displacement processes with various capillary numbers and viscosity ratios in 3D natural sandstone. Adv. Water Resour. 2016, 95, 3–15. [Google Scholar] [CrossRef]
  30. Chen, Y.F.; Fang, S.; Wu, D.S.; Hu, R. Visualizing and quantifying the crossover from capillary fingering to viscous fingering in a rough fracture. Water Resour. Res. 2017, 53, 7756–7772. [Google Scholar] [CrossRef]
  31. Ahmadikhamsi, S.; Golfier, F.; Oltean, C. Impact of surfactant addition on non-Newtonian fluid behavior during viscous fingering in Hele-Shaw cell. Phys. Fluids 2020, 32, 012103. [Google Scholar] [CrossRef]
  32. Nguyen, Q.D.; Luu, D.V.; Nguyen, X.B. Viscoplastic effects on a non-Newtonian fluid flow in rock fracture. AIP Adv. 2025, 15, 035331. [Google Scholar] [CrossRef]
  33. Li, Y.; Liu, H.-Q.; Peng, C.; He, H. Discussion on pore-to-field scale evolution of invasive pattern in immiscible two-phase flow with pseudoplastic behavior in porous media. Phys. Fluids 2025, 37, 023106. [Google Scholar] [CrossRef]
  34. Wang, W.; Liu, P.; Zhou, C.; Bate, B.; Chen, Y. Numerical pore-scale investigation of two-phase displacement with non-Newtonian defending fluid. Phys. Fluids 2024, 36, 093105. [Google Scholar] [CrossRef]
  35. Lee, Y.H.; Wang, J.; Kannaiyan, R.; Su, Y.; Gates, I.D. Air invasion into three-dimensional foam induces viscous fingering instabilities. Sci. Rep. 2024, 14, 2892. [Google Scholar] [CrossRef]
  36. Cao, L.; Lv, M.; Li, C.; Sun, Q.; Wu, M.; Xu, C.; Dou, J. Effects of Crosslinking Agents and Reservoir Conditions on the Propagation of Fractures in Coal Reservoirs During Hydraulic Fracturing. Reserv. Sci. 2025, 1, 36–51. [Google Scholar] [CrossRef]
  37. Li, M.; Liu, J.; Xia, Y. Risk Prediction of Gas Hydrate Formation in the Wellbore and Subsea Gathering System of Deep-Water Turbidite Reservoirs: Case Analysis from the South China Sea. Reserv. Sci. 2025, 1, 52–72. [Google Scholar] [CrossRef]
  38. Wu, J.; Ansari, U. From CO2 Sequestration to Hydrogen Storage: Further Utilization of Depleted Gas Reservoirs. Reserv. Sci. 2025, 1, 19–35. [Google Scholar] [CrossRef]
  39. Shi, Y.; Tang, G.H. Non-Newtonian rheology property for two-phase flow on fingering phenomenon in porous media using the lattice Boltzmann method. J. Non-Newton. Fluid Mech. 2016, 229, 86–95. [Google Scholar] [CrossRef]
  40. Yang, X.; Tang, Y.; Li, M.; Li, C.; Wang, M.; Li, X.; Zhao, J. Effect of shear-thinning of non-Newtonian fluid on the crossover from capillary fingering to viscous fingering in porous media. Phys. Lett. A 2022, 449, 128364. [Google Scholar] [CrossRef]
  41. Omrani, S.; Green, C.; Sahimi, M.; Niasar, V. Anomalies of solute transport in flow of shear-thinning fluids in heterogeneous porous media. Phys. Fluids 2024, 36, 076629. [Google Scholar] [CrossRef]
  42. Al-Qenae, A.; Shokri, J.; Shende, T.; Sahimi, M.; Niasar, V. Enhanced dispersion in shear-thinning fluid flow through porous media. Phys. Rev. Fluids 2025, 10, 063802. [Google Scholar] [CrossRef]
  43. Zhang, S.Q.; Abdallah, K.B.; Li, L.; Hamdi, E.; Liu, J. Multiphase flow controlled by synergistic injection-production pressure: Enabling CO2 geo-sequestration with additional gas recovery from vertically heterogeneous depleted shale reservoirs. Fuel 2025, 398, 135591. [Google Scholar] [CrossRef]
  44. Lu, Z.H.; Li, K.; Liu, X.B.; Zhao, P.; Liu, J. Low-field NMR application in the characterization of CO2 Geological storage and utilization related to shale gas reservoirs: A brief review. Front. Earth Sci. 2023, 17, 739–751. [Google Scholar] [CrossRef]
  45. He, L.; Zhao, F.; Shang, X.; Lou, R.; Sun, P.; Song, B.; Cui, H.; Tao, Y. Detachment dynamics of sessile droplets triggered by interaction forces between oil and wall in a microchannel. Phys. Fluids 2024, 36, 052107. [Google Scholar] [CrossRef]
  46. He, L.; Wang, S.; Han, S.; Yuan, Y.; Yuan, Y.; Shang, X. Shear-thinning stimulative fluid breakup in 3D pore-throat. Chem. Eng. Res. Des. 2024, 201, 362–371. [Google Scholar] [CrossRef]
  47. Georgiadis, A.; Llovell, F.; Bismarck, A.; Blas, F.J.; Galindo, A.; Maitland, G.C.; Trusler, J.; Jackson, G. Interfacial tension measurements and modelling of (carbon dioxide+n-alkane) and (carbon dioxide+water) binary mixtures at elevated pressures and temperatures. J. Supercrit. Fluids 2010, 55, 743–754. [Google Scholar] [CrossRef]
  48. Barrufet, M.A.; Salem, S.K.E.S.; Tantawy, M.; Iglesias-Silva, G.A. Liquid Viscosities of Carbon Dioxide + Hydrocarbons from 310 K to 403 K. J. Chem. Eng. Data 1996, 41, 436–439. [Google Scholar] [CrossRef]
  49. He, L.; Liang, W.; Zhao, F.; Yuan, Y.; Lou, R.; Ren, T.; Liu, W. Role of thermal Marangoni effect on droplet jetting induced by surface acoustic waves. Therm. Sci. Eng. Prog. 2025, 68, 104248. [Google Scholar] [CrossRef]
  50. He, L.; Liang, W.; Yuan, K.; Lou, R.; Ren, T.; Liu, W. Facilitating droplets detachment in microchannels via surface acoustic wave. Phys. Fluids 2025, 37, 082126. [Google Scholar] [CrossRef]
  51. de Castro, A.R.; Goyeau, B. Numerical analysis of the pore-scale mechanisms controlling the efficiency of immiscible displacement of a pollutant phase by a shear-thinning fluid. Chem. Eng. Sci. 2022, 251, 117462. [Google Scholar] [CrossRef]
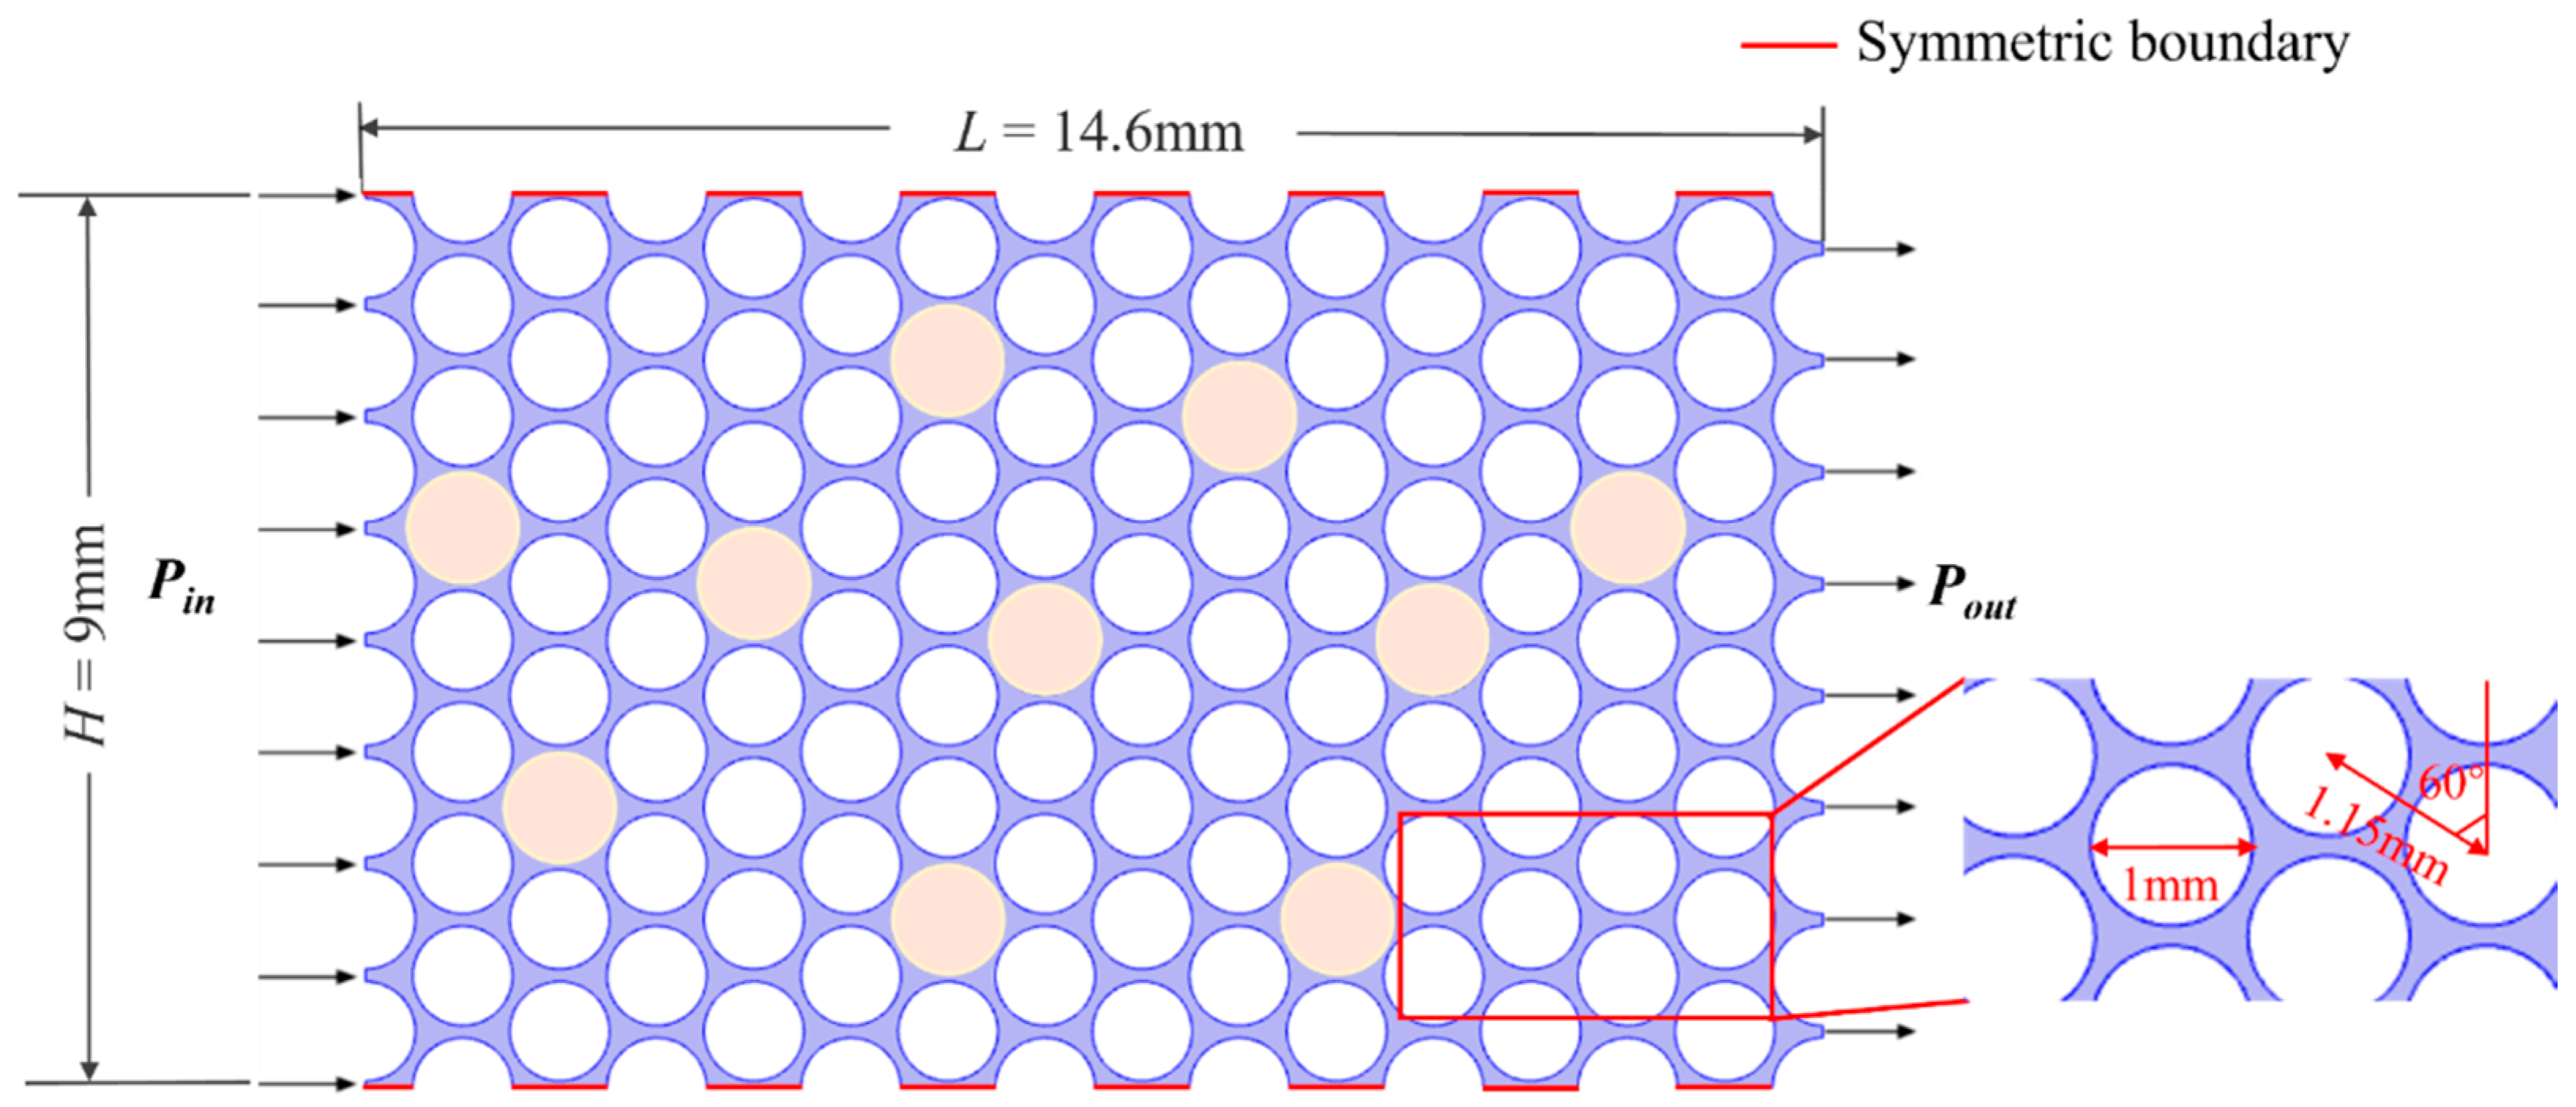
Figure 1. A schematic diagram of the geometric model.
Processes 13 03771 g001
Figure 2. Comparison of CO2 displacement in porous media of flow patterns (A) and residual oil between our model and numerical results obtained by Castro et al. [51] under different uin (B).
Processes 13 03771 g002
Figure 3. Typical displacement patterns (AC) and corresponding viscosity distribution (DF) at breakthrough moment during CO2 displacement of shear-thinning oil.
Processes 13 03771 g003
Figure 4. Two-phase fluid distribution (AC), viscosity distribution (DF), and corresponding variations in residual oil saturation So and average oil viscosity μ ¯ oil (G) under various power-law indices (n) with Ca = 0.24 and μ0 = 10 Pa·s.
Processes 13 03771 g004
Figure 5. Phase diagram of fingering modes at μ0 = 10 Pa·s under various capillary numbers Ca and power-law indices n.
Processes 13 03771 g005
Figure 6. Two-phase distribution (AC), viscosity distribution (DF), and corresponding variations in residual oil saturation So and average oil-phase viscosity μ ¯ oil (G) under different zero-shear viscosities (μ0) with Ca = 0.24 and n = 0.6.
Processes 13 03771 g006
Figure 7. Phase diagrams of fingering under various capillary numbers Ca and zero-shear viscosities μ0.
Processes 13 03771 g007
Figure 8. Fingering phase diagrams of Ca and M at various power-law indices n (A) and zero-shear viscosities μ0 (B).
Processes 13 03771 g008
Figure 9. Comparison of fingering transition between Newtonian and shear-thinning oil. (A) Fingering phase diagrams of Newtonian oil, (B) fingering transition boundaries of Newtonian and shear-thinning oil.
Processes 13 03771 g009
Figure 10. Comparison of pressure distribution (AC), viscosity distribution (DF), and two-phase fluid distribution (GI) between Newtonian and shear-thinning oil, along with pressure profile (J) and its derivative (K) when displacement front reaches midpoint of porous media.
Processes 13 03771 g010
Figure 11. Viscosity distributions of shear-thinning oil when displacement front reaches midpoint of porous media (A) and at breakthrough moment (B), and viscosity profiles along displacement direction at h = 3.5 mm, 4.5 mm, and 8.5 mm (C).
Processes 13 03771 g011
Table 1. Fluid parameters used in this paper.
Symbolρgρoilμgμ0μnλ
Unitkg/m3kg/m3Pa·sPa·sPa·ss
Value142.7718.92 × 10−55~150 [47]0.010.2~0.80.64
Disclaimer/Publisher’s Note: The statements, opinions and data contained in all publications are solely those of the individual author(s) and contributor(s) and not of MDPI and/or the editor(s). MDPI and/or the editor(s) disclaim responsibility for any injury to people or property resulting from any ideas, methods, instructions or products referred to in the content.