Article

Study on the Evolution Law of Four-Dimensional In Situ Stress During Hydraulic Fracturing of Deep Shale Gas Reservoir

1
Shale Gas Research Institute, PetroChina Southwest Oil & Gasfield Company, Chengdu 610000, China
2
State Key Laboratory of Oil and Gas Reservoir Geology and Exploitation, Southwest Petroleum University, Chengdu 610500, China
*
Author to whom correspondence should be addressed.
Processes 2025, 13(12), 3772; https://doi.org/10.3390/pr13123772
Submission received: 17 September 2025 / Revised: 22 October 2025 / Accepted: 17 November 2025 / Published: 21 November 2025
(This article belongs to the Section Energy Systems)

Abstract

The increasing burial depth of deep shale formations in the southern Sichuan leads to more complex in situ stresses and geological structures, which in turn raises the challenges of hydraulic fracturing. Although enlarging the treatment scale and injection rate can enhance reservoir stimulation, the intensive development of faults and fractures in deep shale formations aggravates stress instability, inducing casing deformation, fracture communication, and other engineering risks that constrain efficient shale gas production. In this study, a cross-scale geomechanical model linking the regional to near-wellbore domains was constructed. A dynamic evolution equation was established based on flow–stress coupling, and a numerical conversion from the geological model to the finite element model was implemented through self-programming, thereby developing a simulation method for dynamic geomechanical evolution during hydraulic fracturing. Results indicate that dynamic variations in pore pressure dominate stress redistribution, while near-wellbore heterogeneity and mechanical property distribution significantly affect prediction accuracy. The injection of fracturing fluid generates a high-pressure gradient that drives pore pressure diffusion along fracture networks and faults, exhibiting a strong near-wellbore but weak far-field non-steady spatial attenuation. As the pore pressure increases, the peak value reaches 1.4 times the original pressure. The triaxial stress shows a negative correlation and decreases. The horizontal minimum principal stress shows the most significant drop, with a reduction of 15.79% to 20.68%, while the vertical stress changes the least, with a reduction of 5.7% to 7.14%. Compared with the initial stress state, the horizontal stress difference increases during fracturing. Rapid pore-pressure surges and fault distributions further trigger stress reorientation, with the magnitude of rotation positively correlated with the intensity of pore-pressure variation. The high porosity and permeability characteristics of the initial fracture network lead to a rapid attenuation of the stress around the wellbore. In the middle and later stages, as the pressure balance is achieved through fracture filling, the pore pressure rises and the stress decline tends to stabilize. The findings provide significant insights into the dynamic stress evolution of deep shale reservoirs during fracturing and offer theoretical support for optimizing fracturing design and mitigating engineering risks.

1. Introduction

With the continuous development of China’s socio-economy, energy demand remains at a high level. Currently, China’s external dependence on oil and natural gas has exceeded 70% and 40%, respectively, resulting in a significant gap between energy supply and demand, which poses a severe challenge to national energy security [1,2,3]. Against this backdrop, shale gas, as an unconventional natural gas resource with enormous potential, has not only reshaped the global energy supply landscape but also become a key area for China’s energy development. China is rich in shale gas resources, with reserves of approximately 36.1 × 10¹² m3, ranking first in the world. Among this, the Sichuan Basin accounts for as high as 68.4% of the total shale gas resources in China, and the deep shale gas in southern Sichuan alone makes up over 80% of the total shale gas resources in the Sichuan Basin, demonstrating tremendous potential for exploration and development. Accelerating shale gas development holds important strategic significance for safeguarding national energy security, optimizing the energy structure, and promoting the development of a low-carbon economy [4,5,6].
As the focus of exploration and development gradually shifts to deep formations, certain progress has been made in the exploration of deep shale gas in the Sichuan Basin; however, its deep-layer development still faces numerous technical bottlenecks. Deep shale reservoirs generally exhibit characteristics of high compactness, low porosity, and low permeability, and large-scale hydraulic fracturing is essential to establish complex fracture networks for effective exploitation. Nevertheless, due to strong reservoir heterogeneity and the widespread development of natural microfractures and faults, the injection of fracturing fluid causes a sharp increase in pore pressure and disturbance of the stress field, inducing the redistribution of in situ stress and forming a complex local stress state. Such stress changes and complex geological structures not only restrict the propagation pattern and conductivity of fractures (making fracturing effects difficult to predict) but also easily lead to shear failure of reservoir rock masses and fault slippage, threatening wellbore stability and operational safety. Among these issues, casing deformation is particularly prominent, which has become a core obstacle restricting the fracturing efficiency and productivity construction of deep shale gas [7,8,9]. The essence of the above problems lies in the insufficient understanding of the dynamic evolution mechanism of the in situ stress field in deep shale reservoirs during the fracturing process.
To reveal the dynamic response mechanism of in situ stress during the fracturing process, scholars at home and abroad, driven by the concept of geology-engineering integration, have widely adopted numerical simulation methods to conduct relevant research. At present, seepage-stress coupling models based on different numerical approaches—such as the finite difference method (FDM), discrete element method (DEM), and finite element method (FEM)—have been applied to simulate the dynamic changes in formation pressure and stress field during actual fracturing processes. Dean et al. [10] compared three coupling approaches—explicit solution, implicit itera-tion, and fully coupled methods—showing that they produce similar results, while the choice depends on feasibility, numerical stability, and computational efficiency. Hatch-ell et al. [11,12,13] integrated reservoir simulators with seismically driven geomechanical models to develop four-dimensional (4D) stress models incorporating production and injection time effects. Zhang et al. [14] introduced a fully coupled multi-scale numerical simulation approach and applied the discrete element method to qualitatively assess the role of natural fractures in hydraulic fracturing. Marongiu-Porcu et al. [15] utilized a three-dimensional finite element model that accounted for geomechanical conditions, fracture propagation, and its interactions with the discrete fracture network (DFN), thereby analyzing the dynamic evolution of stress magnitudes and orientations. Yang et al. [16,17] investigated how fracture parameters and rock mechanical properties in-fluence reservoir stress evolution during shale gas production using FEM. Zhao et al. [18,19,20] applied the displacement discontinuity method to develop mathematical models of multi-cluster fracture-induced stresses, revealing that fracture-induced stress significantly increases local stresses and fracture initiation pressures. Furui et al. [21] emphasized that hydraulic fracturing damages reservoir rock structures, causing localized compaction and deformation, while also generating high-pore-pressure zones near the wellbore. Zhang et al. [22] examined infill well fracturing in New Mexico’s Avalon shale by integrating complex fracture modeling workflows with FEM-based stress analysis, successfully history-matching legacy production and analyzing stress redistribution. Zhu et al. [23,24] comprehensively considered reservoir geomechanical parameters, and the heterogeneity and anisotropy of natural fractures in the Sichuan Basin’s X1 shale gas block. Using ECLIPSE and ABAQUS in an iterative finite element coupling scheme, they simulated dynamic stress evolution, fracture propagation, and infill well performance, ultimately identifying optimal fracturing timing for shale gas field development.
Although significant progress has been made in simulating the in situ stress response during hydraulic fracturing in previous studies, most models still rely on simplified assumptions and inadequately capture the coupling mechanisms between complex fracture networks and dynamic stress in deep shale reservoirs. In particular, there remains a lack of in-depth understanding of the fully coupled dynamic stress evolution under the influence of heterogeneity and natural fracture systems. Therefore, it is imperative to establish an integrated analysis framework that comprehensively incorporates geological characteristics, mechanical responses, and fracturing processes to systematically elucidate the dynamic evolution mechanisms of in situ stress during deep shale gas fracturing.
Guided by the concept of geology-engineering integration, this study addresses the geological conditions and engineering requirements of deep shale gas reservoirs in southern Sichuan and focuses on the core issue of dynamic in situ stress variation during fracturing. A tripartite research framework is constructed, encompassing “detailed geological characterization—geomechanical parameter modeling—fully coupled dynamic stress simulation.” By combining theoretical analysis with numerical simulation, this work systematically reveals the dynamic evolution laws of in situ stress during fracturing, with the aim of providing theoretical support and technical guidance for fracturing optimization and engineering risk control in the efficient development of shale gas.

2. Theory

2.1. Theory of Multi-Physics Field Coupling for Fluid Flow and Geomechanics in Fractured Zones of Shale Reservoirs

2.1.1. The Numerical Simulation Method for the Full Coupling of Fluid and Solid in the Evolution of In Situ Stress

In view of reservoir heterogeneity, anisotropy, and practical fracturing schedules, a fully coupled, multi-scale numerical approach is proposed to simulate the dynamic evolution of in situ stress during fracturing. Multi-source data (well data, seismic, logs) and laboratory rock-mechanics tests are integrated to construct a fine-scale geological model of the fracturing zone containing petrophysical and geomechanical parameters. Microseismic point-cloud data are used to calibrate the extent of fracture network growth. To balance field applicability and numerical accuracy, geological modeling and finite-element modeling are bridged via self-programming that converts the fine-scale model (including geomechanical parameters and microseismic data) into finite-element meshes with material attributes. Fully coupled computation is adopted; stress-sensitive porosity/permeability models are introduced to update properties in real time; and equivalent material treatments are used to represent faults and fracture networks. Initial pore pressure and in situ stress serve as mechanical boundaries, and the evolving flow field provides coupled boundary conditions, enabling a four-dimensional dynamic evaluation of in situ stress during fracturing.

2.1.2. Seepage-Geomechanics Fully Coupled Model

Considering deep shale-reservoir characteristics, an isothermal Darcy-flow and solid-mechanics fully coupled mathematical model is employed. The fluid phase is assumed to be weakly compressible; the porous medium is treated as an isotropic elastic solid under small-strain conditions. During full coupling, the governing equations of the flow field and the solid-mechanics stress field are assembled into a unified system. The reservoir model is described jointly by the fluid-flow equations, rock-matrix equations, and stress-sensitive porosity/permeability relations.
(1)
Reservoir rock mass control equation
Taking into account the lithological characteristics of shale reservoirs, in order to avoid the imbalance in the simulation, the deformation of porous media under the assumption of small deformation and isotropic elasticity is adopted. Under this assumption, an equivalent elastic model of porous media is established. On this basis, the effective stress and constitutive equation of Biot’s equivalent elastic model are used:
σ e = σ α B P I ,
α B = 1 K d K s .
According to the constitutive equation of elasticity, by replacing the stress tensor of the elastic body with the effective stress tensor, and adding the contribution of pore pressure to the total stress tensor, the constitutive equation of the stress field for the porous medium of reservoir rock can be obtained:
C ε u s = σ α B P I ,
σ e = C ε u s .
The governing equations of the combined small deformation porous elastic model are as follows. The control equations for the rock mass adopt the modified constitutive equation of the porous medium stress field, the equilibrium differential equation, and the geometric equation as shown below:
C ε u s = σ α B P I ,
σ = F V ,
ε u s = 1 2 u s T + u s .
In Equations (1)–(7), σ denotes the total stress tensor (Pa); σe denotes the effective stress tensor (Pa); αB is the Biot coefficient, dimensionless; P is the pore-fluid pressure (Pa); I is the Cartesian identity tensor, dimensionless; Kd is the drained bulk modulus of the porous medium (Pa); Ks is the bulk modulus of the solid grain framework (Pa); C is the fourth-order elastic tensor (with Poisson’s ratio ν and Young’s modulus E (Pa) as components); ε is the small-strain tensor (–); ∇ is the vector differential operator (m−1); U is the displacement vector (m); ∇U is the tensor product ∇⊗U (–); (∇U)T is the transpose of ∇U; ∇·σ is the divergence of the stress tensor (Pa·m−1); and FV is the body force vector (N).
(2)
Reservoir fluid flow control equation
Based on the experimental data of pore and permeability in shale reservoirs and the analysis of their physical properties, it is assumed that the fluids in the reservoir during the fracturing process are micro-compressible and satisfy the Darcy’s law of seepage, and without considering the temperature change, the fluid control equation is the Darcy momentum equation of the seepage field:
v = κ μ P + ρ g .
Ignoring gravity:
v = κ μ P .
The continuity equation can be obtained through the conservation of mass of the fluid flowing in the pores:
t ϕ ρ + ρ v = Q .
By integrating the Darcy’s law and the continuity equation, the following equation can be obtained:
t ϕ ρ + ρ κ μ P = Q .
In Equations (8)–(11), v is the Darcy velocity vector; κ is the permeability tensor (for isotropic flow κ = κI, m2); μ is the dynamic viscosity (Pa·s); ∇P is the pressure gradient (Pa·m−1); g is the gravitational acceleration vector (m·s−2); t is the time (s); ρ is the fluid density (kg·m−3); ϕ is the porosity; and Q is the mass source/sink term (kg·s−1).
(3)
Sensitivity control equation for reservoir fluid seepage stress
Both the seepage field and the stress field in porous media contain the common pore pressure variable, which enables the establishment of a full coupling between seepage and stress. However, during the fracturing construction process, the change in pressure boundary conditions in the formation and the seepage of fluids will lead to the redistribution of formation pore pressure. The changes in the stress field should be considered to quantitatively affect the porosity and permeability. For porous elastic media, the changes in pore pressure and stress conditions will cause deformation of the rock skeleton, resulting in changes in porosity. According to the Kozeny–Carman formula, permeability is closely related to porosity, and permeability will also change accordingly. The seepage field will then change again, forming a new round of coupling with pore pressure. Therefore, a stress-sensitive model for porosity and permeability should be established to update the seepage parameters in real time. The coupling process is shown in Figure 1.
The porosity and permeability stress sensitivity model can be expressed as [25]
ϕ = 1 ϕ 0 e ε v ,
K = K 0 1 ϕ 0 ( 1 + ε v ) 3 1 ϕ 0 ϕ 0 ( 1 + ε v ) 1 3 .
In Equations (12) and (13), K0 is the initial permeability (m2); K is the current permeability (m2); and εv is the volumetric strain.
(4)
Darcy Flow–Stress Coupling
By assembling the fluid-flow equations, rock-matrix equations, and stress-sensitivity relations, a closed flow–solid coupled system is obtained. With appropriate initial and boundary conditions for the near-wellbore stress and flow fields, the dynamic distribution of in situ stress in shale reservoirs can be solved during hydraulic fracturing.

3. Model-Construction of a Four-Dimensional Geostress Evolution Model Based on the Coupling of Seepage and Geomechanics

3.1. Establishment of a Fine-Scale Geomechanical Model in the Target Block

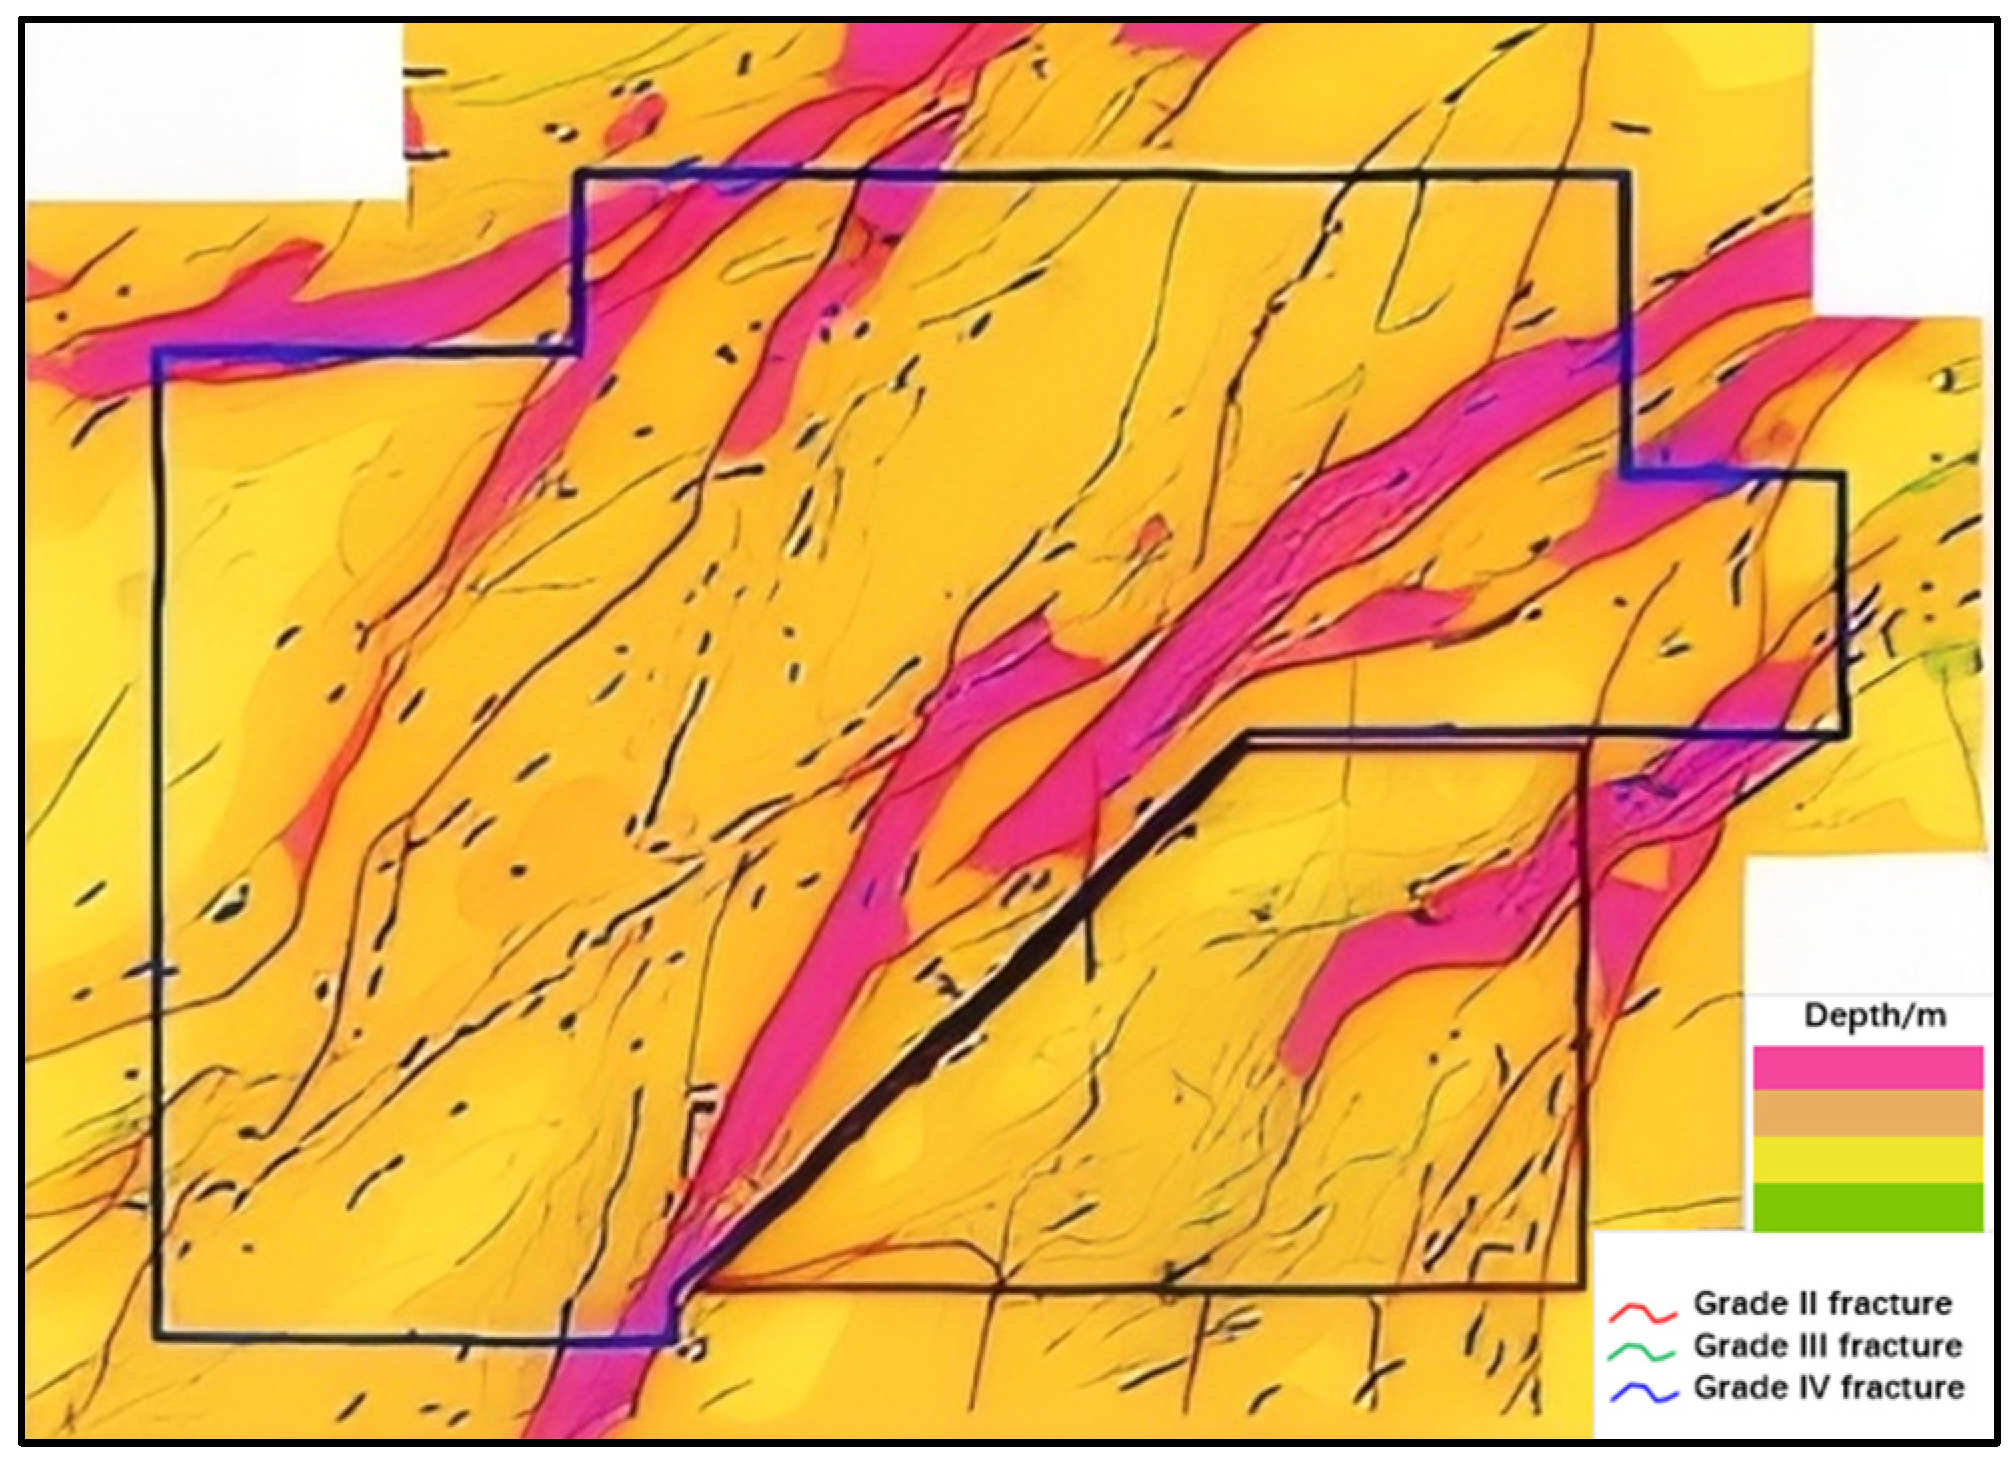
The target block is located in the southern Sichuan region, with a terrain that is higher in the northeast and lower in the southwest. It belongs to the high and steep tectonic zone in the southeast of Sichuan. The target block was formed by the superposition of multiple tectonic movements. The tectonic form is mainly long and narrow, with a relatively high uplift amplitude, and the axis is mainly in the northeast direction. The tectonic pattern of the target block is shaped by the combination of uplift, fault zones and the development of secondary faults. The development patterns of faults caused by different tectonic units show strong spatial differences. A large number of secondary faults are developed in the area, mostly parallel or distributed in a large-scale oblique manner, controlling the development direction of local fractures. The strike of faults is mainly in the northeast-southwest direction, and large faults are well developed. The scale of faults increases from north to south (Figure 2).
The model established based on the integrated platform of Petrel software (version 2024.8) has its core advantage in achieving the integration of multi-disciplinary data and a unified workflow. This model can seamlessly integrate multi-source data such as seismic, logging, and geology in a shared three-dimensional environment. It particularly utilizes its advanced discrete fracture network (DFN) technology to precisely characterize the natural fracture system. Moreover, with its powerful three-dimensional visualization and mesh modeling capabilities, the model effectively depicts the heterogeneity of the reservoir, providing a reliable technical foundation for subsequent full-coupled dynamic stress simulation and analysis [26]. Well and layer data from the target reservoir were compiled to define the study area, focusing on horizontal sections of shale rich in natural fractures and organic matter. Microseismic monitoring was used to calibrate the extent of fracture-network growth and to delineate the fracturing zone. The reservoir is tight, with matrix porosity of 2.0–6.0% and permeability of 0.0066–0.594 mD. The gradients of the maximum horizontal, minimum horizontal, and vertical stresses are 2.56, 2.03, and 2.30 MPa/100 m, respectively. The stress state satisfies σH > σV > σh (strike-slip regime). A 3D structural model with a grid size of 25 m × 25 m × 5 m was established. Petrophysical and geomechanical parameters were constrained by laboratory tests; variograms (exponential model) were used to analyze principal directions and ranges; and sequential Gaussian simulation was applied for inter-well interpolation to build a fine-scale property model of the block (Figure 3).

3.2. Establishment of the Finite Element Geomechanical Model

3.2.1. Geometric Conversion of Geological Structures and Grid Construction

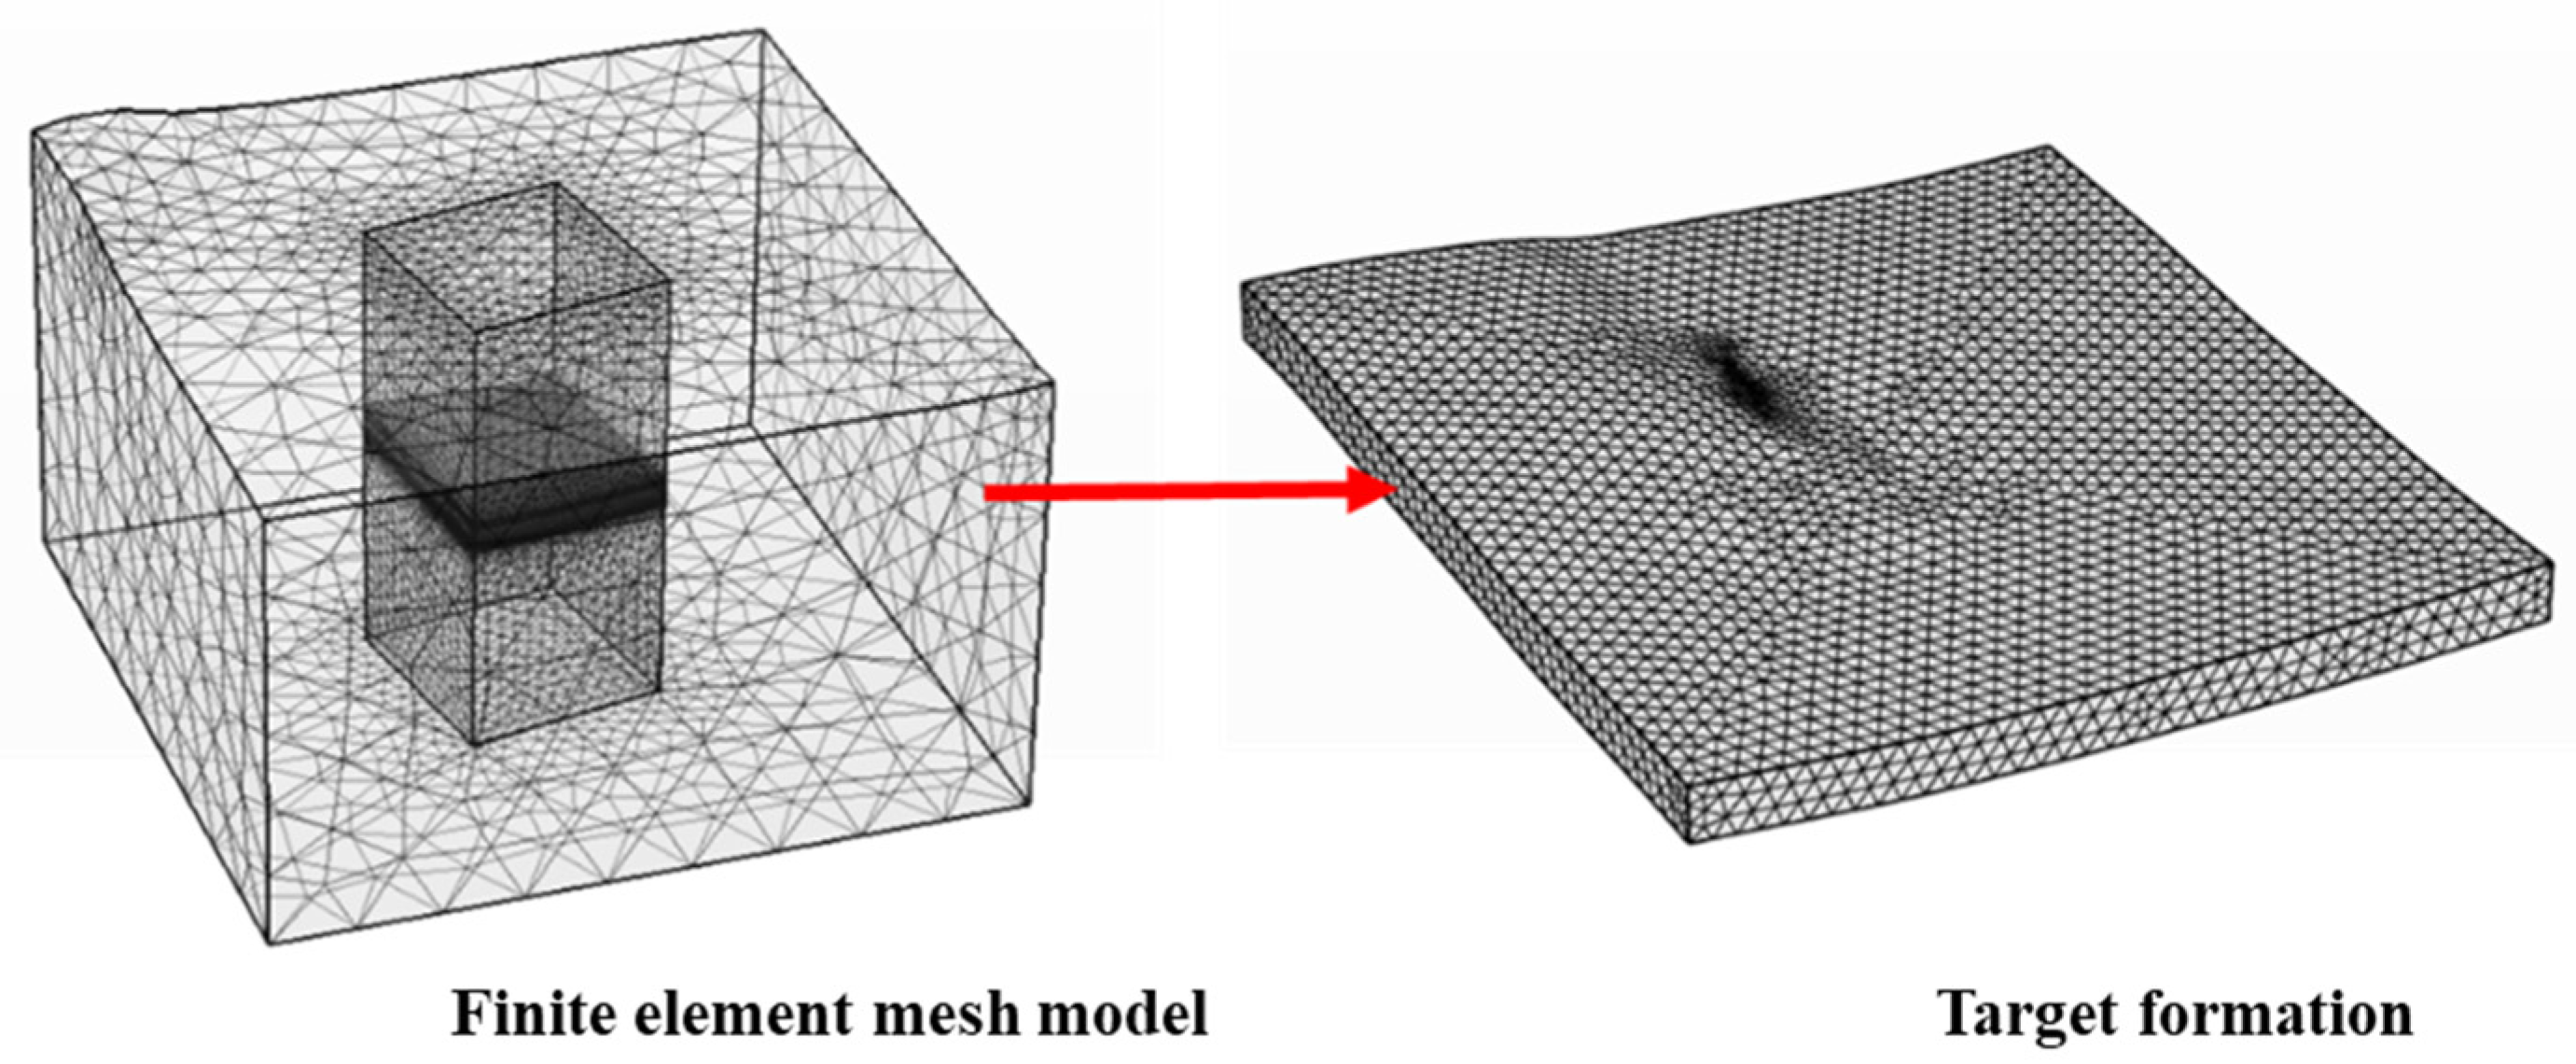
Based on the fine-scale model, a finite-element (FE) model was constructed. Computational graphics algorithms were used to process microseismic point-clouds, obtaining the fracturing-zone geometry and defining the monitoring domain (microseismic geometric domain). Faults and stratigraphic surfaces interpreted from field data were honored by converting triangular surface meshes (TS format) to STL format via self-written code (Figure 4), enabling accurate representation of geological structures. To mitigate boundary effects, enclosing wall rock of 1–3 times the target-layer scale was added around the target formation to build a larger geologic geometry (Figure 5). Because stress transmits dynamically during fracturing, a uniformly fine mesh would cause excessive model size and non-convergence. Therefore, an adaptive tetrahedral meshing strategy was adopted: coarse meshes in the outer wall rock and locally refined sweeping meshes near the fracturing zone and wellbore. The final model contains 1,141,049 volume elements, 37,538 boundary elements, and 2266 edge elements.

3.2.2. Construction of Finite Element Attribute Parameter Fields for Mechanical Properties and Fluid Flow Characteristics in the Fracturing Zone

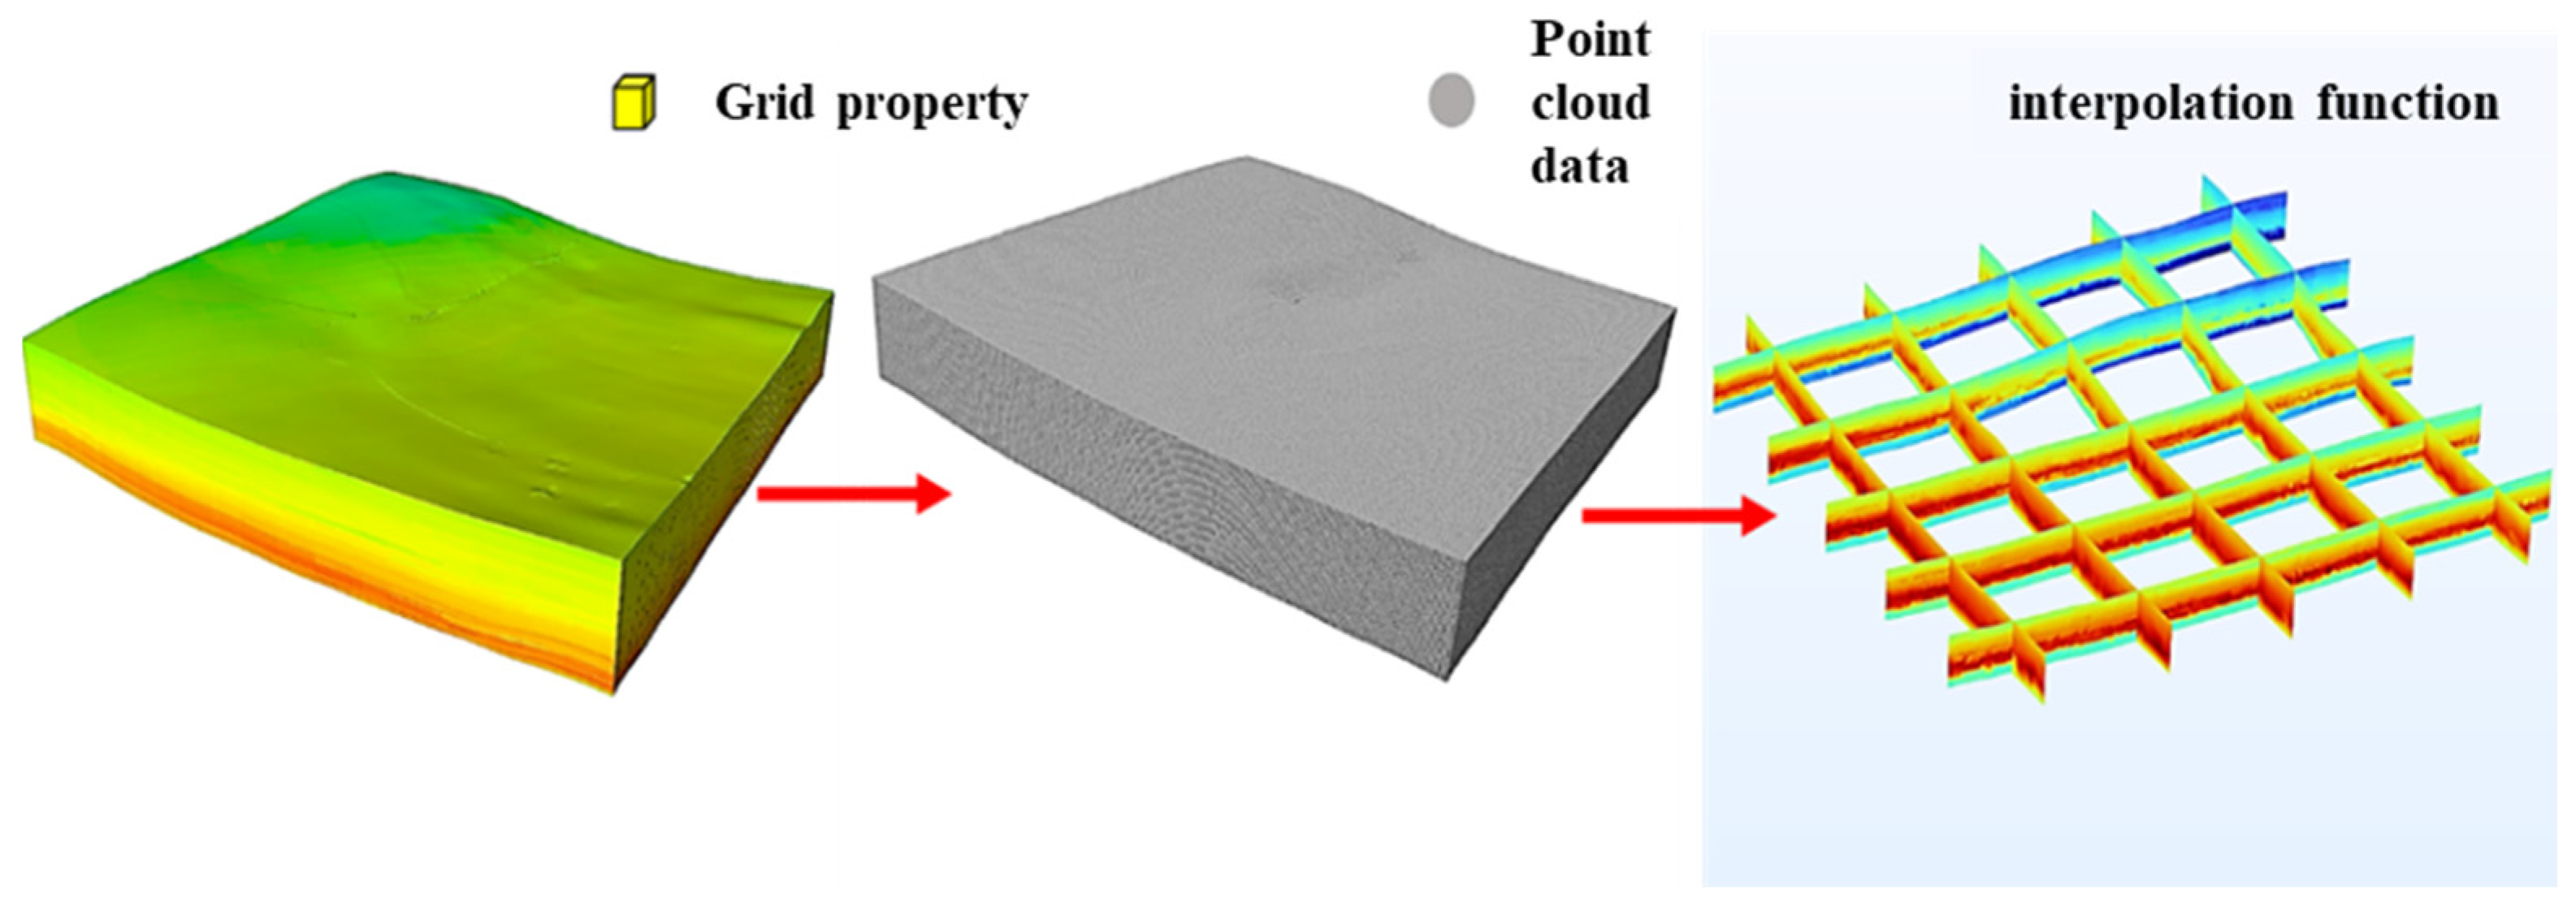
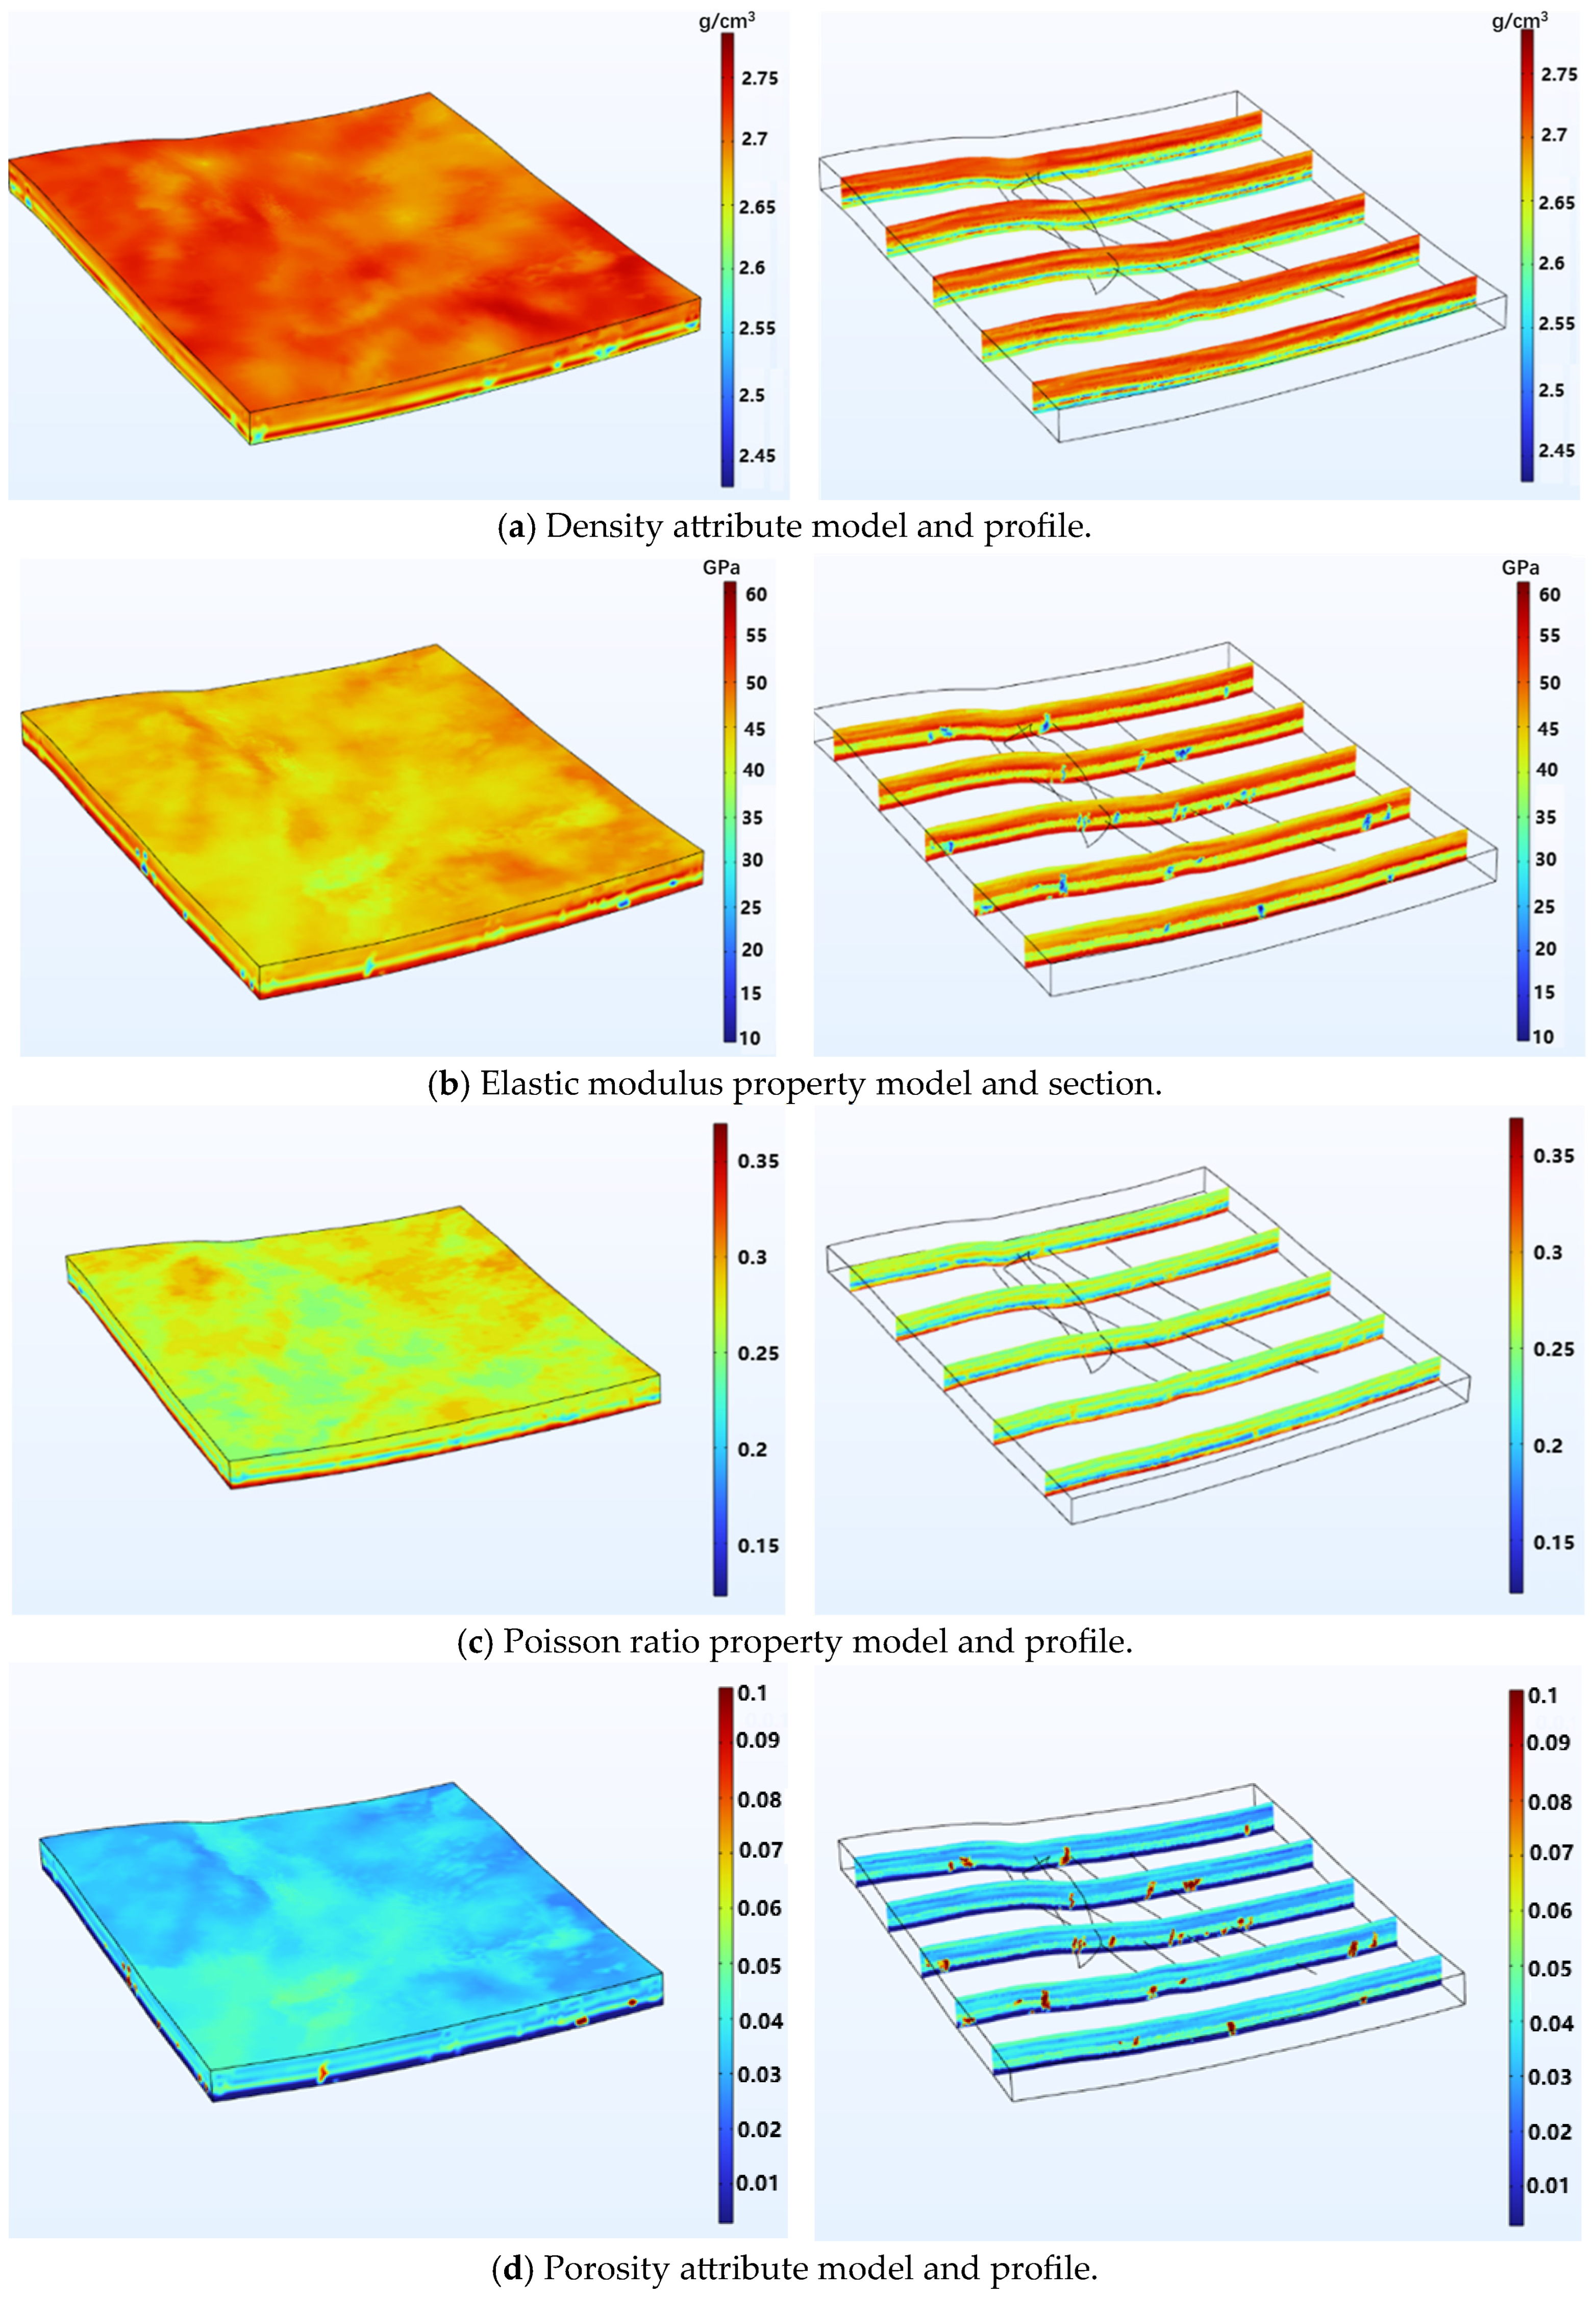
The fine-scale property model is grid-based, and its application in FE coupling requires format conversion of attributes. By binding property parameters to grid locations, a grid-to-point conversion yields attributed point-cloud data. Three-dimensional interpolation functions are then constructed to map properties onto FE meshes (Figure 6). The advantage is that the precision of material properties in the FE model can be controlled flexibly by adjusting the resolution of the geological model. Faults, fractures, and microseismic activation regions were not explicitly meshed as complex domains; instead, they were represented by equivalent materials. According to field data and empirical formulas, regions traversed by these features were equivalently assigned high porosity and permeability and low elastic modulus. Through interpolation, the fine-scale property model was mapped to the FE mesh to reconstruct formation parameters in the fracturing zone (Figure 7).

3.3. Construction of Fluid-Solid Coupling Seepage and Geostress Field

Based on the geological mechanics model, the indoor experiments on the magnitude of in situ stress and pore permeability parameters, combined with the fracturing construction conditions of horizontal well sections in shale reservoirs and the in situ stress, pore pressure and physical parameters under fracturing conditions, the boundary conditions of the target layer stress field and the internal boundary conditions of the seepage field were set. The simulation of the in situ stress and seepage boundary was carried out, and the four-dimensional dynamic seepage-stress coupling physical field of the reservoir was constructed [27,28].

3.3.1. Simulation of the Original In Situ Stress Field

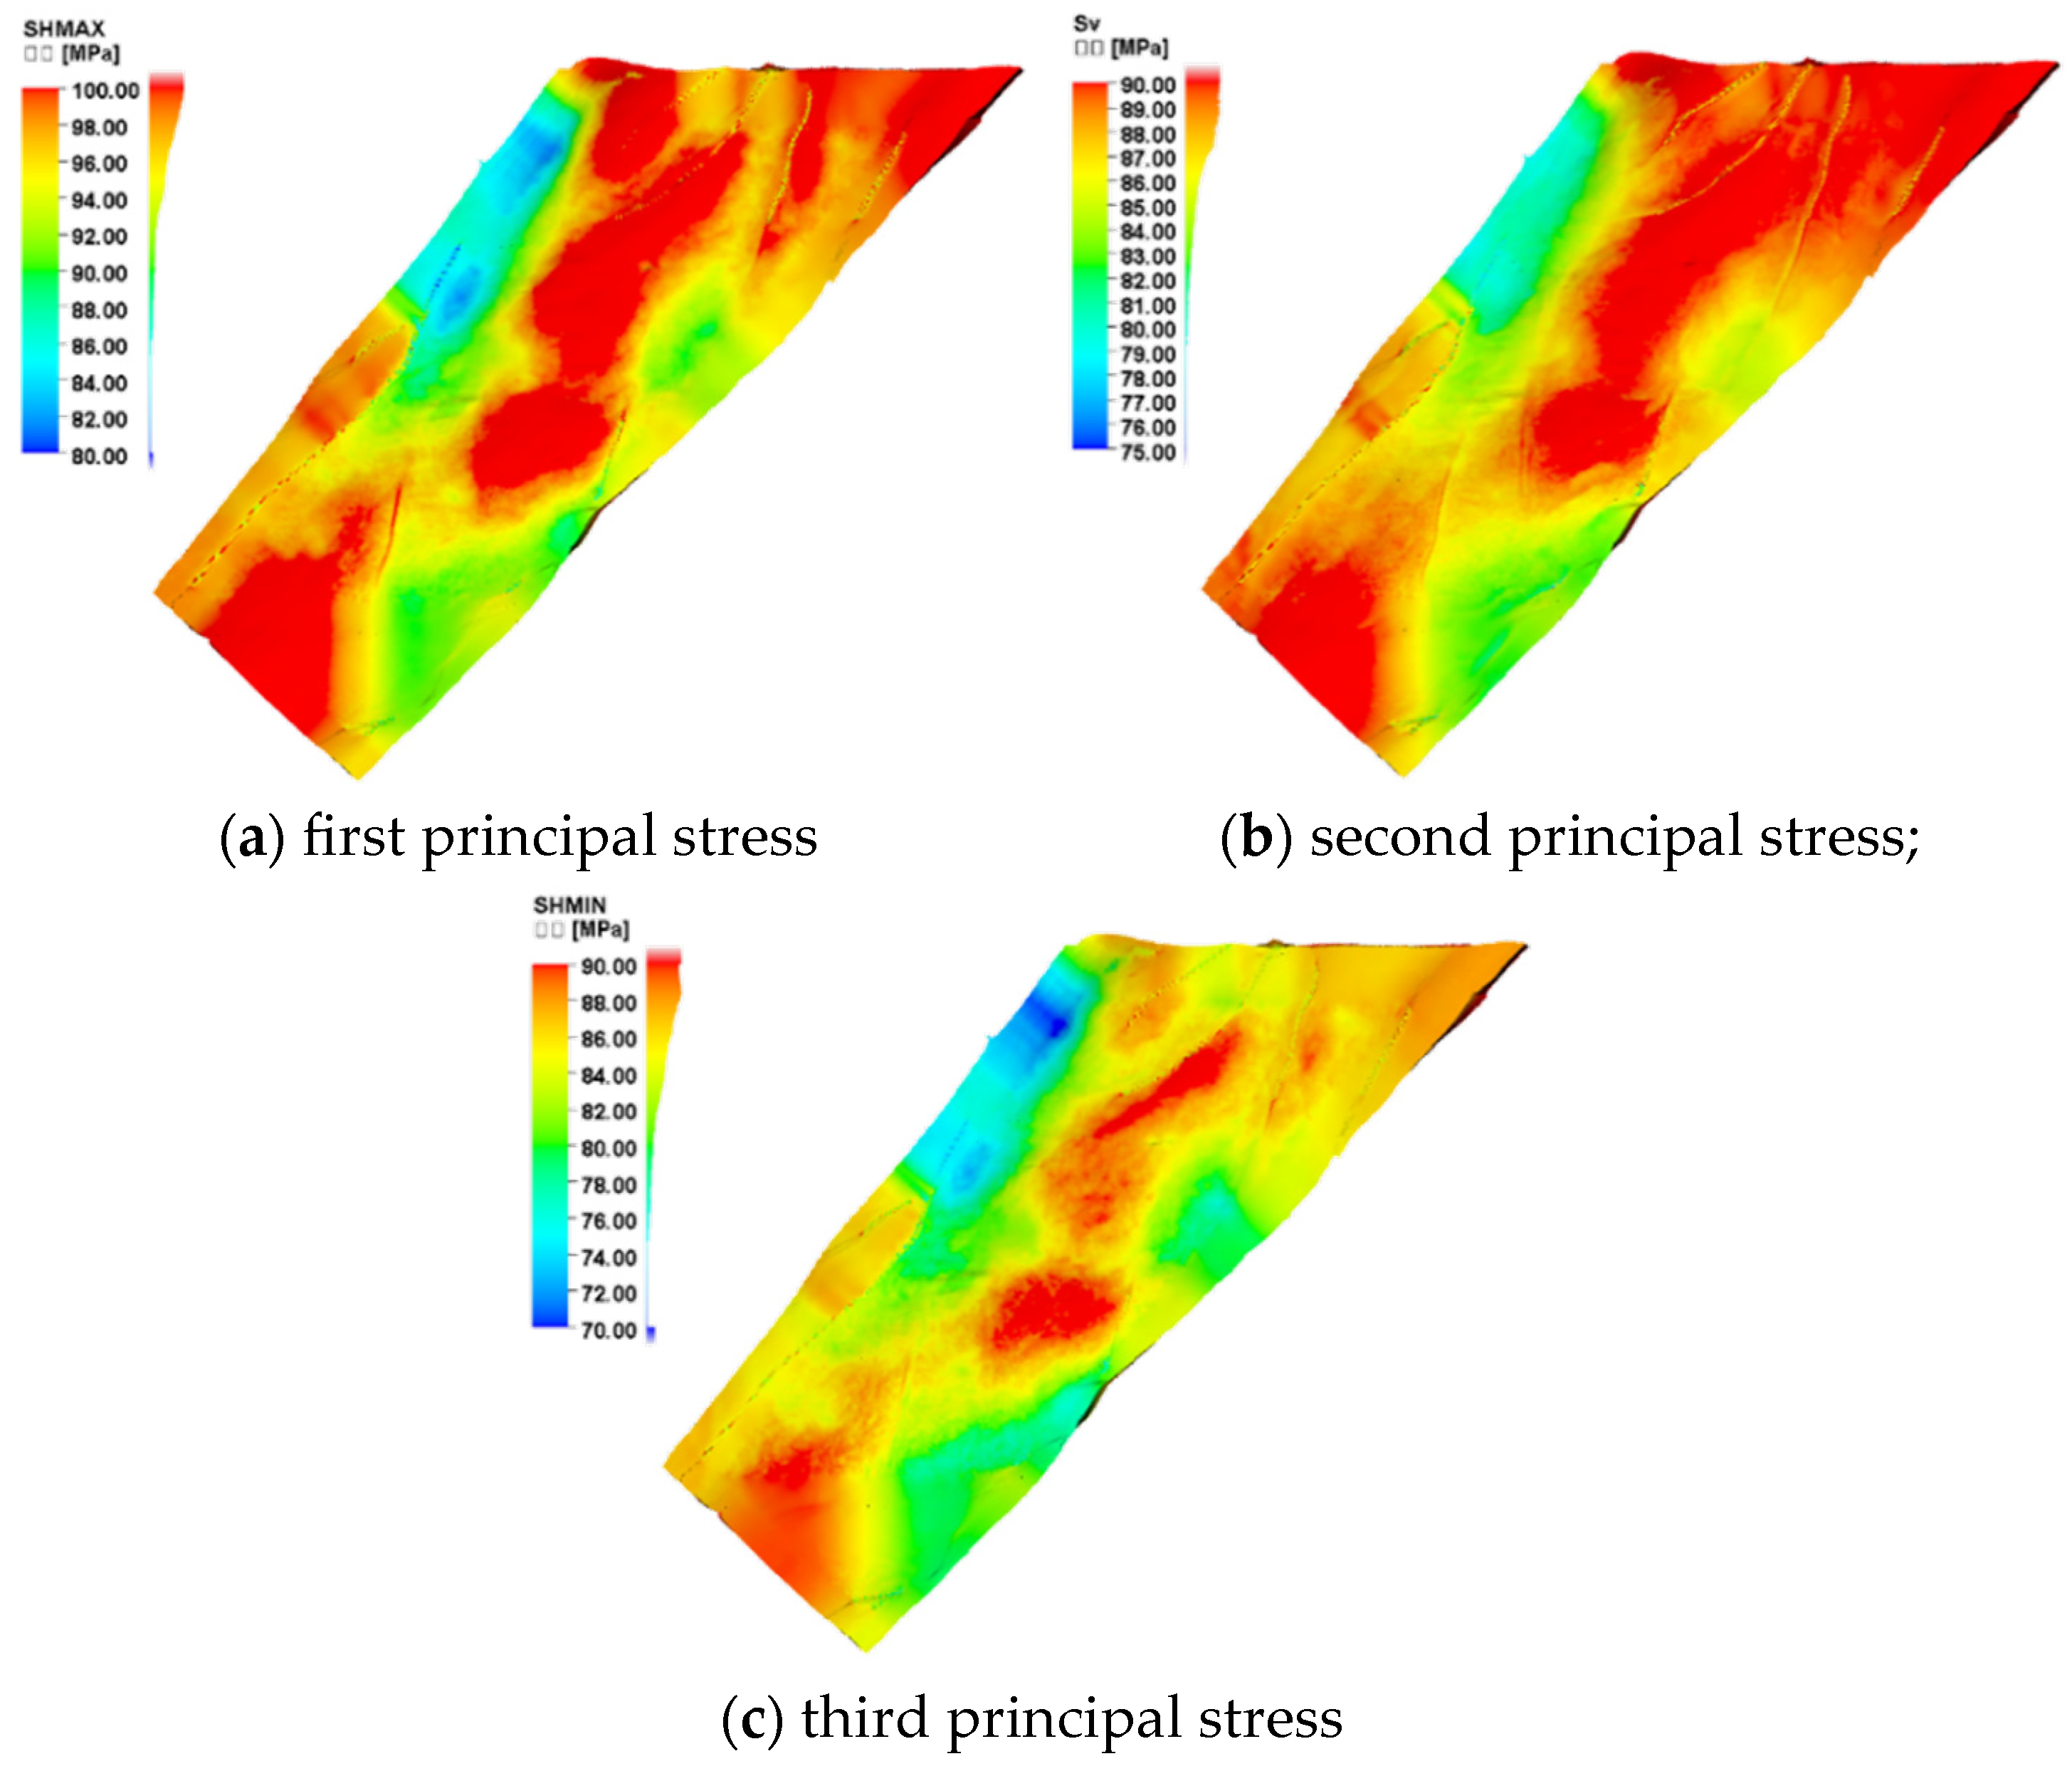
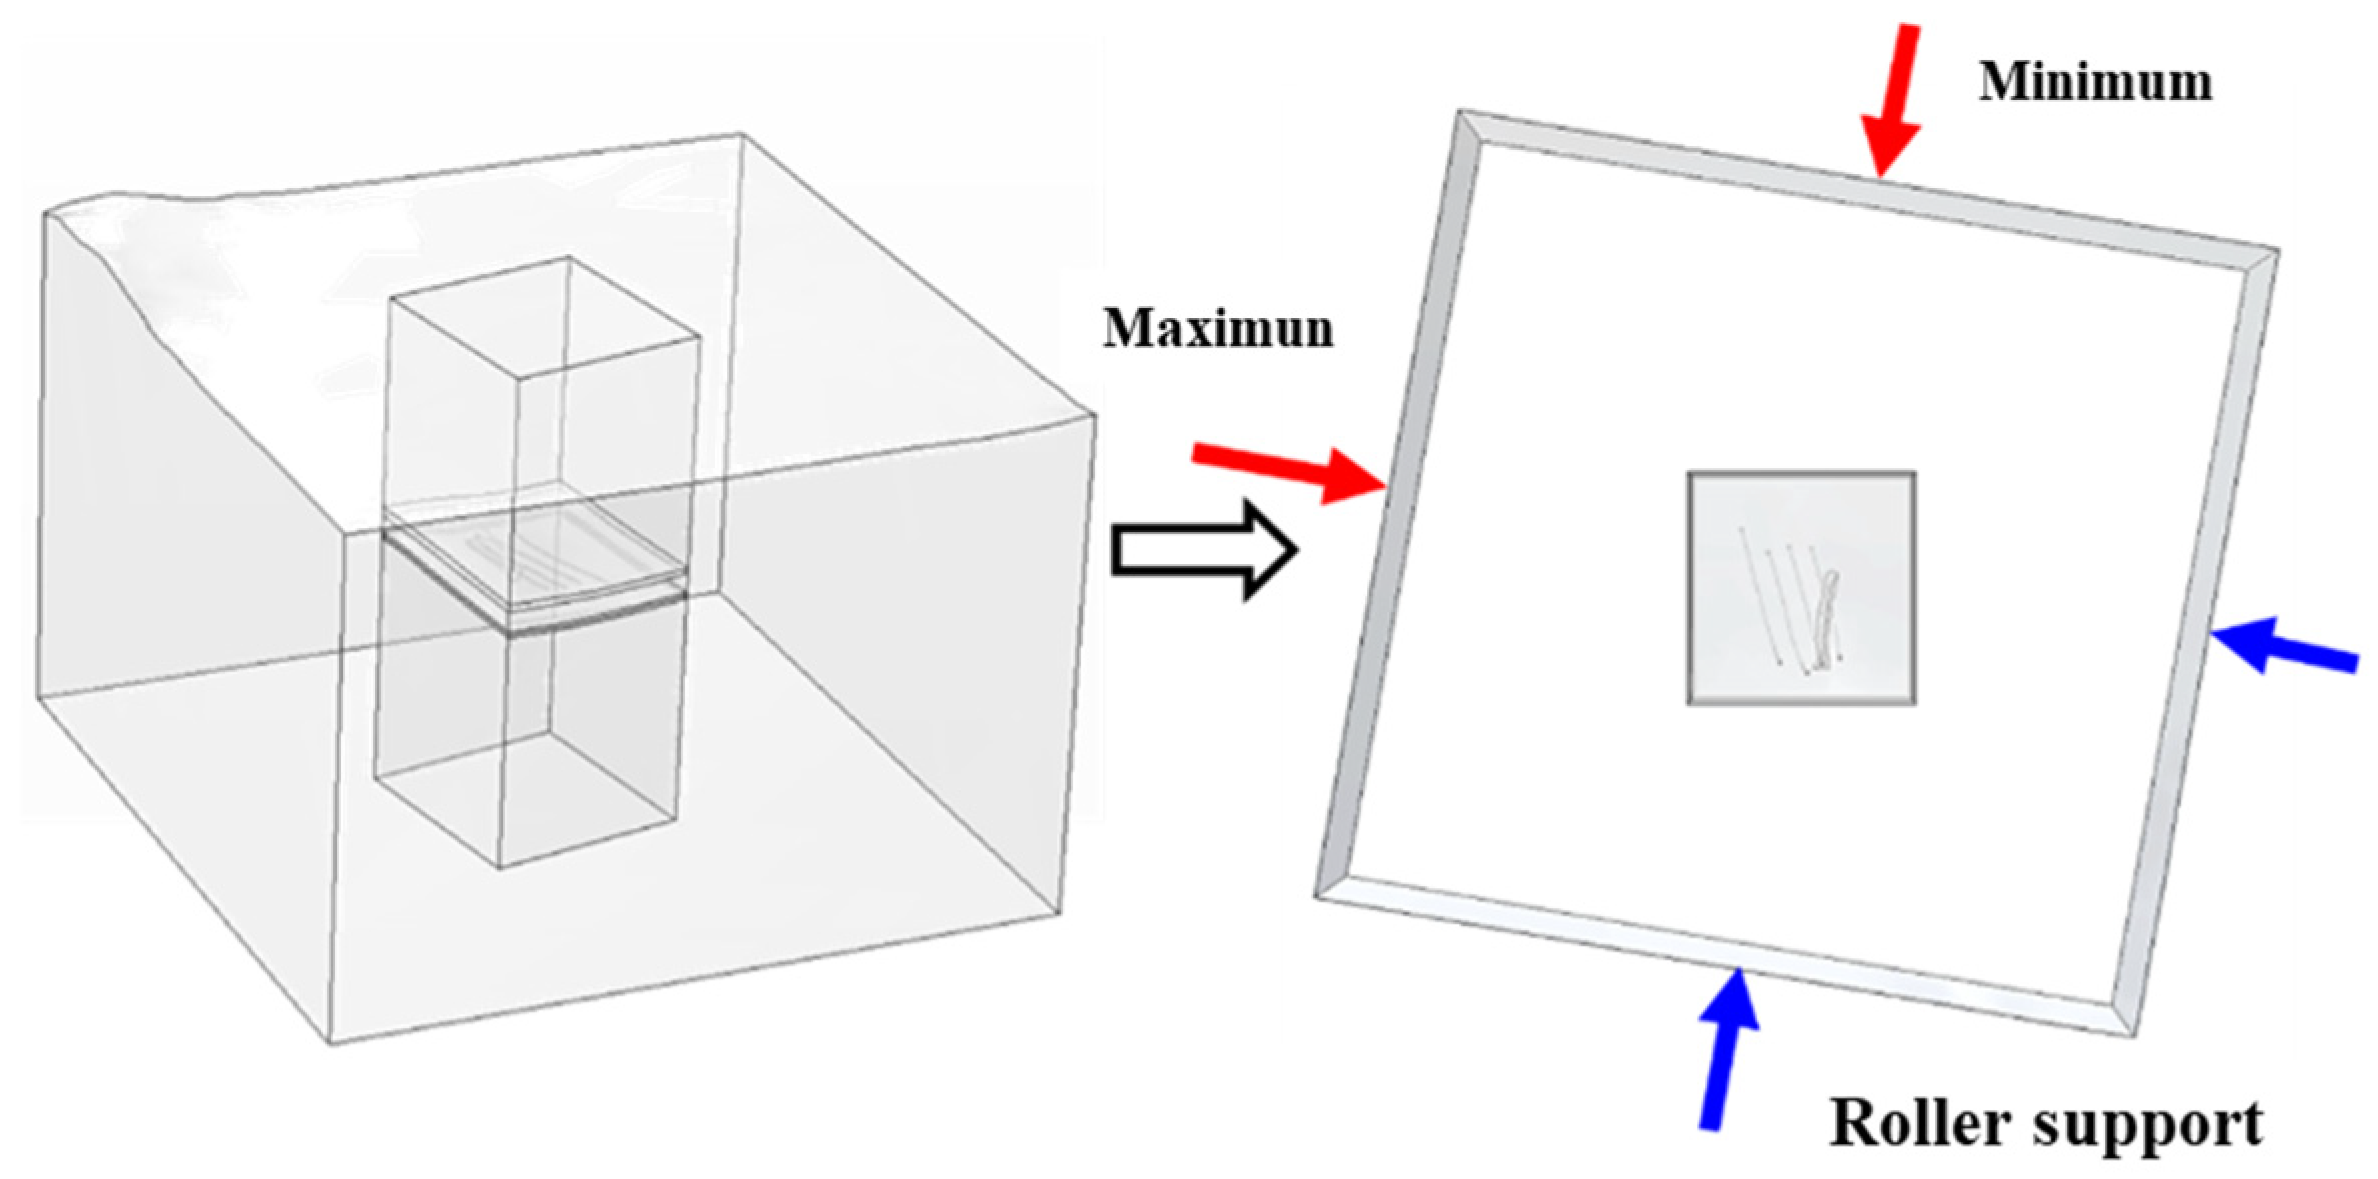
Before fracturing, the geological structure under tectonic stress is in a deformed yet balanced state. To recover the original stress field, a steady-state stress-equilibrium calculation is required prior to coupling. The maximum horizontal principal stress in the target reservoir is oriented approximately NE 90° (i.e., east-trending), with magnitude and orientation controlled by tectonic stress direction, gradient, and depth. To reduce boundary effects, the model is configured as follows: vertical stress is applied via gravity; two of the four vertical side boundaries are set as roller-supports while the other two are stress boundaries; the bottom boundary is fixed in the normal direction; and the top surface is traction-free. During simulation, stresses and displacements evolve. An iterative scheme is used to reach equilibrium: the Cauchy stress tensor in material coordinates is extracted, formation pressure is superposed with the second Piola–Kirchhoff stress as external stress, and the model is re-simulated under the same tectonic boundary conditions. This process is repeated until the displacement converges to (approximately) zero, yielding the pre-fracturing stress and displacement state (Figure 8).
The stress regime is σ1 (maximum horizontal) > σ2 (vertical) > σ3 (minimum horizontal), consistent with a strike-slip environment. Stress release at faults appears as low-stress zones. The simulated pre-fracturing stress magnitudes agree with field estimates within ~10%, matching the spatial distribution observed in the target block.

3.3.2. The Seepage Physical Field and Boundary Conditions

In the numerical simulation of fluid flow-stress coupling, the setting of boundary conditions for the fluid flow field is of vital importance for simulating the interaction between fluid migration and reservoir stress during the fracturing process. Based on the principle of pore pressure equilibrium, the three-dimensional pore pressure distribution determined by the interpolation function Pp(x,y,z) of the target layer section is set as the initial condition and external boundary condition of the fluid flow field. According to the fracturing treatment schedule, the wellbore pressure equals the surface treating pressure plus hydrostatic head and frictional pressure losses, and it is applied as inner boundary conditions on the horizontal wellbore. During fracturing, the wellhead treating pressure varies dynamically; fracture-network initiation and propagation pressures range from 68.5 to 74.1 MPa. Combined with the elevation of each point on the wellbore-boundary surface, the pressure at each point is computed to form the inner-boundary pressure field (Figure 9). A transient porous-media flow simulation is then performed under the governing equations ∇⋅(ρu) = Qm and u = −K/μ ∇P to construct the coupled flow field for the target layer.

3.4. Construction and Simulation of the Four-Dimensional Seepage-Stress Coupling Model

Because the flow and stress fields interact and evolve over time during fracturing, a fully coupled poroelastic framework is used, with Darcy flow as the flow-field governing equation and a small-strain isotropic linear-elastic model as the solid-mechanics equation. Stress-sensitive porosity and permeability are updated using the established relations, yielding a 4D model of in situ stress and pore pressure. For each fracturing stage, the simulated pore-pressure distribution is used as the outer boundary condition for the subsequent step, providing dynamic stress-coupling results and revealing stress and pore-pressure evolution from early to late stages.

4. Results and Discussion

During the hydraulic fracturing process, there is a complex interaction between fluid pressure and the underground stress field. This section systematically analyzes the dynamic evolution of pore pressure and ground stress and links these changes with the expansion of fractures and potential engineering problems (such as casing deformation).

4.1. Characteristics of Pore Pressure Changes in the Surrounding Strata of the Fracturing Area Wells

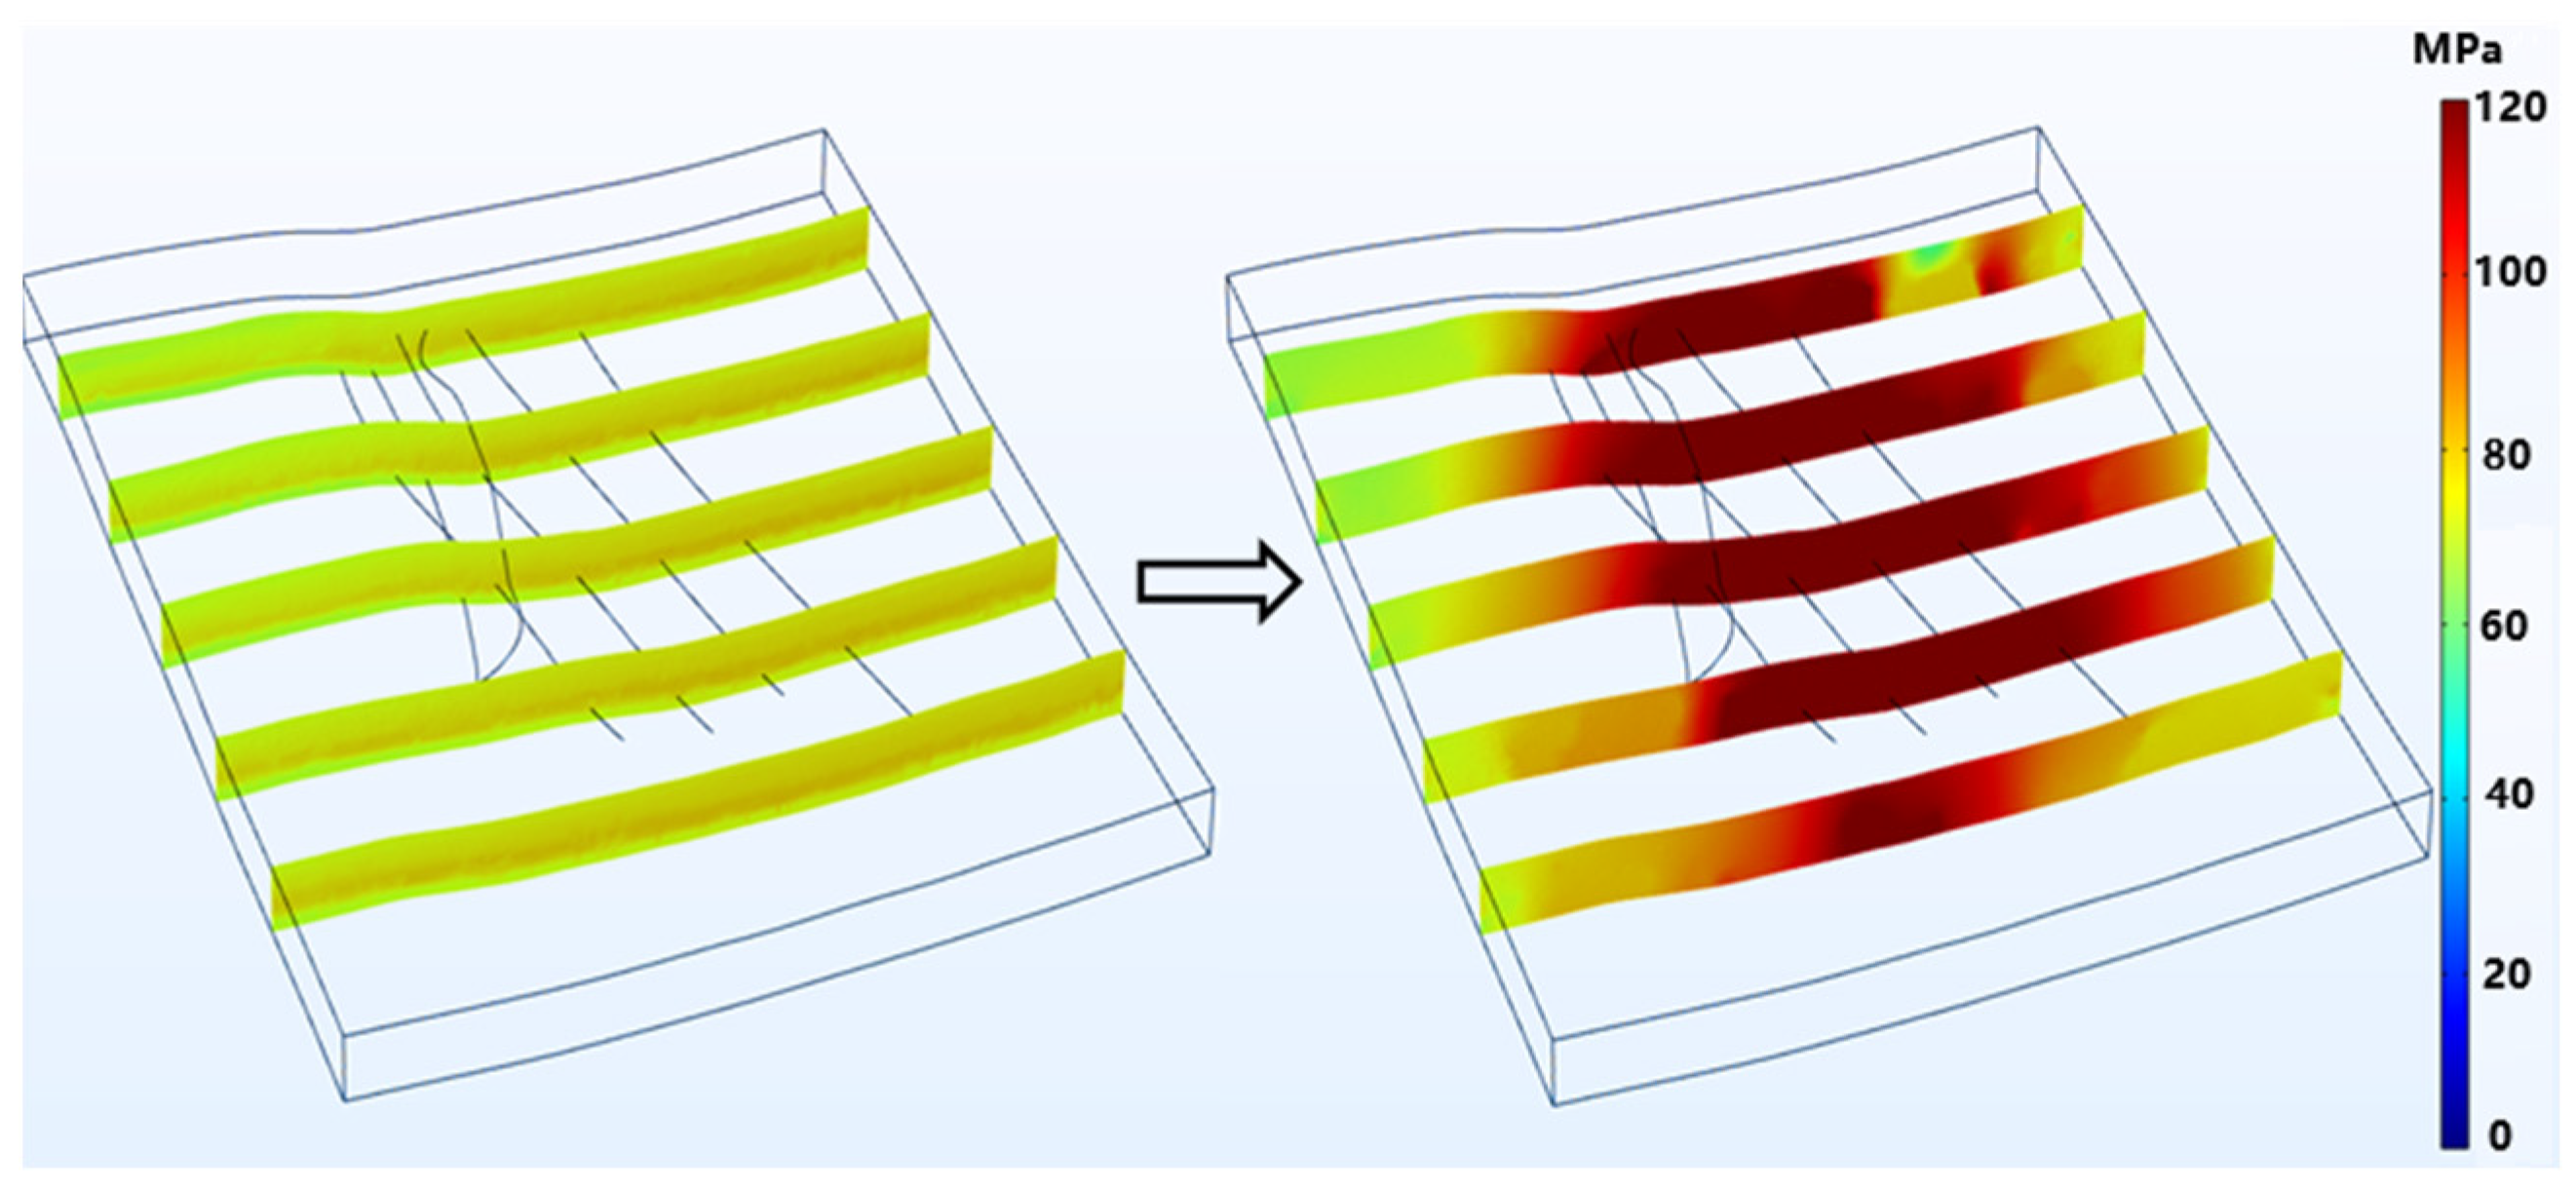
The simulation results revealed significant pore pressure disturbances around the well during fluid injection. As shown in Figure 10, the injection of high-pressure fluid created a large pressure difference, driving the fracturing fluid to preferentially flow along the dominant channels (such as fracture networks and faults). A “pressure concentration funnel” with increased pore pressure was formed around the well, showing a gradient attenuation characteristic. The pressure increase was the greatest in the near-well zone (36.87–45.26%), reaching 1.4 times the original pressure; the pressure response in the far-field lagged and the influence decayed. As the fracturing process continued, the radius of this pressure funnel continued to expand.
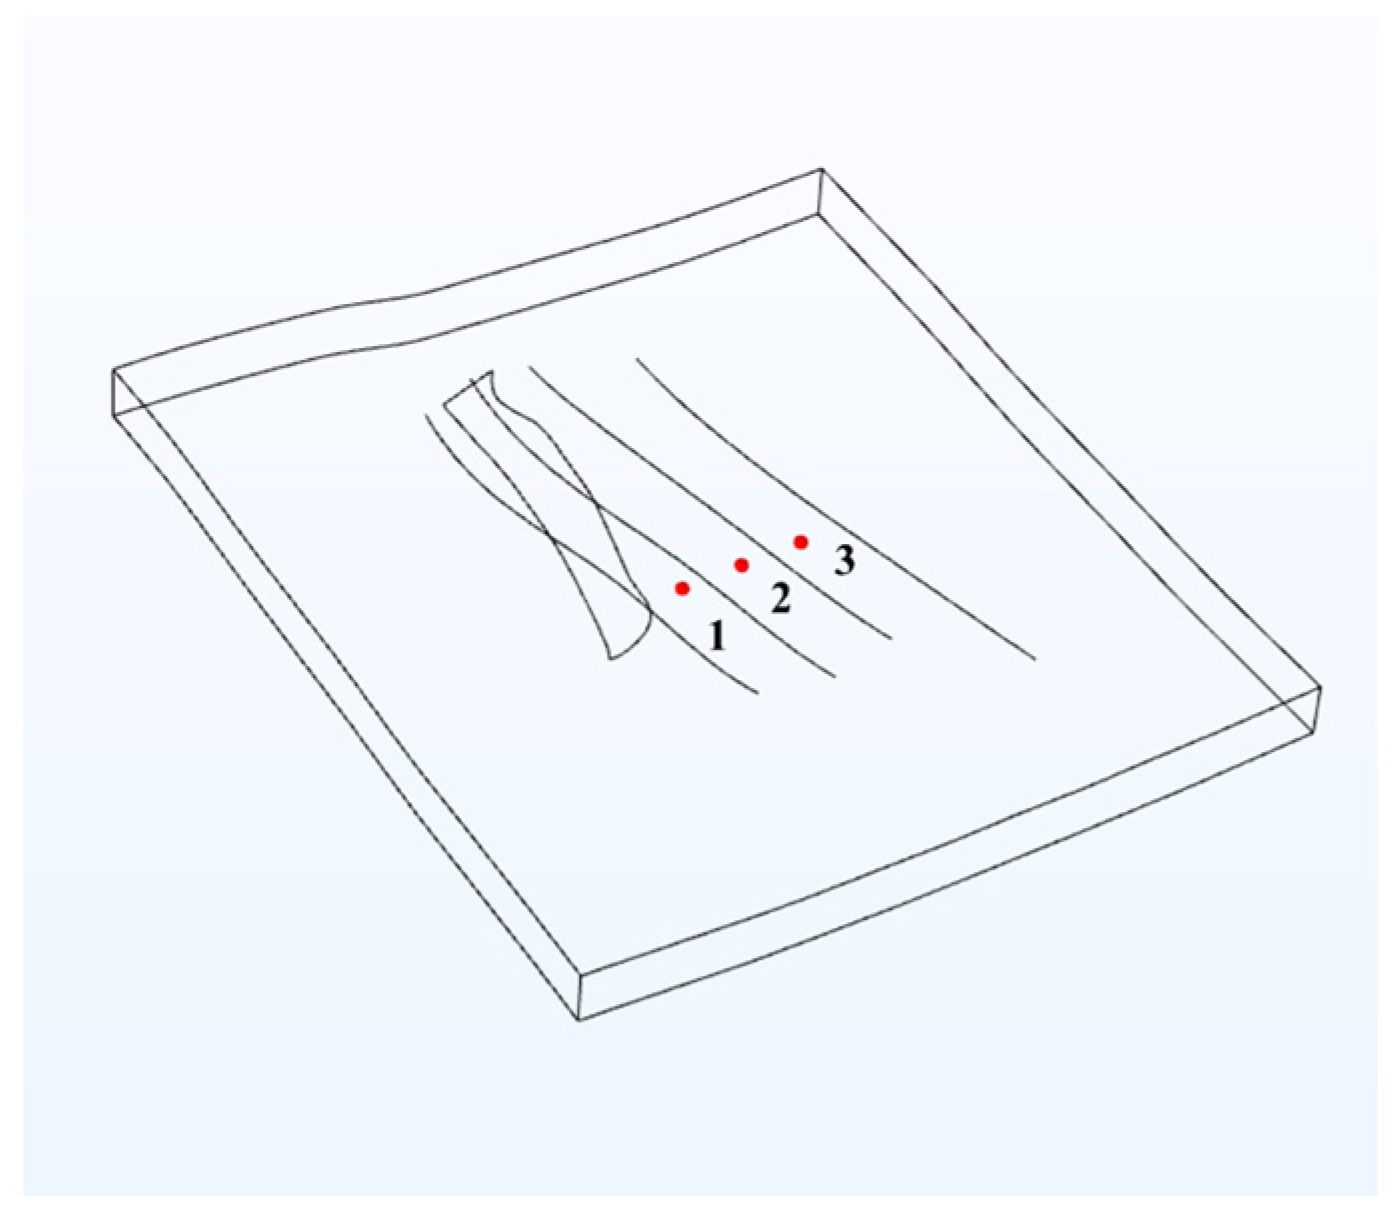
Figure 11 shows the three monitoring probes set around the horizontal well section; the time series data collected by them (as shown in Figure 12) provides further evidence. In the initial stage of fracturing, as the rapidly expanding fracture network communicates with the highly permeable natural fractures/dips, the pore pressure rises sharply. The increments at probes 1, 2, and 3 reach 18.61%, 27.74%, and 29.14%, respectively. In the middle and later stages of fracturing, as the fractures are filled, the pressure is transferred to the bedrock and a dynamic equilibrium is formed, and the rate of pressure increase significantly slows down.
The observed pressure evolution pattern conforms to the classic theory of unstable seepage in fractured media. The non-uniform pressure distribution formed due to the influence of pre-existing faults and fractures highlights the crucial role of geological heterogeneity. The formation and expansion of pressure funnels directly alter the effective stress field, which is the fundamental driving force for subsequent stress evolution.

4.2. The Variation Characteristics of the In Situ Stress Field of the Surrounding Strata in the Fracturing Area Wells

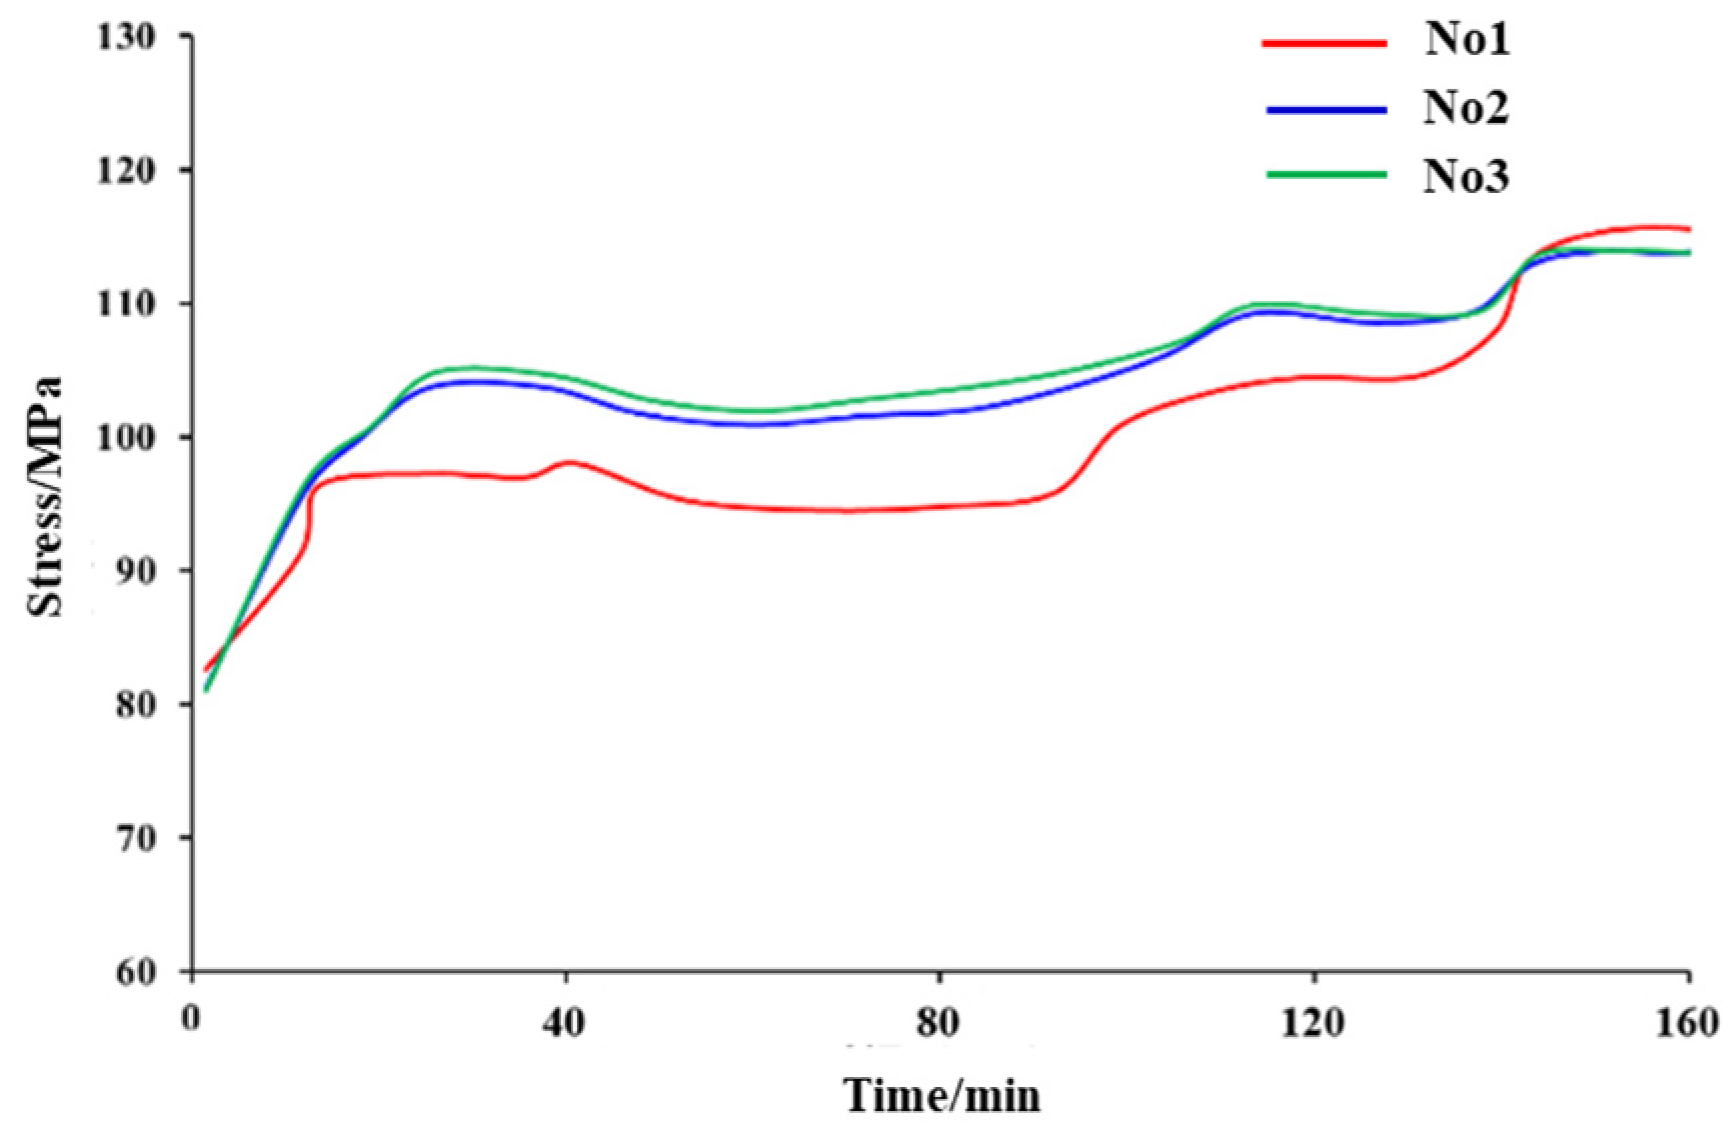
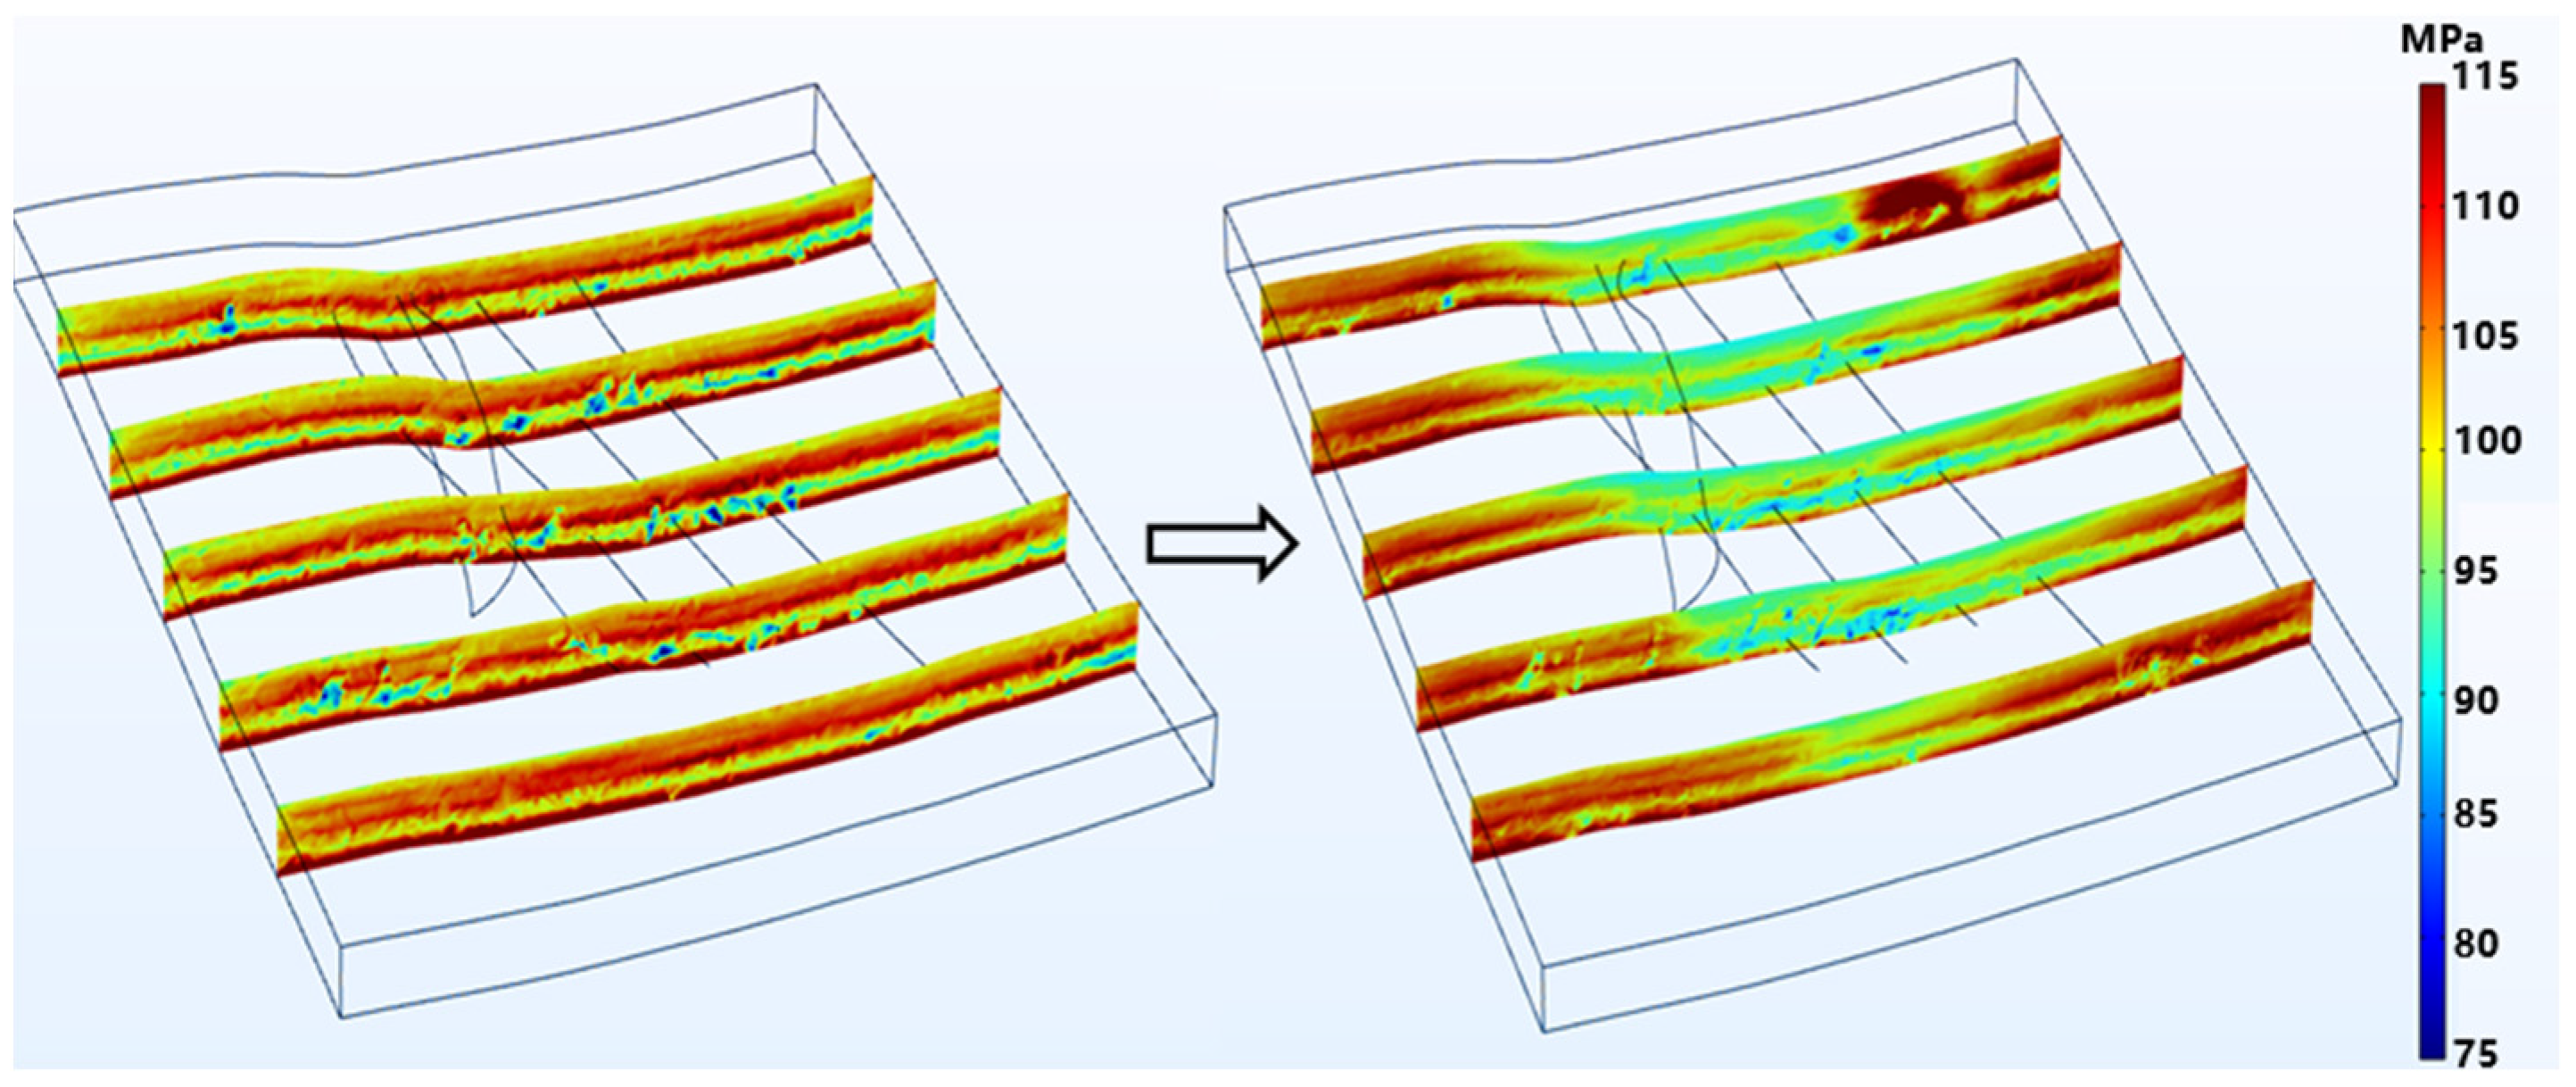
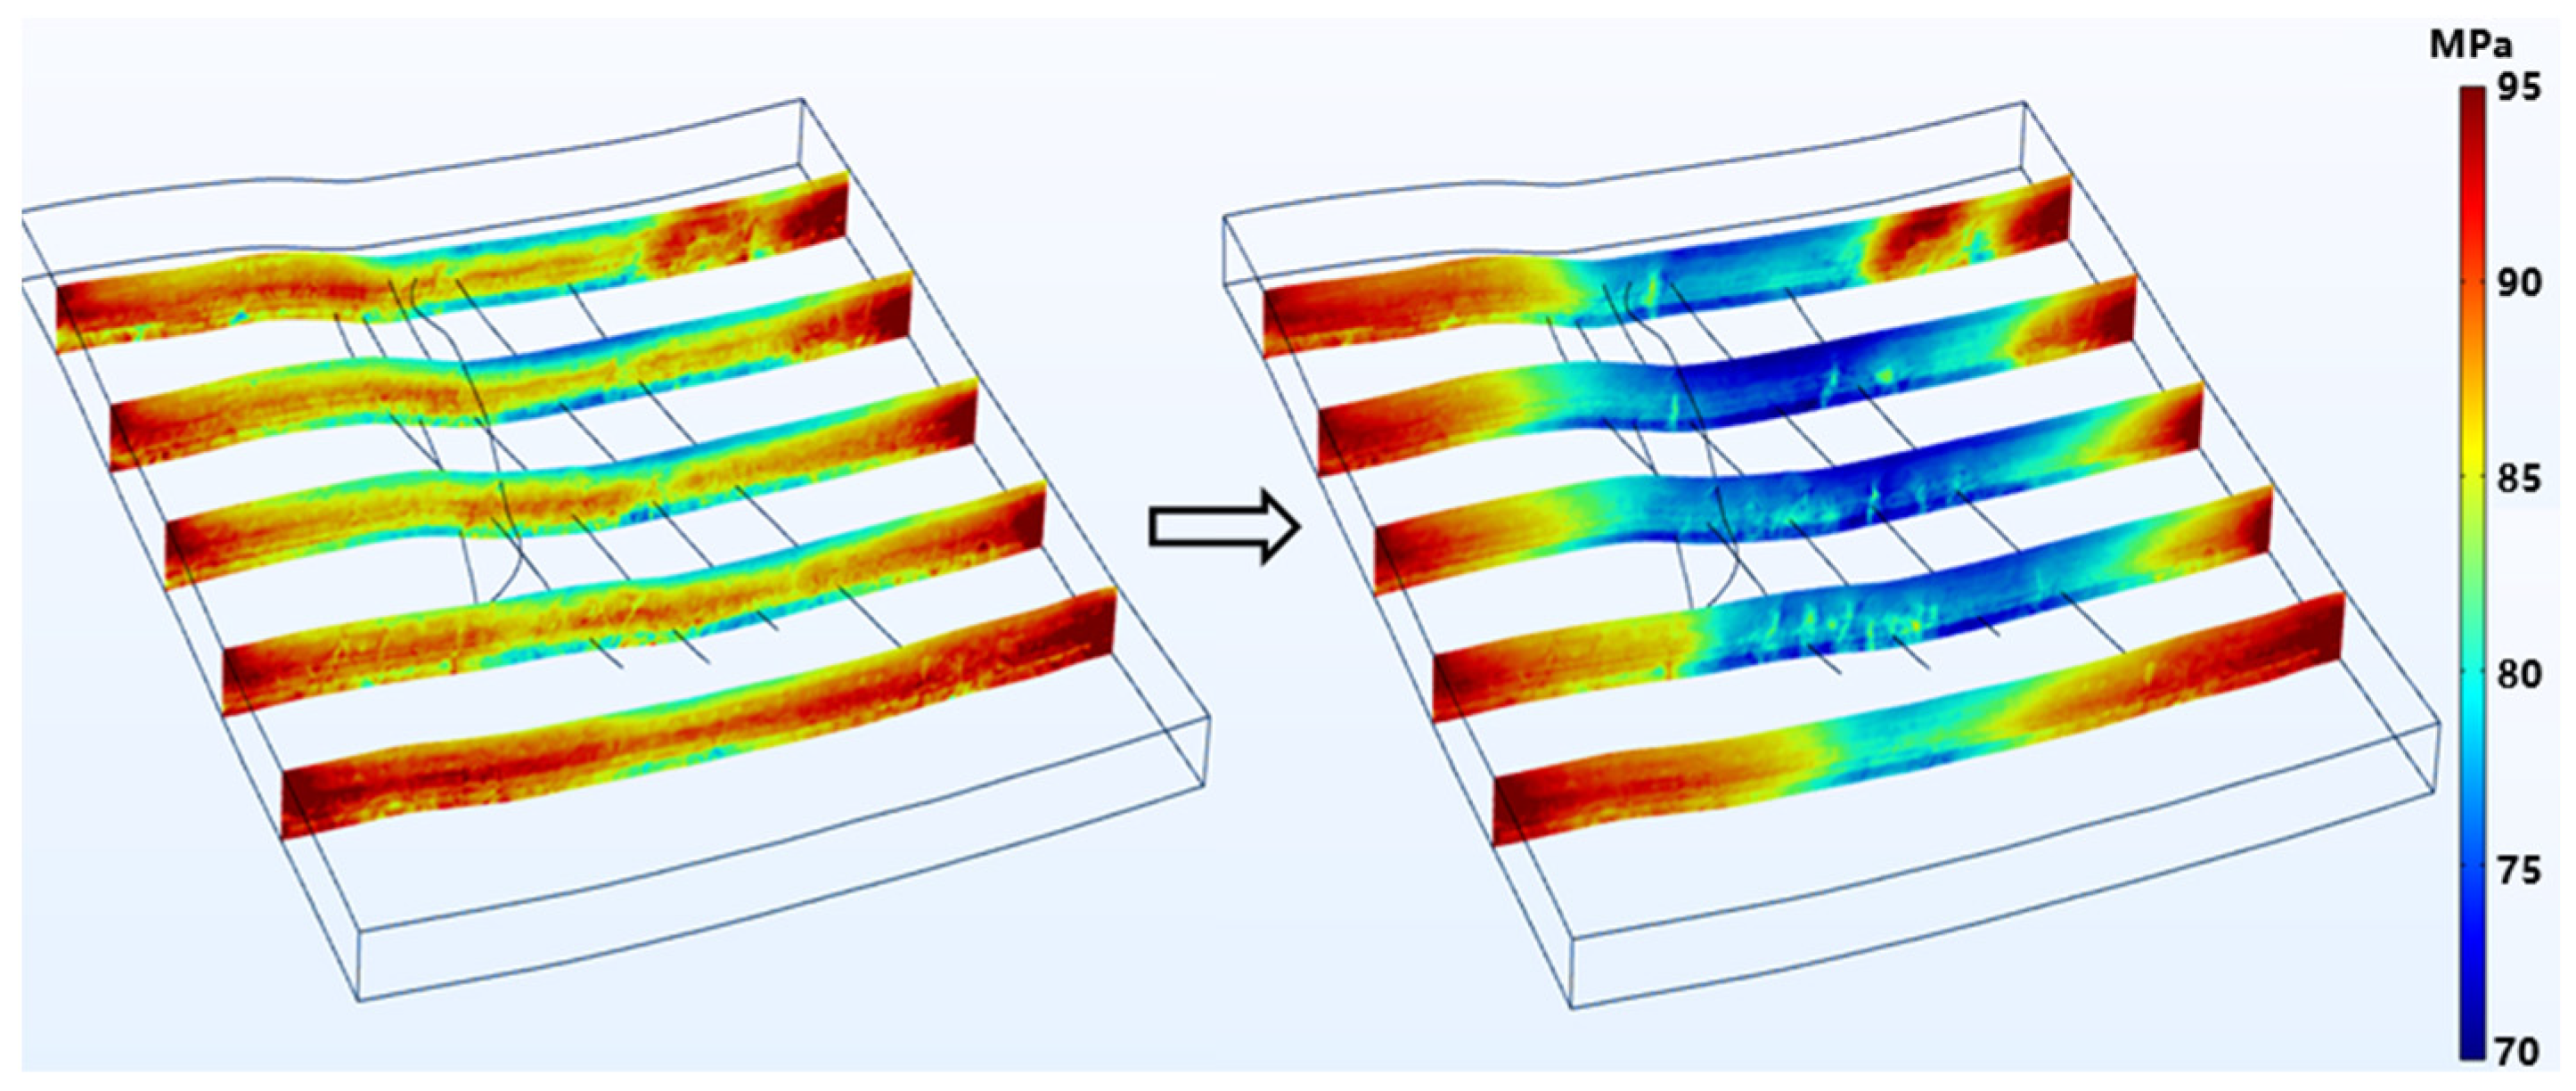
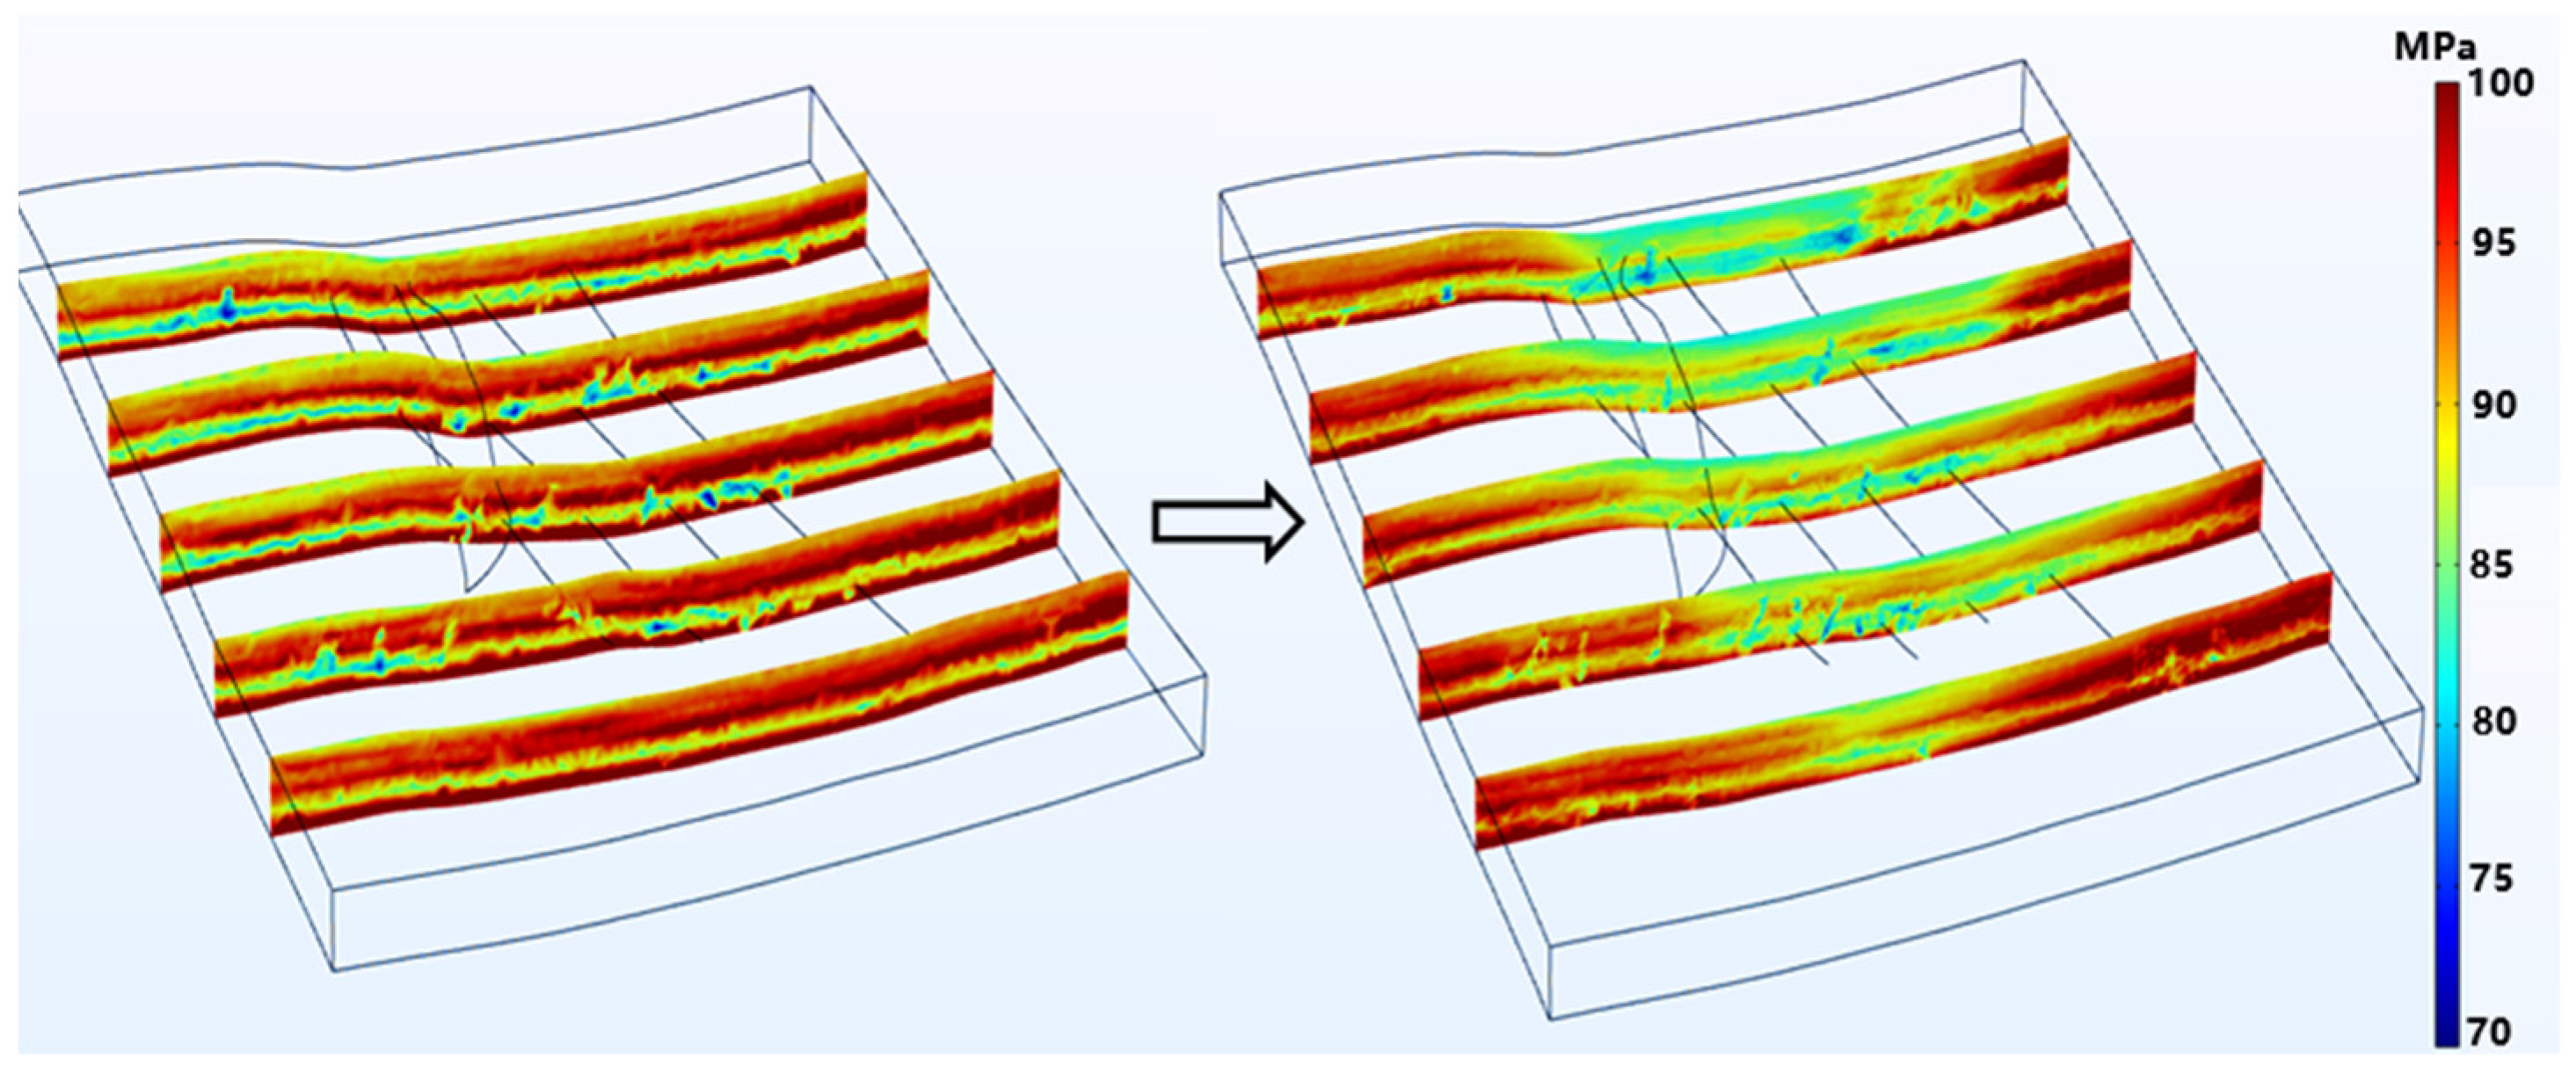
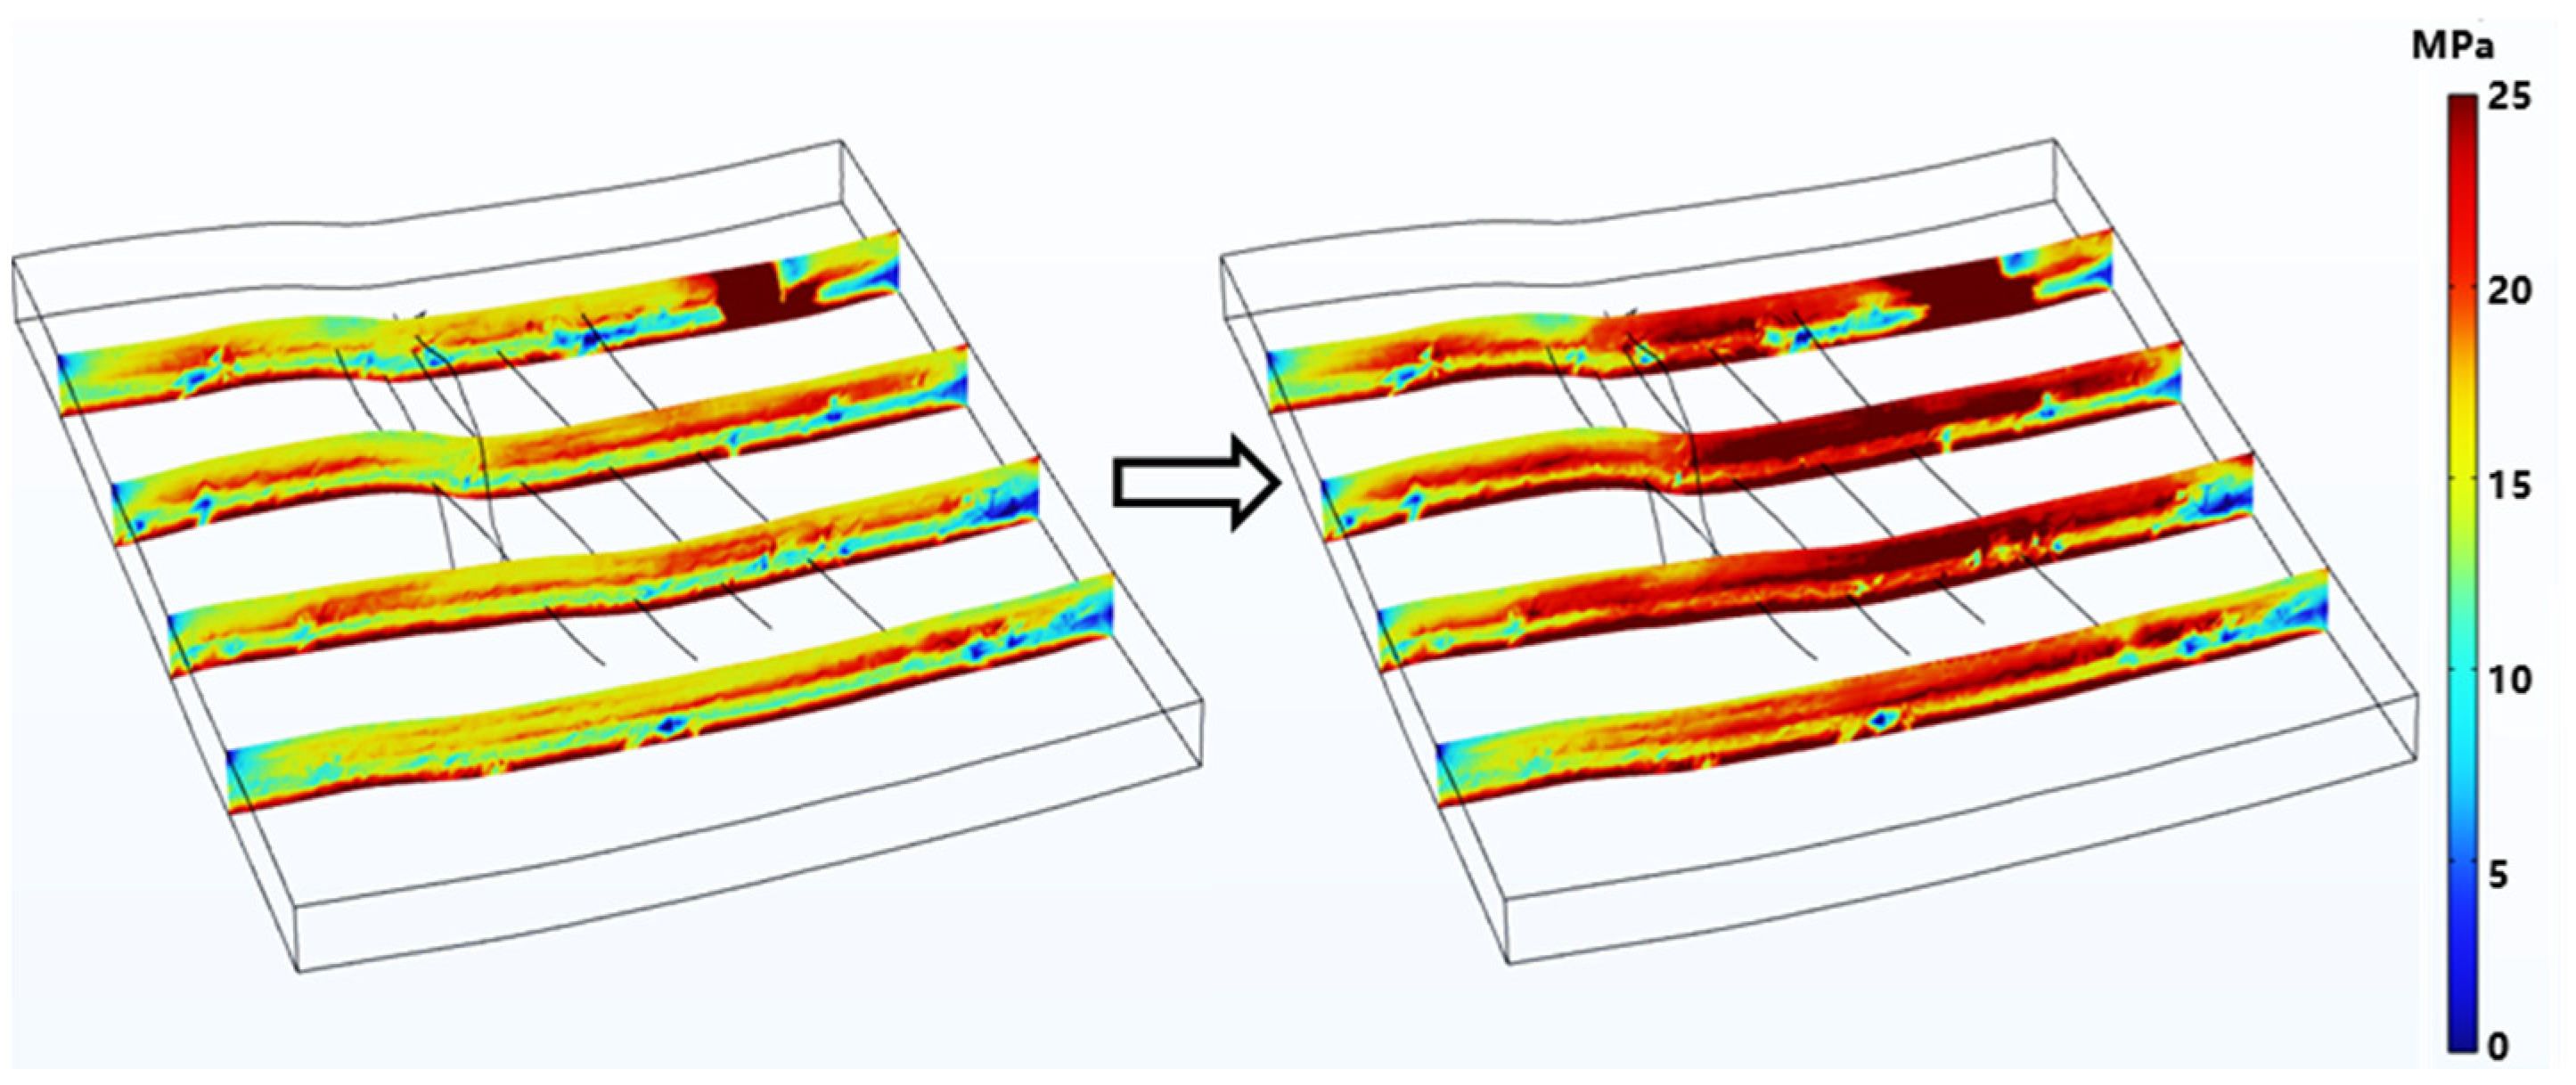
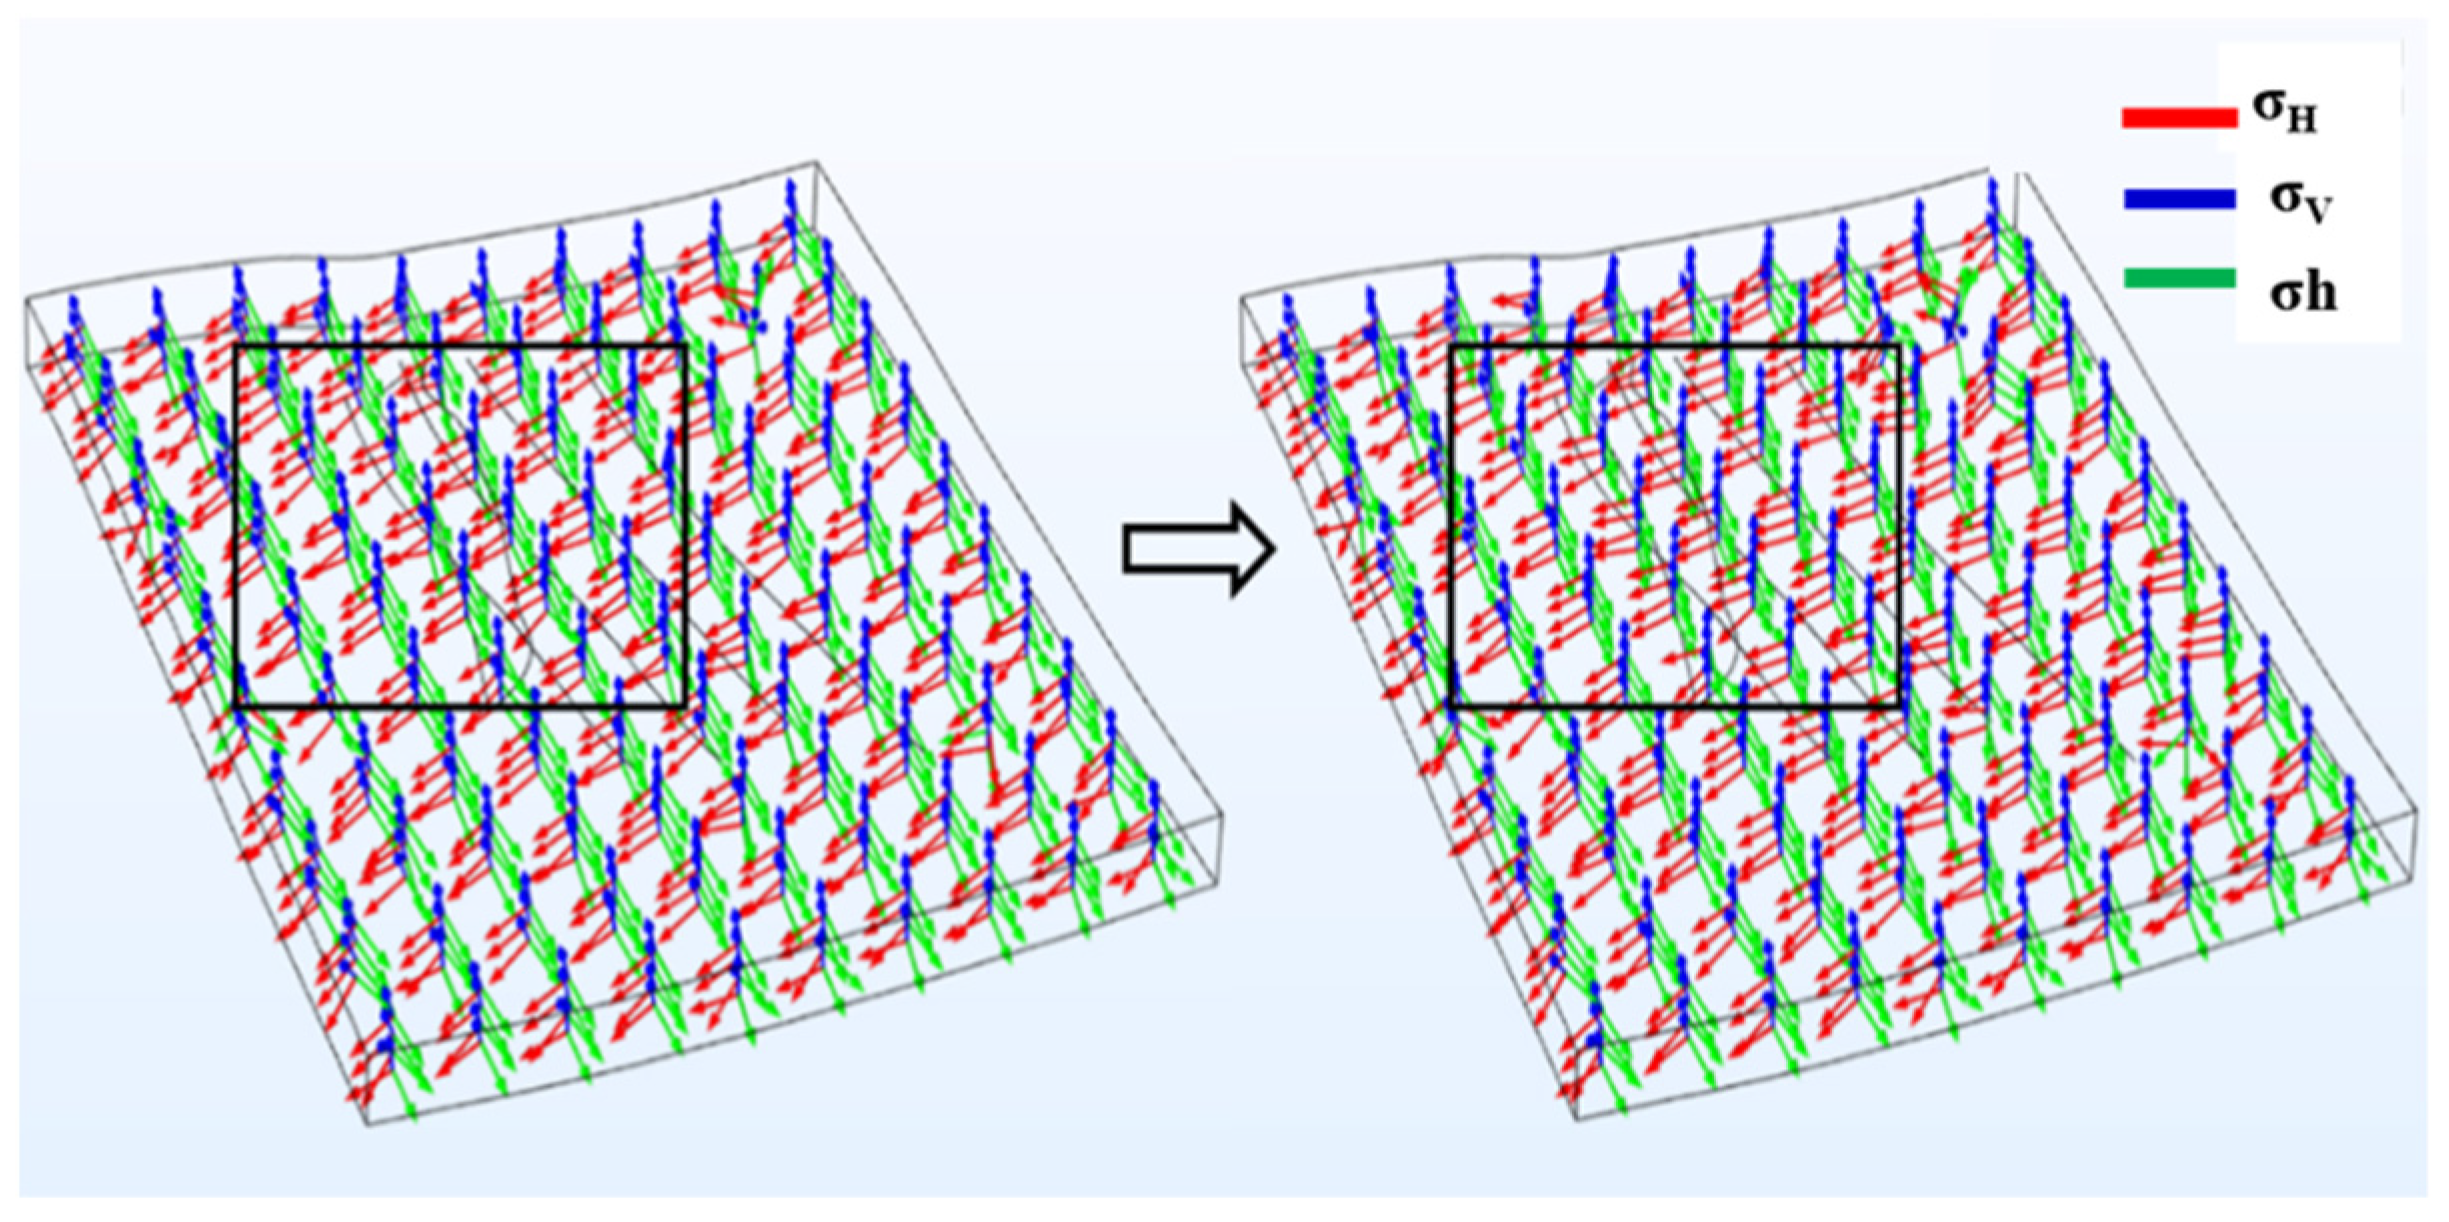
According to the effective stress principle, when the total stress remains constant, an increase in pore pressure will lead to a decrease in effective stress, thereby weakening the rock strength and altering the stress state of the earth. The simulation results verify this principle. As shown in Figure 13, Figure 14, Figure 15 and Figure 16, the three principal stresses all decrease as Pp increases. Among them, the horizontal minimum principal stress shows the most significant decrease, resulting in a continuous increase in the difference between the horizontal principal stresses. The “pressure drop funnel” expands symmetrically from the well circumference outward, accompanied by a decrease in stress values. More importantly, as shown in Figure 17, when this funnel extends to the fault or fracture development area, the direction of the stress field undergoes a significant deflection.
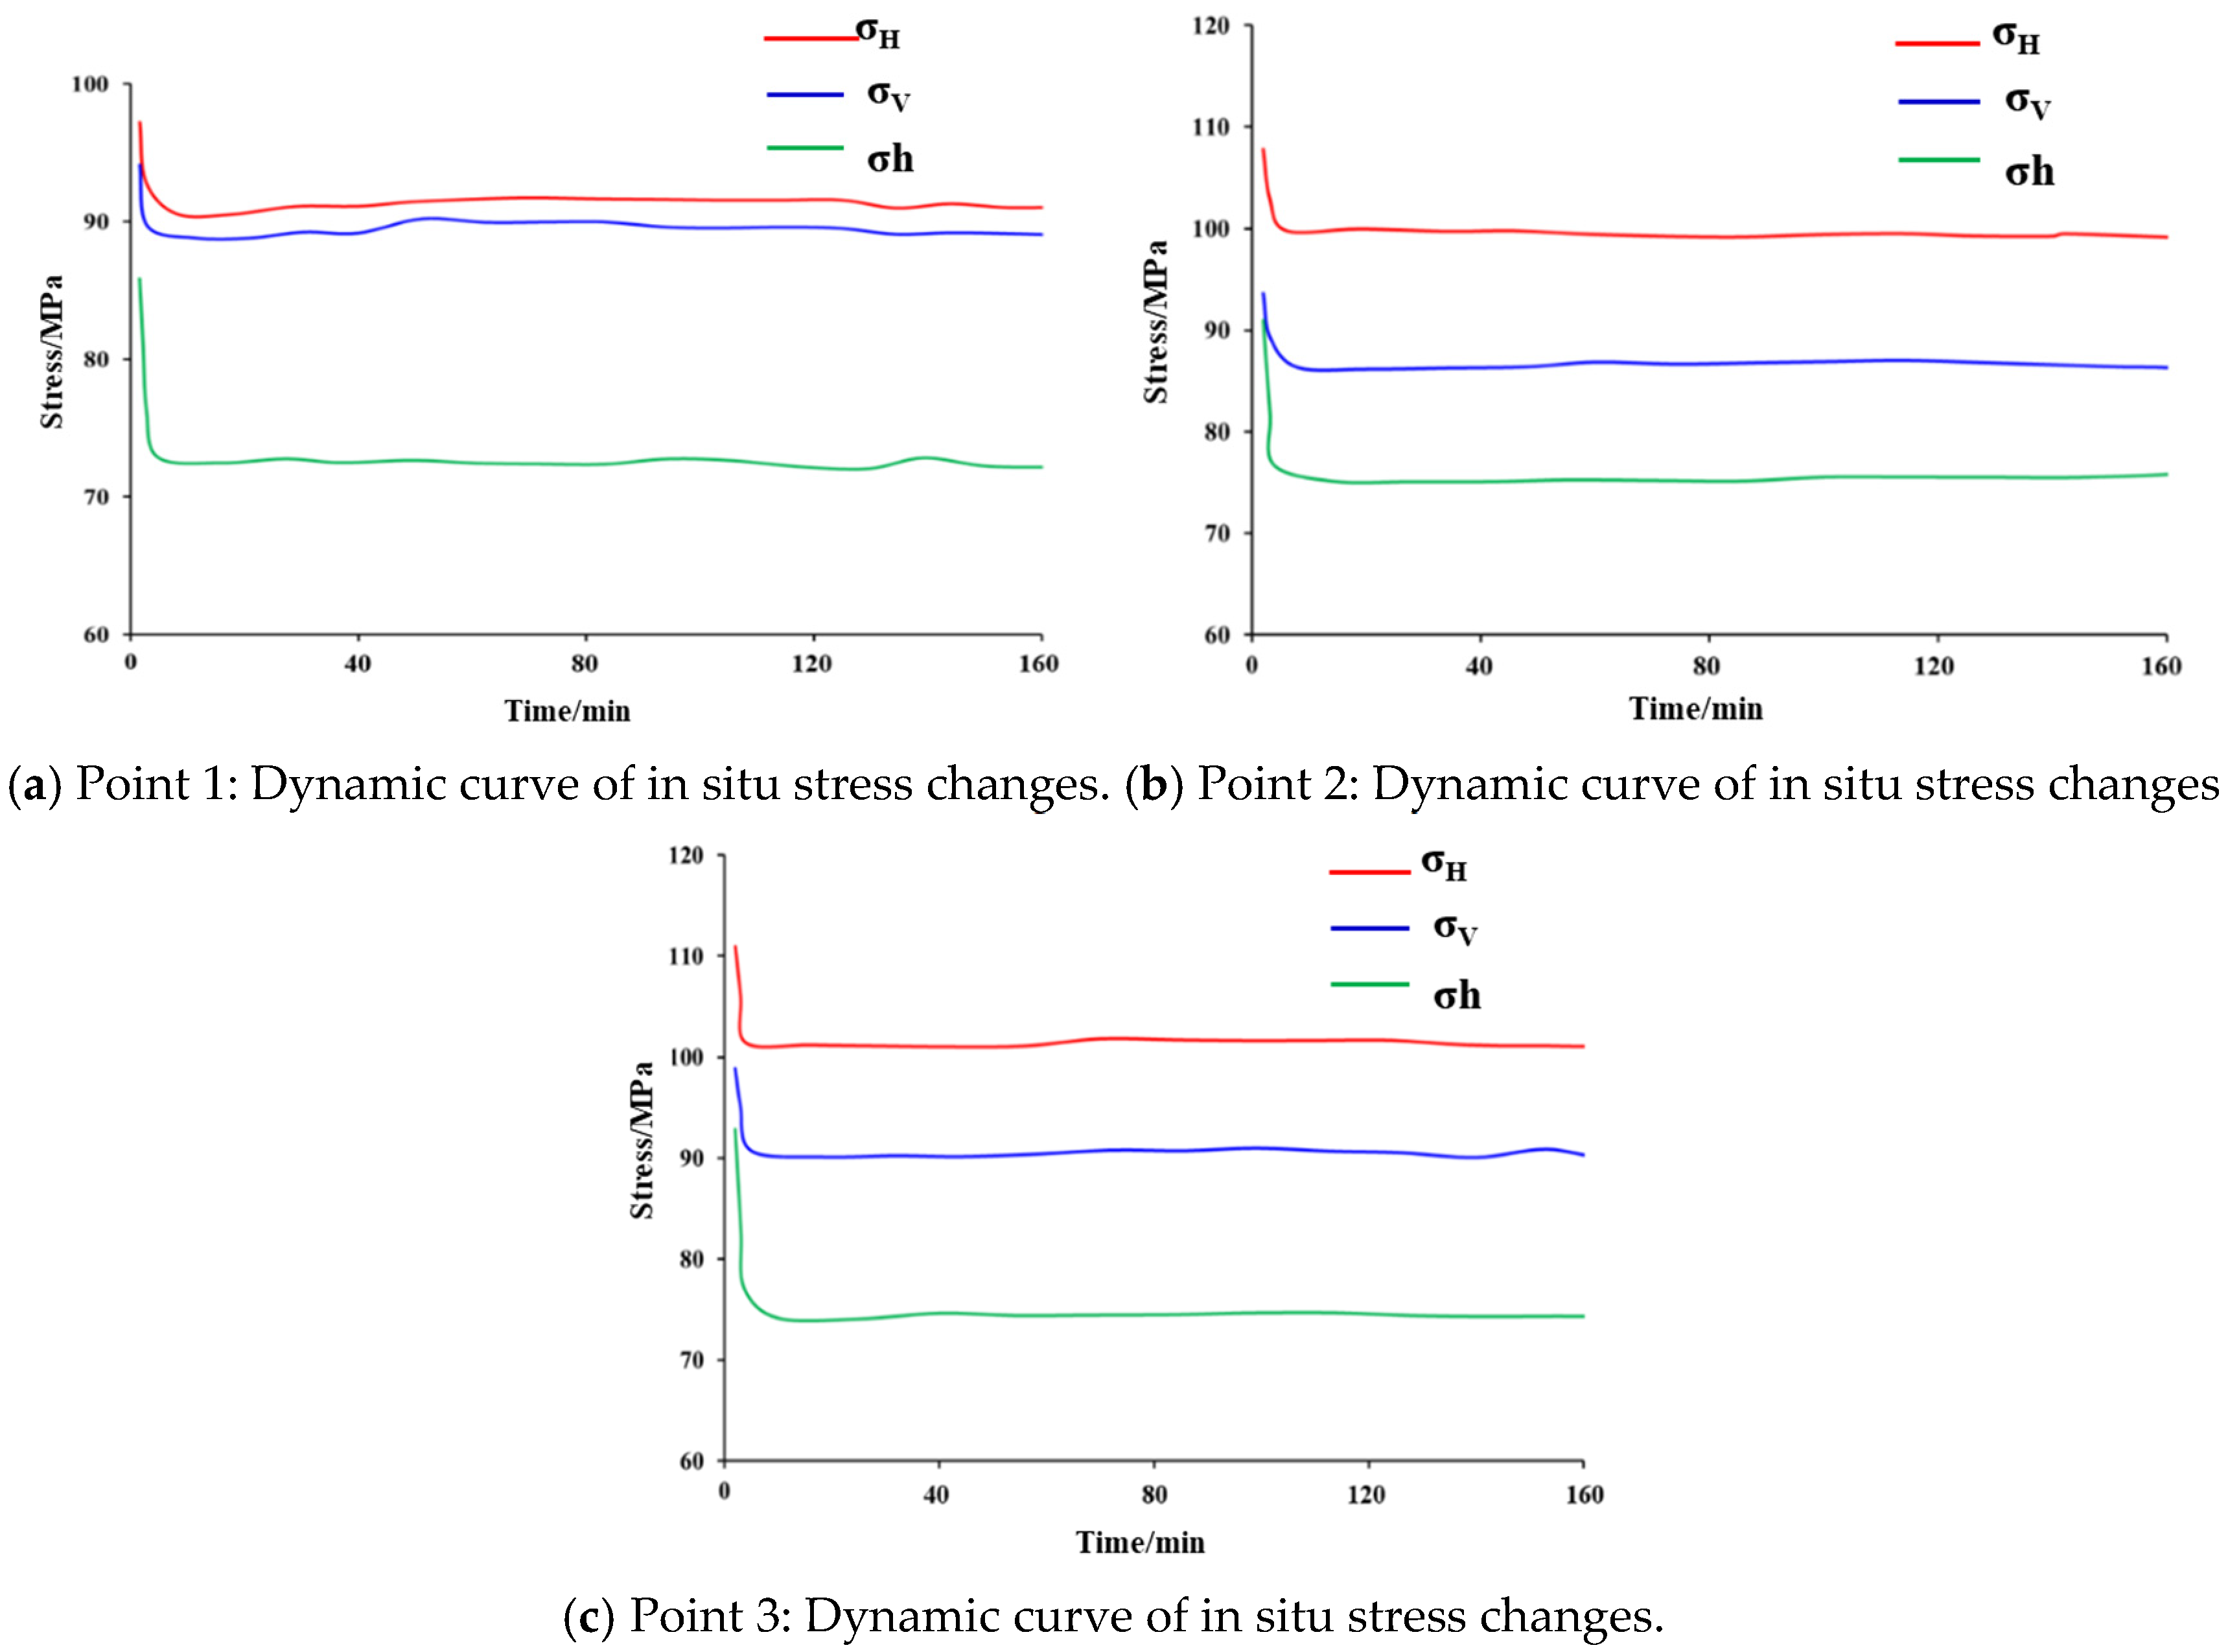
The time-series data of the monitoring points (Figure 18) quantified this process. The stress drop was the most rapid in the initial stage of injection, then stabilized, which was consistent with the trend of pore pressure changes. Eventually, the maximum horizontal principal stress decreased by 5.73% to 8.31%, the vertical stress decreased by 5.7% to 7.14%, and the minimum horizontal principal stress decreased by 15.79% to 20.68%.
The differential stress drop can be attributed to geological and mechanical constraints. The vertical stress dominated by the weight of overlying rock layers is less affected. Under this strike-slip fault stress state, the initial value of σh is the smallest. Therefore, the same increment of pore pressure, due to the mechanical response of the rock, will result in a proportionally greater drop in σh. Moreover, the preferential opening of fractures perpendicular to the σh direction (i.e., along the σH direction) will produce a “stress shadow” or unloading effect, further exacerbating the decline of σh.

4.3. Implications of the Risk of Casing Deformation

Based on the results of the fully coupled dynamic stress-seepage simulation, the real-time pore pressure and stress values at the fault or fracture interface are substituted into the Mohr-Coulomb failure criterion to assess the risk of shear slip at the interface. The analysis based on the above simulation results indicates that a significant increase in pore pressure reduces the effective normal stress acting on the fault plane, while the continuously evolving stress field (especially the continuously increasing stress difference) increases the shear driving force. The combination of these two effects can bring the fault to the critical state of stress field instability. Such shear slip of faults in the near-wellbore area is one of the main mechanisms for inducing casing deformation.
Therefore, the established integrated model not only clarifies the geological mechanical evolution laws during the fracturing process but also provides a quantitative tool for predicting the risk of casing deformation. By identifying high-risk areas in advance, it can provide a basis for optimizing the fracturing plan and formulating engineering risk prevention measures.

5. Conclusions

Based on multi-source geological engineering information, considering the non-uniformity of shale bedding, geological mechanical characteristics and the complexity of pressure fracture network expansion, a four-dimensional geostress evolution numerical simulation method for the shale reservoir fracturing zone with full coupling of flow field and stress field was established. The dynamic evolution laws of pore pressure and geostress field during the fracturing process were revealed.
(1)
The dynamic changes in pore pressure are the main controlling factor for the redistribution of regional ground stress. The non-uniformity near the well and the distribution of geomechanical parameters also affect its accuracy. The injection of fracturing fluid forms a high-pressure gradient, driving the non-steady diffusion of pore pressure and fluids along artificial or natural fracture networks. The spatial heterogeneity is strong: the pressure increase is the greatest in the near-wellbore area, and it decays with distance, forming a stress concentration funnel effect. Its influence range expands with the extension of fracturing time.
(2)
Elevated pore pressure redistributes in situ stress: all three principal stresses are negatively correlated with pore pressure and decrease accordingly; the minimum horizontal stress exhibits the greatest reduction, whereas the vertical stress shows the least variation. A pressure-drop funnel forms near the wellbore corresponding to the stress-concentration zone. Fracturing increases horizontal stress anisotropy; rapid pore-pressure changes together with fault or fracture distributions trigger stress reorientation, and stronger pore-pressure fluctuations lead to larger rotations.
(3)
In the early stage of fracturing, the fluids preferentially enter the high-porosity and high-permeability fault or suture networks. The pore pressure rises sharply, and the in situ stress rapidly decreases from the wellbore to the periphery. As the fracturing progresses, the fractures are filled and the pressure is transmitted to the bedrock. In the middle and later stages, the pore pressure rises and the trend of in situ stress decrease becomes stable. The system gradually reaches a dynamic equilibrium.

Author Contributions

Writing—original draft, S.C.; conceptualization, J.W.; methodology, B.Z.; formal analysis, H.H.; resources, S.W.; visualization, H.L.; investigation, J.G. All authors have read and agreed to the published version of the manuscript.

Funding

This research was funded by the China Postdoctoral Foundation Funding Program. (project number: 2025M772951) and the postdoctoral research station scientific research project (project number: 2024D102-01-17).

Data Availability Statement

The original contributions presented in this study are included in the article. Further inquiries can be directed to the corresponding author.

Conflicts of Interest

Authors Shuai Cui, Jianfa Wu, Bo Zeng, Haoyong Huang, Shouyi Wang Junchuan Gui were employed by the company PetroChina Southwest Oil & Gasfield Company. The remaining authors declare that the research was conducted in the absence of any commercial or financial relationships that could be construed as a potential conflict of interest.

References

  1. Chen, S.B.; Zhu, Y.M.; Wang, H.Y.; Liu, H.; Wei, W.; Luo, Y.; Li, W.; Fang, J. Research status and trends of shale gas in China. Acta Pet. Sin. 2010, 31, 689–694. [Google Scholar] [CrossRef]
  2. Zhao, W.Z.; Jia, A.L.; Wei, Y.S.; Wang, J.; Zhu, H. Progress in shale gas exploration in China and prospects for future development. China Pet. Explor. 2020, 25, 31–44. [Google Scholar] [CrossRef]
  3. Li, G.X.; Lei, Z.D.; Dong, W.H.; Wang, H.; Zheng, X.; Tan, J. Progress, challenges and prospects of unconventional oil and gas development of CNPC. China Pet. Explor. 2022, 27, 1–11. [Google Scholar]
  4. Guo, M.; Lu, X.; Nielsen, C.P.; McElroy, M.B.; Shi, W.; Chen, Y.; Xu, Y. Prospects for shale gas production in China: Implications for water demand. Renew. Sustain. Energy Rev. 2016, 66, 742–750. [Google Scholar] [CrossRef]
  5. Dong, D.Z.; Gao, S.K.; Huang, J.L.; Guan, Q.; Wang, S.; Wang, Y. A discussion on the shale gas exploration & development prospect in the Sichuan Basin. Nat. Gas Ind. 2014, 34, 1–15. [Google Scholar]
  6. Dong, D.Z.; Wang, Y.M.; Li, X.J.; Zou, C.; Guan, Q.; Zhang, C.; Huang, J.; Wang, S.; Wang, H.; Liu, H.; et al. Breakthrough and prospect of shale gas exploration and development in China. Nat. Gas Ind. 2016, 36, 19–32. [Google Scholar] [CrossRef]
  7. Gao, D.L.; Liu, K. Progresses in shale gas well integrity research. Oil Gas Geol. 2019, 40, 602–615. [Google Scholar] [CrossRef]
  8. Gao, D.L.; Liu, K.; Wang, Y.B.; Liu, J.; Li, X. Some research advances in the failure mechanism and design & control technologies of shale gas well integrity. Acta Pet. Sin. 2022, 43, 1798–1812. [Google Scholar] [CrossRef]
  9. Xi, Y.; Li, J.; Liu, G.H.; Zeng, Y.; Li, J. Overview of Casing Deformation in Multistage Fracturing of Shale Gas Horizontal Wells. Spec. Oil Gas Reserv. 2019, 26, 1–6. [Google Scholar]
  10. Dean, R.H.; Gai, X.; Stone, C.M.; Minkoff, S.E. A comparison of techniques for coupling porous flow and geomechanics. SPE J. 2006, 11, 132–140. [Google Scholar] [CrossRef]
  11. Hatchell, P.; Bourne, S. Rocks under strain: Strain-induced time-lapse time shifts are observed for depleting reservoirs. Lead. Edge 2005, 24, 1222–1225. [Google Scholar] [CrossRef]
  12. Herwanger, J.; Koutsabeloulis, N. Seismic Geomechanics: How to Build and Calibrate Geomechanical Models Using 3D and 4D Seismic Data; European Association of Geoscientists & Engineers: Houten, The Netherlands, 2011. [Google Scholar]
  13. Onaisi, A.; Fiore, J.; Rodriguez, H.A.; Koutsabeloulis, N.; Selva, F. Matching stress-induced 4D seismic time-shifts with coupled geomechanical models. In Proceedings of the 49th US Rock Mechanics/Geomechanics Symposium, San Francisco, CA, USA, 28 June–1 July 2015. [Google Scholar]
  14. Zhang, F.S.; Damjanac, B.; Maxwell, S. Investigating hydraulic fracturing complexity in naturally fractured rock masses using fully coupled multiscale numerical modeling. Rock Mech. Rock Eng. 2019, 52, 5137–5160. [Google Scholar] [CrossRef]
  15. Marongiu, P.M.; Lee, D.; Shan, D.; Morales, A. Advanced modeling of interwell fracturing interference: An Eagle Ford Shale oil study. SPE J. 2016, 21, 1567–1582. [Google Scholar] [CrossRef]
  16. Yang, D.; Moridis, G.J.; Blasingame, T.A. A fully coupled multiphase flow and geomechanics solver for highly heterogeneous porous media. J. Comput. Appl. Math. 2014, 270, 417–432. [Google Scholar] [CrossRef]
  17. Guo, X.Y.; Song, H.Q.; Wu, K.; Killough, J. Pressure characteristics and performance of multi-stage fractured horizontal well in shale gas reservoirs with coupled flow and geomechan-ics. J. Pet. Sci. Eng. 2018, 163, 1–15. [Google Scholar] [CrossRef]
  18. Li, Y.M.; Wang, Y.C.; Zhao, J.Z.; Shen, F.; Qiao, H. Calculation Model of Kink Angle in Shale Gas Reservoirs with Consideration of Stress Interference. Nat. Gas Geosci. 2015, 26, 1979–1983. [Google Scholar]
  19. Li, Y.M.; Chen, X.Y.; Zhao, J.Z.; Shen, F. The Effects of Crack Interaction in Multi-stage Horizontal Fracturing. J. Southwest Pet. Univ. (Sci. Technol. Ed.) 2016, 38, 76–83. [Google Scholar]
  20. Zhao, J.Z.; Chen, X.Y.; Liu, C.Y.; Li, H.; Cao, X.J. The Analysis of Crack Interaction in Multi-Stage Horizontal Fracturing. Nat. Gas Geosci. 2015, 26, 533–538. [Google Scholar]
  21. Furui, K.; Fuh, G.; Abdelmalek, N.; Morita, N. A comprehensive modeling analysis of borehole stability and production-liner deformation for inclined/horizontal wells completed in a highly compacting chalk formation. SPE Drill. Complet. 2010, 25, 530–543. [Google Scholar] [CrossRef]
  22. Zhang, X.; Jeffrey, R.G. Fluid-driven nucleation and propagation of splay fractures from a permeable fault. J. Geophys. Res. Solid Earth 2016, 121, 5257–5277. [Google Scholar] [CrossRef]
  23. Zhu, H.Y.; Song, Y.J.; Tang, X.H.; Li, K.; Xiao, J. Optimization of fracturing timing of infill wells in shale gas reservoirs: A case study on Well Group X1 of Fuling Shale Gas Field in the Sichuan Basin. Nat. Gas Ind. 2021, 41, 154–168. [Google Scholar]
  24. Zhu, H.Y.; Song, Y.J.; Xu, Y.; Li, K.; Tang, X. Four-dimensional in-situ stress evolution of shale gas reservoirs and its impact on infill well complex fractures propagation. Acta Pet. Sin. 2021, 42, 1224–1236. [Google Scholar]
  25. Chugunova, T.; Corpel, V.; Gomez, J.P. Explicit fracture network modelling: From multiple point statistics to dynamic simulation. Math. Geosci. 2017, 49, 541–553. [Google Scholar] [CrossRef]
  26. Ren, X.Q.; Gao, X.R.; Wang, H.L.; Liu, J.; Sun, C.; Lu, X.; Sun, Z. Research on multi-scale diserete fracture 3D refined geological modeling and geothermal resource evaluation: A case study of Xianxian County geothermal field, Bohai Bay Basin. Pet. Reserv. Eval. Dev. 2025, 15, 1104–1111. [Google Scholar]
  27. Zhao, C.S.; Lei, S.; Hang, Y.; Yan, L.; Luo, Y.; Luo, S.; Qiu, P.; Hu, Y. Study on the Four-Dimensional Variations of In Situ Stress in Stress-Sensitive Ultra-High-Pressure Tight Gas Reservoirs. Processes 2025, 13, 1508. [Google Scholar] [CrossRef]
  28. Wu, Y.; Zhu, Z.; Shen, Y.; Yu, X.; Liu, G.; Liu, P. Study on the Evolution Law of Four-Dimensional Dynamic Stress Fields in Fracturing of Deep Shale Gas Platform Wells. Processes 2025, 13, 2709. [Google Scholar] [CrossRef]
Figure 1. Schematic of the flow–stress coupling process.
Processes 13 03772 g001
Figure 2. The structural location map of the research area.
Processes 13 03772 g002
Figure 3. Geomechanical model of the fracturing area and its three-dimensional spatial distribution of properties.
Processes 13 03772 g003
Figure 4. Geometric conversion of geological structures.
Processes 13 03772 g004
Figure 5. Near-wellbore geological mesh model of the fracturing zone.
Processes 13 03772 g005
Figure 6. Finite element mesh material property assignment.
Processes 13 03772 g006
Figure 7. Inversion of formation attribute parameters in the fracturing area-Porosity attribute model and profile.
Processes 13 03772 g007
Figure 8. Results of the original in situ stress simulation.
Processes 13 03772 g008
Figure 9. A schematic diagram of the stress boundary of the coupling simulation for fracturing.
Processes 13 03772 g009
Figure 10. Dynamic near-wellbore changes in pore pressure before and after fracturing.
Processes 13 03772 g010
Figure 11. Locations of the three monitoring points.
Processes 13 03772 g011
Figure 12. Pore-pressure evolution near the wellbore during hydraulic fracturing.
Processes 13 03772 g012
Figure 13. Dynamic changes in maximum horizontal stress before and after fracturing.
Processes 13 03772 g013
Figure 14. Dynamic changes in minimum horizontal stress before and after fracturing.
Processes 13 03772 g014
Figure 15. Dynamic changes in vertical stress before and after fracturing.
Processes 13 03772 g015
Figure 16. Dynamic changes in horizontal stress difference before and after fracturing.
Processes 13 03772 g016
Figure 17. Dynamic changes in stress orientation before and after fracturing.
Processes 13 03772 g017
Figure 18. Evolution laws of in situ stress at different directions around the wellbore.
Processes 13 03772 g018
Disclaimer/Publisher’s Note: The statements, opinions and data contained in all publications are solely those of the individual author(s) and contributor(s) and not of MDPI and/or the editor(s). MDPI and/or the editor(s) disclaim responsibility for any injury to people or property resulting from any ideas, methods, instructions or products referred to in the content.