Article

An Enhanced Workflow for Quantitative Evaluation of Fluid and Proppant Distribution in Multistage Fracture Treatment with Distributed Acoustic Sensing

1
China National Logging Company, Xi’an 710077, China
2
School of Mine Safety, North China Institute of Science and Technology, Sanhe 065201, China
3
School of Ocean and Earth Science, Tongji University, Shanghai 200092, China
4
OptaSoft, Beijing 101199, China
*
Author to whom correspondence should be addressed.
Processes 2025, 13(11), 3738; https://doi.org/10.3390/pr13113738
Submission received: 10 October 2025 / Revised: 10 November 2025 / Accepted: 12 November 2025 / Published: 19 November 2025

Abstract

Distributed Acoustic Sensing (DAS) technology has emerged as a valuable tool for monitoring fluid and proppant injection during hydraulic fracturing. One of its applications involves estimating cluster-level fluid and proppant allocations in real time. However, significant uncertainties remain in the quantitative calculation of injected volumes due to limitations in frequency band energy (FBE) data extraction, cluster depth determination, and volume estimation algorithms. This study presents an enhanced workflow for quantitatively estimating fluid and proppant allocations from DAS-derived FBE data while minimizing uncertainties. The workflow integrates multi-band and summed-energy analyses with the optimized selection of calculation algorithms to reduce interpretation uncertainties. The results show that FBE [50–200 Hz] exhibits the highest sensitivity to injection activities, local minima on summed FBE can accurately pinpoint top and bottom depths of each cluster, and a power-law model linking acoustic energy to flow rate allows for quantitative calculation. Field applications demonstrate consistent improvements in fluid and proppant volume estimation accuracy. Validation against post-frac numerical simulations shows that estimated fluid and proppant allocations agree within a 6% error, confirming the method’s quantitative reliability. By addressing key sources of uncertainty, this approach enhances DAS-based fracture diagnostics and provides actionable guidance for real-time decision making in unconventional completions.

1. Introduction

Multistage hydraulic fracturing in extended horizontal wells is a critical technology for enabling the effective development of unconventional tight oil reservoirs. Among various available completion methods, plug-and-perf completion—which isolates individual perforation clusters and fractures the reservoir sequentially, stage by stage—has become the most commonly used approach in horizontal wells [1]. To maximize the efficiency of perforation clusters and achieve uniform fracture distribution along the entire wellbore, multistage fracturing operations require continuous, high-resolution monitoring to enhance stimulation effectiveness and ensure safe execution [2,3]. Distributed Acoustic Sensing (DAS) converts fiber-optic cables into dense acoustic sensor arrays by utilizing Rayleigh backscattering, enabling high-resolution downhole monitoring [4,5,6,7,8]. By emitting laser pulses and analyzing the phase shift in Rayleigh backscattering caused by inherent impurities within the fiber cable, a DAS interrogator unit detects and measures the dynamic strain or strain rate along either specialized fiber cables or existing telecommunication fiber cables. The changes in the intensity of backscattered light over time are called distributed acoustic signatures. These signatures can identify and describe acoustic events, such as seismic waves, along the fiber. The extensive dynamic range and broad frequency coverage of DAS have made it useful for monitoring seismic activities such as earthquakes, volcanic events, and glacier-related seismicity [9]. Unlike conventional pressure and temperature gauges, DAS allows for the real-time acquisition of acoustic signals along the entire wellbore [10], supporting applications such as evaluating perforation operation effectiveness [11,12], monitoring perforation cluster activation [13], detecting diversion [14,15,16,17], and identifying downhole anomalies such as sand screen-out [18], out-of-zone flow [19,20], and fiber failure [21].
With in-well fiber-optic cables, DAS provides a non-intrusive means of monitoring fracture initiation, propagation, and effectiveness by capturing the acoustic energy generated by fluid and proppant movement during hydraulic fracture treatment. Both in-casing and out-of-casing fiber deployments are increasingly adopted in field applications. Out-of-casing fibers, in particular, offer improved acoustic coupling and signal fidelity, especially in long horizontal shale wells [22]. This configuration enables effective stage-by-stage and cluster-level monitoring of fluid injection.
Quantitative evaluation of injected fluid and proppant volumes can be obtained from DAS data during hydraulic fracturing, which allows for predicting the locations of the dominant fractures to optimize and improve future treatments [23]. Recent studies have increasingly adopted frequency band energy (FBE) as a proxy for estimating fluid and proppant injection volumes [24]. The raw DAS data are multidimensional and complex, as they are acquired at high spatial and temporal resolutions. Therefore, they should be averaged over a fixed duration with several frequency bands to provide a simplified snapshot of the acoustic energy within the dataset at any given time [25]. Thus, the raw time-domain data are commonly transformed into the frequency domain using the signal processing technique of the FBE method, which averages the data over a fixed time duration and frequency range for a simplified interpretation. With FBE, the signals of interest can be more easily isolated from the background noise and environmental effects in the frequency domain [26]. In the application of hydraulic fracturing monitoring with DAS technology, FBE integrates acoustic energy within selected frequency bands during injection and has shown a log-linear correlation with injected fluid rates. The correlation has been validated in multi-stage treatments [27]. This relationship is supported by numerical modeling of fracture–acoustic behavior [28,29]. Despite its increasing application in hydraulic fracturing diagnostics, the DAS-based quantitative evaluation of injected fluid and proppant volumes remains constrained by several technical challenges. The uniform application of FBE across all clusters overlooks cluster-specific dominant frequencies arising from varying geomechanical and completion conditions. Despite its growing use, few studies have addressed frequency-dependent attenuation or proposed correction methods based on perforation characteristics. In particular, some previous experimental and field example studies revealed that frequency bands that are sensitive to injection or production activities vary significantly according to the variations in flow rate, proppant concentration, pipe and/or valve size, etc. [30,31]; however, the questions of how to extract appropriate FBE datasets for quantitative evaluation, which frequency band should be selected as the optimal FBE dataset for quantitative estimation and how FBE datasets influence the quantitative evaluation result have not been fully examined yet. Previous studies on DAS-based fluid and proppant distribution estimation often relied on single-frequency band analysis or subjective selection of frequency ranges without systematic justification. These approaches introduced significant uncertainty in cluster-level volume calculations due to inconsistent signal interpretation. Moreover, cluster depth determination was typically based on manual picking or low-resolution methods, leading to misalignment between clusters and acoustic responses. Other than FBE data extraction and cluster depth location determination, quantitative fluid and proppant volume calculation algorithms are also a key factor that influence the correctness and accuracy of quantitative hydraulic fracturing fluid and sand volumes calculated from acoustic signals from DAS measurements. The influence of different calculation algorithms on fluid and proppant allocations has not been fully discussed yet. Volume estimation algorithms were frequently empirical, lacking validation against independent data such as post-fracture simulations. As a result, quantitative reliability remained limited, hindering real-time decision-making during fracturing operations. In a word, the uncertainties existing in the three key aspects noted above have not yet been thoroughly investigated and discussed.
This study addresses these limitations through an enhanced, integrated workflow that reduces uncertainty at every step. We introduce a sliding-window Fast Fourier Transform (FFT) combined with multi-band FBE analysis to objectively identify the most responsive frequency range. Cluster depths are precisely determined using local minima in summed FBE profiles, improving spatial accuracy. A power-law model is then applied for volume calculation, calibrated and validated against post-frac numerical simulations. Uncertainty is quantified at each stage, ensuring transparency and reproducibility. The objective of this work is fourfold: (1) to optimize the selection of FBE frequency bands based on injection-phase sensitivity; (2) to develop a robust methodology for accurate cluster depth identification; (3) to establish a reliable algorithm for quantitative fluid and proppant volume estimation from DAS data; and (4) to evaluate the influence of key processing steps on final results. By achieving these goals, our workflow advances DAS-based fracture diagnostics and provides a practical framework for real-time monitoring in unconventional reservoir completions.

2. Methodology

2.1. Overview of the DAS-Based Quantitative Evaluation Workflow

This study adopts a structured DAS-based quantitative evaluation workflow designed to transform raw acoustic measurements into actionable engineering insights. The workflow mainly relies on the FBE data derived from time-domain raw DAS data.
While the qualitative interpretation focuses on identifying fracturing-related features, such as perforation cluster activation, flow diversion, and well integrity anomalies, by analyzing spatio-temporal patterns in DAS energy waterfall plots and spectrograms, the quantitative evaluation is mainly focused on estimating the relative or absolute volumes of fluid and proppant injected into each perforation cluster. This process involves converting FBE metrics into flow rates using empirical or physics-based models, followed by time integration to obtain cumulative injection volumes. While enabling detailed diagnostics, this approach is sensitive to noise, signal distortion, and modeling assumptions.
The proposed workflow, which is shown in Figure 1, consists of six key steps:
(1)
Sliding-Window FFT: Raw DAS data are converted to the amplitude-spectrum domain via sliding-window FFT. The FFT method can be either the Short-Time Fourier Transform (STFT) [32] or Power Spectral Density (PSD). In practice, the PSD algorithm [33] can be applied to each windowed 1D acoustic signal on a specific channel and repeat this processing by looping over all channels and time windows.
(2)
Frequency Band Energy Extraction: For each PSD curve, multi-band energy can be extracted by first clipping the PSD curve between the lower-frequency and upper-frequency bands and, second, summing the clipped curve data. Thus, only one single FBE value is yielded for each time window in Step (1). This is also a downsampling process, and the data volume will be reduced dramatically after FBE extraction. The summation could also be replaced by the Root Mean Squared (RMS) or integral algorithms.
(3)
FBE Dataset Selection: We select one optimal FBE dataset from the multi-band FBE datasets. The selection criterion involves finding the frequency band with the highest energy within the active stage depth interval and the lowest energy outside the active stage.
(4)
Cluster Depth Determination. The top and bottom depth intervals of active perforation clusters are defined according to the minima points on the summed FBE curve, allowing for the extraction of cluster-specific FBE profiles over time.
(5)
Fluid and Proppant Volume Calculation Algorithm Selection: We select an optimal system of equations derived from either empirical or physics-based models.
(6)
Quantitative Evaluation: Converting FBE metrics into flow rates using the algorithm selected in Step (5), followed by time integration to obtain cumulative injection volumes.
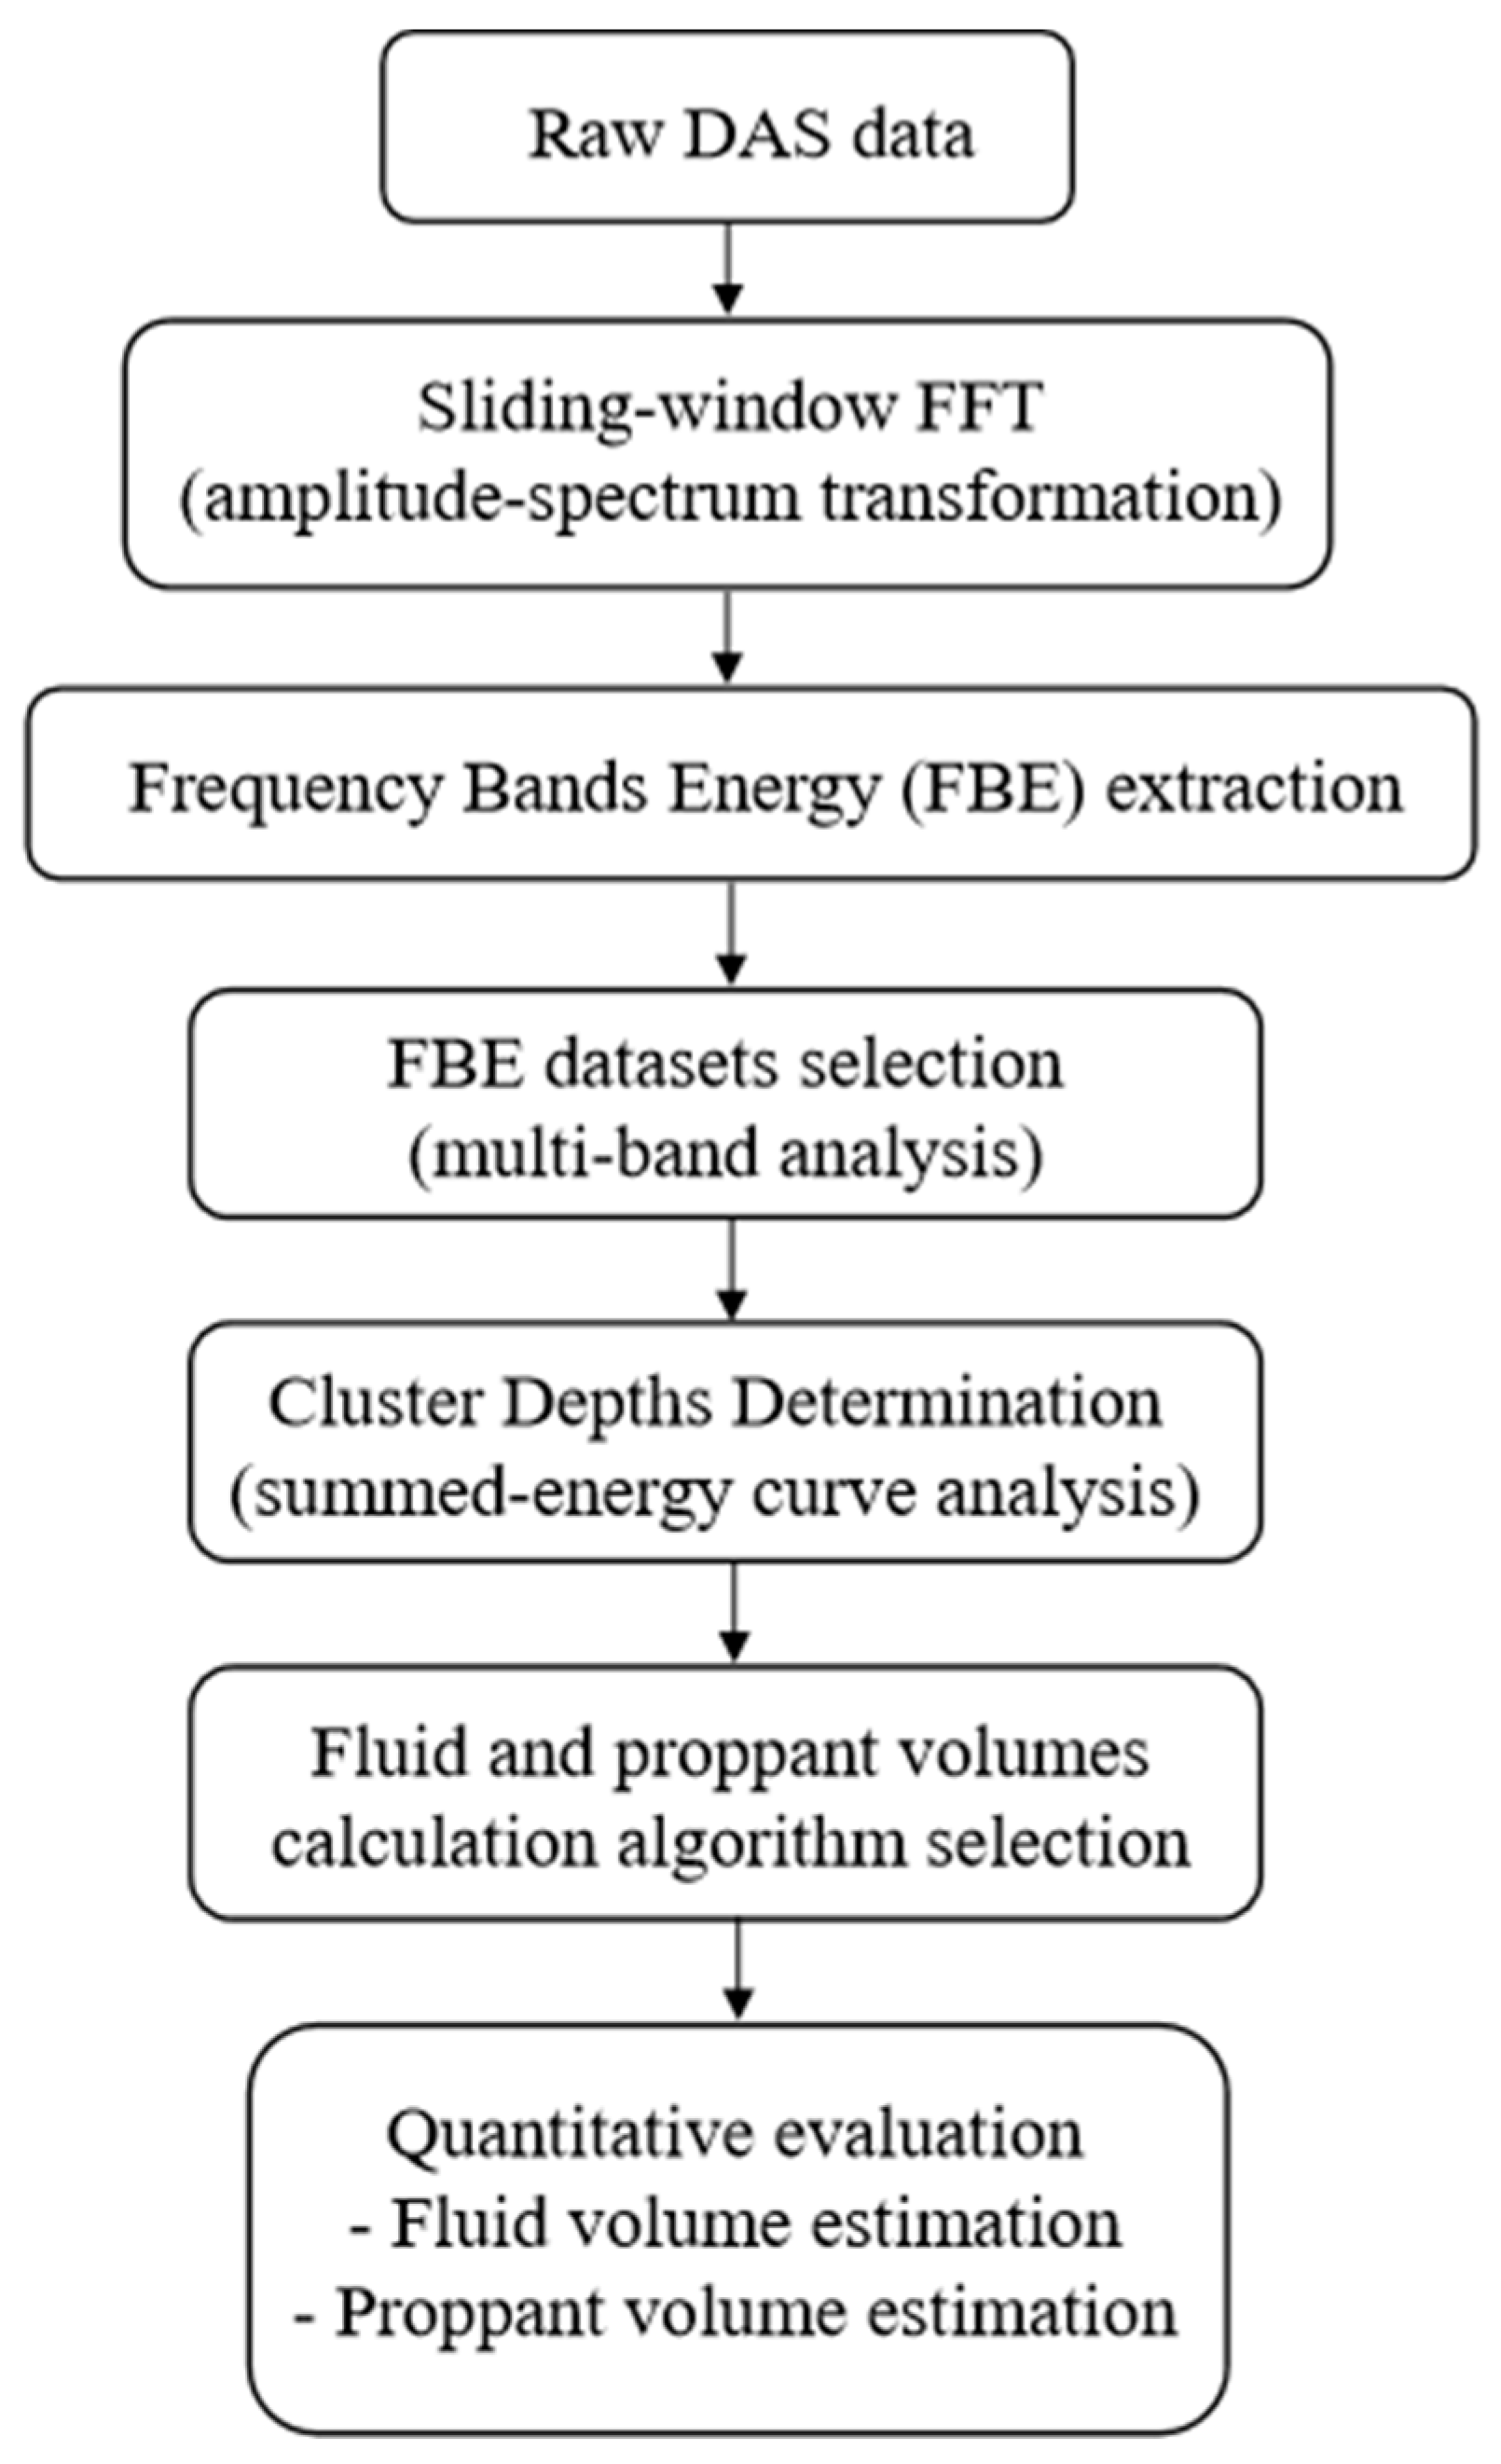
This workflow supports both real-time fracture diagnostics and post-treatment flow allocation analysis. The following sections examine three primary uncertainty sources that influence the robustness of DAS-based fluid and proppant volume estimations: FBE dataset selection, cluster depth determination, and flow allocation calculation algorithm selection.
Figure 1. Workflow of DAS-based quantitative evaluation of fluid and proppant volume.
Processes 13 03738 g001

2.2. Uncertainty I: FBE Dataset Selection

The first major source of uncertainty in DAS-based quantitative evaluation lies in the selection of frequency bands used to calculate the FBE. FBE is an energy attribute representing the energy extracted from a certain frequency band that is most sensitive to fluid and proppant injection activities. FBE, which is defined as the integration of squared raw measurements in each DAS channel location for a fixed period of time, has been used as a proxy for the energy induced by fluid and proppant movement.
However, this type of FBE contains the full frequency band energy and sometimes cannot highlight the energies of injection intervals; this is because the full borehole presents chaos features resulting from the high flow rate of injections. To overcome this issue, Zhao et al. [24] define FBE as the sum of the power spectral density of raw measurements in each DAS channel location for a fixed period of time. The advantage of this type of FBE is that it allows for the extraction of FBE in certain frequency bands that are most sensitive to fluid injection activities; it can highlight the higher energies in the injected cluster intervals while suppressing the energies in the non-injection borehole intervals. In terms of signal processing, FBE is derived by integrating the acoustic energy of DAS signals within selected time–depth windows, typically after applying a sliding-window FFT.
Figure 2 illustrates the process of extracting multi-band FBE datasets. The raw or median filtered DAS data essentially comprise a 2D array of acoustic signals. The first step of extracting FBE is to segment the 2D array into many one-dimensional (1D) arrays of acoustic signals (Figure 2a); each of these arrays is clipped from one specific channel and has several samples, which is actually the down-sampling factor. The next step is applying FFT to each of these 1D arrays of acoustic signals, thus transforming them into amplitude–frequency curves (Figure 2b). For each amplitude–frequency curve, one single-frequency band with lower- and upper-frequency or multiple-frequency bands can be defined, and the summation or RMS value of the amplitudes between the lower and upper frequency of each frequency band constitutes the frequency band energy.
These frequency components serve as proxies for fracture-related acoustic events such as fluid turbulence, proppant transport, or near-wellbore friction. However, the choice of frequency band directly affects signal fidelity, sensitivity, and interpretability. Although hydraulic fracturing generates a broadband acoustic spectrum, only certain frequency sub-bands are physically representative of flow activity. A narrow frequency band risks omitting critical signal components, especially in weak or noisy environments. Conversely, a wide frequency range may include irrelevant energy from surface pumps, tubing resonance, or annular fluid motion, diluting the diagnostic value. Therefore, FBE bandwidth selection involves a trade-off between suppressing noise and preserving relevant fracture-induced signatures.
Laboratory-scale experiments provide empirical support for the spectral interpretation of DAS signals under controlled multiphase injection conditions [18]. In these flow-loop tests, optical fibers were bonded along the exterior of transparent pipes while injecting mixtures of fluids and solids at different flow rates, temperatures, and erosion states. The experiments revealed that different operational modes generate distinct DAS frequency responses. For example, sand-laden injection and perforation erosion resulted in higher energy in mid-to-high-frequency bands, while clean fluid injection dominated lower-frequency ranges.
Table 1 summarizes the typical DAS response frequency ranges associated with key downhole operations, including hydraulic fracturing, production flow, sand production, and leakage or noise sources, as observed in both field applications and controlled experiments. This categorization serves as a reference for selecting candidate bands in both field data analysis and laboratory validation.
To mitigate the uncertainty introduced by fixed bandwidth selection, this study adopts a multi-band FBE approach. The FFT spectrum is divided into multiple candidate frequency bands, and each of them is analyzed separately to capture distinct spectral signatures associated with fracture-related events. A normalization step is then applied to correct for time-dependent energy decay across bands, enhancing the consistency of flow interpretation.
In summary, the bandwidth selection process plays a critical role in both qualitative and quantitative DAS workflows. Improper frequency choices may lead to signal distortion, underrepresentation of flow activity, or overemphasis of irrelevant noise. This multi-band framework, informed by controlled experiments, enhances interpretability and addresses one of the key sources of uncertainty in DAS-based workflows. After defining the optimal frequency band, the next step involves identifying active perforation clusters based on FBE signatures.

2.3. Uncertainty II: Perforation Cluster Depth Interval Determination

A second major source of uncertainty in DAS-based quantitative evaluation arises from the determination of perforation cluster depth intervals. Accurate identification of each cluster’s spatial extent is critical for calculating fluid and proppant injection volumes, as these estimates depend on integrating FBE signals within defined depth windows. Misidentifying cluster boundaries may result in signal misallocation, overlap between adjacent clusters, or biased volume calculations.
In typical field operations, physical depth markers, such as radioactive tracers or fiber-deployed reference points, are often unavailable. There are no physical instruments installed in wellbores to provide accurate top and bottom depths for each cluster; therefore, cluster depth intervals must be inferred from DAS signal responses alone, and some calculations should be carried out to determine the virtual border for each cluster. However, raw DAS data during injection frequently exhibit elevated acoustic signals along the entire fiber length, making it challenging to directly identify active injection zones on conventional waterfall plots.
To address this, we developed a method for determining the depth location of each cluster based on local minima of summed DAS FBE data. These FBE values are integrated over time for each depth channel, producing a 1D depth–energy curve. In this curve, local maxima generally correspond to active injection clusters, while local minima delineate boundaries between clusters. The adjacent local minima usually help exclude channels with FBE responses close to zero, meaning that uncertainty will not emerge in the input FBE dataset for fluid volume estimation.
This approach segments the depth-summed FBE profile at the identified local minima to define initial cluster intervals. Such segmentation reduces cross-cluster signal interference and improves the reliability of subsequent flow rate and volume estimations. Despite its practicality, this method inherently introduces spatial uncertainty. Weak or indistinct minima, caused by overlapping acoustic signatures, background noise, or near-wellbore effects, can lead to the erroneous merging or splitting of clusters, depending on the segmentation parameters applied. Additionally, anomalies such as diversion effects, tool-related noise, or perforation erosion may alter the acoustic energy distribution, complicating accurate interval delineation. Under these extreme conditions, manual inspection and corrections should be in place to derive the correct top and bottom depth values for each perforation cluster.
In order to obtain accurate fluid and proppant volumes, one should first determine the cluster depth location by following the principle and procedure described above to exclude channels with an FBE response close to zero; otherwise, uncertainty will emerge in the input dataset. This cluster depth determination approach provides a practical method for defining effective cluster intervals in the absence of downhole positioning tools. Despite inherent uncertainties (e.g., signal overlap or noise), the summed FBE method reliably delineates injection-active depths and serves as a foundation for subsequent volume estimation across treatment stages. This depth-interval determination method, based on FBE analysis, offers a signal-driven alternative to physical markers but remains sensitive to spatial uncertainties. Therefore, quantitative DAS interpretations must carefully consider these potential errors when assessing cluster identification and boundary segmentation.

2.4. Uncertainty III: Fluid and Proppant Volume Calculation Algorithms

The third major source of uncertainty in quantitative DAS interpretation arises from the algorithms used to convert FBE data into injection flow rates and cumulative volumes. Unlike qualitative analyses, which focus on pattern recognition, quantitative workflows require a practical relationship between acoustic signal intensity and injection parameters such as the fluid rate and proppant mass.
To quantitatively calculate the fluid and proppant volumes for each perforation cluster, we developed a system of equations that connects the acoustic energy response with the cluster flow-rate distribution during the injection period using the correlation between acoustic signal and flow rate observed and confirmed by both laboratory experiments and computational simulations [27]. The correlation is expressed in the equation below:
log q 3   =   A   ×   L SP   +   B  
where q is the flow rate, L SP is sound pressure level (SPL) that can be replaced by FBE data, and A and B are parameters of the correlation.
The system of equations developed based on the correlation equation above is expressed as follows:
N 1 q 1 t   = N 1 10 A 3 × E 1 t   × q T t   N 1 10 A 3 × E 1 t   + + N n 10 A 3 × E n t     N n q n t   = N n 10 A 3 × E n t   × q T t   N 1 10 A 3 × E 1 t   + + N n 10 A 3 × E n t  
where E i is FBE in cluster i, n is the total number of perforated clusters in one stage, and qi is the flow rate for one perforation in cluster I; q T is total flow rate of fluid injected for the fracturing treatment, and N i is the number of perforations per cluster I; A is the parameter of correlation that is close to a constant regardless of fluid properties and fracture properties, ranging from 0.08 to 0.1 [28]. However, the parameter A in the equation exerts a strong, nonlinear influence on estimated flow rates and hence on the fluid volumes. A brief sensitivity analysis over the range A ∈ [0.08, 0.1] indicates that each increment of 0.01 in A approximately doubles the estimated flow rate at 90 dB, and the flow rate estimations can vary by up to 300%. Therefore, field applications should employ site-specific calibration of A and propagate uncertainty bounds through volume estimation workflows to avoid significant over- or under-predictions of fluid allocation.
The cumulative volume distribution of fluid flow V i can be calculated by integrating the flow rate q i derived from Equation (2) over all injection time periods from the fracturing treatment start time t 0 to the end of the fracturing period t fin . The equations are as follows:
V 1 = t = t 0 t fin N 1 q 1 t V n = t = t 0 t fin N n q n t
The cumulative weight of proppant distribution, W i , can be calculated by integrating the mass flow rate of the proppant obtained using the bottom-hole proppant concentration C P ( t ) multiplying the cumulative volume distribution over time:
W 1 = t = t 0 t fin c p ( t ) × N 1 q 1 t W n = t = t 0 t fin c p ( t ) × N n q n t
There is also an approximated version of the system of equations listed above It keeps the forms of Equations (3) and (4); however, instead of using Equation (2) to solve q i in each time period, it simply solves q i by allocating the flow rate of each cluster according to the ratio of the summed FBE values per cluster to the summed FBE values of all clusters. The correlation is expressed in the equation below:
q = a ×   L SP
where q is the flow rate, L SP is the SPL that can be replaced by FBE data, and a is a coefficient that is not verified by laboratory experiments and is usually equal to 1 for simplicity. In essence, Equation (5) assumes the flow rate of each perforation hole is linearly proportional to the SPL. This FBE–flow relationship does not consistently hold under varying operational conditions, particularly without laboratory experiment data and local recalibration using site-specific data. Additionally, it does not use perforation shot counts ( n i ) as weighting factors and can introduce significant errors, especially when perforation number variation, perforation erosion, ineffective shots, or variations in perforation performance alter the actual flow allocation. In practice, Equation (1) tends to yield more accurate fluid and proppant allocation results than Equation (5), and we select Equation (1) as the quantitative evaluation model.
In summary, three key factors influence the correctness and accuracy of quantitative evaluation of fluid and sand volumes that are calculated from acoustic signals from DAS measurements, including frequency band energy (FBE) data extraction, cluster depth location determination and quantitative fluid and proppant volume calculation algorithm. The accurate evaluation of injected fluid and proppant volumes for each perforation cluster requires an appropriate FBE dataset that contains the frequency band energy most sensitive to fluid and proppant injection, proper depth-interval determination for each perforation cluster, and an appropriate system of equations that connects acoustic energy response with the flow rate and proppant concentration.

3. Field Dataset

3.1. Well Completion and Fracture Treatment Design

The Junggar Basin, which is a major unconventional resource basin in northwestern China, serves as the focus of this study. The basin contains shale gas, tight sandstone, and conglomerate reservoirs, which are typically characterized by ultra-low permeability, complex lithology, and the presence of natural fracture networks. These geological conditions make hydraulic fracturing essential for achieving commercial production. However, reservoir heterogeneity and variable fracture propagation behavior present significant challenges to efficient stimulation and uniform fluid distribution.
The field DAS data analyzed in this study were acquired using a behind-casing in-well fiber-optic cable during the hydraulic fracturing of a horizontal tight gas well located in the western Junggar Basin, China. The well was completed with casing and cementing along its entire length to ensure structural integrity and zonal isolation during fracturing operations. The target reservoir is a low-permeability, feldspar-bearing sandstone interval with a thickness of approximately 30 m, situated at depths ranging from 3916 m to 4128 m. The formation exhibits porosity around 3–5% and permeability generally below 0.5 mD, being dominated by matrix pores with limited natural fracture development. The reservoir is further characterized by significant mechanical heterogeneity and complex in situ stress conditions, including a maximum horizontal stress of approximately 65 MPa and Young’s modulus of 31 GPa. These geological conditions create a challenging environment for hydraulic fracture propagation, fluid transport, and cluster efficiency.
The horizontal lateral extended approximately 1000 m and was completed using a 14-stage multi-cluster hydraulic fracturing design, with total measured depth reaching up to 5122 m. The perforation scheme was designed with 2–6 clusters per stage, with 5–10 perforation holes per cluster. The perforation strategy aimed to enhance cluster efficiency and fracture complexity. The fracturing treatment employed slickwater as the base fluid, with friction reducers and proppant transport additives tailored to operational needs. Pumping rates typically ranged from 20 to 25 m3/min, with proppant concentrations adjusted dynamically during each stage. Treatment designs were optimized for each stage based on real-time operational feedback, seeking to maximize stimulated reservoir volume (SRV) and fracture complexity.

3.2. DAS Data Acquisition

The primary objective of the field test was to evaluate fluid and proppant distribution behaviors during multi-cluster hydraulic fracturing stages, particularly under the influence of diversion techniques. The diverters were selectively deployed in certain stages, including Stage 8, to promote balanced fluid distribution across clusters and mitigate dominant flow channels. This setup provided a valuable opportunity to assess the impact of the diverter on cluster activation using DAS-based flow diagnostics. DAS was deployed as the primary downhole monitoring technology to capture real-time acoustic responses during the fracturing operations. A specially designed fiber-optic cable was deployed outside the casing using a centralized stabilizer system to optimize coupling with the formation for DAS signal acquisition. The DAS system utilized a phase-sensitive optical time-domain reflectometry (ϕ-OTDR) interrogator with a spatial sampling interval of 0.2 m, a gauge length of 1.0 m and a sampling rate of 10 kHz, enabling the continuous acquisition of high-fidelity acoustic data along the entire wellbore.
To ensure high-fidelity acoustic signal acquisition throughout the hydraulic fracturing operation, a structured Distributed Acoustic Sensing (DAS) monitoring protocol was implemented. This protocol emphasized rigorous pre-job system validation, optimized fiber coupling, and a synchronized data acquisition workflow, minimizing environmental interference while ensuring reliable downhole event detection.
Prior to the fracturing operation, optical time-domain reflectometry (OTDR) tests verified fiber integrity, ensuring uninterrupted signal transmission along the entire wellbore. The DAS system was connected to the wellhead through dedicated monitoring panels. Functionality checks confirmed readiness, while calibration procedures, including acoustic pulse and thermal injection tests, validated coupling performance and established baseline noise levels.
Baseline DAS recordings were captured before each stage to provide reference datasets for background noise suppression and facilitate post-acquisition signal interpretation. During the fracturing of Stage 2 to Stage 14, the DAS system continuously recorded acoustic data in synchronization with surface operations, allowing for real-time monitoring of perforation activation, fracture propagation, and potential fluid diversion.
Stages involving diversions received particular monitoring attention, with acoustic responses recorded before and after diversion to assess flow redistribution and diversion efficacy. Post-stage background recordings further ensured consistent system performance and verified fiber response integrity across the operation.
In summary, the combination of engineered well completion, tailored fracturing design, and advanced fiber-optic monitoring established a comprehensive foundation for the subsequent quantitative analysis of injection behavior at the cluster level. The DAS monitoring protocol, combining thorough pre-job validation, continuous synchronized data collection, and systematic background measurement, established a reliable dataset for the subsequent interpretation of multi-cluster hydraulic fracturing behavior. These comprehensive field data support both qualitative and quantitative evaluations, forming the basis for the uncertainty analyses and quantitative fluid volume estimation. Moreover, these observations offer valuable insights for the engineering application of DAS-based fracture diagnostics.

4. Results

4.1. FBE Dataset Selection

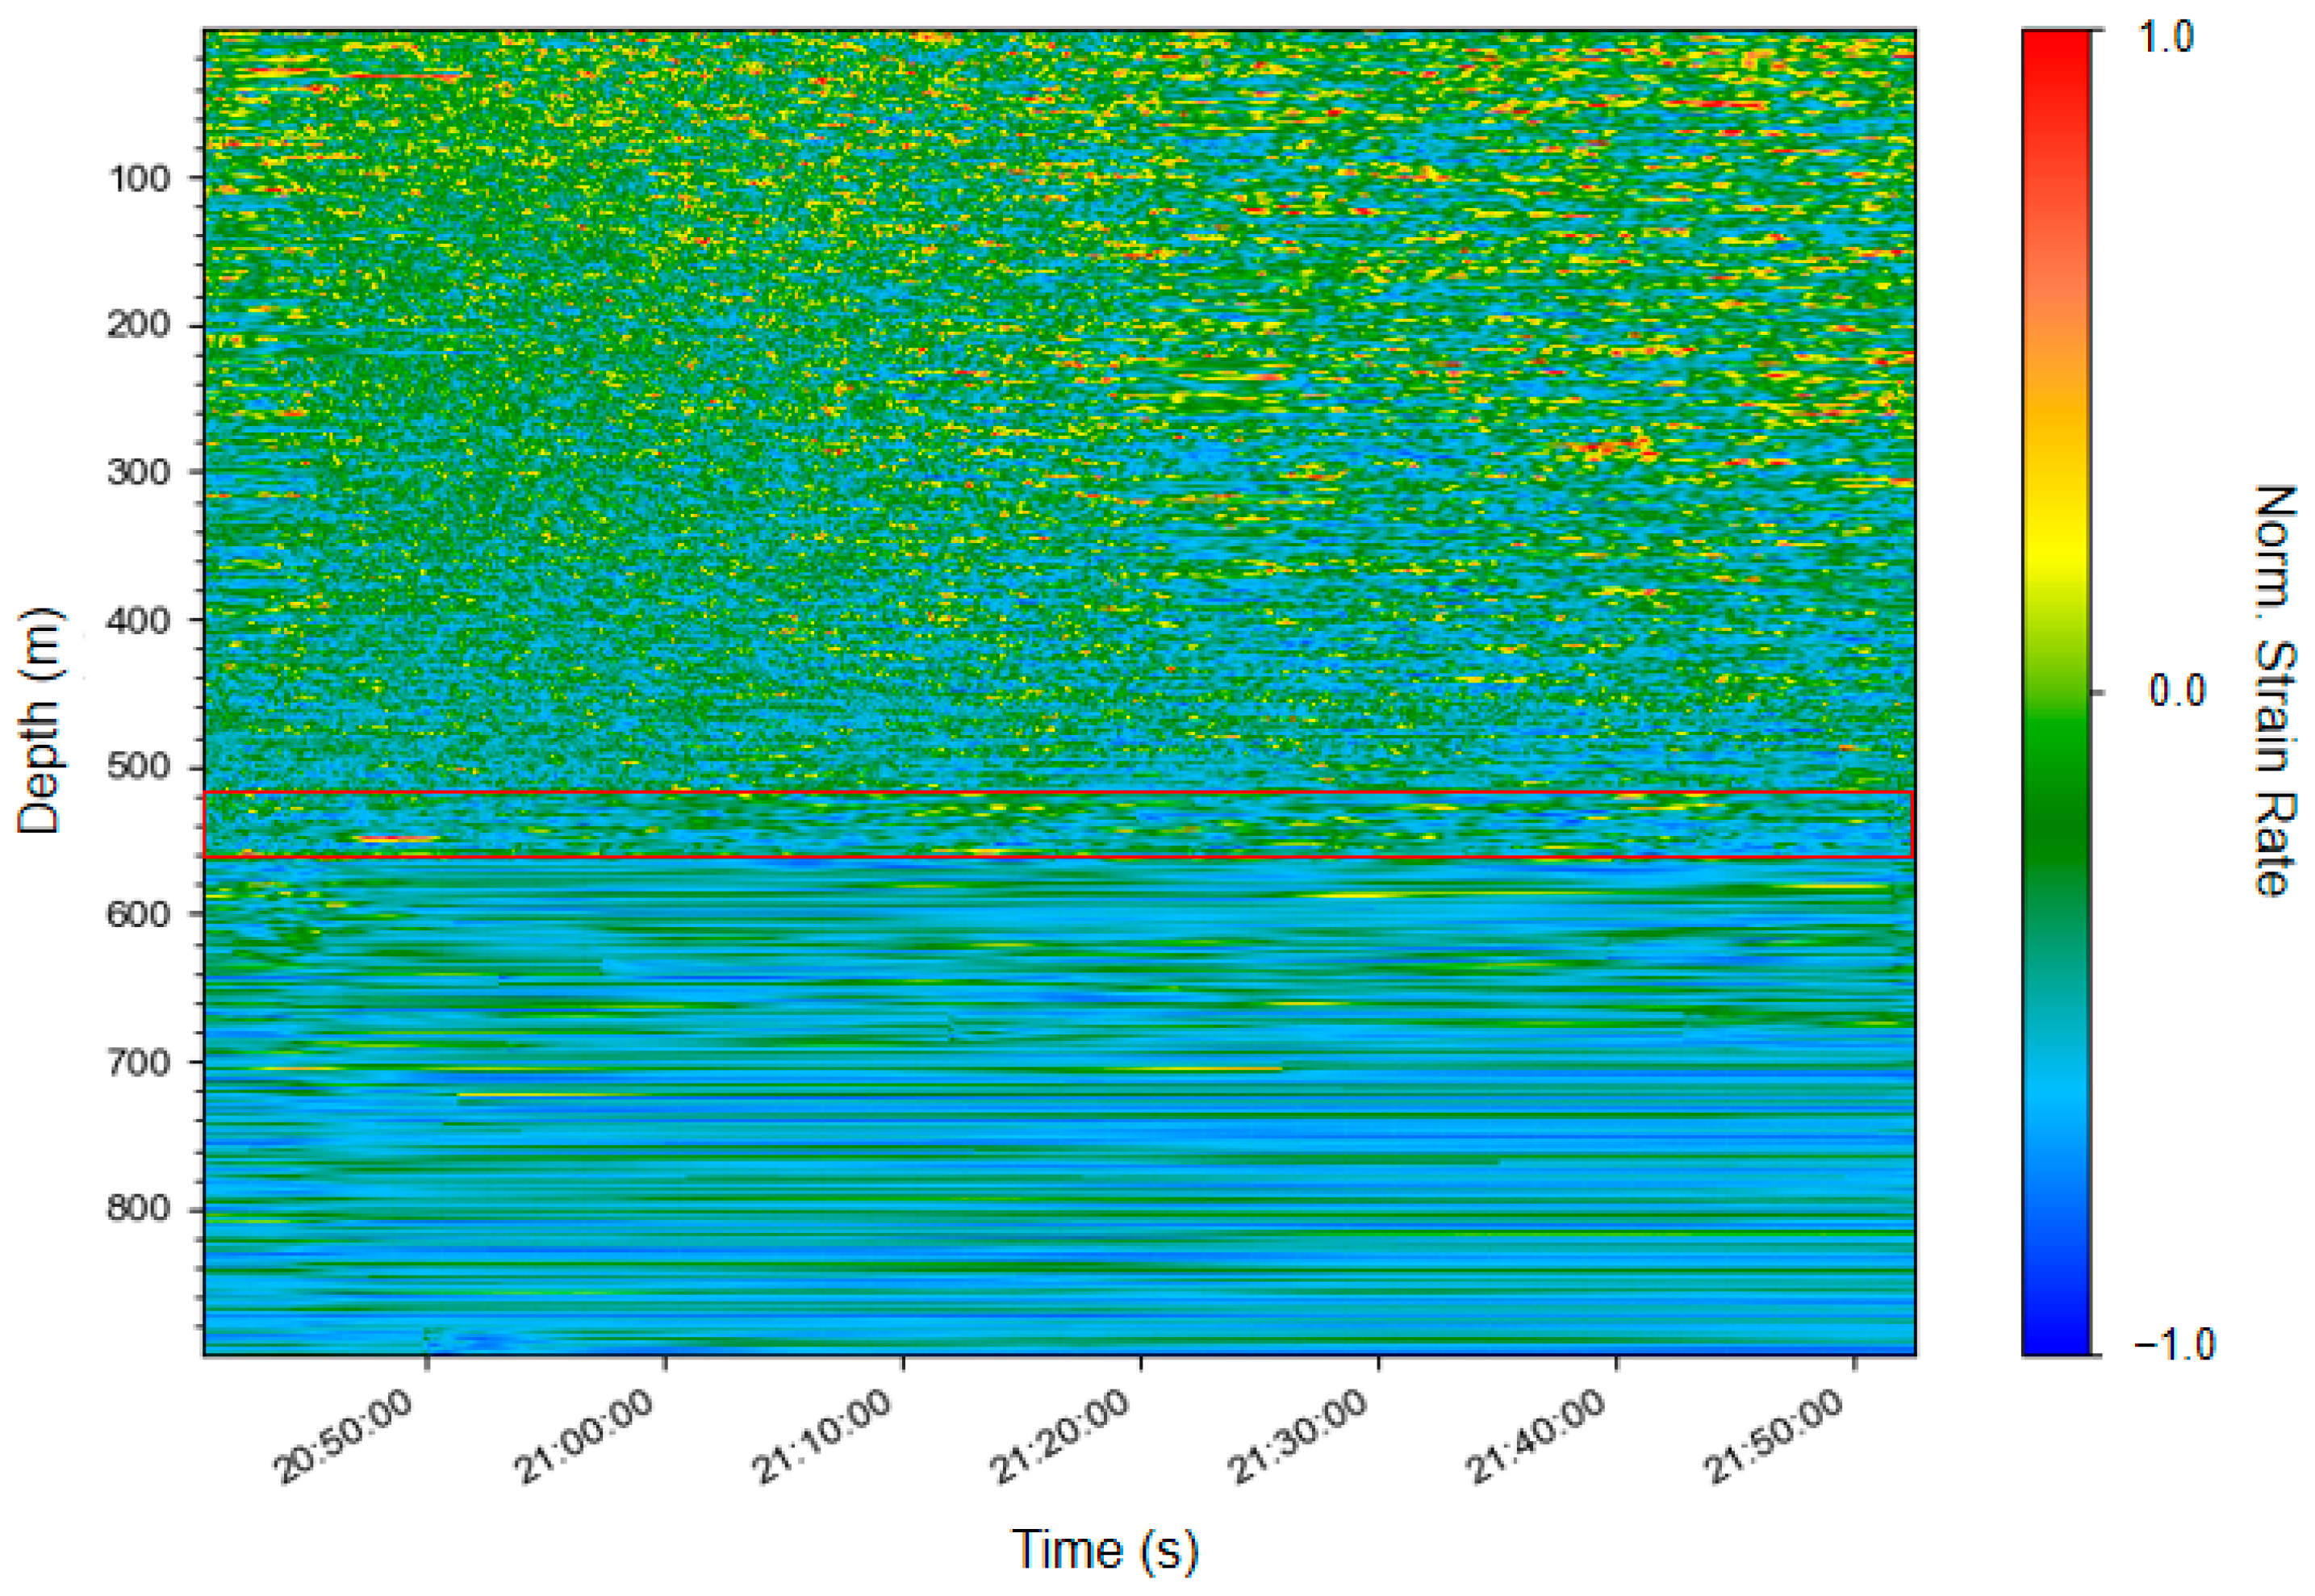
The DAS system records broadband strain or strain rate signals along the fiber cable, providing detailed acoustic response patterns during hydraulic fracturing. Figure 3 presents the raw DAS waterfall plot from Stage 8 of the hydraulic fractured well. As the raw DAS data are recorded at a sampling frequency of 10 kHz, the frequency of acoustic signals ranges from 0 to 5 kHz. It is evident that no high-energy bright spots or regions exist in either the injection or non-injection depth locations on the raw DAS waterfall plot, meaning that the raw DAS data cannot be used for the interpretation of fluid and proppant volumes. In fact, the broadband acoustic signals contain various vibrations and cannot highlight the high-intensity vibrations from injection activities around active perforation cluster depth locations. Moreover, the plot reveals dominant high-amplitude background signals across the entire monitored treatment interval, which is delineated within the red rectangle; this is primarily caused by rapid fluid flow toward the bottom wellbore. However, within the depth range of 520–560 m, where the perforated clusters are located, the raw DAS signals are not distinctly enhanced, making it difficult to directly identify injection-active zones and separate responses of each cluster from the raw data alone.
Therefore, FBE datasets should be extracted from raw DAS data and used for estimating fluid and proppant volumes. To extract injection-sensitive features from the broadband signals, a frequency-domain transformation was performed on the raw DAS data using a sliding-window FFT. This process generated FBE profiles, which reflect signal amplitude within specified frequency bands.
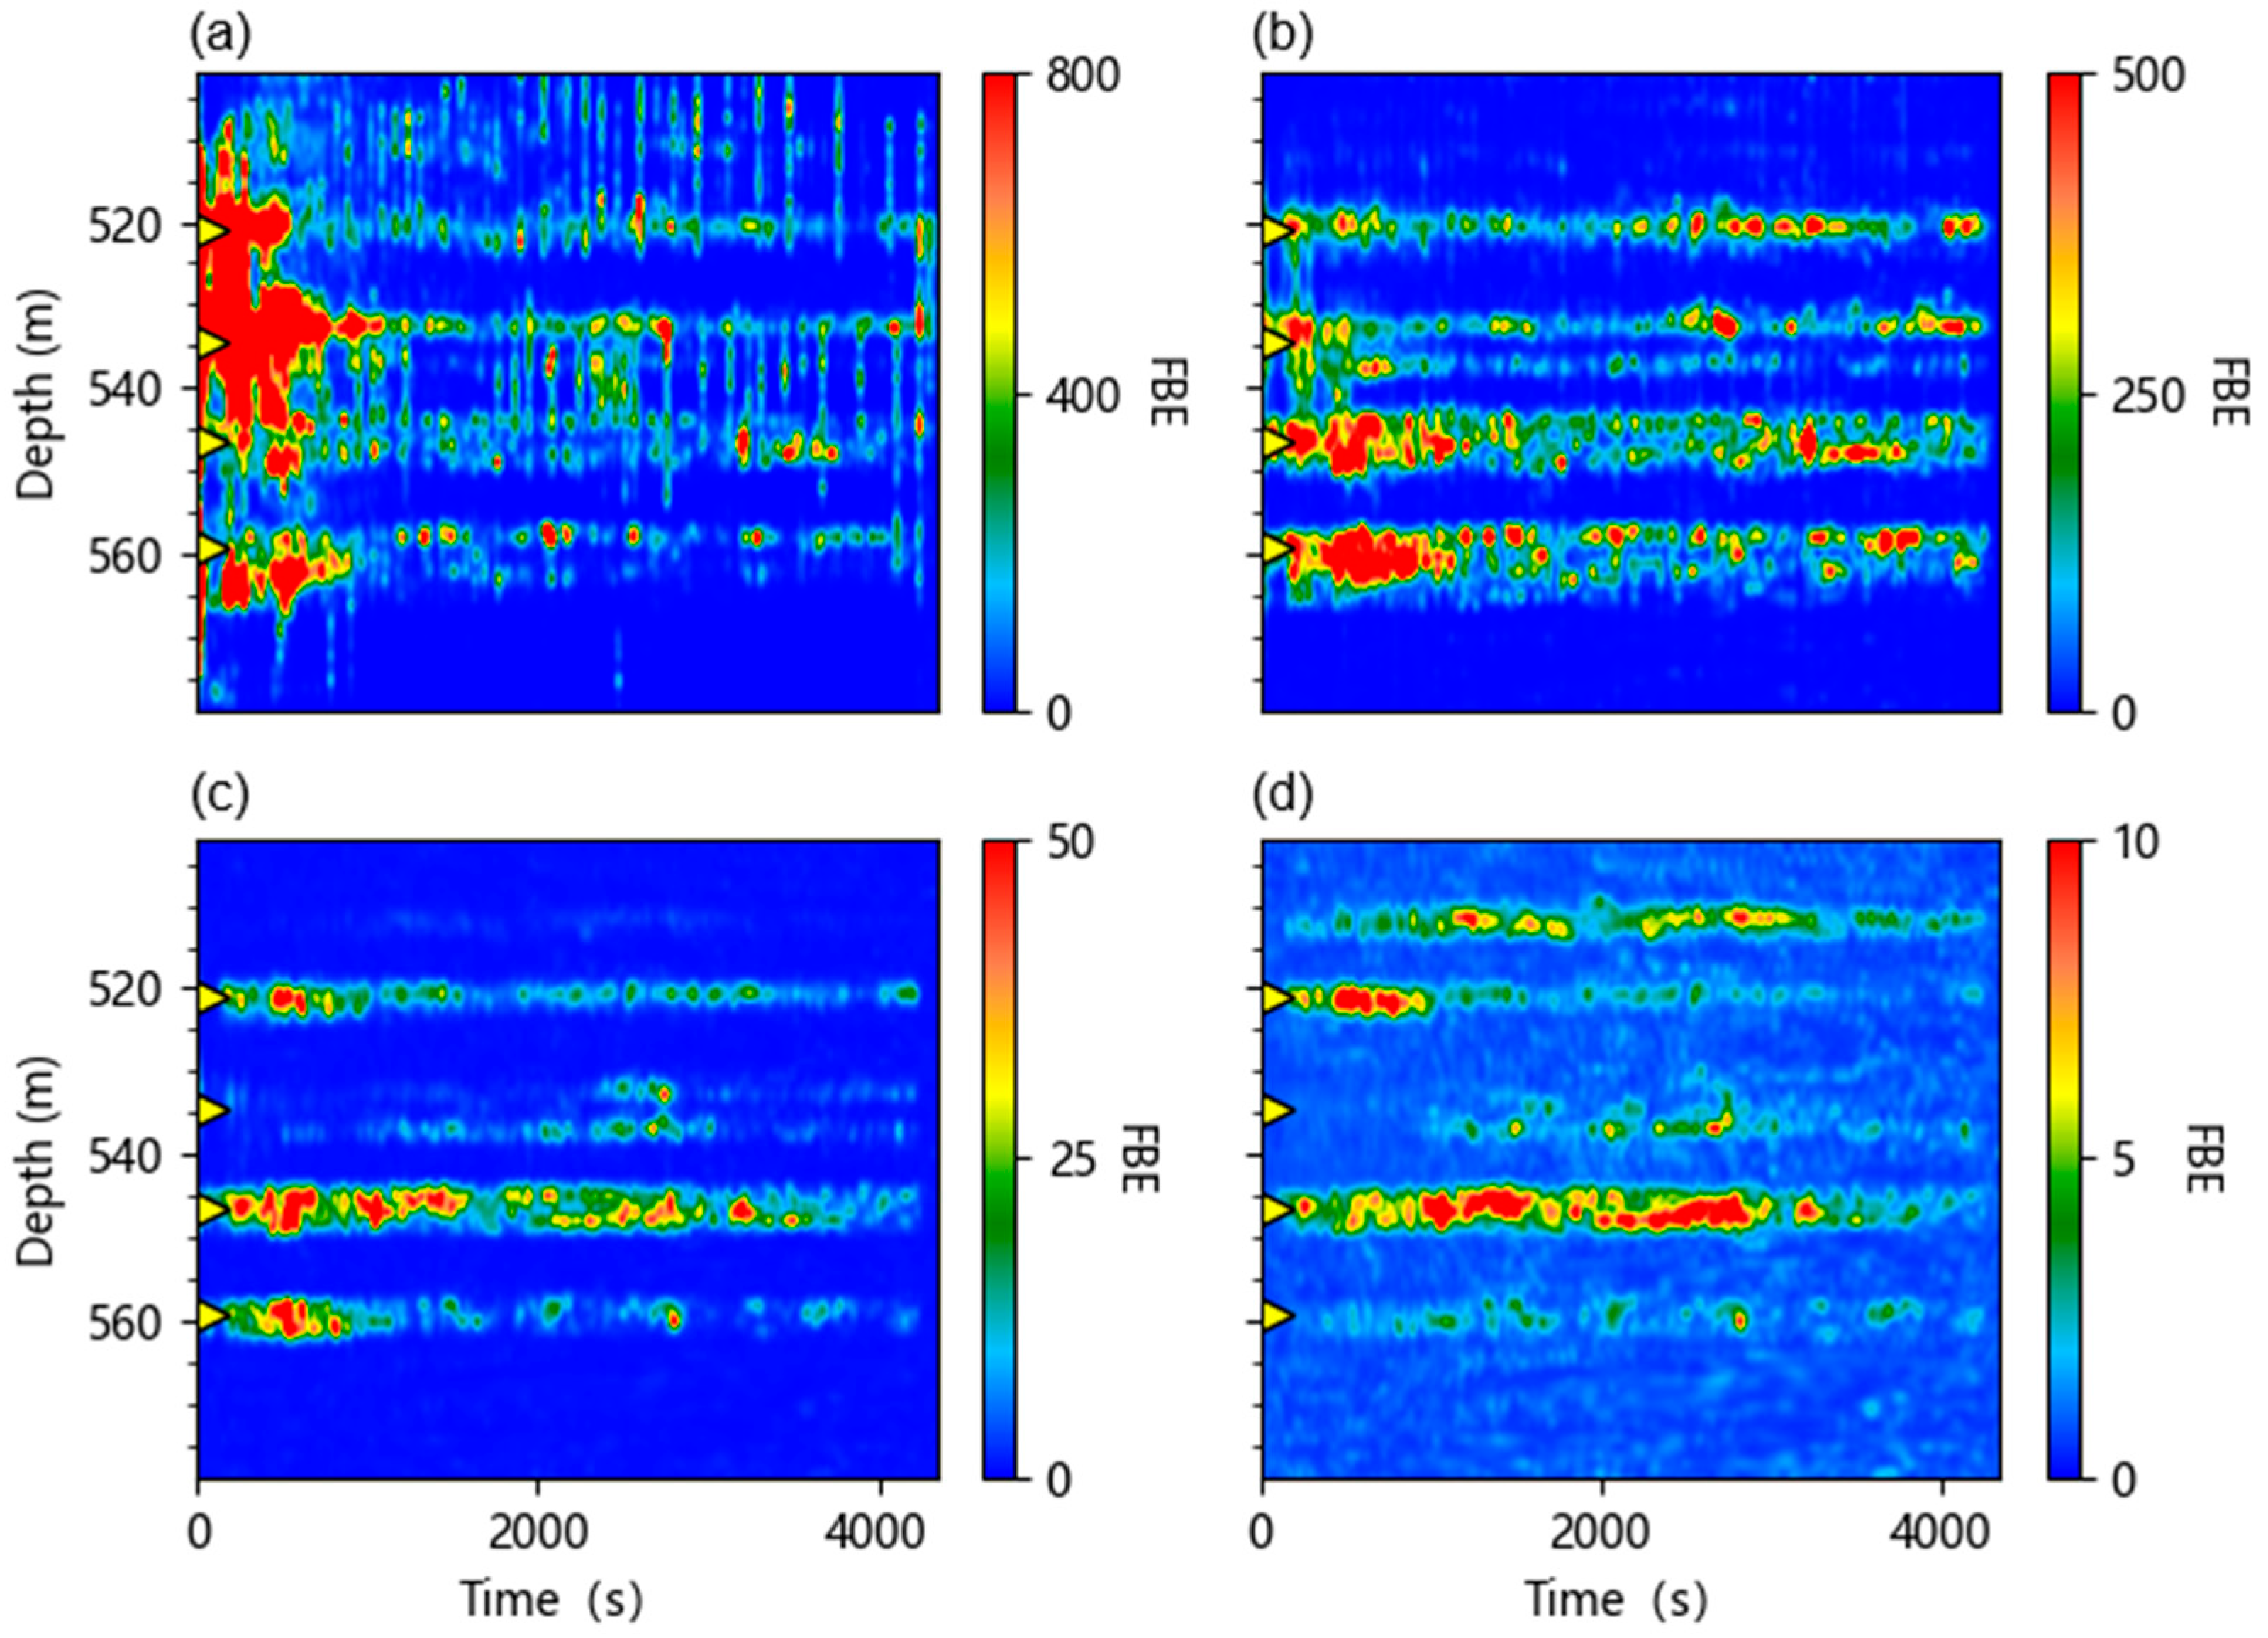
Figure 4 shows the waterfall plots of four FBE datasets extracted from different frequency bands, with yellow triangle markers pinpointing the four perforation clusters of Stage 8. The depths of these datasets are a bit larger than the top and bottom depth locations of 4 perforation clusters in Stage 8. All waterfall plots of the FBE datasets, including FBE [0–3 Hz] in Figure 4a, FBE [3–50 Hz] in Figure 4b, FBE [50–200 Hz] in Figure 4c and FBE [200–2000 Hz] in Figure 4d, have relatively high energies within the depth locations of the four perforation clusters. In particular, the waterfall plots of FBE [3–50 Hz] in Figure 4b and FBE [50–200 Hz] in Figure 4c show four clear high-energy regions, with each of them delineating the depth locations of the four perforation clusters.
This feature of FBE datasets brings about uncertainties in choosing which FBE dataset to be the input dataset for the interpretation of fluid and proppant volumes. The criterion for selecting the best FBE dataset in practice is to carry out amplitude comparisons of different FBE data covering both the injection zone and non-injection zone.
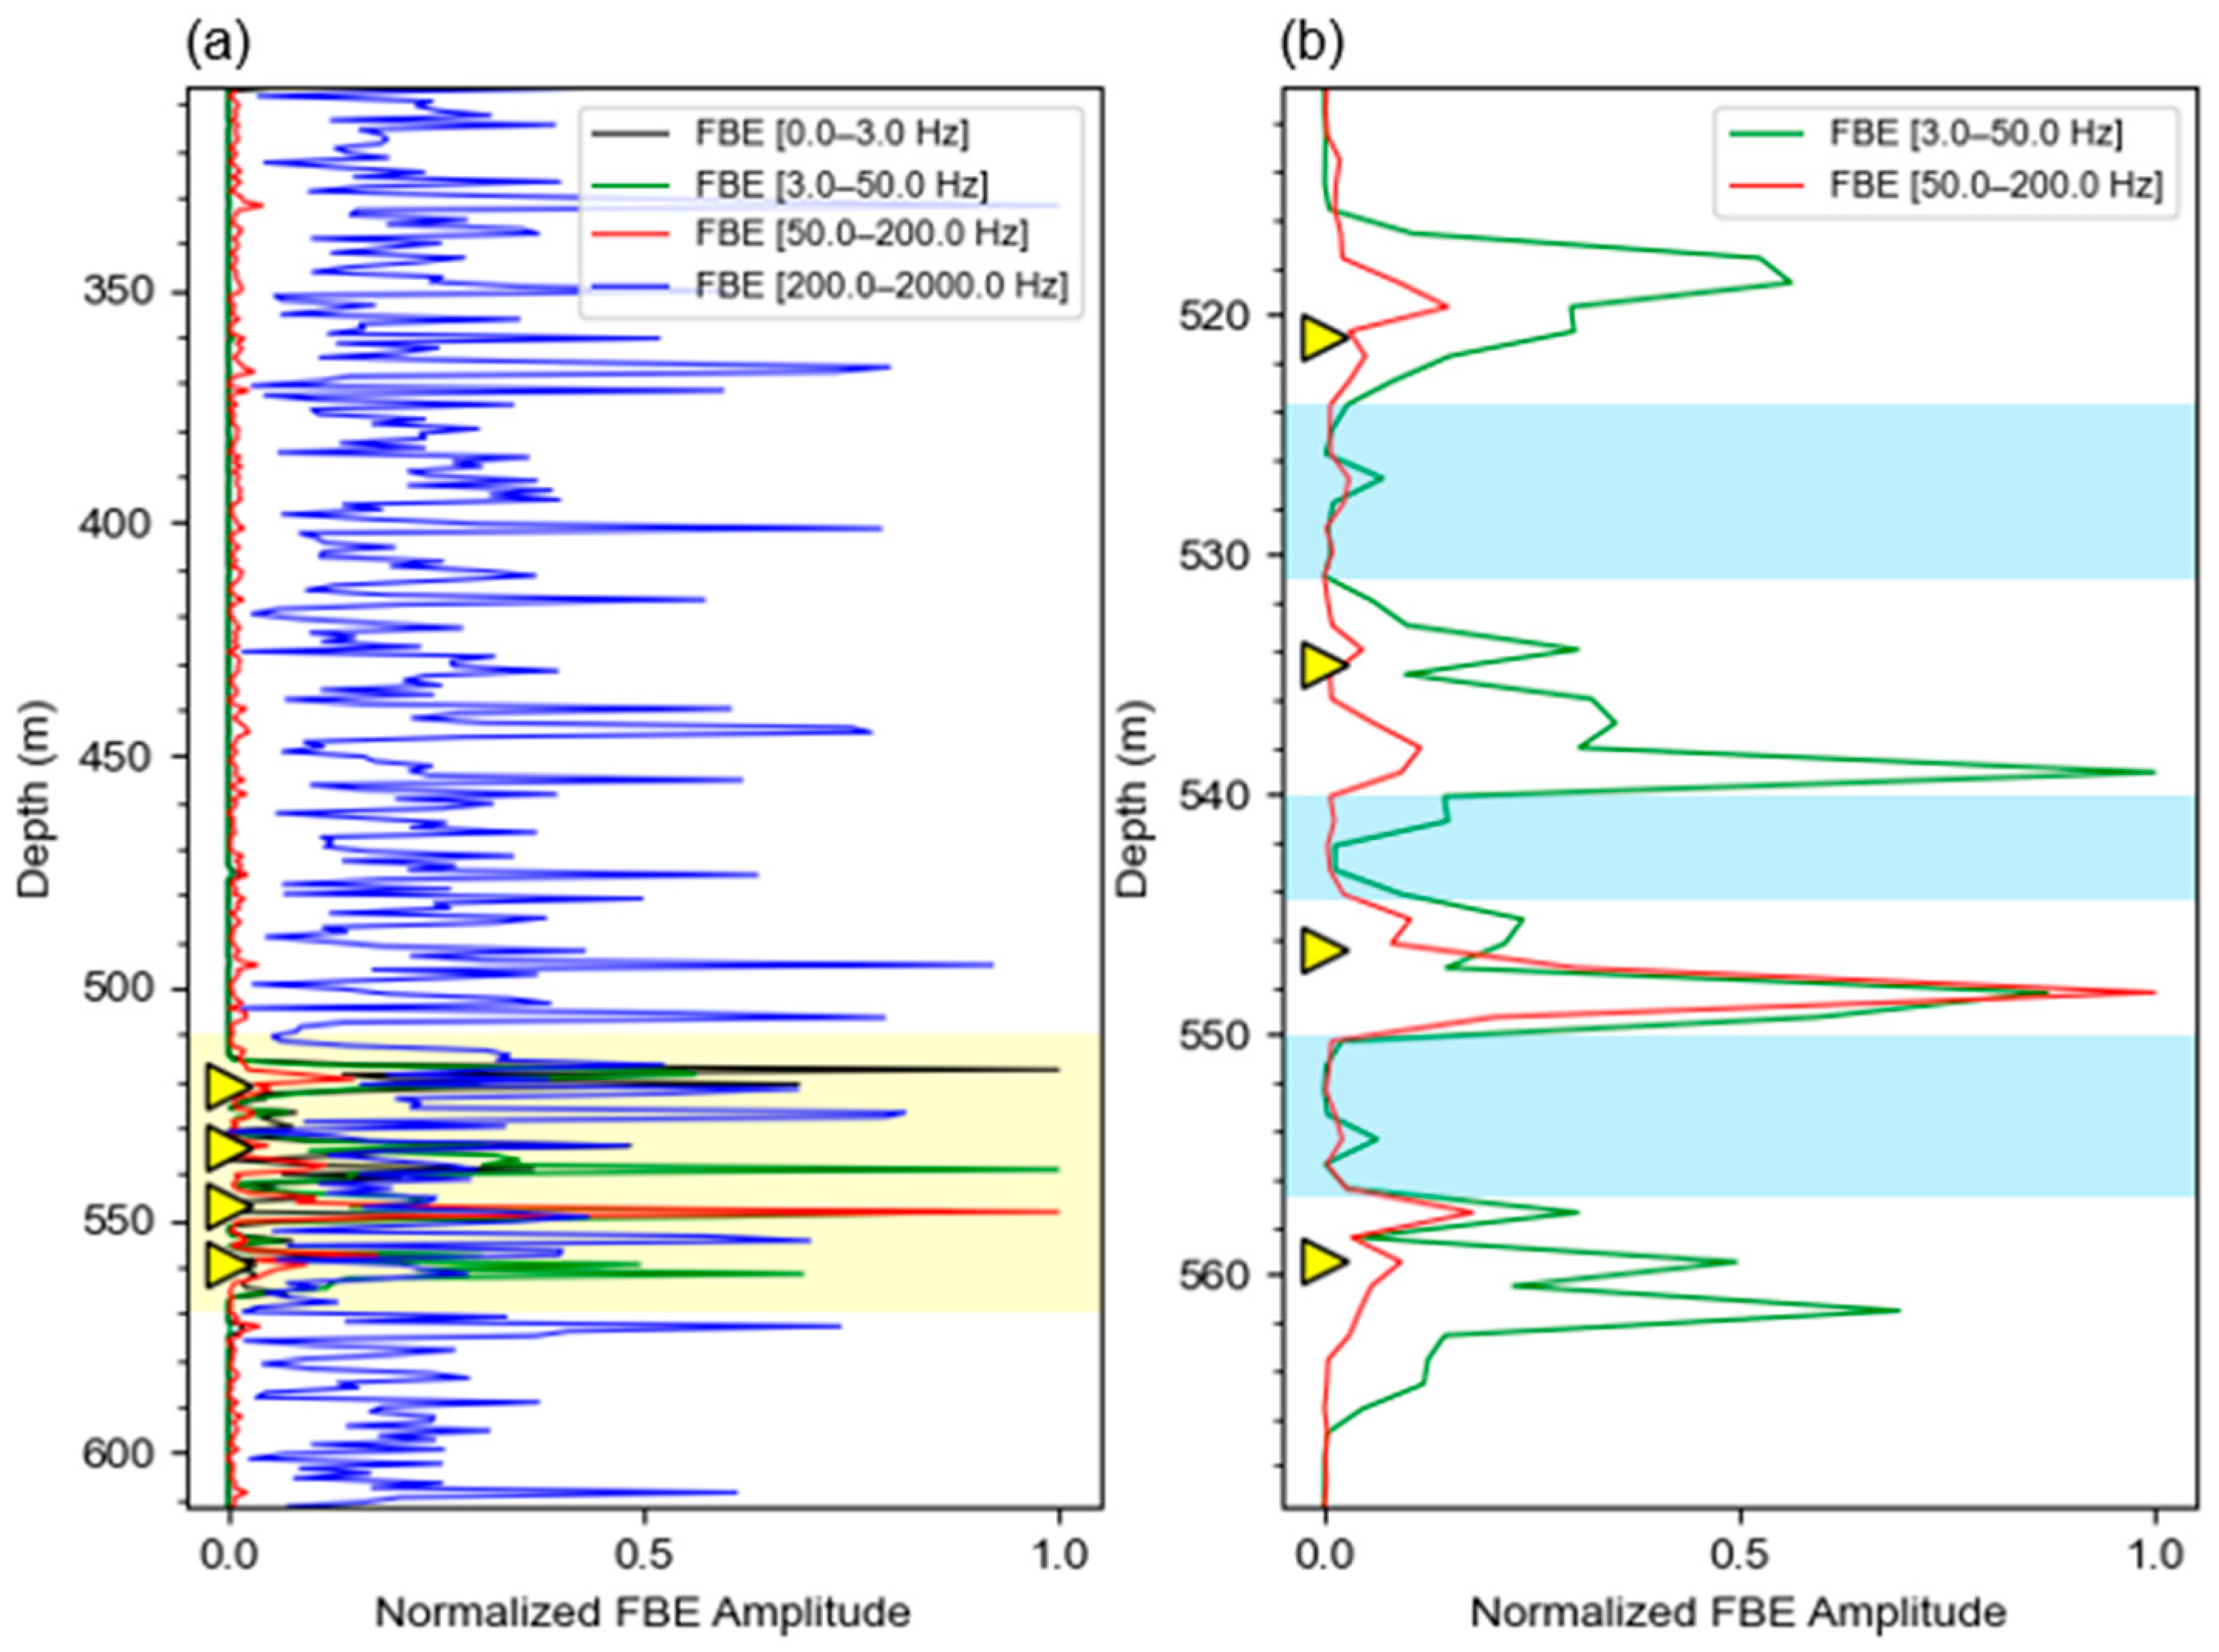
Figure 5 shows the normalized amplitude curves of four different FBE curves covering both the injection zone and non-injection zone of Stage 8. The best FBE data should have the lowest amplitude in the non-injection zone and the highest amplitude in the injection zone. This characteristic also indicates that the frequency band is most sensitive to the fluid and proppant injection activities. Figure 5a shows that the FBE [200–2000 Hz] dataset has relatively high amplitudes in the non-injection zone and lower amplitudes in the injection zone, meaning that it cannot be used for the interpretation of fluid and proppant volumes, as the results would be incorrect. All of the FBE [0–3 Hz], FBE [3–50 Hz] and FBE [50–200 Hz] datasets are featured with higher amplitudes in the injection zone and lower amplitudes in the non-injection zone and could be candidate input datasets for the quantitative calculation of fluid and proppant volumes. However, the FBE [0–3 Hz] dataset contains the energy response impacted by fluid temperature variations; therefore, it usually cannot be used for quantitative calculations. Moreover, if we zoom in on the FBE [3–5 Hz] and FBE [50–200 Hz] curves to the active injection zone (see Figure 5b), the FBE [50–200 Hz] curve has a lower amplitude than that of the FBE [3–50 Hz] curve between each adjacent pair of perforation clusters that are delineated by shallow blue rectangles in Figure 5b. As there are no perforation holes between clusters, these zones should be the “quiet zones” in DAS FBE dataset, so the quiet-zone amplitudes of the best FBE dataset should be lowest while the active perforation cluster zones should have relatively high amplitudes. The FBE [3–50 Hz] curve has relatively high amplitudes in both quiet zones and active perforation zones, which means there are additional vibration noises that are irrelevant to fluid entering into perforation holes; thus, it is inadequate for quantitative evaluation. However, the FBE [50–200 Hz] curve is featured with that quiet zone, which has the lowest vibration levels, while the active perforation cluster has relatively high amplitudes. Based on this selection criterion, FBE [50–200 Hz] is finally selected as the best candidate FBE dataset for the quantitative calculation of fluid and proppant volumes.

4.2. Perforation Cluster Depth Interval Determination

Calculating the injected fluid and proppant volumes for each perforation cluster location demands proper depth location determination for each perforation cluster. There are no physical instruments installed in the wellbore to provide accurate top and bottom depths for each cluster; therefore, some calculations should be carried out to determine the virtual border for each cluster. In this field test, the depth intervals of perforation clusters were identified using FBE data derived from DAS measurements, with Stage 8 serving as a representative case.
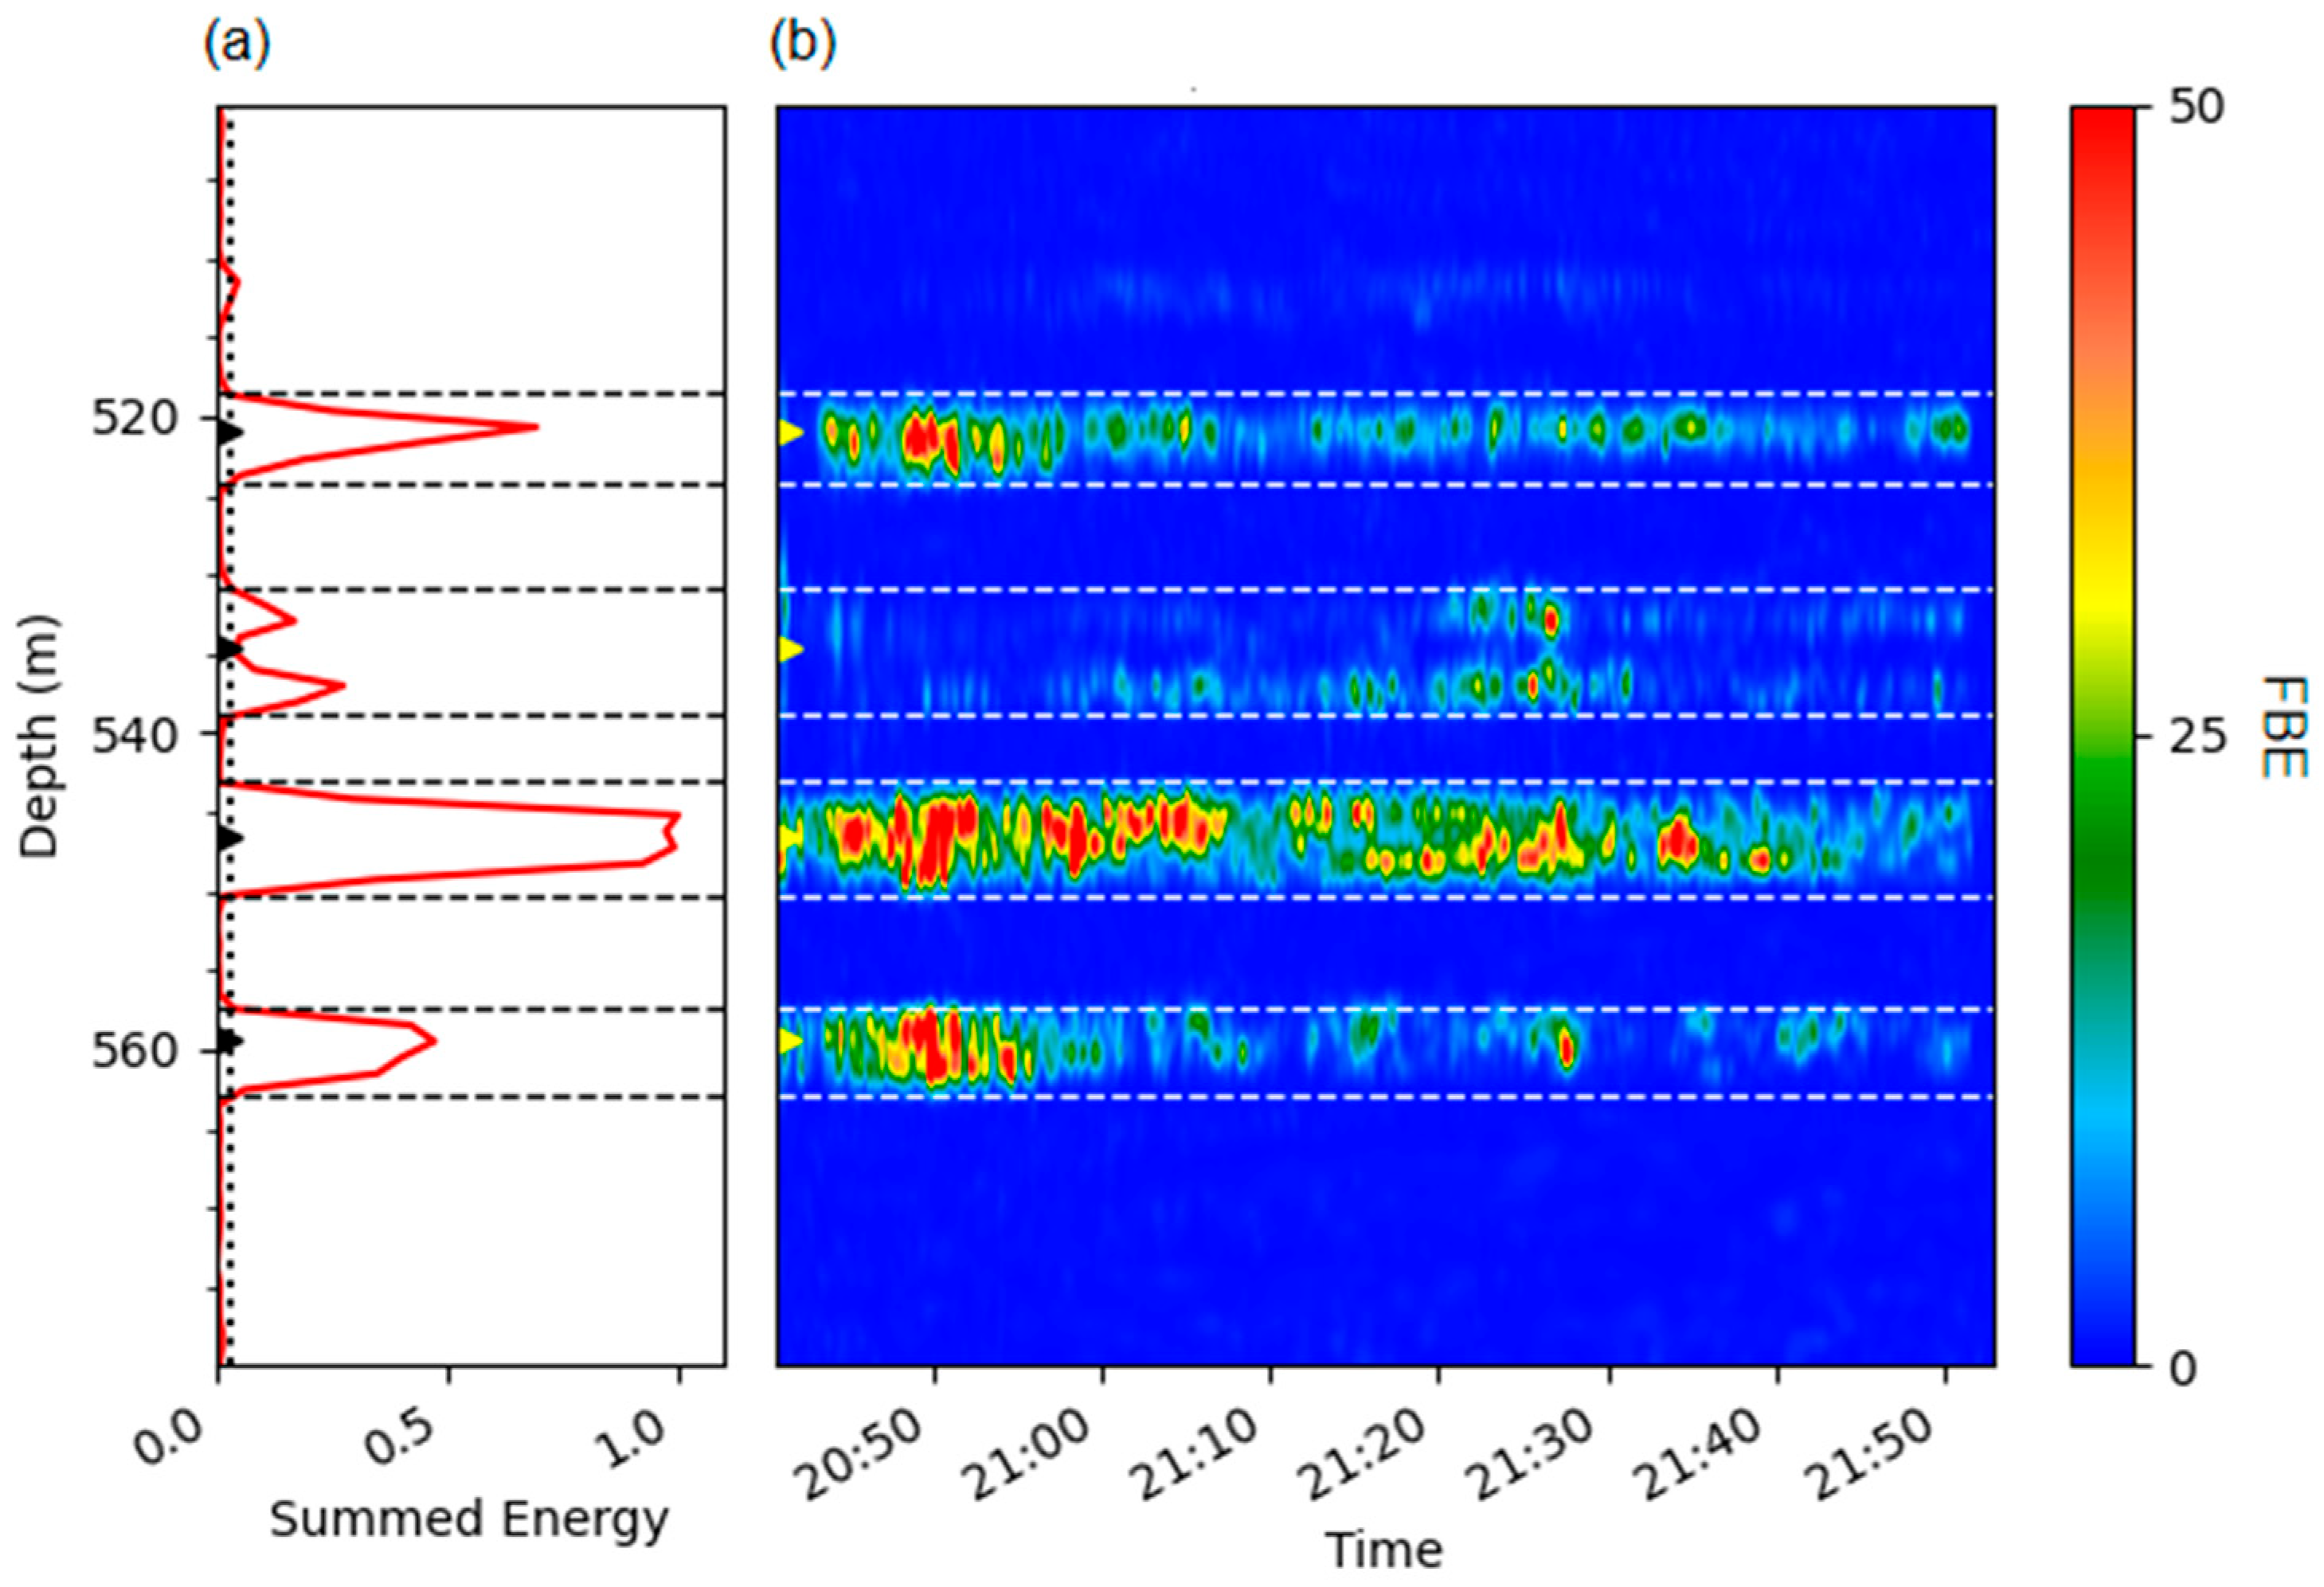
The depth location of each cluster was determined in this study based on the local minima of the summed DAS FBE data. Figure 6a shows the curve of the normalized summed DAS FBE [50–200 Hz] curve of Stage 8, which is created by summing the FBE [50–200 Hz] values of each channel along the time axis. The curve has several local minima that are used as cluster depth location borders separating different clusters. Distinct energy peaks on the curve align with active perforation clusters, while local minima between peaks were used to define cluster boundaries. These minima represent zones of minimal acoustic response, interpreted as barriers to fluid entry. The top and bottom depths, plotted as black horizontal dashed lines in Figure 6a, define the initial depth windows of high-intensity responses for all clusters. As is shown clearly, the number of channels in the depth windows varies from Cluster 1 (lowest) to Cluster 4 (highest), with Cluster 3 boasting the greatest number of channels. Figure 6b presents the corresponding FBE [50–200 Hz] waterfall plot, in which yellow triangle markers represent the center points of each perforation cluster. High-energy bands coincide with injection-active zones, and dashed lines mark the cluster intervals inferred from the summed energy curve.
Note that there are channel gaps between two adjacent clusters. These gaps contain channels that have low FBE responses close to zero, and these channel locations are considered to have no fluid or proppant flows from the wellbore into the reservoir; thus, they should be excluded in quantitative calculations of fluid and proppant volumes. The question of how many channels should be excluded is a case-by-case problem and depends on the curve values of normalized summed FBE data. In this case, we use 0.03, which is plotted as a black vertical dashed line in Figure 6a, as the threshold value to determine the lowest FBE response, below which the channels should be excluded. We can tell that the local minima, which are determined as the intersecting points of the threshold line and the curve of normalized summed FBE values, form the top and bottom depth locations for each cluster.

4.3. Quantitative Calculation of Fluid and Proppant Volumes

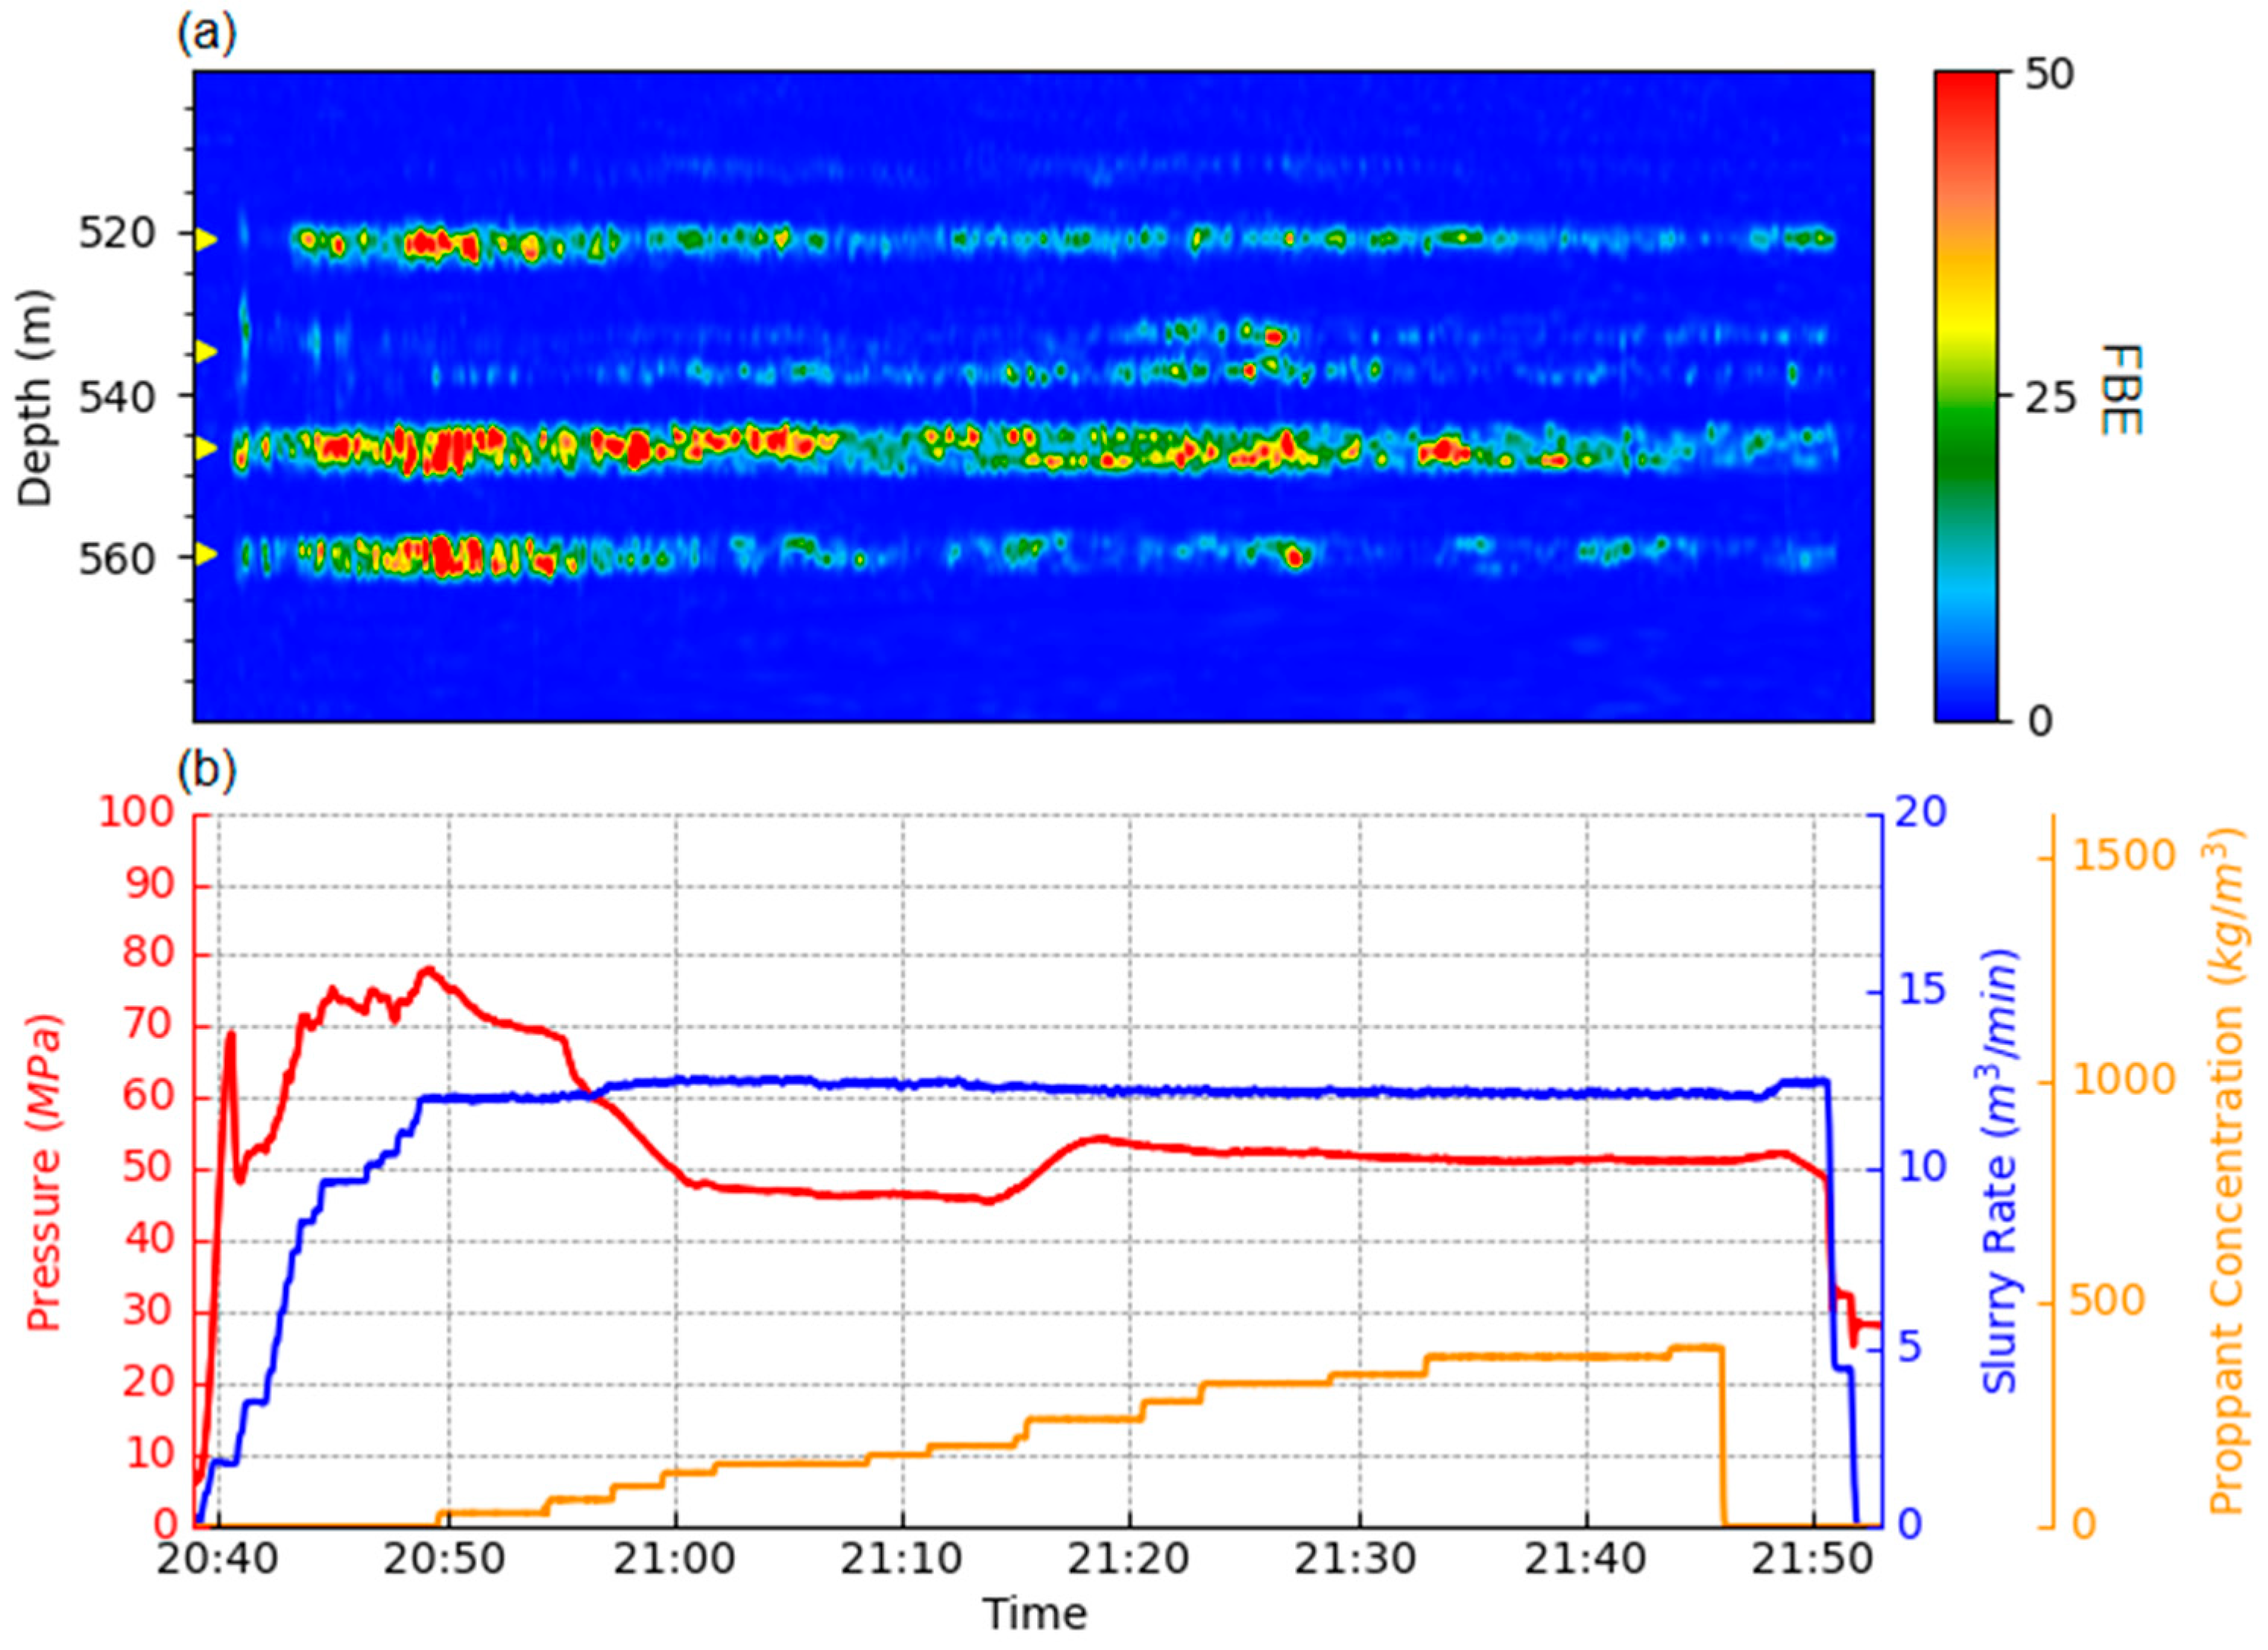
When cluster depths are determined, the FBE dataset can be temporally aligned with the injection data (see Figure 7), in which the slurry rate and proppant concentration curves are used, along with FBE data, for quantitative evaluation.
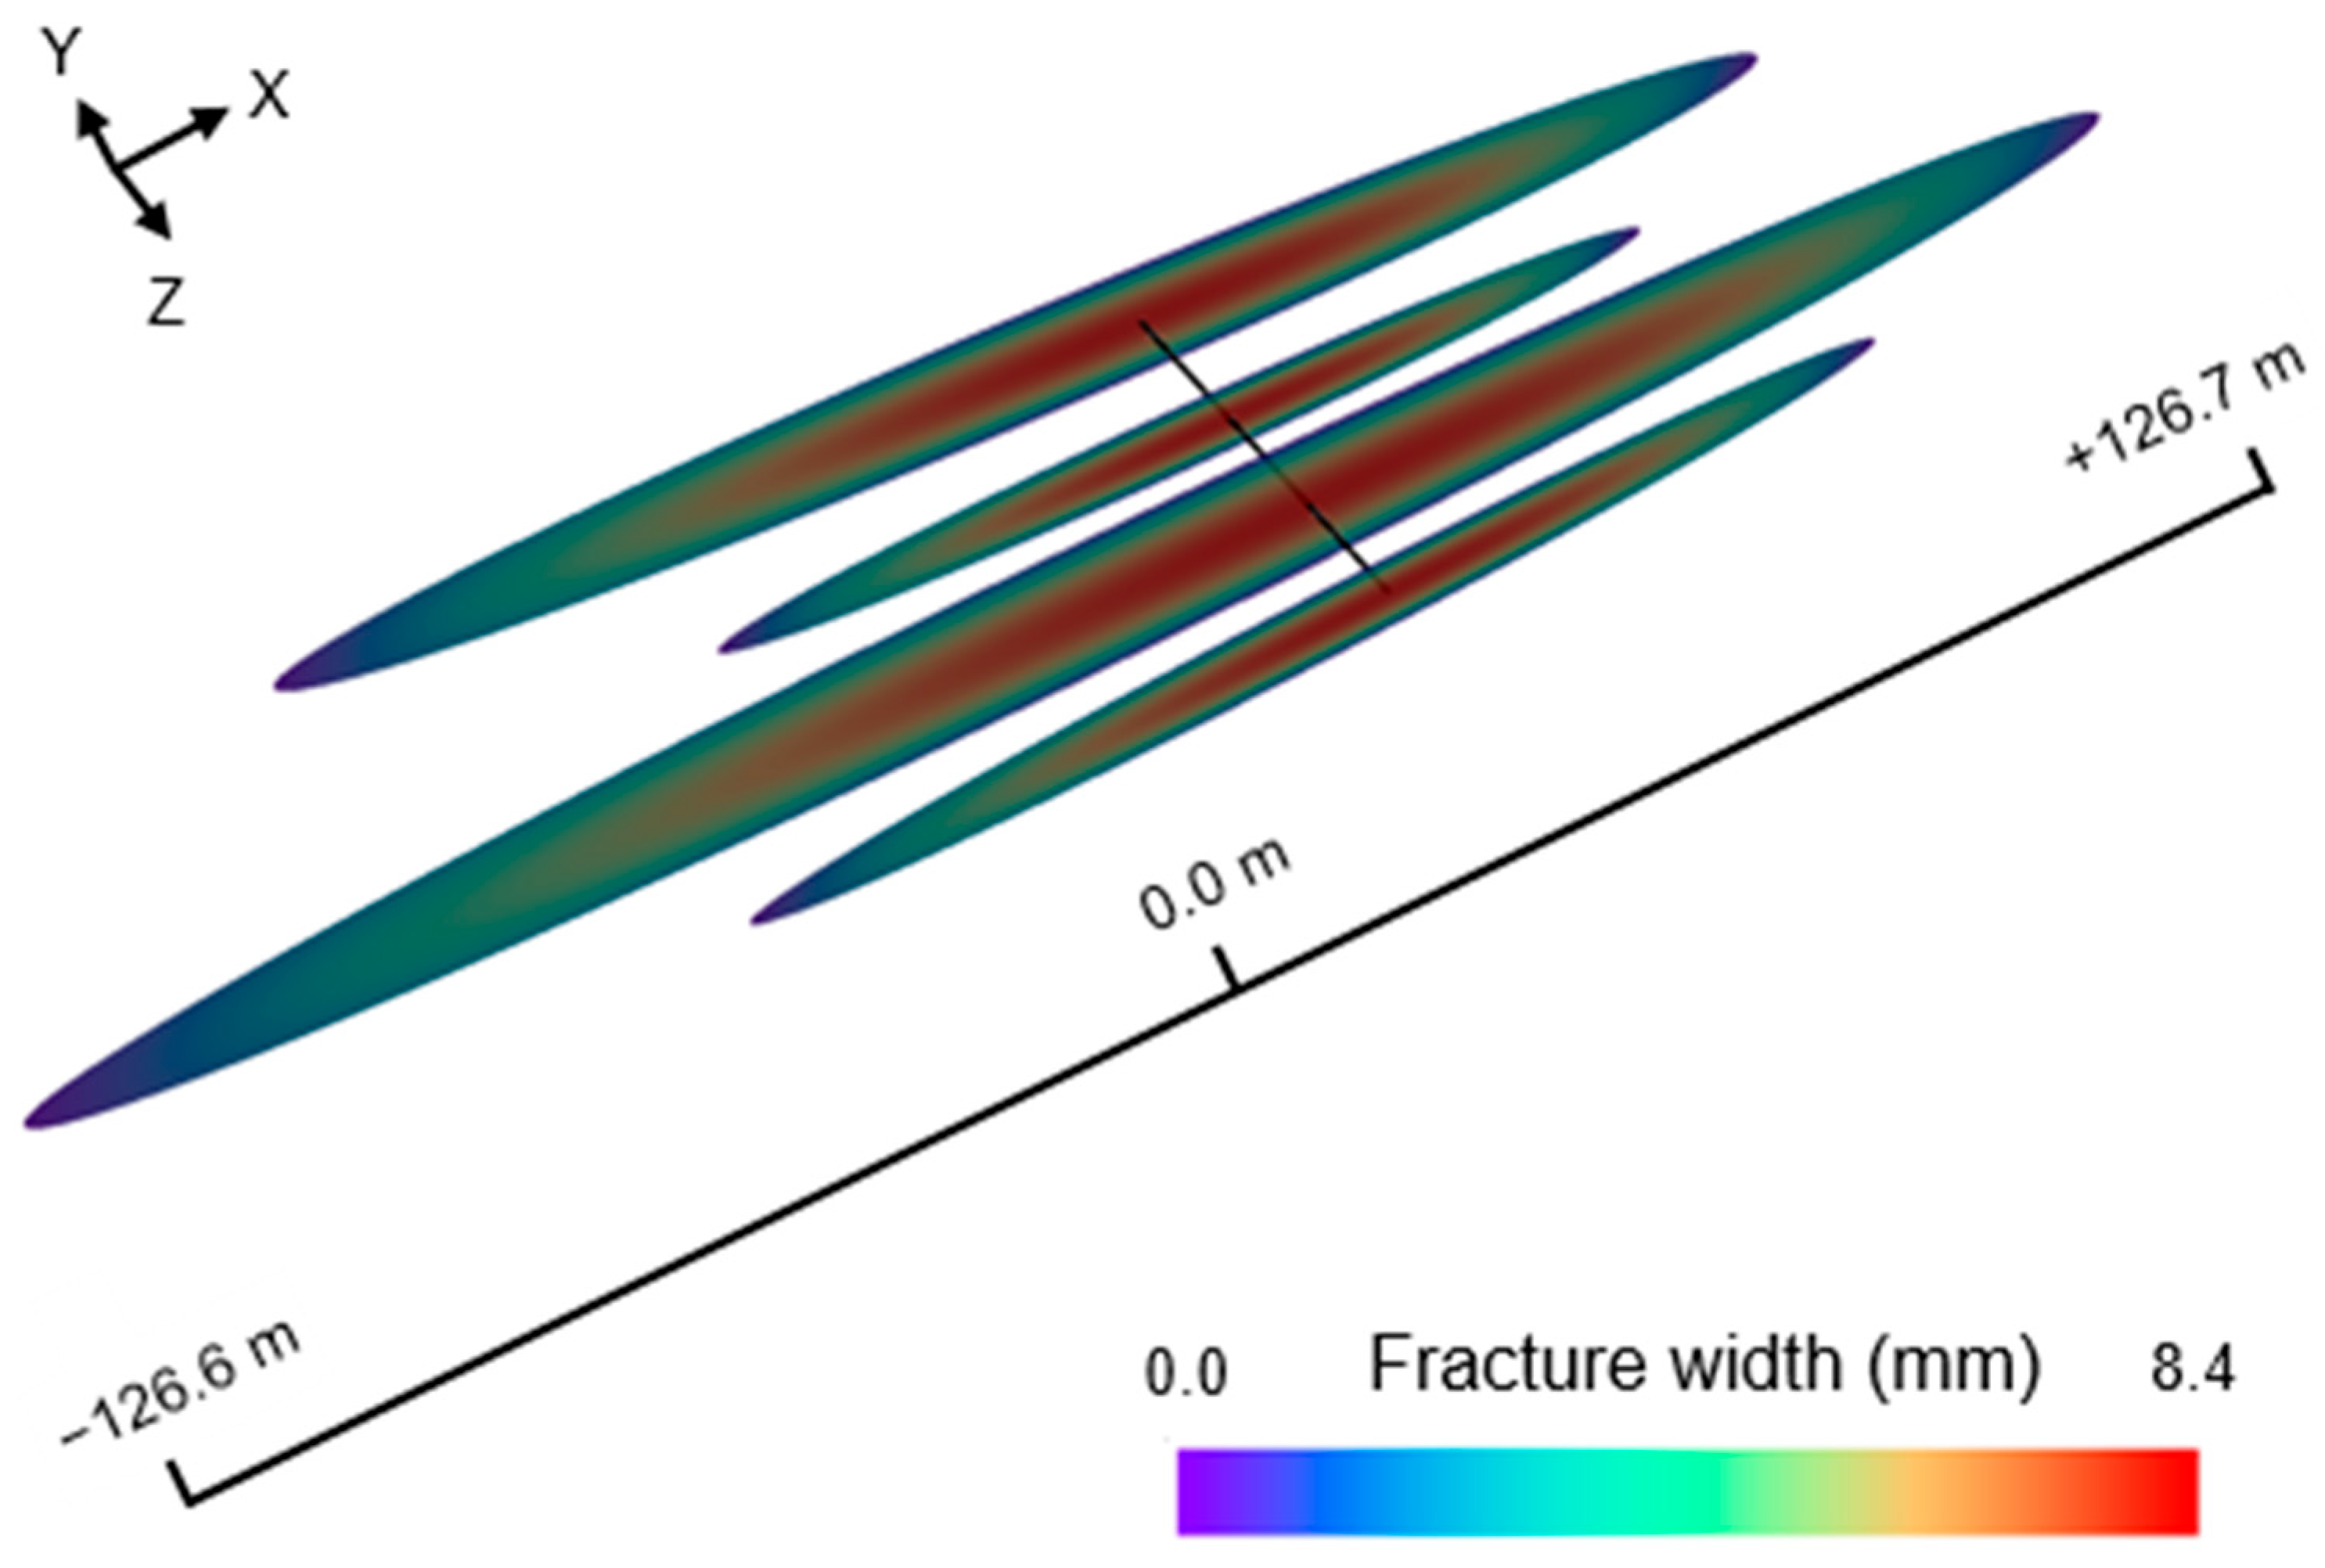
The injected fluid and proppant volumes were calculated by use of Equation (1) and Equation (5). In addition, to validate the accuracy and reliability of Equations (1) and (5), we also conducted a numerical simulation of the hydraulic fracturing process for Stage 8, which includes four perforation clusters, using realistic injection data. The fracture propagation model is based on a planar-3D approach that couples fracture geometry evolution, fluid flow, leak-off, and proppant transport within a formation under variable in situ stresses [34]. This model captures both fracture length and height growth in a two-dimensional plane embedded in a three-dimensional stress field, integrating rock elasticity, fluid dynamics, and proppant migration in a super time-stepping framework, enabling efficient yet physically representative simulations. Figure 8 shows the four 3D planar hydraulic fractures initiated from four perforation clusters, with cold to warm colors representing small to large fracture widths.
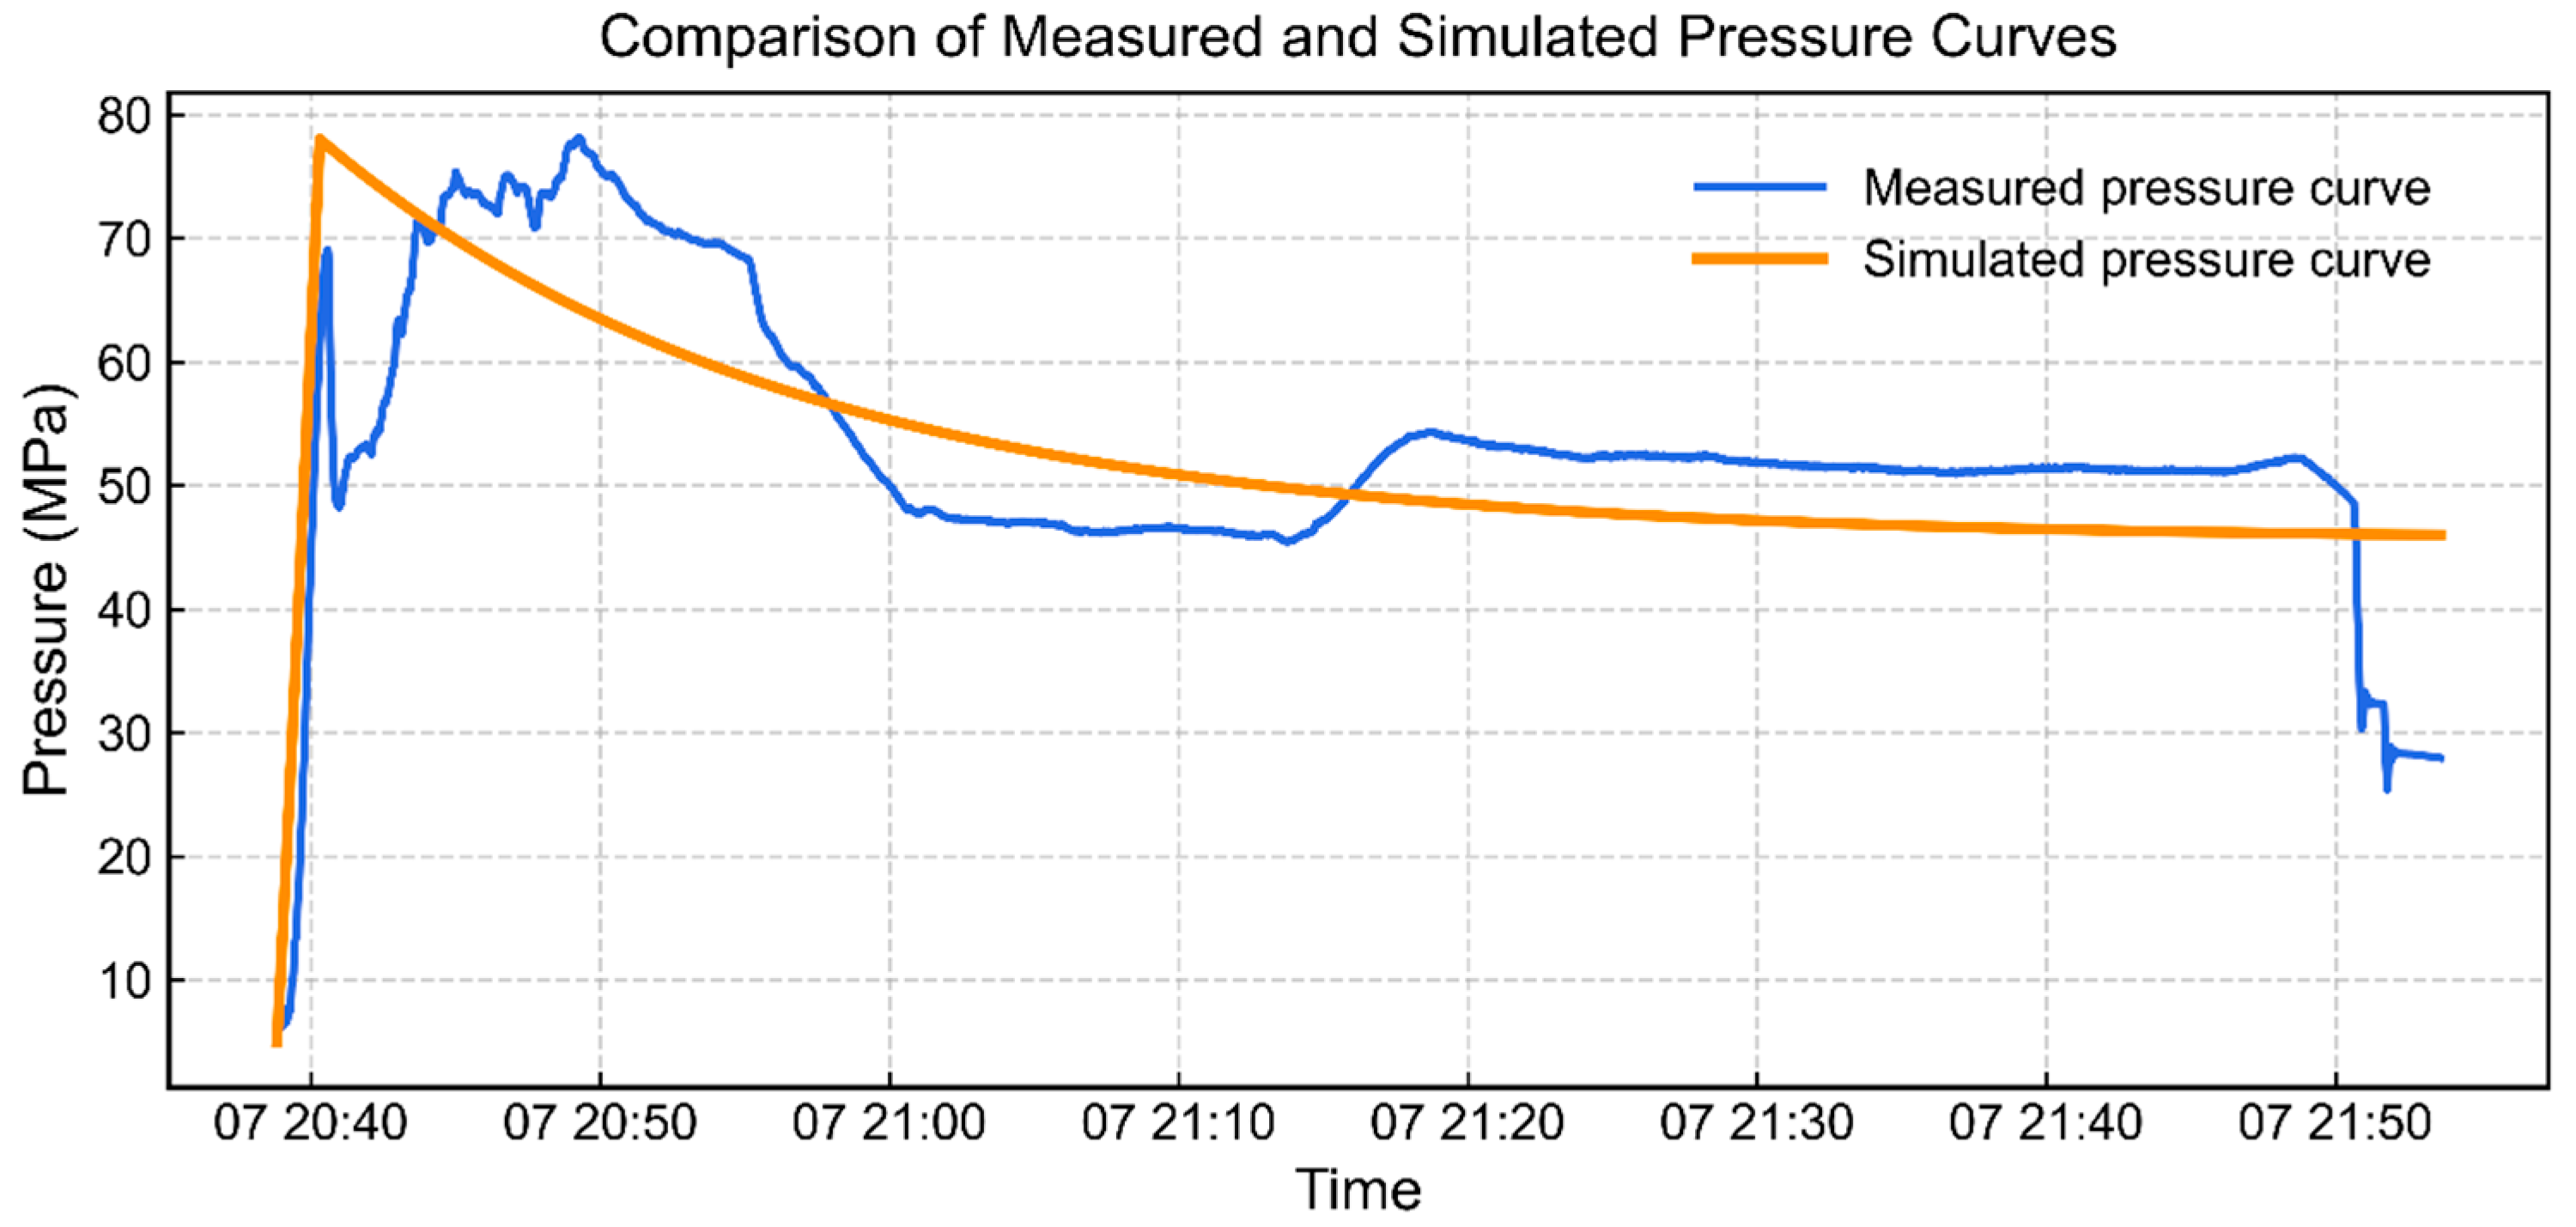
The comparison between the measured surface treatment pressure and the simulated pressure shows strong consistency in the overall trend (Figure 9). Both curves exhibit a rapid pressure rise during fracture initiation, followed by a gradual decline after peak pressure, and a quasi-steady state in the later stages of pumping. The close match confirms that the model accurately reproduces key hydro-mechanical responses during stimulation. This high degree of agreement validates the simulated fracture growth and fluid distribution, thereby supporting the credibility of the simulation serving as an independent benchmark.
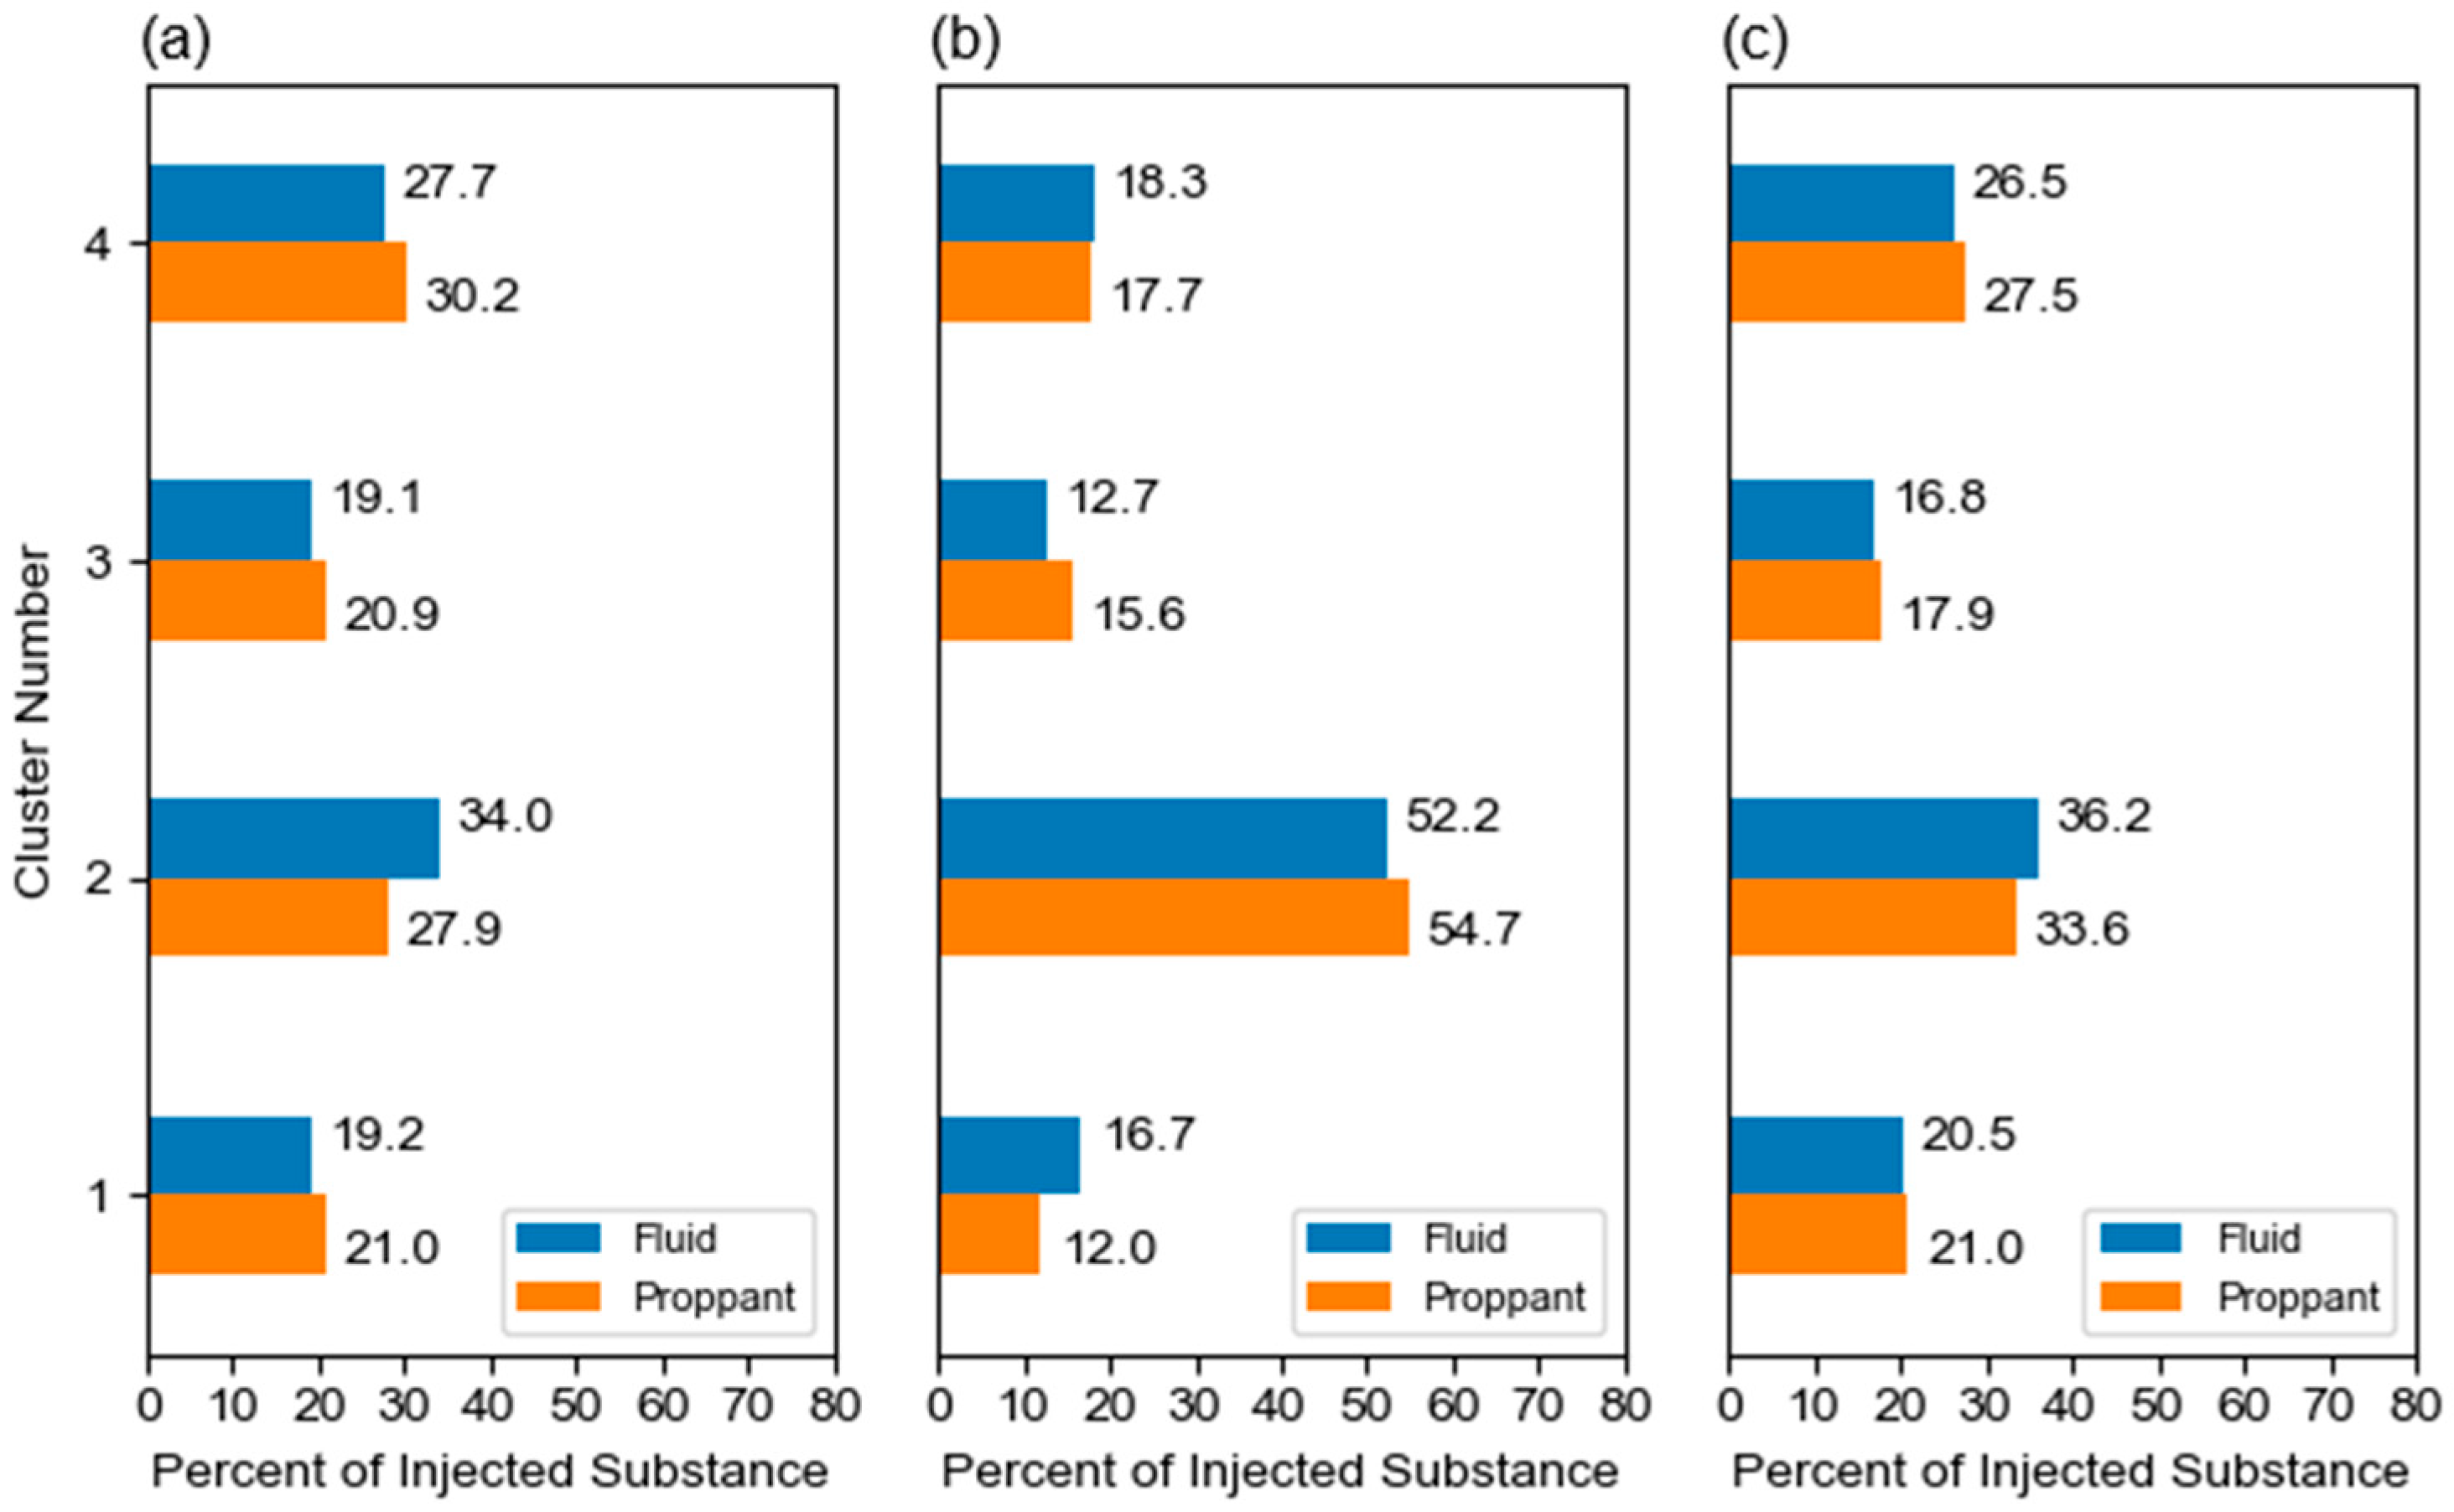
Figure 10 shows the bar chart of injected fluid and proppant volumes calculated using Equations (1) and (5) and numerical simulation. The fluid volumes of Cluster 2 in all results are the highest among all the clusters, which is consistent with the fact that the FBE values of Cluster 2 are also the highest on the waterfall plot shown in Figure 7a. The comparison of Equations (1) and (5), and the numerical simulation results (used as the benchmark) clearly demonstrates the superior accuracy of Equation (1) in estimating cluster-level fluid and proppant allocations. As shown in Table 2, the last two columns display the absolute differences (i.e., direct subtraction without normalization or correlation adjustment) between each algorithm’s output and the simulated values. For fluid allocation, Equation (1) yields absolute errors ranging from 0.5% to 2.3%, while Equation (5) produces significantly larger discrepancies of 3.8% to 16.0% across the four clusters. Similarly, for proppant allocation, Equation (1) maintains errors within the range of 0.0% to 5.7%, whereas Equation (5) exhibits errors between 2.3% and 21.1%. These quantitative results confirm that Equation (1) provides a much closer match to the physics-based simulation, with error magnitudes less than one-third of those from Equation (5). This improved accuracy is attributed to Equation (1)’s optimized frequency band selection (50–200 Hz), precise depth interval determination, and power-law energy-to-rate model, which collectively reduce interpretation uncertainties. Therefore, Equation (1) delivers more reliable and quantitatively robust estimates for real-time DAS-based fracture diagnostics.
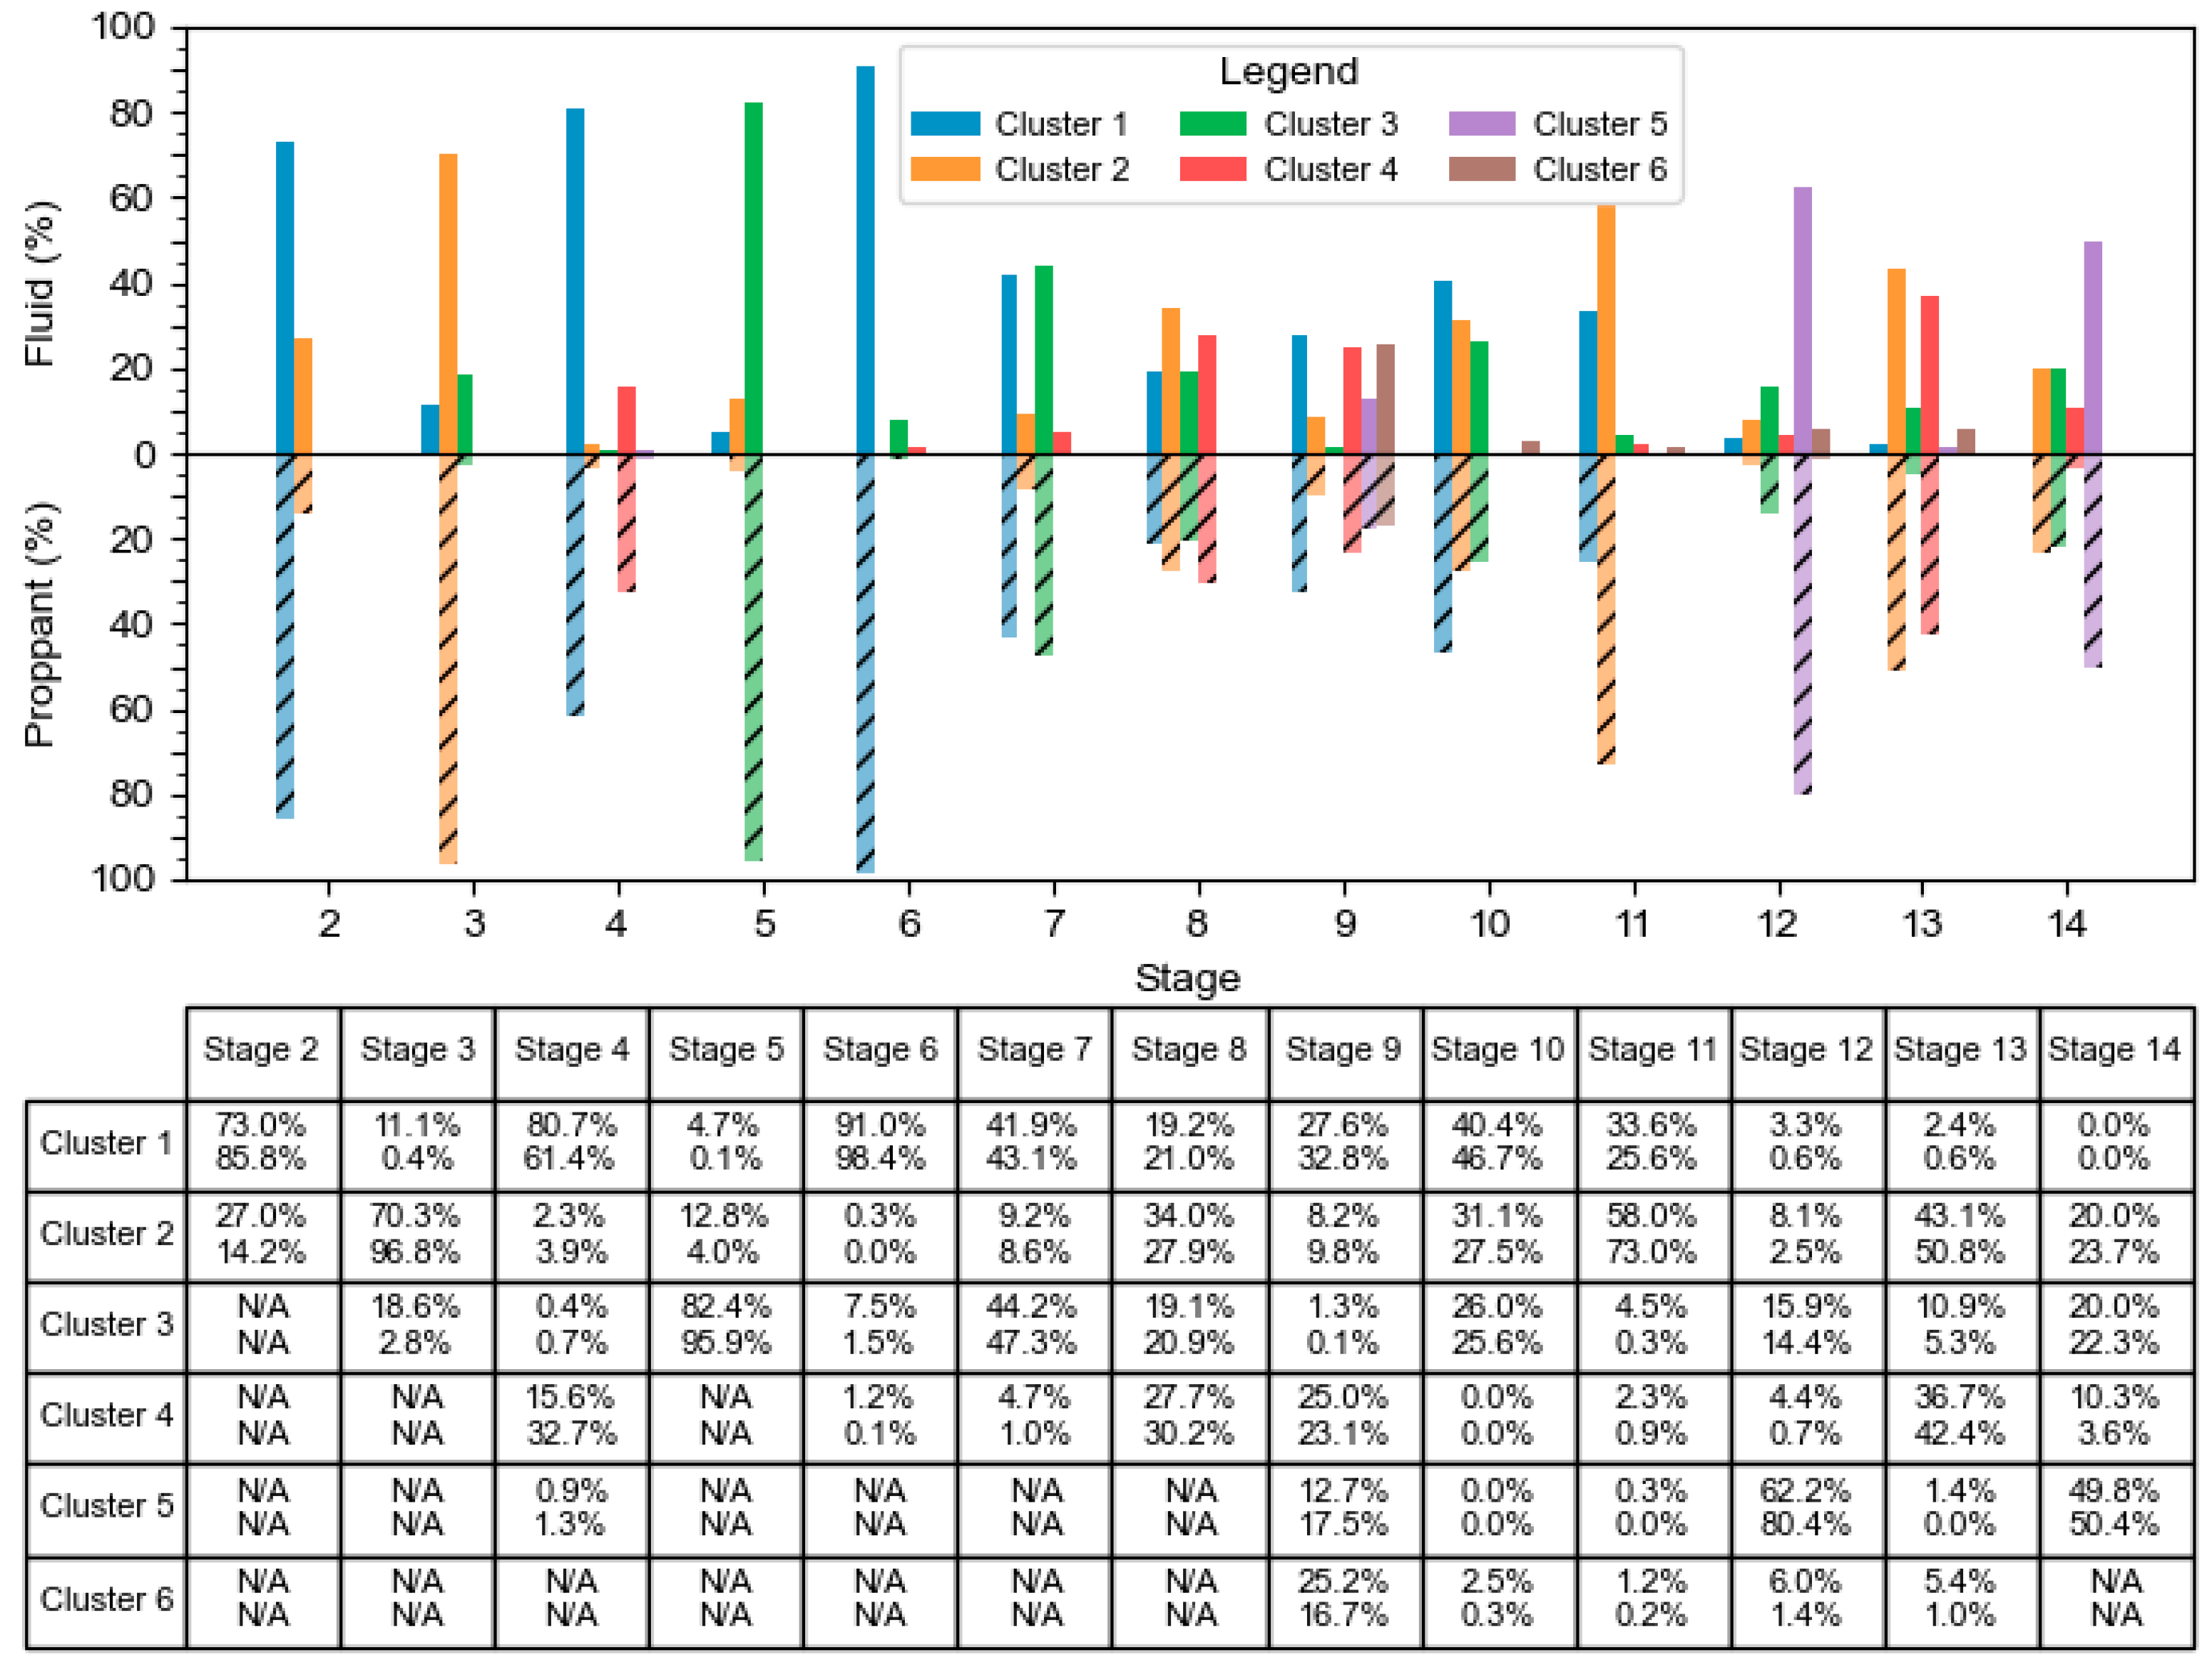
Following the workflow of DAS-based quantitative evaluations of fluid and proppant volume illustrated in Figure 1, and considering the three key uncertainties described above, we calculated the fluid and proppant distributions for all clusters of all stages. The results are shown in Figure 11, with upper and lower bars representing the fluid and proppant volume percentages for each cluster, respectively. Note that, as each stage has a different number of perforation clusters, N/A was placed into the table where the specific perforation cluster is missing in the stage. From the bar chart and table, we can see that Stage 8 and Stage 10 obtain the highest cluster efficiency as fluid volumes do not vary significantly among the four clusters. The cluster efficiencies of the other stages are not good enough, as a large discrepancy exists between the highest fluid volume and lowest fluid volume. This phenomenon indicates that a diverter should be in place and the diversion strategy should be further optimized in the future in order to obtain good cluster efficiency.

5. Discussion

5.1. Reasons for the Discrepancies Between Equations (1) and (5)

Although all results in Figure 10 show consistent distribution trends, whereby the fluid volumes of Clusters 3, 1, 4 and 2 rank from lowest to highest, large discrepancies exist in the percentages of fluid and proppant volumes of Cluster 2. Equation (1) produced smoother and more balanced volume estimates, which means that Stage 8 performs well in terms of cluster efficiency. Its incorporation of total stage flow constraints reduced the risk of overestimating weakly responsive clusters. In contrast, Equation (5) tended to exaggerate inter-cluster differences, amplifying strong signals while under-representing weaker zones due to the absence of normalization. From the description of the DAS dataset, we can tell that Cluster 2 consists of eight perforations, while the other clusters consist of only six perforations. Equation (1) takes the number of perforations in each cluster into account, while Equation (5) ignores the differences between the perforation numbers of each cluster and treats all clusters equally and the same. In essence, the flow rate of each one perforation out of eight perforations in Cluster 2, calculated by Equation (1), is lower than that calculated by Equation (5). This is why the calculated fluid volume of Cluster 2, which boasts two extra perforations and higher FBE values than the other clusters, is not that large. In summary, in terms of whether to take the perforation number difference into account, Equation (1) gives a correct and more accurate distribution of fluid and proppant volumes, while Equation (5) is prone to errors because it ignores perforation number differences among all clusters.

5.2. Limitations of Equation (1)

It is important to acknowledge a key limitation of the empirical method based on the correlation of Equation (1): it assumes a stable relationship between the flow rate and acoustic signal strength, without accounting for dynamic changes in perforation geometry during the stimulation. In reality, perforation erosion caused by proppant-laden fluid can lead to an increase in the perforation diameter over time [35,36]. This erosion reduces perforation friction and flow turbulence, thereby decreasing the energy of the generated acoustic signals, causing DAS signals to shift toward lower-frequency bands and presenting a “fading” effect on the FBE waterfall plot—even when the injection rate remains constant [37]. These phenomena indicate that the SPL of the DAS acoustic signal is not solely a function of the flow rate but is also influenced by time-dependent perforation size changes. Consequently, if perforation erosion occurs, the assumption of proportionality between SPL and the flow rate breaks down, leading to potential underestimations of flow rates at later stages when using the fixed coefficients A and B. Therefore, while the correlation provides a robust empirical fit under controlled or short-duration conditions, its applicability in long-term or high-proppant-loading scenarios may be limited unless perforation evolution and associated signal decay are explicitly modeled. Recent studies have proposed more advanced models that simultaneously estimate fluid flow and evolving perforation dimensions [38]; such approaches require additional calibration and assumptions about erosion dynamics and are often sensitive to noise in field data.
In this study, we did not observe significant signal attenuation or frequency shifting indicative of perforation erosion in the DAS-based FBE waterfall plots in Figure 7. Specifically, the acoustic energy from the second cluster remained consistently high throughout the treatment stage, persisting until the sand concentration dropped to zero, which suggests minimal degradation of flow-induced noise due to changing perforation size. Furthermore, there was no downhole camera or direct imaging evidence available to confirm perforation enlargement or erosion in the wellbore. Given the absence of observable signal decay and the lack of corroborating field evidence for perforation growth in our dataset, we consider that the use of the time-invariant empirical correlations, which are defined in Equation (1), is sufficient for flow estimation in this specific context. Nevertheless, this highlights a broader limitation: the current method may not remain valid under different operational conditions—such as higher proppant concentrations, longer pumping durations, softer rock formations, or extremely limited-entry design with fewer perforation clusters—where perforation erosion is more pronounced [39]. Future research should incorporate real-time diagnostics or independent measurements (e.g., downhole cameras) to assess perforation integrity and inform adaptive signal interpretation models.
In addition, while the proposed workflow focuses on estimating fluid and proppant allocations from DAS-derived FBE data, it is important to recognize that in situ stress, depth, and formation mechanical properties can indirectly influence proppant transport and distribution. Higher vertical stress gradients at greater depths may lead to narrower fracture apertures, increasing the likelihood of proppant bridging and reducing effective proppant penetration. Similarly, variations in rock toughness and Young’s modulus affect fracture geometry—stiffer formations tend to develop shorter, wider fractures, while more ductile or layered rocks may promote complex, tortuous paths that alter slurry rheology and proppant settling behavior [40,41]. These geomechanical factors do not directly change the injected proppant volume or weight at surface, but they can impact downhole flow partitioning among clusters, which in turn affects the apparent acoustic response used for allocation. The current model assumes that acoustic energy primarily reflects surface-measured injection dynamics, and it only accounts for the perforation hole count per cluster as a key parameter. Although the model used in our study does not explicitly incorporate subsurface geomechanics, future refinements could integrate geomechanical zonation and stress contrasts to improve interpretation accuracy across heterogeneous reservoirs.

6. Conclusions

This study proposes a quantitative evaluation workflow for the fluid and proppant distribution in multistage fracture treatments using DAS, addressing three primary sources of uncertainty: FBE dataset selection, perforation cluster depth interval determination, and volume calculation algorithm choice. By systematically mitigating these uncertainties and validating the results against those of physics-based numerical simulations, the workflow achieves a high level of accuracy, with estimated fluid and proppant allocations agreeing within a 6% error compared to simulated distributions—representing a significant improvement over approximated methods that often exhibit errors exceeding 20%. The key conclusions are summarized as follows:
(1)
FBE dataset selection critically influences quantitative accuracy. Field analysis shows that the 50–200 Hz frequency band provides optimal sensitivity to injection-related acoustic signals while effectively suppressing background noise, yielding strong correlations with the injection rate.
(2)
Cluster depth intervals can be reliably identified using local minima in summed FBE profiles. This method is practical for real-time applications, although ambiguous boundaries or signal overlap may require refinement through multi-stage comparison, operational context integration, and manual quality control.
(3)
Volume estimation is highly sensitive to algorithm selection. Equation (1), based on laboratory-calibrated power-law relationships, aligns closely with field behavior, whereas the linear approximation (Equation (5)) introduces larger discrepancies—highlighting the importance of model calibration.
(4)
Sensitivity analysis of the correlation parameter A in Equation (1) indicates that it exerts a strong, nonlinear influence on estimated flow rates and hence fluid volumes. The flow rate estimations can vary by up to 300% within A ∈ [0.08, 0.1]. Field applications should employ the site-specific calibration of A.
(5)
Systematic uncertainty analysis enhances the robustness of DAS interpretation. The proposed workflow offers a practical and reproducible framework suitable for real-time fracture diagnostics in complex completions.
Future research may focus on developing physics-informed or machine-learning-assisted calibration techniques for the FBE–flow relationship, improving signal filtering and cluster identification accuracy, and validating the workflow across a range of geological settings and operational conditions. These efforts will support the development of standardized, broadly applicable DAS monitoring and interpretation methodologies.

Author Contributions

Conceptualization, Z.Z. and W.L.; methodology, Z.Z., W.L. and J.T.; software, B.L.; validation, R.W. and Y.B.; formal analysis, W.L.; investigation, H.G. and C.W.; resources, R.W. and Y.B.; data curation, B.L.; writing—original draft preparation, W.L.; writing—review and editing, Z.Z., J.T. and H.G.; visualization, W.L. and H.G.; supervision, Z.Z. and J.T.; project administration, C.W.; funding acquisition, C.W. All authors have read and agreed to the published version of the manuscript.

Funding

This research was funded by the Scientific Research and Technology Development Project of China National Petroleum Corporation (Grant No. 2021DJ3803), the Key R&D Program of Shaanxi Province (Grant No. 2023-ZDLSF-64), the Fundamental Research Funds for the Central Universities (Grant No. 3142025002), and the Science and Technology Support Project of Langfang (Grant No. 2024011067).

Data Availability Statement

The original contributions presented in this study are included in the article. Further inquiries can be directed to the corresponding author.

Conflicts of Interest

Authors Wenqiang Liu, Bobo Li, Rou Wen, Yu Bai were employed by the China National Logging Company. Author Chunlei Wang was employed by the company OptaSoft. The remaining authors declare that the research was conducted in the absence of any commercial or financial relationships that could be construed as a potential conflict of interest.

Abbreviations

The following abbreviations are used in this manuscript:
DASDistributed Acoustic Sensing
FBEFrequency Band Energy
FFTFast Fourier Transform
N/ANot Applicable
OTDROptical Time-Domain Reflectometry
ϕ-OTDRPhase-sensitive Optical Time-Domain Reflectometry
PSDPower Spectral Density
RMSRoot Mean Squared
SPLSound Pressure Level
SRVStimulated Reservoir Volume
STFTShort-Time Fourier Transform

References

  1. Weijers, L.; Wright, C.; Mayerhofer, M.; Pearson, M.; Griffin, L.; Weddle, P. Trends in the North American Frac Industry: Invention through the Shale Revolution. In Proceedings of the SPE Hydraulic Fracturing Technology Conference and Exhibition, The Woodlands, TX, USA, 5–7 February 2019; SPE: Richardson, TX, USA, 2019; p. D011S001R001. [Google Scholar] [CrossRef]
  2. Cipolla, C.; Singh, A.; McClure, M.; McKimmy, M.; Lassek, J. The Perfect Frac Stage—What’s the Value? In Proceedings of the Unconventional Resources Technology Conference (URTeC), Houston, TX, USA, 17–19 June 2024; pp. 923–942. [Google Scholar] [CrossRef]
  3. Zhang, Z.; Tang, J.; Zhang, J.; Meng, S.; Li, J. Modeling of Scale-Dependent Perforation Geometrical Fracture Growth in Naturally Layered Media. Eng. Geol. 2024, 336, 107499. [Google Scholar] [CrossRef]
  4. Molenaar, M.M.; Fidan, E.; Hill, D.J. Real-Time Downhole Monitoring of Hydraulic Fracturing Treatments Using Fibre Optic Distributed Temperature and Acoustic Sensing. In Proceedings of the SPE/EAGE European Unconventional Resources Conference and Exhibition, Vienna, Austria, 20–22 March 2012; SPE: Richardson, TX, USA, 2012; p. SPE-152981. [Google Scholar] [CrossRef]
  5. Molenaar, M.M.; Hill, D.J.; Webster, P.; Fidan, E.; Birch, B. First Downhole Application of Distributed Acoustic Sensing for Hydraulic-Fracturing Monitoring and Diagnostics. SPE Drill. Complet. 2012, 27, 32–38. [Google Scholar] [CrossRef]
  6. Molenaar, M.M.; Cox, B.E. Field Cases of Hydraulic Fracture Stimulation Diagnostics Using Fiber Optic Distributed Acoustic Sensing (DAS) Measurements and Analyses. In Proceedings of the SPE Middle East Unconventional Resources Conference and Exhibition, Muscat, Oman, 28–30 January 2013; SPE: Richardson, TX, USA, 2013; p. SPE-164030. [Google Scholar] [CrossRef]
  7. Ugueto, G.A.; Ehiwario, M.; Grae, A.; Molenaar, M.; McCoy, K.; Huckabee, P.; Barree, B. Application of Integrated Advanced Diagnostics and Modeling to Improve Hydraulic Fracture Stimulation Analysis and Optimization. In Proceedings of the SPE Hydraulic Fracturing Technology Conference and Exhibition, The Woodlands, TX, USA, 4–6 February 2014; SPE: Richardson, TX, USA, 2014; p. SPE-168603. [Google Scholar] [CrossRef]
  8. Sui, W.; Liu, R.; Cui, K. Application and Research Progress of Distributed Optical Fiber Acoustic Sensing Monitoring for Hydraulic Fracturing. Sci. Sin. Technol. 2021, 51, 371–387. [Google Scholar] [CrossRef]
  9. Rashid, A.; Tackie-Otoo, B.N.; Abdul Latiff, A.H.; Otchere, D.A.; Jamaludin, S.N.F.; Asfha, D.T. Research Advances on Distributed Acoustic Sensing Technology for Seismology. Photonics 2025, 12, 196. [Google Scholar] [CrossRef]
  10. Rasool, M.H.; Ridha, S.; Latif, A.H.A.; Krishna, S. Industrial Adoption of Distributed Acoustic Sensing (DAS) in Petroleum Engineering and Geosciences: Real-World Evidence. J. Petro Chem. Eng. 2025, 51, 22–29. [Google Scholar]
  11. Boone, K.; Crickmore, R.; Werdeg, Z.; Laing, C.; Molenaar, M. Monitoring Hydraulic Fracturing Operations Using Fiber-Optic Distributed Acoustic Sensing. In Proceedings of the SPE/AAPG/SEG Unconventional Resources Technology Conference (URTeC), San Antonio, TX, USA, 20–22 July 2015; URTEC: Richardson, TX, USA, 2015; p. URTeC-2158449. [Google Scholar] [CrossRef]
  12. Saw, J.; Zhu, X.; Luo, L.; Correa, J.; Soga, K.; Ajo-Franklin, J. Distributed Fiber Optic Sensing for In-Well Hydraulic Fracture Monitoring. Geoenerg. Sci. Eng. 2025, 250, 213792. [Google Scholar] [CrossRef]
  13. Lorwongngam, A.O.; McKimmy, M.; Oughton, E.; Cipolla, C. One Shot Wonder XLE Design: A Continuous Improvement Case Study of Developing XLE Design in the Bakken. In Proceedings of the SPE Hydraulic Fracturing Technology Conference and Exhibition, The Woodlands, TX, USA, 31 January–2 February 2023; SPE: Richardson, TX, USA, 2023; p. D021S006R002. [Google Scholar] [CrossRef]
  14. Ramurthy, M.; Richardson, J.; Brown, M.; Sahdev, N.; Wiener, J.; Garcia, M. Fiber-Optics Results from an Intra-Stage Diversion Design Completions Study in the Niobrara Formation of DJ Basin. In Proceedings of the SPE Hydraulic Fracturing Technology Conference and Exhibition, The Woodlands, TX, USA, 9–11 February 2016; SPE: Richardson, TX, USA, 2016; p. D021S006R005. [Google Scholar] [CrossRef]
  15. Trumble, M.; Sinkey, M.; Meehleib, J. Got Diversion Real-Time Analysis to Identify Success or Failure. In Proceedings of the SPE Hydraulic Fracturing Technology Conference and Exhibition, The Woodlands, TX, USA, 5–7 February 2019; SPE: Richardson, TX, USA, 2019; p. D021S005R002. [Google Scholar] [CrossRef]
  16. Ugueto, G.A.; Huckabee, P.T.; Molenaar, M.M. Challenging Assumptions about Fracture Stimulation Placement Effectiveness Using Fiber Optic Distributed Sensing Diagnostics: Diversion, Stage Isolation and Overflushing. In Proceedings of the SPE Hydraulic Fracturing Technology Conference and Exhibition, The Woodlands, TX, USA, 3–5 February 2015; SPE: Richardson, TX, USA, 2015; p. D011S002R001. [Google Scholar] [CrossRef]
  17. Ugueto, G.; Huckabee, P.; Nguyen, A.; Daredia, T.; Chavarria, J.; Wojtaszek, M.; Reynolds, A. A Cost-Effective Evaluation of Pods Diversion Effectiveness Using Fiber Optics DAS and DTS. In Proceedings of the SPE Hydraulic Fracturing Technology Conference and Exhibition, The Woodlands, TX, USA, 4–6 February 2020; SPE: Richardson, TX, USA, 2020; p. D011S002R001. [Google Scholar] [CrossRef]
  18. Thiruvenkatanathan, P.; Langnes, T.; Beaumont, P.; White, D.; Webster, M. Downhole Sand Ingress Detection Using Fibre-Optic Distributed Acoustic Sensors. In Proceedings of the Abu Dhabi International Petroleum Exhibition & Conference, Abu Dhabi, United Arab Emirates, 7–10 November 2016; SPE: Richardson, TX, USA, 2016; p. SPE-183329-MS. [Google Scholar] [CrossRef]
  19. Bohn, R.; Hull, R.; Trujillo, K.; Wygal, B.; Parsegov, S.G.; Carr, T.; Carney, B.J. Learnings from the Marcellus Shale Energy and Environmental Lab (MSEEL) Using Fiber Optic Tools and Geomechanical Modeling. In Proceedings of the Unconventional Resources Technology Conference (URTeC), Austin, TX, USA, 20–22 July 2020; pp. 1833–1851. [Google Scholar] [CrossRef]
  20. Hull, R.; Woerpel, C.; Trujillo, K.; Bohn, R.; Wygal, B.; Carney, B.J.; Carr, T. Hydraulic Fracture Characterization Using Fiber Optic DAS and DTS Data. In Proceedings of the SEG International Exposition and Annual Meeting, Virtual, 11–16 October 2020; SEG: Houston, TX, USA, 2020; p. D041S096R007. [Google Scholar] [CrossRef]
  21. James-Ravenell, M.; Jin, G. Characterizing In-Well DAS Signal before Fiber Breakage. In Proceedings of the SEG International Exposition and Annual Meeting, Houston, TX, USA, 26–29 August 2024; SEG: Houston, TX, USA, 2024; p. SEG-2024. [Google Scholar] [CrossRef]
  22. Wu, B.; Wang, J.; Zhang, J.; Wang, M.; Wang, F.; Yan, T. Field Test of Single-Cluster Fracture Extension Strength Monitoring by Optical Fiber Outside Casing. Drill. Prod. Technol. 2022, 45, 84–88. [Google Scholar] [CrossRef]
  23. Pakhotina, I. Using Distributed Acoustic Sensing for Multiple-Stage Fractured Well Diagnosis. Ph.D. Thesis, Texas A&M University, College Station, TX, USA, 2020. [Google Scholar]
  24. Zhao, Z.; Wu, X.; Qiao, Y.; Zhang, Y.; Tang, J.; Tian, Y.; Wang, C. Uncertainty Analysis of Quantitative Hydraulic Fracturing Fluid and Sand Volumes Calculated from DAS Data. In Proceedings of the SEG Workshop on Fiber Optics Sensing for Energy Applications, Xi’an, China, 21–23 July 2024; Society of Exploration Geophysicists: Houston, TX, USA, 2024; pp. 35–38. [Google Scholar] [CrossRef]
  25. Sharma, J.; Cuny, T.; Ogunsanwo, O.; Santos, O. Low-frequency distributed acoustic sensing for early gas detection in a wellbore. IEEE Sens. J. 2020, 21, 6158–6169. [Google Scholar] [CrossRef]
  26. Gemeinhardt, H.; Sharma, J. Machine-learning-assisted leak detection using distributed temperature and acoustic sensors. IEEE Sens. J. 2023, 24, 1520–1531. [Google Scholar] [CrossRef]
  27. Pakhotina, I.; Sakaida, S.; Zhu, D.; Hill, A.D. Diagnosing Multistage Fracture Treatments with Distributed Fiber-Optic Sensors. SPE Prod. Oper. 2020, 35, 852–864. [Google Scholar] [CrossRef]
  28. Chen, K.; Zhu, D.; Hill, A.D. Acoustic Signature of Flow from a Fractured Wellbore. In Proceedings of the SPE Annual Technical Conference and Exhibition, Houston, TX, USA, 28–30 September 2015; SPE: Houston, TX, USA, 2015. [Google Scholar] [CrossRef]
  29. Santos, R.A. Experimental Study of the Effect of Permeability on the Generation of Noise. Ph.D. Thesis, Texas A&M University, College Station, TX, USA, 2018. [Google Scholar]
  30. In’t Panhuis, P.; den Boer, H.; Van Der Horst, J.; Paleja, R.; Randell, D.; Joinson, D.; Bartlett, R. Flow Monitoring and Production Profiling Using DAS. In Proceedings of the SPE Annual Technical Conference and Exhibition, Amsterdam, The Netherlands, 27–29 October 2014; SPE: Richardson, TX, USA, 2014; p. SPE-170917. [Google Scholar] [CrossRef]
  31. Langnes, T.; Thiruvenkatanathan, P. Detecting Downhole Sand Ingress Locations. Patent No. 11,053,791 B2, 6 July 2021. [Google Scholar]
  32. Sejdić, E.; Djurović, I.; Jiang, J. Time–Frequency Feature Representation Using Energy Concentration: An Overview of Recent Advances. Digit. Signal Process. 2009, 19, 153–183. [Google Scholar] [CrossRef]
  33. Welch, P. The Use of Fast Fourier Transform for the Estimation of Power Spectra: A Method Based on Time Averaging over Short, Modified Periodograms. IEEE Trans. Audio Electroacoust. 2003, 15, 70–73. [Google Scholar] [CrossRef]
  34. Wang, Y.; Chen, M.; Guo, T.; Qu, Z.; Zhang, B.; Lv, M.; Wang, W. Proppant transport coupled with propagation of three-dimensional hydraulic-natural fractures. Rock Mech. Rock Eng. 2025, 58, 2435–2463. [Google Scholar] [CrossRef]
  35. Lakirouhani, A.; Jolfaei, S. Assessment of hydraulic fracture initiation pressure using fracture mechanics criterion and coupled criterion with emphasis on the size effect. Arab. J. Sci. Eng. 2024, 49, 5897–5908. [Google Scholar] [CrossRef]
  36. Cramer, D.D.; Zhang, J. Pressure-Based Diagnostics for Evaluating Treatment Confinement. SPE Prod. Oper. 2021, 36, 530–552. [Google Scholar] [CrossRef]
  37. Hamanaka, Y.; Zhu, D.; Hill, A.D. Investigation of the Reduction in Distributed Acoustic Sensing Signal Due to Perforation Erosion by Using CFD Acoustic Simulation and Lighthill’s Acoustic Power Law. Sensors 2024, 24, 5996. [Google Scholar] [CrossRef] [PubMed]
  38. Hamanaka, Y.; Zhu, D.; Hill, A.D.; Kerr, E. Evaluation of Perforation Erosion and Fluid Allocation with Distributed Acoustic Sensing in Multi-Stage Fracture Stimulation. In Proceedings of the SPE Hydraulic Fracturing Technology Conference and Exhibition, The Woodlands, TX, USA, 4–6 February 2025; SPE: Richardson, TX, USA, 2025; p. D021S006R005. [Google Scholar] [CrossRef]
  39. Somanchi, K.; Brewer, J.; Reynolds, A. Extreme Limited-Entry Design Improves Distribution Efficiency in Plug-and-Perforate Completions: Insights from Fiber-Optic Diagnostics. SPE Drill. Complet. 2018, 33, 298–306. [Google Scholar] [CrossRef]
  40. Katende, A.; Allen, C.; Rutqvist, J.; Nakagawa, S.; Radonjic, M. Experimental and numerical investigation of proppant embedment and conductivity reduction within a fracture in the Caney Shale, Southern Oklahoma, USA. Fuel 2023, 341, 127571. [Google Scholar] [CrossRef]
  41. Sun, X.; Mu, J.; Guo, X.; Cao, B.; Tang, T.; Zhang, T. Experimental Study on Effective Propping of Multi-Level Fractures Using Micro-Proppants. Processes 2025, 13, 2503. [Google Scholar] [CrossRef]
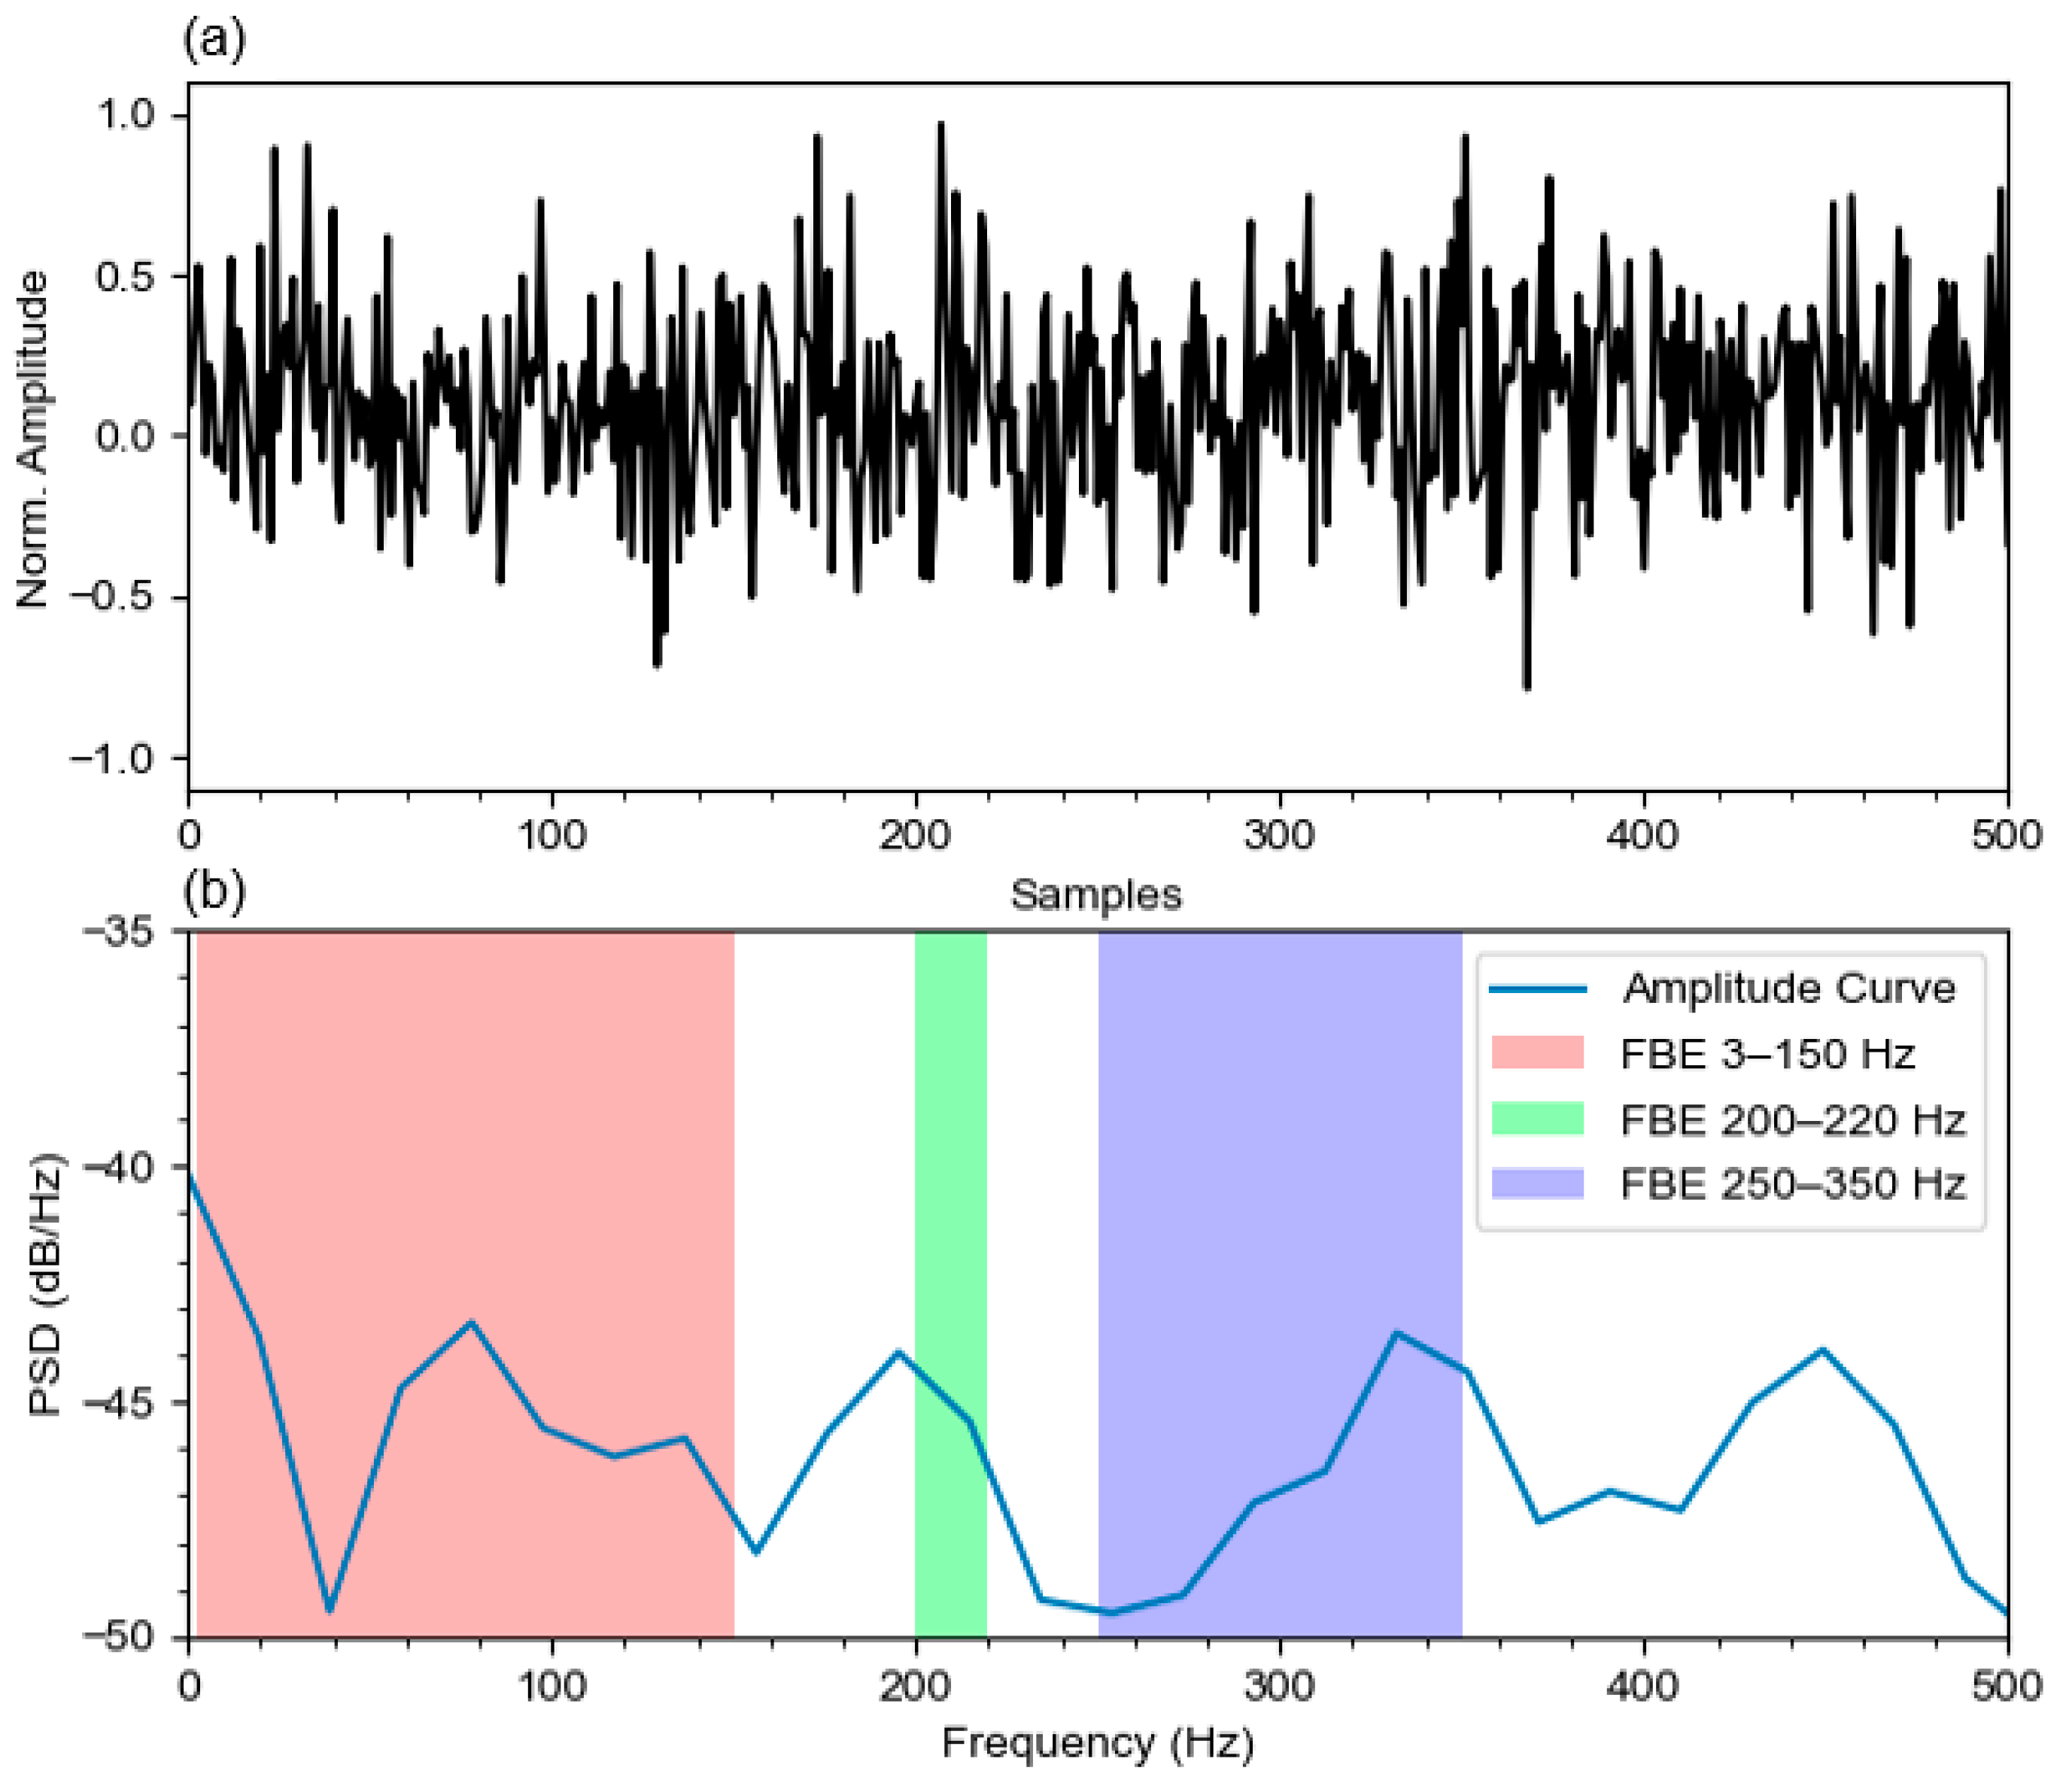
Figure 2. Illustration of the extraction of multi-band FBE datasets: (a) Segment of 1D acoustic signal from raw DAS data. (b) Plot of amplitude–spectrum and multiple frequency bands.
Processes 13 03738 g002
Figure 3. Raw DAS waterfall plot for Stage 8. Red rectangle highlights the fracture treatment interval.
Processes 13 03738 g003
Figure 4. Waterfall plots of four different FBE data: (a) FBE [0–3 Hz]. (b) FBE [3–50 Hz]. (c) FBE [50–200 Hz]. (d) FBE [200–2000 Hz]. Yellow triangles pinpoint the depth locations of the four perforation clusters of Stage 8.
Processes 13 03738 g004
Figure 5. Amplitude comparison of four different FBE curves covering both the injection zone (shaded in yellow) and non-injection zone: (a) FBE curves covering both non-injection and injection zones. (b) Zoomed-in FBE curves covering only the active injection zone. Yellow triangles pinpoint the depth locations of the four perforation clusters of Stage 8.
Processes 13 03738 g005
Figure 6. Determination of top and bottom depths of perforation clusters based on FBE data, with triangles representing perforation clusters: (a) Summed FBE curve. (b) FBE [50–200 Hz] waterfall plot. Black and yellow triangles pinpoint the depth locations of the four perforation clusters of Stage 8.
Processes 13 03738 g006
Figure 7. Time-aligned FBE data waterfall plot and pumping data curves: (a) Waterfall plot of FBE data extracted from frequency bands of 50–200 Hz; (b) plot of injection data curves for Stage 8. Yellow triangles pinpoint the depth locations of the four perforation clusters of Stage 8.
Processes 13 03738 g007
Figure 8. Three-dimensional visualization of the four numerically simulated hydraulic fractures initiated from the four perforation clusters of Stage 8.
Processes 13 03738 g008
Figure 9. Comparison of the realistic surface treatment pressure and the simulated pressure curves.
Processes 13 03738 g009
Figure 10. Bar charts of injected fluid and proppant volumes calculated using Equation (1) (a), Equation (5) (b) and the benchmarked simulation (c).
Processes 13 03738 g010
Figure 11. Bar chart and table of injected fluid and proppant volumes for all clusters of all stages.
Processes 13 03738 g011
Table 1. Typical DAS response frequency ranges for common well operations.
OperationDominant Response Frequency RangeRemarks
Hydraulic fracturing and injection0–400 HzEnergy concentrated in the mid-frequency band
Production (liquid/gas)0–500 HzFlow-induced signals; frequency may vary with production phase
Sand ingress<50 Hz or >5 kHzLow-frequency flow noise or high excitation frequency vibration
Wellbore leakage and noise sources<300 Hz or BroadbandLeakage signals, background noise, and reflections; typically filtered or segmented during preprocessing
Table 2. Comparison of fluid and proppant distributions derived from Equation (1), Equation (5) and the benchmarked simulation.
MassCluster No.Volume Percent of Equation (1)
(%)
Volume Percent of Equation (5)
(%)
Volume Percent of Benchmarked Simulation
(%)
Errors of
Equation (1) to Simulation
(%)
Errors of
Equation (5) to Simulation
(%)
Fluid121.016.720.50.53.8
234.052.236.22.216.0
319.112.716.82.34.1
427.718.326.51.28.2
Proppant121.012.021.00.09.0
227.954.733.65.721.1
320.915.617.93.02.3
430.217.727.52.79.8
Disclaimer/Publisher’s Note: The statements, opinions and data contained in all publications are solely those of the individual author(s) and contributor(s) and not of MDPI and/or the editor(s). MDPI and/or the editor(s) disclaim responsibility for any injury to people or property resulting from any ideas, methods, instructions or products referred to in the content.