Abstract
Municipal solid waste incineration fly ash (MSWIFA) can be reused as an admixture in cementitious materials, but its low activity limits its utilization as a resource. In this study, we systematically investigated the mineral and grinding characteristics of MSWIFA and then studied its pretreatment and activation via mechanical force–surface modification. The results indicate that the fineness and angle of repose of MSWIFA during grinding are inversely proportional to grinding time, while specific surface area and powder fluidity increase. Agglomeration occurs in the later stage, and particle size fluctuates. Gray correlation analysis shows that MSWIFA powder with a particle size of 16–45 μm contributes most to compressive strength improvement. The composite surface modifier TEA-STPP benefits grinding, shortens ball-milling time, and increases active particle size content, thereby promoting hydration activity. The best process regarding the modifier was determined. MSWIFA and blast furnace slag (BFS) accelerate early hydration of ordinary Portland cement (OPC) and increase its reaction participation, promoting the generation of calcium chloroaluminate (Friedel’s salt) and monosulfate-aluminate phases (SO4-AFm) and significantly enhancing the hydration of tricalcium aluminate (C3A) in OPC.
1. Introduction
The continuous increase in the generation of municipal solid waste (MSW) has become a major environmental problem worldwide [1]. Incineration is one of the most effective ways to treat waste, with the advantages of reductions in volume and secondary pollution, as well as energy recovery [2]. In 2019, the total amount of domestic waste generated in China was 242 million tons, of which incineration accounted for 51.6% as a treatment method [3]. With the continuous improvement in the generation and collection rate of garbage, it is expected that domestic waste in China will increase to 440 million tons in 2025 and 550 million tons in 2035, and the corresponding incineration of garbage will account for 50% and 75%. This means that in 2025, China will produce about 3.3 million tons of municipal solid waste incineration fly ash (MSWIFA) [4]. Pollutants in MSWIFA, especially heavy metals and dioxins, will pose a serious threat to the environment and human health if not handled properly [5,6,7].
MSWIFA has the potential to be used to develop cementitious materials [8]. Bertolini washed MSWIFA to reduce its chlorine content and then ground the bottom ash with water and dry-ground it, respectively, to replace 30% of the cement to make cement paste specimens for research and comparison. The results showed that the compressive strength of the wet-ground bottom ash was higher than that of the standard specimen, and it showed excellent Portland cement reaction [9]. Bawab used MSWIFA to replace part of the cement and part of the sand for the study of cement mortar specimens. The slump of the replaced sand decreased, whereas that of the replaced cement increased, and its 28 d strength was similar or slightly higher [10]. In Lin’s study, the slag from the melting treatment of MSWIFA was used to make specimens at replacement rates of 0%, 10%, and 20%, respectively. The test results showed that the 28 and 90 d compressive strengths of the specimens were 84–96% and 95–110% of those of the unreplaced specimens, respectively [11]. Lin et al. conducted an analysis of the hydration activity of Al2O3 after the melting treatment of MSWIFA, which was ground into powder and replaced part of the cement to make cement paste specimens; they obtained good results [12]. Wang replaced Portland cement types I and II with MSWIFA slag powder at ratios of 10–40%, respectively, to make cement paste specimens [13]. Compared with the standard specimens, the growth of its early strength was lower, but that of its late strength was higher. Poranek investigated the working mechanics and durability of ecological concrete after replacing ordinary Portland cement (OPC) and calcium sulfoaluminate cement (CSA) with MSWIFA [14]. The aerated mortar mixed with 20% MSWIFA could also obtain a compressive strength of more than 50 MPa. In conclusion, if the self-activation ability of MSWIFA can be utilized to simultaneously achieve the physical solidification of MSWIFA and the stabilization of heavy metals, the effect of waste resource utilization can be achieved.
MSWIFA has a certain activity and can stimulate blast furnace slag (BFS) to produce hydration products to solidify heavy metals [15]. However, MSWIFA is limited due to its very low activity [16]. While previous studies have investigated the chemical and mineral composition of MSWIFA, few have systematically explored the effects of mechanical force-surface modification on particle size, hydration activity, and early strength development. In our previous work, raw MSWIFA was used as a supplementary cementitious material in combination with OPC and ground-granulated BFS [17].
In this study, MSWIFA was activated via a mechanochemical treatment to precisely control its particle size distribution and surface properties, thereby significantly enhancing its pozzolanic reactivity in MSWIFA–BFS–cement blended systems. The novelty of this research lies in correlating the microscale physical modifications with the macroreactivity of MSWIFA, systematically revealing how mechanochemically tailored properties promote the formation of critical hydration products—specifically Friedel’s salt and ettringite (AFt)—which contribute to improved mechanical strength and leaching resistance. Furthermore, this work provides deeper mechanistic insights into the hydration processes and offers a practical pathway toward high-value and large-volume recycling of MSWIFA in low-carbon cementitious materials.
2. Materials and Methods
2.1. Materials
MSWIFA was sourced from a municipal solid waste incineration power plant located in Guangzhou. The flue gas purification system of the plant comprises four main components: An acid gas absorption unit employs a calcium hydroxide slurry spray process for the removal of acidic gases. A portion of the resulting reaction products subsequently enters the bag filter unit, which captures particulate matter, and the accumulated powder layer further adsorbs heavy metals and dioxins. The collected dust from this process constitutes the MSWIFA sample used in this study.
The blast furnace slag powder (BFS, Grade S95) utilized in this experiment was obtained from Wuxin New Building Materials Co., Ltd. (Wuhan, China). The cement used was commercially available 42.5 ordinary Portland cement (OPC) from Huaxin Co., Ltd. (Huangshi, China).
The above raw materials needed to be dried at 103 ± 5 °C to constant weight before use, and the MSWIFA needed to be calcined at 850 °C for 4 h to eliminate the carbon dioxide absorbed in the air during storage and transportation (Figure S1). As observed in Figure S1, the characteristic peaks of calcium sulfate, sodium chloride, and potassium chloride persisted in MSWIFA calcined at 850 °C, whereas those of calcium carbonate virtually disappeared.
The main elements in the raw materials were analyzed using an X-ray fluorescence spectrometer (XRF, Axios mAX, PANalytical Co. Ltd., Shanghai, China). Samples were subjected to microwave-assisted acid digestion with a solid-to-liquid ratio of 1:75 using a mixture of HCl:HNO3:HF at a volume ratio of 3:1:1, respectively, and the digestion was performed at 180 °C for 30 min. The trace elements in the raw materials were analyzed using an inductively coupled plasma atomic emission spectrometer (ICP-AES, Agilent Technologies Inc., Santa Clara, CA, USA) and an inductively coupled plasma mass spectrometer (ICP-MS, PerkinElmer Inc., Waltham, MA, USA). The mineral composition of the raw materials was determined using a D8Advance powder X-ray diffractometer (XRD, Bruker Corporation, Karlsruhe, Germany), and the solid samples to be tested were ground to below 45 μm before testing. The test environment was at room temperature (23 ± 2 °C), and the diffraction angle range was 5–80°.
2.2. Experimental Method
2.2.1. Pre-Grinding of MSWIFA
The stepwise flowchart of the research is shown in Figure S2. The calcined MSWIFA was initially crushed to a particle size below 5 mm using a Φ500 mm × 500 mm laboratory ball mill (model: SM-500, Jianyi Co. Ltd., Wuxi, China) operating at 48 r/min for 30 min, followed by an additional 5 min of milling. The resulting product was then sieved through a 32-mesh sieve (aperture size: 0.5 mm).
The QM-QX2 planetary ball mill (Xiangyi Co. Ltd., Changsha, China) was used to conduct the research experiment on the grinding characteristics of MSWIFA. An amount of 200 g of pre-ground MSWIFA sample was added to the stainless steel ball mill tank; the mass of the stainless steel ball was 3 kg, the revolution speed was 120 r/min, and the rotation speed was 240 r/min. According to calculations (Supplementary Section S1 [18]), the ball-milling energy input was 2.74 kJ/min. The ball-milling times were 10, 20, 30, 40, 50, 60, 70, 80, 150, and 240 min. The particle size distribution of the MSWIFA powder was determined using the dry method by the Malvern S3500 series laser particle size analyzer (Malvern Panalytical Ltd., Malvern, UK) according to the JC/T721-2006 standard [19].
As shown in Table S1, using the ground MSWIFA obtained from the grinding test and OPC as raw materials, 30% of MSWIFA powder—each ground for different durations—was incorporated into OPC in accordance with the Chinese standard “Test Method for the Activity of Industrial Waste Residues Used as Cement Admixtures” (GB/T 12957-2005) [20]. The mixtures were thoroughly blended prior to testing.
For determining the neat paste strength, specimens were prepared using 20 × 20 × 20 mm molds with a water–cement ratio of 0.3:1. After 24 h, the specimens were demolded and transferred to a standard curing room (maintained at 20 ± 3 °C and relative humidity ≥ 95%) until the target ages were reached. The compressive strength was measured at 3, 7, and 28 days following the procedure outlined in GB/T 17671-1999 [21]. Each strength test was conducted in triplicate, and the average value was reported. The raw and ground MSWIFA were selected for scanning electron microscopy (SEM, S-4800, Hitachi Co., Ltd., Tokyo, Japan) to characterize the surface morphology.
2.2.2. Gray Correlation Degree Analysis
Variations in the particle size of powder materials can result in both physical filling and chemical activity effects, thereby influencing their cementitious properties [22]. It is therefore essential to examine how the particle size distribution of MSWIFA affects the mechanical performance of cementitious systems, with the aim of establishing the correlation between MSWIFA particle size and the mechanical properties of composite cement, as well as identifying the optimal particle size range. Gray correlation analysis can be employed to evaluate the contribution of different MSWIFA particle sizes to the strength of cementitious hydration [23] and to determine the most reactive particle size range.
In the gray relational analysis, a model was established with the compressive strengths of MSWIFA cement at 3, 7, and 28 days serving as the reference sequence (also called the parent sequence), designated as Y1, Y2, and Y3, respectively. These ages were selected as reference values because the 3- and 28-day strengths represent critical performance states in early and later curing stages, respectively, offering key insights into material behavior. Using these references allows for a more effective evaluation of the correlation between influencing factors and the overall performance of the material.
The percentage of particle content in each particle size range of MSWIFA powder was set as the subsequence [24], and the corresponding serial numbers were set as X1, X2, X3, X4, X5, and X6 for the ranges of 0–16, 16–45, 45–74, 74–150, 150–245, and >245 μm, respectively. To ensure data comparability by establishing uniform dimensionality across all sequences, the following normalization procedure was applied to the subsequences to enable the subsequent gray relational analysis:
The absolute value of the difference between each parent sequence and each subsequence, Δi(k) = |Yi′(k) − Xi′(k)|; the correlation coefficient γoi(k) = γ[x0′(k), xi′(k)] of the difference between the parent sequence and each subsequence [25]; and the absolute value of the gray correlation degree γoi = γ(x0′, xi′) = ∑γ[Y0′(k), Xi′(k)]/n between the parent sequence and each subsequence were calculated. According to the formula for judging the correlation polarity, the correlation degree between the parent sequence (Y1, Y2, and Y3) and the subsequence (X1, X2, X3, X4, X5, and X6) was obtained.
2.2.3. Response Surface Optimization
The experiment was designed using a Box–Behnken design (BBD) [26] integrated with Response Surface Methodology (RSM) [27]. RSM is a collection of statistical and mathematical techniques used for developing, improving, and optimizing processes. It employs a scientific experimental design to fit a multivariate quadratic regression model that describes the relationship between multiple independent variables and one or more response variables. This approach allows for efficient modeling and optimization of process parameters while evaluating interaction effects among factors. The BBD, specifically, is a rotatable or nearly rotatable second-order design based on incomplete factorial designs that requires fewer experimental runs than other comparable designs, thereby improving efficiency without compromising the predictability of the model [28]. This method has been extensively applied and validated in process optimization across various fields, including materials science, chemical engineering, and pharmaceutical processing [29,30].
Based on preliminary experiments, the dosage of the surface modifier (A), the ball-to-material ratio (B), and the ball-milling time (C) were selected as independent variables, while the proportion of 74 μm sieve residue (Y) was defined as the response variable. A total of 17 experimental runs were generated using the Box–Behnken design. The experimental outcomes were analyzed using Design-Expert 9.0.5 software to fit an appropriate quadratic model. Subsequently, response surface analysis was performed to identify the optimal process conditions.
where is the offset term; represents the linear effect of ; represents the quadratic effect of ; and represents the interaction effect between and , , , …, are encoded variables [31].
2.2.4. Hydration Heat
The mixture formulation of the OPC-BFS-MSWIFA ternary system used for the hydration heat test is shown in Table S2. According to the proportions listed, 5.000 g of solid sample and 2.000 g of deionized water were weighed. The deionized water was poured into a plastic vial containing the cementitious sample, and the mixture was stirred manually for 60 s until a homogeneous paste was achieved. Immediately after mixing, the vial was placed into the isothermal calorimeter to initiate the measurement. Heat flow data were collected continuously for 72 h using a C80 microcalorimeter. The Knudsen equation [32] was proposed in the 1970s, which established a relationship between the degree of cement hydration reaction and the hydration heat curve, thereby deriving the kinetic equation of cement reaction heat. Based on the stage of heat release during the cement hydration reaction, with 1/2 of the total heat release, Q50, as the distinguishing point, the kinetics of the entire polymerization process should follow
where α(t) represents the degree of the polymerization reaction at time t as it changes over time; Qmax represents the total heat change of the reaction assumed to have occurred completely in the entire reaction stage; and Q(t) is the cumulative heat release at reaction t since the polymerization occurred. Therefore, the relationship between the reaction rate and the heat release Q can be obtained by differentiating it:
where t0 is the reaction time at the end of the induction period, and in the polymer, it is the end time of the raw material dissolution stage; t50 is the time when the cumulative heat release of the cement hydration reaction reaches 50%, and in the geopolymer, it is the time from t0 to the cumulative heat release reaching Qmax/2.
By using the pseudo-first-order kinetics Krstulovic–Dabic (K-D) model [33] of cement to fit the OPC-BFS-MSWIFA kinetics curve stages, the factors that mainly control the hydration reaction rate in each stage are extracted, or the reaction order is determined.
This model divides cement hydration into three stages: the nucleation and crystal growth (NG) stage, the interactions at phase boundaries (I) stage, and the diffusion (D) stage. Therefore, the following relationships exist:
NG stage:
I stage:
D stage:
where n is the reaction order, and generally, n = 1~3; KNG, KI, and KD are the reaction rate constants of the NG, I, and D stages, respectively.
3. Results and Discussion
3.1. Properties of Raw Materials
The chemical composition and trace elements of the raw materials are shown in Table 1. The main chemical components of MSWIFA are CaO, SiO2, Al2O3, and a large amount of soluble potassium salts, sodium salts, chlorides, sulfates, etc. Compared with Portland cement and slag, MSWIFA has the characteristics of high salt content, which restricts its use as an auxiliary cementitious material. Compared to ground granulated blast furnace slag and cement, fly ash contains higher concentrations of heavy metals such as Cr, Cu, Pb, and Zn, reaching 2793.12, 689.65, 1397.29, and 6917.43 mg/kg, respectively. These values are one to two orders of magnitude greater than those found in slag and cement.

Table 1.
Chemical composition of raw materials.
The XRD pattern is shown in Figure 1b. The main mineral phases of cement are tricalcium silicate (C3S), dicalcium silicate (C2S), tricalcium aluminate (C3A), tetracalcium aluminoferrite (C4AF), CaCO3, and anhydrite (CaSO4). The main mineral phases of MSWIFA are anhydrite, sylvite, halite, quartz, CaCO3, and gehlenite. The solid phase in blast furnace slag powder is mainly amorphous, and its diffraction pattern shows a relatively broad steamed bun peak.
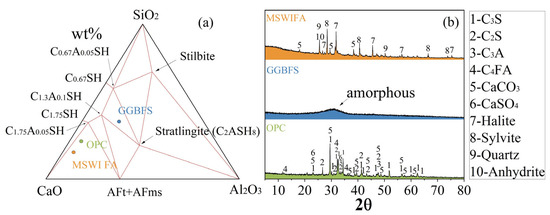
Figure 1.
Chemical composition (a) CaO-SiO2-Al2O3 composition and (b) XRD patterns of raw materials.
MSWIFA contains a certain quantity of aluminosilicates, as well as calcium chloride and calcium sulfate, and it can be used as a slag-based cementitious material. The main physical properties of the raw materials are shown in Table 2. Compared with slag and cement, the specific gravity and Blaine specific surface area of MSWIFA are relatively low, possibly due to agglomeration. It needs to be milled to reduce the particle size and enhance its activity, promoting the hydration reaction.
Table 2.
Physical properties of raw materials.
3.2. Grinding Characteristics of MSWIFA
3.2.1. Fineness of MSWIFA
The fineness of the powder is usually characterized by the sieve residue and specific surface area. The sieve residue and cumulative distribution of the MSWIFA powder under different grinding times are shown in Figure 2. It can be seen that with the extension of the grinding time, the 245, 150, and 74 μm sieve residues of the MSWIFA powder gradually decrease first before gradually increasing after 50 min. The reason for the fluctuation in particle size of the MSWIFA after ball milling for a certain period of time is as follows: (1) After grinding, the particles of the MSWIFA become finer, the active sites increase, and the fine particles are prone to adhere to each other to produce agglomeration [34]; (2) the original particles break during the grinding process, causing the fracture of the Ca-O ionic bond and the Si-O covalent bond at the crack site, releasing charges, and resulting in the re-healing of the fracture site to form large particles [35]. As shown in Figure 3, the unprocessed MSWIFA particles are relatively coarse, with molten and crystalline chloride salt particles forming large, integrated structures. After 240 min of ball milling, most particles are reduced to sizes below 1 μm but re-agglomerated, forming larger aggregated clusters. Therefore, grinding aids need to be added to improve the surface characteristics of MSWIFA particles and enhance the grinding efficiency [36,37,38].
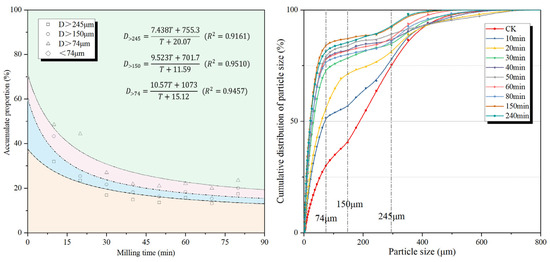
Figure 2.
Particle size distribution of MSWIFA under different grinding times.
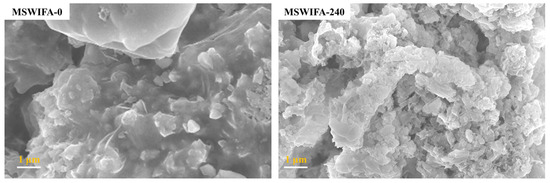
Figure 3.
SEM images of fly ash before and after ball milling.
3.2.2. Grey Correlation Relationship Between Fly Ash Particle Size and Composite System Strength
The 3, 7, and 28 d paste strengths of the MSWIFA–cement composite containing 30% MSWIFA powder are shown in Figure 4a. The gray correlation degree between the strength of each curing age and the particle size range of the MSWIFA powder is shown in Figure 4c. The MSWIFA particles less than 74 μm in size (X1~X3) are positively correlated with the compressive strength of the MSWIFA–cement composite at 3, 7, and 28 days (Y1~Y3). The MSWIFA powder in this range can promote the compressive strength of the MSWIFA–cement composite at each age. Among them, the MSWIFA powder in the 16–45 μm part (X2) has the greatest effect on improving the compressive strength, and the order of the effect on the improvement in the 3 d compressive strength is 16–45 μm > 0–16 μm > 45–74 μm (X2 > X1 > X3). The MSWIFA particles greater than 74 μm in size (X4~X6) are negatively correlated with the compressive strength of the MSWIFA–cement composite at 3, 7, and 28 days. The MSWIFA powder in this range will reduce the compressive strength of the MSWIFA cement at each age. The weakening effect of 150–74 μm (X4), 245–150 μm (X5), and >245 μm (X6) on the compressive strength is not much different. From the above results, it can be seen that in order to improve the 7 and 28 d strengths of the composite cement with 30% MSWIFA powder, the particle content less than 74 μm (X1~X3), especially 16–45 μm (X2), should be increased, and the particle content greater than 74 μm (X4~X6) should be limited. Therefore, it can be considered that the MSWIFA powder particle size of 16–45 μm (X2) best matches the reference cement.
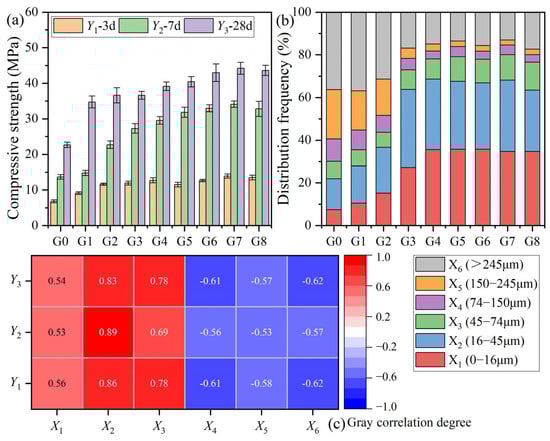
Figure 4.
Corresponding values of the (a) parent sequence (Yi) and (b) the subsequence (Xi); (c) gray correlation degree between particle size range and paste strength.
3.3. Response Surface Optimization of MSWIFA Modification Process
The surface of MSWIFA particles was modified with triethanolamine and sodium hexametaphosphate (TEA-STPP) as grinding aids. The range of factors is shown in Table 3. According to the ratio of the test design, specific experiments were carried out to obtain the experimental results. Multiple regression analysis of the experimental results found that the second-order model can simulate the experimental results well, and the specific expression is as follows:
Table 3.
The range and level of experimental factors.
Table S2 shows the variance analysis of the model. Table S3 shows the estimated coefficients for coded factors. The F value of the model is 281.1, indicating that the established second-order model is significant. There is less than a 0.001% chance of data being larger than the F value, which is caused by the signal-to-noise ratio. The value of “Prob. > F” less than 0.0001 indicates that the model parameters are significant. The F value indicates the significance of the model equation [39]. The regression response value of “Prob. > F” less than 0.05 means that the model parameters are significant [40], while the opposite is true when it is greater than 0.1. In this experiment [41], A, B, C, AB, AC, A2, B2, and C2 are significant model parameter terms. Table 4 shows the statistical results of response surface fitting. R2 (0.9958) indicates that the model explains over 99% of the variability in the data, suggesting an excellent fit. The low standard deviation (0.5331) confirms that the actual data points are closely clustered around the model’s predicted values, reflecting high precision. Meanwhile, the Predicted R2 (0.9441), while slightly lower than the adjusted R2, remains high and shows that the model maintains strong predictive power for new observations, with only a minor degree of overfitting. Overall, these metrics demonstrate a highly accurate and reliable model.
Table 4.
Statistical results of response surface fitting.
Figure 5 shows a three-dimensional response surface plot of the experimental results obtained by the analysis software, in which the 74 μm sieve residue is the Z-axis response value, and the X and Y axes are two of the experimental influencing factors. When two of the influencing factors are the X and Y axis variables, the other influencing factor remains unchanged and is at the 0 level. The three-dimensional response surface and the corresponding contour plot can be used to easily and simply check the response of the influencing experimental variables [42]. The grinding aid TEA-STPP dosage A, ball-to-material ratio B, and ball-milling time C have obvious interactive effects on the improvement in the 74 μm sieve residue ratio. Through analysis and response surface optimization, the optimal experimental parameters can be obtained: the grinding aid TEA-STPP dosage is 0.07%; the ball-to-material ratio is 0.33; the ball-milling time is 44 min; and the 74 μm sieve residue is 0.63%.
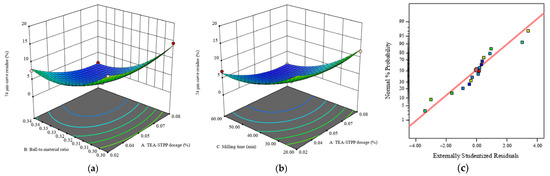
Figure 5.
Response surface plots under different experimental factors: (a) simulated response versus A and B at C = 40 min; (b) simulated response versus A and C at B = 0.32; (c) normal plot of residuals.
The grinding aids play a role in reducing the surface energy in the early stage of grinding, not only preventing crack closure but also promoting crack expansion and accelerating the generation of fractures. In the middle and late stages of grinding, the triethanolamine (TEA) mainly plays a dispersing role, delaying or reducing the agglomeration of fine materials [43]. The sodium hexametaphosphate (STPP) can selectively adsorb and electrically neutralize on the surface of the material, eliminating the electrostatic effect [44], reducing the ability and opportunity of fine particle aggregation, thereby reducing the phenomenon of ball coating and lining plate pasting in the mill, eliminating or greatly reducing the liner formed by adhering fine powder on the steel ball and the inner wall of the mill, improving the dispersion of fine powder materials, improving the utilization rate of mechanical energy, and thus improving the grinding efficiency of the mill. The points in the graph cluster closely around the straight reference line (Figure 5c), indicating that the residuals approximately follow a normal distribution and further supporting the validity of the model.
3.4. Hydration Reaction Kinetics of the MSWIFA-BFS-OPC Ternary System
From the hydration heat release curves of OPC, the MSWIFA+OPC system, and the MSWIFA+BFS+OPC system at different periods in Figure 6, it can be seen that the hydration heat release process of the cementitious system doped with MSWIFA is similar to that of the cement-based material cementitious system, and can also be divided into five stages such as the early hydration stage, hydration induction stage, hydration acceleration stage, and hydration deceleration stage [45], but there are certain differences in the reaction process.
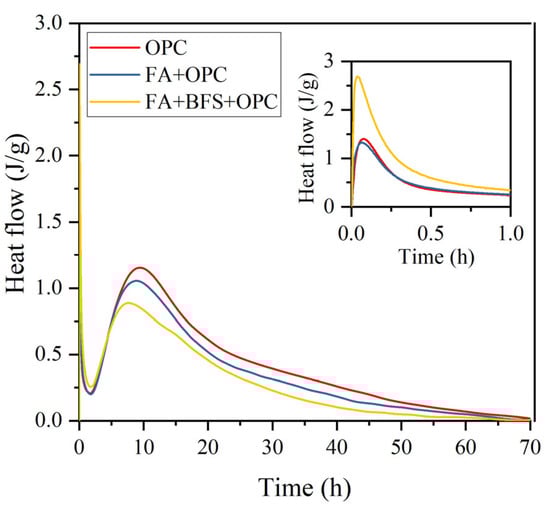
Figure 6.
The hydration heat curve of the ternary blend paste with the addition of FA and BFS.
The total amount of 72 h hydration heat from high to low is pure OPC > MSWIFA+OPC > MSWIFA+BFS+OPC; the time corresponding to the peak of the initial hydration reaction heat flow from fast to slow is MSWIFA+BFS+OPC > MSWIFA+OPC > OPC; the initial hydration reaction heat flow value from high to low is MSWIFA+BFS+OPC > OPC > MSWIFA+OPC; the time corresponding to the peak of the second reaction heat flow from fast to slow is MSWIFA+BFS+OPC > MSWIFA+OPC > OPC; and the peak of the second reaction heat flow from high to low is OPC > MSWIFA+OPC > MSWIFA+BFS+OPC.
Incorporating MSWIFA can reduce the total hydration heat of the cementitious system, and the reduction amplitude is equal to its dosage (15%), which is consistent with the reduction in the 7 d strength of the cement mortar mixed with MSWIFA alone mentioned above.
Incorporating MSWIFA can accelerate the participation of OPC in early hydration and increase the amount of its participation in the reaction. That is, the time corresponding to the peak of the C3A reaction heat flow is advanced from 276.8 to 224.9 s, and the peak of the heat flow is only reduced by 5% (less than the reduction in its dosage by 15%); the time corresponding to the peak of the C3S and C2S reaction heat flow is advanced from 9.45 to 8.91 h, and the reduction in the peak of the heat flow is 9% (less than the dosage of 15%).
Compound incorporation of MSWIFA and BFS reduces the total hydration heat of the cementitious system, and its reduction amplitude (28%) is slightly higher than its dosage (25%).
This compound incorporation also accelerates the participation of OPC in early hydration and increases the amount of its participation in the reaction [46]. Among them, the time corresponding to the peak of the C3A reaction heat flow is shortened by half compared to the benchmark cement, that is, from 276.8 to 138.4 s, and the peak of the heat flow increases from 1.402 to 2.690 mW, which significantly promotes the hydration of C3A in OPC and the generation of Federal’s salt and SO4-AFm [47]; the time corresponding to the peak of the C3S and C2S reaction heat flow is advanced from 9.45 to 7.66 h, and the reduction in the peak of the heat flow is 23% (less than the dosage of 25%).
The K-D models for the hydration heat curve of OPC, the MSWIFA+OPC system, and the MSWIFA+BFS+OPC system are shown in Figure 7, Figure 8 and Figure 9, respectively. Knudsen equation parameters are presented in Table 5. Combining the results of hydration heat and microcalorimeter experiments, it is found that the incorporation of MSWIFA has an accelerating effect on the early hydration of OPC: the inert particles of extremely fine MSWIFA act as crystal nuclei and are uniformly dispersed in the cementitious system [48], promoting the early hydration of aluminum and silicon phase minerals in OPC through the diffusion-activating nucleation sites [49], manifested as the increase in the time the hydration heat peak appears on the hydration heat release curve and the increase in the initial heat flow value; shortening the induction period of cement hydration, causing it to enter the acceleration period in advance; and promoting the early hydration of cement. However, due to the low activity of MSWIFA, the long-term hydration heat of the composite cementitious system is always less than that of the OPC system. When MSWIFA and BFS are compounded, due to the larger specific surface area and higher activity of the BFS, the early hydration acceleration effect of OPC is more significant, but the later hydration rate is reduced; when 5% BFS and 20% MSWIFA are compounded, the initial heat flow peak in the early hydration stage of the cementitious system is equivalent to twice that of the benchmark cement, and the heat flow peak in the acceleration stage is reduced by 23% compared to the benchmark cement (the reduction amplitude is less than its dosage of 25%).
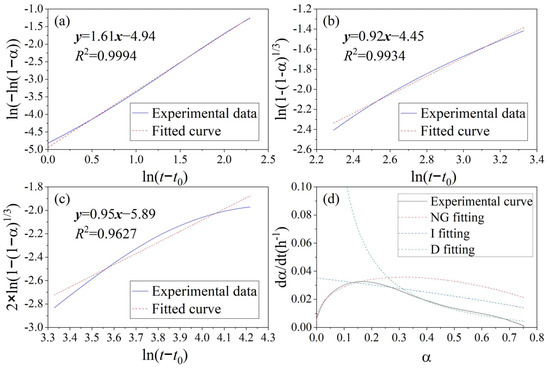
Figure 7.
K-D model for hydration heat curve of OPC paste: (a) KNG stage, (b) KI stage, (c) KD stage, and (d) hydration rate fitting curve.
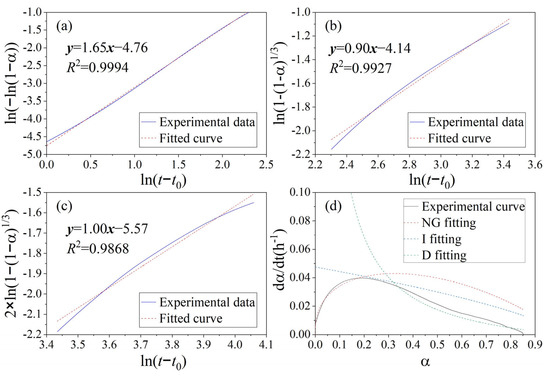
Figure 8.
K-D model for hydration heat curve of binary blend paste with addition of FA: (a) KNG stage, (b) KI stage, (c) KD stage, and (d) hydration rate fitting curve.
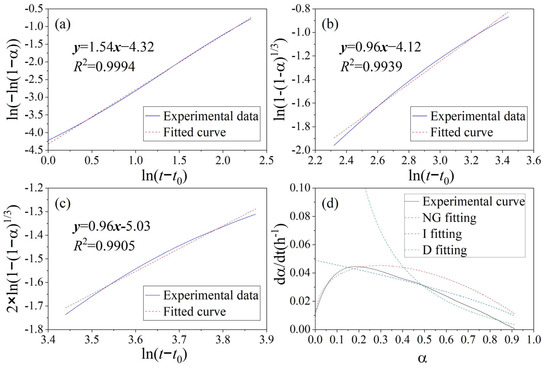
Figure 9.
K-D model for heat of hydration curve of ternary blend paste with addition of FA and BFS: (a) KNG stage, (b) KI stage, (c) KD stage, and (d) hydration rate fitting curve.
Table 5.
Knudsen equation parameters of MSWIFA+BFS+OPC.
The kinetic parameters determined by means of the K-D model are presented in Table 6. n is the reaction order, also known as the geometric crystal growth exponent, which reflects the capability of crystal nucleation and growth [50]. The n value of MSWIFA+OPC is slightly higher than that of OPC, suggesting a more intensive geometric process of crystal nucleation and growth in the hydration products of MSWIFA+OPC. Furthermore, the KNG, KI, and KD values of MSWIFA+BFS+OPC are all higher than those of MSWIFA+OPC and OPC. This indicates that the reaction rates of MSWIFA+BFS+OPC in the nucleation and growth (NG), induction (I), and diffusion (D) stages are higher than those of the other two mixtures. The enhanced reactivity is attributed to the fact that GGBFS and MSWIFA, under the alkaline conditions provided by cement, can form more highly reactive chlorine- and sulfur-containing hydration products [17]. Relevant studies indicate that the high alkalinity in MSWIFA promotes the formation of more C-(A)-S-H gels [51]. Figure 10 also indicates the presence of numerous hexagonal platy Friedel’s salt-like structures in the MSWIFA+BFS+OPC sample.
Table 6.
Kinetic parameters determined by means of the K-D model.
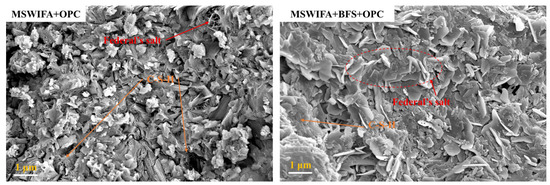
Figure 10.
SEM images of the ternary blend paste with the addition of FA and BFS.
3.5. Environmental Risk and Reuse Safety Assessment
The TCLP toxicity leaching test results for the MSWIFA+BFS+OPC ternary system are presented in Table 7. As shown in Table 7, the incorporation of MSWIFA led to an increase in the heavy metal leaching concentrations of MSWIFA+OPC compared to those of OPC alone, with the most pronounced increase observed for Pb. After the addition of BFS, the leaching of Pb was significantly inhibited, indicating that the combination of OPC and BFS exhibits a stronger solidification effect on Pb in MSWIFA. In contrast, the increases in Zn and Cd were less significant, and a decrease was even observed, suggesting that the ternary system provides better solidification efficiency for these two amphoteric metals. Overall, the leaching concentrations of OPC, MSWIFA+OPC, and MSWIFA+BFS+OPC all met the requirements of GB 46040-2025 [52] and GB 5085.3-2007 [53]. The ternary system achieved solidification and stabilization of the five heavy metals through mechanisms such as physical encapsulation, chemical adsorption, and crystalline fixation. These results demonstrate that the MSWIFA+BFS+OPC ternary system is environmentally safe.
Table 7.
TCLP leaching concentrations of heavy metals out of MSWIFA+BFS+OPC.
4. Conclusions
The mineral and grinding characteristics of MSWIFA were systematically studied first, and then the pretreatment of MSWIFA and the activation of mechanochemical forces were studied. The main conclusions are as follows:
The fineness and angle of repose of MSWIFA during the grinding process are inversely proportional to the grinding time. According to the results of gray correlation analysis, MSWIFA powder with a particle size of 16–45 μm makes the greatest contribution to improving the compressive strength of MSWIFA cement, and the proportion of this part of the MSWIFA powder in the particle size range of 0–74 μm is very small, so increasing this proportion will help the cementitious activity of the MSWIFA. MSWIFA particles larger than 74 μm weaken the strength of the MSWIFA cement.
The composite special-effect surface modifier TEA-STPP is beneficial to the grinding of MSWIFA, shortens ball-milling time, and increases the content of active particle size, thereby promoting the hydration activity of MSWIFA. According to the response surface optimization results, optimal experimental parameters can be obtained with a surface modifier TEA-STPP dosage of 0.07%, ball-to-material ratio of 0.33, ball-milling time of 44 min, and a minimum 74 μm sieve residue of 0.63%.
MSWIFA and BFS accelerate the participation of OPC in early hydration and increase their participation in the reaction. Between them, the time corresponding to the peak heat flow of the C3A reaction is shortened by half compared to the reference cement, that is, from 276.8 to 138.4 s, and the peak heat flow increases from 1.402 to 2.690 mW, which significantly promotes the hydration of the C3A in the OPC.
Supplementary Materials
The following supporting information can be downloaded at: https://www.mdpi.com/article/10.3390/pr13113736/s1. Figure S1: Comparative XRD patterns of MSWIFA before and after calcination (disappearance of CaCO3 peaks in MSWIFA-850). Figure S2: Stepwise flowchart of the research. Table S1: Mixture proportions of different samples for the neat paste strength test (by weight). Table S2: Mixture proportions of different samples for hydration heat test (by weight). Table S3: Analysis of variance of the response surface model. Table S4: Estimated Coefficients for Coded Factors. Section S1: Estimation of Ball Milling Energy Input.
Author Contributions
Data Curation, Z.Q., Z.P., Z.H., S.W. and X.Z.; Investigation, Z.X.; Methodology, K.L.; Project Administration, Z.Q.; Resources, G.L.; Software, X.X.; Writing—Original Draft Preparation, Z.Q.; Writing—Review and Editing, Z.P., Z.H. and Z.Q. All authors have read and agreed to the published version of the manuscript.
Funding
This research was funded by the Major Science and Technology Project of the Jiangxi Provincial Water Resources Department (202527ZDKT03); the Central-Southern Safety & Environment Technology Institute Co., Ltd. (CSET-31-Y2024-456); and the Central Non-Profit Scientific Research Fund for Institutes (CKSF2024336/HL and CKSF2023397/HL).
Data Availability Statement
The data presented in this study are available upon request from the corresponding author.
Conflicts of Interest
Authors Zedong Qiu, Gang Li, Xintong Xiao, Kun Liu and Zhicheng Xiang, were employed by the Central-Southern Safety & Environment Technology Institute Co., Ltd. Author Zhen Hu, was employed by the Wuhan Huzhenyu Environmental Technology Company Ltd. The remaining authors declare that the research was conducted in the absence of any commercial or financial relationships that could be construed as a potential conflict of interest.
References
- Kun, U.H.; Ksepko, E. Advancing Municipal Solid Waste Management Through Gasification Technology. Processes 2025, 13, 2000. [Google Scholar] [CrossRef]
- Chen, S.; Xu, F.; Chen, Y.; Yin, L. Numerical Simulation and Intelligent Prediction of Effects of Primary Air Proportion and Moisture Content on MSW Incineration. Processes 2025, 13, 1479. [Google Scholar] [CrossRef]
- Maier, M.; Beuntner, N.; Thienel, K.-C. Mineralogical characterization and reactivity test of common clays suitable as supplementary cementitious material. Appl. Clay Sci. 2021, 202, 105990. [Google Scholar] [CrossRef]
- Li, W.; Yan, D.; Li, L.; Wen, Z.; Liu, M.; Lu, S.; Huang, Q. Review of thermal treatments for the degradation of dioxins in municipal solid waste incineration fly ash: Proposing a suitable method for large-scale processing. Sci. Total Environ. 2023, 875, 162565. [Google Scholar] [CrossRef] [PubMed]
- Awasthi, S.K.; Sarsaiya, S.; Kumar, V.; Chaturvedi, P.; Sindhu, R.; Binod, P.; Zhang, Z.; Pandey, A.; Awasthi, M.K. Processing of municipal solid waste resources for a circular economy in China: An overview. Fuel 2022, 317, 123478. [Google Scholar] [CrossRef]
- Su, L.; Wu, S.; Yu, F.; Zhu, W.; Zhang, X.; Liang, B. Utilizing municipal solid waste incineration fly ash for mine goaf filling: Preparation, optimization, and heavy metal leaching study. Environ. Res. 2025, 266, 120594. [Google Scholar] [CrossRef]
- Li, K.; Deng, J.; Zhu, Y.; Zhang, W.; Zhang, T.; Tian, C.; Ma, J.; Shao, Y.; Yang, Y.; Shao, Y. Utilization of municipal solid waste incineration fly ash with different pretreatments with gold tailings and coal fly ash for environmentally friendly geopolymers. Waste Manag. 2025, 194, 342–352. [Google Scholar] [CrossRef]
- He, S.; Lei, X.; Zhang, H.; Yu, P.; Zhou, Y.; Huang, X. Durability and heavy metals long-term stability of alkali-activated sintered municipal solid waste incineration fly ash concrete in acidic environments. Constr. Build. Mater. 2025, 462, 139990. [Google Scholar] [CrossRef]
- Bertolini, L.; Carsana, M.; Cassago, D.; Curzio, A.Q.; Collepardi, M. MSWI ashes as mineral additions in concrete. Cem. Concr. Res. 2004, 34, 1899–1906. [Google Scholar] [CrossRef]
- Bawab, J.; Khatib, J.; Kenai, S.; Sonebi, M. A Review on Cementitious Materials Including Municipal Solid Waste Incineration Bottom Ash (MSWI-BA) as Aggregates. Buildings 2021, 11, 179. [Google Scholar] [CrossRef]
- Lin, K.-L. The influence of municipal solid waste incinerator fly ash slag blended in cement pastes. Cem. Concr. Res. 2005, 35, 979–986. [Google Scholar] [CrossRef]
- Lin, K.-L.; Chang, J.-C.; Shie, J.-L.; Chen, H.-J.; Ma, C.-M. Characteristics of Porous Ceramics Produced from Waste Diatomite and Water Purification Sludge. Environ. Eng. Sci. 2012, 29, 436–446. [Google Scholar] [CrossRef]
- Wang, L.; Jin, Y.; Nie, Y. Investigation of accelerated and natural carbonation of MSWI fly ash with a high content of Ca. J. Hazard. Mater. 2010, 174, 334–343. [Google Scholar] [CrossRef] [PubMed]
- Poranek, N.; Pizoń, J.; Łaźniewska-Piekarczyk, B.; Czajkowski, A.; Lagashkin, R. Recycle option for municipal solid waste incineration fly ash (MSWIFA) as a partial replacement for cement in mortars containing calcium sulfoaluminate cement (CSA) and portland cement to save the environment and natural resources. Materials 2023, 17, 39. [Google Scholar] [CrossRef] [PubMed]
- Chen, C.; Wei, R.; Lan, J.; Xiang, Y.; Dong, Y.; Hou, H. Submicron tourmaline enhanced the solidification of municipal solid waste incineration fly ash by chemical structure reorganization and stabilized heavy metals. Waste Manag. 2023, 156, 12–21. [Google Scholar] [CrossRef] [PubMed]
- Xue, Y.; Yang, T.; Liu, X.; Cao, Z.; Gu, J.; Wang, Y. Enabling efficient and economical degradation of PCDD/Fs in MSWIFA via catalysis and dechlorination effect of EMR in synergistic thermal treatment. Chemosphere 2023, 342, 140164. [Google Scholar] [CrossRef]
- Wan, S.; Zhou, X.; Zhou, M.; Han, Y.; Chen, Y.; Geng, J.; Wang, T.; Xu, S.; Qiu, Z.; Hou, H. Hydration characteristics and modeling of ternary system of municipal solid wastes incineration fly ash-blast furnace slag-cement. Constr. Build. Mater. 2018, 180, 154–166. [Google Scholar] [CrossRef]
- Burgio, N.; Iasonna, A.; Magini, M.; Martelli, S.; Padella, F. Mechanical alloying of the Fe−Zr system. Correlation between input energy and end products. Il Nuovo Cimento D 1991, 13, 459–476. [Google Scholar] [CrossRef]
- Zhao, J.; Wang, D.; Wang, X.; Liao, S.; Lin, H. Ultrafine grinding of fly ash with grinding aids: Impact on particle characteristics of ultrafine fly ash and properties of blended cement containing ultrafine fly ash. Constr. Build. Mater. 2015, 78, 250–259. [Google Scholar] [CrossRef]
- Duan, S.; Wu, H.; Liao, H.; Cheng, F. Design and experimental study of a blended cement containing high-volume solid waste activated ultrafine powder. Constr. Build. Mater. 2021, 303, 124504. [Google Scholar] [CrossRef]
- Luo, Z.; Chen, L.; Zhang, M.; Liu, L.; Zhao, J.; Mu, Y. Analysis of melting reconstruction treatment and cement solidification on ultra-risk municipal solid waste incinerator fly ash–blast furnace slag mixtures. Environ. Sci. Pollut. Res. 2020, 27, 32139–32151. [Google Scholar] [CrossRef]
- Xu, X.; Zhao, Y.; Gu, X.; Zhu, Z.; Wang, F.; Zhang, Z. Effect of Particle Size and Morphology of Siliceous Supplementary Cementitious Material on the Hydration and Autogenous Shrinkage of Blended Cement. Materials 2023, 16, 1638. [Google Scholar] [CrossRef] [PubMed]
- Zhu, L.; Zhao, C.; Dai, J. Prediction of compressive strength of recycled aggregate concrete based on gray correlation analysis. Constr. Build. Mater. 2021, 273, 121750. [Google Scholar] [CrossRef]
- Gong, S.; Bai, L.; Tan, Z.; Xu, L.; Bai, X.; Huang, Z. Mechanical Properties of Polypropylene Fiber Recycled Brick Aggregate Concrete and Its Influencing Factors by Gray Correlation Analysis. Sustainability 2023, 15, 11135. [Google Scholar] [CrossRef]
- Deng, X.; Xiang, X. Fuzzy Comprehensive Evaluation Method for Evaluating Stability of Loess Slopes. Adv. Civ. Eng. 2023, 2023, 6692746. [Google Scholar] [CrossRef]
- Chen, Y.; Shi, J.; Rong, H.; Zhou, X.; Chen, F.; Li, X.; Wang, T.; Hou, H. Adsorption mechanism of lead ions on porous ceramsite prepared by co-combustion ash of sewage sludge and biomass. Sci. Total Environ. 2020, 702, 135017. [Google Scholar] [CrossRef]
- Raheem, A.; Ding, L.; He, Q.; Mangi, F.H.; Khand, Z.H.; Sajid, M.; Ryzhkov, A.; Yu, G. Effective pretreatment of corn straw biomass using hydrothermal carbonization for co-gasification with coal: Response surface Methodology–Box Behnken design. Fuel 2022, 324, 124544. [Google Scholar] [CrossRef]
- Xu, W.; Shah, Y.I.; Xu, S.; Wang, S.; Zhang, K.; Fan, X.; Liu, B. Multi-objective optimization of cold mix materials based on response surface methodology. Constr. Build. Mater. 2024, 435, 136782. [Google Scholar] [CrossRef]
- Heidari, P.; Rivard, P.; Wilson, W. Multi-objective optimization of cement-based systems containing marine dredged sediment. Constr. Build. Mater. 2024, 439, 137228. [Google Scholar] [CrossRef]
- Song, J.; Wang, B.; Hao, X. Optimization Algorithms and Their Applications and Prospects in Manufacturing Engineering. Materials 2024, 17, 4093. [Google Scholar] [CrossRef]
- Madondo, N.I.; Rathilal, S.; Bakare, B.F. Utilization of Response Surface Methodology in Optimization and Modelling of a Microbial Electrolysis Cell for Wastewater Treatment Using Box–Behnken Design Method. Catalysts 2022, 12, 1052. [Google Scholar] [CrossRef]
- Li, Z.; Gao, X.; Lu, D.; Dong, J. Early hydration properties and reaction kinetics of multi-composite cement pastes with supplementary cementitious materials (SCMs). Thermochim. Acta 2022, 709, 179157. [Google Scholar] [CrossRef]
- Zhou, X.; Chen, Y.; Dong, S.; Li, H. Geopolymerization kinetics of steel slag activated gasification coal fly ash: A case study for amorphous-rich slags. J. Clean. Prod. 2022, 379, 134671. [Google Scholar] [CrossRef]
- Prziwara, P.; Kwade, A. Grinding aids for dry fine grinding processes–Part I: Mechanism of action and lab-scale grinding. Powder Technol. 2020, 375, 146–160. [Google Scholar] [CrossRef]
- Tan, N.; Han, S.; Wei, K.; Wu, D.; Ma, W. Effect of Grinding Liberation on Recovery of Silicon from MG-Si Waste Slag by Flotation. Silicon 2024, 16, 3755–3764. [Google Scholar] [CrossRef]
- Prziwara, P.; Kwade, A. Grinding aid additives for dry fine grinding processes–Part II: Continuous and industrial grinding. Powder Technol. 2021, 394, 207–213. [Google Scholar] [CrossRef]
- Sun, X.; Liu, J.; Zhao, Y.; Zhao, J.; Li, Z.; Sun, Y.; Qiu, J.; Zheng, P. Mechanical activation of steel slag to prepare supplementary cementitious materials: A comparative research based on the particle size distribution, hydration, toxicity assessment and carbon dioxide emission. J. Build. Eng. 2022, 60, 105200. [Google Scholar] [CrossRef]
- Kalman, H. Quantification of mechanisms governing the angle of repose, angle of tilting, and Hausner ratio to estimate the flowability of particulate materials. Powder Technol. 2021, 382, 573–593. [Google Scholar] [CrossRef]
- Breig, S.J.M.; Luti, K.J.K. Response surface methodology: A review on its applications and challenges in microbial cultures. Mater. Today Proc. 2021, 42, 2277–2284. [Google Scholar] [CrossRef]
- Wang, W.; Hou, X.; Duan, C.; Mao, P.; Jiang, H.; Qiao, J.; Pan, M.; Fan, X.; Zhao, Y.; Lu, H. Dynamic model of the flip-flow screen-penetration process and influence mechanism of multiple parameters. Adv. Powder Technol. 2022, 33, 103814. [Google Scholar] [CrossRef]
- Nwose, S.A.; Edoziuno, F.; Osuji, S. Statistical analysis and Response Surface Modelling of the compressive strength inhibition of crude oil in concrete test cubes. Alger. J. Eng. Technol. 2021, 4, 99–107. [Google Scholar]
- Huang, T.; Rong, L.; Zhang, G. Investigating the feasibility of using computational fluid dynamics based response surface methodology and neural network to model the performance of the individualised ventilation in sow houses. Biosys. Eng. 2022, 214, 138–151. [Google Scholar] [CrossRef]
- Kaya, Y.; Kobya, V.; Mardani, A.; Assaad, J.J. Effect of modified Triethanolamine on grinding efficiency and performance of cementitious materials. Talanta Open 2024, 9, 100293. [Google Scholar] [CrossRef]
- Chipakwe, V.; Semsari, P.; Karlkvist, T.; Rosenkranz, J.; Chelgani, S.C. A critical review on the mechanisms of chemical additives used in grinding and their effects on the downstream processes. J. Mater. Res. Technol. 2020, 9, 8148–8162. [Google Scholar] [CrossRef]
- Ouyang, S.; Huang, Y.; Zhou, N.; Li, J.; Gao, H.; Guo, Y. Experiment on hydration exothermic characteristics and hydration mechanism of sand-based cemented paste backfill materials. Constr. Build. Mater. 2022, 318, 125870. [Google Scholar] [CrossRef]
- Ren, P.; Ling, T.-C. Roles of chlorine and sulphate in MSWIFA in GGBFS binder: Hydration, mechanical properties and stabilization considerations. Environ. Pollut. 2021, 284, 117175. [Google Scholar] [CrossRef] [PubMed]
- Zhou, X.; Zhou, M.; Wu, X.; Han, Y.; Geng, J.; Wang, T.; Wan, S.; Hou, H. Reductive solidification/stabilization of chromate in municipal solid waste incineration fly ash by ascorbic acid and blast furnace slag. Chemosphere 2017, 182, 76–84. [Google Scholar] [CrossRef] [PubMed]
- Ren, B.; Chai, L.; Liu, Y.; Ma, R.; Liu, Z.; Wang, Y. Performance optimization design of high ductility cement-based alkali-activated municipal solid waste incineration fly ash composite for rapid repair material. Constr. Build. Mater. 2023, 404, 133301. [Google Scholar] [CrossRef]
- He, J.; Long, G.; Ma, K.; Xie, Y. Influence of fly ash or slag on nucleation and growth of early hydration of cement. Thermochim. Acta 2021, 701, 178964. [Google Scholar] [CrossRef]
- Meng, S.; Shi, Z.; Ouyang, X. Comparison of the effects of carbon-based and inorganic nanomaterials on early cement hydration. Constr. Build. Mater. 2024, 421, 135705. [Google Scholar] [CrossRef]
- Xie, X.; Liu, X.; Lyu, Y.; Liu, R.; Lyu, K.; Fu, F.; Yu, J.; Zuo, J.; Shah, S.P. Hydration characteristic and strengthening mechanism of municipal solid waste incineration fly ash cementitious composites modified by nano SiO2. Constr. Build. Mater. 2023, 409, 134004. [Google Scholar] [CrossRef]
- GB 46040-2025; Limits of Leachable Harmful Metal Elements in Wall Materials. State Administration for Market Regulation, Standardization Administration of China: Beijing, China, 2025.
- GB 5085.3-2007; Identification Standards for Hazardous Wastes—Identification for Extraction Toxicity. State Administration for Market Regulation, Standardization Administration of China: Beijing, China, 2007.
Disclaimer/Publisher’s Note: The statements, opinions and data contained in all publications are solely those of the individual author(s) and contributor(s) and not of MDPI and/or the editor(s). MDPI and/or the editor(s) disclaim responsibility for any injury to people or property resulting from any ideas, methods, instructions or products referred to in the content. |
© 2025 by the authors. Licensee MDPI, Basel, Switzerland. This article is an open access article distributed under the terms and conditions of the Creative Commons Attribution (CC BY) license (https://creativecommons.org/licenses/by/4.0/).