Article

Bioactive Properties of Polyphenolic Extracts from Flourensia cernua Obtained by Emerging Technologies Under a Taguchi L18 Orthogonal Array

by
Andrea G. Valero-Mendoza
1,
Alberto Nuncio
1,
Mayela Govea Salas
2,
Alejandro Zugasti-Cruz
3,
Leopoldo J. Ríos-González
1,
Juan A. Ascacio-Valdés
4,
Thelma K. Morales-Martínez
1,
Marisol Cruz-Requena
1,* and
Miguel A. Medina-Morales
1,*
1
Agro-Environmental Biotechnology Group, Facultad de Ciencias Químicas, Universidad Autónoma de Coahuila, Blvd. V. Carranza s/n, Saltillo 25280, Mexico
2
Nanobioscience Group, Facultad de Ciencias Químicas, Universidad Autónoma de Coahuila, Blvd. V. Carranza s/n, Saltillo 25280, Mexico
3
Laboratorio de Toxicología, Facultad de Ciencias Químicas, Universidad Autónoma de Coahuila, Blvd. V. Carranza s/n, Saltillo 25280, Mexico
4
Departamento de Investigación de Alimentos, Facultad de Ciencias Químicas, Universidad Autónoma de Coahuila, Blvd. V. Carranza s/n, Saltillo 25280, Mexico
*
Authors to whom correspondence should be addressed.
Processes 2025, 13(11), 3725; https://doi.org/10.3390/pr13113725
Submission received: 14 October 2025 / Revised: 11 November 2025 / Accepted: 12 November 2025 / Published: 18 November 2025
(This article belongs to the Special Issue Extraction and Application Process of Bioactive Substances)

Abstract

Flourensia cernua, commonly known as hojasén, is an endemic species from northern Mexico used in herbal medicine as a remedy for various stomach and respiratory ailments. In addition to its medicinal applications, this plant has notable antioxidant potential, making it a promising area of study. A crucial aspect in plant studies is the extraction method used, as conventional approaches can diminish the bioactivities present and affect the environment. This study aims to compare two sustainable extraction techniques, ultrasound and microwave-assisted (UAE/MAE), to maximize the yield of polyphenolic compounds from F. cernua. The Taguchi L18 orthogonal array was employed to evaluate total polyphenols and to examine independent variables, such as solvent concentration, temperature, and time. Additionally, the total flavonoid content and antioxidant activity were evaluated using the radicals ABTS●+ and DPPH, and the compounds were identified using RP-HPLC-ESI-MS. The results indicated that ultrasound showed better performance in recovering total bioactive compounds, correlating with antioxidant activity. Moreover, the in vitro, hemolytic, and antihemolytic assays demonstrated that F. cernua extracts are biocompatible and exhibit significant protective activity against oxidative damage in erythrocytes, supporting their potential cytoprotective and antioxidant properties. This suggests that ultrasound-assisted extraction (UAE) is an effective method for extracting phenolic compounds from F. cernua, with potential for optimizing conditions and facilitating biotechnological and therapeutic applications.

1. Introduction

Flourensia spp. represents a group of wild plants distributed across a broad area, ranging from the southern United States to Mexico, Peru, Bolivia, and into Argentina [1,2]. The genus Flourensia includes approximately 42 species, of which at least 9 have been found in Mexico [3,4]. In the state of Coahuila, three species of this genus have been considered endemic: F. cernua, F. microphylla, and F. retinophylla [5]. Flourensia cernua, commonly known as “hojasén,” is the species that has been the subject of the most studies due to its antioxidant effects [6,7].
This plant is found in the deserts of Sonora and Chihuahua, extending into other states of Mexico such as Nuevo León, Coahuila, San Luis Potosí, and Zacatecas [6,8,9]. It has resinous, slender branches that range in color from light gray to brown, with dark green, resinous leaves. Its hanging flowers feature yellow disks, and its fruit is a fuzzy achene that can measure up to 1 cm in length, with a characteristic tar-like odor [10,11,12]. In Mexico, this plant has been used over the years, primarily by grandmothers, as a remedy in the form of tea to treat intestinal diseases such as indigestion, as well as disorders like rheumatism, venereal diseases, herpes, bronchitis, chickenpox, and the common cold [13,14,15]. Physicochemically, this species is mainly composed of polyphenolic compounds and essential oils [6,12]. The flavonoids include flavones, flavanones, and flavonols, among which are ellagic acid, catechin, quinic acid, and methyloscillate [3,5,16]. Additionally, the essential oils of Flourensia cernua are composed of sesquiterpenes, such as ledol, caryophyllene, flourensadiol, α-endemol, limonene, γ-eudesmol, myrcene, borneol, δ-3-carene, α-himachalene, and α-gurjunene, characterized by having a basic structure of 15 carbon atoms [3,5,17].
Recent research on Flourensia cernua has demonstrated significant biological activities in its extracts, mainly highlighting antioxidant activity, which is associated with anti-inflammatory, anticancer, and antidiabetic properties evaluated in vitro [6,18]. Additionally, antifungal activity has been reported against fungi such as Fusarium oxysporum, and F. cernua has inhibited Rhizopus stolonifer in ethanolic and aqueous extracts [10,19]. On the other hand, studies on F. cernua have evaluated aqueous and ethanolic extracts using different extraction methods. In recent years, two prominent technologies have been ultrasound-assisted extraction and microwave-assisted extraction. Ultrasound waves cause mechanical rupture in the cell wall, dispersing bioactive compounds. Additionally, localized heating of the solvent increases the extract’s propagation, thus improving mass transfer across the solid–liquid interface [20,21]. Microwave-assisted extraction operates through a mechanism that allows contactless heating, reducing the thermal gradient and accelerating energy transfer. This technique is used to extract flavor compounds, antioxidants, and essential oils [22]. Both extraction technologies are considered “green” due to their advantages, such as shorter extraction times and higher yields in recovering bioactive compounds [11,23]. Moreover, the optimal selection of experimental conditions is essential for maximizing the informative content of data, which in turn facilitates inference and prediction [24]. Design of Experiments (DOE) utilizes a system model to systematically choose experimental conditions or designs, thereby maximizing the informative content of observations for parameter inference [24]. The Taguchi method, on the other hand, is a robust approach designed to improve product development. It is based on orthogonal designs that allow for the estimation of the main effects and interactions of noise controls, while secondary interactions of controls are minimized [25]. This method has been recently applied in engineering, biotechnology, and biomedical fields [26]. In addition to antioxidant, antimicrobial, and anticancer activities, several studies have emphasized the importance of hemolytic and antihemolytic assays as complementary in vitro models to evaluate the biocompatibility and cytoprotective potential of plant extracts. This study aimed to quantify total hydrolysable polyphenols and total flavonoids in Flourensia cernua extracts obtained by ultrasound and microwave; assess the effects of extraction type, solvent, temperature, and time on antioxidant and antihemolytic responses under a Taguchi L18 design; and identify major constituents by RP-HPLC-ESI-MS. Overall, our findings provide a reproducible and sustainable basis to optimize bioactive recovery from F. cernua [27,28].

2. Materials and Methods

2.1. Plant Material and Characterization

Plant material of Flourensia cernua was collected during the summer in the region of General Cepeda, Coahuila, Mexico (August 2023). Leaves were dried at 50 °C for 72 h in a temperature-controlled oven and stored at room temperature until analysis. To avoid damage to wild populations, only aerial parts (leaves and tender twigs) were harvested non-destructively, without removing roots or stems, allowing continued vegetative growth and regeneration.

2.2. L18 Orthogonal Taguchi Experimental Array

This design was applied for the extraction methods to determine the conditions that would favor polyphenol extraction under the following extraction methods using ultrasound and microwave.

2.2.1. Ultrasound-Assisted Extraction (UAE)

Ultrasound-assisted extraction was performed in an ultrasonic bath (JPS-10A VEVOR) following a published methodology [29]. The bath tank measured 23.2 cm × 13.5 cm × 16 cm. Ultrasonic cavitation caused a mild temperature rise in the bath (30 to 50 °C). Dried plant powder (2.5 g) was placed in a 50 mL conical tube together with the extraction solvent according to the experimental design (Table 1). The tube containing the suspension was immersed in the bath water and sonicated for the preset extraction time. Finally, extracts were filtered through muslin cloth and stored at −20 °C until analysis.

2.2.2. Microwave-Assisted Extraction (MAE)

A microwave extraction reactor (Ethos CFR Milestone) with a maximum capacity of 170 mL and a stirring speed of 100 revolutions per minute was used. The experimental design for the MAE followed a Taguchi design, which considered three experimental factors: solvent composition (0%, 30%, and 50% ethanol in water), extraction time (5, 10, and 20 min), and temperature (30, 40, and 50 °C). In the reactor, powdered Flourensia cernua leaves were dissolved with the solvent in a ratio of 1:10 (w/v), following the experimental design presented in Table 1.

2.3. Quantification of Total Hydrolysable Polyphenols (THPs)

The total content of hydrolyzable polyphenols was determined using the Folin–Ciocalteu method, following Wong-Paz et al. [29]. The method was performed in a microplate with sample volumes of 20 µL. Then, 20 µL of Folin–Ciocalteu reagent was added and allowed to rest for 5 min. Subsequently, 20 µL of Na2CO3 (0.01 M) was added to each sample and allowed to sit for another 5 min. After that, 125 µL of distilled water was added to dilute the samples with the reagents. Finally, the samples were read at an absorbance of 790 nm using a microplate reader (Thermoscientific multiskan SkyHigh).

2.4. Quantification of Total Flavonoids (TFC)

The total flavonoid content was determined using the methodology described by Vargas-Rueda et al. [30]. A volume of 200 µL of the extracts was added to each well of the microplate. Subsequently, 75 µL of 5% sodium nitrite solution was added, and the mixture was shaken and incubated for 5 min. Afterward, 370 µL of 2% aluminum chloride solution was added, mixed again, and incubated for an additional 5 min. Finally, 500 µL of 4% sodium hydroxide solution and 500 µL of water were added to each sample. The absorbance of each sample was measured at 510 nm using a microplate reader.

2.5. Antioxidant Activity

2.5.1. ABTS●+ Radical Cation (2,2′-azino-bis(3-ethylbenzothiazoline-6-sulfonic Acid)) Assay

The antioxidant activity of the extracts obtained from Flourensia cernua using microwave and ultrasound was assessed using the ABTS●+ assay, following the method of Valero-Mendoza et al. [31]. ABTS●+ was formed by mixing a stock solution of ABTS (7 mM) with potassium persulfate (2.45 mM) in distilled water, and the mixture was kept at room temperature in the dark for 12–16 h. The assay was conducted in a microplate with a volume of 200 μL. The reaction was initiated by mixing 20 μL of the sample solution with 180 μL of diluted ABTS●+ (absorbance 0.7 at 734 nm). The decrease in absorbance was measured at 734 nm after 1 min of incubation for each well. The effect of radical scavenging was expressed as a percentage of radical scavenging activity using the following Equation (1):
A B T S + s c a v e n g i n g ( % ) = A A s A × 100
where A and As are the absorbance of the control solution and the absorbance of the sample solution, respectively.

2.5.2. Antioxidant Activity by 1,1-Diphenyl-2-Picrylhydrazyl (DPPH)

To evaluate the DPPH radical scavenging activity, a method based on that of Estrada-Gil [32] was used, with some modifications. The DPPH solution was prepared in methanol at a concentration of 60 μM, using methanol as the reading blank. In a 96-well microplate, 20 μL of each sample and 180 μL of the DPPH radical solution were added. The samples were covered and incubated for 30 min, protected from light. Subsequently, the absorbance was measured at 517 nm using a microplate spectrophotometer. The effect of DPPHradical scavenging was expressed according to the following Equation (2):
D P P H s c a v e n g i n g ( % ) = A A s A × 100
where A and As are the absorbance of the control solution and the absorbance of the sample solution, respectively.

2.6. RP-HPLC-ESI-MS Analysis

RP-HPLC-ESI-MS was used to tentatively identify secondary metabolites present in F. cernua extracts. The Varian HPLC system included an auto-sampler (Varian ProStar 410, USA), a ternary pump (Varian ProStar 230I, USA), and a PDA detector (Varian ProStar 330, USA). Additionally, a Varian 500-MS IT mass spectrometer (USA) equipped with an electrospray ionization source was used. Samples (5 µL) were injected into a Denali C18 column (150 mm × 2.1 mm, 3 µm, Grace, USA). The oven temperature was maintained at 30 °C. The eluents consisted of formic acid (0.2% v/v) in water (solvent A), which was pre-filtered through a 0.45 µm nylon membrane and degassed, and HPLC-grade acetonitrile (solvent B). The following gradient was applied: initial, 3% B; 0–5 min, linear increase to 9% B; 5–15 min, linear increase to 16% B; 15–45 min, linear increase to 50% B. The column was washed and reconditioned. The flow rate was maintained at 0.2 mL/min, and elution was monitored at 245, 280, 320, and 550 nm. The entire effluent (0.2 mL/min) was injected into the mass spectrometer source without splitting. All MS experiments were conducted in negative mode [M-H]. Nitrogen was used as the nebulizer gas, and helium served as the collision gas. Source parameters: spray voltage of 5.0 kV, a capillary voltage of 90 V, and source at 350 °C. Data were acquired with Varian MS Workstation software (v 6.9). in full-scan m/z 50–2000 [33].
Compound identification. Assignments were tentatively based on accurate mass, isotopic pattern, diagnostic MS/MS fragments, and retention behavior compared with the literature reports; no authentic standards were used in this study. Peak numbering in Table 1 and Table 2 follows the chromatographic order.

2.7. Hemolytic Activity

Ethical oversight and consent. This in vitro assay used self-donated human blood, involved minimal risk and no identifiable data, and was conducted in accordance with the guidelines of the Ethics Committee of the Facultad de Ciencias Químicas and the Declaration of Helsinki. According to institutional policy, this activity was exempt from formal ethics review. Written informed consent was obtained from the donor.
Evaluating hemolytic activity is essential to determine the biocompatibility and safety of Flourensia cernua extracts, as high therapeutic or antioxidant potential does not necessarily ensure the absence of cytotoxic effects on human erythrocytes [34]. Hemolytic activity was assessed according to the standard method, with modifications [35]. Fresh human blood was collected on the same day of the experiment from a healthy donor and anticoagulated with Alsever’s solution. The sample was then centrifuged at 3200 rpm for 5 min to remove platelets and plasma. The erythrocytes were washed three times with Alsever’s solution and resuspended at 2% hematocrit in Alsever’s for immediate use. Erythrocytes were incubated with plant extracts (0–1000 ppm) for 30 min at 37 °C. After incubation, samples were centrifuged (3200 rpm, 5 min), and supernatants were read at 540 nm using distilled water as the spectrophotometric blank. Controls were defined as follows: 0% hemolysis = erythrocytes in Alsever’s (vehicle) and 100% hemolysis = erythrocytes lysed in distilled water (hypotonic lysis.
The percentage of hemolysis (hemolysis, %) was calculated using the following Equation (3):
% H = ( A   s a m p l e A c ) ( A c + + A c ) × 100
According to ASTM F756, materials are classified as non-hemolytic (<2%), slightly hemolytic (2–5%), or hemolytic (<5%). Measurements were performed in triplicate (n = 3) and analyzed by one-way ANOVA followed by Fisher’s LSD (α = 0.05).

2.8. Antihemolytic Activity Assay

The antihemolytic activity of Flourensia cernua extracts was evaluated according to previously reported methods for assessing erythrocyte protection against oxidative and osmotic damage, with slight modifications. Fresh human blood was collected on the same day of the assay from a healthy donor and anticoagulated with Alsever’s solution. The sample was centrifuged at 3200 rpm for 5 min to remove plasma and platelets, and erythrocytes were washed three times with the same solution. A 2% erythrocyte suspension was prepared for immediate use. For the oxidative model, 500 µL of each treatment was mixed with 500 µL of hydrogen peroxide (H2O2) 3% and incubated at 37 °C for 1 h. Subsequently, 100 µL of the mixture was added to 400 µL of the erythrocyte suspension and incubated again for 1 h at 37 °C. For the osmotic model, the same procedure was followed using sodium carbonate (Na2CO3) 5% instead of hydrogen peroxide. Distilled water and Alsever’s solution were used as positive and negative controls, respectively. After incubation, the samples were centrifuged at 3500 rpm for 5 min, and 100 µL of the supernatant was transferred to a 96-well plate to measure absorbance at 540 nm [36]. The percentage of antihemolytic activity (%AH) was calculated according to the following Equation (4):
% A H = ( A b s o r b a n c e   o f   s a m p l e A b s o r b a n c e   C ) ( A b s r b a n c e   C + A b s r b a n c e   C ) × 100

2.9. Data Analysis

Data was analyzed in Minitab 19 (α = 0.05). For Taguchi L18 screening, we fitted factorial ANOVA models to test the main effects; post hoc comparisons used Fisher’s LSD. Treatment-wise 95% confidence intervals (Cls) were computed from the pooled residual variance (MSE) of the ANOVA as mean ± t0.975, df. M E n . Assumptions (normality and homoscedasticity) were checked with residual diagnostics. Given the L18 resolution, interactions were not the focus and are not interpreted beyond model diagnostics. Additional information can be found in the Supplementary Materials.

3. Results

3.1. Quantification of Total Hydrolyzable Polyphenols and Total Flavonoids

Purpose: To quantify total hydrolyzable phenolics (TPC; mg GAE/g extract) and total flavonoids (8 mg QE/g extract) across the Taguchi L18 treatments and to compare extraction methods (ultrasound vs. microwave).
TPC values were reported for each factor-level combination in the exploratory design. The Taguchi design, applicable in various biological, food, and biotechnological fields, allowed for the identification of experimental factors that had the greatest influence on the process of interest (Aranda-Ledesma et al. [23]). In Figure 1, a comparison between the two extraction methods is shown, where the ultrasound treatment exhibited the highest yield, reaching 14.80 mg of GAE extract, compared with 11.63 mg of GAE/g extract obtained by microwave extraction. This behavior was consistent with the conditions used in this study; in both methods, the greatest recovery occurred with a hydroalcoholic solvent of 50% ethanol and 50% water.
Model predictions indicated that the highest TPC would be achieved under extraction conditions using 50% ethanol and an extraction time with an extraction of 10 min. Similarly, for flavonoids, the treatments indicated that this extraction time was also appropriate.
Statistical analysis predicted that the maximum yield of hydrolyzable polyphenols would be achieved under extraction conditions using a 50% solvent, with a ratio and extraction time of 10 min. Similarly, treatments for the determination of flavonoids indicated that treatment 8 yielded the best result among the ultrasound treatments. Figure 1 displays the 18 treatments under the Taguchi L18 design; treatment 17 showed a significant difference, with 70.12 mg/g, while treatment 8 with ultrasound achieved a yield of 65 mg/g. This trend differs from the results previously obtained with hydrolyzable polyphenols.
To assess the impact of independent factors on the extraction processes using ultrasound and microwaves, we employed a screening design aimed at minimizing the extraction time while maximizing yields [37]. Contour plots helped visualize the statistically significant effects detected in the analysis of factors in the extraction of phenolic compounds present in F. cernua. For total hydrolyzable phenolics (TPC), higher responses were observed at temperatures ≥ 40 °C and times ≥ 17 min (Figure 2a); increasing the temperature toward 50 °C and extending the time further increased TPC. For total flavonoids, factor effects were weaker and did not reach statistical significance at α = 0.05 (Figure 2b). Overall, these trends delineate an operating window rather than a single optimum. Figure 2a shows the response surface for time (min) and temperature (°C); the color scale represents TPC (mg GAE/g extract).
In Figure 3a,b, the main effects of the exploratory design for F. cernua are presented. Regarding the type of extraction, a significant difference is observed between ultrasound and microwave methods, indicating that ultrasound is more effective for extracting total polyphenols. Concerning solvent concentration, an increase in ethanol–water levels at 30% and 50% was noted. However, temperature did not show significant differences for this variable. Finally, the extraction time suggests that it needs to be increased to reach an optimal point for maximizing recovery.

3.2. Antioxidant Activity

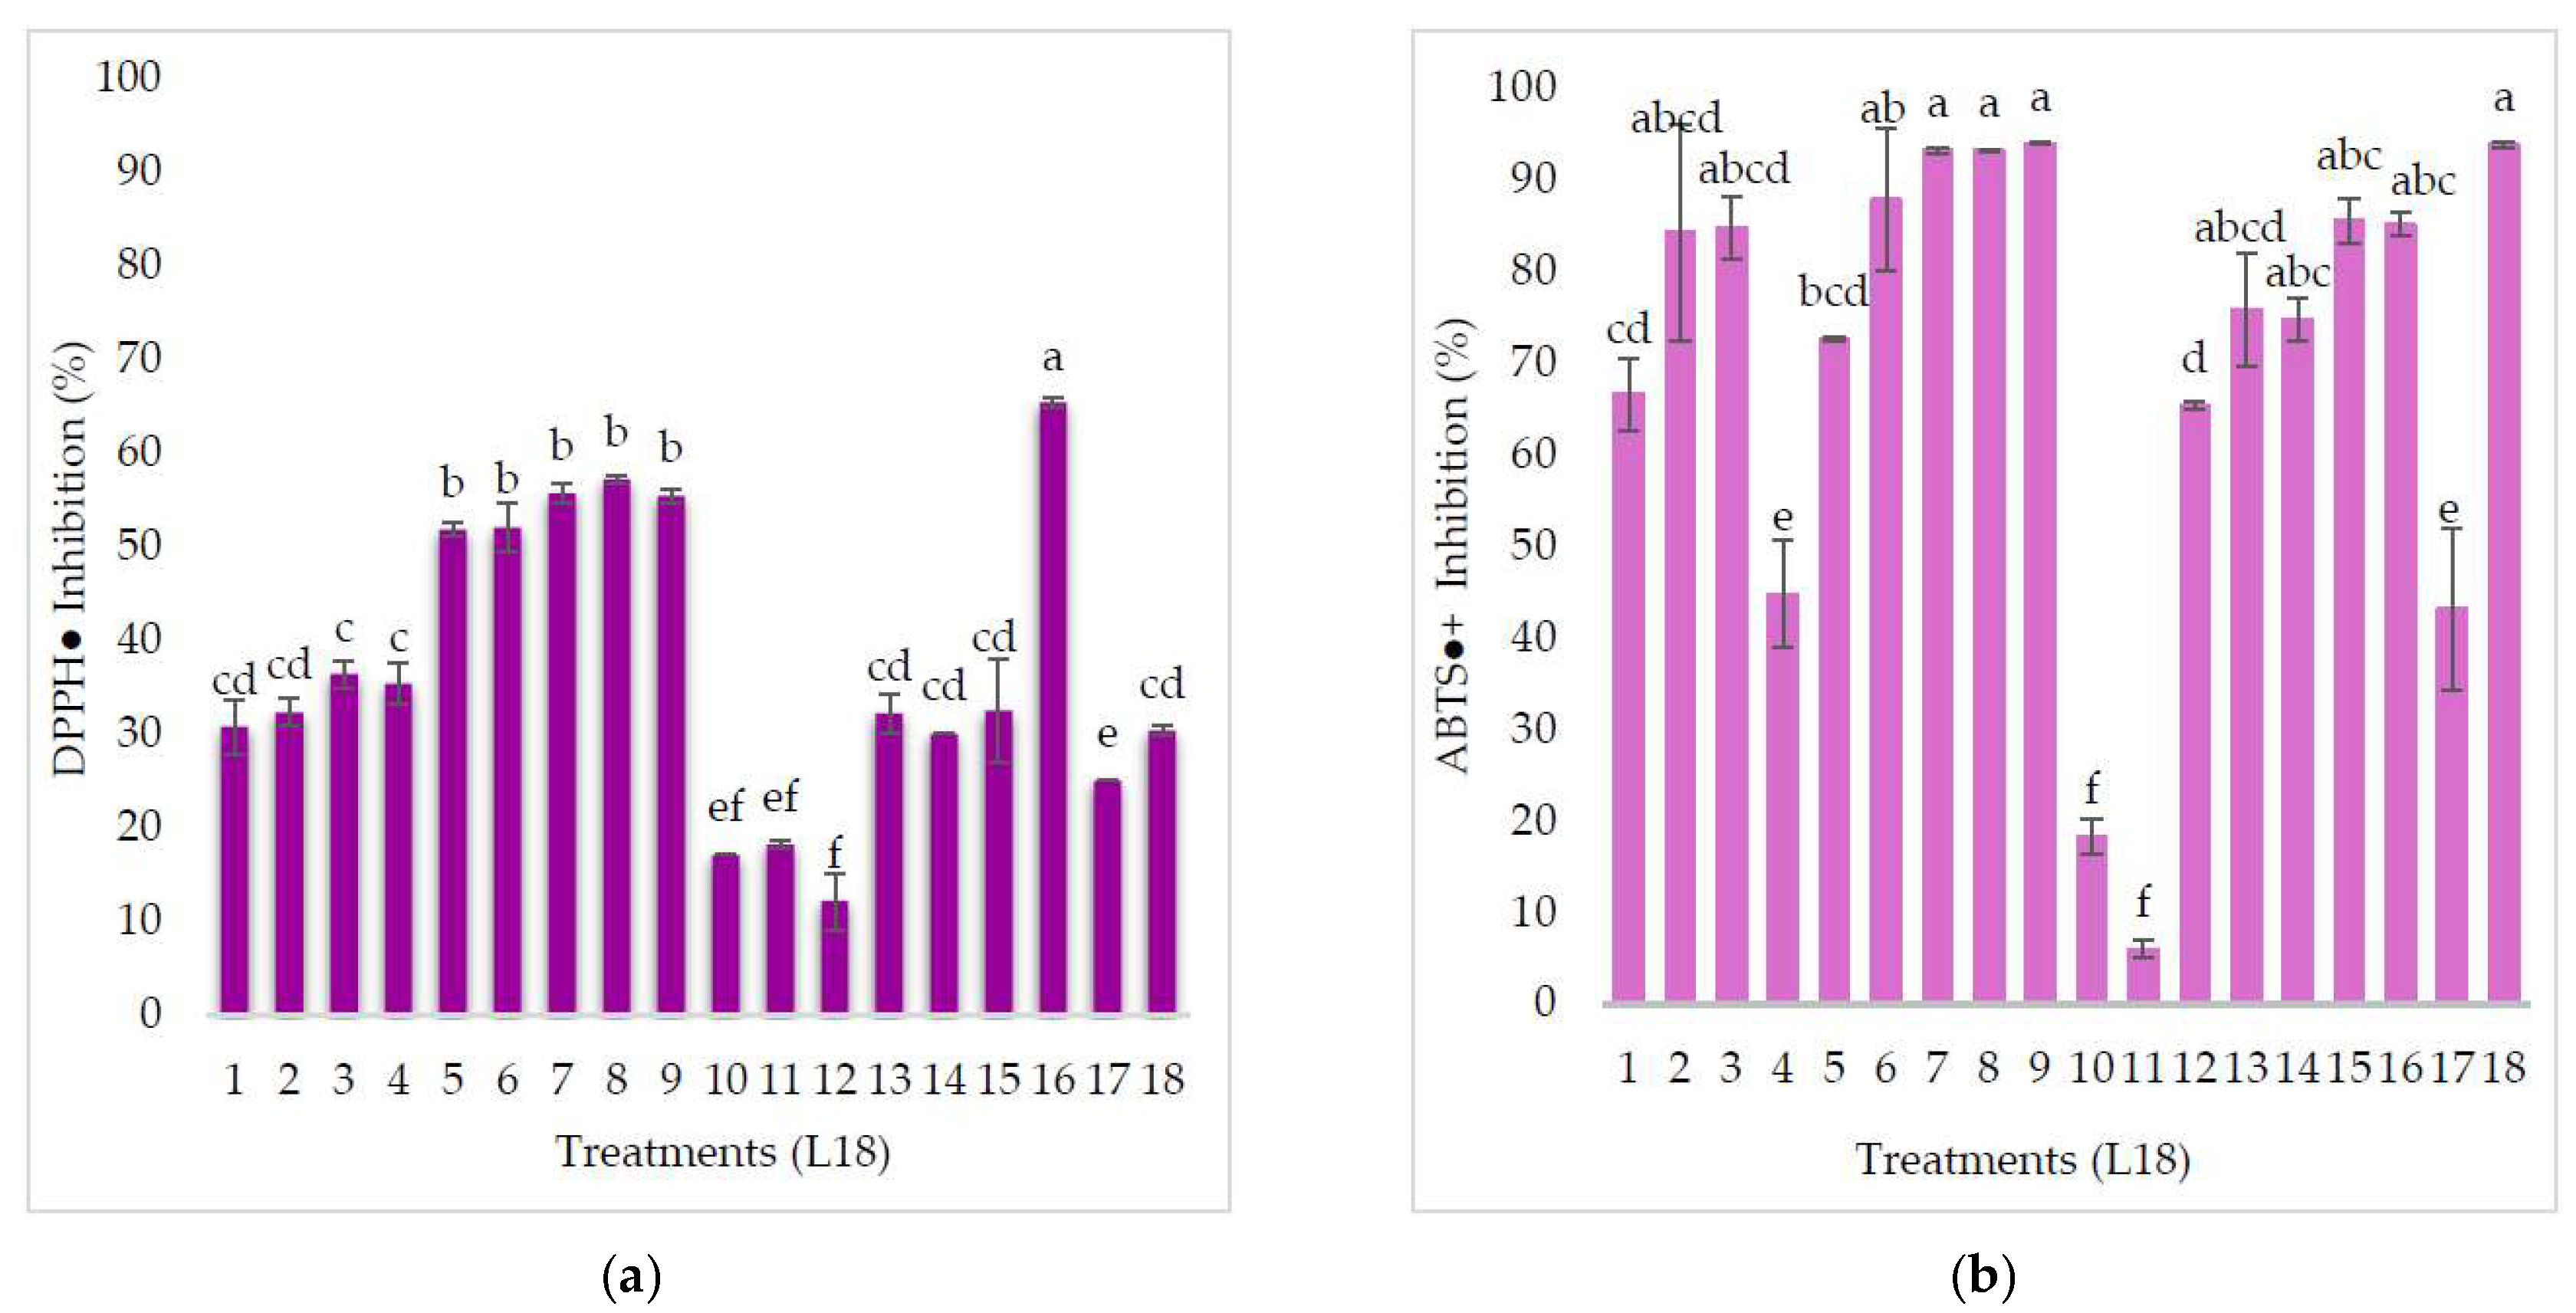
The purpose of this assay is to compare radical scavenging responses across Taguchi L18 treatment using the DPPH and ABTS●+ assays. Figure 4 shows inhibition (%) for the 18 treatments. The highest percentage of inhibition among the 18 treatments was observed for treatment 17, with an inhibition rate of 65.36% (DPPH). Conversely, when evaluating antioxidant activity using the ABTS●+ radical, a higher percentage of inhibition was recorded overall compared with the DPPH radical. Notably, treatment 1 exhibited 80% ABTS●+ inhibition, while treatment 18 demonstrated the highest ABTS●+ activity at 94%. These antioxidant activity results are broadly consistent with the content of total flavonoids and total hydrolyzable polyphenols (TPC), as the presence of these secondary metabolites can contribute to the overall antioxidant effect.
Figure 5a,b illustrate the main effects of the exploratory design of F. cernua in determining antioxidant activity. Regarding the type of extraction, a significant difference in favor of ultrasound extraction compared to microwave extraction is observed. The type of solvent also has a significant effect, like that observed in the determination of total polyphenols. In the analysis with DPPH, a linear trend indicates that the optimal solvent concentration is 50%. A similar behavior is noted in the DPPH test, although the line is less straight, suggesting that higher activity percentages were obtained in the ABTS●+ test. Concerning temperature, the DPPH test shows no significant differences, while ABTS●+ reveals a favorable trend when working at 50 °C. Finally, regarding extraction time, DPPH indicates that at least 20 min are needed to achieve significant activity in both techniques. These results can be correlated with previous findings, allowing for the selection of optimal conditions to maximize both yield and antioxidant activity.
Regarding temperature, a significant effect is observed at 50 °C; to optimize the recovery of compounds, it is essential to work at this temperature or higher. Finally, the analysis indicates that the ideal extraction time is 20 min, effectively combining the two evaluated factors. Figure 6 shows the response surface generated by the software used in the exploration design, which indicates that the best conditions for each variable were achieved through the ultrasound extraction technique. This technique, combined with a solvent concentration of 50% ethanol in water, allows for the extraction of a greater number of bioactive compounds, which in turn increases antioxidant activity. Additionally, combining a temperature of 40 °C with an extraction time of 20 min yields the optimal conditions for maximizing results, which is essential for establishing an effective starting point in the chosen extraction process.

3.3. Identification of Secondary Metabolites Present in Flourensia cernua

With the intent of identifying secondary metabolites in ethanolic leaf extracts using RP-HPLC-ESI-MS, and to compare microwave and ultrasound-assisted extraction, the chromatographic methodology was employed. The extracts of Flourensia cernua were identified by RP-HPLC-ESI-MS. Table 2 lists the compounds identified in the microwave-assisted ethanolic leaf extract (retention times and m/z with MS/MS fragments), whereas Table 3 presents those identified in ultrasound-assisted ethanolic leaf extracts. In total, fifteen compounds were identified in the leaves of F. cernua, most of which were flavonoids. Flavonoids represent the largest group of polyphenols, encompassing flavones, flavonols, flavanones, flavanols, isoflavonoids, and anthocyanidins [32,33]. These compounds exhibit relevant bioactivities in vitro and in vivo [33] (identification levels and the use of authentic standards are detailed in Methods).
It is noteworthy that, in both cases, apigenin remains the predominant compound. However, luteolin was also identified, a flavonoid that has not been frequently reported in Flourensia cernua yet possesses important biological properties, particularly regarding antioxidant activity. These results are clearly related to the analytical determination of total polyphenols and antioxidant activity conducted in this study. The abundance of phenolic compounds is associated with the high antioxidant activity observed, which has previously been compared in other studies [34].

3.4. Hemolytic Activity

Purpose: To assess the hemolytic effect of F. cernua extracts on human erythrocytes across the tested concentration range.
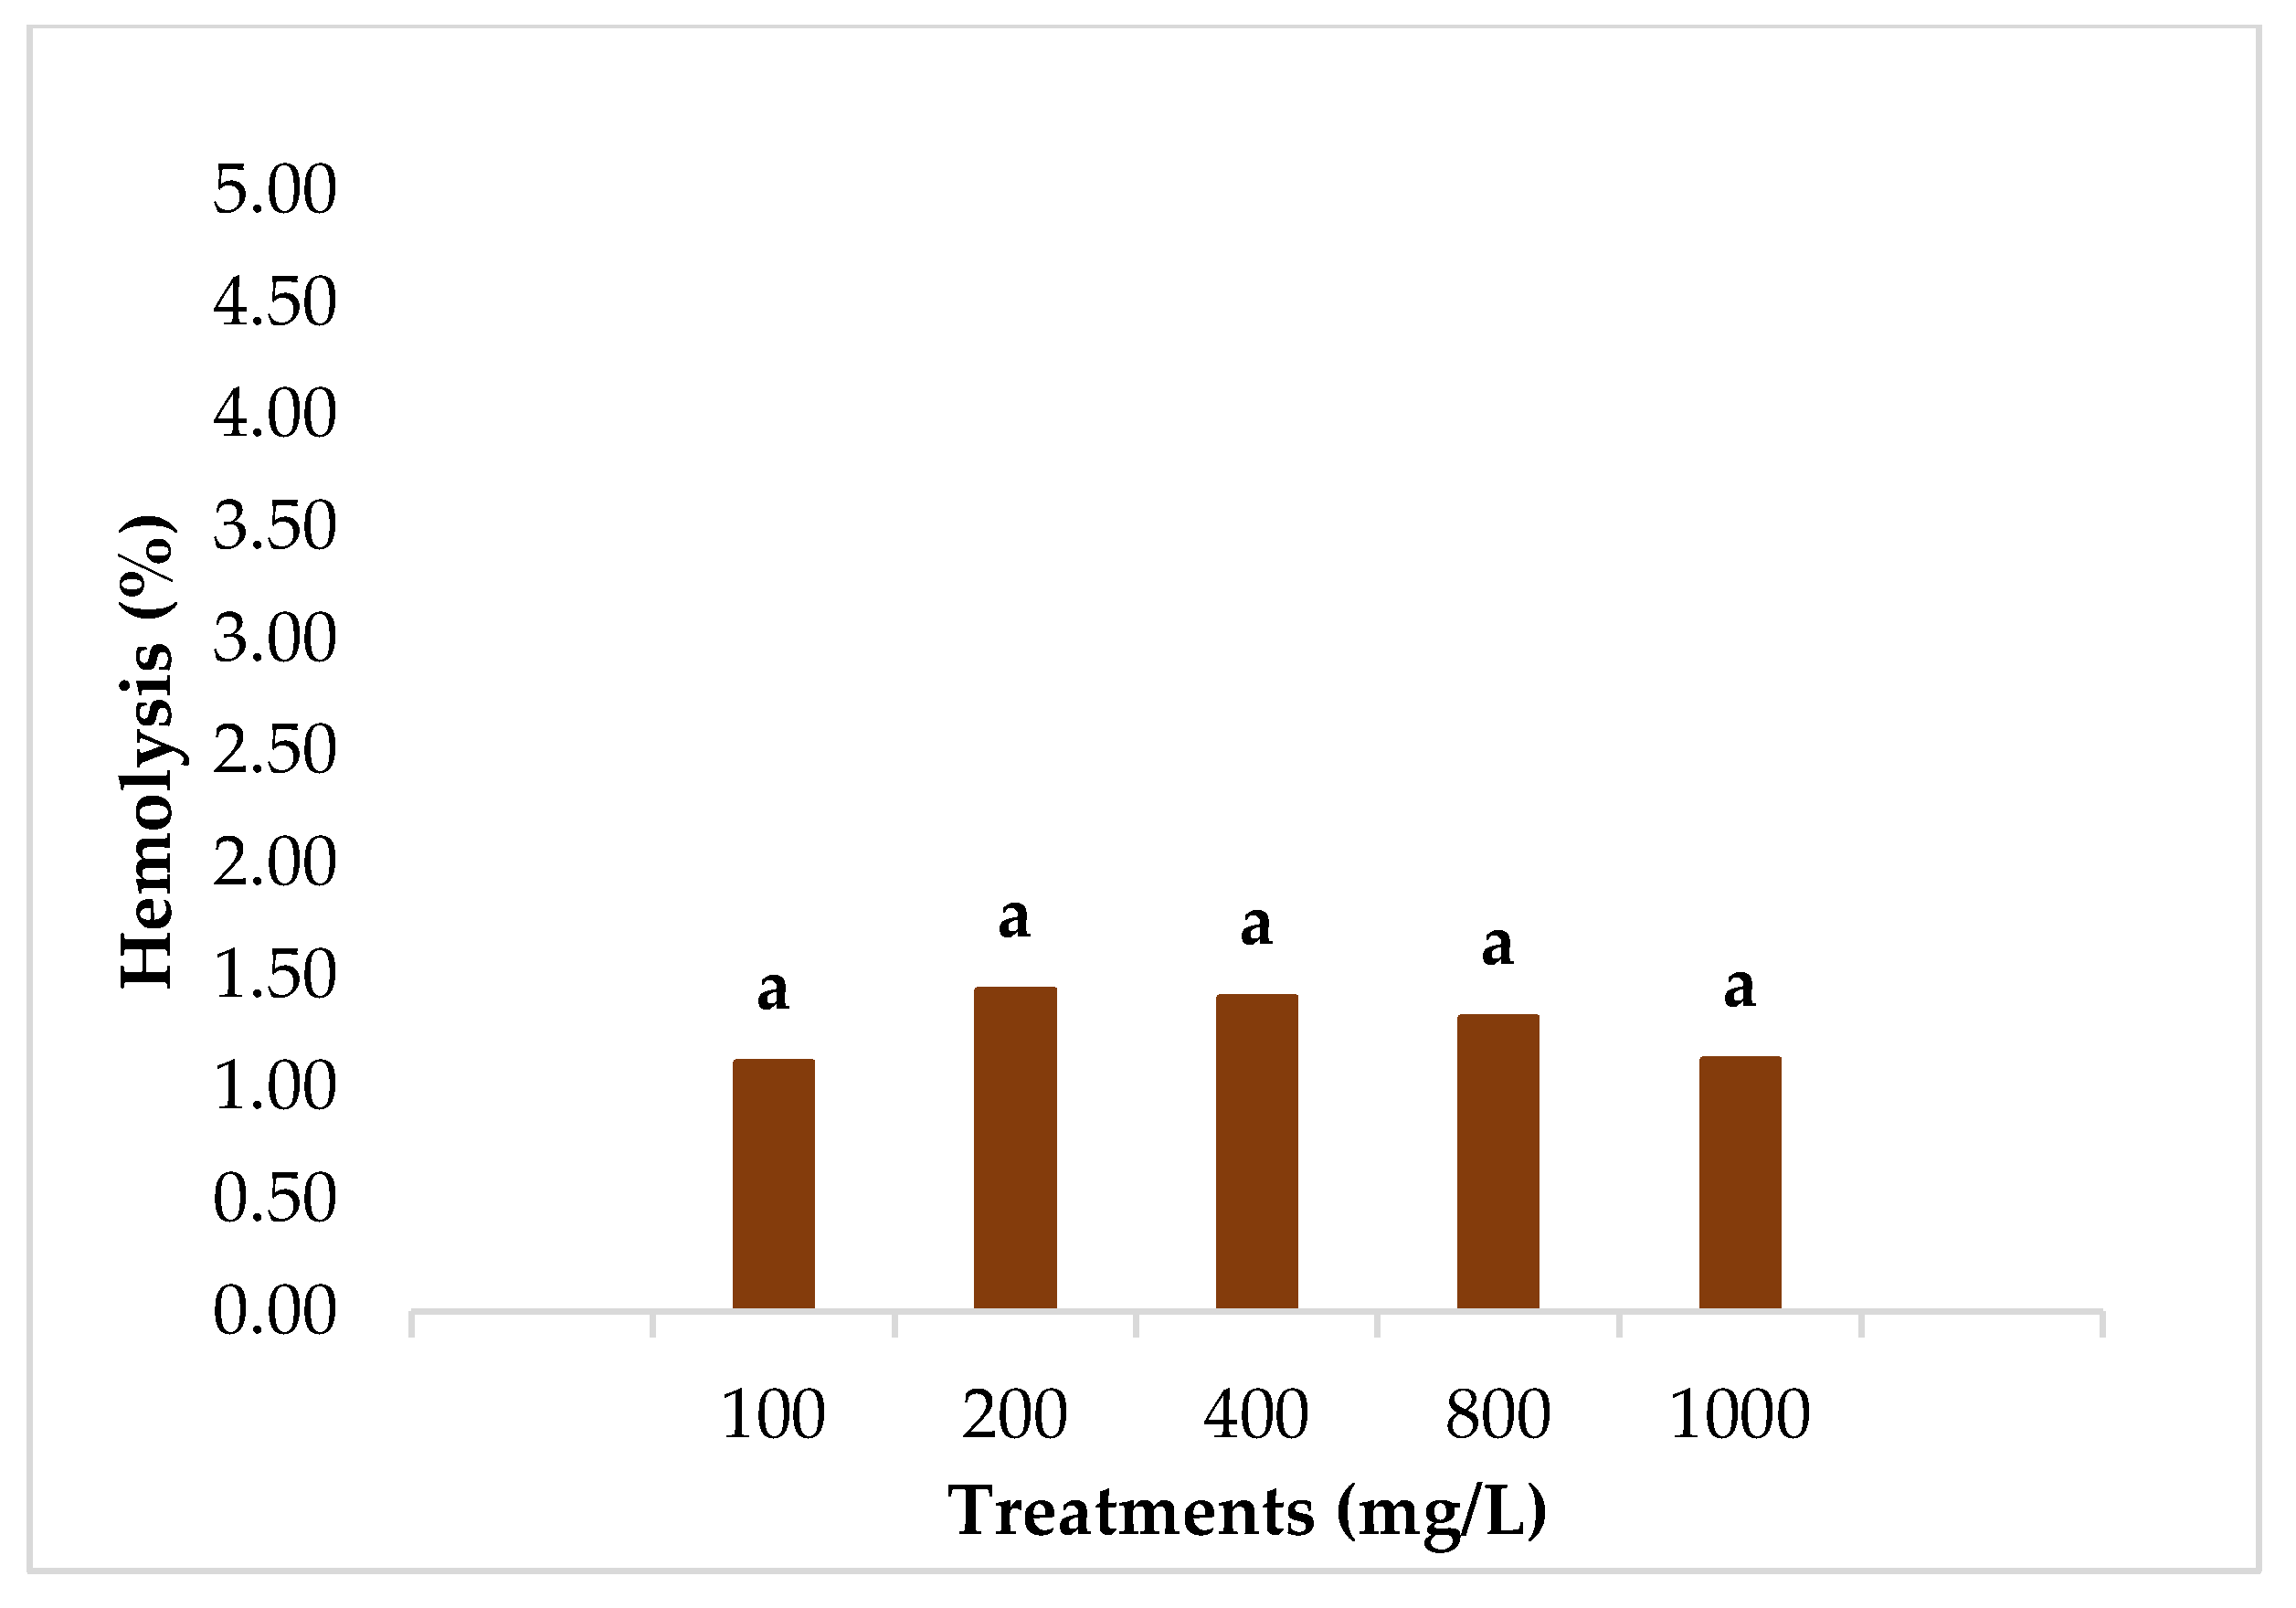
Flourensia cernua is a plant commonly used in traditional herbal medicine to alleviate gastrointestinal discomfort; however, further research is needed to establish the concentration thresholds at which its extracts may exert toxic effects. Figure 7 shows the percentage of hemolysis of human erythrocytes treated with different extract concentrations. The hemolysis values remained below 5%, indicating that the extracts did not cause significant membrane damage and can be considered non-hemolytic under the tested conditions. Four of the five treatments were statistically similar according to Fisher’s test, confirming the extract’s biocompatibility within the evaluated concentration range.

3.5. Antihemolytic Activity

Additionally, the antihemolytic activity of the extracts was evaluated against hemolytic agents such as sodium carbonate (Na2CO3) and hydrogen peroxide (H2O2) to determine their protective capacity on erythrocytes. As shown in Figure 8, F. cernua exhibited protective effects greater than 80% under Na2CO3 treatment and above 100% against H2O2-induced hemolysis. These values demonstrate a remarkable protective effect, particularly against oxidative damage induced by peroxide, likely associated with the antioxidant capacity previously confirmed through DPPH and ABTS assays. According to Fisher’s test, significant differences were observed between both hemolytic agents, with higher protection against oxidative stress caused by free radicals.

4. Discussion

4.1. Total Hydrolyzable Phenols and Flavonoids

The factors evaluated in this study are crucial for maximizing the recovery of phenolic bioactives from F. cernua. Among them, solvent composition was the primary driver. Using water and 50% ethanol as extraction media, the best results for both ultrasound-assisted extraction (UAE) and microwave-assisted extraction (MAE) were consistently obtained with the hydroalcoholic extract, in line with previous observations for F. cernua and other botanicals [38,39,40,41,42,43,44]. This behavior reflects the complementary roles of the binary solvent system: water promotes tissue swelling and enhances the hydration of cell walls, thereby facilitating the diffusion of solutes, while ethanol, owing to its medium polarity, broadens the solvation window toward moderately polar and some less polar phenolics, weakening solute matrix interactions and improving mass transfer [23,37,38]. As a result, ethanol–water mixtures often display a synergistic effect on polyphenol recovery compared with either solvent alone [38]. These patterns also help contextualize the literature variability. For example, Wong-Paz et al. [29] reported lower values for hydrolyzable polyphenols by UAE (~3.0 mg/g), which can reasonably be attributed to factors such as harvesting season and concomitant variation in native phenolic profiles, in addition to differences in matrix pretreatment, particle size, and solvent formulation. Within this solvent framework, our data indicate that temperature exerted a nonlinear, technique-dependent influence. When the process was constrained below ~40 °C, yields decreased consistently with limited solubility at lower temperatures, whereas increasing the temperature beyond that threshold tended to plateau rather than deliver proportional gains. Importantly, excessive heating can compromise recovery by distinct mechanisms in UAE versus MAE: in UAE, higher bulk temperatures elevate vapor pressure within cavitation nuclei, dampening bubble collapse intensity and thus the mechanical disruption that drives cell wall rupture and solvent penetration; in MAE, dielectric heating accelerates extraction but can, at sufficiently high temperatures, promote thermal oxidative degradation of labile phenolics and undesirable solvent loss [23]. In agreement with Aranda-Ledesma [23], microwave-driven processes at temperatures above ~60 °C showed diminished returns, underlining the need to balance kinetic acceleration with compound stability. Time was likewise decisive. Under our conditions, UAE achieved higher yields at ~20 min, whereas MAE produced substantial recovery in ~5 min, reflecting the more rapid energy deposition and solvent matrix heating inherent to microwaves. Extending the microwave process to 30 min, as reported by Arand- Ledesma et al. [23], further increased yields in that study, consistent with the notion that the majority of recoveries accrue within the first 25–30 min under optimized mass transfer regimes [23,40]. Nevertheless, time optimization should explicitly weigh the marginal gains in yield against energy input and operating costs, especially for scale-up, as highlighted by other authors [29]. Taken together, these results support a practical extraction envelope for F. cernua in which a 50% ethanol–water solvent maximizes the polarity match and matrix swelling needed for broad phenolic coverage [37,43]; temperature is tuned to enhance diffusivity without undermining cavitation efficacy (UAE) or inducing thermal degradation [23]; and extraction time is set near the window where mass transfer benefits asymptotically approach a plateau (~20 min for UAE and ≤ 5–30 min for MAE depending on power temperature), thereby minimizing energy cost per unit yield [23,29,40].

4.2. Antioxidant Activity

Antioxidant activity is among the most investigated bioactivities in plant extracts because diverse secondary metabolites quench reactive species and mitigate cellular alterations; the complexity of oxidative processes in plants further shapes this response [23]; an aqueous extraction of Flourensia cernua leaves at 60 °C for 2 h under stirring showed that, under those conditions, ABTS●+ outperformed DPPH, supporting the predominant role of phenolics in this species [29]. Consistently, Aranda-Ledesma [17] reported high ABTS●+ inhibition in aqueous extracts of F. cernua.
In our study, the inhibition profiles followed a similar trend in both assays (Figure 4a, DPPH at 517nm, and Figure 4b, ABTS), with higher responses in complex matrices due to their greater reactivity with both hydrophilic and lipophilic antioxidants and sensitivity to reducing agents [40,41,42]; in F. cernua, total reducing sugars may contribute to ABTS●+ signals [40,42,44]. By contrast, DPPH shows steric hindrance and slower kinetics toward certain antioxidants, so it does not always mirror ABTS●+ magnitudes [41,42,45]. Accordingly, we report % inhibition at a fixed concentration and refer comparisons directly to the figures, avoiding metrics not determined in this work.
Between-treatment differences reflect the phenolic composition and processing. Water–ethanol (50%) enhances phenolic recovery via a synergistic mechanism, matrix swelling (water), plus disruption of solute matrix bonding improves mass transfer (ethanol) [41,42]. Variability across studies also arises from the diversity of phenolic structures and the position of OH groups, which control the reaction pathway involved [38,40]. Overall, our results support that the chosen operating window (50% solvent, moderate conditions, and processing scheme) aligns with a higher antioxidant response.
One of the most extensively studied bioactivities in plant extracts is the antioxidant activity. This interest stems from the wide variety of plants that contain different secondary metabolites, which confer this important biological function, helping to counteract various cellular alterations. The complexity of oxidation processes in plant organisms plays a significant role in this activity [23]. In a study conducted by Alvarez-Pérez et al. [6], aqueous extraction of Flourensia cernua leaves was performed by subjecting them to a temperature of 60 °C for 2 h with constant stirring. This procedure resulted in inhibition percentages of 85.82% for DPPH and 58.15% for ABTS●+. These results support the idea that phenolic compounds significantly contribute to the antioxidant and free radical activity of extracts from this plant [29].
The findings of this study are like those reported by Aranda-Ledesma et al. [17], who achieved an inhibition value of 76.30% with ABTS●+ in aqueous extracts of F. cernua leaves. As shown in this analysis, ABTS●+ exhibits higher activity compared to the DPPH radical. This can be attributed to the sensitivity of the ABTS●+radical, which reacts more readily with hydrophilic and lipophilic compounds [40,42], as well as with reducing agents [41], such as total and reducing sugars present in F. cernua [40,42]. In contrast, the DPPH radical primarily reacts with hydrophilic compounds, such as gallic acid [42,45].

4.3. Identification of Secondary Metabolites Present in Flourensia cernua

The major compounds identified were apigenin glucoside and caffeic acid, both known for their significant biological activities in various plants. According to Álvarez-Pérez et al. [6], apigenin stands out as the predominant compound in the characterization of F. cernua. Among flavonoids, apigenin (4′,5,7-trihydroxyflavone) is one of the most widely distributed compounds in vegetables and fruits and is also one of the most studied. Apigenin can occur in glycosylated forms, and its glycosylation state can interfere with metabolism in various ways, thereby affecting its antioxidant potential and bioactivities [46,47]. Aguirre-García et al. [11], through HPLC-MS characterization, identified the main polyphenolic compounds as apigenin arabinoside glucose (25.69%), 1,3-dicaffeoylquinic acid, 1-caffeoylquinic acid, and 4′-O-glucuronide of jaceidin (17.56%), as well as 1,5-dicaffeoylquinic acid and 3-caffeoylquinic acid (11.52%). Other significant compounds include 6,8-di-C-glucoside of apigenin (7.64%) and apigenin (6.36%). These findings are consistent with the results of this study, confirming the presence of apigenin in its glycosylated form as the predominant compound. Numerous studies have elucidated the potential effect of apigenin in pharmacological and nutraceutical activities, highlighting its significant antioxidant activity, which positions it as a possible therapeutic agent in inflammatory processes related to various diseases, including several types of cancer, autoimmune diseases, and neurodegenerative disorders [33]. According to Álvarez-Pérez et al. [6], luteolin was identified as one of the main compounds in an aqueous extract, although this is unusual, as the leaf composition typically does not reveal this compound. This discrepancy is attributed to the time and method of extraction of phytocompounds. Like apigenin, luteolin has demonstrated anti-inflammatory effects in both in vitro and in vivo studies [45].
This study reinforces previous findings indicating that the largest proportion of phytochemical compounds present in F. cernua are flavonoids, known to be natural antioxidants with potent anticancer effects both in vitro and in vivo, making them ideal candidates for applications in the nutraceutical or pharmaceutical fields [46].

4.4. Hemolytic Activity and Antihemolytic

According to the ASTM F756-17 (2025) standard Practice for Assessment of Hemolytic Properties of Materials [48], a material is considered non-hemolytic when the hemolysis percentage is below 2%, slightly hemolytic between 2% and 5%, and hemolytic when it exceeds 5%. In this context, the hemolytic evaluation of Flourensia cernua revealed percentages below 5%, suggesting adequate biocompatibility with erythrocyte cells. This behavior is consistent with reports for various plant extracts exhibiting low cytotoxic potential and protective effects on human erythrocytes [27,28]. The absence of significant hemolysis indicates that the compounds present in the extracts do not affect the integrity of the lipid bilayer, which is relevant considering that erythrocytes possess a high concentration of polyunsaturated fatty acids susceptible to lipid peroxidation, and hemoglobin is a constant source of reactive oxygen species [28].
Regarding the antihemolytic assay, F. cernua demonstrated a marked protective capacity against damage induced by sodium carbonate and hydrogen peroxide, with both values exceeding 80% and 100%, respectively.
This effect suggests that the phenolic metabolites of the extract may act as antioxidant and membrane-stabilizing agents, neutralizing reactive species and preventing erythrocyte rupture [49,50,51]. Previous studies have shown that flavonoids (Table 2), present in F. cernua extracts, possess strong antihemolytic activity by inhibiting lipid peroxidation through their free radical scavenging capacity [28,52,53].
The higher efficacy observed against hydrogen peroxide can be explained by the direct relationship between oxidative stress and the generation of hydroxyl radicals, which promote the abstraction of hydrogen atoms from membrane lipids and ultimately lead to cell lysis. The inhibition of this process by F. cernua extracts suggests an antioxidant action like that described in ethanolic or ethyl acetate extracts rich in polyphenols, where radical elimination and reducing power follow a dose-dependent pattern [52]. Comparable results have been reported for species of the genera Origanum, Lavandula, and Ocimum, whose aqueous extracts exhibited protective effects of up to 270% against AAPH-induced hemolysis, attributed to their high phenolic compound and condensed tannin contents [52]. Similarly, hydroalcoholic extracts of Rhamnus alaternus achieved nearly 100% inhibition of hemolysis induced by AAPH-generated radicals, with the bark fraction being more effective than the leaf fraction, demonstrating that solvent polarity and plant tissue type significantly influence the recovery of bioactive compounds [27].
The behavior observed for F. cernua also aligns with studies on the essential oils of Curcuma longa and Salvia officinalis, where a significant reduction in oxidative stress markers such as malondialdehyde, catalase, and glutathione was reported, along with decreased extracellular hemoglobin and lactate dehydrogenase levels, evidencing a protective effect against induced hemolysis [28]. In this regard, the high antihemolytic activity of Flourensia cernua extract may be attributed to the synergistic action of its phenolic compounds, mainly flavonoids The effects are associated with the phenolic compounds listed in Table 1 and Table 2, which act as free radical scavengers, metal chelators, and modulators of membrane permeability.
Overall, these results support that F. cernua is not only safe within the analyzed concentration range but also exhibits a remarkable cytoprotective potential against oxidative damage in erythrocytes, consistent with its high antioxidant capacity demonstrated by DPPH and ABTS assays. Further complementary studies are recommended to identify specific active metabolites and to validate hemocompatibility effects in vivo.

5. Conclusions

The results of this study demonstrate that ultrasound-assisted extraction is the most effective technology for recovering polyphenolic compounds from Flourensia cernua. Using the Taguchi L18 design, the optimal conditions were identified as 40 °C, 20 min, and 50% ethanol concentration. Under these conditions, ultrasound extraction achieved the highest total phenolic content, which correlated strongly with antioxidant activity, as assessed by ABTS●+ and DPPH assays. Compared to microwave-assisted extraction, ultrasound extraction not only maximized the yield of bioactive compounds but also preserved the antioxidant properties more effectively, highlighting its suitability as a green and efficient method.
Furthermore, the in vitro hemolytic and antihemolytic assays confirmed the biocompatibility of F. cernua extracts and their significant protective effect against oxidative damage in erythrocytes. These results indicate that the bioactive compounds obtained under optimal ultrasound conditions not only possess antioxidant potential but also contribute to cytoprotective activity. Overall, ultrasound extraction represents a sustainable and reliable alternative for obtaining functional compounds from Flourensia cernua for pharmaceutical, nutraceutical, and biotechnological applications.

Supplementary Materials

The following supporting information can be downloaded at: https://www.mdpi.com/article/10.3390/pr13113725/s1, Table S1a. TPC (mg GAE/g extract) one way ANOVA across Taguchi L 18 treatments. Table S1b. TPC main effects coefficients for solvent (%EtOH), Temperature (°C), and Time (min). Table S2a TFC (mg QE/g extract) one way ANOVA across Taguchi L18. Table S2b TFC main effects coefficients for solvent (% EtOH), Temperature (°C), and Time (min). Table S3a. DPPH radical scavenging activity one way ANOVA across L18 Taguchi treatments. Table S3b. DPPH main effects coefficients for solvent (% EtOH), Temperature (°C), and Time (min). Table S4a. ABTS radical cation scavenging activity one way ANOVA across 18 Taguchi. Table S4b. ABTS main effects coefficients for Solvent (% EtOH), Temperature (°C), and Time (min).

Author Contributions

Conceptualization, A.G.V.-M. and M.A.M.-M.; methodology, A.G.V.-M. and M.G.S.; formal analysis, L.J.R.-G., J.A.A.-V. and A.N.; investigation, A.G.V.-M. and A.Z.-C.; resources, L.J.R.-G., M.C.-R. and M.A.M.-M.; writing—original draft preparation, A.G.V.-M. and M.A.M.-M.; writing—review and editing, M.C.-R. and M.A.M.-M.; supervision, A.Z.-C., A.N., M.G.S., J.A.A.-V., M.C.-R., T.K.M.-M. and M.A.M.-M.; project administration, L.J.R.-G. and M.A.M.-M. All authors have read and agreed to the published version of the manuscript.

Funding

This research received no external funding.

Data Availability Statement

Data available upon request.

Acknowledgments

The first author would like to thank the National Council of Humanities, Sciences and Technologies for the scholarship granted.

Conflicts of Interest

The authors declare no conflicts of interest.

References

  1. Estrada-Castillón, E.; Villarreal-Quintanilla, J.Á.; Encina-Domínguez, J.A.; Jurado-Ybarra, E.; Cuéllar-Rodríguez, L.G.; Garza-Zambrano, P.; Arévalo-Sierra, J.R.; Cantú-Ayala, C.M.; Himmelsbach, W.; Salinas-Rodríguez, M.M.; et al. Ethnobotanical biocultural diversity by rural communities in the Cuatrociénegas Valley, Coahuila, Mexico. J. Ethnobiol. Ethnomed. 2021, 17, 21. [Google Scholar] [CrossRef] [PubMed]
  2. Dávila-Rangel, I.E.; Charles-Rodríguez, A.V.; López-Romero, J.C.; Flores-López, M.L. Plants from Arid and Semi-Arid Zones of Mexico Used to Treat Respiratory Diseases: A Review. Plants 2024, 13, 792. [Google Scholar] [CrossRef] [PubMed]
  3. Ríos, M.Y. Chemistry and biology of the genus Flourensia (Asteraceae). Chem. Biodivers. 2015, 12, 1595–1634. [Google Scholar] [CrossRef] [PubMed]
  4. De Rodríguez, D.J.; Puente-Romero, G.N.; Díaz-Jiménez, L.; Rodríguez-García, R.; Ramírez-Rodríguez, H.; Villarreal-Quintanilla, J.A.; Flores-López, M.L.; Carrillo-Lomelí, D.A.; Genisheva, Z.A. In Vitro Gastrointestinal Digestion of Microencapsulated Extracts of Flourensia cernua, F. microphylla and F. retinophylla. Ind. Crops Prod. 2019, 138, 111482. [Google Scholar] [CrossRef]
  5. Linares-Braham, A.; Palomo-Ligas, L.; Nery-Flores, S.D. Bioactive Compounds and Pharmacological Potential of Hojasen (Flourensia cernua): A Mini Review. Plant Sci. Today 2023, 10, 304–312. [Google Scholar] [CrossRef]
  6. Álvarez-Pérez, O.B.; Ventura-Sobrevilla, J.M.; Ascacio-Valdés, J.A.; Rojas, R.; Verma, D.K.; Aguilar, C.N. Valorization of Flourensia cernua DC as Source of Antioxidants and Antifungal Bioactives. Ind. Crops Prod. 2020, 152, 112422. [Google Scholar] [CrossRef]
  7. Jasso de Rodríguez, D.; Salas-Méndez, E.J.; Rodríguez-García, R.; Hernández-Castillo, F.D.; Díaz-Jiménez, M.L.; Sáenz-Galindo, A.; González-Morale, S.; Flores-López, M.L.; Villarreal-Quintanilla, J.A.; Peña-Ramos, F.M.; et al. Antifungal activity in vitro of ethanol and aqueous extracts of leaves and branches of Flourensia spp. against postharvest fungi. Ind. Crops Prod. 2017, 107, 499–508. [Google Scholar] [CrossRef]
  8. De Rodríguez, D.J.; Angulo-Sánchez, J.L.; Hernández-Castillo, F.D. An overview of the antimicrobial properties of Mexican medicinal plants. In Advances in Phytomedicine, 3rd ed.; Elsevier: Amsterdam, The Netherlands, 2006; pp. 325–377. [Google Scholar] [CrossRef]
  9. Ruiz-Martínez, J.; Aguirre-Joya, J.A.; Rojas, R.; Vicente, A.; Aguilar-González, M.A.; Rodríguez-Herrera, R.; Alvarez-Perez, O.B.; Torres-León, C.; Aguilar, C.N. Candelilla wax edible coating with Flourensia cernua bioactives to prolong the quality of tomato fruits. Foods 2020, 9, 1303. [Google Scholar] [CrossRef]
  10. Jasso de Rodríguez, D.; Hernández-Castillo, D.; Angulo-Sánchez, J.L.; Rodríguez-García, R.; Villarreal-Quintanilla, J.A.; Lira-Saldivar, R.H. Antifungal activity in vitro of Flourensia spp. extracts on Alternaria sp., Rhizoctonia solani and Fusarium oxysporum. Ind Crops Prod. 2007, 25, 111–116. [Google Scholar] [CrossRef]
  11. Aguirre-García, Y.L.; Castillo-Manzanares, A.; Palomo-Ligas, L.; Ascacio-Valdés, J.A.; Campos-Múzquiz, L.G.; Esparza-González, S.C.; Rodríguez-Herrera, R.; Nery-Flores, S.D. Toxicity evaluation of a polyphenolic extract from Flourensia cernua DC through Artemia lethality assay, hemolytic activity, and acute oral test. J. Toxicol. 2024, 2024, 2970470. [Google Scholar] [CrossRef]
  12. Peralta Bello, J.E. Evaluación de la Actividad de Extractos de Hojasén Flourensia cernua D.C. in vitro en el Control de las Bacterias Fitopatógenas: Xanthomonas campestris pv. phaseoli (Smith) Dye, Erwinia carotovora pv. atroseptica (Van Hall) Dye y Pseudomonas cichorii (Swingle) Stapp. Bachelor’s Thesis, Universidad Autónoma Agraria Antonio Narro, Saltillo, Coahuila, México, 2006. [Google Scholar]
  13. Zavala, C.D.; Carrillo, I.M.L.; Alvarado, S.B.; Sánchez, C.H.A.O. Evaluación de la toxicidad aguda de un extracto alcohólico de hojas de hojasén (Flourensia cernua). Rev. Mex. Cienc. Farm. 2010, 41, 50–54. Available online: https://www.redalyc.org/pdf/579/57916078007.pdf (accessed on 10 November 2025).
  14. De León-Zapata, M.A.; Sáenz-Galindo, A.; Rojas-Molina, R.; Rodríguez-Herrera, R.; Jasso-Cantú, D.; Aguilar, C.N. Edible candelilla wax coating with fermented extract of tarbush improves the shelf life and quality of apples. Food Packag. Shelf Life 2015, 3, 70–75. [Google Scholar] [CrossRef]
  15. Ganchev, D. Antisporulation action of tarbush plant (Flourensia cernua) towards conidiospores of plant pathogens. Malays. J. Sustain. Agric. 2022, 6, 81–84. [Google Scholar] [CrossRef]
  16. Mata, R.; Bye, R.; Linares, E.; Macías, M.; Rivero-Cruz, I.; Pérez, O.; Timmermann, B.N. Phytotoxic compounds from Flourensia cernua. Phytochemistry 2003, 64, 285–291. [Google Scholar] [CrossRef]
  17. Aranda-Ledesma, N.E.; González-Hernández, M.D.; Rojas, R.; Paz-González, A.D.; Rivera, G.; Luna-Sosa, B.; Martínez-Ávila, G.C.G. Essential oil and polyphenolic compounds of Flourensia cernua leaves: Chemical profiling and functional properties. Agronomy 2022, 12, 2274. [Google Scholar] [CrossRef]
  18. Silva, G.C.C.; Machado, M.A.; Sakumoto, K.; Inumaro, R.S.; Gonçalves, J.E.; Mandim, F.; Vaz, J.; do Valle, J.S.; Faria, M.G.I.; Ruiz, S.P.; et al. Cellular antioxidant, anti-inflammatory, and antiproliferative activities from the flowers, leaves and fruits of Gallesia integrifolia Spreng. Harms. Molecules 2023, 28, 5406. [Google Scholar] [CrossRef]
  19. López-Benítez, A.; López-Betancourt, S.R.; Vázquez-Badillo, M.E.; Rodríguez-Herrera, S.A. Inhibición del crecimiento micelial de Fusarium oxysporum Schlechtend. f. sp. lycopersici (Sacc.) Snyder y Hanses, Rhizoctonia solani Kühn y Verticillium dahliae Kleb. Rev. Mex. Fitopatol. 2005, 23, 183–190. Available online: https://www.redalyc.org/pdf/612/61223212.pdf (accessed on 10 November 2025).
  20. Pérez-Gutiérrez, R.M.; Martínez-Jerónimo, F.F.; Contreras-Soto, J.G.; Muñiz-Ramírez, A.; Estrella-Mendoza, M.F. Optimization of Ultrasonic-Assisted Extraction of Polyphenols from a Polyherbal Formulation of Cinnamomum verum, Origanum majorana, and Origanum vulgare and Their Antidiabetic Capacity in Zebrafish (Danio rerio). Heliyon 2022, 8, e08682. [Google Scholar] [CrossRef]
  21. Rojas, T.; Gómez, S.; Fuentes-Campos, M.E.; Contreras-López, E.; Muñoz-Jáuregui, A.M. Extracción asistida por ultrasonido de compuestos fenólicos de la cáscara de Sanky (Corryocactus brevistylus). Rev. Soc. Quím. Perú 2018, 85, 258–267. [Google Scholar] [CrossRef]
  22. Arya, P.; Kumar, P. Comparison of Ultrasound and Microwave-Assisted Extraction of Diosgenin from Trigonella foenum-graecum Seed. Ultrason. Sonochem. 2021, 74, 105572. [Google Scholar] [CrossRef]
  23. Aranda-Ledesma, N.E.; Aguilar-Zárate, P.; Bautista-Hernández, I.; Rojas, R.; Robledo-Jiménez, C.L.; Martínez-Ávila, G.C.G. Optimization of Ultrasound-Assisted Extraction for Bioactive Compounds from Flourensia cernua and Jatropha dioica and Evaluation of Their Functional Properties. Horticulturae 2024, 10, 709. [Google Scholar] [CrossRef]
  24. Montgomery, D.C. Design and Analysis of Experiments, 9th ed.; John Wiley & Sons: New York, NY, USA, 2017; Available online: https://books.google.com.mx/books?id=Py7bDgAAQBAJ (accessed on 10 November 2025).
  25. Naranjo-Palacios, F.; Ríos-Lira, A.J.; Pantoja-Pacheco, Y.V.; Tapia-Esquivias, M. Diseños ortogonales de Taguchi fraccionados. Ing. Investig. Tecnol. 2020, 21, 1–12. [Google Scholar] [CrossRef]
  26. Kurata, K.; Shimada, K.; Takamatsu, H. Application of the Taguchi Method to Explore a Robust Condition of Tumor-Treating Field Treatment. PLoS ONE 2022, 17, e0262133. [Google Scholar] [CrossRef] [PubMed]
  27. Kherbachi, S.; Kheniche, M.; Tacherfiout, M. Antihemolytic Activity of Hydroalcoholic Leaves and Bark Extracts from Rhamnus alaternus against AAPH-Induced Hemolysis on Human Erythrocytes. Int. J. Plant Based Pharm. 2022, 2, 210–219. Available online: https://ijpbp.com (accessed on 10 November 2025). [CrossRef]
  28. Tabet-Zatla, A.; Hammoudi, A.; El-Hiti, G.A.; Fellah, M.; Mohammed, D.Z.; Pérard, J. In Vitro Study of the Antihemolytic and Antioxidant Potential of Two Essential Oils from Salvia officinalis L. and Curcuma longa L. against Glucantime® Toxicity. J. Eng. Res. 2025, in press. [Google Scholar] [CrossRef]
  29. Wong-Paz, J.E.; Muñiz-Márquez, D.B.; Martínez-Ávila, G.C.G.; Belmares-Cerda, R.E.; Aguilar, C.N. Ultrasound-Assisted Extraction of Polyphenols from Native Plants in the Mexican Desert. Ultrason. Sonochem. 2015, 22, 474–481. [Google Scholar] [CrossRef]
  30. Muñoz-Acevedo, A.; Vargas-Rueda, S.J.; Guerra, E.X.; Cervantes-Díaz, M. Determinación del contenido total de flavonoides presentes en residuos agroindustriales de frutas tropicales. Rev. Agunkuyâa 2021, 11, 28–35. [Google Scholar] [CrossRef]
  31. Valero-Mendoza, A.G.; Meléndez-Rentería, N.P.; Chávez-González, M.L.; Flores-Gallegos, A.C. The whole pomegranate (Punica granatum L.): Biological properties and important findings—A review. Food Chem. Adv. 2023, 2, 100153. [Google Scholar] [CrossRef]
  32. Estrada-Gil, L.; Contreras-Esquivel, J.C.; Flores-Gallegos, C.; Zugasti-Cruz, A.; Govea-Salas, M.; Mata-Gómez, M.A.; Ascacio-Valdés, J.A. Recovery of bioactive ellagitannins by ultrasound/microwave-assisted extraction from Mexican rambutan peel (Nephelium lappaceum L.). Molecules 2022, 27, 1592. [Google Scholar] [CrossRef]
  33. De León-Medina, J.C.; Buenrostro-Figueroa, J.J.; Sepúlveda, L.; Aguilar, C.N.; Ascacio-Valdés, J.A. Fungal biodegradation of ellagitannins extracted from rambutan peel. Food Bioprod. Process. 2023, 141, 81–90. [Google Scholar] [CrossRef]
  34. Nasiri, S.N.; Aghajanloo, B.; Nasiri, N.; Nazarnezhad, S. Cytotoxicity and biocompatibility of green biomaterials. In Green Biomaterials in Tissue Engineering; ACS Symposium Series; American Chemical Society: Washington, DC, USA, 2025; Volume 1497, pp. 175–205. [Google Scholar] [CrossRef]
  35. Alonso-Montemayor, F.J.; Neira-Velázquez, M.G.; Zugasti-Cruz, A.; Sáenz-Galindo, A. Minimum inhibitory but maximum non-hemolytic concentration of Larrea tridentata and Origanum vulgare extracts. Afinidad 2023, 80, 1–9. [Google Scholar] [CrossRef]
  36. Pacheco Coello, F.J. Primer análisis comparativo de la actividad antioxidante, hemolítica y antihemolítica de extractos acuosos de cinco especies del género Hibiscus presentes en Latinoamérica. Cienc. Ambiente Clima 2023, 6, 9–32. [Google Scholar] [CrossRef]
  37. Lopes, T.A.M.; Godoy, A.C.; Sinosaki, N.B.M.; Chiavelli, L.U.R.; Silveira, R.; Figueiredo, B.H.; Santos, O.O. Green extraction optimization of bioactive compounds from rosemary. J. Braz. Chem. Soc. 2020, 31, 2603–2610. [Google Scholar] [CrossRef]
  38. Amarowicz, R.; Carle, R.; Dongowski, G.; Durazzo, A.; Galensa, R.; Kammerer, D.; Maiani, G.; Piskula, M.K. Influence of postharvest processing and storage on the content of phenolic acids and flavonoids in foods. Mol. Nutr. Food Res. 2009, 53 (Suppl. 2), S151–S183. [Google Scholar] [CrossRef] [PubMed]
  39. Salehi, B.; Venditti, A.; Sharifi-Rad, M.; Kręgiel, D.; Sharifi-Rad, J.; Durazzo, A.; Lucarini, M.; Santini, A.; Souto, E.B.; Novellino, E.; et al. The therapeutic potential of apigenin. Int. J. Mol. Sci. 2019, 20, 1305. [Google Scholar] [CrossRef]
  40. Estell, R.E.; Fredrickson, E.L.; James, D.K. Effect of light intensity and wavelength on concentration of plant secondary metabolites in leaves of Flourensia cernua. Biochem. Syst. Ecol. 2016, 65, 108–114. [Google Scholar] [CrossRef]
  41. Henkel, S.; Misuraca, M.C.; Troselj, P.; Davidson, J.; Hunter, C.A. Polarisation effects on the solvation properties of alcohols. Chem. Sci. 2018, 9, 88–99. [Google Scholar] [CrossRef]
  42. Ćujić, N.; Šavikin, K.; Janković, T.; Pljevljakušić, D.; Zdunić, G.; Ibrić, S. Optimization of polyphenols extraction from dried chokeberry using maceration as traditional technique. Food Chem. 2016, 194, 135–142. [Google Scholar] [CrossRef]
  43. Galvan D’Alessandro, L.; Kriaa, K.; Nikov, I.; Dimitrov, K. Ultrasound-assisted extraction of polyphenols from black chokeberry. Sep. Purif. Technol. 2012, 93, 42–47. [Google Scholar] [CrossRef]
  44. Nishad, J.; Saha, S.; Kaur, C. Enzyme- and ultrasound-assisted extractions of polyphenols from Citrus sinensis (cv. Malta) peel: A comparative study. J. Food Process. Preserv. 2019, 43, e14046. [Google Scholar] [CrossRef]
  45. Pérez, R.M.; Vargas, R.; Martínez, F.J.; García, E.V.; Hernández, B. Actividad antioxidante de los alcaloides de Bocconia arborea: Estudio sobre seis métodos de análisis. Ars. Pharm. 2003, 44, 5–21. Available online: https://www.ugr.es/~ars/abstract/44-5-03.pdf (accessed on 10 November 2025).
  46. De León-Zapata, M.A.; Pastrana-Castro, L.; Rua-Rodríguez, M.L.; Álvarez-Pérez, O.B.; Rodríguez-Herrera, R.; Aguilar, C.N. Experimental protocol for the recovery and evaluation of bioactive compounds of tarbush against postharvest fruit fungi. Food Chem. 2016, 198, 62–67. [Google Scholar] [CrossRef] [PubMed]
  47. Rojano, A.; Gaviria, C.A.; Ochoa, C.I.; Sánchez, N.; Medina, C.; Lobo, M. Propiedades antioxidantes de los frutos de agraz o mortiño (Vaccinium meridionale Swartz). In Perspectivas del Cultivo de Agraz o Mortiño en la Zona Altoandina de Colombia; Gente Nueva Editorial: Bogotá, Colombia, 2009; pp. 95–112. Available online: https://repository.agrosavia.co/bitstream/handle/20.500.12324/20444/81392_56989.pdf (accessed on 10 November 2025).
  48. ASTM F756-17(2025); Standard Practice for Assessment of Hemolytic Properties of Materials. ASTM International: West Conshohocken, PA, USA, 2025.
  49. Belmares, R.; Garza, Y.; Rodríguez, R.; Contreras-Esquivel, J.C.; Aguilar, C.N. Composition and fungal degradation of tannins present in semiarid plants. Electron. J. Environ. Agric. Food Chem. 2009, 8, 312–318. [Google Scholar]
  50. Álvarez, R.E.; Jiménez, G.O.J.; Posada, A.C.M.; Rojano, B.A.; Gil, G.G.H.; García, P.C.M.; Durango, R.D.L. Actividad antioxidante y contenido fenólico de los extractos provenientes de las bayas de dos especies del género Vismia (Guttiferae). Vitae 2008, 15, 165–172. Available online: https://www.scielo.org.co/pdf/vitae/v15n1/v15n1a20.pdf (accessed on 10 November 2025).
  51. Cai, Y.-Z.; Sun, M.; Xing, J.; Luo, Q.; Corke, H. Structure–Radical Scavenging Activity Relationships of Phenolic Compounds from Traditional Chinese Medicinal Plants. Life Sci. 2006, 78, 2872–2878. [Google Scholar] [CrossRef]
  52. Chen, Z.; Kong, S.; Song, F.; Li, L.; Jiang, H. Pharmacokinetic Study of Luteolin, Apigenin, Chrysoeriol, and Diosmetin after Oral Administration of Flos chrysanthemi Extract in Rats. Fitoterapia 2012, 83, 1616–1622. [Google Scholar] [CrossRef]
  53. Hmidani, A.; Bouhlali, E.T.; Ajebli, M.; Khouya, T.; Benlyas, M.; Alem, C. In Vitro Investigation of Antioxidant and Antihemolytic Activities of Three Lamiaceae Species from Morocco. Beni-Suef Univ. J. Basic Appl. Sci. 2021, 10, 27. [Google Scholar] [CrossRef]
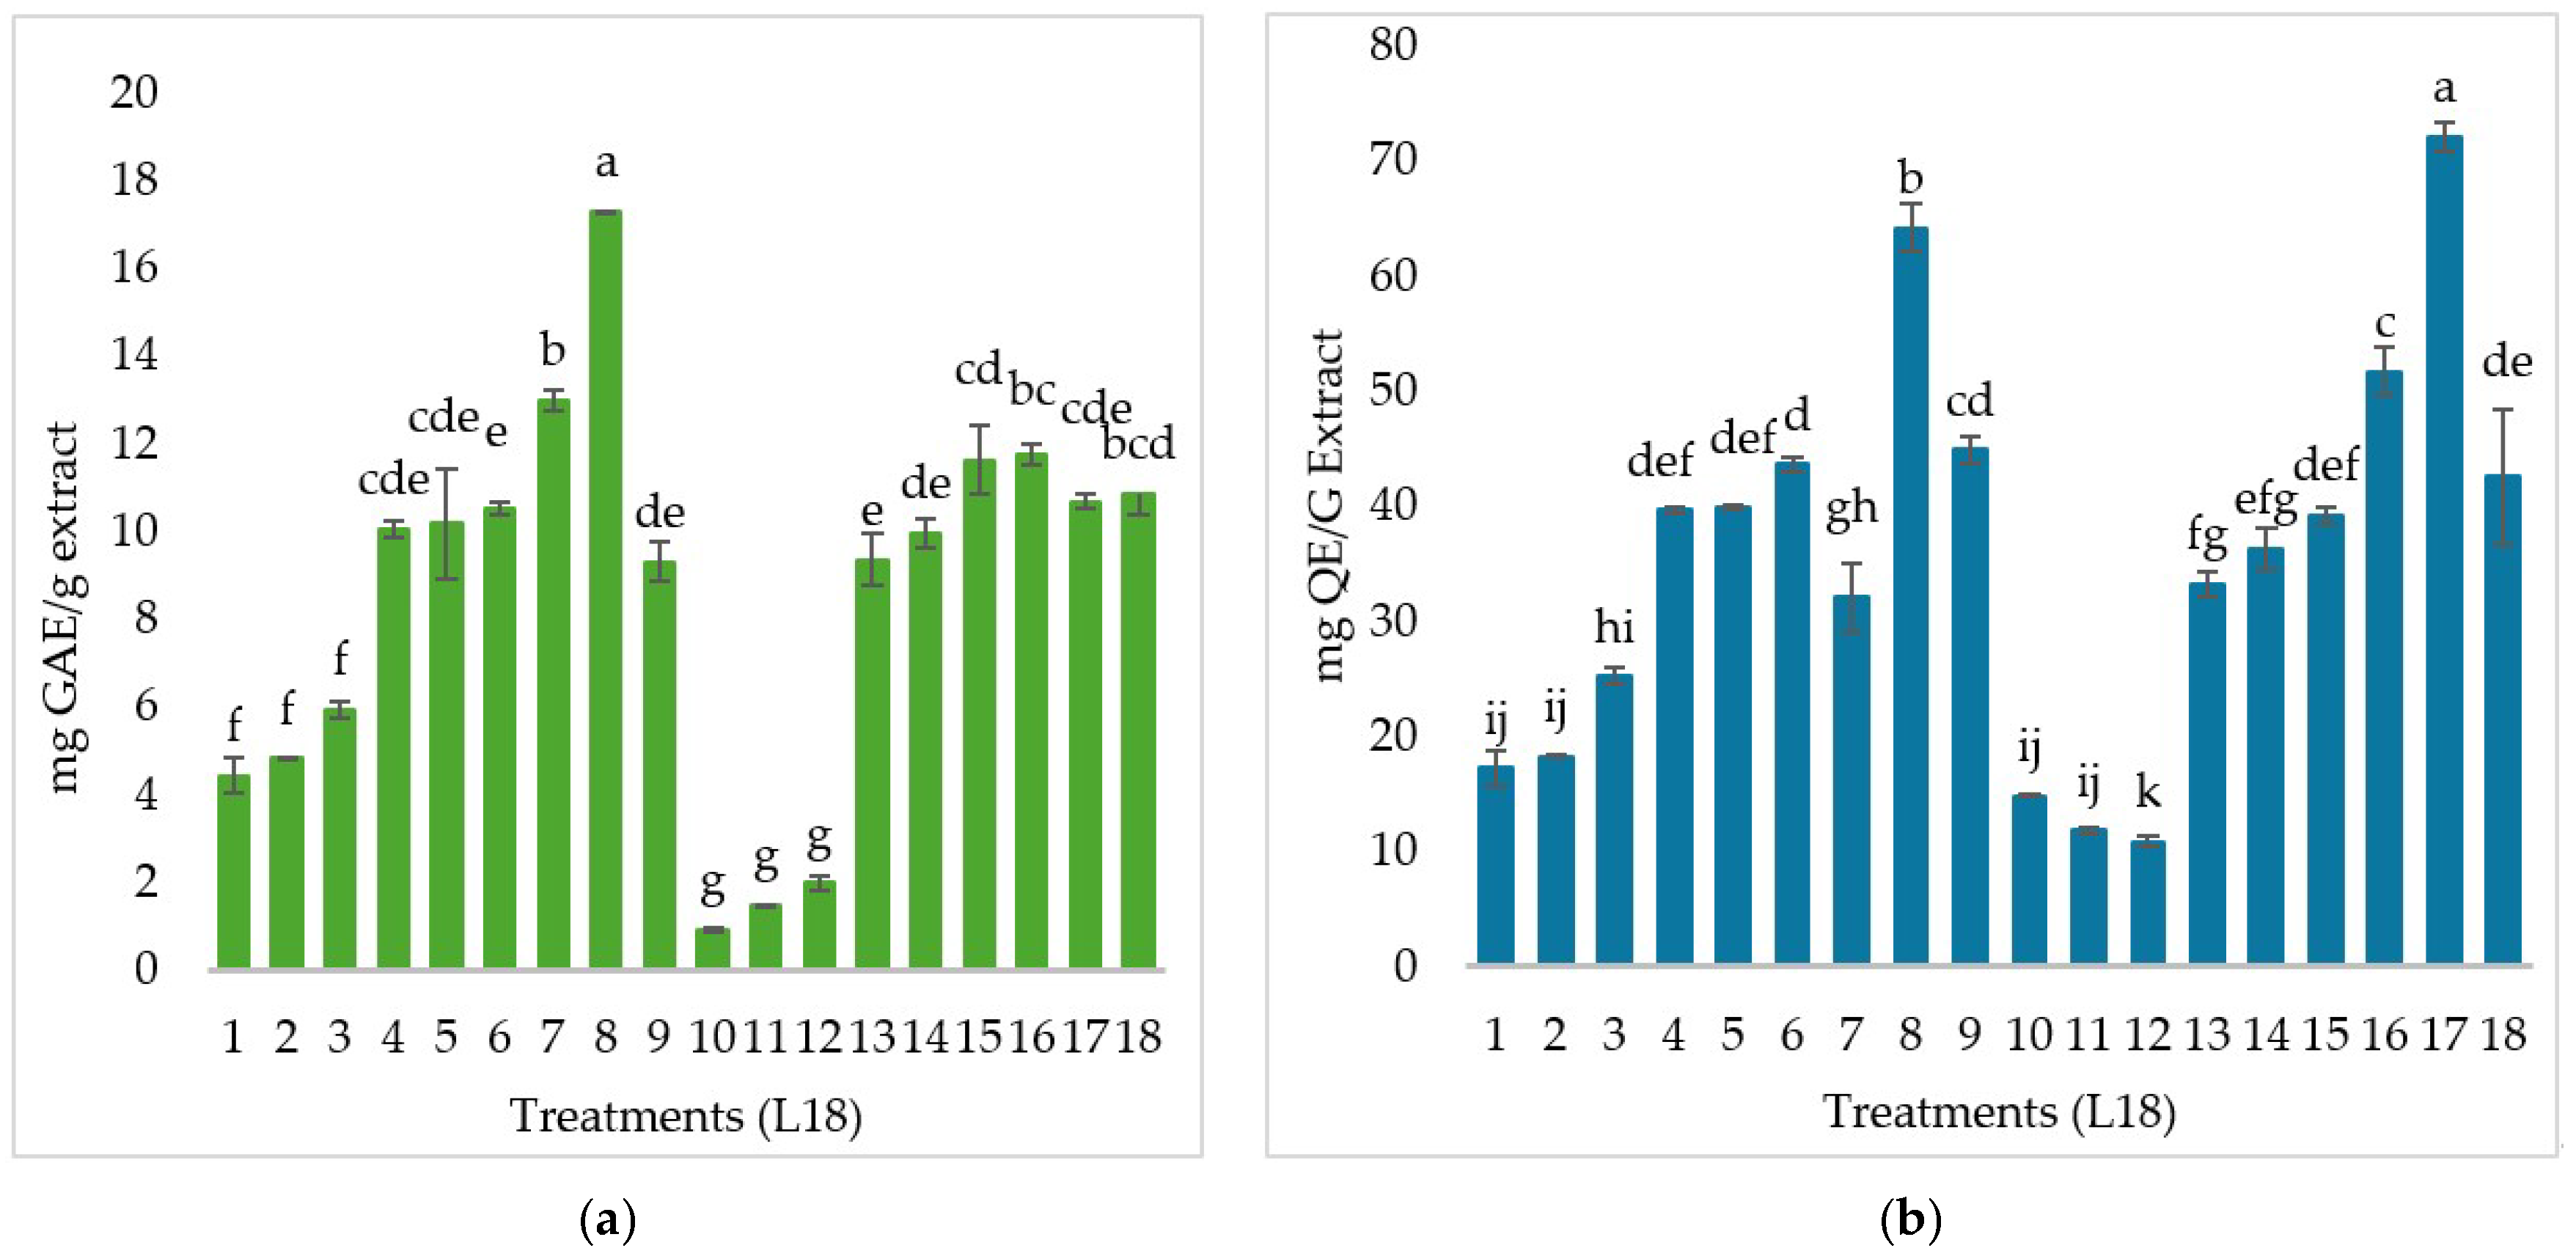
Figure 1. Total hydrolyzable phenolics (TPC) and total flavonoids (TFC) in Flourensia cernua across Taguchi L18 treatments. (a) Total hydrolyzable phenolics (mg GAE/g extract). (b) Total flavonoids (mg QE/g extract). Bars show mean ± SD of duplicate measurements (technical replicates). Different letters above the bars denote significant differences among treatments (one-way ANOVA followed by Fisher’s LSD, α = 0.05). Factor levels for each treatment are listed in Table 1. Statistics (a): F (17,18) = 193.77, p < 0.0001; MSE = 0.194 (mg GAE/g)2; 95% Cl per treatment = mean ± 0.655 mg GAE/g (n = 2); Fisher’s LSD (α = 0.05) = 0.926 mg GAE/g. Statistics (b): F (17,18) = 168.60, p < 0.0001; MSE = 3.506 (mg QE/g)2 95% Cl per treatment = mean ± 2.782 mg QE/g (n = 2); Fisher’s LSD (α = 0.05) = 3.934 mg QE/g.
Processes 13 03725 g001
Figure 2. Response contours as a function of time and temperature under ultrasound. (a) TPC (mg GAE/g extract vs. time (min) and temperature (°C). (b) Total flavonoids (mg QE/g extract) vs. time (min) and temperature (°C). Color scale indicates response level. Surfaces derive from the fitted model; dots mark experimental runs. Solvent fraction fixed and 50% ethanol, unless otherwise stated.
Processes 13 03725 g002
Figure 3. Main effect plots (Taguchi) for extraction factors in Flourensia cernua. (a) Total hydrolyzable phenolics (TPC; mg GAE/g extract). (b) Total flavonoids (mg QE/g extract). Each panel shows the mean response at each level of the factors (extraction type, extraction solvent (% ethanol), temperature (°C), time (min), after averaging over the levels of the other factors. The dashed line indicates overall (grand) mean. Higher departures from the dashed line denote stronger main effects (levels: ultrasound/microwave; 0–30% ethanol, 30–40–50 °C, 5–10–20 min).
Processes 13 03725 g003
Figure 4. Radical scavenging activity by DPPH and ABTS●+ across Taguchi L18 treatments. (a) DPPH inhibition (%). (b) ABTS●+ inhibition (%). Bars show mean ± SD of duplicate measurements (technical replicates. Different letters above the bars denote significant differences among treatments (one-way ANOVA followed by Fisher’s LSD, α = 0.05). X-axis Treatment (L18). Statistics (a) DPPH: F (3,14) = 4.83, p = 0.016; MSE = 142.24 (%)2; 95% CI = mean ± 18.09% (n = 2); LSD = 25.58%. Statistics (b) ABTS: F (3,14) = 3.05, p = 0.064; MSE = 504.40 (%)2; 95% CI = mean ± 34.06% (n = 2); LSD = 48.17%.
Processes 13 03725 g004
Figure 5. Main effects (Taguchi) for antioxidant activity. (a) DPPH Inhibition (%). (b) ABTS●+ Inhibition (%). Each panel shows the mean response at each factor level (type of extraction; solvent fraction (% ethanol); temperature (°C); time (min) pooled over the remaining factors. The dashed line indicates the grand mean; larger deviations from the grand mean denote stronger main effects. Assay conditions: 30 min; add concentration if applicable (100 μg/mL).
Processes 13 03725 g005
Figure 6. (a) Response contour determination of Flourensia cernua DPPH radical antioxidant activity as a function of time and temperature. (b) Response contour graph of Flourensia cernua ABTS●+ radical antioxidant activity as a function of time and temperature. To better visualize the results, Figure 6a,b highlight that the most effective extraction method is ultrasound, with a 50% ethanol concentration maximizing the recovery of the compounds of interest.
Processes 13 03725 g006
Figure 7. Hemolytic activity of Flourensia cernua ethanolic extracts on human erythrocytes. Hemolysis (%) after exposure to indicated extract concentrations (mg/L): the “+” on the x-axis denotes the positive control (distilled water). Values are mean ± SD (N = 3 technical replicates). PBS served as the negative control (0 mg/L). The dashed line at 5% marks the non-hemolytic threshold. Similar letters indicate no significant differences (one-way ANOVA, Fisher’s LSD, α = 0.05). Statistics (hemolysis): F(5,12) = 58.94, p < 0.0001; MSE = 0.020 (%2), 95% CI = mean ± 0.18% (n = 3); LSD (α = 0.05) = 0.25%.
Processes 13 03725 g007
Figure 8. Antihemolytic activity (protective) effect of Flourensia cernua extracts against hemolysis induced by sodium carbonate (NaCO3) and hydrogen peroxide (H2O2). Protection (%) after incubation at the indicated extract concentrations (mg/L). Bars show mean ± SD (n = 3 technical replicates). Different letters indicate a significant difference between agents at each concentration (one-way ANOVA, Fisher’s LSD, α determined by Fisher = 0.05). Note: Values > 100% may occur due to the protection formula when treated samples exhibit lower absorbance than the negative control (see Methods). Statistics (Na2CO3, H2O2): F (5,12) = 408.96, p < 0.0001; MSE = 0.95 (%2); 95% CI = mean ± 1.23% (n = 3); LSD = 1.74%.
Processes 13 03725 g008
Table 1. MINITAB generated conditions for designing and statistically analyzing the complementary analysis of quintuple mixtures (software, version 19).
TreatmentConcentrationTemperature, °CTime, min
Ultrasound0305
Ultrasound04010
Ultrasound05020
Ultrasound30305
Ultrasound304010
Ultrasound305020
Ultrasound503010
Ultrasound504020
Ultrasound50505
Microwave03020
Microwave0405
Microwave05010
Microwave303010
Microwave304020
Microwave30505
Microwave503020
Microwave50405
Microwave505010
Table 2. Compounds identified by RP-HPLC-ESI-MS in microwave-assisted ethanolic leaf extracts of Flourensia cernua.
RT (min)MassCompound
12.5341Caffeic acid 4-O-glucosideHydroxycinnamic acids
15.141352.91-Caffeoylquinic acidHydroxycinnamic acids
37.492352.93-Caffeoylquinic acidHydroxycinnamic acids
40.072592.9Apigenin 6,8-di-C-glucosideFlavones
42.566310.9Caffeoyl tartaric acidHydroxycinnamic acids
44.427563.0 Apigenin arabinoside-glucosideFlavones
47.288562.9Apigenin galactoside-arabinosideFlavones
51.291293Caffeoyl aspartic acidHydroxycinnamic acids
53.25514.91,3-Dicaffeoylquinic acidHydroxycinnamic acids
54.054514.91,5-Dicaffeoylquinic acidHydroxycinnamic acids
56.805514.93,4-Dicaffeoylquinic acidHydroxycinnamic acids
58.596317MyricetinFlavonols
59.901313CirsimaritinMethoxyflavones
Table 3. Compounds identified by RP-HPLC-ESI-MS in ultrasound-assisted ethanolic leaf extracts of Flourensia cernua.
RT (min)MassCompound
7.66355Ferulic acid 4-O-glucosideMethoxycinnamic acids
11.398340.9Caffeic acid 4-O-glucosideHydroxycinnamic acids
12.196341.0 Caffeic acid 4-O-glucosideHydroxycinnamic acids
15.218352.91-Caffeoylquinic acidHydroxycinnamic acids
38.994593Apigenin 6,8-di-C-glucosideFlavones
39.977593Luteolin 7-O-rutinosideFlavones
43.186311Caffeoyl tartaric acidHydroxycinnamic acids
44.626563Apigenin arabinoside-glucosideFlavones
45.148563Apigenin galactoside-arabinosideFlavones
46.042563Apigenin 7-O-apiosyl-glucosideFlavones
47.019562.9TheaflavinTheaflavins
48.092364.9SecoisolariciresinolLignans
52.099338.9EsculinHydroxycoumarins
53.872514.91,3-Dicaffeoylquinic acidHydroxycinnamic acids
54.948514.91,5-Dicaffeoylquinic acidHydroxycinnamic acids
58.757317MyricetinFlavonols
59.93313.1CirsimaritinMethoxyflavones
Disclaimer/Publisher’s Note: The statements, opinions and data contained in all publications are solely those of the individual author(s) and contributor(s) and not of MDPI and/or the editor(s). MDPI and/or the editor(s) disclaim responsibility for any injury to people or property resulting from any ideas, methods, instructions or products referred to in the content.