Raman Spectroscopy Coupled with Multivariate Statistical Process Control for Detecting Anomalies During Milk Coagulation
Abstract
1. Introduction
- To provide a critical analysis of global and local MSPC algorithms to identify the optimal fault detection configuration to correctly discriminate NOC experiments from faulty ones.
- To carry out a fault diagnosis procedure that allows us to identify the specific source of a fault.
- To assess whether the fault detection algorithms identify process deviations prior to the onset of gelation.
2. Materials and Methods
2.1. Sample Preparation and Experimental Design
2.2. Raman Measurements
2.3. Statistical Analysis
2.3.1. Preprocessing
2.3.2. Fault Detection Algorithms
- PC score confidence interval (SCI) algorithm.
- PC score non-linear regression model-based fault detection.
- T2-based fault detection.
- Squared Prediction Error (SPE)-based fault detection algorithm.
- SPE- or T2-based algorithm.
- SPE- and T2-based algorithm
3. Results and Discussion
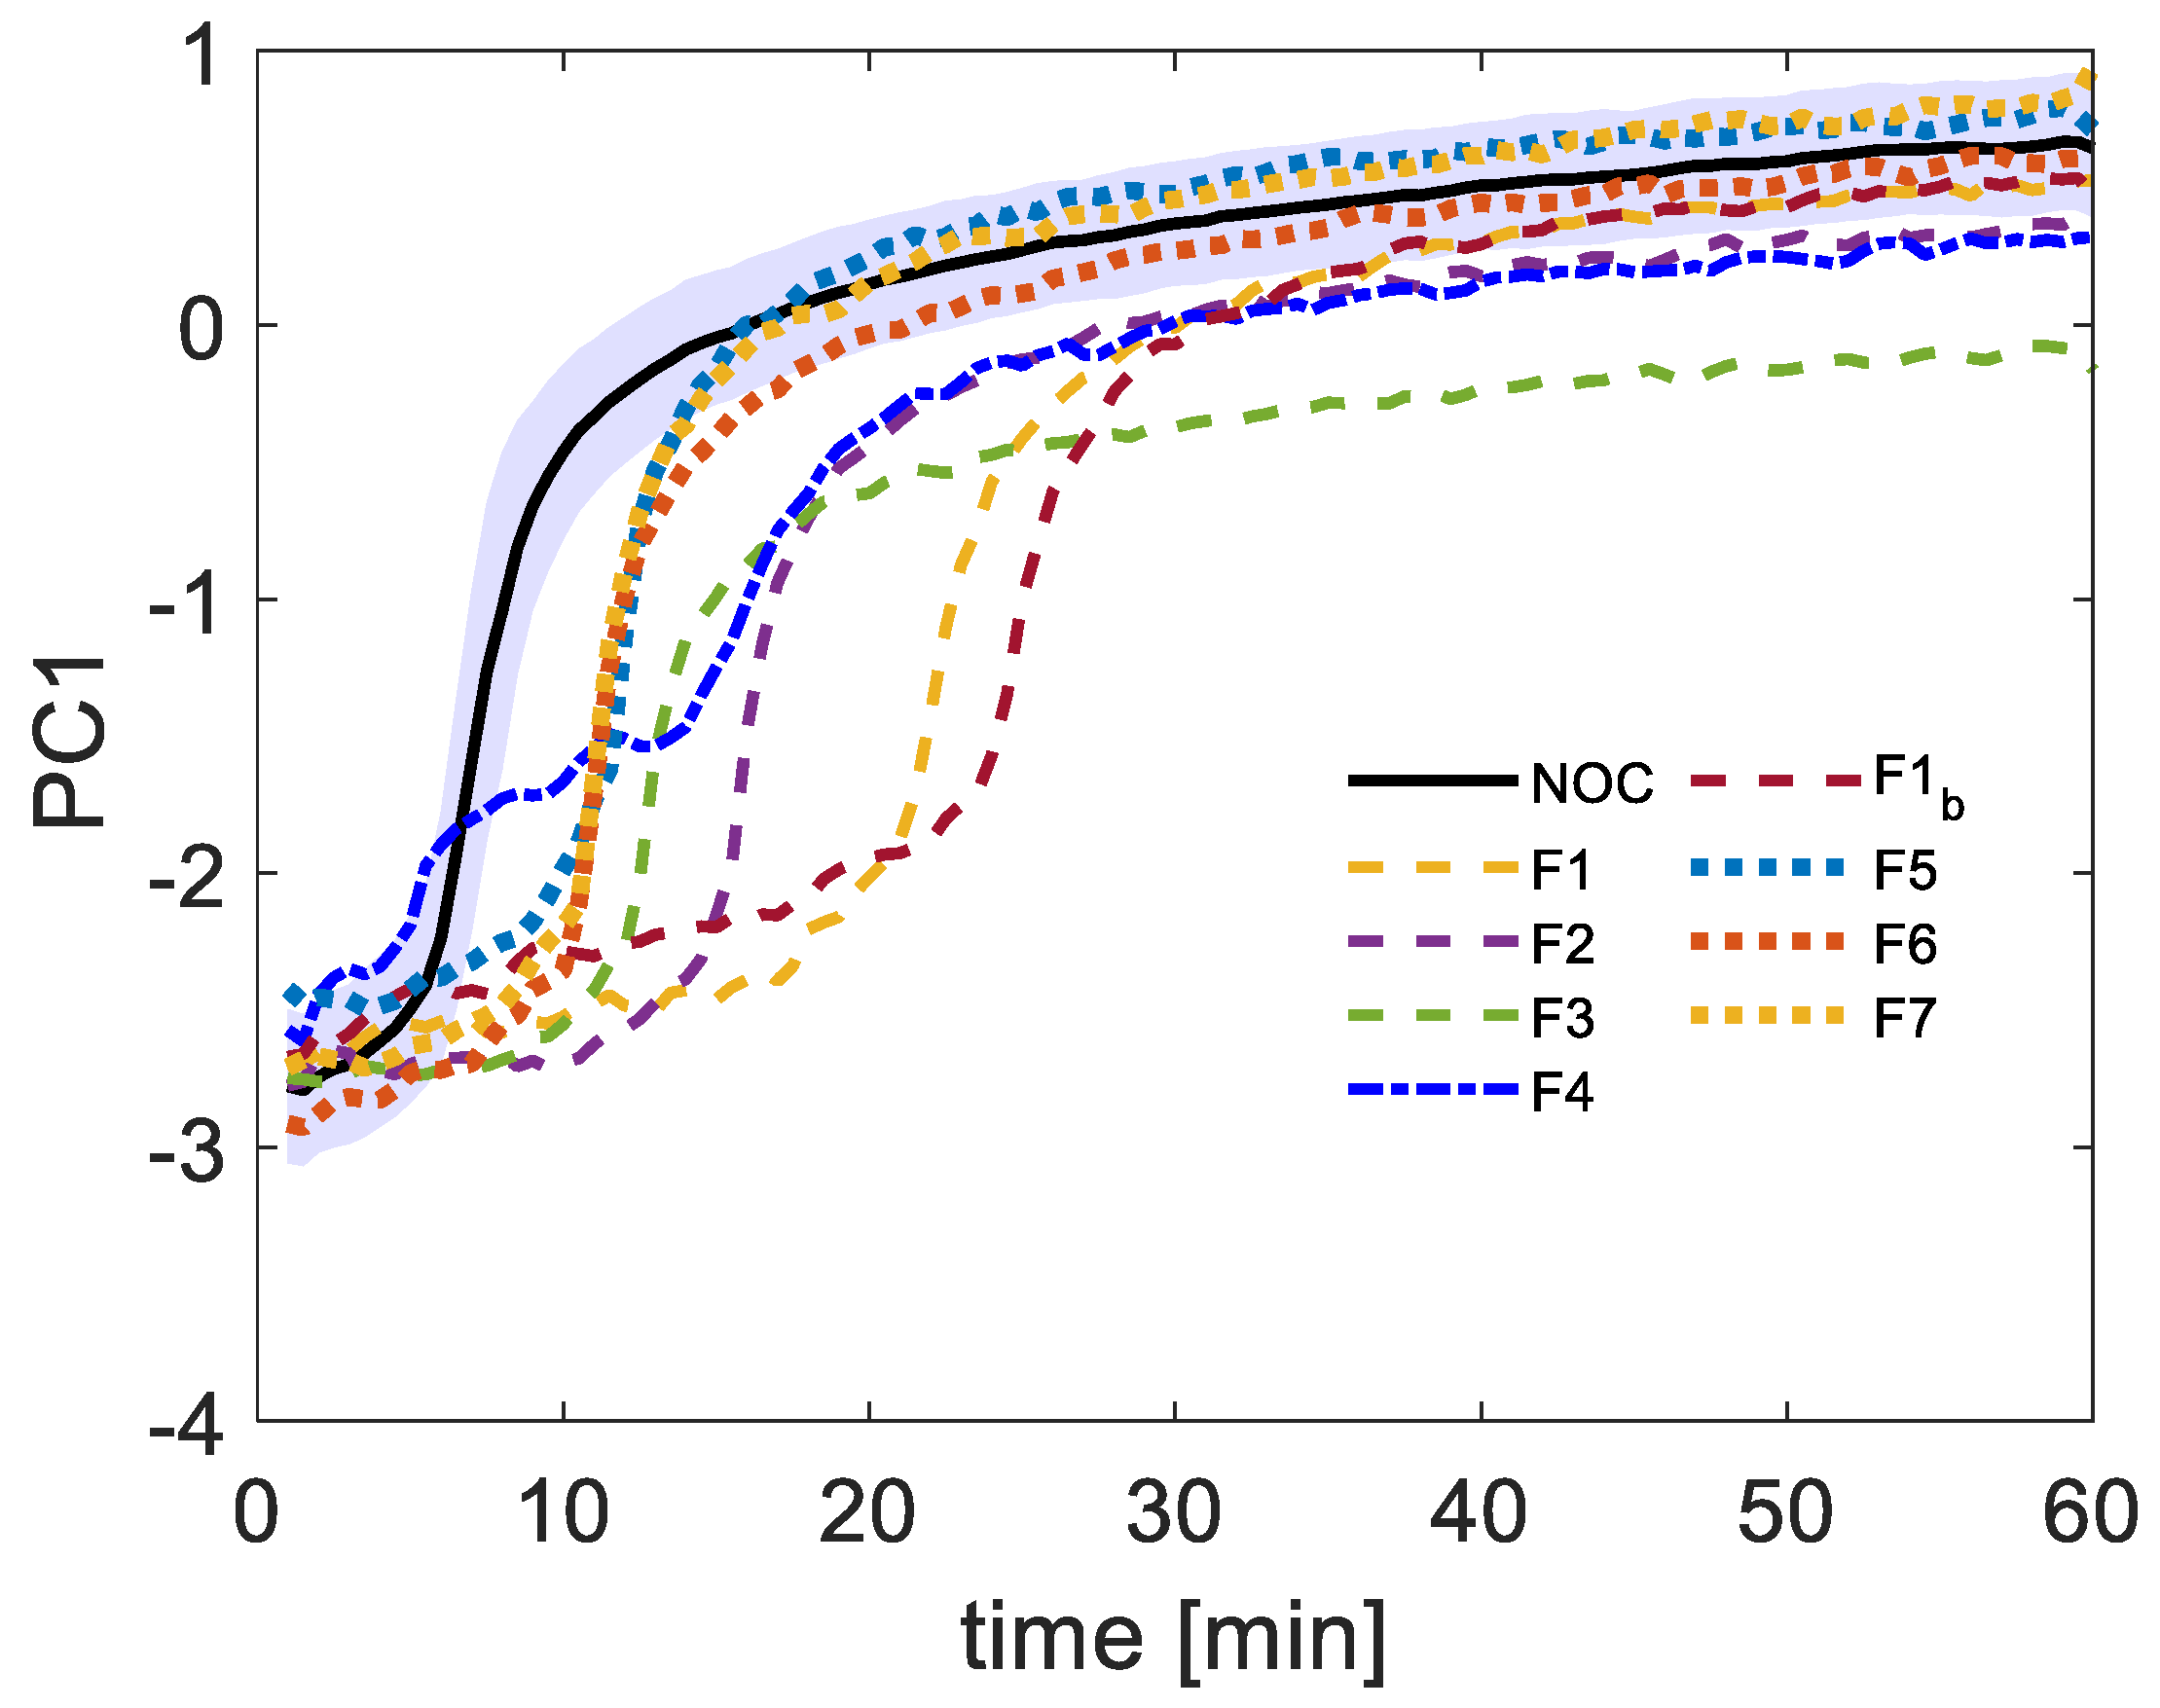
3.1. PC Scores Non-Linear Regression Model-Based Fault Detection
3.2. T2 and SPE Fault Detection Algorithm
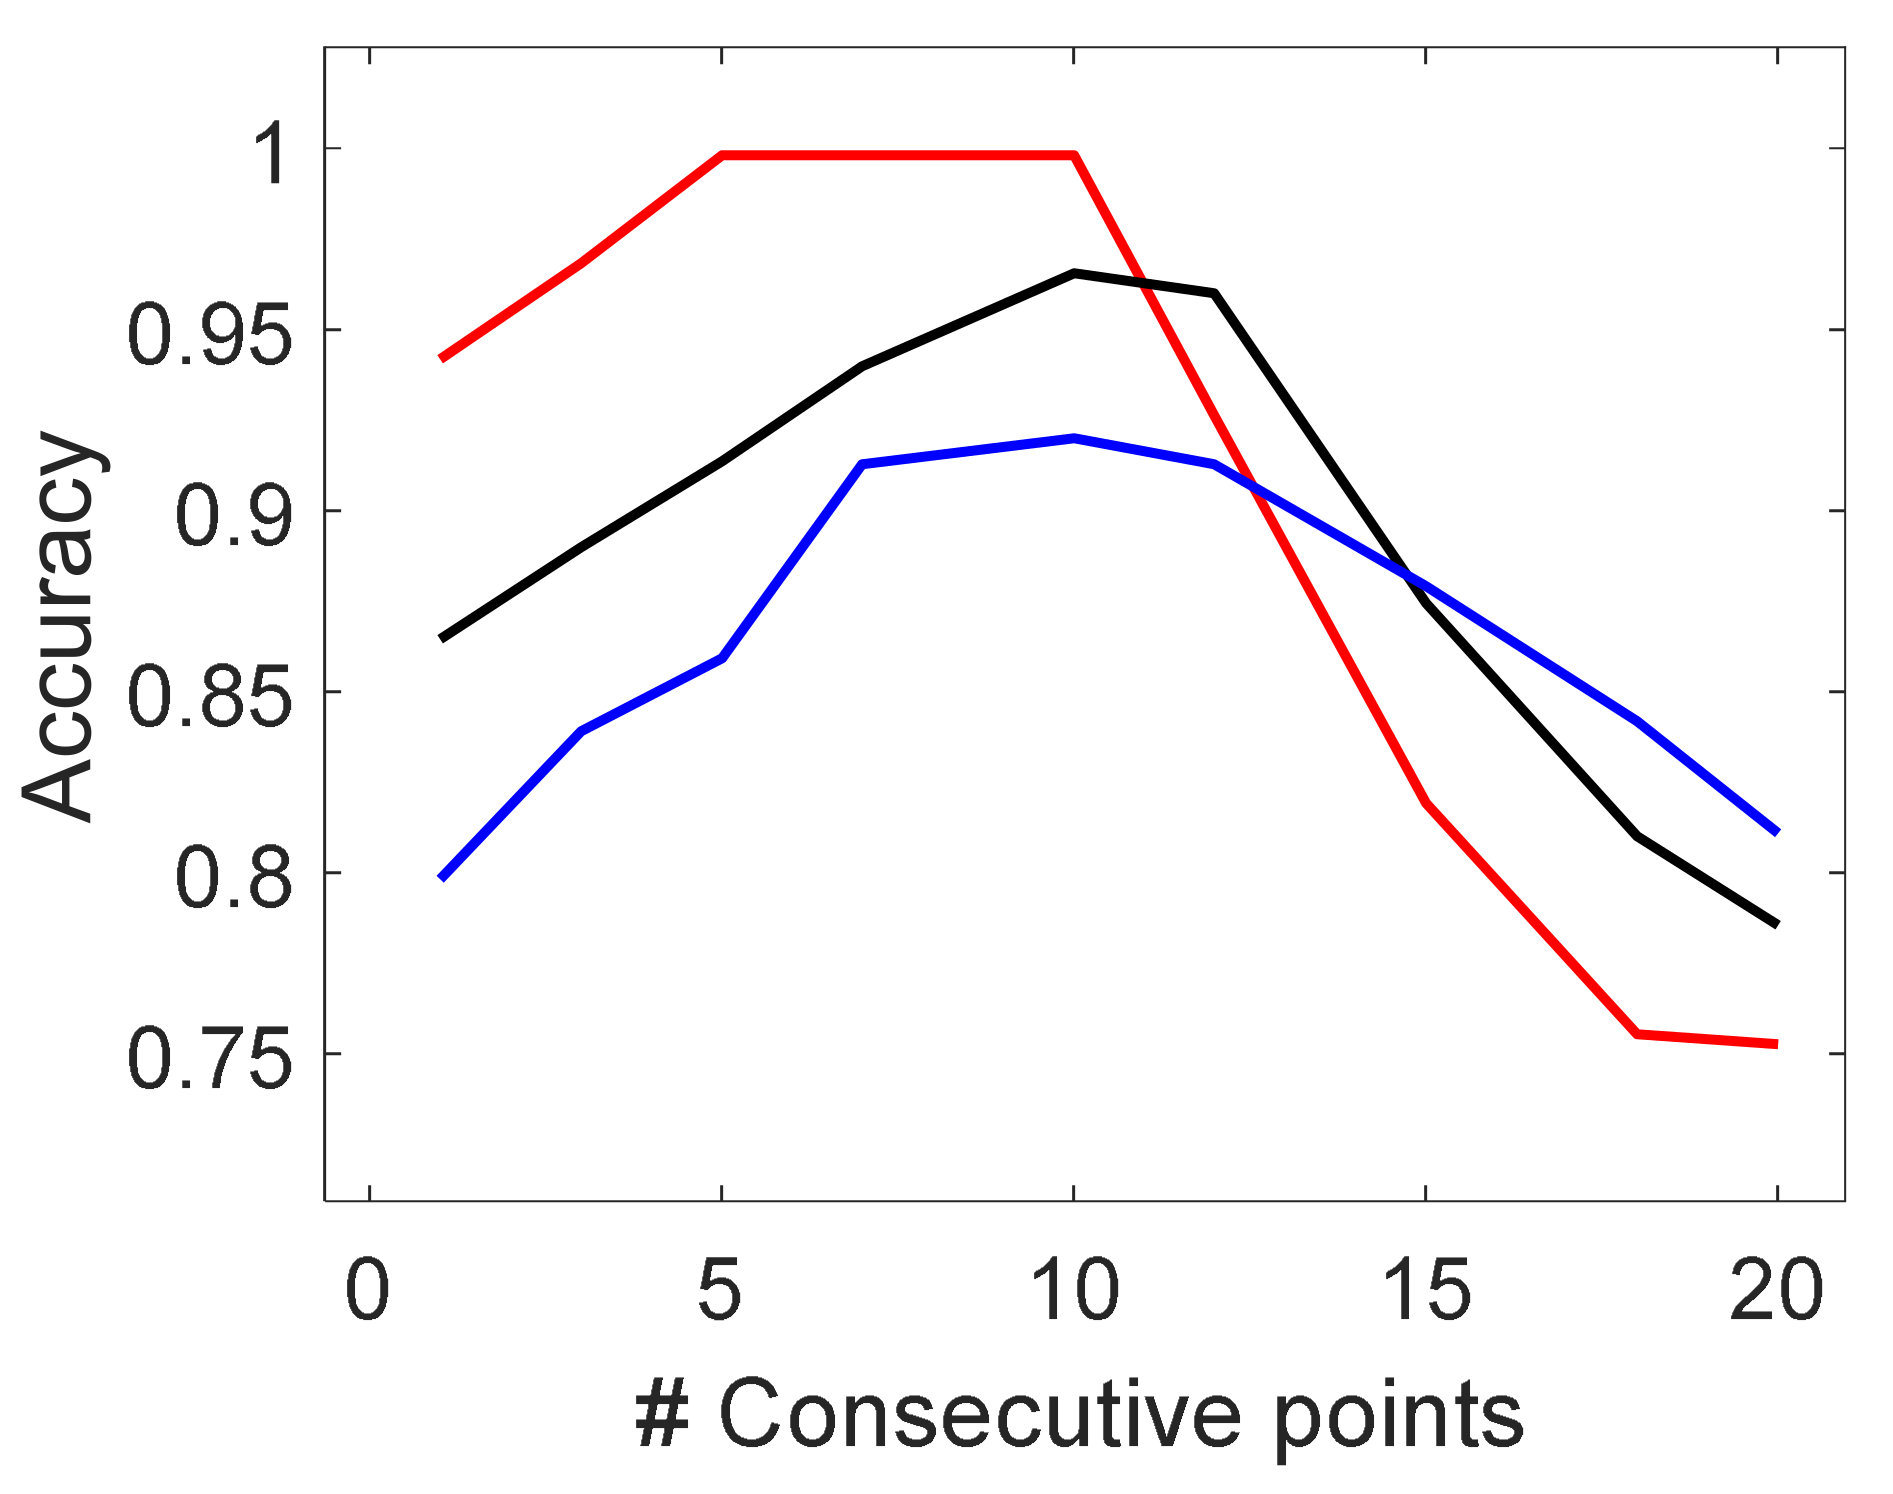
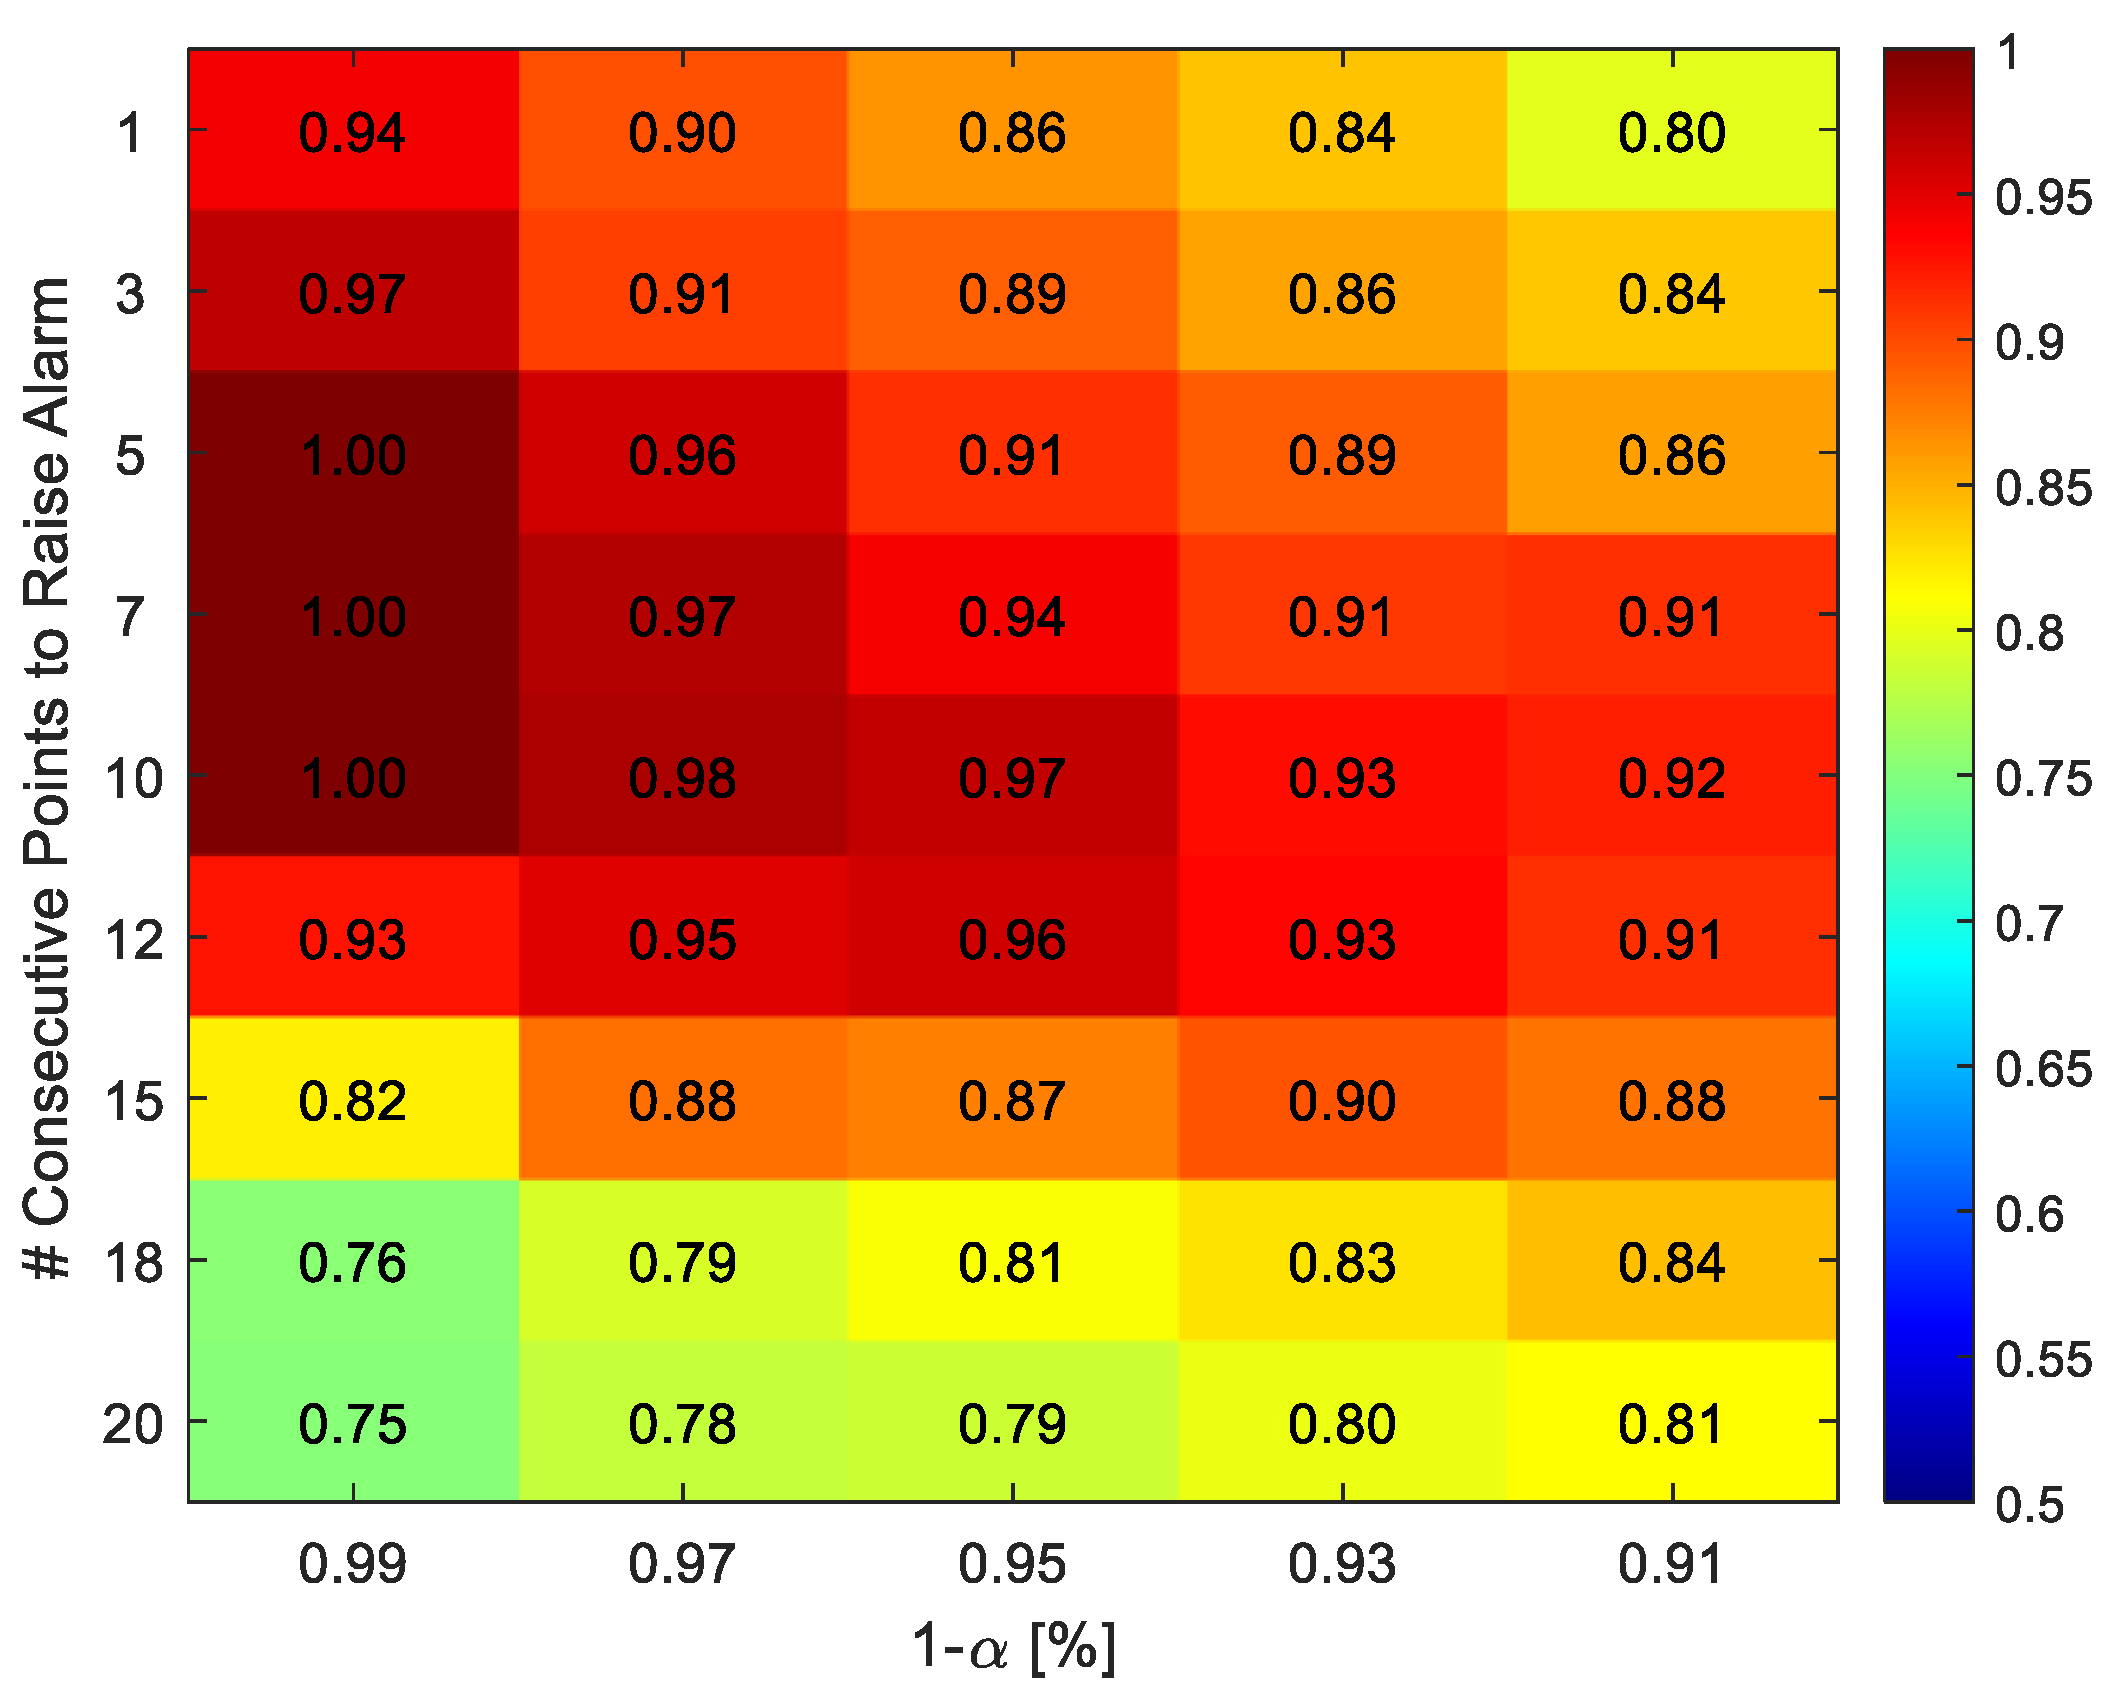
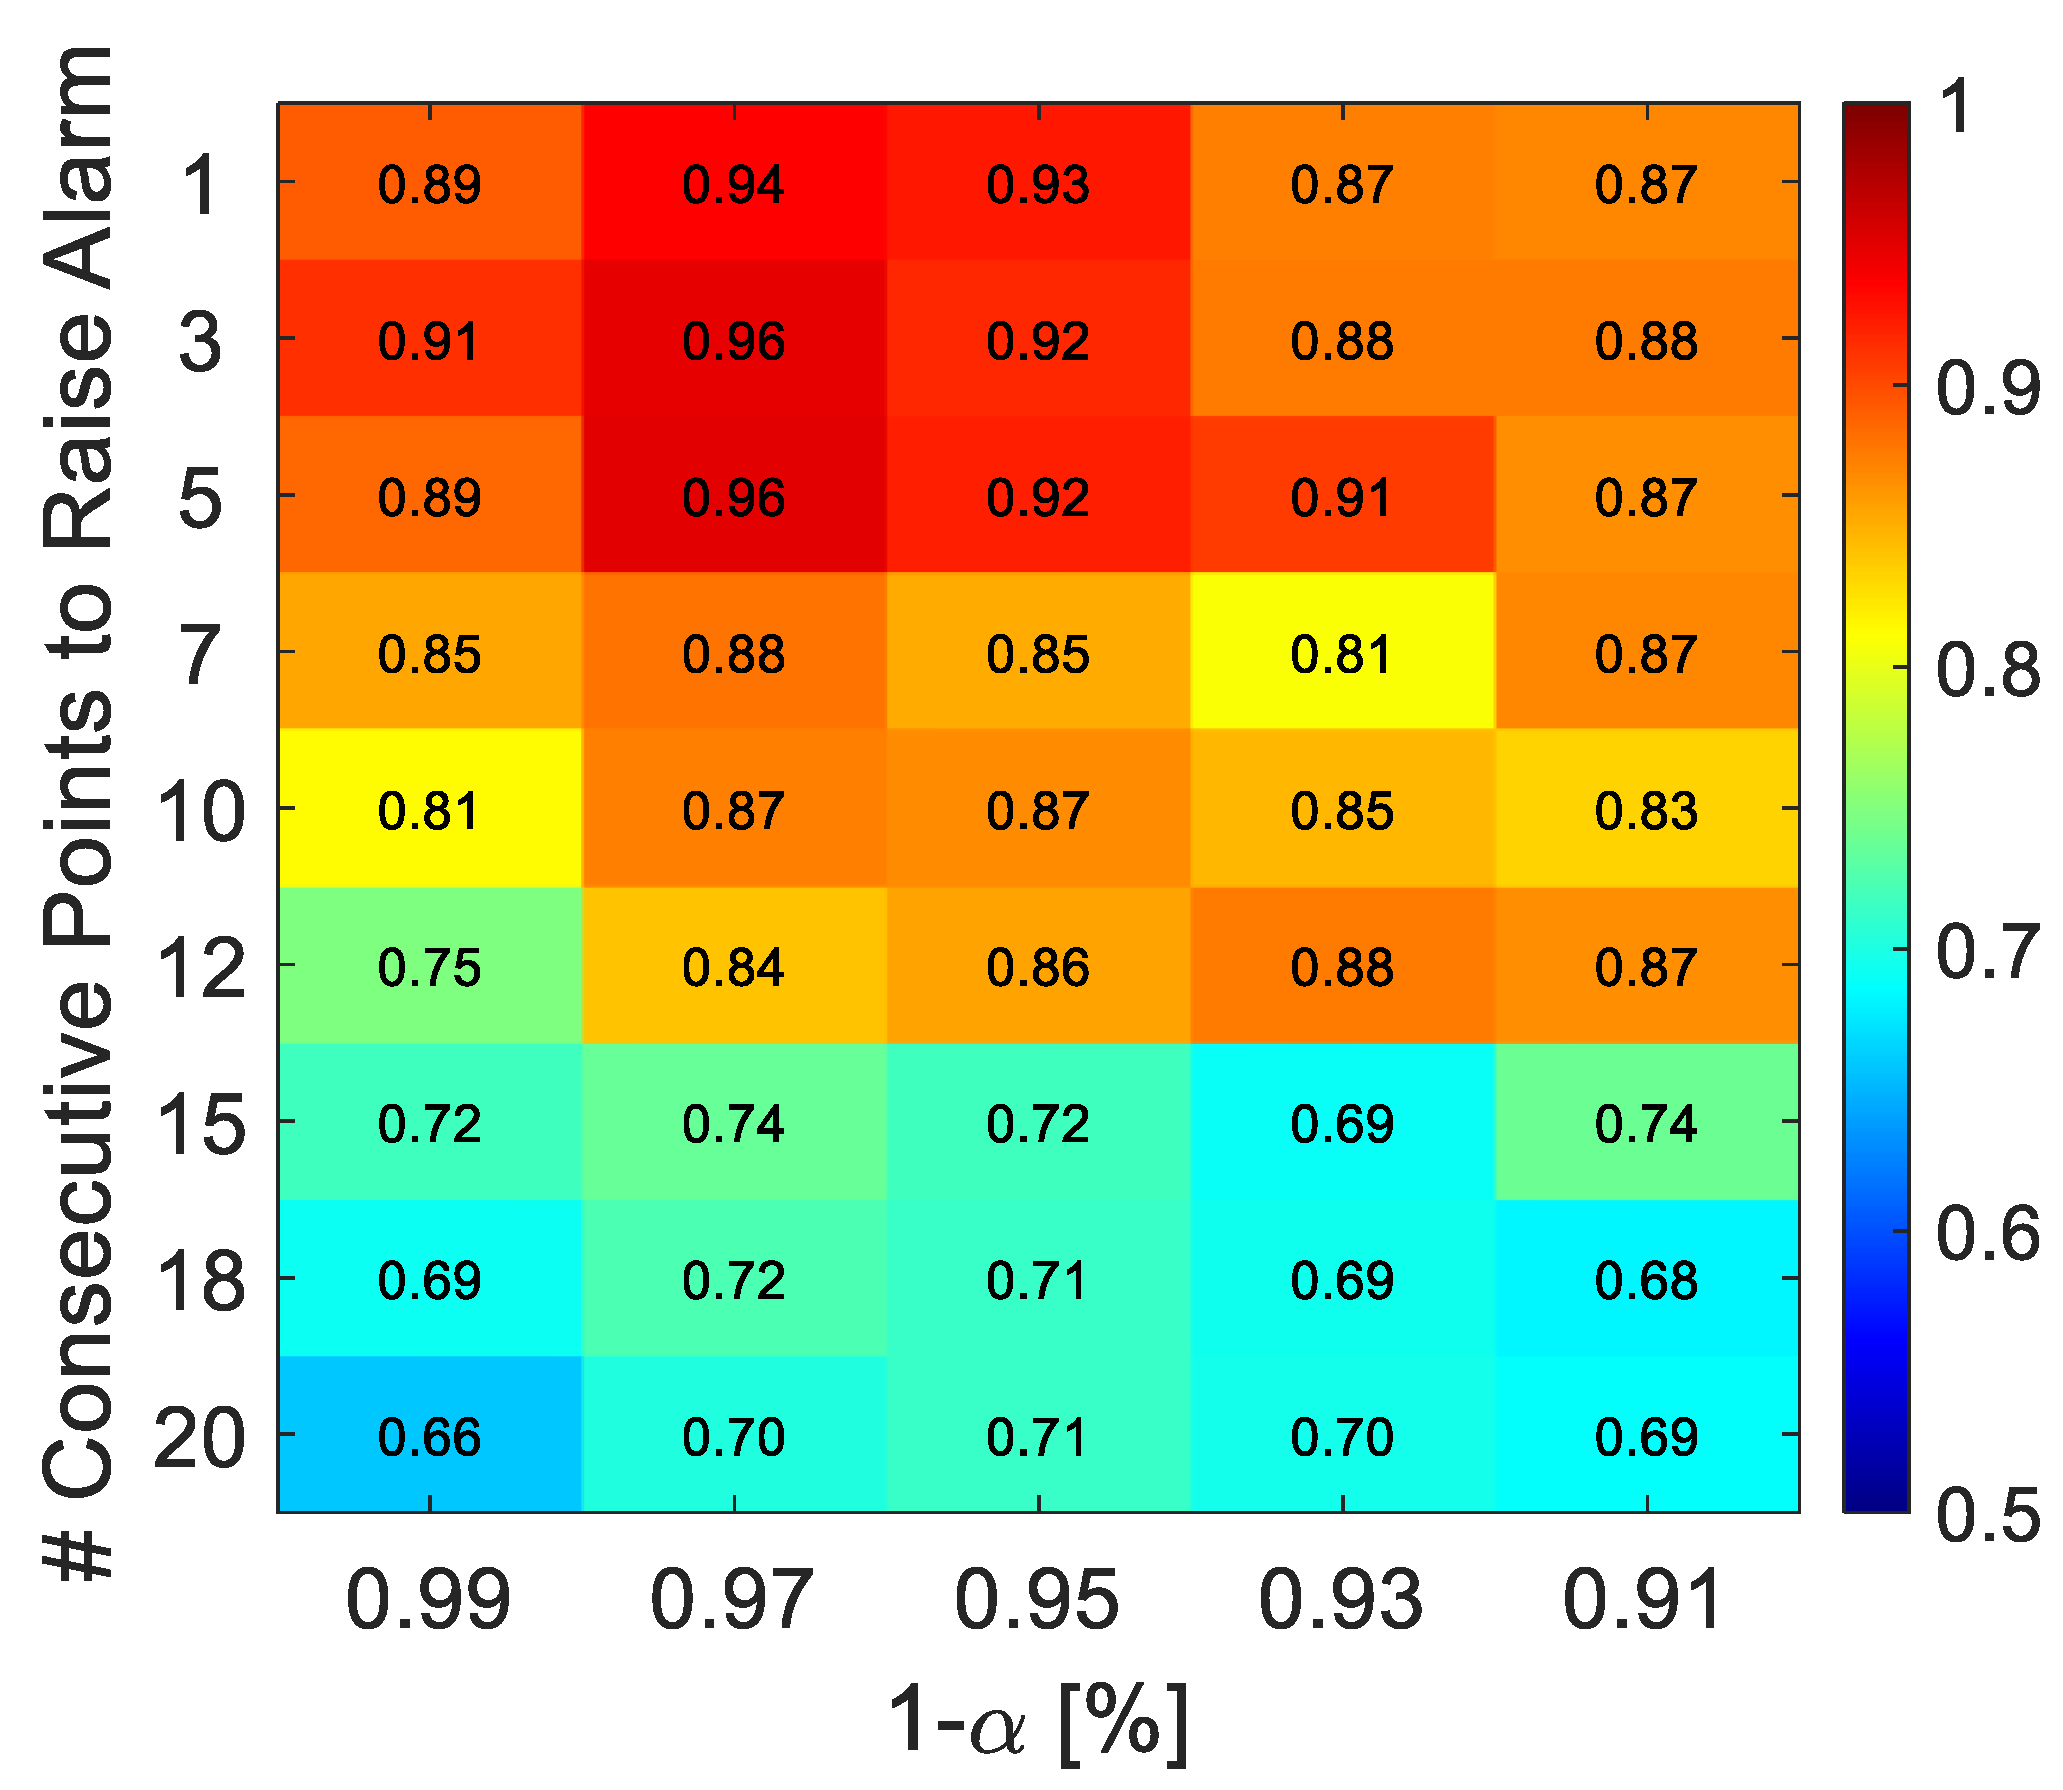
3.2.1. Hyperparameters Tuning
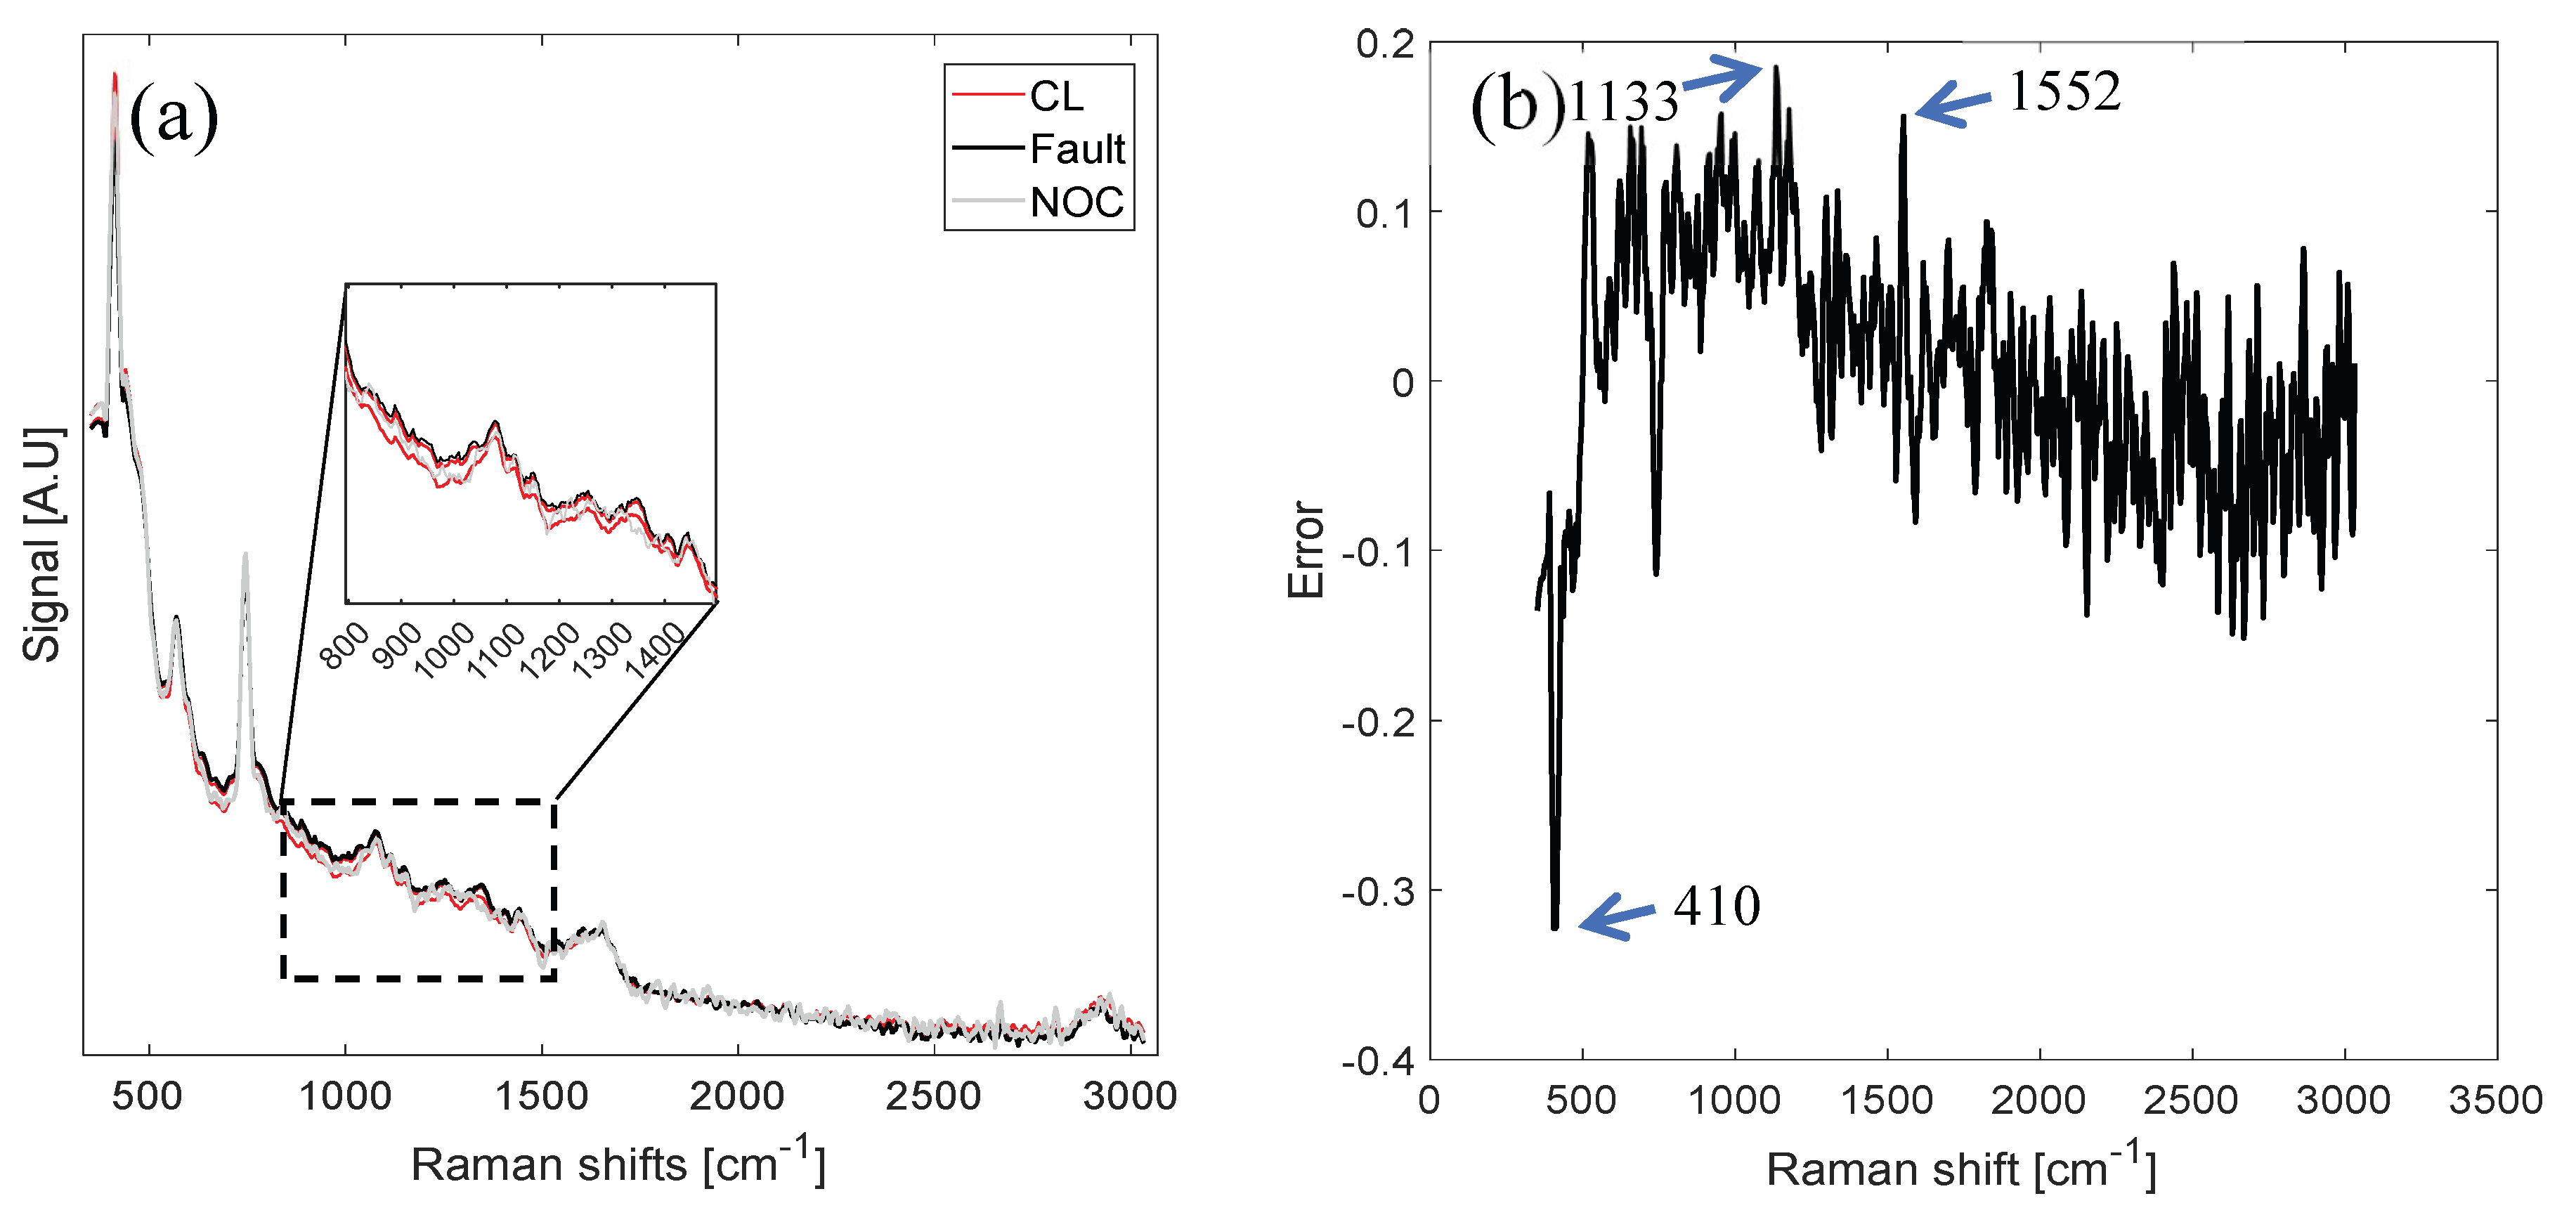
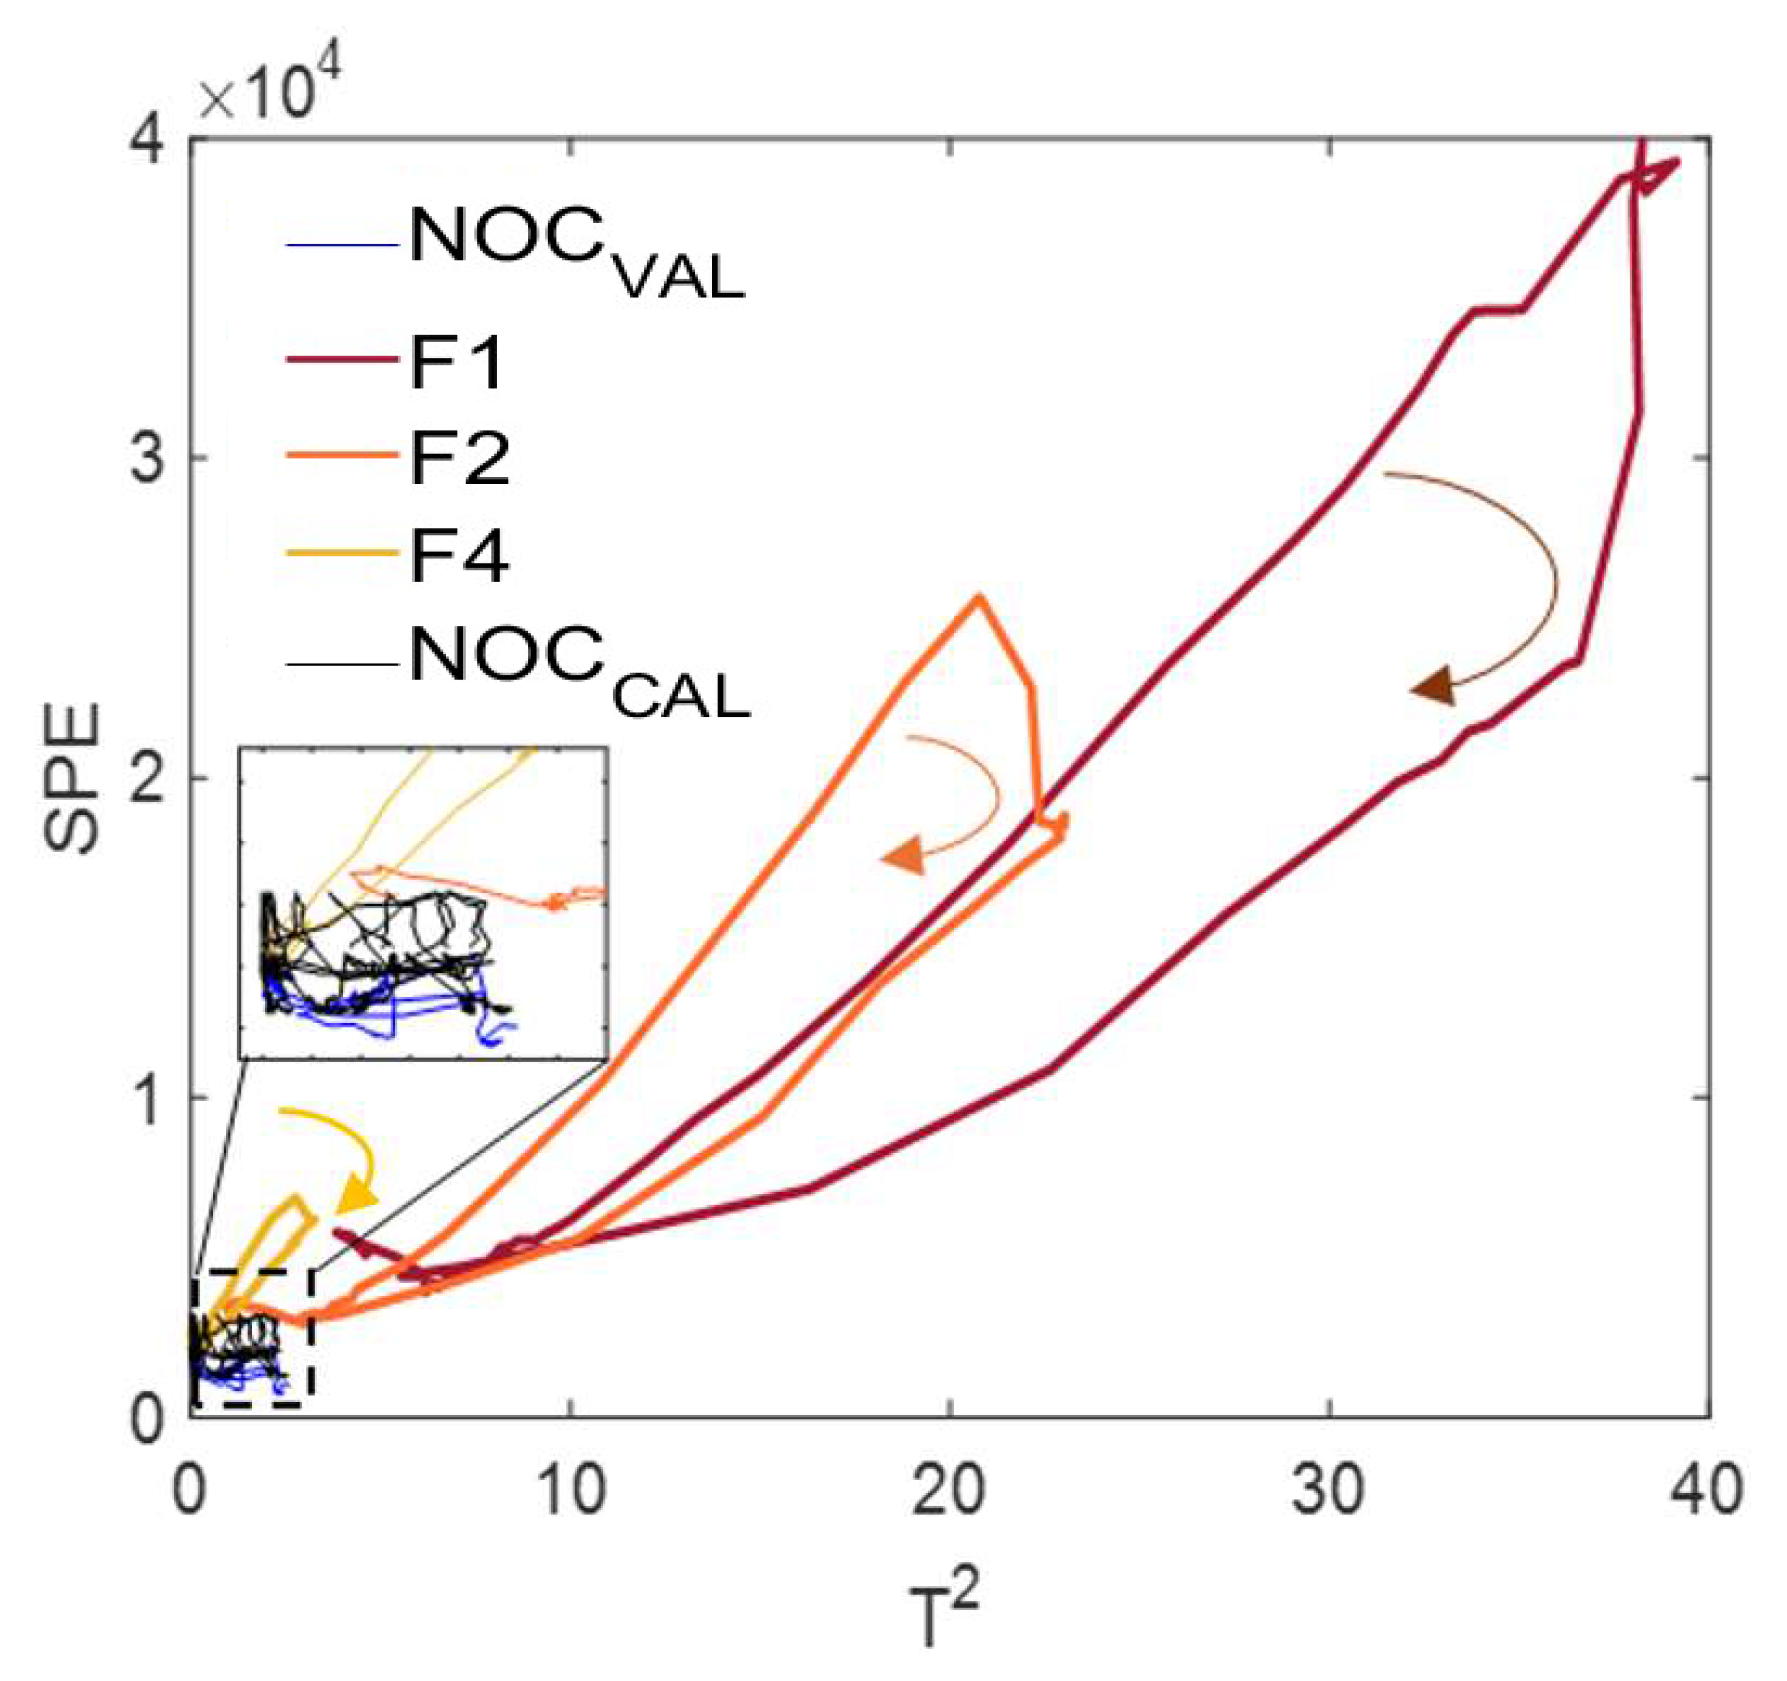
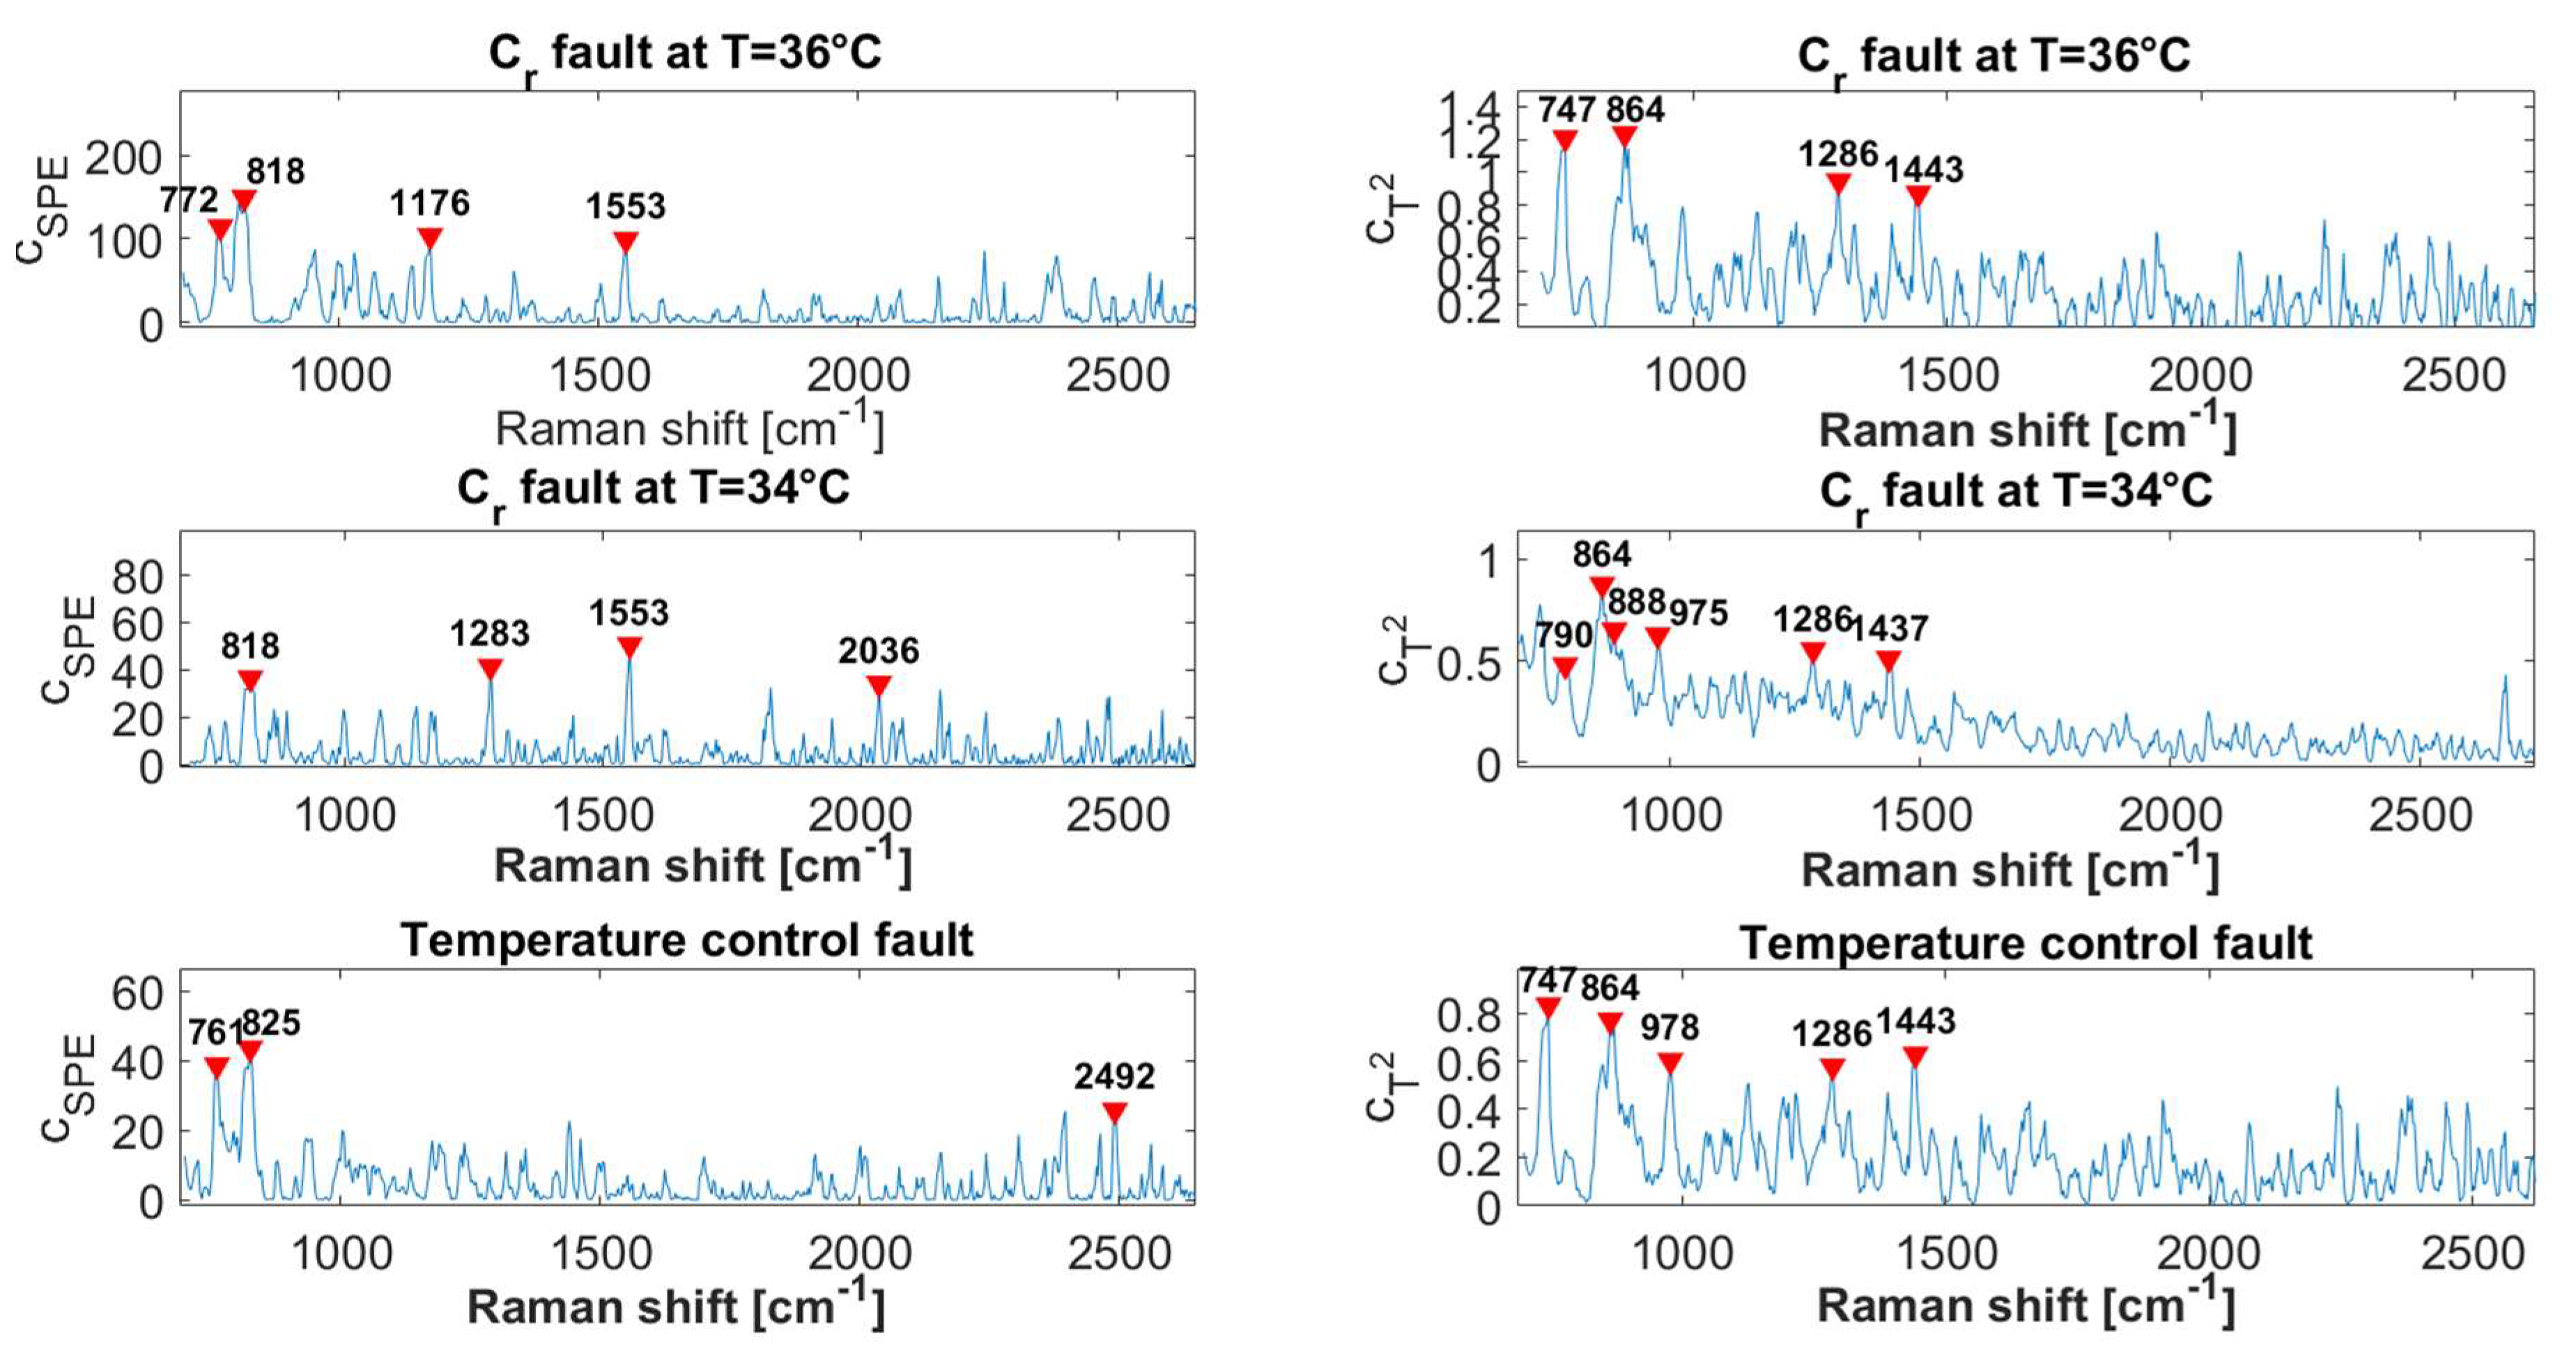
3.2.2. Fault Diagnosis
3.2.3. Comparison of Detection Algorithm Performance
4. Conclusions
Supplementary Materials
Author Contributions
Funding
Data Availability Statement
Acknowledgments
Conflicts of Interest
Abbreviations
| F | Fault |
| FAR | False Alarm Rate |
| FDR | Fault Discovery Rate |
| IMCU | International Milk Clotting Unit |
| LCL | Lower Control Limit |
| MSPC | Multivariate Statistical Process Control |
| NIR | Near InfraRed |
| NOC | Normal Operating Condition |
| PAT | Process Analytical Technology |
| PCA | Principal Component Analysis |
| SCI | Score Confidence Interval |
| SPE | Square Prediction Error |
| UCL | Upper Control Limit |
References
- Hassoun, A.; Jagtap, S.; Garcia-Garcia, G.; Trollman, H.; Pateiro, M.; Lorenzo, J.M.; Trif, M.; Rusu, A.V.; Aadil, R.M.; Šimat, V.; et al. Food Quality 4.0: From Traditional Approaches to Digitalized Automated Analysis. J. Food Eng. 2023, 337, 111216. [Google Scholar] [CrossRef]
- Castillo, M.; Lucey, J.A.; Payne, F.A. The Effect of Temperature and Inoculum Concentration on Rheological and Light Scatter Properties of Milk Coagulated by a Combination of Bacterial Fermentation and Chymosin. Cottage Cheese-Type Gels. Int. Dairy J. 2006, 16, 131–146. [Google Scholar] [CrossRef]
- Tajammal Munir, M.; Yu, W.; Young, B.R.; Wilson, D.I. The Current Status of Process Analytical Technologies in the Dairy Industry. Trends Food Sci. Technol. 2015, 43, 205–218. [Google Scholar] [CrossRef]
- Panikuttira, B.; O’Shea, N.; Tobin, J.T.; Tiwari, B.K.; O’Donnell, C.P. Process Analytical Technology for Cheese Manufacture. Int. J. Food Sci. Technol. 2018, 53, 1803–1815. [Google Scholar] [CrossRef]
- Duran-Villalobos, C.A.; Goldrick, S.; Lennox, B. Multivariate Statistical Process Control of an Industrial-Scale Fed-Batch Simulator. Comput. Chem. Eng. 2020, 132, 106620. [Google Scholar] [CrossRef]
- Castillo, M. Cutting Time Prediction Methods in Cheese Making. Encycl. Agric. Food Biol. Eng. 2006, 1, 1–7. [Google Scholar]
- Derra, M.; Bakkali, F.; Amghar, A.; Sahsah, H. Estimation of Coagulation Time in Cheese Manufacture Using an Ultrasonic Pulse-Echo Technique. J. Food Eng. 2018, 216, 65–71. [Google Scholar] [CrossRef]
- Pretto, D.; Kaart, T.; Vallas, M.; Jõudu, I.; Henno, M.; Ancilotto, L.; Cassandro, M.; Pärna, E. Relationships between Milk Coagulation Property Traits Analyzed with Different Methodologies. J. Dairy Sci. 2011, 94, 4336–4346. [Google Scholar] [CrossRef]
- Villaquiran, Z.; Zamora, A.; Arango, O.; Castillo, M. Inline Determination of the Gel Elastic Modulus During Milk Coagulation Using a Multifiber Optical Probe. Food Bioprocess Technol. 2024, 17, 3149–3161. [Google Scholar] [CrossRef]
- Strani, L.; Grassi, S.; Alamprese, C.; Casiraghi, E.; Ghiglietti, R.; Locci, F.; Pricca, N.; De Juan, A. Effect of Physicochemical Factors and Use of Milk Powder on Milk Rennet-Coagulation: Process Understanding by near Infrared Spectroscopy and Chemometrics. Food Control 2021, 119, 107494. [Google Scholar] [CrossRef]
- Sibono, L.; Tronci, S.; Hedegaard, M.A.B.; Errico, M.; Grosso, M. Monitoring of Milk Rennet Coagulation: Chemical and Physical Perspective Using Raman Spectroscopy. Appl. Food Res. 2025, 5, 100701. [Google Scholar] [CrossRef]
- Lyndgaard, C.B.; Engelsen, S.B.; Van Den Berg, F.W.J. Real-Time Modeling of Milk Coagulation Using in-Line near Infrared Spectroscopy. J. Food Eng. 2012, 108, 345–352. [Google Scholar] [CrossRef]
- Grassi, S.; Strani, L.; Alamprese, C.; Pricca, N.; Casiraghi, E.; Cabassi, G. A FT-NIR Process Analytical Technology Approach for Milk Renneting Control. Foods 2022, 11, 33. [Google Scholar] [CrossRef] [PubMed]
- De Beer, T.; Burggraeve, A.; Fonteyne, M.; Saerens, L.; Remon, J.P.; Vervaet, C. Near Infrared and Raman Spectroscopy for the In-Process Monitoring of Pharmaceutical Production Processes. Int. J. Pharm. 2011, 417, 32–47. [Google Scholar] [CrossRef] [PubMed]
- Nicolau, N.; Buffa, M.; O’Callaghan, D.J.; Guamis, B.; Castillo, M. Estimation of Clotting and Cutting Times in Sheep Cheese Manufacture Using NIR Light Backscatter. Dairy Sci. Technol. 2015, 95, 495–507. [Google Scholar] [CrossRef]
- Yang, M.; Ye, A.; Yang, Z.; Everett, D.W.; Gilbert, E.P.; Singh, H. Kinetics of Pepsin-Induced Hydrolysis and the Coagulation of Milk Proteins. J. Dairy Sci. 2022, 105, 990–1003. [Google Scholar] [CrossRef]
- Hayes, E.; Greene, D.; O’Donnell, C.; O’Shea, N.; Fenelon, M.A. Spectroscopic Technologies and Data Fusion: Applications for the Dairy Industry. Front. Nutr. 2023, 9, 1074688. [Google Scholar] [CrossRef]
- Schmid, M.; Rath, D.; Diebold, U. Why and How Savitzky-Golay Filters Should Be Replaced. ACS Meas. Sci. Au 2022, 2, 185–196. [Google Scholar] [CrossRef]
- Sibono, L.; Tronci, S.; Hedegaard, M.A.B.; Errico, M.; Grosso, M. PAT-Driven Dairy Processing: A Rheo-Raman-Based Kinetic Model for in-Line Prediction of Milk Coagulation Dynamics. Anal. Bioanal. Chem. 2025, 417, 5691–5702. [Google Scholar] [CrossRef]
- Pratt, W.K. Digital Image Processing, 4th ed.; John Wiley & Sons: Hoboken, NJ, USA, 2007. [Google Scholar]
- Brereton, R.G. Chemometrics for Pattern Recognition; Wiley: Hoboken, NJ, USA, 2009; ISBN 9780470987254. [Google Scholar]
- Ford Versypt, A.N.; Harrell, G.K.; McPeak, A.N. A Pharmacokinetic/Pharmacodynamic Model of ACE Inhibition of the Renin-Angiotensin System for Normal and Impaired Renal Function. Comput. Chem. Eng. 2017, 104, 311–322. [Google Scholar] [CrossRef]
- Lane, T.P.; Dumouchel, W.H. Simultaneous Confidence Intervals in Multiple Regression. Am. Stat. 1994, 48, 315–321. [Google Scholar] [CrossRef]
- Alcala, C.F.; Joe Qin, S. Analysis and Generalization of Fault Diagnosis Methods for Process Monitoring. J. Process Control 2011, 21, 322–330. [Google Scholar] [CrossRef]
- Reis, M.S.; Rendall, R.; Rato, T.J.; Martins, C.; Delgado, P. Improving the Sensitivity of Statistical Process Monitoring of Manifolds Embedded in High-Dimensional Spaces: The Truncated-Q Statistic. Chemom. Intell. Lab. Syst. 2021, 215, 104369. [Google Scholar] [CrossRef]
- Jul-Jørgensen, I.; Facco, P.; Gernaey, K.V.; Barolo, M.; Hundahl, C.A. Data Fusion of Raman Spectra in MSPC for Fault Detection and Diagnosis in Pharmaceutical Manufacturing. Comput. Chem. Eng. 2024, 184, 108647. [Google Scholar] [CrossRef]
- Zhao, M.; Markiewicz-Keszycka, M.; Beattie, R.J.; Casado-Gavalda, M.P.; Cama-Moncunill, X.; O’Donnell, C.P.; Cullen, P.J.; Sullivan, C. Quantification of Calcium in Infant Formula Using Laser-Induced Breakdown Spectroscopy (LIBS), Fourier Transform Mid-Infrared (FT-IR) and Raman Spectroscopy Combined with Chemometrics Including Data Fusion. Food Chem. 2020, 320, 126639. [Google Scholar] [CrossRef] [PubMed]
- Stephani, R.; de Sá Oliveira, K.; de Almeida, C.E.R.; Perrone, Í.T.; de Carvalho, A.F.; de Oliveira, L.F.C.; Almeida, M.R. Raman Spectroscopy as a Tool to Identify Modification of Whey Protein Concentrate (WPC) during Shelf Life. Food Packag. Shelf Life 2017, 11, 1–9. [Google Scholar] [CrossRef]
- Rodrigues Júnior, P.H.; De Sá Oliveira, K.; De Almeida, C.E.R.; De Oliveira, L.F.C.; Stephani, R.; Pinto, M.D.S.; De Carvalho, A.F.; Perrone, Í.T. FT-Raman and Chemometric Tools for Rapid Determination of Quality Parameters in Milk Powder: Classification of Samples for the Presence of Lactose and Fraud Detection by Addition of Maltodextrin. Food Chem. 2016, 196, 584–588. [Google Scholar] [CrossRef]
- Panthi, R.R.; Shibu, S.N.; Ochalski, T.J.; O’Mahony, J.A. Raman Spectra of Micellar Casein Powders Prepared with Wet Blending of Glycomacropeptide and Micellar Casein Concentrate. Int. J. Dairy Technol. 2023, 76, 429–435. [Google Scholar] [CrossRef]
- El-Abassy, R.M.; Eravuchira, P.J.; Donfack, P.; Von Der Kammer, B.; Materny, A. Fast Determination of Milk Fat Content Using Raman Spectroscopy. Vib. Spectrosc. 2011, 56, 3–8. [Google Scholar] [CrossRef]
- Abdelgawad, A.R.; Guamis, B.; Castillo, M. Using a Fiber Optic Sensor for Cutting Time Prediction in Cheese Manufacture from a Mixture of Cow, Sheep and Goat Milk. J. Food Eng. 2014, 125, 157–168. [Google Scholar] [CrossRef]
- Grassi, S.; Strani, L.; Casiraghi, E.; Alamprese, C. Control and Monitoring of Milk Renneting Using FT-NIR Spectroscopy as a Process Analytical Technology Tool. Foods 2019, 8, 405. [Google Scholar] [CrossRef]


| Label | Temperature [°C] | Rennet Concentration [IMCU/mL of Milk] | Replications | Operative Category |
|---|---|---|---|---|
| NOC1 | 34 | 0.029 | 4 | NOC |
| NOC2 | 36 | 0.029 | 4 | NOC |
| NOC3 | 38 | 0.029 | 4 | NOC |
| F1 | 34 | 0.007 | 2 | Fault |
| F2 | 36 | 0.007 | 1 | Fault |
| F3 | 38 | 0.007 | 1 | Fault |
| F4 | T0 = 38 °C | 0.0145 | 1 | Fault |
| F5 | 34 | 0.0145 | 1 | Fault |
| F6 | 36 | 0.0145 | 1 | Fault |
| F7 | 38 | 0.0145 | 1 | Fault |
| Parameter | # Consecutive Points | α | Accuracy | FDR | FAR | [min] |
|---|---|---|---|---|---|---|
| SCI | 10 | 0.01 | 0.89 | 0.96 | 0.18 | 13.3 |
| Non-linear model | 5 | 0.01 | 0.996 | 1 | 0.01 | 8.5 |
| T2 | 1 | 0.09 | 0.93 | 0.85 | 0.003 | 6.5 |
| SPE | 3 | 0.03 | 0.95 | 1 | 0.09 | 7.6 |
| SPE and T2 | 1 | 0.07 | 0.92 | 0.83 | 0 | 7.2 |
| SPE or T2 | 3 | 0.03 | 0.96 | 0.99 | 0.09 | 7.0 |
Disclaimer/Publisher’s Note: The statements, opinions and data contained in all publications are solely those of the individual author(s) and contributor(s) and not of MDPI and/or the editor(s). MDPI and/or the editor(s) disclaim responsibility for any injury to people or property resulting from any ideas, methods, instructions or products referred to in the content. |
© 2025 by the authors. Licensee MDPI, Basel, Switzerland. This article is an open access article distributed under the terms and conditions of the Creative Commons Attribution (CC BY) license (https://creativecommons.org/licenses/by/4.0/).
Share and Cite
Sibono, L.; Tronci, S.; Hedegaard, M.A.B.; Errico, M.; Grosso, M. Raman Spectroscopy Coupled with Multivariate Statistical Process Control for Detecting Anomalies During Milk Coagulation. Processes 2025, 13, 3519. https://doi.org/10.3390/pr13113519
Sibono L, Tronci S, Hedegaard MAB, Errico M, Grosso M. Raman Spectroscopy Coupled with Multivariate Statistical Process Control for Detecting Anomalies During Milk Coagulation. Processes. 2025; 13(11):3519. https://doi.org/10.3390/pr13113519
Chicago/Turabian StyleSibono, Leonardo, Stefania Tronci, Martin Aage Barsøe Hedegaard, Massimiliano Errico, and Massimiliano Grosso. 2025. "Raman Spectroscopy Coupled with Multivariate Statistical Process Control for Detecting Anomalies During Milk Coagulation" Processes 13, no. 11: 3519. https://doi.org/10.3390/pr13113519
APA StyleSibono, L., Tronci, S., Hedegaard, M. A. B., Errico, M., & Grosso, M. (2025). Raman Spectroscopy Coupled with Multivariate Statistical Process Control for Detecting Anomalies During Milk Coagulation. Processes, 13(11), 3519. https://doi.org/10.3390/pr13113519


