Article

Raman Spectroscopy Coupled with Multivariate Statistical Process Control for Detecting Anomalies During Milk Coagulation

by
Leonardo Sibono
1,
Stefania Tronci
1,
Martin Aage Barsøe Hedegaard
2,
Massimiliano Errico
2 and
Massimiliano Grosso
1,2,*
1
Dipartimento di Ingegneria Meccanica, Chimica e dei Materiali, Università degli Studi di Cagliari, Via Marengo 2, 09123 Cagliari, Italy
2
Department of Green Technology, University of Southern Denmark, Campusvej 55, 5230 Odense, Denmark
*
Author to whom correspondence should be addressed.
Processes 2025, 13(11), 3519; https://doi.org/10.3390/pr13113519
Submission received: 1 October 2025 / Revised: 29 October 2025 / Accepted: 31 October 2025 / Published: 3 November 2025

Abstract

This study explores the potential of Raman spectroscopy as a screening tool for fault detection in dairy processing, focusing its application on milk rennet coagulation. Multivariate Statistical Process Control techniques were employed to analyze spectral data collected under both nominal and failure conditions, with the aim of identifying deviations from normal operating conditions. Both global and local Principal Component Analysis-based algorithms were employed to detect two types of fault conditions, namely, rennet concentration and temperature control failures. High performance was obtained by each algorithm, reaching up to an accuracy of 99.8% and a minimum detection time of 7 min after rennet addition, which is earlier than the milk phase transition, meaning that the fault can be detected before it affects the product’s quality. The fault diagnosis revealed consistent fault-related Raman shifts, below 900 cm−1 and between 1100 and 1600 cm−1, suggesting that these spectral features may serve as reliable indicators of process failure sources. The results supported the reliability of Raman spectroscopy as a Process Analytical Technology tool for monitoring dairy processes.

Graphical Abstract

1. Introduction

Modern food manufacturing’s demand for real-time, non-invasive monitoring technologies has grown significantly, driven by the need to ensure consistent product quality, operational efficiency, and regulatory compliance [1]. In the context of dairy processes like cheesemaking, the final product’s quality is highly sensitive to process variations in the manufacturing line, where even minor deviations can significantly affect the texture, flavor, and safety of the final product [2]. In particular, several critical quality attributes of cheese (e.g., fat and whey content, cheese yield, and firmness) are heavily dependent on how milk is processed along the production line. The adoption of the Process Analytical Technology (PAT) rationale for continuous monitoring and control of Critical Processing Parameters (CPPs) in dairy manufacturing holds the benefit of significantly reducing the production of off-spec products while simultaneously enhancing process efficiency, productivity, and overall profitability [3]. It has been reported that PAT application in cheesemaking is required for five critical control points to ensure satisfactory quality of the end product: (1) milk quality and composition; (2) milk standardization; (3) milk coagulation and syneresis; (4) curd moisture and salt content; and (5) cheese ripening [4]. However, unacceptable deviations in product quality from the required specifications that occur during these production steps often become apparent only at the end of the production line. As a result, there is a widespread reliance on offline methods for quality testing of final products, leading to economic loss; food waste; or, in the worst cases, product recall [4].
As a consequence, the final product quality would significantly benefit from the stage-by-stage application of monitoring strategies that enable the identification of deviations in CPPs from the so-called “golden batch” trajectory, that is, the set of optimal process conditions known to consistently produce in-specification products [5]. Therefore, ensuring product quality requires more than simply adhering to a final product quality perspective; it is equally essential to maintain CPPs within their optimal ranges at each individual stage of production. In the specific case of milk coagulation, the improper start-up and conduction of this process can result in several defects, including undesirable moisture levels in the curd, which subsequently compromise the ripening process [6]. The gelation process that occurs during milk coagulation represents a particularly critical step, where the CPPs’ role is conventionally covered up by viscoelastic properties measured by means of a manual operator’s assessment, lactodynamography, or rheological measurements [7,8,9]. However, such techniques are known to be intrusive and unsuitable for the current industrial applications [10,11], highlighting the need to implement alternative monitoring approaches.
To date, process monitoring of milk enzymatic coagulation has been extensively investigated using NIR spectroscopy [10,12,13]. In the study reported by Grassi et al. [13], the authors proposed a novel application of Multivariate Statistical Process Control (MSPC) to milk coagulation. However, achieving comprehensive fault diagnosis (i.e., identifying the source of a failure) can be challenging when relying on NIR spectroscopy due to its high sensitivity to water content [14]. Despite the current research in this field being largely focused on the identification of coagulation time and optimal curd cutting time, which are technical parameters of high relevance in the dairy industry, little attention has been paid to how process monitoring can support fault diagnosis. In particular, the evaluation of how early a fault is detected can offer timely and effective information for prompt intervention. Indeed, it is well known that the phase transition induced by casein coagulation occurs only after a certain lag time following enzyme addition due to the enzymatic hydrolysis step [15,16]. At this early stage, the system allows for corrective actions, such as temperature adjustment, enzyme concentration correction, or pH modulation, to be effectively implemented before the occurrence of irreversible colloid destabilization. This means that the ability to detect process faults prior to the onset of the phase transition during milk coagulation represents a critical advantage for process control in dairy production. In this regard, Raman spectroscopy benefits from a higher sensitivity to organic molecular structures, opening up the path for multiple applications such as process monitoring and chemical characterization [11,17].
The occurrence of deviation from normal operating conditions (NOCs) is here simulated by mimicking two types of faults: reduction in enzyme concentration and temperature control shutdown. In this regard, the present investigation intends to address the following tasks:
  • To provide a critical analysis of global and local MSPC algorithms to identify the optimal fault detection configuration to correctly discriminate NOC experiments from faulty ones.
  • To carry out a fault diagnosis procedure that allows us to identify the specific source of a fault.
  • To assess whether the fault detection algorithms identify process deviations prior to the onset of gelation.
This methodology aims to establish a basis for time-efficient fault detection under the hypothesis that Raman signal variation supported by MSPC tools enables the early identification of process anomalies. The diagnosis strategy presented herein can be further exploited to keep the CPP inside the optimal operational window, paving the path to a potential reduction in product losses and improvement of final product consistency.

2. Materials and Methods

2.1. Sample Preparation and Experimental Design

Reconstituted skimmed milk powder was prepared according to the procedure reported in a previous work [11]. Briefly, the solution was mixed for 20 min at room temperature using a magnetic stirrer at a frequency of 350 rpm. CaCl2 (≥99%, Sigma-Aldrich, Merck KGaA, Darmstadt, Germany) was added to the solution to improve casein micelle aggregation, reaching a concentration of added salt equal to 3 mM. After reconstitution, milk was stored for 30 min at 4 °C to enhance casein hydration. Samples were heated to the operative temperature by means of a water bath. When the thermal equilibrium was reached, a Chymosin 85 ± 3% and Pepsin 15 ± 3% calf rennet solution (Hjemmeriet, Ringsted, Denmark, 145 IMCU mL−1 of rennet) was added to the milk, and stirred for 30 s. The NOC experiments set consists of three temperature levels (34 °C, 36 °C, 38 °C) and a rennet concentration of 0.029 IMCU mL−1 of milk. The experiments were quadruplicated, yielding 12 NOC assays. Eight additional experiments were conducted to simulate faulty conditions. Four of these were carried out at 34 °C (in duplicate), 36 °C, and 38 °C, each with only 0.007 IMCU mL−1 of milk. The other three fault experiments were conducted at 34 °C, 36 °C, and 38 °C, each with half of the nominal rennet concentration (0.0145 IMCU mL−1 of milk). These seven experiments were denoted as rennet concentration (Cr) faults. The use of two different scenarios of Cr faults allowed us to investigate the sensitivity of Raman signals to different failure extents. An additional fault experiment was conducted at an initial temperature of 38 °C, after which the water bath temperature was abruptly reduced to room temperature, serving as a combined rennet–temperature control system failure. Table 1 summarizes the experimental design for the coagulation assays.

2.2. Raman Measurements

Raman acquisitions were performed through a Raman immersion probe (Ocean Insights, Dunedin, FL, USA) using a 785 nm fiber-coupled laser (B&W TEK Inc., Newark, NJ, USA) with an output power of 200 mW at the sample. This was coupled with a QE Pro-Raman+ (Ocean Insights, Dunedin, FL, USA) operating in a range of 350–3033 cm−1 and a resolution of 10–14 cm−1. Every acquisition was obtained by averaging 30 spectra, with an integration time of 1 s, resulting in a sampling interval of 30 s. Each time run provided 953 Raman intensities for 119 temporal acquisitions. Raman measurements were supported with the OceanView 2.0.14 software (Ocean Optics, Orlando, FL, USA).

2.3. Statistical Analysis

Every computation shown in this work was performed using Matlab®2023a. The fault detection algorithms and model validation were carried out through Matlab codes developed by the authors. The following is a description of the algorithms and data preprocessing procedures.

2.3.1. Preprocessing

The spectral acquisitions were assembled into a three-way data structure (N × P × K), where N is the number of acquisitions per experiment (119), P is the number of Raman shifts (953), and K is the number of experiments (20). Data were preprocessed through the Savitzky–Golay filter to smooth the data by fitting successive windows of data points to the polynomial of a specified degree while preserving the original shape of the signal [18]. A second-order polynomial and a frame length of 15 were used, as this preprocessing provided sufficient smoothing without removing the relevant information [19]. Moreover, spectra were subjected to one-dimensional three-order median filtering along the renneting times to dampen the effect of eventual outliers [20], thus removing cosmic spikes. Similar to other spectroscopical techniques applied within the framework of this study, baseline variation is an indication of the coagulation progress related to the modification of physical properties and, therefore, should not be removed by preprocessing [10]. Notably, Savitzky–Golay filtering was applied along the Raman shift dimension, while median filtering was performed along the sampling times for each individual Raman shift, thus avoiding overlapping the effects of the two techniques [11].

2.3.2. Fault Detection Algorithms

In this study, MSPC principles are applied to a batch process, which differs from fault analysis in continuous processes, as it requires focusing on a desired dynamic behavior over time. In this study, Principal Component Analysis (PCA)-based modeling was employed to extract relevant patterns from the Raman spectral dataset. Only one principal component was selected to calibrate the PCA model, as it was sufficient to capture the dominant variability associated with the coagulation process dynamics. Moreover, no additional information was obtained from the exploratory analysis of higher-dimensional PCs. The model can be represented according to the following Equation [21]:
X = t   p T + E
where X denotes the data matrix, and E is the residual matrix, while t and p are, respectively, the score and the loading vectors related to PC1. Six algorithms were employed for the assessment of NOC and fault experiments:
  • PC score confidence interval (SCI) algorithm.
  • PC score non-linear regression model-based fault detection.
  • T2-based fault detection.
  • Squared Prediction Error (SPE)-based fault detection algorithm.
  • SPE- or T2-based algorithm.
  • SPE- and T2-based algorithm
For all the algorithms, the fault detection quality was assessed through Fault Discovery Rate (FDR), false alarm rate (FAR), and accuracy. FDR, FAR, and accuracy were computed by means of a cross-validation scheme. Specifically, the calibration step involved the random selection of nine out of the twelve NOC samples, whereas the remaining three NOC samples were reserved as validation experiments for FAR assessment, and eight fault samples were used for FDR calculation. Before performing PCA decomposition, the three-way data tensor made of calibration experiments was unfolded to form a (P × NKcal) dimensional structure. Here, Kcal denotes the number of calibration experiments. Subsequently, the specific fault detection algorithms described below were applied. This procedure was repeated 100 times, out of which the average accuracy, FAR, and FDR were calculated. The validation protocol was used to tune the hyperparameters (i.e., parameters that are set before training and adjusted to improve fault detection performance). Unlike the conventional model parameters, which are directly derived from data, hyperparameter selection is driven by the model’s accuracy.
Algorithms 1 and 2 belong to the global PCA category, as the model and confidence limits are built on all N acquisitions associated with the calibration samples (Overall, N Kcal). Conversely, Algorithms 3–6 are associated with local PCA-based models, wherein the model statistics evolve over time. This results in fluctuating control limits that dynamically adapt to the variability inherent in each individual data acquisition for the calibration samples. Among the investigated methodologies, only two methods are described here, as they outperformed the others in terms of classification accuracy. These include a global PCA-based model (PC scores non-linear regression model-based fault detection) and a local PCA-based model (SPE- or T2-based algorithm). A detailed explanation of Algorithms 1, 3, 4 and 6 is reported in the Supplementary Materials, Section S.1.
In PC score non-linear regression model-based fault detection, a PCA model is trained using NOC calibration samples and employed to compute the loading values. PC1 scores (denoted as S1) are modeled through a Hill-type sigmoidal equation [22]:
S ^ 1 ( t ) = B + L 1 + C t D
In Equation (2), B is the offset parameter; L is a parameter such that B + L corresponds to the asymptotic value; C is a displacement parameter along the x-axis; and D is the Hill coefficient, which defines the steepness of the function. Acquisitions from NOC and fault validation samples were sequentially projected into the PC space and compared to the model’s Upper Control Limit (UCL) and Lower Control Limit (LCL), defined by the prediction confidence interval at the relevant acquisition time [23]. The sample is then classified as a fault if all projected values in a preselected time window exceed the UCL or fall below the LCL. In this algorithm, the prediction confidence level (1-α) and the number of consecutive points falling outside the NOC region required to trigger the alarm were considered the hyperparameters of interest.
The SPE- or T2-based algorithm is the local counterpart of the investigated MSPC model. The first PC was used for dimensionality reduction, and the T2 statistic was calculated to evaluate deviations from the normal operational state [24]:
T i 2 = t i λ 1 1 t i T
where t i is the PC1 score value for the i-th acquisition, and λ 1 is the relevant eigenvalue. The UCL for the T2 statistic was computed using a χ2-distribution-based threshold [25].
T l i m 2 = σ T 2 2 2 μ T 2 χ α 2 2 μ T 2 2 σ T 2 2
where μ T 2 and σ T 2 2 are the sample mean and variance for T2 obtained from each individual acquisition of the calibration set. This implies a dynamic evolution of the limit statistics. Concurrently, the SPE statistic was also computed [26]:
S P E = e i T   e i
where e i is the (P × 1) error vector related to the i-th acquisition. The UCL for the SPE was computed as [27]
S P E l i m = θ 1 1 + θ 2 h 0 h 0 1 θ 1 2 + c α h 0 2 θ 2 θ 1 1 h 0
for which it can be written such that
θ k = r = 2 P λ r k
h 0 = 1 2 θ 1 θ 3 3   θ 2 2
In Equation (6), c α is the α-th upper percentile of a normal distribution with zero mean and unity variance. The fault detection algorithm assessed deviations from NOCs using an approach based on the number of consecutive points above the limit [26]. Specifically, Raman spectra from the validation samples (3 NOCs and 8 faults) were iteratively projected onto the PC space built by training spectra corresponding to a single, continuously updated experimental time point. Subsequently, the T2 and SPE statistics for the validation acquisition were computed and compared to the corresponding limit value for a predefined number of consecutive points. If all consecutive T2 or SPE values exceeded the limit, a fault was detected. The projection is performed until a fault is detected or all acquisitions of the same experiment are considered. Different values of consecutive points used to raise the alarm and α values were assessed. The combination of hyperparameters that maximized accuracy was selected as optimal. Once the T2- or SPE-based model was tuned, the variables’ contribution was assessed to perform the fault diagnosis, that is, the identification of which Raman shifts mostly contribute to the deviation of T2 and the SPE from the NOC behavior. Complete Decomposition Contributions (CDCs) applied to a one-dimensional PC subspace were employed for T2 and SPE statistics [24]:
c i T 2 = p p T x i λ 1 2
c i S P E = e i 2 = x i x ^ i 2 = x i t i p T
where x i denotes the i-th spectrum acquired experimentally, while x ^ i is the corresponding PCA-model estimation. The use of local-PCA implies the loss of time correlation information between successive samples [26], which, although essential for investigating technological parameters such as curd cutting time [11], does not constitute a critical requirement for fault detection purposes. After tuning the models with the optimal combination of hyperparameters, the average time at fault was computed to assess how quickly the failure is detected. This time parameter was ultimately used as a comparison metric for the selection of the best algorithm.

3. Results and Discussion

Before validating the algorithms, the Raman spectra from the entire dataset were explored using a PCA model. This operation was carried out to visually highlight differences between NOC and fault experiments. Figure 1 emphasizes the divergence between the NOC and fault experiments in terms of PC1 evolution over time. As can be observed from the sigmoidal shape of the PC1 vs. time profile, the scores related to the first PC account for the dynamic evolution of curd firmness during milk coagulation, explaining 43% of the total variance. On the other hand, the second and third principal components, which respectively explain 12% and 11% of the variance, did not provide any additional information and were therefore discarded from the analysis, along with the higher-dimensional PCs. Fault experiments F1, F2, and F3 led to a delay in milk gelation, reflected by the sluggish dynamics of the relevant PC1 scores. To a lesser extent, similar conclusions can be drawn from F5, F6, and F7, where half of the nominal concentration was employed to coagulate the milk. In addition, the temperature drop induced by switching off the water bath (F4) results in a thermal limitation on coagulation kinetics. In this case, the PC1 values fell inside the NOC area for up to 8 min, after which the curve trajectory dropped below the lower limit. This delay is likely due to the probe position near the surface and close to the center of the cylindrical beaker: under quiescent conditions, heat transfer occurs predominantly by conduction, so that the effect of thermal disturbance requires time to establish a significant radial temperature gradient within the system and become detectable by the probe.
Six different algorithms were subjected to cross-validation in order to evaluate their ability to detect faults in milk coagulation induced by temperature control failures and reduced rennet dosage. For each algorithm, the hyperparameters were tuned according to the respective accuracy maximization. To this end, the non-linear regression model-based fault detection (2) and T2 or SPE Algorithm 5 are discussed in the following sections. The results obtained from the application of Algorithms 1, 3, 4 and 6 are reported in the Supplementary Materials, Sections S.2 and S.3.

3.1. PC Scores Non-Linear Regression Model-Based Fault Detection

Equation (2) was used to model the PC1 score profile evolution of the NOC samples, establishing a reference trajectory of curd properties as monitored through Raman spectroscopy. Based on the global PCA principles, Algorithm 2 provides an equation-based approach that exhibits low sensitivity to noise, as it performs data fitting on PC1 associated with each spectral acquisition. By fitting Equation (2) to PC1 scores from NOC experiments, the following parameters were obtained [26]:
S ^ 1 = 2.69 + 3.51 1 + 8.07 t 2.72
For this non-linear regression model, R2 = 0.91, indicating that the equation was capable of satisfactorily capturing the variability of S1, along with narrow parameter confidence intervals (from 6 to 12% of the estimated value), denoting a low correlation among the parameters.
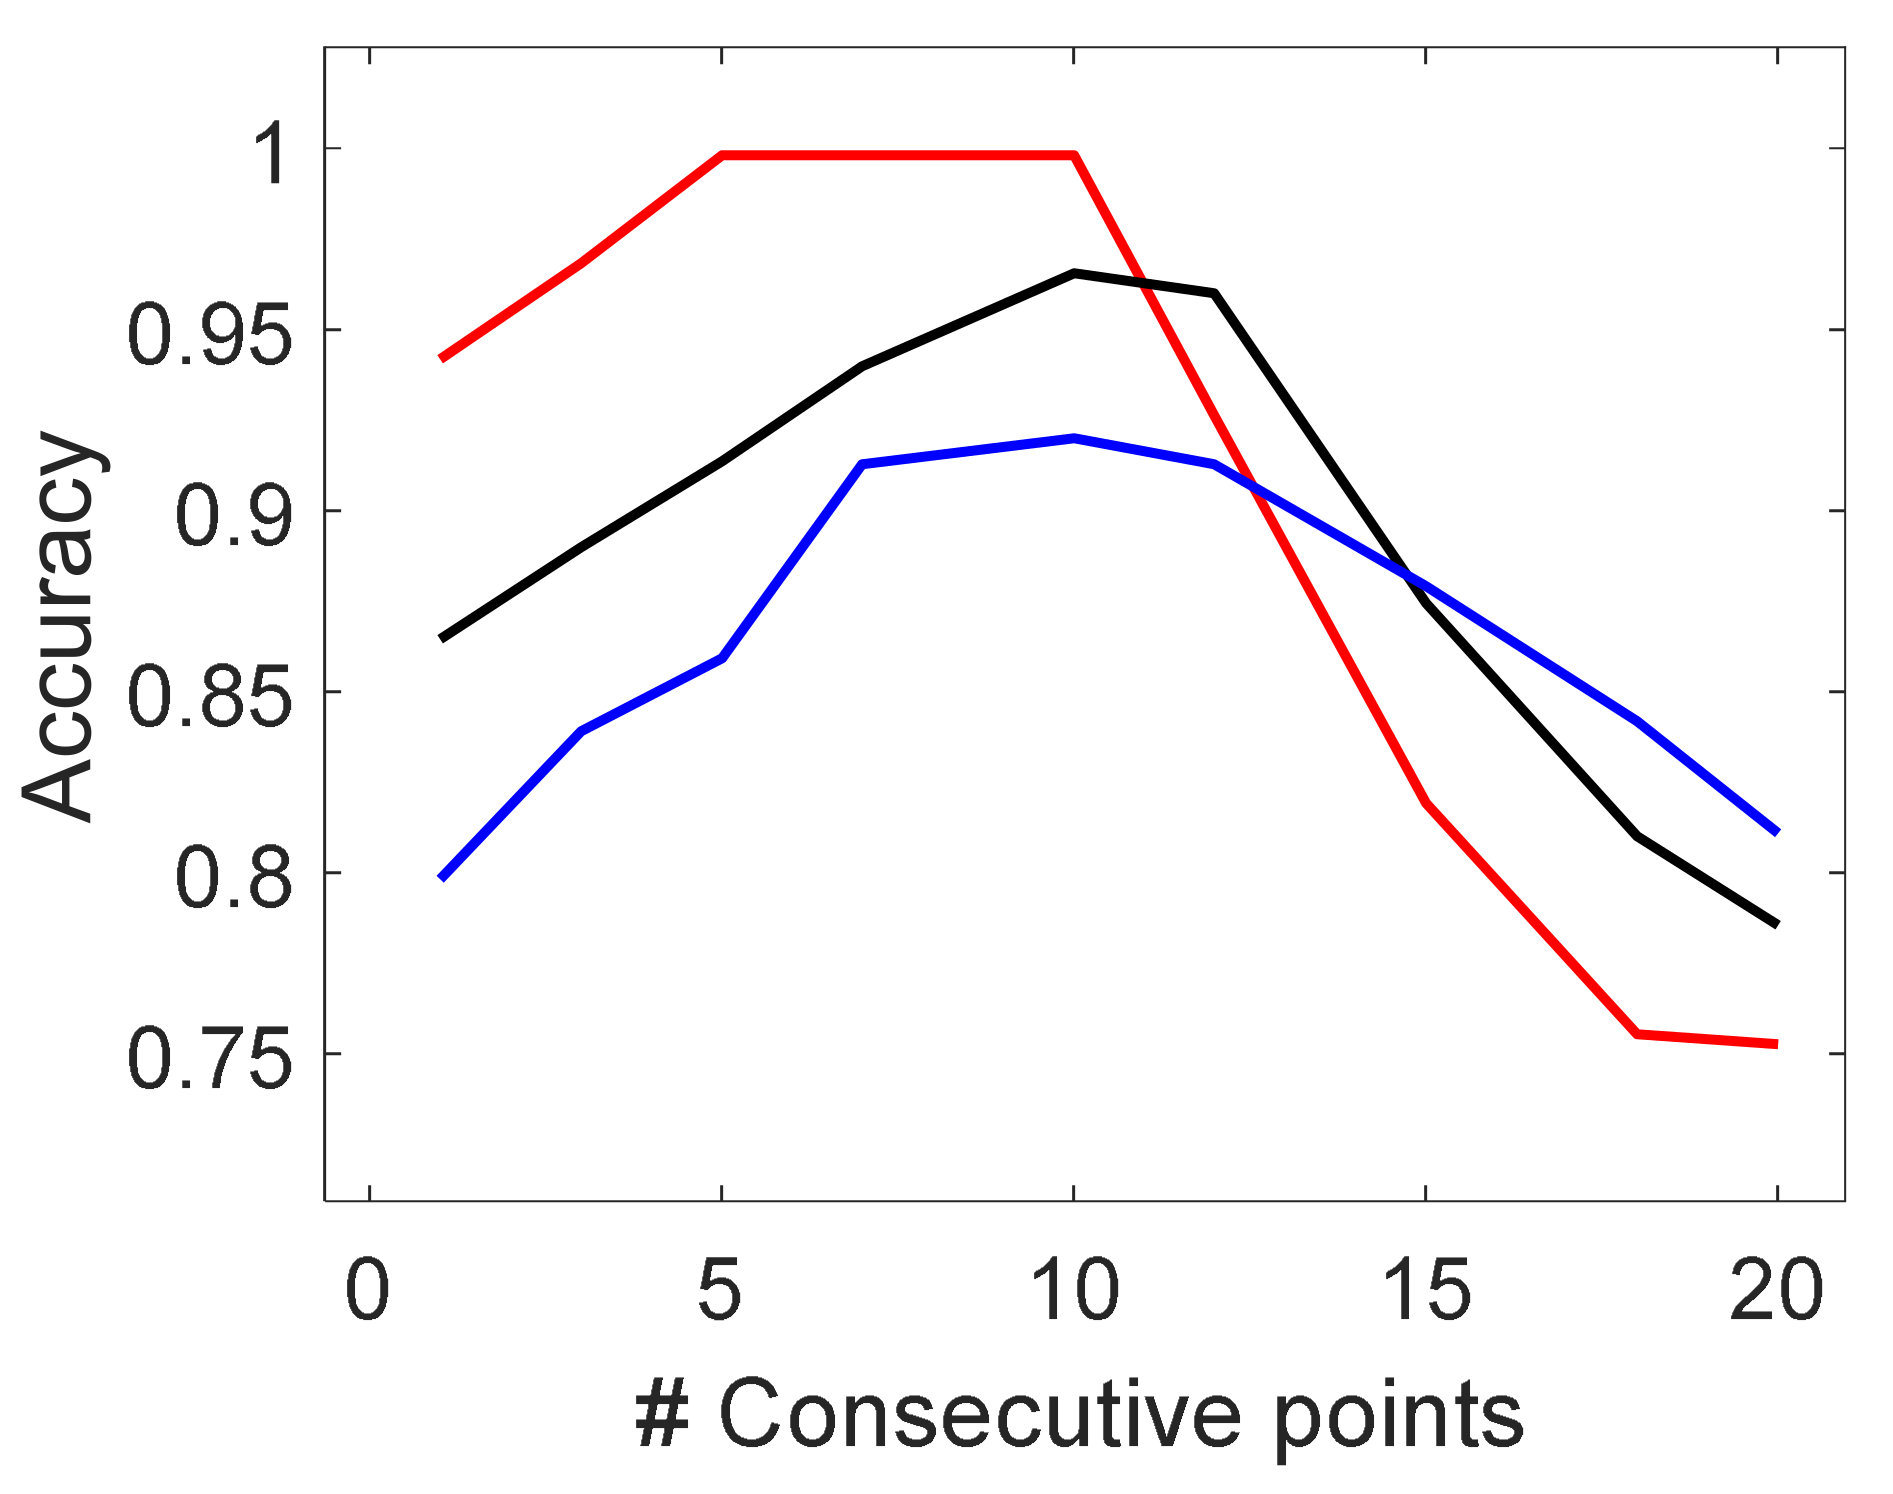
The non-linear equation, Equation (11), depicting the overall behavior of the NOC batches, was supplemented with the UCL and LCL to delineate the region of acceptability. The deviation from nominal conditions was assessed for each individual acquisition through the difference between its PC1 value and the model’s prediction confidence interval. To this end, Figure 2 shows the accuracy profile when varying the number of consecutive points to trigger the alarm for three confidence levels (1-α). As can be observed, by fixing the confidence level, it is possible to determine the number of consecutive acquisitions that maximizes the number of correctly classified batches, hence achieving the highest accuracy. From Figure 2, it is possible to infer that the detection performance is strongly sensitive to the value of α. Indeed, the maximum achievable accuracy increased by 3 percentage points when reducing α from 0.05 to 0.01 and by 8 percentage points when changing the significance level from 0.09 to 0.01.
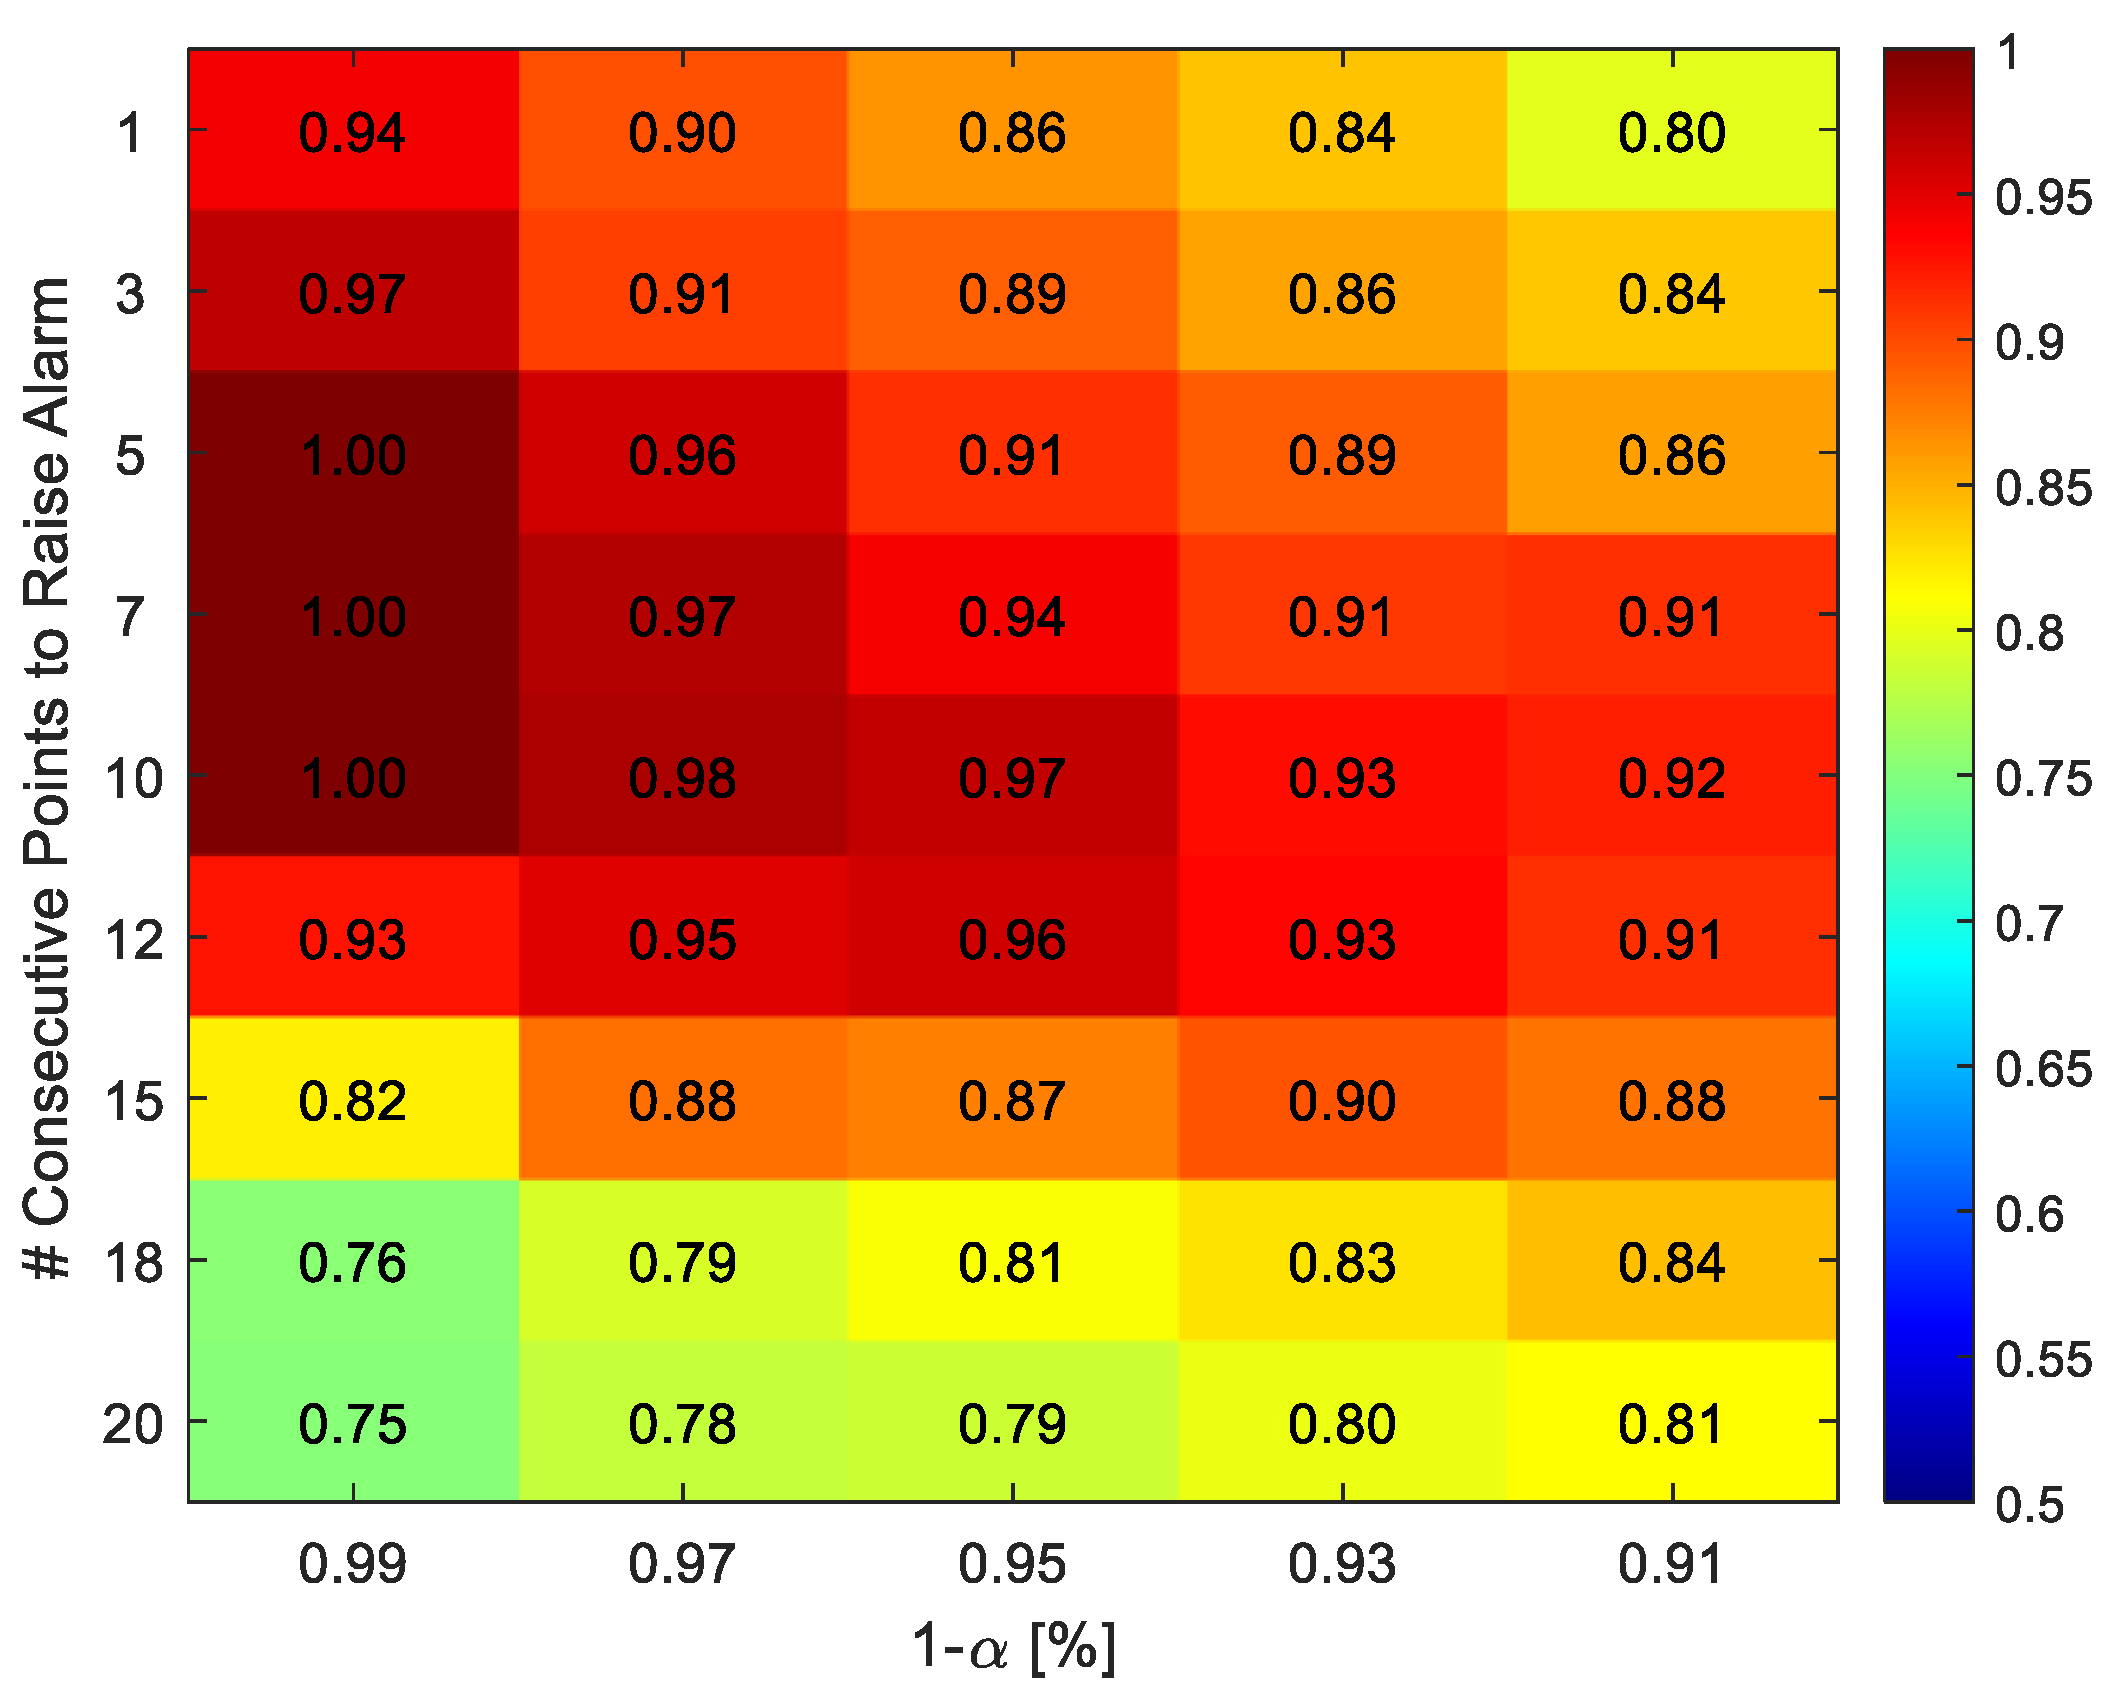
In order to precisely find the optimal configuration of the detection algorithm, one has to decrease the mesh size of the hyperparameter grid. To this end, the accuracy heatmap offers a clear visualization of the algorithm’s performance profile. Figure 3 depicts the accuracy profile over the hyperparameter space associated with the application of Algorithm 2 to the cross-validation scheme, highlighting that the optimal performance was obtained for a confidence level of 0.99 combined with five consecutive points outside the NOC region, for which an accuracy of 99.82% and a unitary FDR were obtained.
The hyperparameter combination that maximized the accuracy was applied to the whole dataset to graphically illustrate its fault detection capabilities (Figure 4). Under fault conditions, the PC1 trajectories systematically deviated from the nominal behavior, as they surpassed the control boundaries for at least five consecutive acquisitions. Overall, this model resulted in the fast and accurate identification of faults while retaining a high specificity.
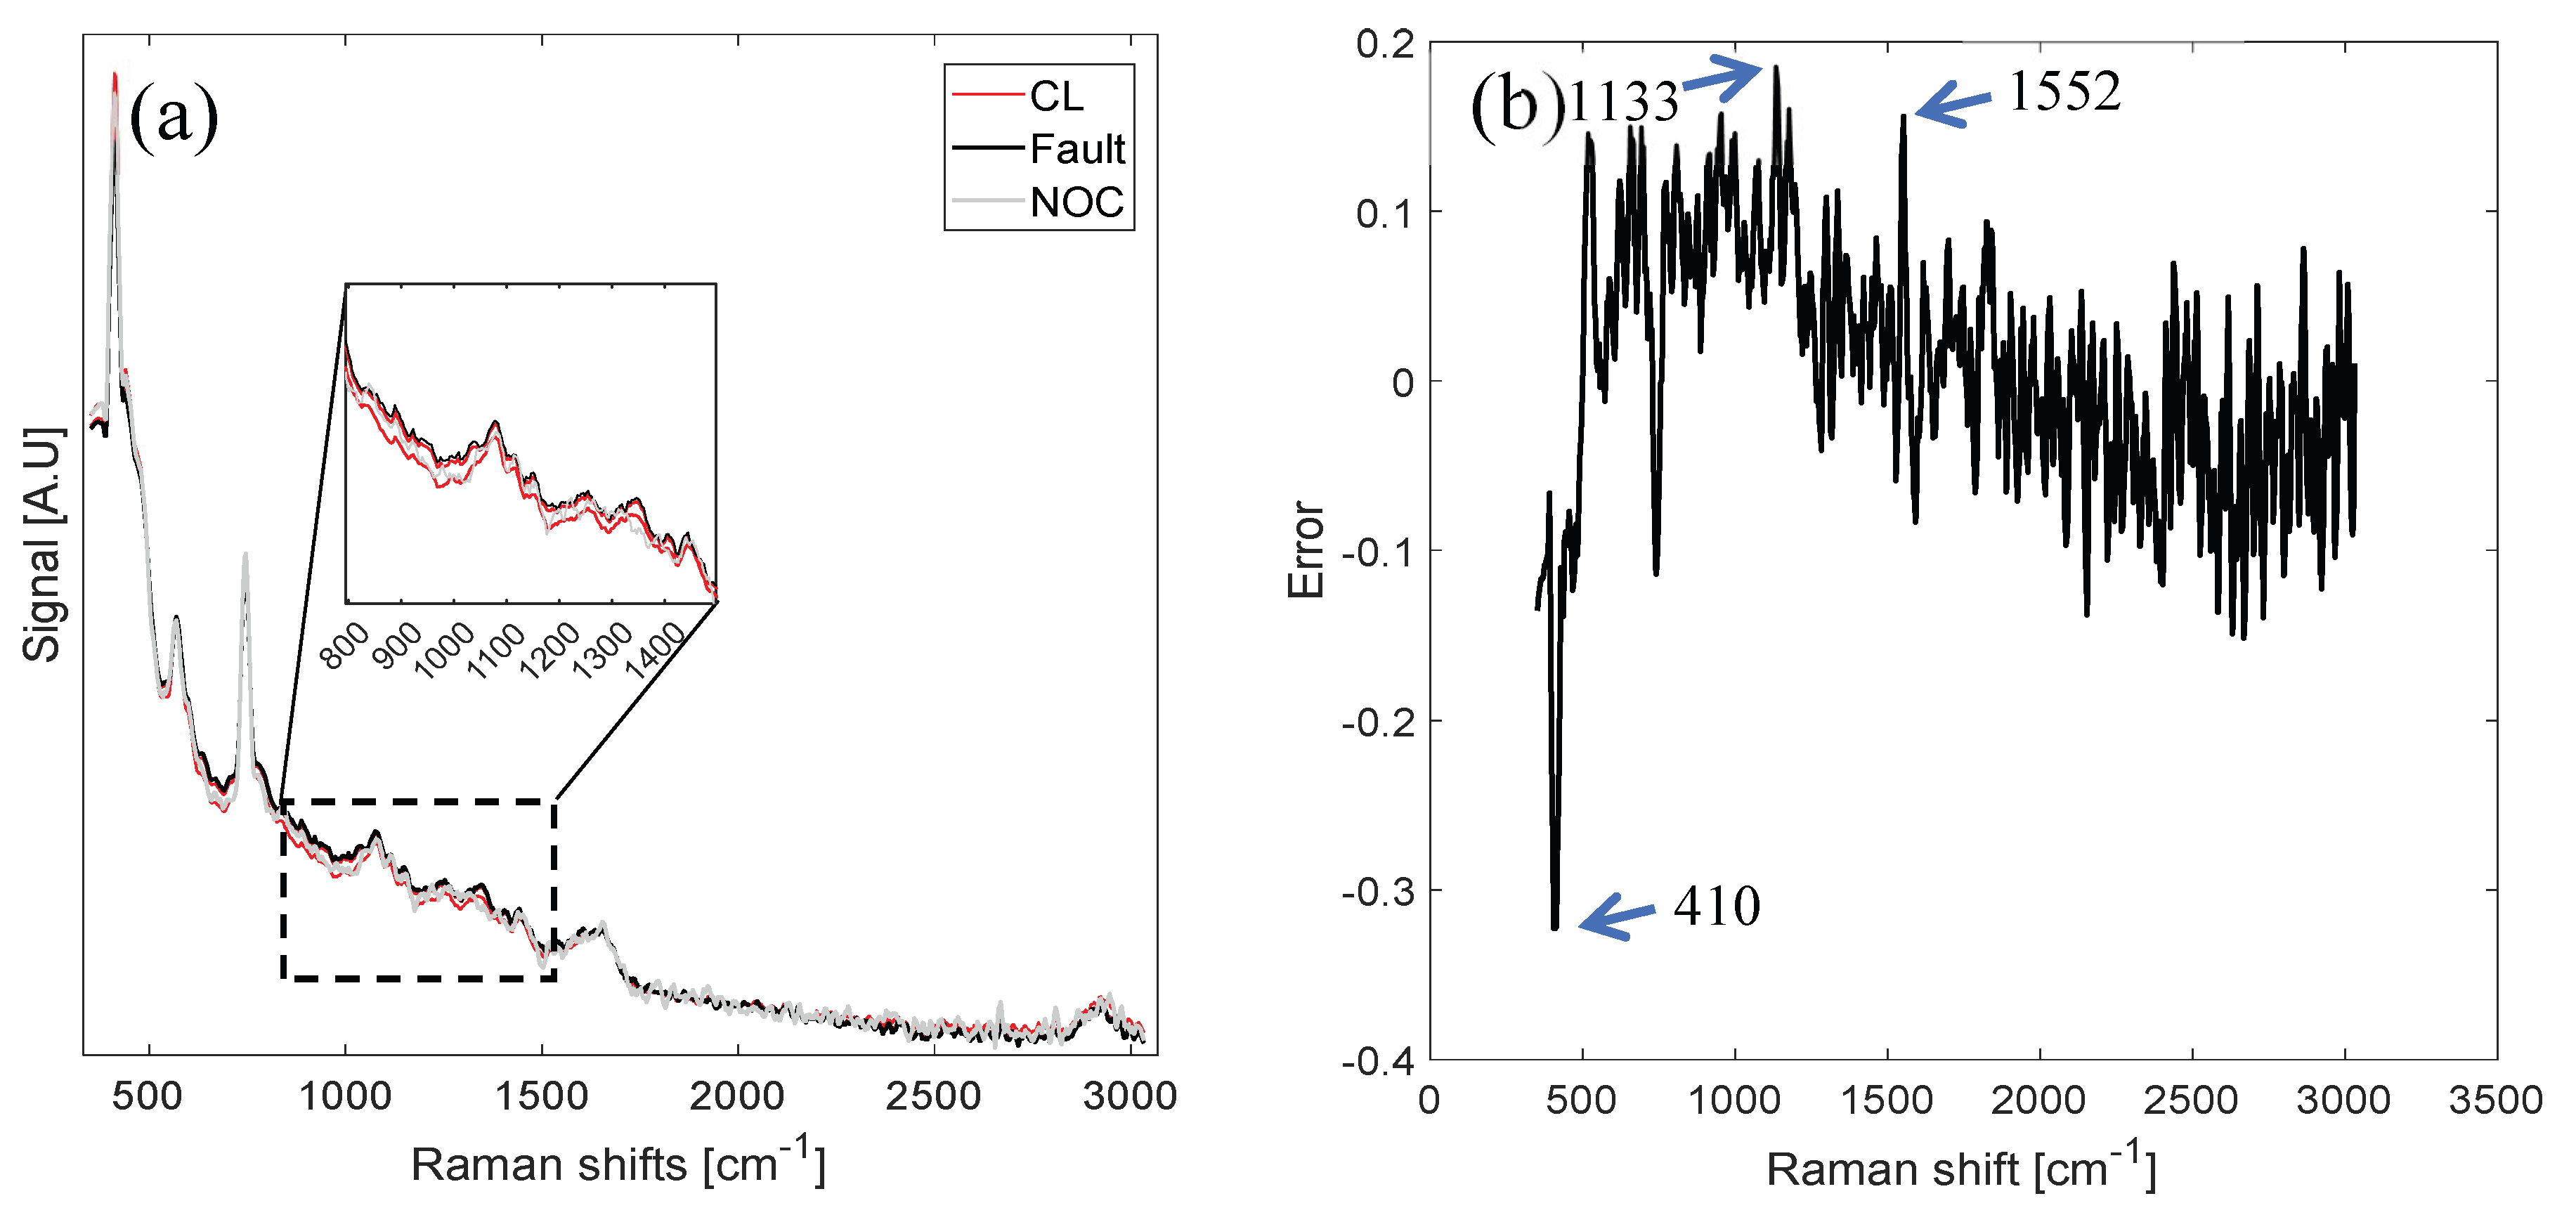
For the sake of fault diagnosis, PC1 score prediction confidence interval values were projected back onto the original variable space using the loading values (Figure 5a). These reconstructed spectra represent the expected range of normal behavior and were compared to the actual spectrum recorded at the alarm time for an illustrative fault batch (T = 34 °C; Cr = 0.007 IMCU mL−1). The alarm occurred 8.5 min after rennet addition. For reference, a spectrum from an NOC batch was also included. As shown in Figure 5a, the fault spectrum lies predominantly above the control region, with the NOC spectrum remaining within expected bounds. Figure 5b displays the corresponding error plot, derived by calculating the difference between the fault spectrum and the spectrum reconstructed by projecting the model-predicted score back into the original variable. The strongly negative error value observed at 410 cm−1 is attributed to baseline effects, likely linked to changes in the curd’s firmness [11]. Other important deviations from the nominal spectrum appear between 1000 and 1600 cm−1, corresponding to protein-associated Raman bands, suggesting a slower biochemical evolution due to a lower enzyme concentration. This behavior is clearly reflected in the error plot (Figure 5b), where positive deviations at 1133 and 1552 cm−1 denote the vibrational modes associated with aspartic and glutamic acids, along with N-H deformation [27,28,29,30].

3.2. T2 and SPE Fault Detection Algorithm

In the following discussion, the hyperparameter tuning for the presented dataset is examined along with the diagnosis of fault batches using the T2 or SPE Algorithm 5.

3.2.1. Hyperparameters Tuning

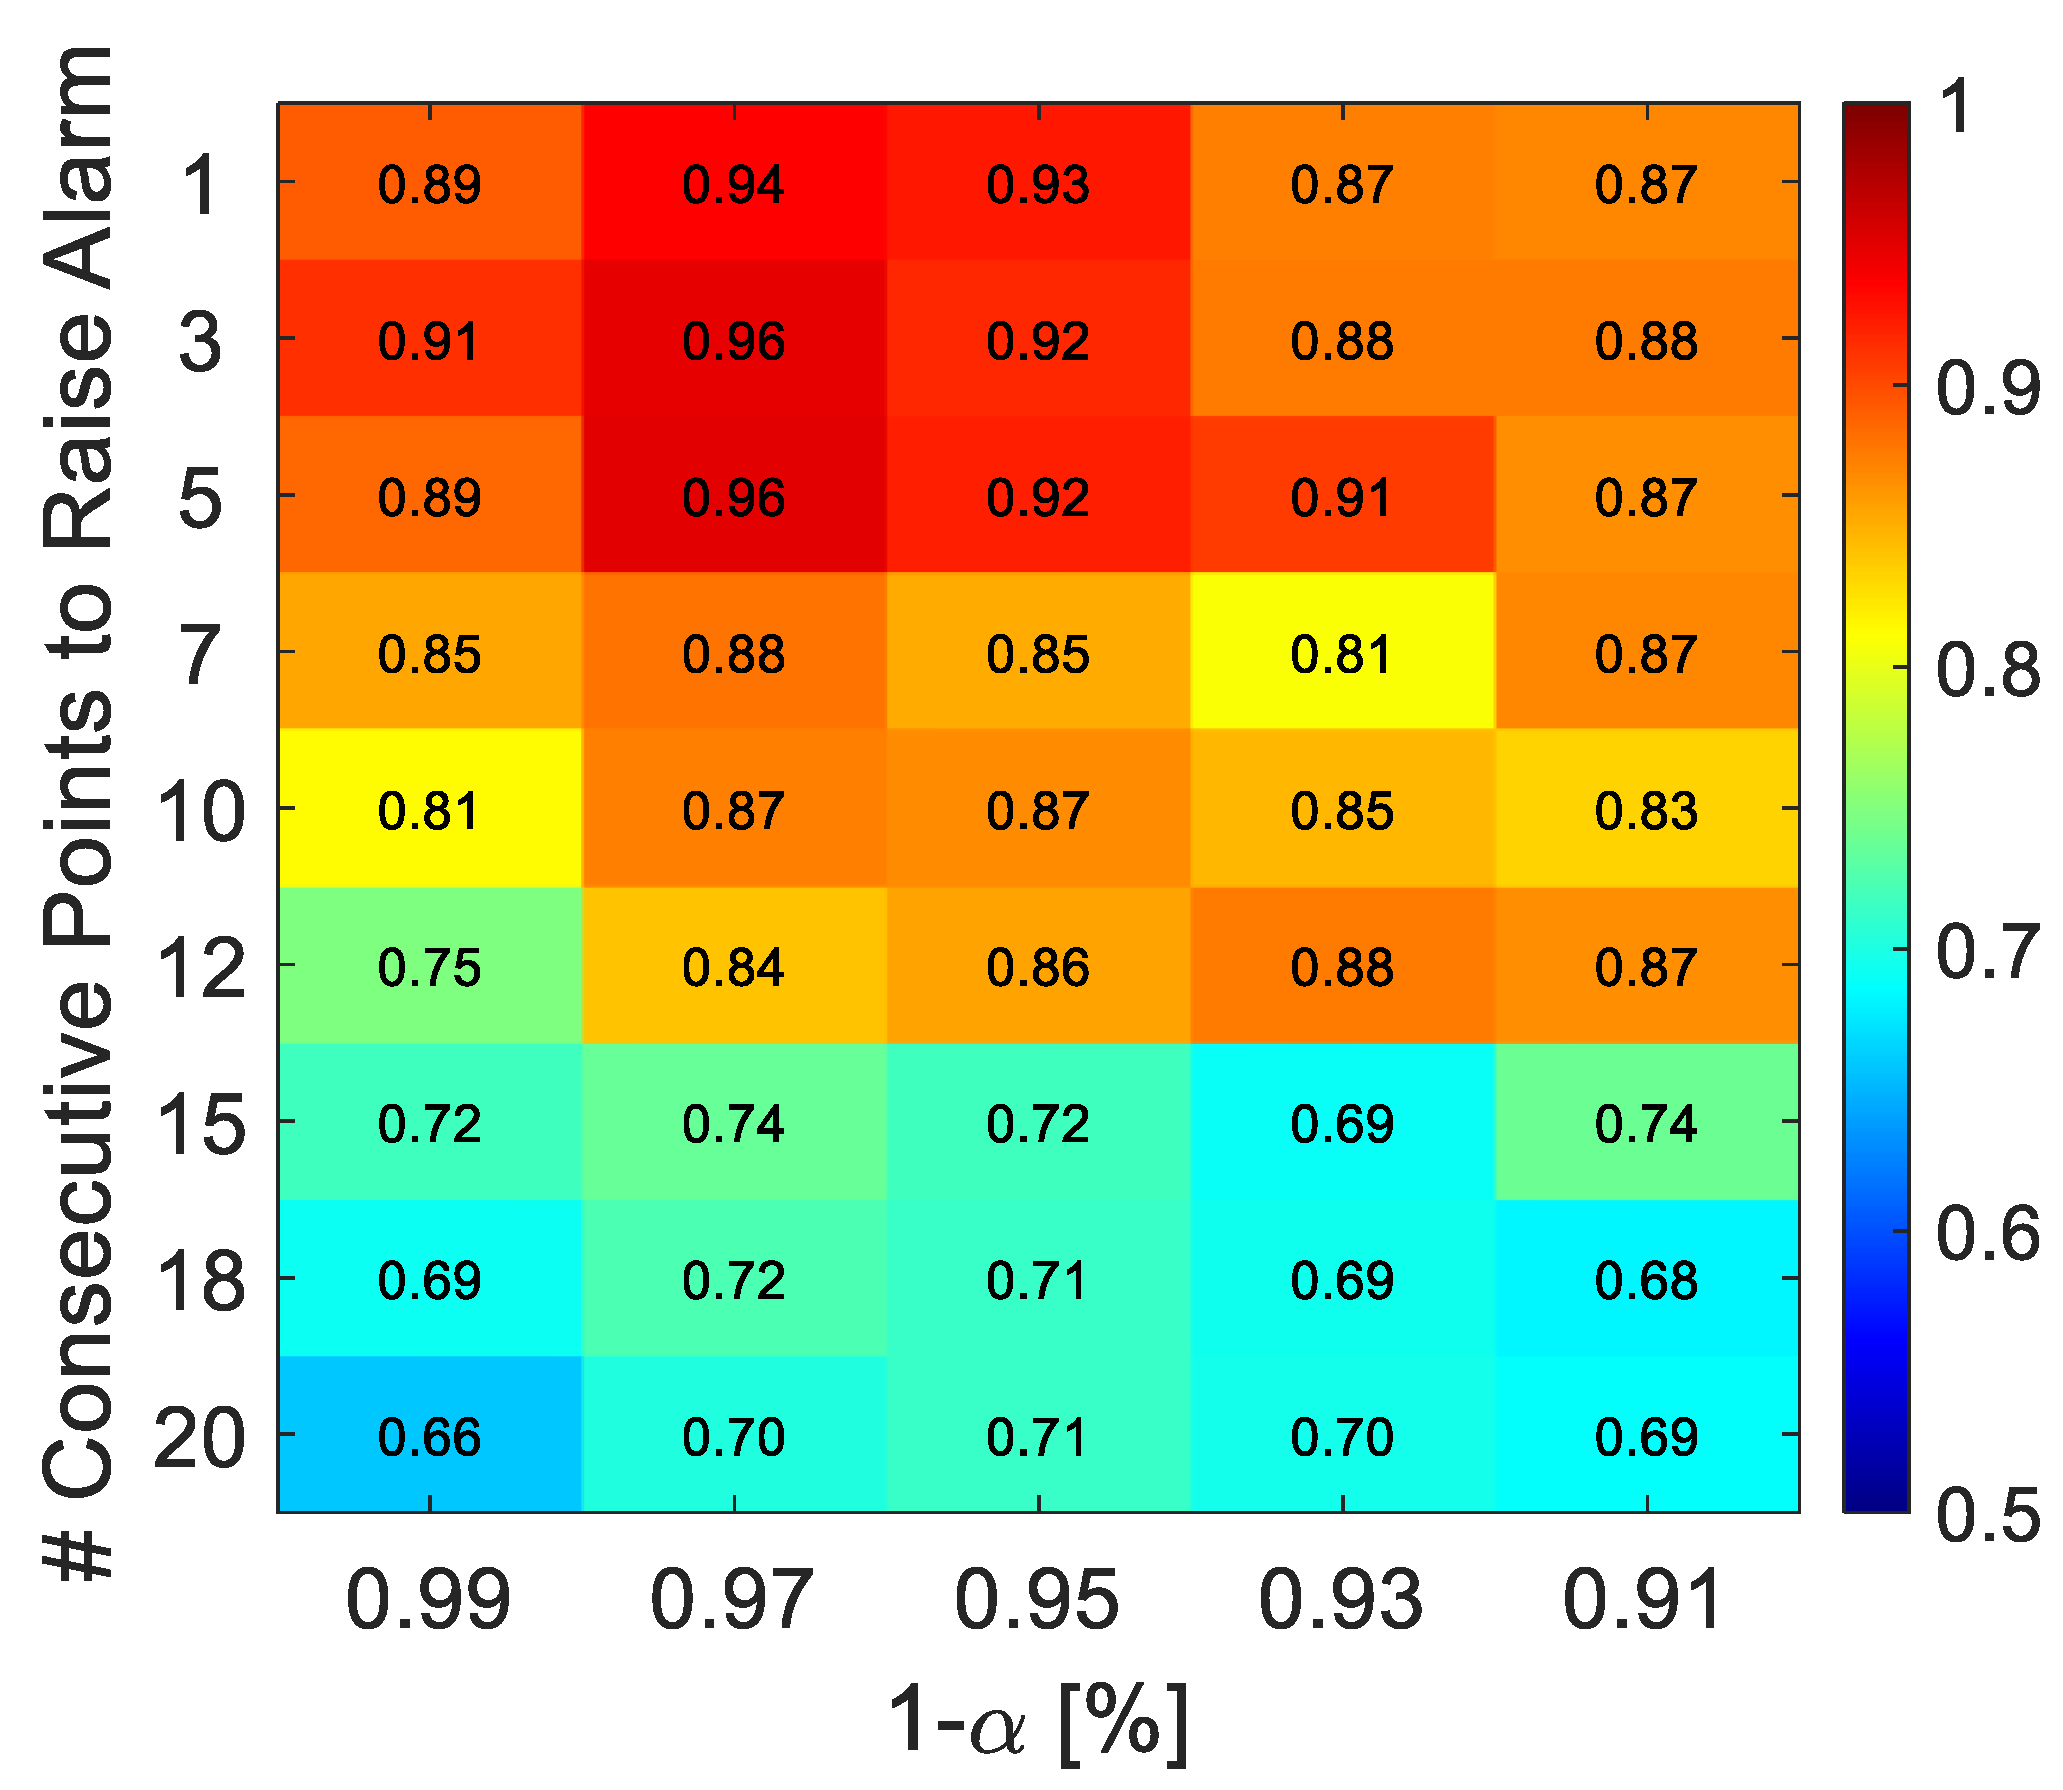
Figure 6 shows the accuracy heatmaps resulting from tuning the T2 or SPE model corresponding to Algorithm 5, using different pairs of hyperparameters. The plot shows how tuning the model with different hyperparameter combinations influences the detection performance in cross-validation. The x-axes are the 1-α percentile chosen for the alarm limit. The y-axes indicate how many points should be above the UCL before the alarm triggers.
The best performance for the T2-SPE-based detection algorithm using the logical OR approach was achieved by three consecutive points above the UCL and α = 3%, yielding an accuracy of 96%, meaning that this local PCA algorithm is a potential candidate for addressing the problem. This means that the combined analysis of the explained variance captured by the first principal component and the residual variance represented by the SPE provides a more comprehensive view of the process dynamics, thereby improving the ability to detect anomalies. Further details about the other local-based algorithms are reported in the Supplementary Materials, Section S.3. It is important to specify that these considerations are specific to the presented dataset, which nonetheless reflects reasonable operating conditions.

3.2.2. Fault Diagnosis

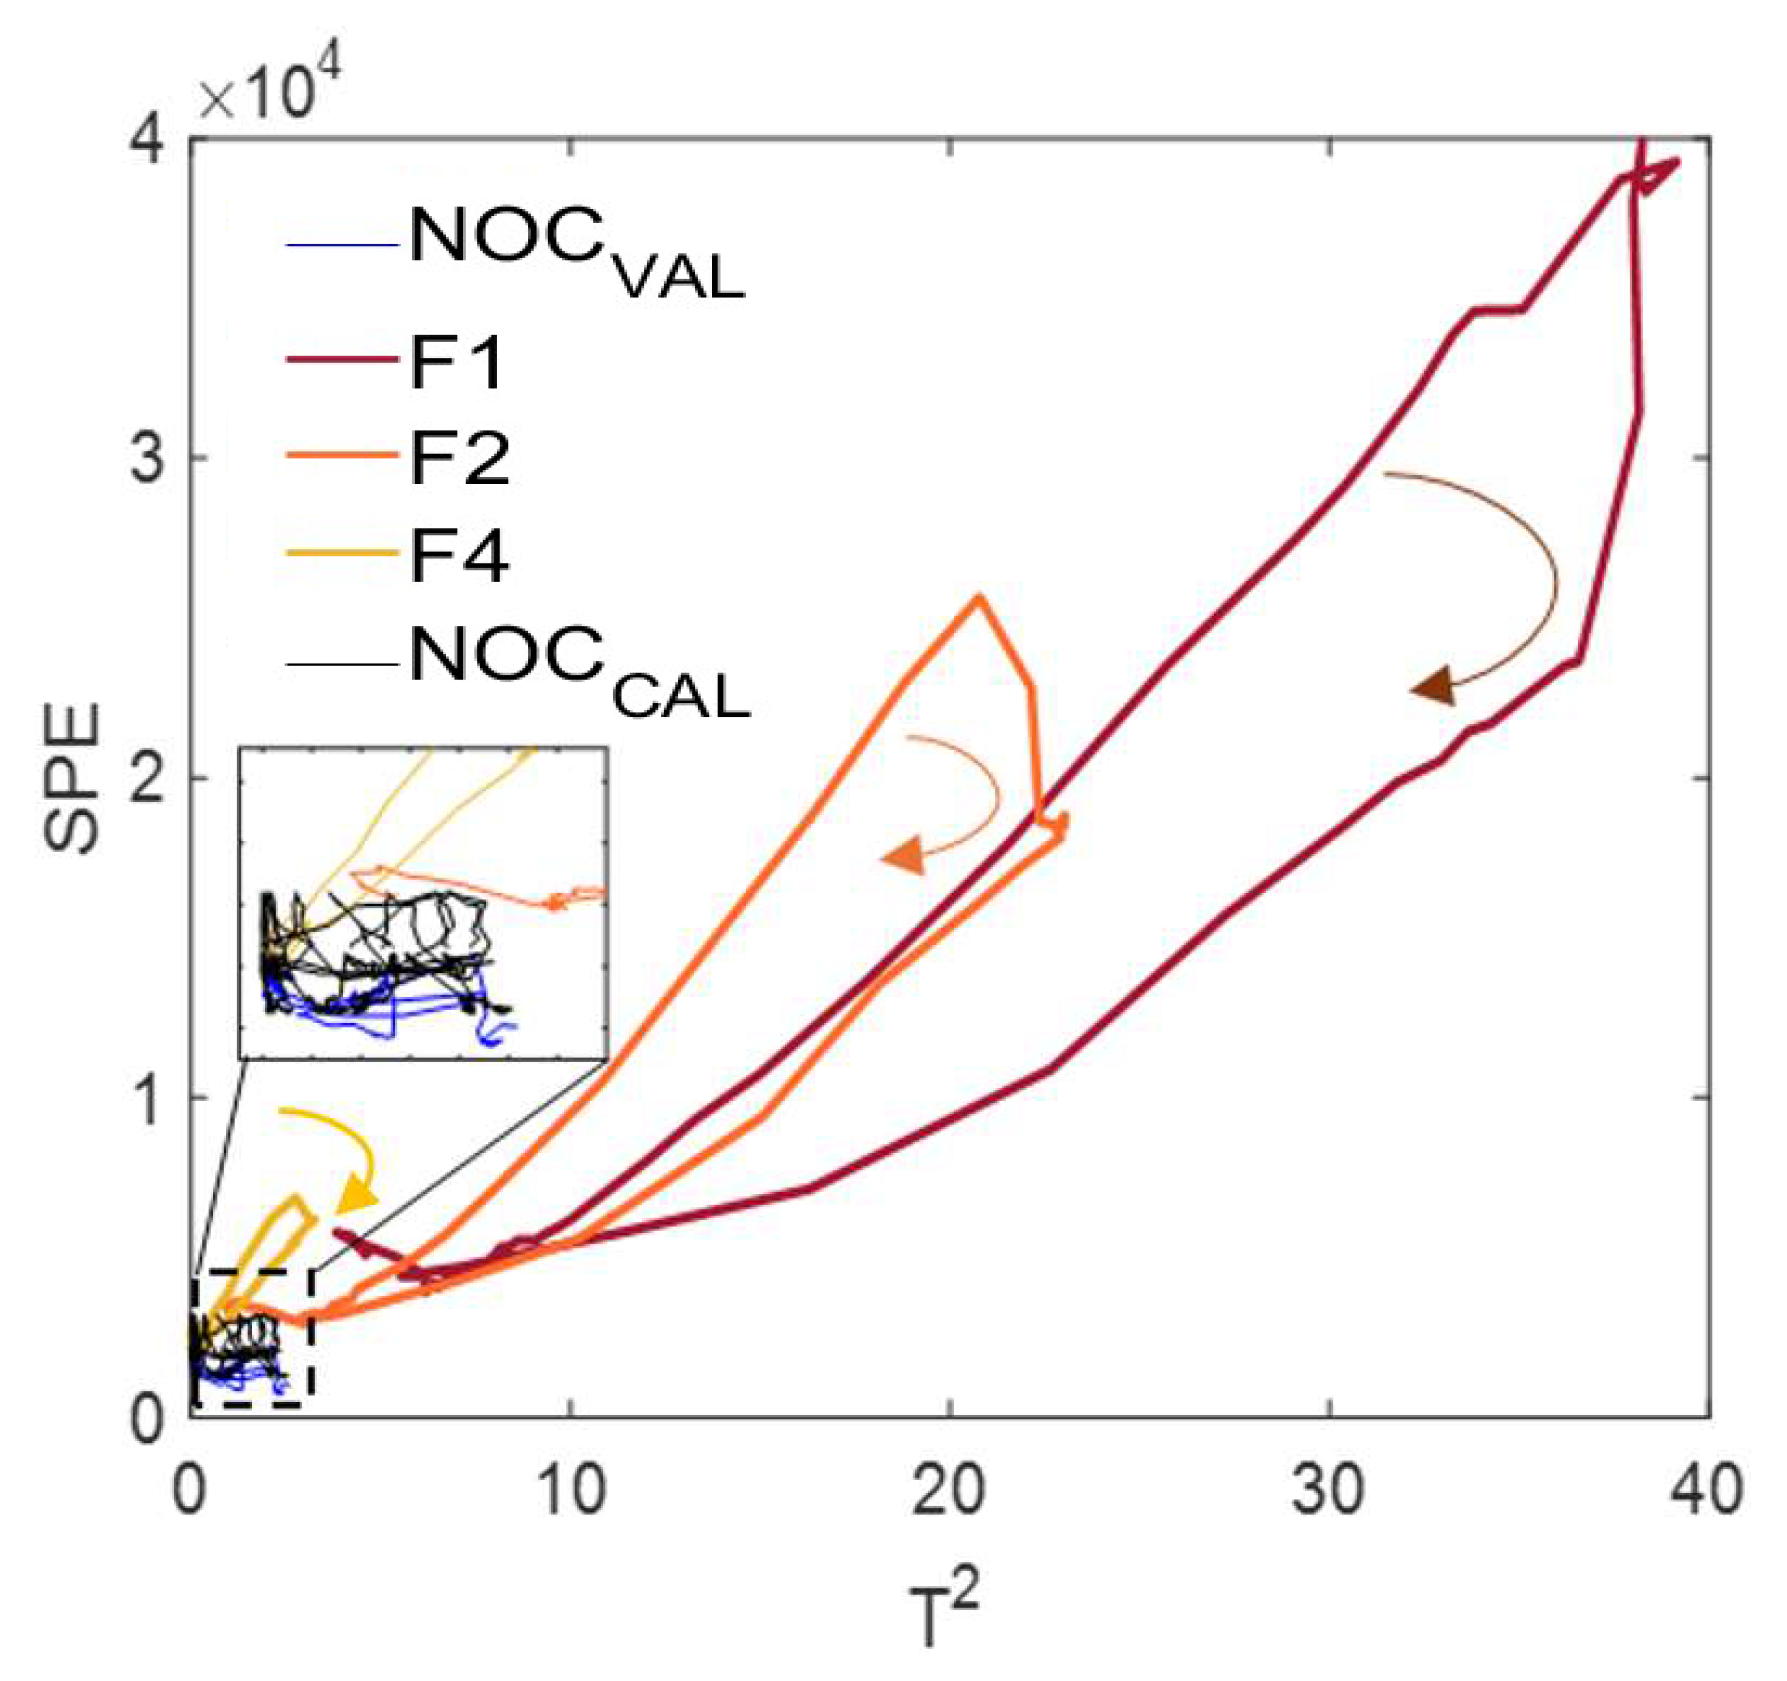
After tuning the detection model, fault diagnosis enables us to investigate the source of the process failures. The joint representation of SPE and T2 in a single plot allows for a combined visualization of both the explained and residual data variance. Figure 7 shows the batch trajectories in the T2–SPE space, including NOCs from both the calibration and validation sets, as well as batches affected by a reduction in rennet concentration at two temperatures (34 °C and 36 °C) and the combined rennet–temperature control system fault. While NOC trajectories remain confined within a tight region near the origin, all fault batches deviate significantly. In particular, the rennet concentration faults exhibited the most pronounced divergence from NOC conditions, with the deviation being more substantial at 34 °C than at 36 °C. This behavior can be attributed to the greater kinetic limitation posed by the lower temperature, resulting in the slower dynamic response of the signal. Conversely, the temperature fault shows a moderate deviation from NOCs compared to the other faults, particularly in terms of T2. Regarding the validation of the NOC samples, their trajectories remain within the region delimited by the NOC calibration samples.
Figure 8 presents the evolution of the statistical monitoring indices over time. For simplicity, only T = 34 °C is displayed for NOC analysis, while F2 and the F4 run are considered among the fault experiments. The plots are organized into three rows and two columns, with each row corresponding to a specific scenario. The left column shows the analysis for the T2 statistic, and the right column displays the resulting curve for SPE. Both statistics show the time variation of the control limits resulting from a local PCA model. Concerning the T2 statistic, a noticeable increase is generally observed around the PC1 inflection point across all cases. This behavior is primarily attributed to the high variability in the process dynamics in the proximity of inflection points, which probably arises from different temperatures used to calibrate the model. These sources of variability lead to the formation of T2 peaks, which do not exceed the control limits in the case of NOC batches but become significantly more pronounced in the presence of enzyme concentration faults. While the T2 algorithm correctly classified the NOC batches and the rennet concentration faults, it failed in properly identifying the temperature control fault due to the modest deviations in PC1 values with respect to the other types of faults. Such a miss probably justifies the smaller accuracy values observed when only using T2 statistics (Supplementary Materials, Section S.3). Conversely, SPE resulted in better sensitivity to all the types of faults, including the rennet concentration failures at 34 and 38 °C. The results reported in Figure 7 are representative of the overall behavior of the coagulation experiments. Indeed, similar conclusions can be made for the other failures.
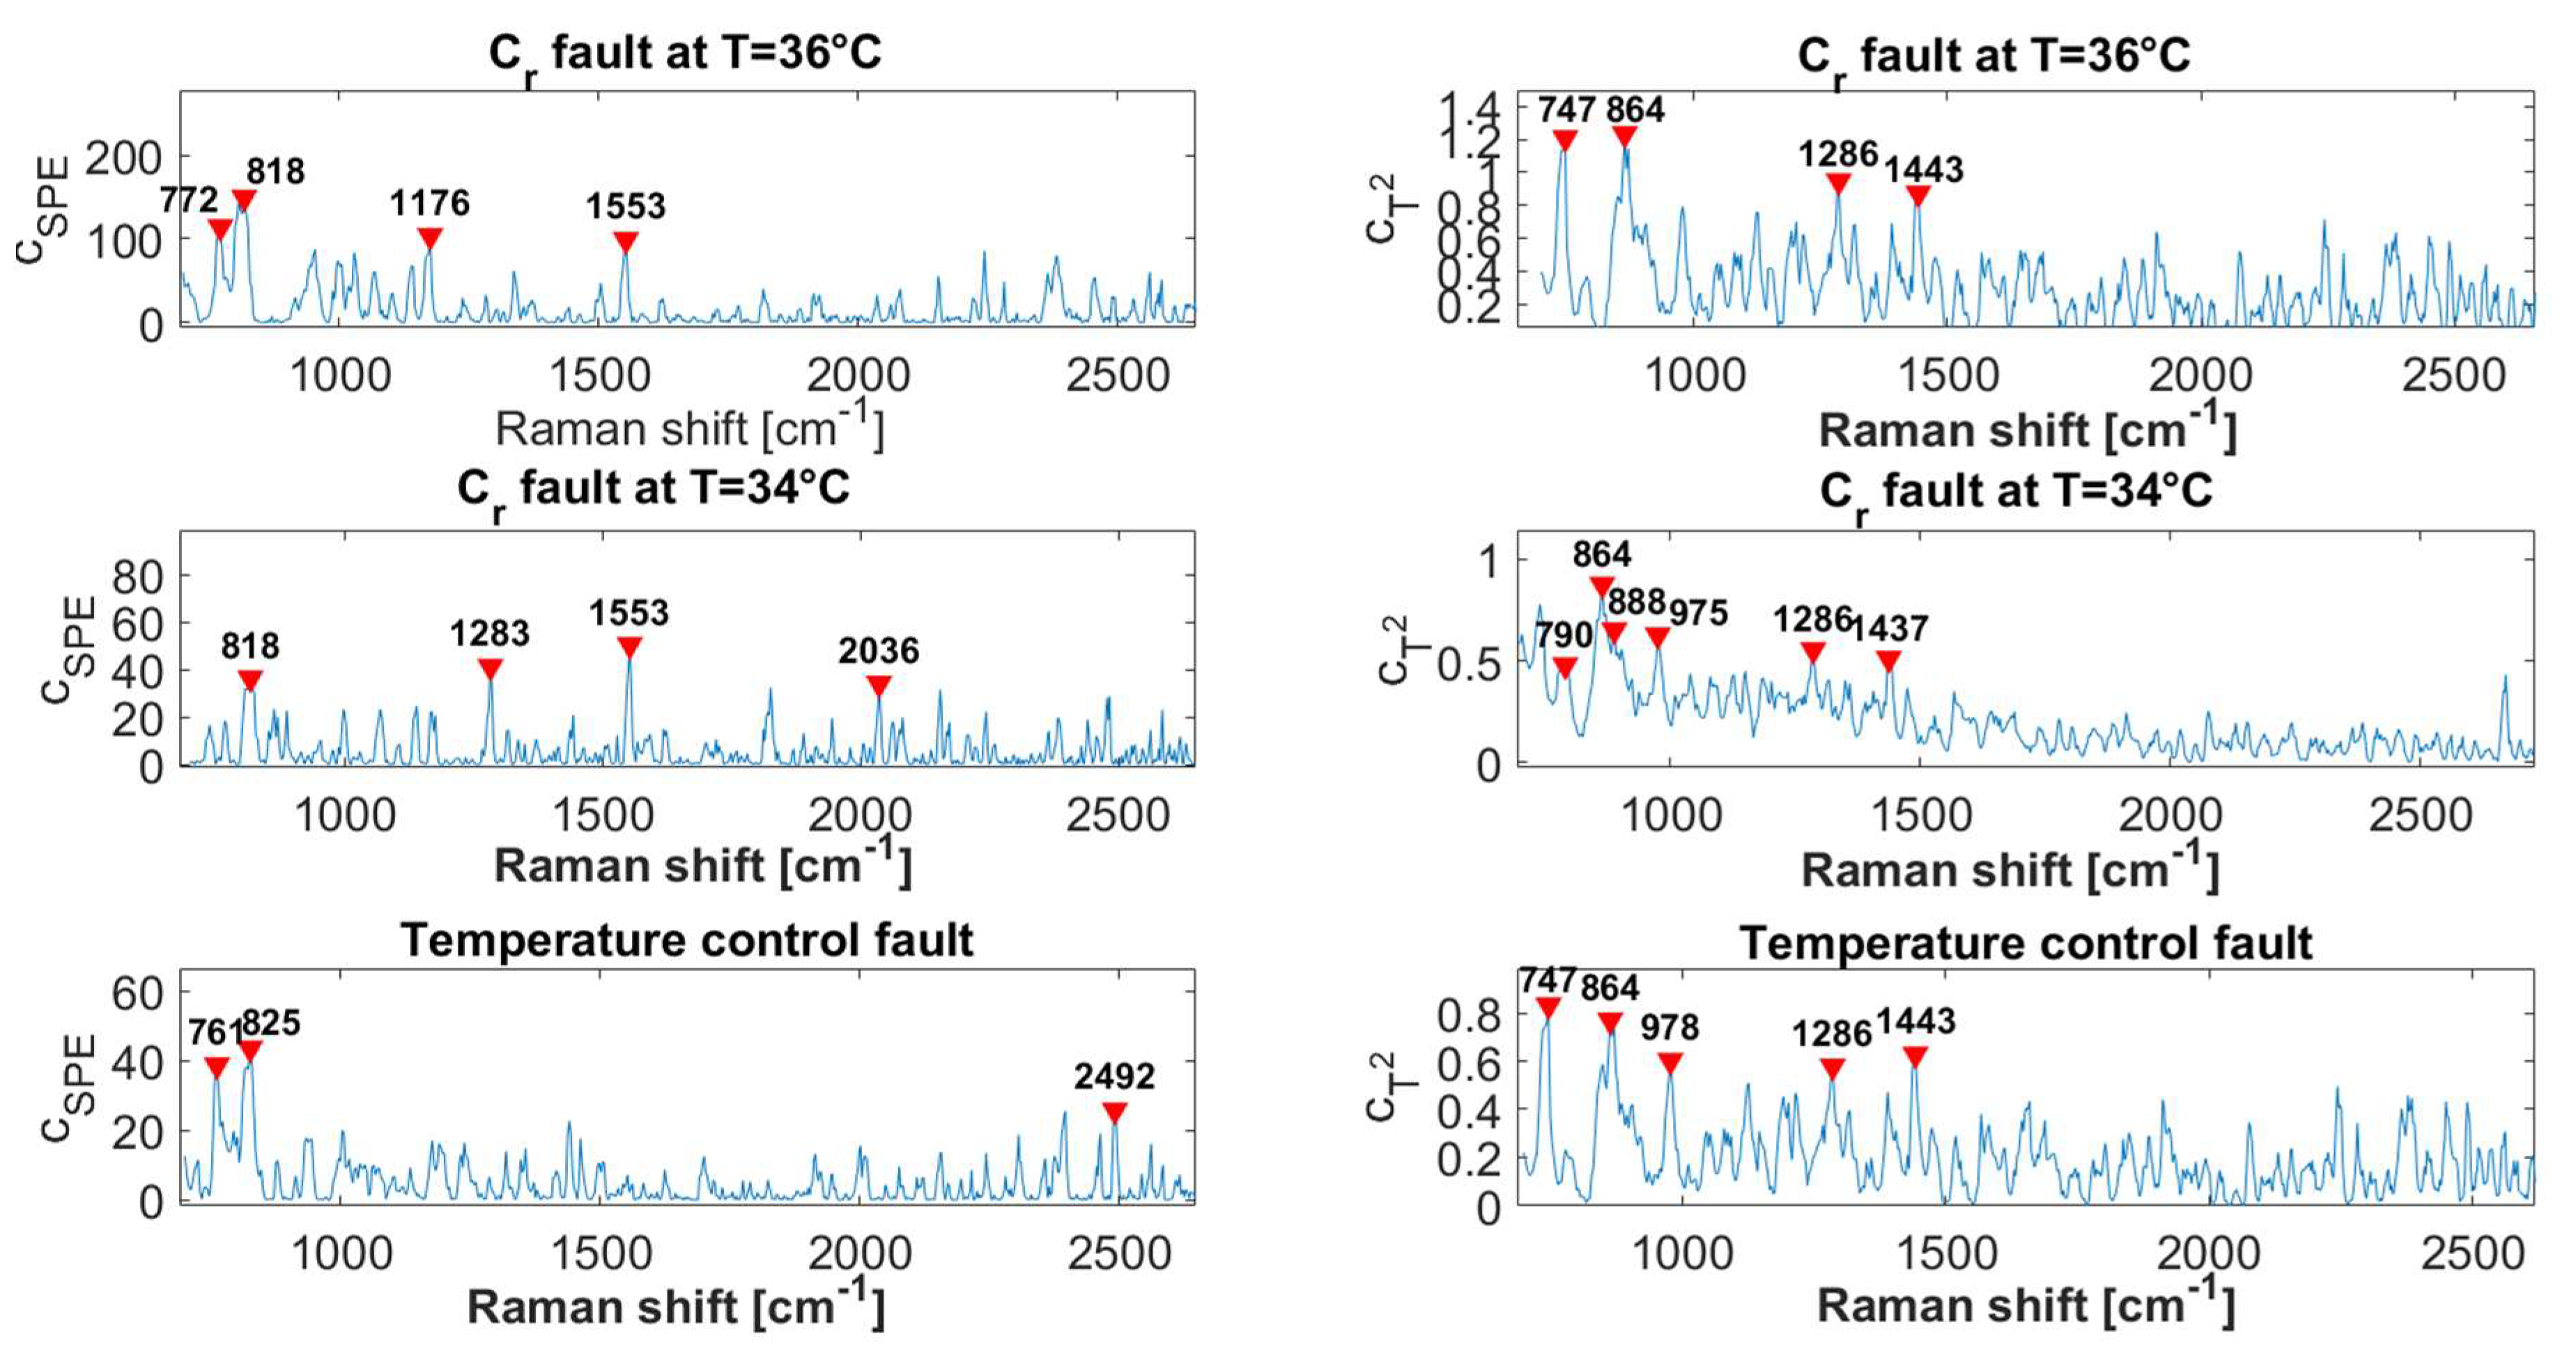
The analysis of contribution plots derived from Equations (9) and (10) allows for a deeper understanding of the Raman shifts involved in the fault occurrence. In particular, this investigation opens up the possibility of discriminating the source of the faults. Figure 9 shows the contribution plots for both the SPE and T2 associated with the spectrum corresponding to the time at fault using the optimal combination of hyperparameters. Specifically, the alarm triggered after 9.5 min for fault F2, while 7 min were required to detect the fault for fault F1a. Interestingly, these two similar types of faults have a high SPE contribution at 1553 cm-1, which is known to belong to the bending mode of N-H bonds and C-N stretching corresponding to amide II [27,28,29], as obtained from the error plot related to the non-linear regression model strategy (Figure 5b). This outcome is reasonably due to the involvement of proteins in the rennet–casein phenomena. Other remarkable, yet less intense, SPE contribution values were observed between the 900 and 1200 cm−1 regions, which are related to milk constituent redistribution during rennet coagulation. Such outcomes are consistent with the results reported in a previous work [11]. Regarding the contribution of Raman shifts below 900 cm−1, their significance is likely associated with baseline variations, as the most intense signal was observed in the lower wavenumber region and was not corrected, as the baseline shift accounts for physical changes in the curd during renneting. Regarding the T2 algorithm, the highest contribution values are predominantly located in the lower Raman shift region, along with a notable effect at 1437–1443 cm−1, which corresponds to C-H bending of the -CH2 group [31]. In contrast, no specific vibrational assignment has yet been reported for the 1286 cm−1 band.

3.2.3. Comparison of Detection Algorithm Performance

Six fault detection algorithms were explored to detect two common types of faults in food processing (temperature and reactant concentration) using the multivariate signal provided by Raman spectroscopy. This section outlines the practical implications of applying these algorithms, emphasizing the technical benefits of accurate and fast fault detection within a dairy processing environment. Table 2 summarizes the results obtained by tuning the hyperparameters associated with the optimal settings, including those reported in the Supplementary Material sections. It is worth mentioning that the PCA-based models were trained over 100 iterations to identify the optimal configuration, and the resulting maximum performance was further confirmed using 1000 iterations. The consistency of the outcomes across iterations demonstrates the stability of the PCs, even when different process disturbances were introduced.
It is worth noting that T2 was the fastest detection algorithm and SCI the slowest. The fast detection of T2 is probably related to its inability to detect temperature control faults, which occurred later than the rennet concentration faults and, therefore, were not accounted for in the average alarm time computation. The most accurate algorithm (i.e., the non-linear model) demonstrated an intermediate fault detection time, constituting a possible tool for this application.
Importantly, the characteristic time of fault detection for the presented algorithms fits well with the industrial practice of milk coagulation. To this end, the SPE or T2 algorithm showed an accuracy of 3.6 percentage points lower than the non-linear equation-based fault detection algorithm while achieving fault detection 1.5 min faster (i.e., 7.0 min). Several studies have demonstrated that coagulating milk exists in a pre-gelation state, where the milk has not changed phase yet [2,11,32]. This means that corrective actions can be made if the fault time occurs earlier than the gelation point, which is the time at which the elastic modulus is G’ = 1 Pa, a practical threshold for deeming the initialization of the phase transition triggered by rennet introduction [32]. In a previous study, where rheological analyses were conducted under the same experimental conditions as the NOC batches presented in this work, gelation was found to occur between 7.5 and 21 min after rennet addition. It is important to highlight that no fault is expected to occur when the gelation takes place after 7.5 min, as occurred at 38 °C under nominal rennet concentration, meaning that fault scenarios are expected to occur significantly later than that time. This indicates that the SPE or T2 fault detection system effectively provides an early warning, which could potentially allow for timely intervention to prevent process deviations before the phase transition of milk. In conclusion, the SPE or T2 and non-linear equation-based fault detection algorithms are deemed valid candidates for this study. This algorithm exhibited similar performance to that reported in a similar work, where FT-NIR was used as a fault detection tool [33]. However, it should be noted that the latter employed fault batches that slightly differed from those considered here. The proposed methodology offers an additional advantage by enabling the diagnosis of the contribution of each investigated variable to the onset of the fault, which can be used as a biomarker of quality. Although the investigated operative condition window reflects the one typically employed in industrial settings, this study is limited by the relatively small size and controlled nature of the available datasets. Further validation is, therefore, required to confirm the robustness and generalizability of the proposed approach, ideally by extending the dataset and introducing additional sources of variability that better represent real process fluctuations. In addition, future studies should explore the integration of control strategies to assess whether the system can actively respond to detected faults and bring potential failure batches back to normal operating conditions.

4. Conclusions

This work presents different fault detection algorithms to investigate the use of Raman spectroscopy as a screening tool for food processing applications. Different nominal and failure conditions were investigated to assess the fault detection rate and false alarm rate. Local and global PCA-based algorithms were employed to find the best options in terms of detection speed and accuracy. High accuracies were obtained by each investigated algorithm, with the SPE or T2 algorithm emerging as particularly effective, reaching up to 96% accuracy and enabling the detection of deviations from NOCs before the occurrence of colloid destabilization. The analysis of variable contributions further demonstrated the ability of Raman spectral data, when combined with multivariate statistical modeling, to identify and interpret the source of faults within the process, thus offering additional benefits over previous studies. In particular, spectral bands below 900 cm−1 or ranging between 1100 and 1600 cm−1 were found to be consistently involved in fault scenarios, suggesting a close relationship between process failures and specific molecular vibrations. The presented methodology holds the potential to achieve a correct diagnosis of process failures prior to the curd gelation point, thus providing a timely informed decision-making strategy to dairy manufacturers in industrial settings. While the results obtained here provide a basis for fault detection process monitoring, future work may consider the application of this methodology to test the sensor’s ability to track any corrective action. In particular, in a potential scale-up phase of the system, it is crucial to assess whether corrective actions can be implemented rapidly enough to compensate for the occurrence of a fault. Subsequent investigations should also aim to extend this framework to evaluate how such early interventions affect the critical quality attributes of the product. Nonetheless, the integration of Raman spectroscopy-based monitoring with MSPC opens promising perspectives for enhancing product quality, reducing manufacturing costs, and avoiding waste.

Supplementary Materials

The following supporting information can be downloaded at https://www.mdpi.com/article/10.3390/pr13113519/s1, Figure S1: Accuracy plot. Figure S2: Time profile of reactor temperature and the corresponding PC1 trajectory. Figure S3: Accuracy as a function of the number of consecutive points and the confidence level for Algorithms 3, 4 and 6. Figure S4: Dynamic profile of raw spectra and the relevant PC1. Figure S5: Time evolution of PC1 during milk coagulation, including NOC and fault scenarios.

Author Contributions

L.S.: Writing–Original Draft, Methodology, Investigation, Validation, Formal analysis, and Data Curation, S.T.: Conceptualization, Methodology, and Writing–Review and Editing, M.A.B.H.: Conceptualization, Formal Analysis, Methodology, and Writing–Review and Editing. M.E.: Conceptualization, Funding Acquisition, Methodology, and Writing–Review and Editing, M.G.: Conceptualization, Methodology, Formal Analysis, Investigation, Validation, and Writing–Review and Editing. All authors have read and agreed to the published version of the manuscript.

Funding

This research received no external funding.

Data Availability Statement

The original contributions presented in this study are included in the Supplementary Materials. Further inquiries can be directed to the corresponding author.

Acknowledgments

The authors acknowledge Ron Hajrizaj (University of Southern Denmark) for technical support. M. Errico and M. Grosso are grateful to Otto Mønsteds Fond for the financial support.

Conflicts of Interest

The authors declare no conflicts of interest.

Abbreviations

The following abbreviations are used in this manuscript:
FFault
FARFalse Alarm Rate
FDRFault Discovery Rate
IMCUInternational Milk Clotting Unit
LCLLower Control Limit
MSPCMultivariate Statistical Process Control
NIRNear InfraRed
NOCNormal Operating Condition
PATProcess Analytical Technology
PCAPrincipal Component Analysis
SCIScore Confidence Interval
SPESquare Prediction Error
UCLUpper Control Limit

References

  1. Hassoun, A.; Jagtap, S.; Garcia-Garcia, G.; Trollman, H.; Pateiro, M.; Lorenzo, J.M.; Trif, M.; Rusu, A.V.; Aadil, R.M.; Šimat, V.; et al. Food Quality 4.0: From Traditional Approaches to Digitalized Automated Analysis. J. Food Eng. 2023, 337, 111216. [Google Scholar] [CrossRef]
  2. Castillo, M.; Lucey, J.A.; Payne, F.A. The Effect of Temperature and Inoculum Concentration on Rheological and Light Scatter Properties of Milk Coagulated by a Combination of Bacterial Fermentation and Chymosin. Cottage Cheese-Type Gels. Int. Dairy J. 2006, 16, 131–146. [Google Scholar] [CrossRef]
  3. Tajammal Munir, M.; Yu, W.; Young, B.R.; Wilson, D.I. The Current Status of Process Analytical Technologies in the Dairy Industry. Trends Food Sci. Technol. 2015, 43, 205–218. [Google Scholar] [CrossRef]
  4. Panikuttira, B.; O’Shea, N.; Tobin, J.T.; Tiwari, B.K.; O’Donnell, C.P. Process Analytical Technology for Cheese Manufacture. Int. J. Food Sci. Technol. 2018, 53, 1803–1815. [Google Scholar] [CrossRef]
  5. Duran-Villalobos, C.A.; Goldrick, S.; Lennox, B. Multivariate Statistical Process Control of an Industrial-Scale Fed-Batch Simulator. Comput. Chem. Eng. 2020, 132, 106620. [Google Scholar] [CrossRef]
  6. Castillo, M. Cutting Time Prediction Methods in Cheese Making. Encycl. Agric. Food Biol. Eng. 2006, 1, 1–7. [Google Scholar]
  7. Derra, M.; Bakkali, F.; Amghar, A.; Sahsah, H. Estimation of Coagulation Time in Cheese Manufacture Using an Ultrasonic Pulse-Echo Technique. J. Food Eng. 2018, 216, 65–71. [Google Scholar] [CrossRef]
  8. Pretto, D.; Kaart, T.; Vallas, M.; Jõudu, I.; Henno, M.; Ancilotto, L.; Cassandro, M.; Pärna, E. Relationships between Milk Coagulation Property Traits Analyzed with Different Methodologies. J. Dairy Sci. 2011, 94, 4336–4346. [Google Scholar] [CrossRef]
  9. Villaquiran, Z.; Zamora, A.; Arango, O.; Castillo, M. Inline Determination of the Gel Elastic Modulus During Milk Coagulation Using a Multifiber Optical Probe. Food Bioprocess Technol. 2024, 17, 3149–3161. [Google Scholar] [CrossRef]
  10. Strani, L.; Grassi, S.; Alamprese, C.; Casiraghi, E.; Ghiglietti, R.; Locci, F.; Pricca, N.; De Juan, A. Effect of Physicochemical Factors and Use of Milk Powder on Milk Rennet-Coagulation: Process Understanding by near Infrared Spectroscopy and Chemometrics. Food Control 2021, 119, 107494. [Google Scholar] [CrossRef]
  11. Sibono, L.; Tronci, S.; Hedegaard, M.A.B.; Errico, M.; Grosso, M. Monitoring of Milk Rennet Coagulation: Chemical and Physical Perspective Using Raman Spectroscopy. Appl. Food Res. 2025, 5, 100701. [Google Scholar] [CrossRef]
  12. Lyndgaard, C.B.; Engelsen, S.B.; Van Den Berg, F.W.J. Real-Time Modeling of Milk Coagulation Using in-Line near Infrared Spectroscopy. J. Food Eng. 2012, 108, 345–352. [Google Scholar] [CrossRef]
  13. Grassi, S.; Strani, L.; Alamprese, C.; Pricca, N.; Casiraghi, E.; Cabassi, G. A FT-NIR Process Analytical Technology Approach for Milk Renneting Control. Foods 2022, 11, 33. [Google Scholar] [CrossRef] [PubMed]
  14. De Beer, T.; Burggraeve, A.; Fonteyne, M.; Saerens, L.; Remon, J.P.; Vervaet, C. Near Infrared and Raman Spectroscopy for the In-Process Monitoring of Pharmaceutical Production Processes. Int. J. Pharm. 2011, 417, 32–47. [Google Scholar] [CrossRef] [PubMed]
  15. Nicolau, N.; Buffa, M.; O’Callaghan, D.J.; Guamis, B.; Castillo, M. Estimation of Clotting and Cutting Times in Sheep Cheese Manufacture Using NIR Light Backscatter. Dairy Sci. Technol. 2015, 95, 495–507. [Google Scholar] [CrossRef]
  16. Yang, M.; Ye, A.; Yang, Z.; Everett, D.W.; Gilbert, E.P.; Singh, H. Kinetics of Pepsin-Induced Hydrolysis and the Coagulation of Milk Proteins. J. Dairy Sci. 2022, 105, 990–1003. [Google Scholar] [CrossRef]
  17. Hayes, E.; Greene, D.; O’Donnell, C.; O’Shea, N.; Fenelon, M.A. Spectroscopic Technologies and Data Fusion: Applications for the Dairy Industry. Front. Nutr. 2023, 9, 1074688. [Google Scholar] [CrossRef]
  18. Schmid, M.; Rath, D.; Diebold, U. Why and How Savitzky-Golay Filters Should Be Replaced. ACS Meas. Sci. Au 2022, 2, 185–196. [Google Scholar] [CrossRef]
  19. Sibono, L.; Tronci, S.; Hedegaard, M.A.B.; Errico, M.; Grosso, M. PAT-Driven Dairy Processing: A Rheo-Raman-Based Kinetic Model for in-Line Prediction of Milk Coagulation Dynamics. Anal. Bioanal. Chem. 2025, 417, 5691–5702. [Google Scholar] [CrossRef]
  20. Pratt, W.K. Digital Image Processing, 4th ed.; John Wiley & Sons: Hoboken, NJ, USA, 2007. [Google Scholar]
  21. Brereton, R.G. Chemometrics for Pattern Recognition; Wiley: Hoboken, NJ, USA, 2009; ISBN 9780470987254. [Google Scholar]
  22. Ford Versypt, A.N.; Harrell, G.K.; McPeak, A.N. A Pharmacokinetic/Pharmacodynamic Model of ACE Inhibition of the Renin-Angiotensin System for Normal and Impaired Renal Function. Comput. Chem. Eng. 2017, 104, 311–322. [Google Scholar] [CrossRef]
  23. Lane, T.P.; Dumouchel, W.H. Simultaneous Confidence Intervals in Multiple Regression. Am. Stat. 1994, 48, 315–321. [Google Scholar] [CrossRef]
  24. Alcala, C.F.; Joe Qin, S. Analysis and Generalization of Fault Diagnosis Methods for Process Monitoring. J. Process Control 2011, 21, 322–330. [Google Scholar] [CrossRef]
  25. Reis, M.S.; Rendall, R.; Rato, T.J.; Martins, C.; Delgado, P. Improving the Sensitivity of Statistical Process Monitoring of Manifolds Embedded in High-Dimensional Spaces: The Truncated-Q Statistic. Chemom. Intell. Lab. Syst. 2021, 215, 104369. [Google Scholar] [CrossRef]
  26. Jul-Jørgensen, I.; Facco, P.; Gernaey, K.V.; Barolo, M.; Hundahl, C.A. Data Fusion of Raman Spectra in MSPC for Fault Detection and Diagnosis in Pharmaceutical Manufacturing. Comput. Chem. Eng. 2024, 184, 108647. [Google Scholar] [CrossRef]
  27. Zhao, M.; Markiewicz-Keszycka, M.; Beattie, R.J.; Casado-Gavalda, M.P.; Cama-Moncunill, X.; O’Donnell, C.P.; Cullen, P.J.; Sullivan, C. Quantification of Calcium in Infant Formula Using Laser-Induced Breakdown Spectroscopy (LIBS), Fourier Transform Mid-Infrared (FT-IR) and Raman Spectroscopy Combined with Chemometrics Including Data Fusion. Food Chem. 2020, 320, 126639. [Google Scholar] [CrossRef] [PubMed]
  28. Stephani, R.; de Sá Oliveira, K.; de Almeida, C.E.R.; Perrone, Í.T.; de Carvalho, A.F.; de Oliveira, L.F.C.; Almeida, M.R. Raman Spectroscopy as a Tool to Identify Modification of Whey Protein Concentrate (WPC) during Shelf Life. Food Packag. Shelf Life 2017, 11, 1–9. [Google Scholar] [CrossRef]
  29. Rodrigues Júnior, P.H.; De Sá Oliveira, K.; De Almeida, C.E.R.; De Oliveira, L.F.C.; Stephani, R.; Pinto, M.D.S.; De Carvalho, A.F.; Perrone, Í.T. FT-Raman and Chemometric Tools for Rapid Determination of Quality Parameters in Milk Powder: Classification of Samples for the Presence of Lactose and Fraud Detection by Addition of Maltodextrin. Food Chem. 2016, 196, 584–588. [Google Scholar] [CrossRef]
  30. Panthi, R.R.; Shibu, S.N.; Ochalski, T.J.; O’Mahony, J.A. Raman Spectra of Micellar Casein Powders Prepared with Wet Blending of Glycomacropeptide and Micellar Casein Concentrate. Int. J. Dairy Technol. 2023, 76, 429–435. [Google Scholar] [CrossRef]
  31. El-Abassy, R.M.; Eravuchira, P.J.; Donfack, P.; Von Der Kammer, B.; Materny, A. Fast Determination of Milk Fat Content Using Raman Spectroscopy. Vib. Spectrosc. 2011, 56, 3–8. [Google Scholar] [CrossRef]
  32. Abdelgawad, A.R.; Guamis, B.; Castillo, M. Using a Fiber Optic Sensor for Cutting Time Prediction in Cheese Manufacture from a Mixture of Cow, Sheep and Goat Milk. J. Food Eng. 2014, 125, 157–168. [Google Scholar] [CrossRef]
  33. Grassi, S.; Strani, L.; Casiraghi, E.; Alamprese, C. Control and Monitoring of Milk Renneting Using FT-NIR Spectroscopy as a Process Analytical Technology Tool. Foods 2019, 8, 405. [Google Scholar] [CrossRef]
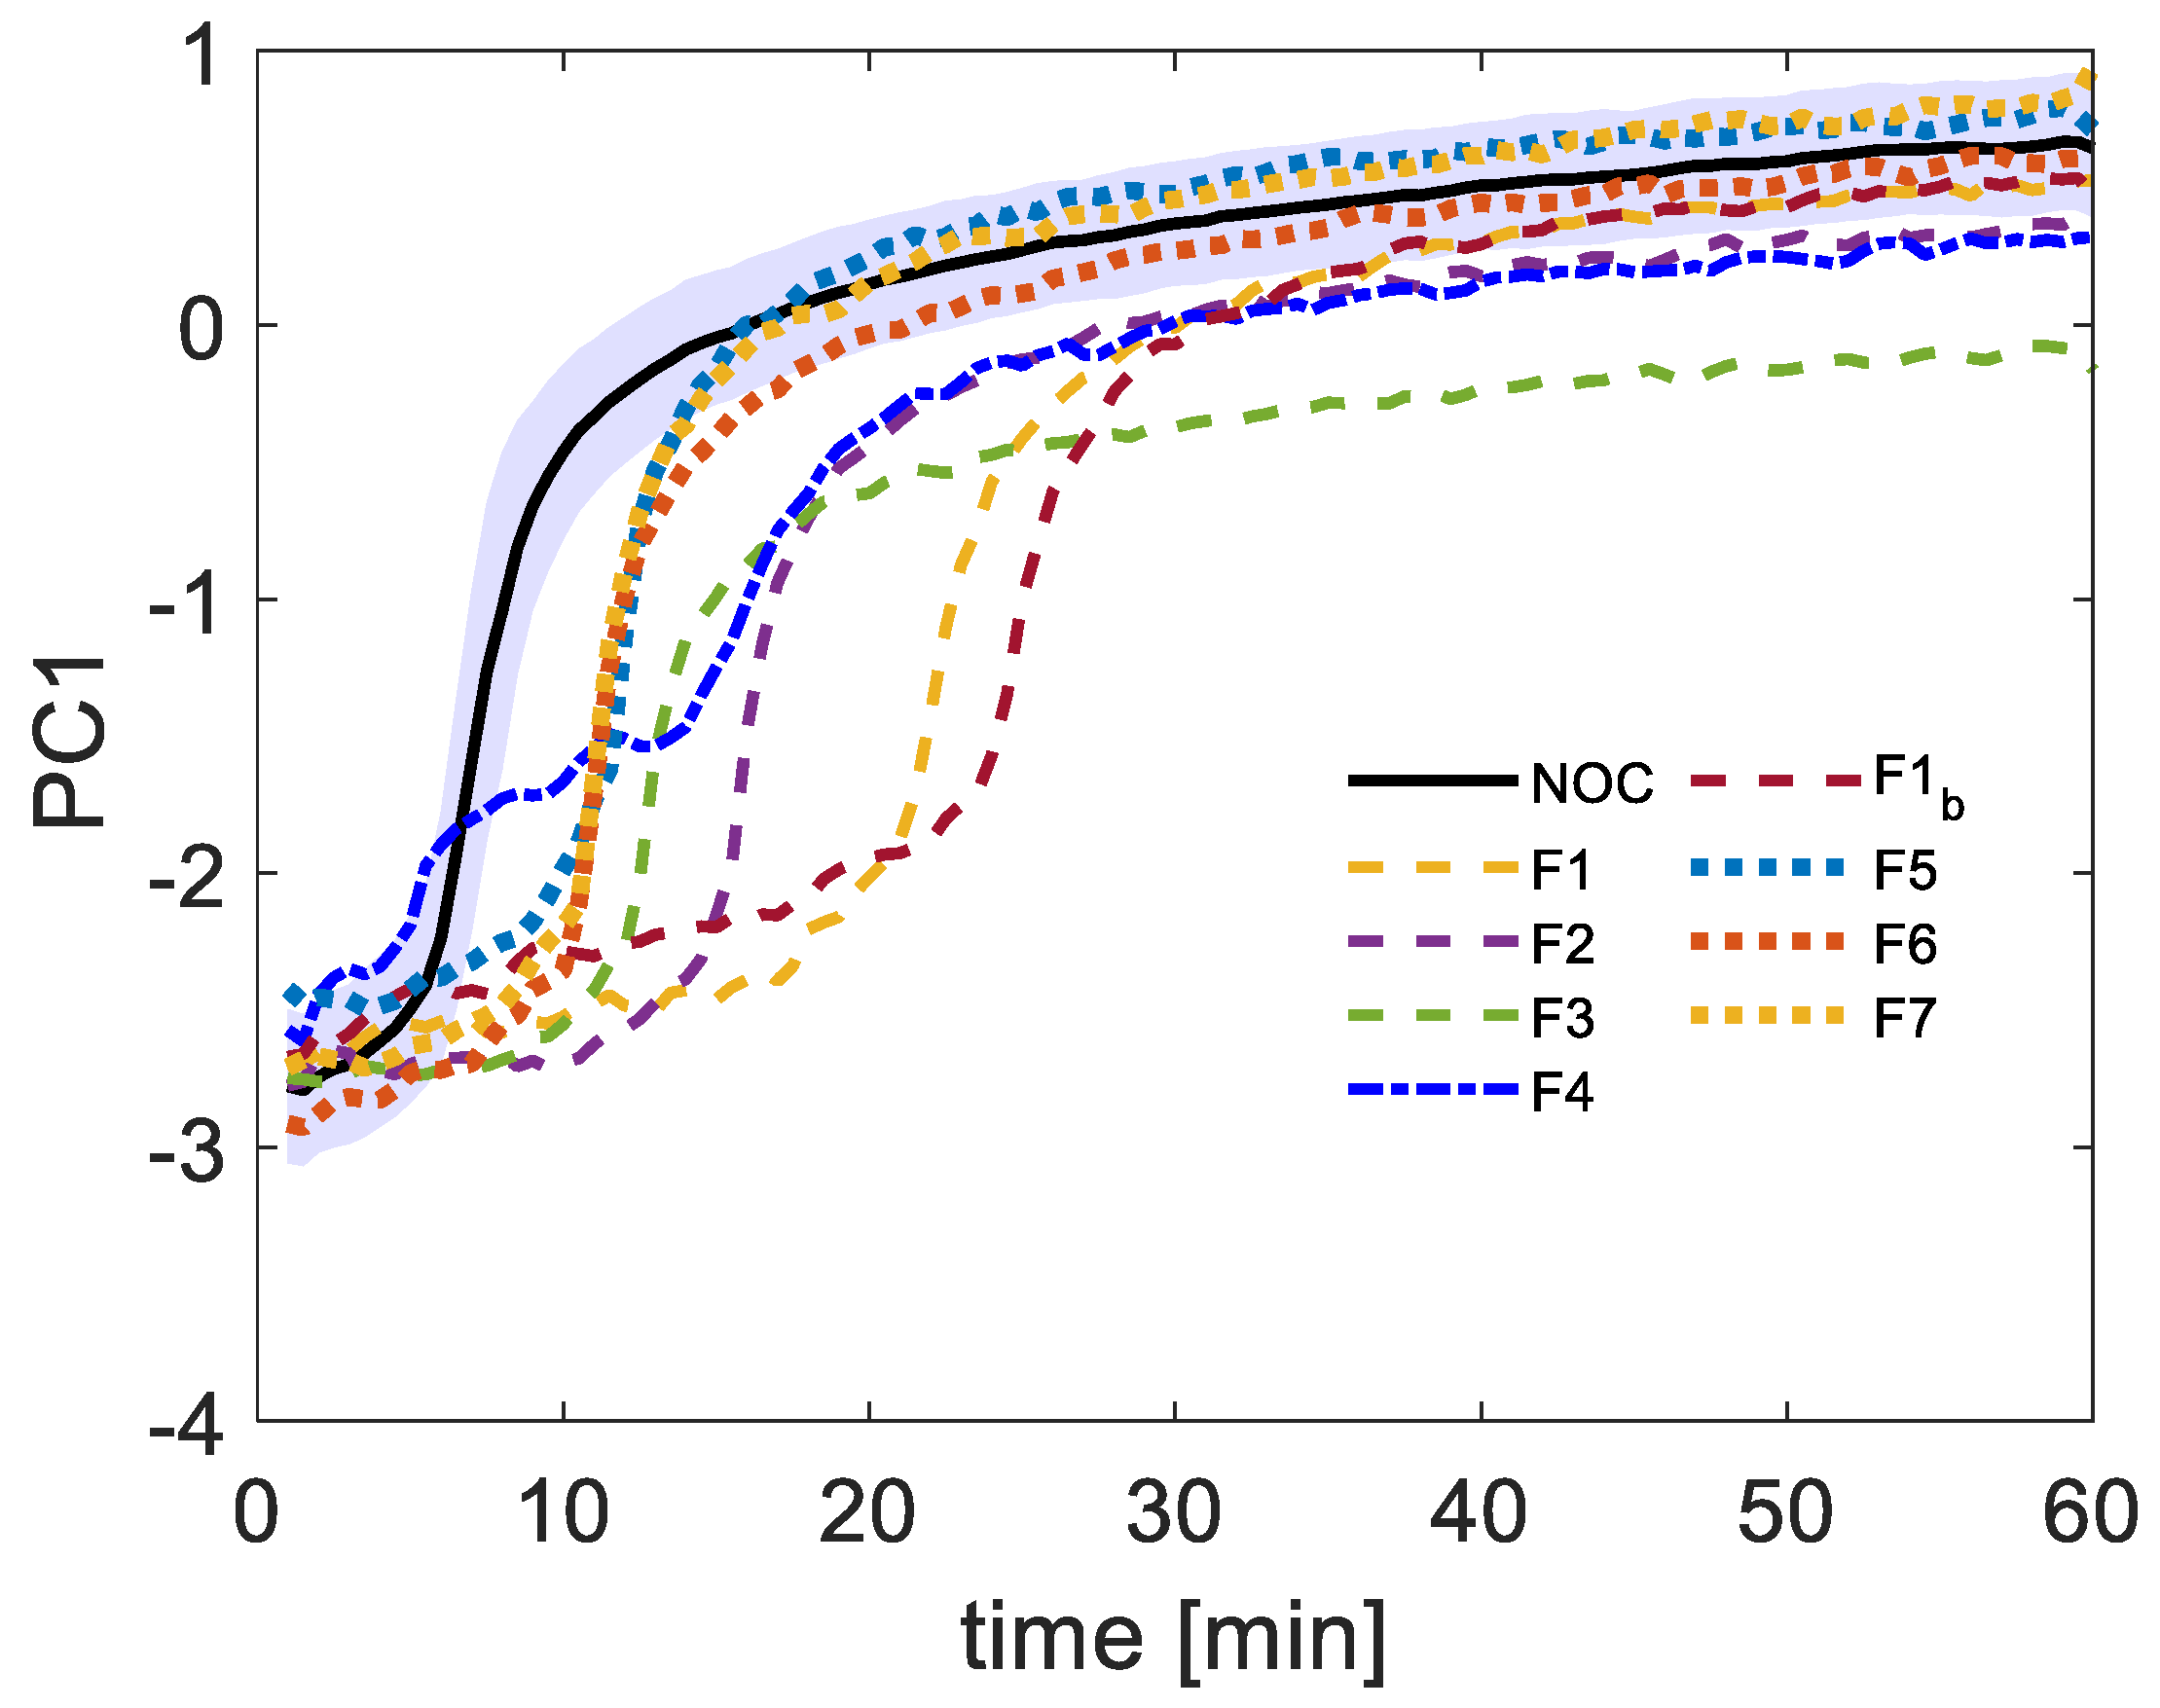
Figure 1. Time evolution of PC1 during milk coagulation. The NOC curve (solid black) represents normal operating conditions, shown as the mean trajectory and the standard deviation, denoted by the shaded area. Dashed curves indicate fault scenarios, induced by variations in initial temperature and enzyme concentration.
Processes 13 03519 g001
Figure 2. Accuracy as a function of the number of consecutive points for different values of confidence levels (1-α) when using a PC score–non-linear regression model-based fault detection algorithm. Blue, black, and red lines, respectively, refer to the accuracy obtained by tuning the model with confidence levels of 0.91, 0.95, and 0.99.
Processes 13 03519 g002
Figure 3. Accuracy as a function of the number of consecutive points and the confidence level for the non-linear regression model-based algorithm.
Processes 13 03519 g003
Figure 4. Application of the Hill equation-based fault detection algorithm to the whole dataset under the selection of the optimal hyperparameter combination. The blue circles represent the NOC trajectories, while the red crosses correspond to faulty conditions. The dashed orange lines denote UCL and LCL under the optimal α value (0.01).
Processes 13 03519 g004
Figure 5. Comparison of NOC and fault spectra (T = 34 °C; Cr = 0.007 IMCU mL−1), along with the reconstructed spectra using the control limits values corresponding to the fault detection time (a) and the associated error plot (b).
Processes 13 03519 g005
Figure 6. Heatmap for accuracy as a function of the hyperparameters corresponding to the T2 and SPE fault detection algorithm.
Processes 13 03519 g006
Figure 7. T2 vs. SPE plot showing fault trajectories compared to those from calibration and validation NOC samples, highlighting the deviation patterns under rennet concentration and temperature faults. The arrows’ directions highlight the temporal evolution of the T2 and SPE statistics.
Processes 13 03519 g007
Figure 8. T2 (left column) and SPE (Right column) time evolution statistics for an NOC (first row) and two faulty batches (second and third rows). The statistical values are indicated by the black line, while the control limits are denoted by the orange dashed lines.
Processes 13 03519 g008
Figure 9. Variable contributions to the SPE (left column) and T2 (right column) for three different fault types. The contribution plots were obtained at the corresponding time of the fault.
Processes 13 03519 g009
Table 1. Operative conditions for the milk coagulation batches explored in this work.
LabelTemperature
[°C]
Rennet Concentration [IMCU/mL of Milk]ReplicationsOperative Category
NOC1340.0294NOC
NOC2360.0294NOC
NOC3380.0294NOC
F1340.0072Fault
F2360.0071Fault
F3380.0071Fault
F4T0 = 38 °C0.01451Fault
F5340.01451Fault
F6360.01451Fault
F7380.01451Fault
Table 2. Fault detection results for each model obtained under the optimal combination of hyperparameters.
Parameter# Consecutive PointsαAccuracyFDRFAR t ¯ f a u l t [min]
SCI100.010.890.960.1813.3
Non-linear model50.010.99610.018.5
T210.090.930.850.0036.5
SPE30.030.9510.097.6
SPE and T210.070.920.8307.2
SPE or T230.030.960.990.097.0
Disclaimer/Publisher’s Note: The statements, opinions and data contained in all publications are solely those of the individual author(s) and contributor(s) and not of MDPI and/or the editor(s). MDPI and/or the editor(s) disclaim responsibility for any injury to people or property resulting from any ideas, methods, instructions or products referred to in the content.