Article

Numerical Simulation Study on Volume Fracturing of Shale Oil Reservoirs in Y Block of Ordos Basin, China

1
College of Petroleum Engineering, Xi’an Shiyou University, Xi’an 710065, China
2
Shaanxi Key Laboratory of Well Stability and Fluid, Rock Mechanics in Oil and Gas Reservoirs, Xi’an Shiyou University, Xi’an 710065, China
3
No. 6 Gas Production Plant, Changqing Oilfield Company, PetroChina Company Limited, Yan’an 716000, China
4
Exploration and Development Technology Research Center, Yanchang Oilfield Co., Ltd., Yan’an 716000, China
*
Authors to whom correspondence should be addressed.
Processes 2025, 13(10), 3356; https://doi.org/10.3390/pr13103356
Submission received: 27 August 2025 / Revised: 9 October 2025 / Accepted: 16 October 2025 / Published: 20 October 2025
(This article belongs to the Section Energy Systems)

Abstract

The shale oil reservoir in Block Y of the Ordos Basin exhibits low porosity and low permeability, yet it features distinct stratification and developed micro-fractures. During the development process using “horizontal wells + volume fracturing”, the differential in geostress exerts a certain influence on the initiation and propagation of fractures. This paper employs the Cohesive element simulation method to investigate the formation patterns of fracture networks in fractured formations. By prefabricating natural fractures, the study explores the impact of natural fractures on the direction of hydraulic fractures during the hydraulic fracturing process. The study considers the fracture initiation and propagation patterns as well as the interaction between hydraulic fractures and natural fractures under differential geostress conditions of 0 MPa, 1 MPa, and 5 MPa. The numerical simulation results reveal that the presence of natural fractures significantly affects the direction of hydraulic fractures, with the tip of the hydraulic fracture deflecting towards the natural fracture. The smaller the geostress difference, the more complex the fractures become with more branching fractures. Conversely, a larger geostress difference leads to the formation of a single double-wing fracture perpendicular to the minimum principal stress, resulting in a simpler fracture morphology. The pore pressure variation at the injection point generally experiences a rapid increase followed by a slight decrease, subsequently undergoing wavy changes. The occurrence of wavy pressure variations indicates the continuous generation of micro-fractures. The fracture width at the injection point generally exhibits an increasing trend followed by a decreasing trend. When the stress difference is 0 MPa, 1 MPa, and 5 MPa, the peak rupture pressures are 12.63 MPa, 13.42 MPa, and 18.33 MPa, respectively; the maximum crack openings are 0.797 cm, 0.779 cm, and 0.771 cm, respectively. The study on fracture initiation and propagation in shale reservoirs provides guidance for the field application of multi-cluster fracturing in horizontal well sections.

1. Introduction

Continental shale oil has become an important replacement resource. Due to the extremely low porosity and permeability of shale reservoirs, as well as their distinct bedding and foliation, “horizontal well + large-scale hydraulic fracturing” technology is commonly used as the main means of reservoir transformation for shale oil reservoirs in the Ordos Basin [1,2,3]. Due to the development of microcracks in shale oil reservoirs, hydraulic fractures are influenced by natural fractures during hydraulic fracturing, causing the trajectory of hydraulic fractures to deviate, ultimately affecting the final shape of the fractures [4,5]. Shale reservoirs have heterogeneity and a large number of microcracks (defects) developed internally. Microcracks have an important impact on the initiation, propagation, and connectivity of hydraulic fractures during hydraulic fracturing [6]. Therefore, the study of crack initiation and propagation in brittle materials (microcracks in shale) with pre-existing defects is of great significance.
The problem with hydraulic fracturing is the process of coupling the solid and fluid parts. The goal of hydraulic fracturing is to pursue the maximum “Reservoir Stimulation Volume (SRV)”. During the volume fracturing process of terrestrial shale reservoirs, the fracturing fluid is continuously pumped into the formation, and when the pumping pressure reaches the critical pressure for crack initiation, the reservoir rock undergoes cracking and destruction, and the resulting cracks continue to expand under continuous pressure supply [7,8]. The theory of linear elastic fracture mechanics of rocks began with Griffith’s brittle fracture mechanics theory, revised by Orowan, and developed by Irwin. Irwin regards material fracture as a discontinuous surface with displacement vectors for cracks [9]. In the theory of linear elastic fracture mechanics (LEFM), there are three forms of rock fracture: rock opening (Type I), sliding (Type II), and tearing (Type III). The corresponding crack initiation can also be divided into three types: tensile opening cracks (Type I), shear sliding cracks (Type II), and torsional tearing cracks (Type III) [10].
During the process of volume fracturing, rock mechanics parameters have a significant impact on the initiation and propagation of hydraulic fracturing fractures. Irwin proposed an expression for the stress field at the crack tip, established the relationship between the energy at the crack tip and the stress intensity factor, and thus proposed a failure theory based on the stress intensity factor perspective. Fracture toughness is a key parameter for the initiation and propagation of cracks, and the presence of microcracks affects the propagation path of hydraulic cracks. According to fracture mechanics theory, when the stress intensity factor (K) at the crack tip reaches a critical value, the crack propagates, which is called the critical stress intensity factor or fracture toughness (KIC) [11,12,13].
Shale oil reservoirs have thin sheet-like or layered joints, weak interlayer bonding, concentrated crack development, and exhibit obvious transverse isotropy characteristics [14]. Jaeger [15,16,17,18,19] and Niandou [20] categorized the failure modes of layered rock masses into two basic forms: shear failure and tensile failure. Yew [21] and Wolfgang [22] established a calculation model for crack initiation pressure under arbitrary wellbore inclination conditions. Anderson et al. [23] conducted indoor experimental studies on the propagation morphology of hydraulic fractures under different natural crack wall roughness conditions. Blanton et al. [24,25] conducted a systematic study on the propagation law of hydraulic fractures under different natural fracture approximation angles and horizontal stress differences. Warpinski [26] classified the mutual interference between natural fractures and hydraulic fractures into three categories: (1) directly passing through natural fractures; (2) the extension of the main crack is obstructed; and (3) natural cracks undergo shear and slip. Fisher et al. [27,28] classified hydraulic fractures into three categories based on their geometric shapes: symmetrical bifurcations, multiple fractures, and fracture networks. Mayerhofer et al. [29,30] first proposed the concept of Reservoir Stimulation Volume (SRV). Soliman et al. [31] proposed a zipper fracturing construction method.
At present, there are three methods for simulating the initiation and propagation of fractures in shale reservoirs: finite element method (FEM), discrete element method (DEM), extended finite element method (XFEM), displacement discontinuity method (DDM), and meshless method (MF) [32,33,34,35]. The displacement discontinuity method was proposed by Crouch [36] and has been widely used to simulate discontinuous displacement field problems such as crack propagation. The discrete element method was proposed by Cundell [37] for simulating nonlinear problems such as rock fractures. The finite element method achieves the arbitrary path extension of simulated cracks by reconstructing the mesh by aligning the boundary of the mesh element with the boundary mesh of the crack [38,39,40]. Belytschko et al. from Northwestern University first proposed the extended finite element method in 1999 [41,42]. In the 1960s, Barenblat and Dugdale first proposed the Cohesion Model (CZM) and studied the fracture propagation of brittle materials and small-scale ductile materials, respectively. A finite element analysis method developed as a result [43,44]. The CZM assumes the existence of a damage evolution zone at the crack tip, avoiding singular values at the crack tip in linear elastic fracture mechanics (LEFM) [45,46,47,48,49,50]. Based on the above advantages, this article adopts the method of adding cohesive elements to the finite element method for hydraulic fracturing related research.
The finite element plus cohesive bonding element simulation method is an effective method for simulating hydraulic fracturing crack propagation. The cohesive bonding element simulation method embeds zero thickness cohesive bonding elements at the boundary of the reservoir matrix element and simulates the displacement, effective stress, and pore pressure changes in the reservoir rock using rock solid elements. The cohesive bonding element simulates the size, fluid pressure, and fracture failure mode of hydraulic fracturing crack propagation. The process of hydraulic fracturing crack propagation is a dynamic coupling process between fracturing cracks and the reservoir matrix, as well as between pore pressure and effective stress. This method can be used to study the formation pattern of fracture networks during the volume fracturing process of terrestrial shale oil reservoirs. This article studies the influence of different geostress differences on the initiation and propagation of fractures, which has important guiding significance for the field application of hydraulic fracturing.

2. Cohesive Bonding Unit Simulation Method

In the development process of terrestrial shale oil reservoirs, the “horizontal well + volume fracturing” technology is used for production enhancement and transformation. This process requires consideration of the seepage and filtration of fracturing fluid, as well as changes in the rock stress field and damage and destruction. The Cohesive Zone Model (CZM) can be used to achieve coupling between fluid flow in porous media and rock deformation. The cohesive force model utilizes the dual line elastic traction separation criterion to characterize the process of crack rupture. Cohesive bonding units can be used to simulate crack propagation behavior, material defects, etc. To simulate using cohesive bonding elements, it is necessary to pre-set the failure location element (crack initiation position) in advance.

2.1. Linear Elastic Traction Separation Behavior

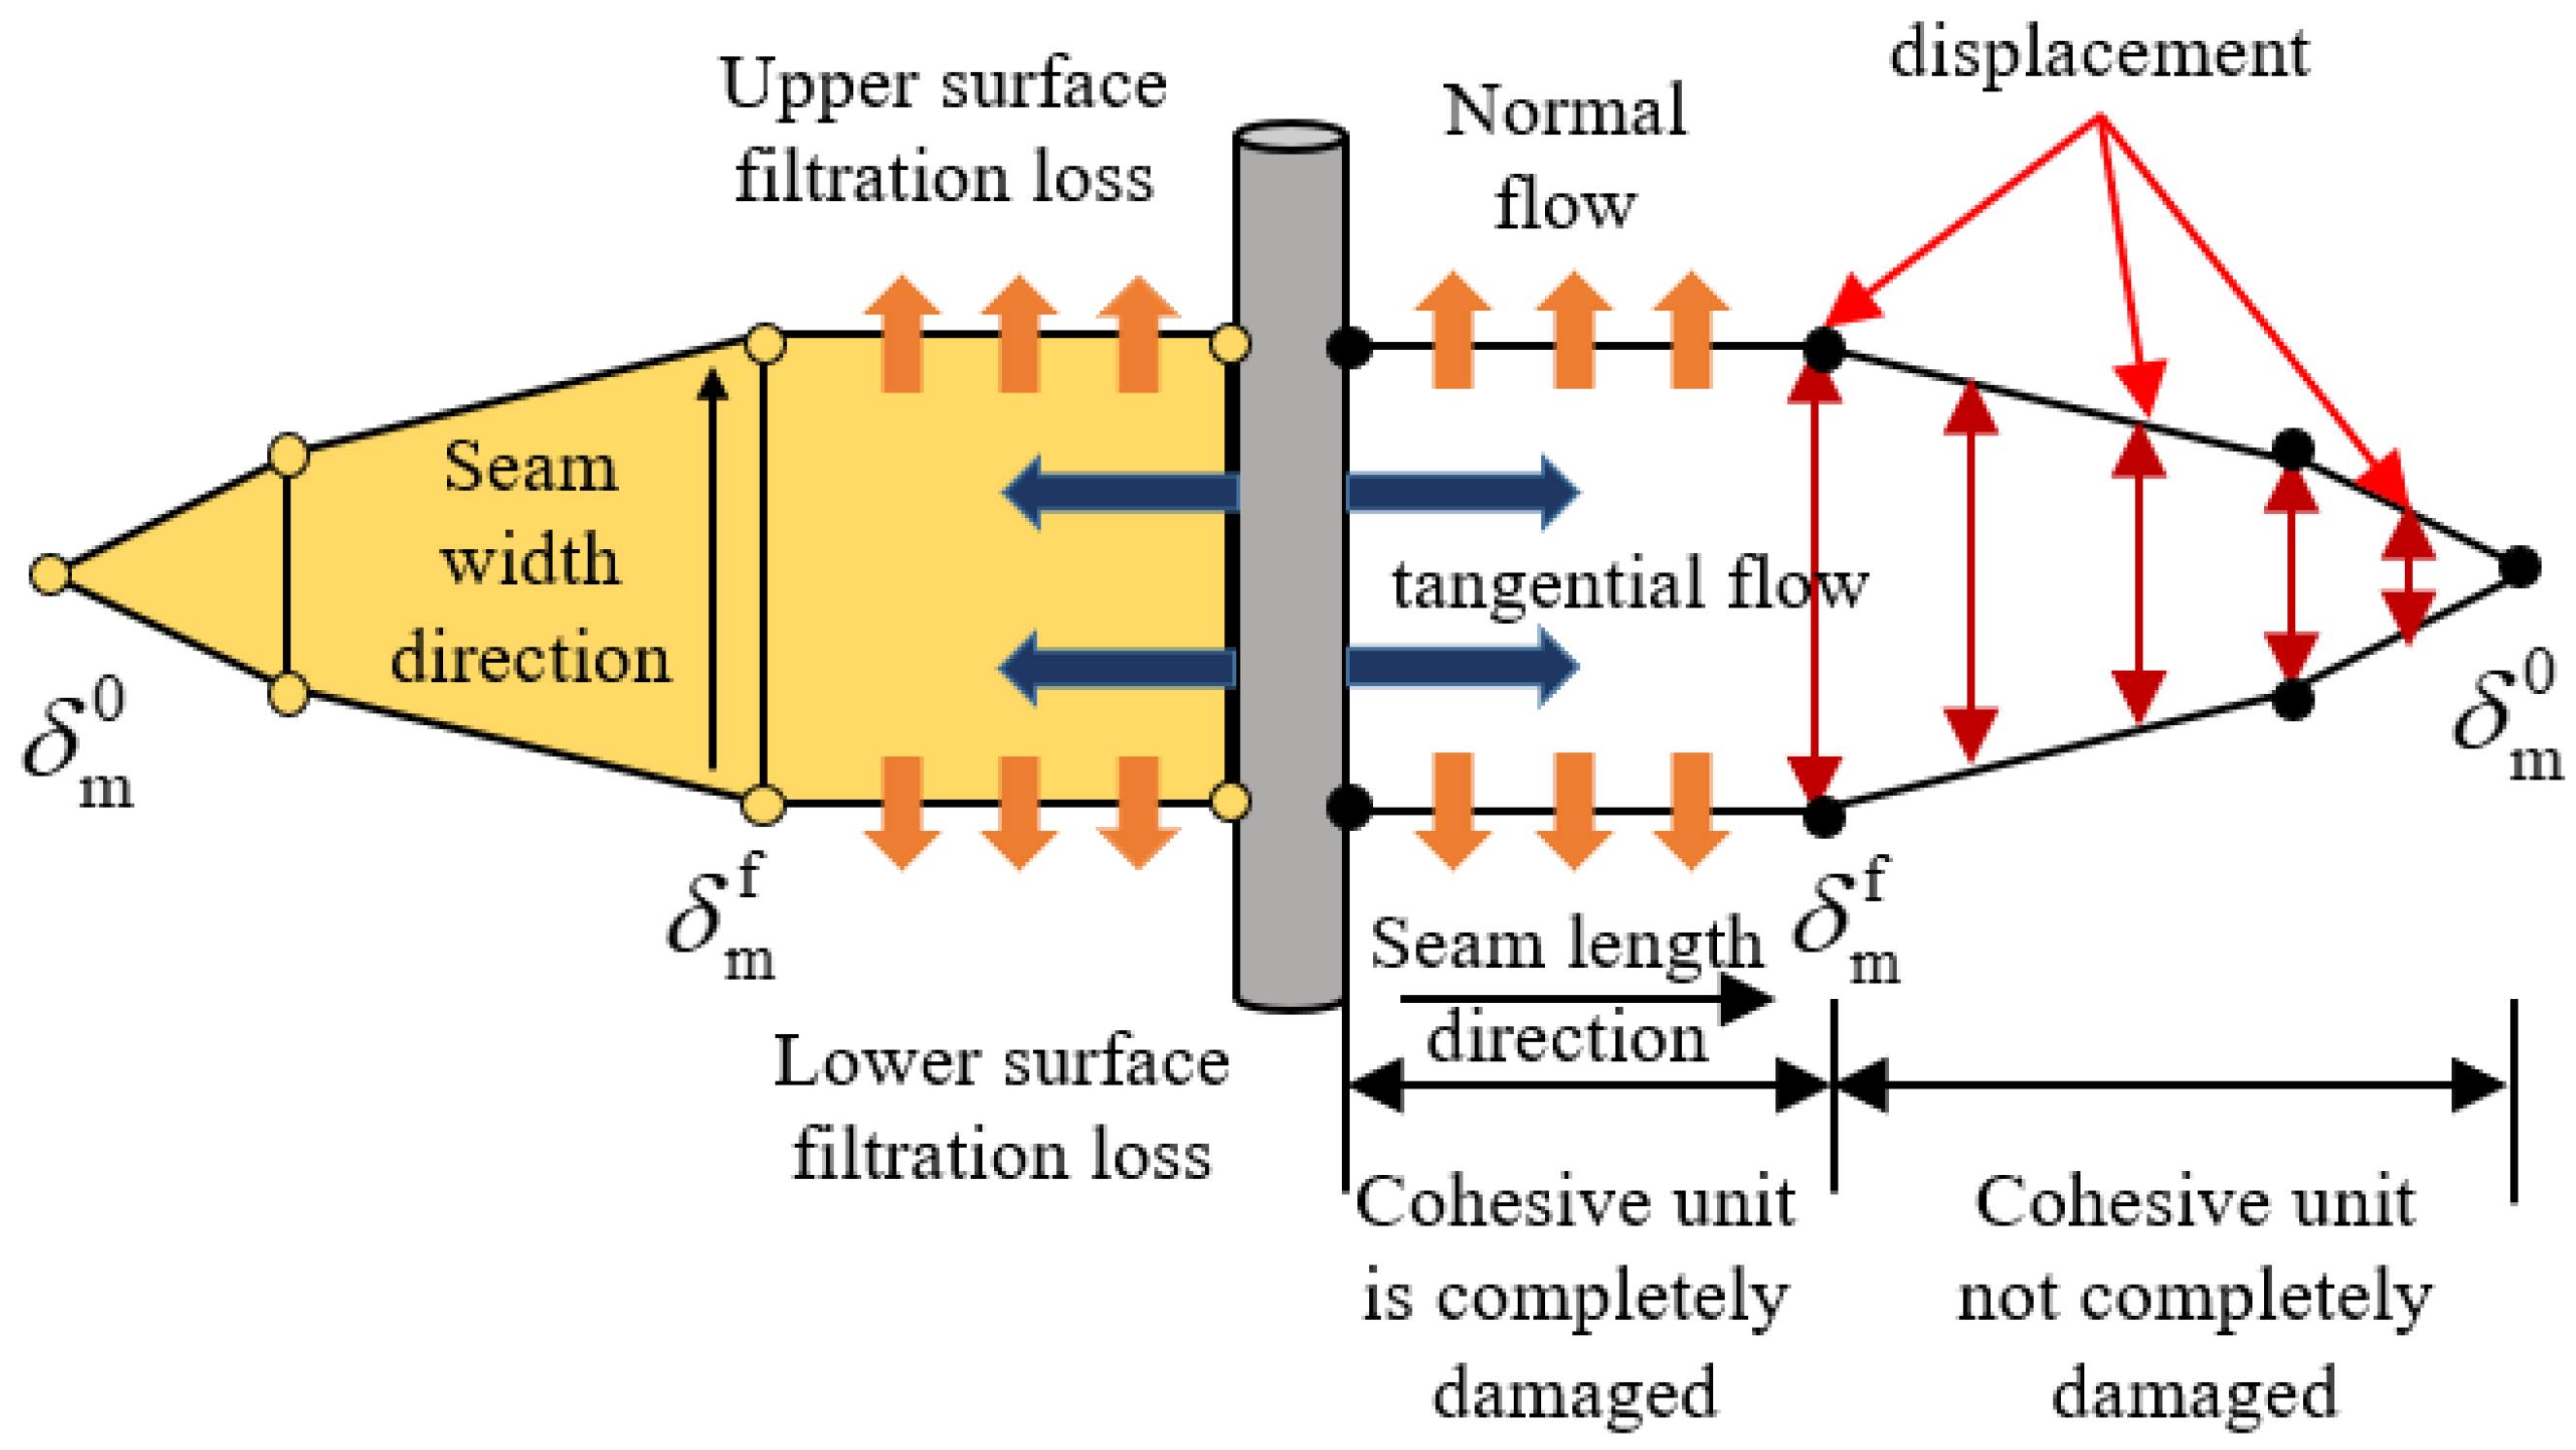
The cohesive bonding unit adopts a traction separation mode, and the initial damage and damage evolution of the unit are assumed to have linear elastic characteristics. The geometric thickness used for the traction separation response is equal to 0, which is called a 0-thickness cohesive bonding element. The schematic diagram of the bilinear traction separation criterion is shown in Figure 1, where δ m 0 is Effective displacement at the beginning of destruction; δ m f is Effective displacement upon complete destruction. The first stage (0~ δ m 0 ) is the linear elastic stage, during which the cohesive force unit remains undamaged; the second stage ( δ m 0 ~ δ m f ) is the softening stage of the element, where, as the displacement gradually increases, the stress borne by the element begins to gradually decrease; and when the displacement increases to ( δ m f ), the unit completely loses its bearing capacity, marking the opening of cracks and the complete rupture of the unit. D is a dimensionless damage coefficient with a range of 0 to 1. If D = 0, it indicates that the material has not yet been damaged; if D = 1, it indicates that the material has been completely destroyed.

2.2. Damage Model of Cohesive Bonding Unit

The response characteristics of cohesive bonding units are defined based on traction separation. By allowing the combination of multiple damage mechanisms acting on the same material, each failure mechanism consists of three parts—initial damage criterion, damage evolution law, and the complete damage failure unit reaching a completely damaged state.
Cohesive bonding units are assumed to exhibit linear elastic behavior before initial damage, but once the initial damage criterion is reached, the material will undergo initial damage according to user-defined damage evolution laws. The formula for the initial linear elastic stage is shown in formula (1). The secondary stress damage criterion assumes that when the sum of the squared ratios of the stresses in three directions to their corresponding critical stresses reaches one, the cohesive bonding unit begins to form damage. The secondary stress damage criterion is shown in formula (2).
Damage evolution: Once the cohesive bonding unit material meets the set initial damage criteria, the set damage evolution criteria are mainly used to describe the rate of stiffness degradation of the material. The damage variable scalar D represents the overall damage of the material and takes into account the comprehensive effect of all damage evolution mechanisms. The initial value of the damage variable is 0. If the damage evolution is defined in the model and damage is formed, as the loading continues, the value of D gradually evolves from 0 to 1.0, and the stress component of traction separation is also affected by the damage. The damage evolution criterion is shown in formula (3).
Initial linear elastic stage formula:
t = t n t s t t = K ε = E nn E ns E nt E ns E ss E st E nt E st E tt ε n ε s ε t
Secondary stress damage criterion:
t n t n 0 2 + t s t s 0 2 + t t t t 0 2 = 1
In formulas (1) and (2), t n , t s , and t t are the nominal normal stress, first tangential nominal tangential stress, and second tangential nominal tangential stress of the cohesive bonding unit. t n 0 , t s 0 , and t t 0 represent the highest nominal stress when the deformation is completely perpendicular to the unit plane or only in the first or second shear direction. ε n 0 , ε s 0 , and ε t 0 represent the highest nominal strain when the deformation is completely perpendicular to the unit plane or only in the first or second shear direction. The symbol indicates that the cohesive bonding unit will not be damaged under stress compression deformation.
Damage evolution criteria:
G C = G n C + G s C G t C G s + G t G n + G s + G t η
In formula (3), G C represents the fracture energy, total energy release rate of the unit, N/m; G n C , G s C , and G t C , respectively, represent the pure normal fracture energy, the shear fracture energy in the first shear direction, and the shear fracture energy in the second shear direction, N/m. η is for material parameters, non-dimensional.

2.3. The Constitutive Response of Fluid Within the Gaps of Cohesive Bonding Units

The flow patterns of pore fluid in cohesive bonding units are shown in Figure 2, including the tangential flow and normal flow within the gaps of cohesive bonding units. Tangential flow can be characterized using Newtonian or power-law fluid models; normal flow can reflect the resistance caused by agglomeration and scaling. The model assumes that the fluid is incompressible, and the relevant formulas are characterized based on the fluid continuity state equation, taking into account the tangential and normal flow of cracks and the opening rate of cohesive bonding units.

3. Hydraulic Fracturing Simulation of Fractured Formations Based on Cohesive Unit Method

The natural fractures in the Y block shale reservoir of the Ordos Basin are relatively developed. During the horizontal well and volume fracturing process, the large number of natural fractures developed in the shale reservoir will affect the expansion morphology of the fractures, thereby affecting the morphology of the fracture network. Therefore, in the process of studying the formation law of the hydraulic fracturing network, the influence of natural fractures must be considered. Based on this, this article establishes a numerical model for the formation of fracture networks considering natural cracks using finite element software.

3.1. Establishment of a Model for the Formation Law of Volume Fracturing Crack Network

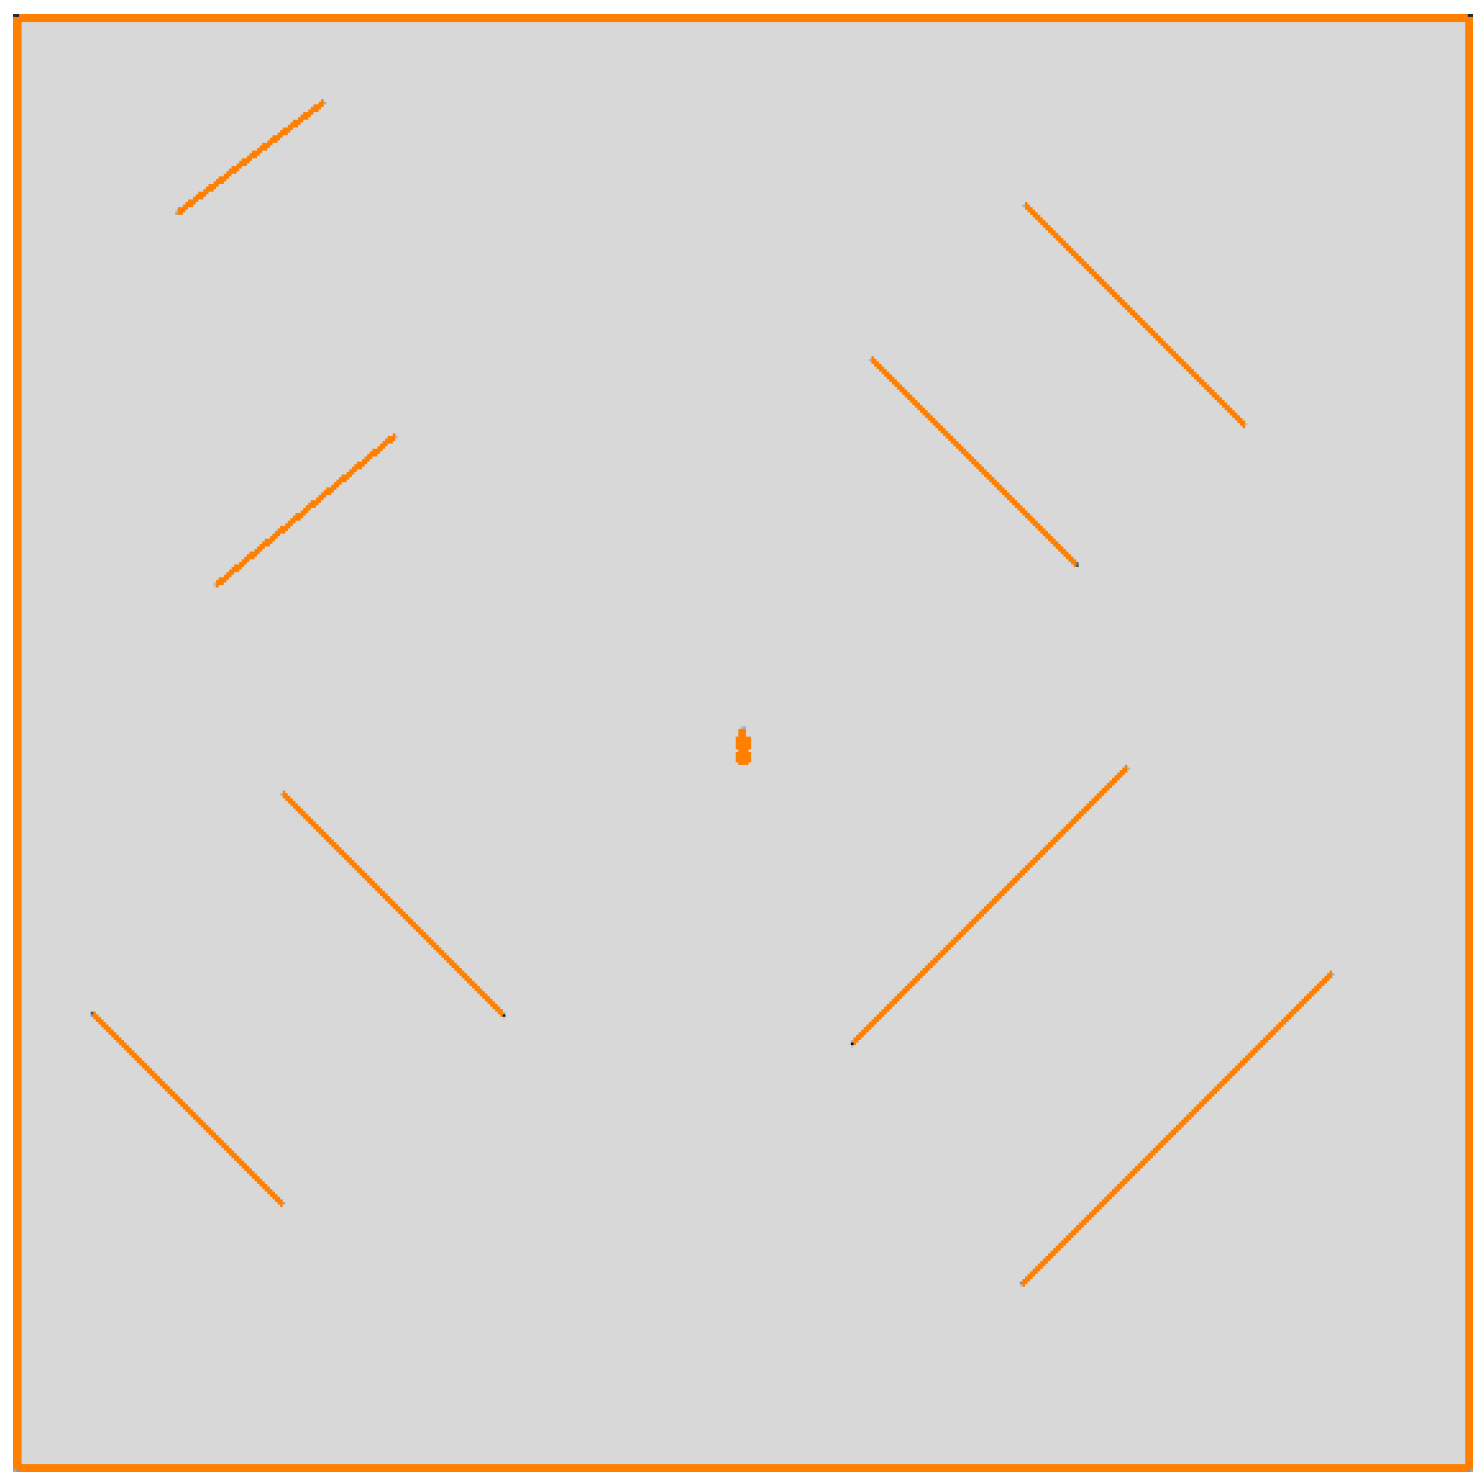
The shale reservoirs in Block Y of the Ordos Basin are developed with bedding and foliation, so the influence of natural fractures must be considered in the model-building process. The orientation of the main fractures in the Chang 7 shale oil reservoir in this block is northeast–southwest 10~20°. Establish the influence of natural fractures on fracture initiation and propagation in the hydraulic fracturing of shale reservoirs, as shown in Figure 3. The model size is 50 m × 50 m, σ H represents the maximum horizontal principal stress, and σ h represents the minimum horizontal principal stress.
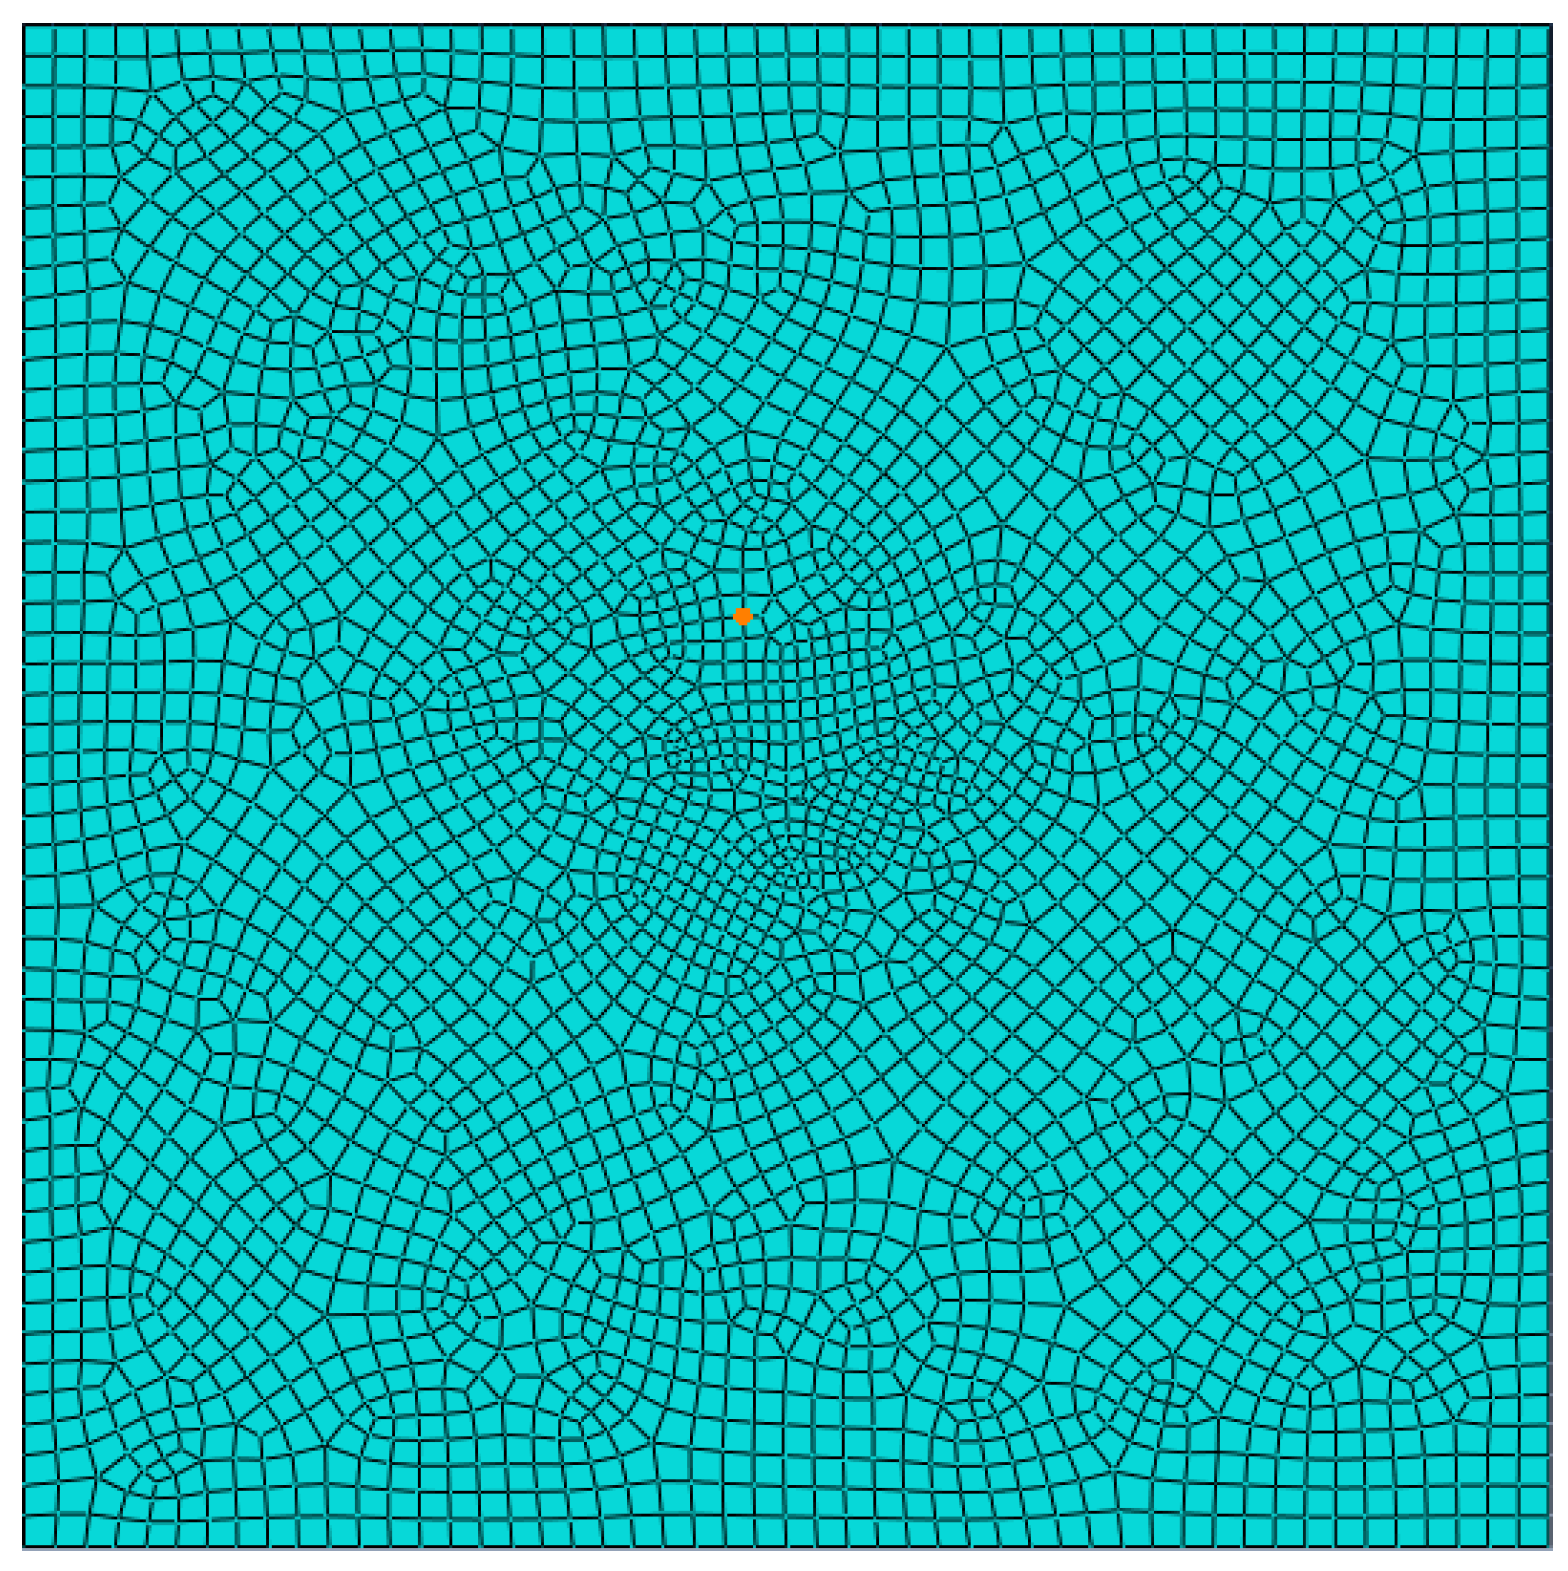
The elastic modulus of the rock matrix is 15 GPa, with a Poisson’s ratio of 0.25. The model is globally embedded with zero thickness cohesive seepage elements, reference lines are created for pre-existing natural cracks and initial crack initiation positions, and joints are drawn. The grid division is shown in Figure 4. The specified grid division method is the quad quadrilateral mesh division, the specified grid type is CPE4P, the specified element type is COH2D4P, and the viscosity regularization coefficient is 0.01. In terms of material properties, the cohesive unit has an elastic modulus of 15 GPa and follows the Max Damage failure law, resulting in fracture at 6 MPa. In the evolution law of damage, the traction separation criterion is adopted, and the fracture occurs when the distance reaches 0.001, with a normal filtration coefficient of 1 × 10⁻¹⁴ and a tangential viscosity of 0.001. The initial ground stress is a maximum horizontal principal stress of 10 MPa and a minimum horizontal principal stress of 5 MPa. In rock matrix materials, the elastic modulus is 15 GPa, Poisson’s ratio is 0.25, the permeability coefficient is 1 × 10⁻⁷, porosity is 0.1, liquid specific gravity is 9800, and the unit system is unified to the International System of Units: kilogram (kg)–meter (m)–second (s)/N/Pa.
The Young’s modulus of the Chang 7 shale oil reservoir in Block Y of the northwest Ordos Basin is measured to be 15 GPa and Poisson’s ratio to be 0.25 through uniaxial compression experiments. The basic parameters of the model are shown in Table 1. The initial porosity ratio is 0.1, and the permeability coefficient of 1 × 10⁻⁷ m/s is calculated through permeability conversion. The viscosity of the fracturing fluid is 0.001 Pa·s. The fracturing fluid displacement can be adjusted, with a setting of 0.1 m3/min and an injection time of 20 s.
Boundary conditions: Boundary conditions Bc-x, Bc-y, and Bc-pp are fixed using an ultra-hydrostatic pressure system, applying the initial effective geostress field and pore pressure field on the model according to the actual situation of the reservoir. The simulation is mainly divided into two stages: The first stage is the geostress equilibrium stage (Geostatic), which ensures that the model reaches geostress equilibrium in the initial state; the second stage is the hydraulic fracturing stage (Soils), in which the fracturing fluid is injected into the formation at a constant rate from the injection point. By increasing the net pressure of the initial fracture, the hydraulic fracture is promoted to expand, simulating the process of hydraulic fracturing.
Modify inp file: Define initial damage units. The original program is as follows (note: commas must be in English, and all letter symbols must be switched to English):
*initial conditions, type = initial gap
Part-1-allElemEdges-1.ini-elem
Modify the output to increase the width of the cohesive unit crack PFOPEN. Create tasks (Job), perform multi-CPU calculations, submit calculations, and check for issues. Post-processing (Visualization), displaying cloud image results, zooming in on deformations, hiding grids, etc., animation display and output, as well as Python 3.8.5 post-processing.

3.2. The Influence of Different Geostress Differences on the Initiation and Propagation of Cracks

The natural fractures in shale reservoirs are relatively developed, and their fracture network expands into the intersection and extension behavior of hydraulic fractures and natural fractures, which are influenced by factors such as the distribution of natural fractures, geostress, rock mechanical properties, fracturing fluid viscosity, construction flow rate, perforation parameters, etc. The behavior of crack propagation has a significant impact on the final fracture network morphology of shale reservoirs.
There are several relationships between hydraulic fractures and natural fractures. The first is that hydraulic fractures pass through natural fractures; in the second type, hydraulic fracturing does not penetrate natural fractures, and the fracturing fluid communicates with natural fractures and expands along them; in the third type, hydraulic pressure fractures penetrate natural fractures while promoting their expansion, which includes both the first and second cases; and in the fourth type, hydraulic pressure fractures do not intersect with natural fractures, but deviate.
(1)
The influence of natural crack location on crack direction
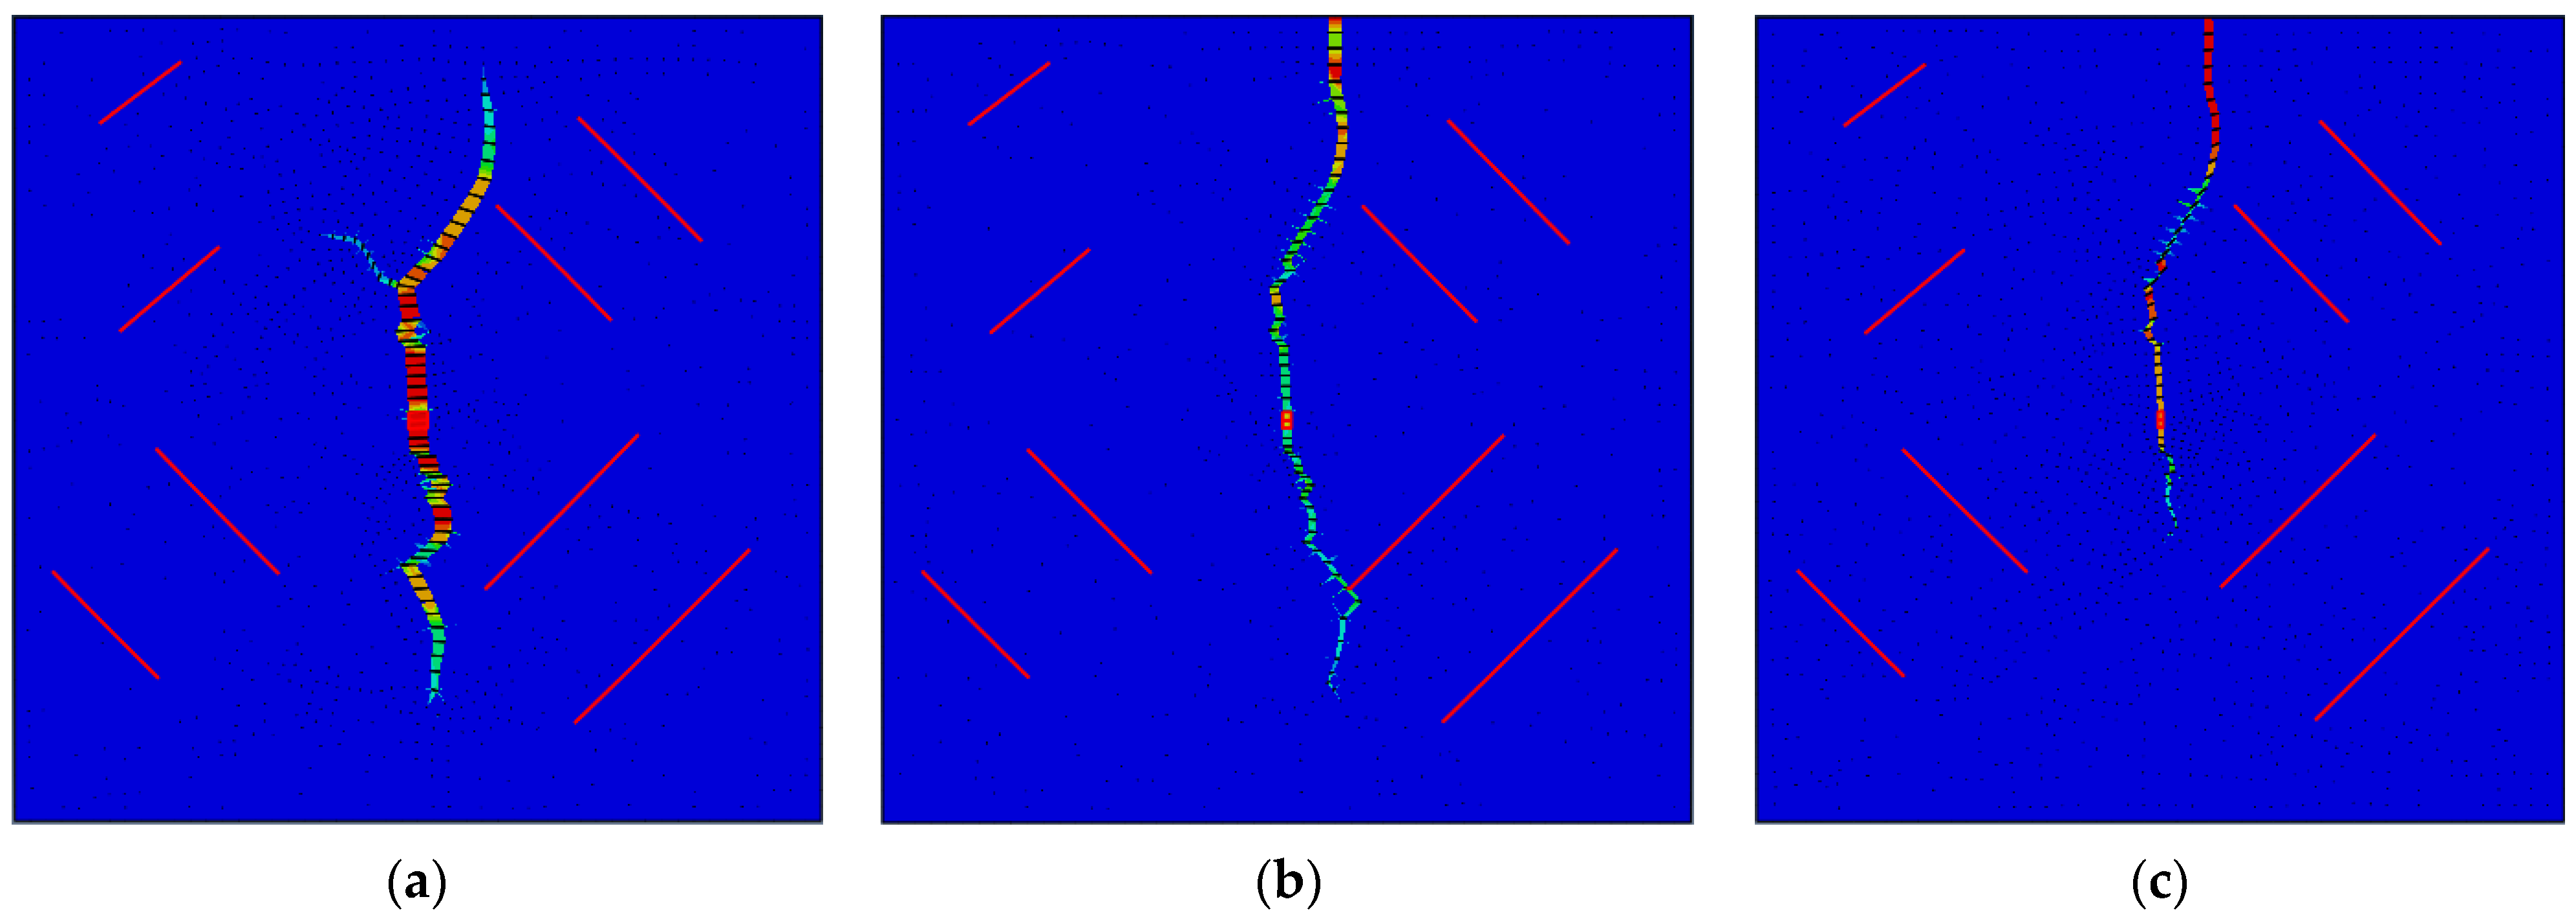
The influence of natural crack location on the direction of hydraulic cracks is shown in Figure 5. Figure 5a shows the direction of crack propagation when the stress difference is 0 MPa. Natural cracks have a certain influence on the direction of hydraulic cracks, and the left branch crack communicates with the natural crack. Figure 5b shows the direction of hydraulic fracture propagation when the stress difference is 1 MPa. The hydraulic fracture in the lower right corner extends towards the natural fracture direction and deflects after communicating with the natural fracture. Figure 5c shows the direction of hydraulic fracture propagation when the ground stress difference is 5 MPa and the overall extension is relatively short.
(2)
Effective velocity of pore fluid under different geostress differences (FLVEL)
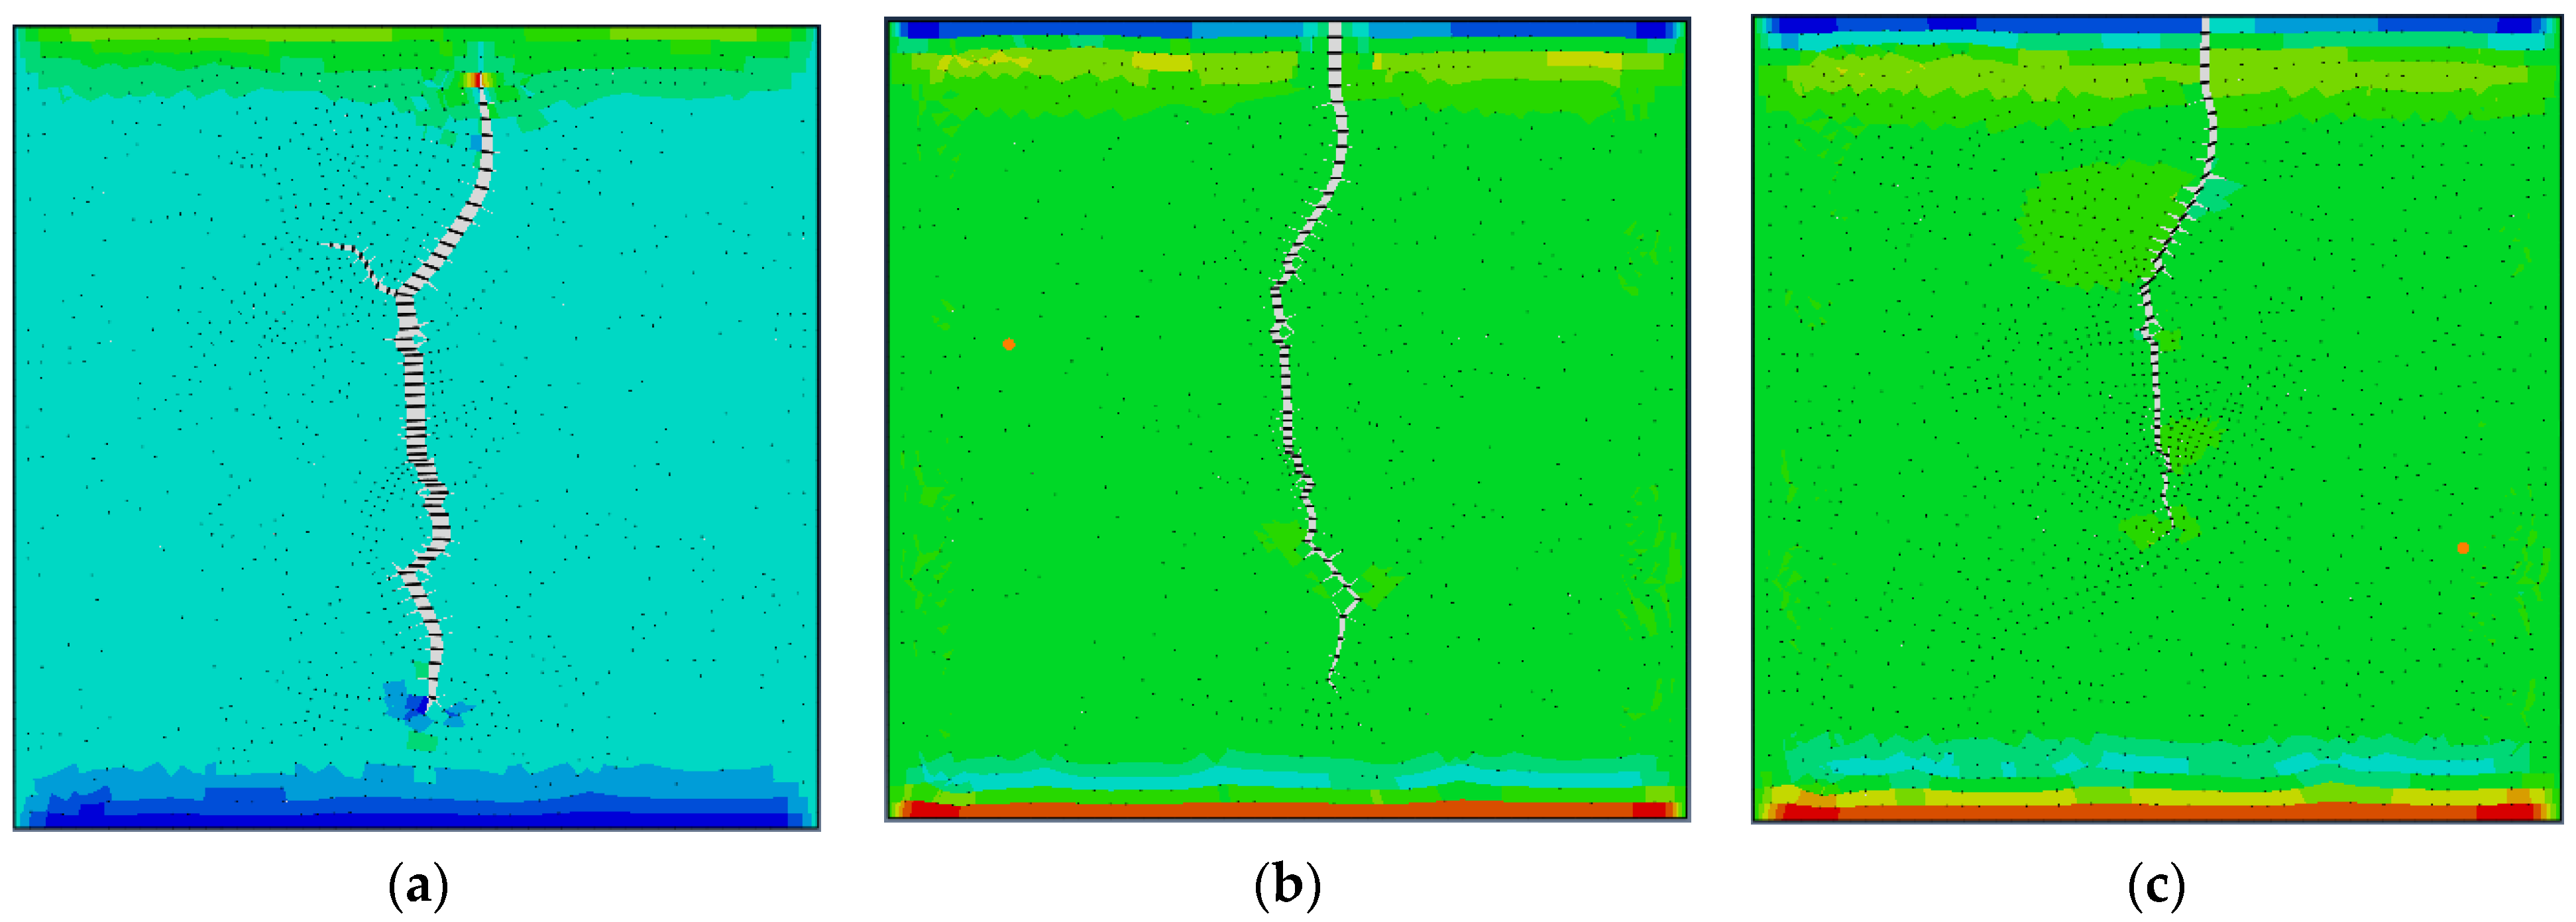
Numerical simulation results for stress differences of 0 MPa, 1 MPa, and 5 MPa. When the stress difference is 0 MPa, the effective velocity of the pore fluid (FLVEL) is shown in Figure 6a. The injection point is located in the center of the model, and the upper part of the artificial crack deviates when it approaches the natural crack. The overall crack shape is complex, with one branch crack. When the stress difference is 0 MPa, the effective velocity of the pore fluid does not change much, only the effective velocity of the pore fluid at the crack tip is relatively high. In Figure 6b, the numerical simulation results show that the upper half of the crack extends to the boundary, and the lower half extends longer when the stress difference is 1 MPa. The effective velocity variation in pore fluid is relatively small. Figure 6c shows the numerical simulation results when the stress difference is 5 MPa. Compared with 0 MPa and 1 MPa, the crack morphology is relatively simple, and the lower half of the crack extends shorter. The effective velocity of pore fluid is relatively low.
The smaller the difference in geostress in Figure 6, the more complex the crack morphology. The effective velocity (FLVEL) of the pore fluid at the crack tip is relatively high, which is conducive to crack propagation.
(3)
Distribution of maximum and minimum principal stresses under different geostress differences
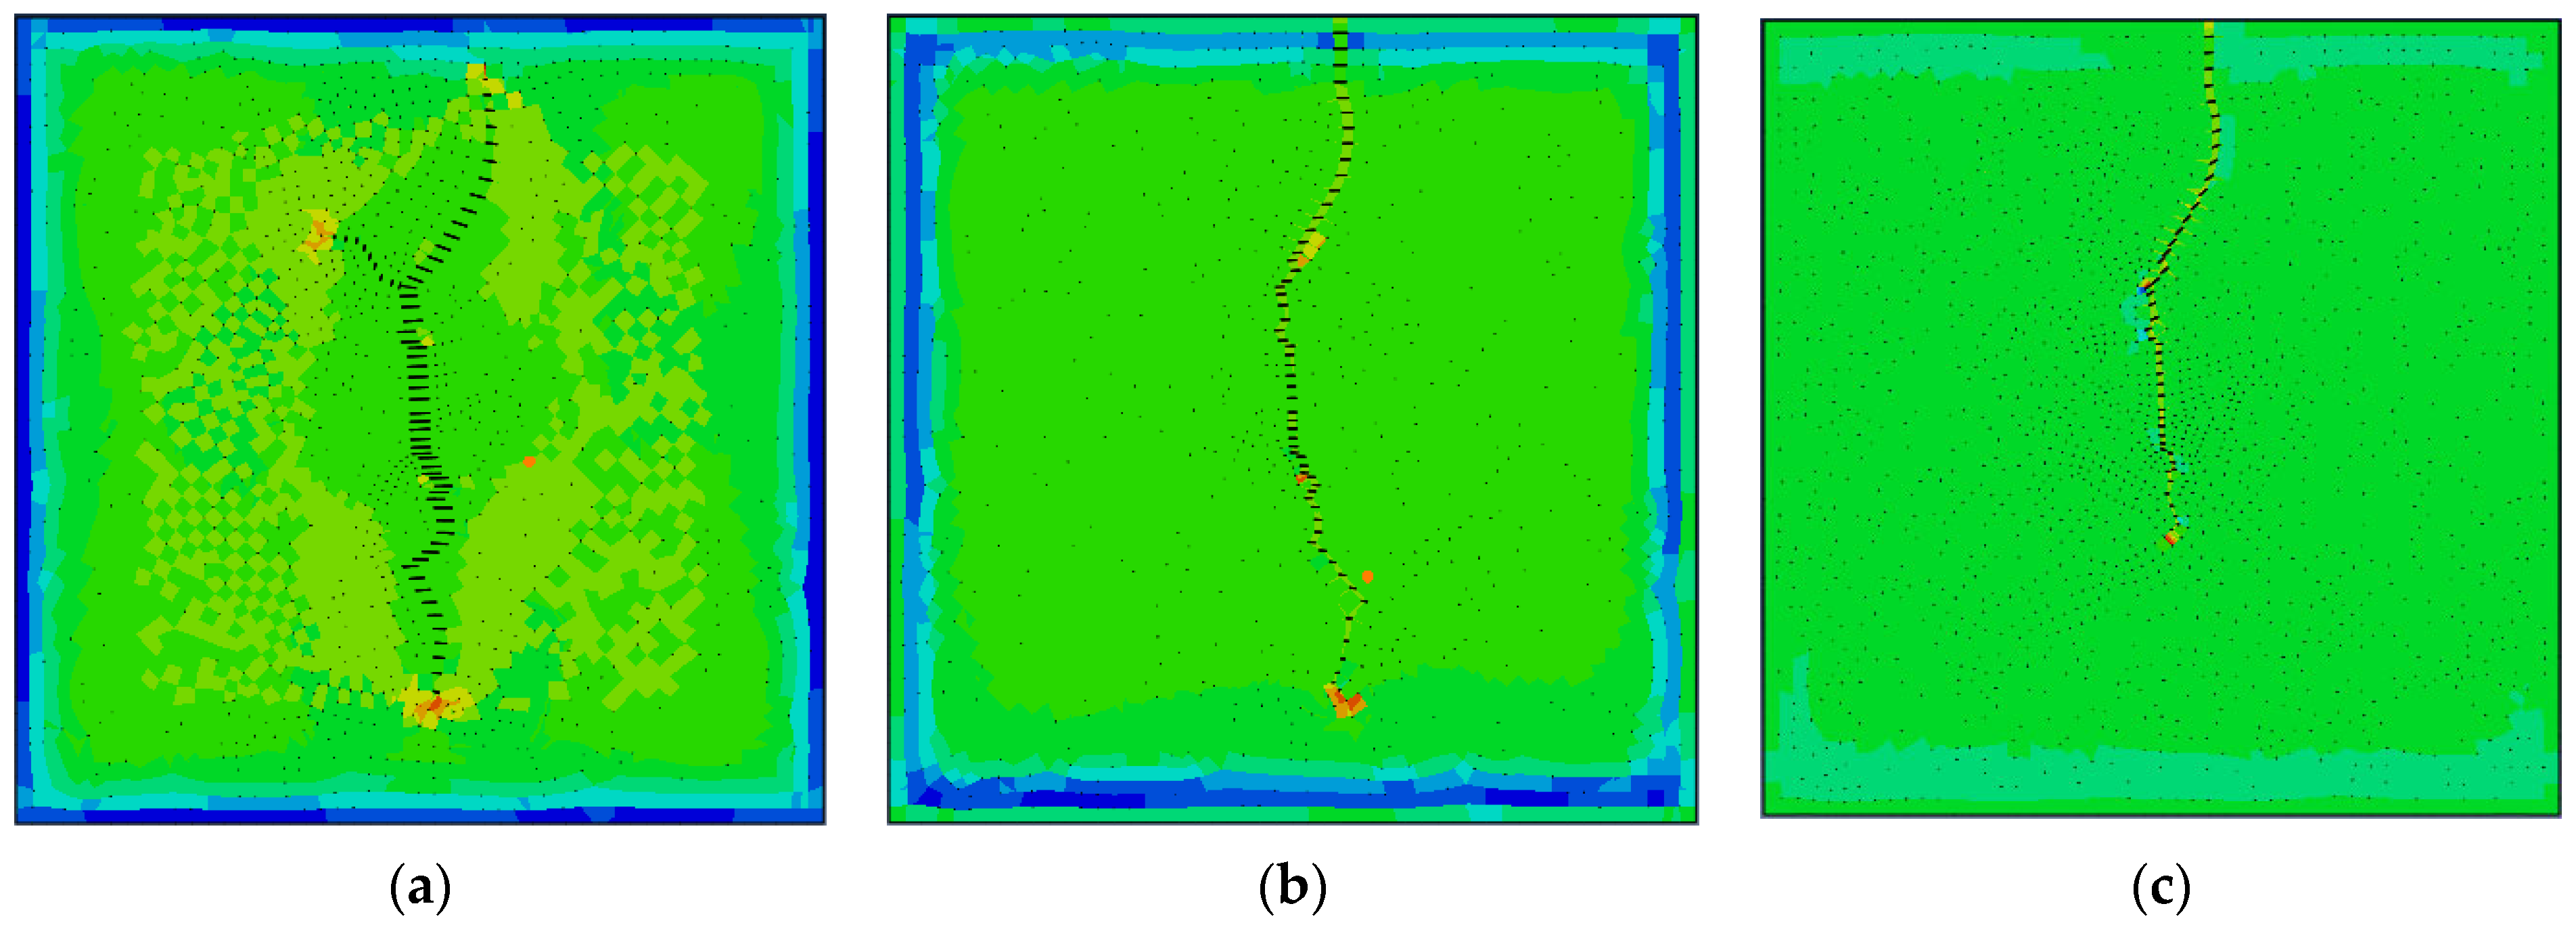
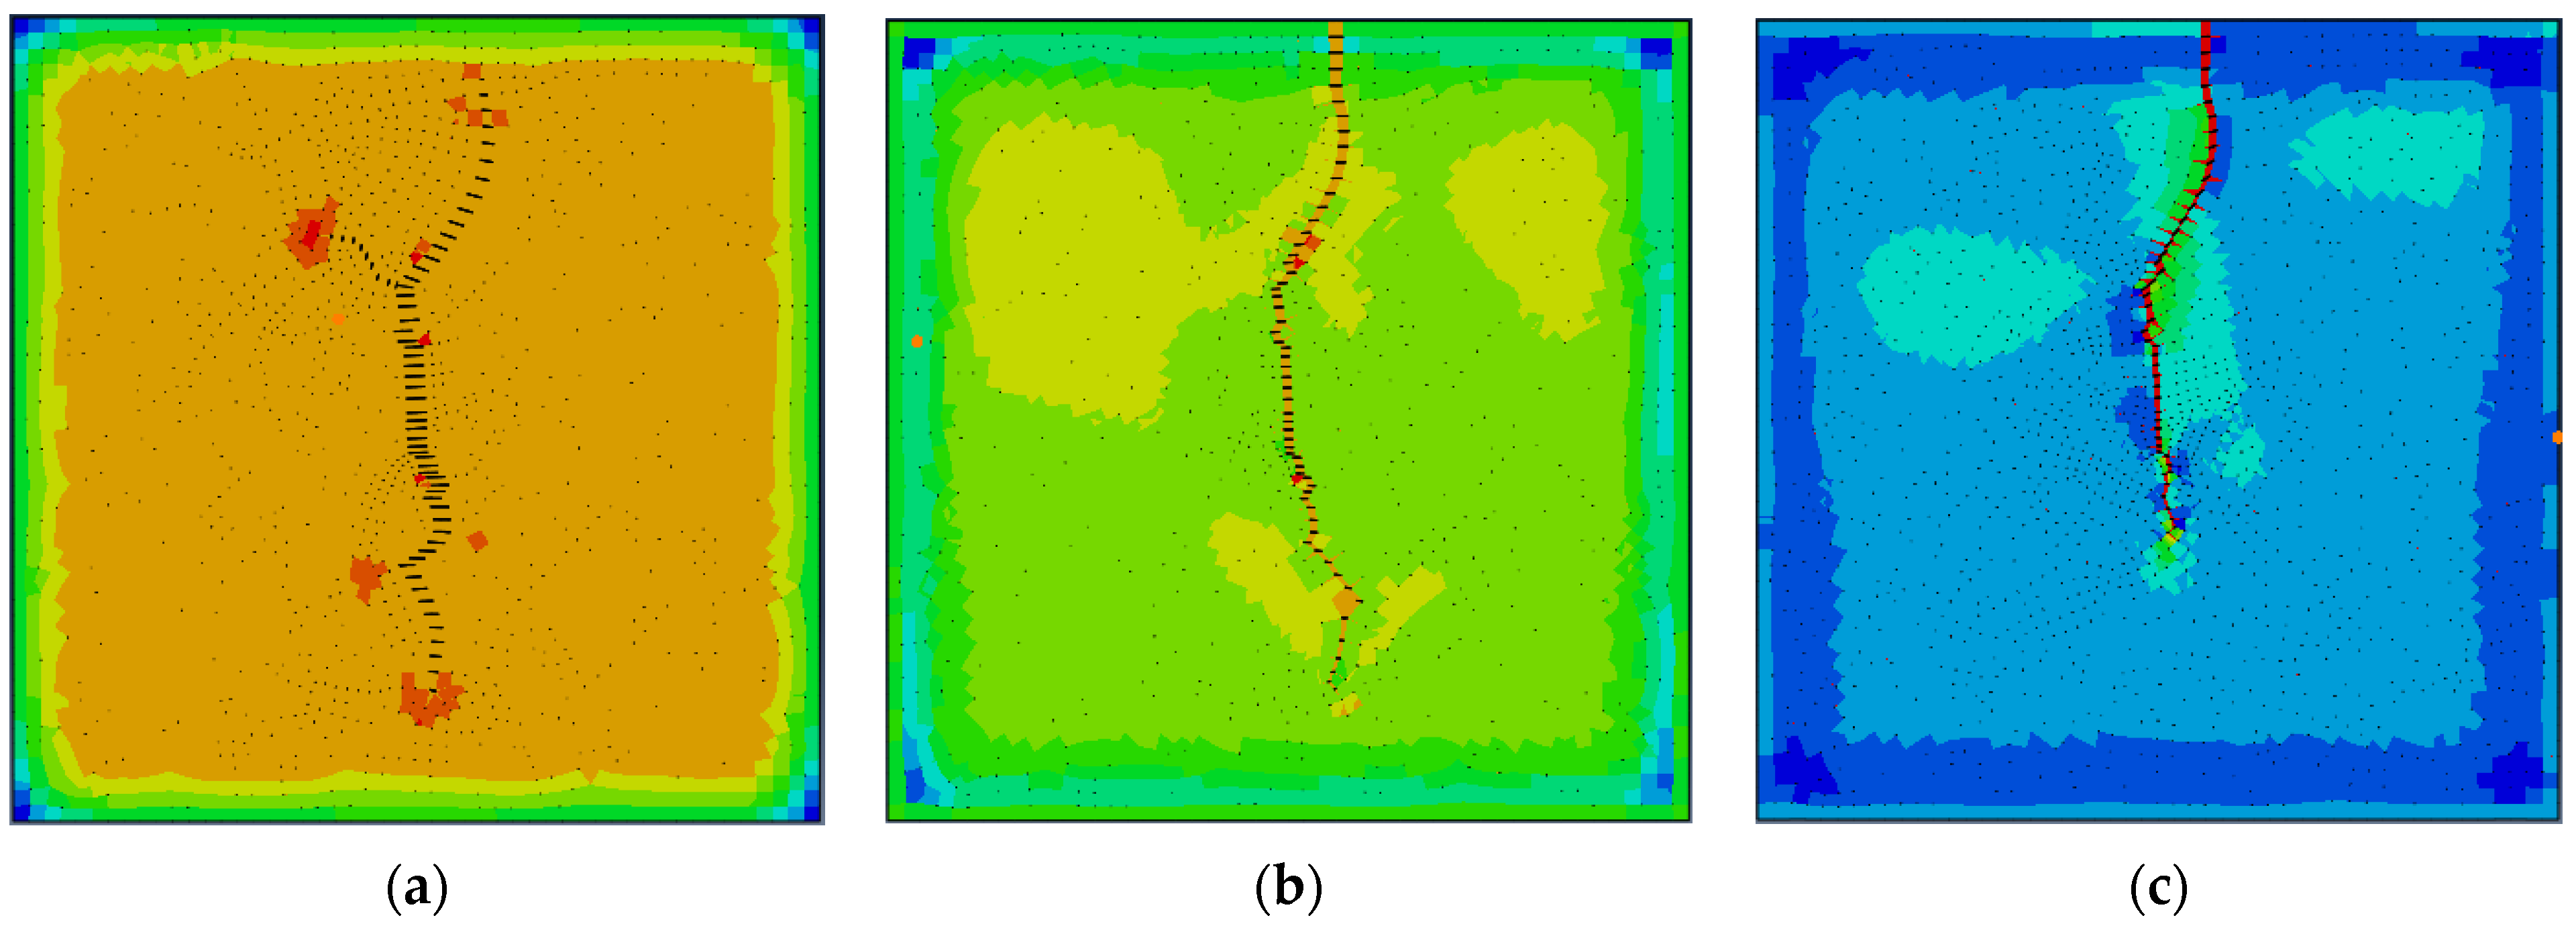
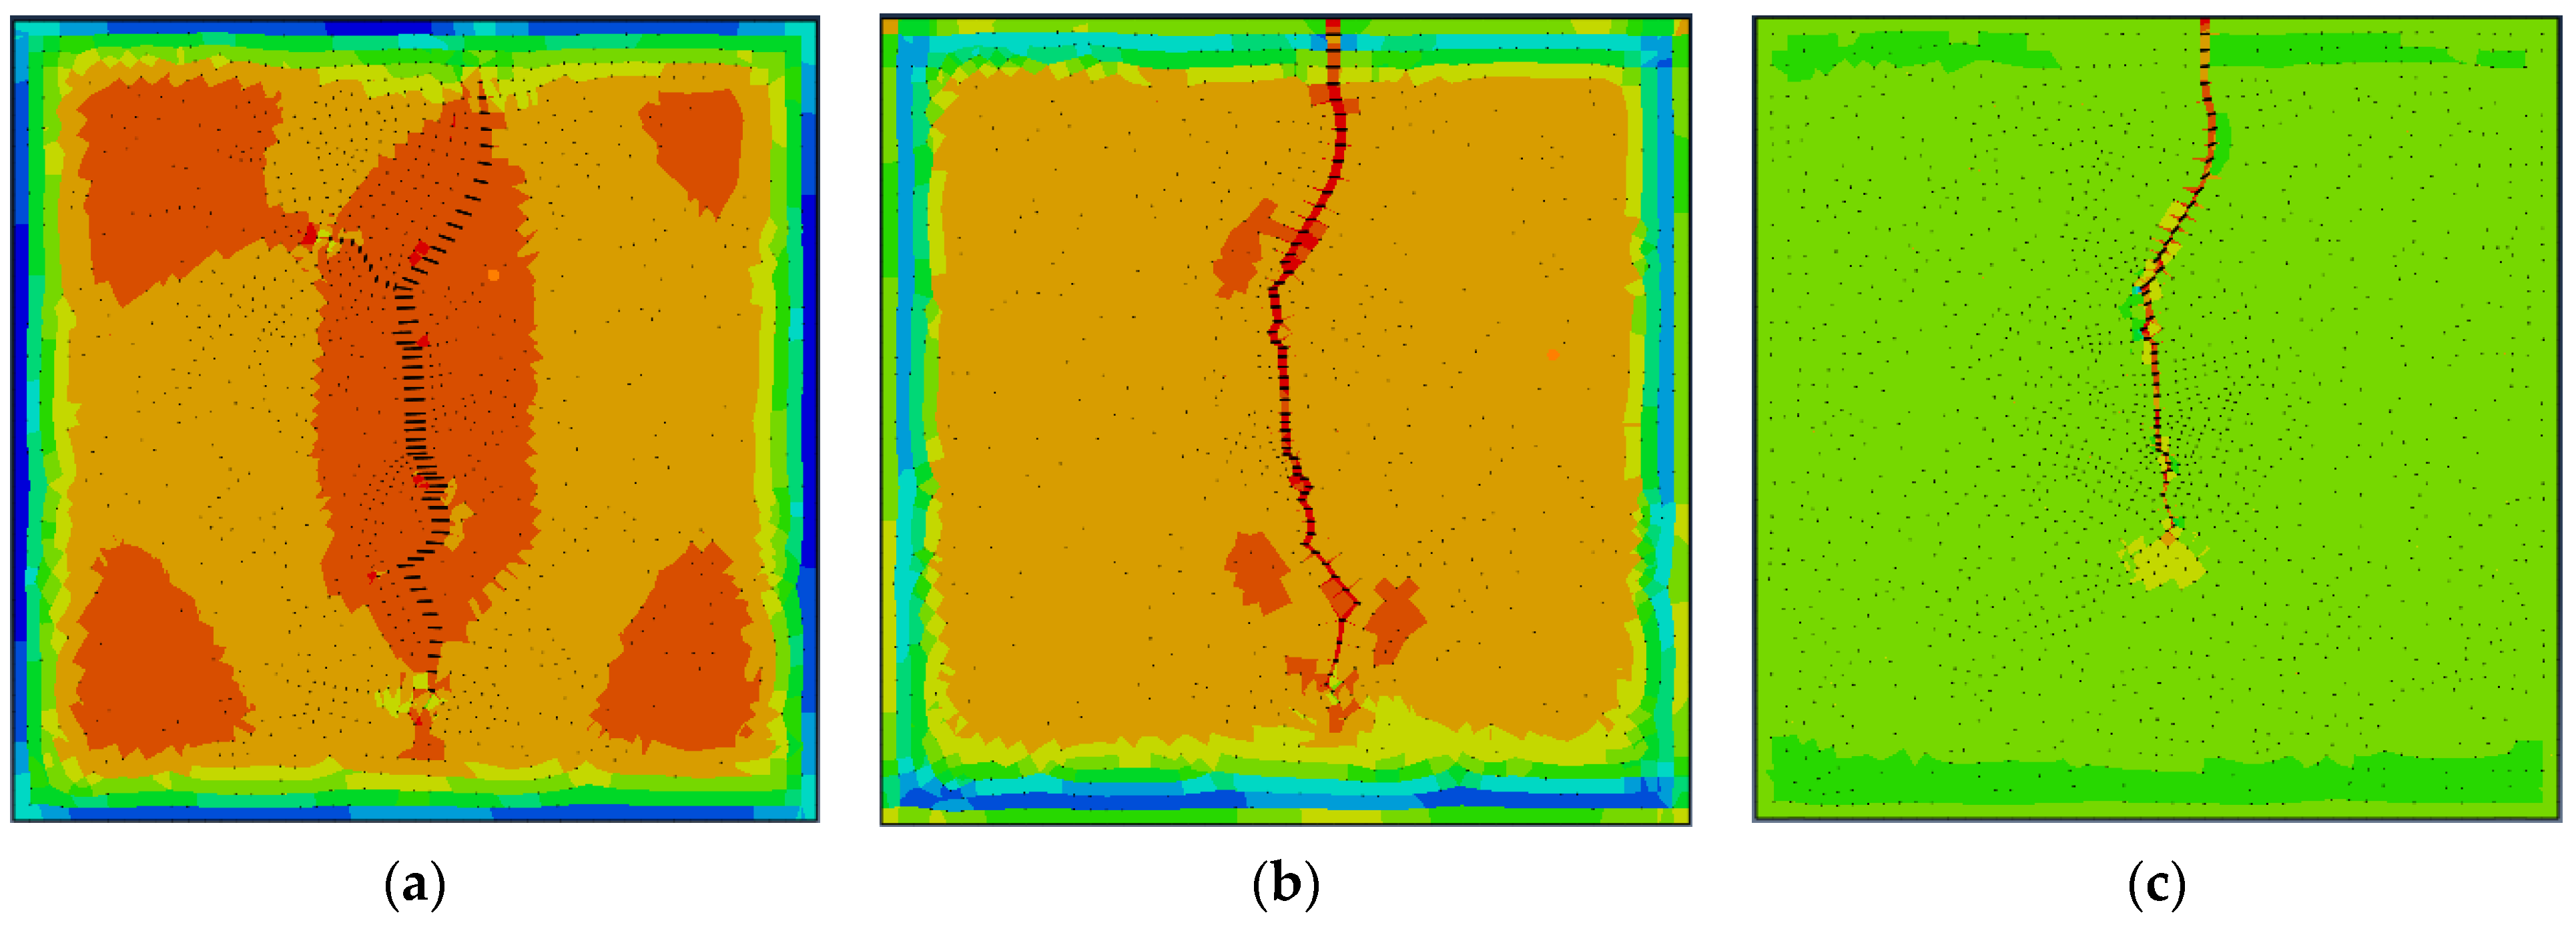
The distribution of principal stresses in reservoir matrices with different geostress differences is shown in Figure 7, Figure 8 and Figure 9. The principal stresses include maximum principal stress (Figure 7), intermediate principal stress (Figure 8), and minimum principal stress (Figure 9). During the process of crack propagation, significant stress concentration occurs at the crack tip, and the range of stress changes gradually increases. The crack tip is a stress concentration area.
The maximum principal stress is shown in Figure 7. Figure 7a shows the maximum principal stress when the stress difference is 0 MPa. The stress concentration at the crack tip is more obvious, the crack shape is more complex, and the pressure around the crack is also higher. There is also stress concentration at the crack tip in Figure 7b, but it is not as obvious as in Figure 7a. The stress concentration at the crack tip is not obvious in Figure 7c.
The middle principal stress diagram is shown in Figure 8. Figure 8a shows the middle principal stress diagram when the stress difference is 0 MPa. The stress concentration at the crack tip is more obvious, and the resulting crack network is more complex, with one branch crack appearing. Figure 8b shows that when the stress difference is 1 MPa, the intermediate principal stress exhibits a stepped shape, with higher stress around the crack and higher stress at the bend of the hydraulic crack. Figure 8c shows that when the stress difference is 5 MPa, stress concentration occurs at the crack tip, and stepped stress appears on both sides of the crack.
The minimum principal stress of the reservoir matrix under different geostress differences is shown in Figure 9. Figure 9a shows the minimum principal stress when the geostress difference is 0 MPa. The stress at the crack tip is quite concentrated, and the stress around the crack is relatively high. Figure 9b shows the minimum principal stress at a stress difference of 1 MPa, with stress concentration at the crack tip and bend. Figure 9c shows the minimum principal stress at a stress difference of 5 MPa, with a relatively simple crack network and stress concentration at the crack tip.
(4)
Distribution of Fracture Openness (PFOPEN) Under Different Ground Stress Differences
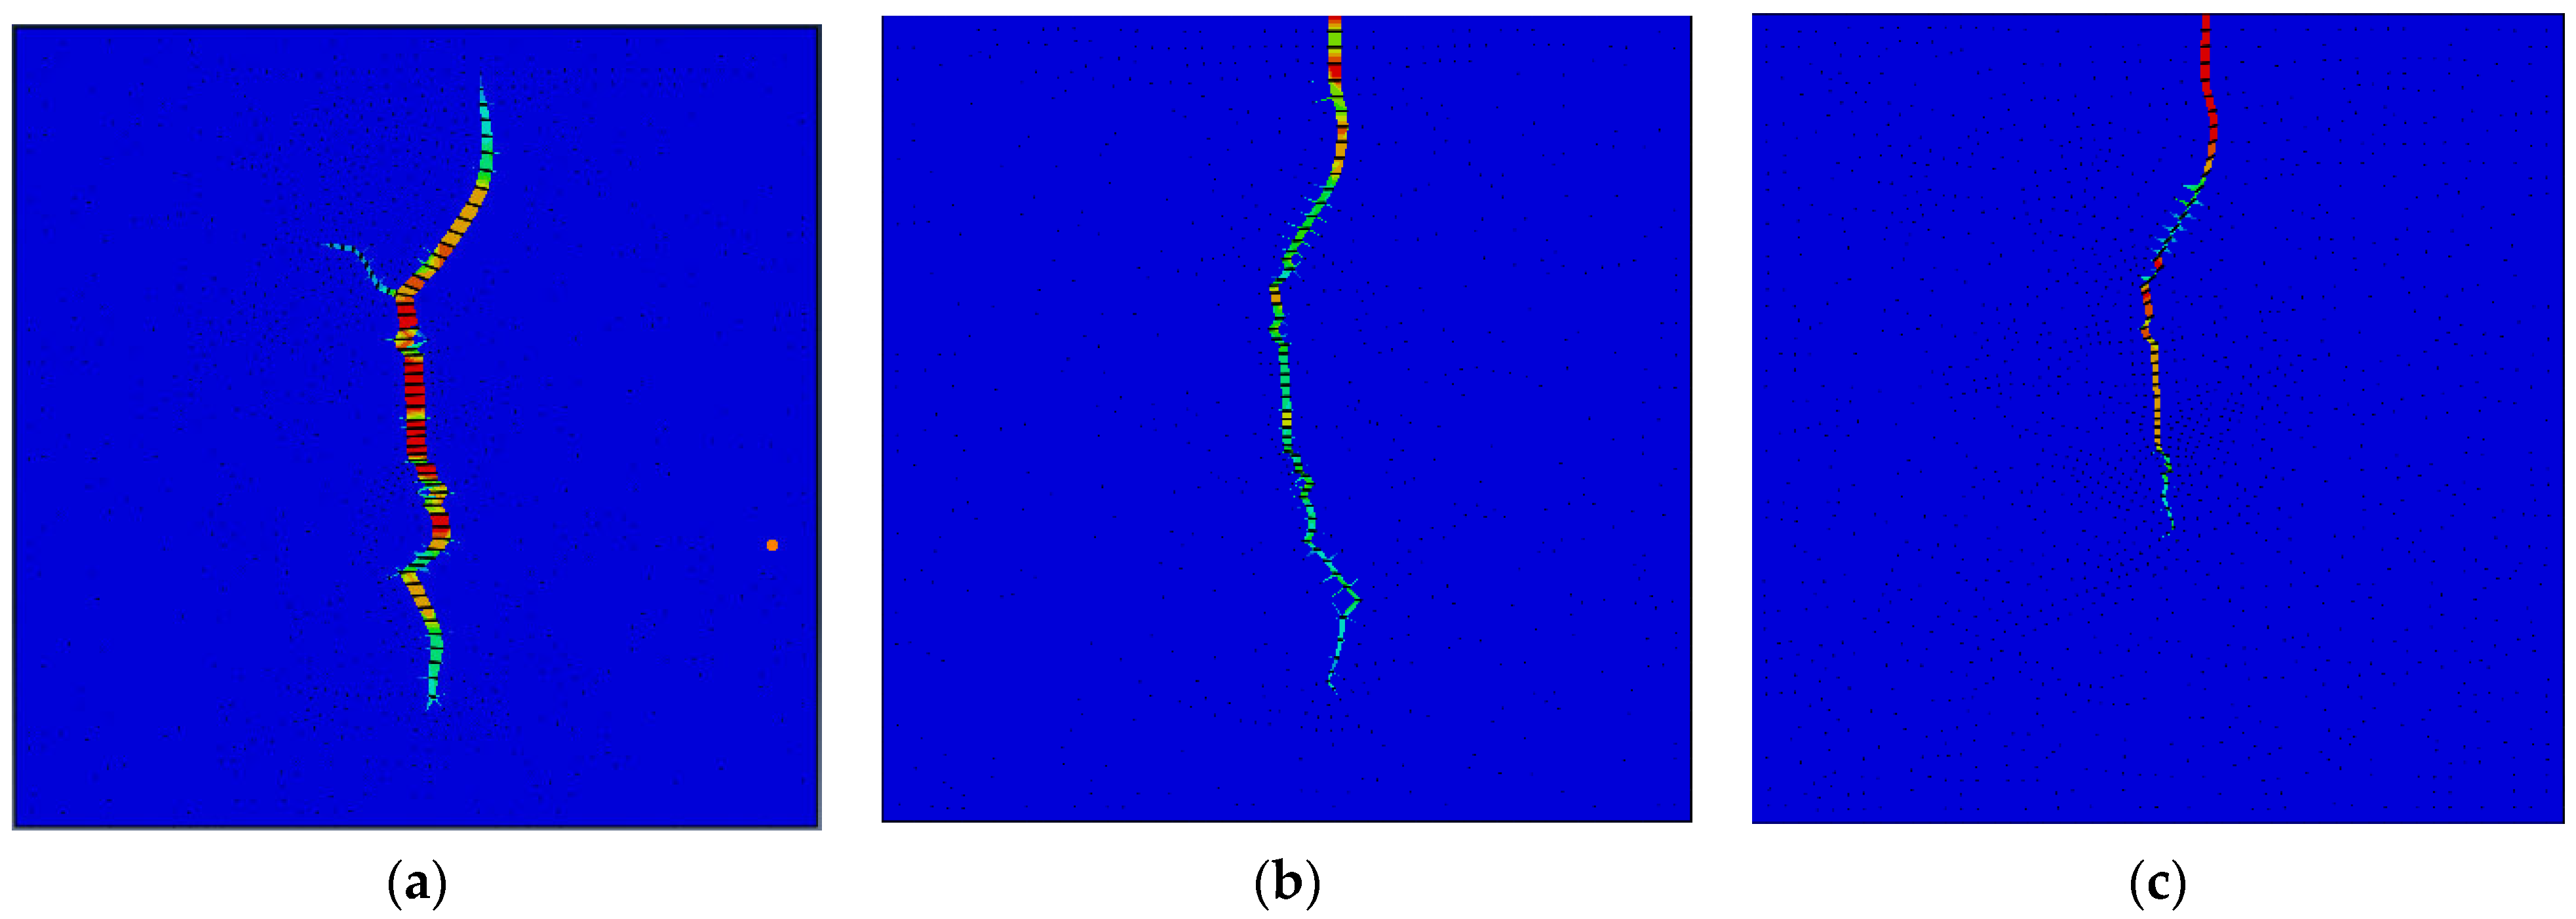
The crack opening diagram under different stress differences is shown in Figure 10. Figure 10a shows the crack opening diagram under a stress difference of 0 MPa, and there is a branch crack in the upper half of the crack. Figure 10b shows the crack opening diagram under a stress of 1 MPa without branching cracks and only one main crack with a longer crack length. Figure 10c shows the crack opening diagram under a stress difference of 5 MPa without branching cracks and with a shorter crack length than Figure 10b.
(5)
Distribution of Pore Pressure (POR) Results Under Different Ground Stress Differences
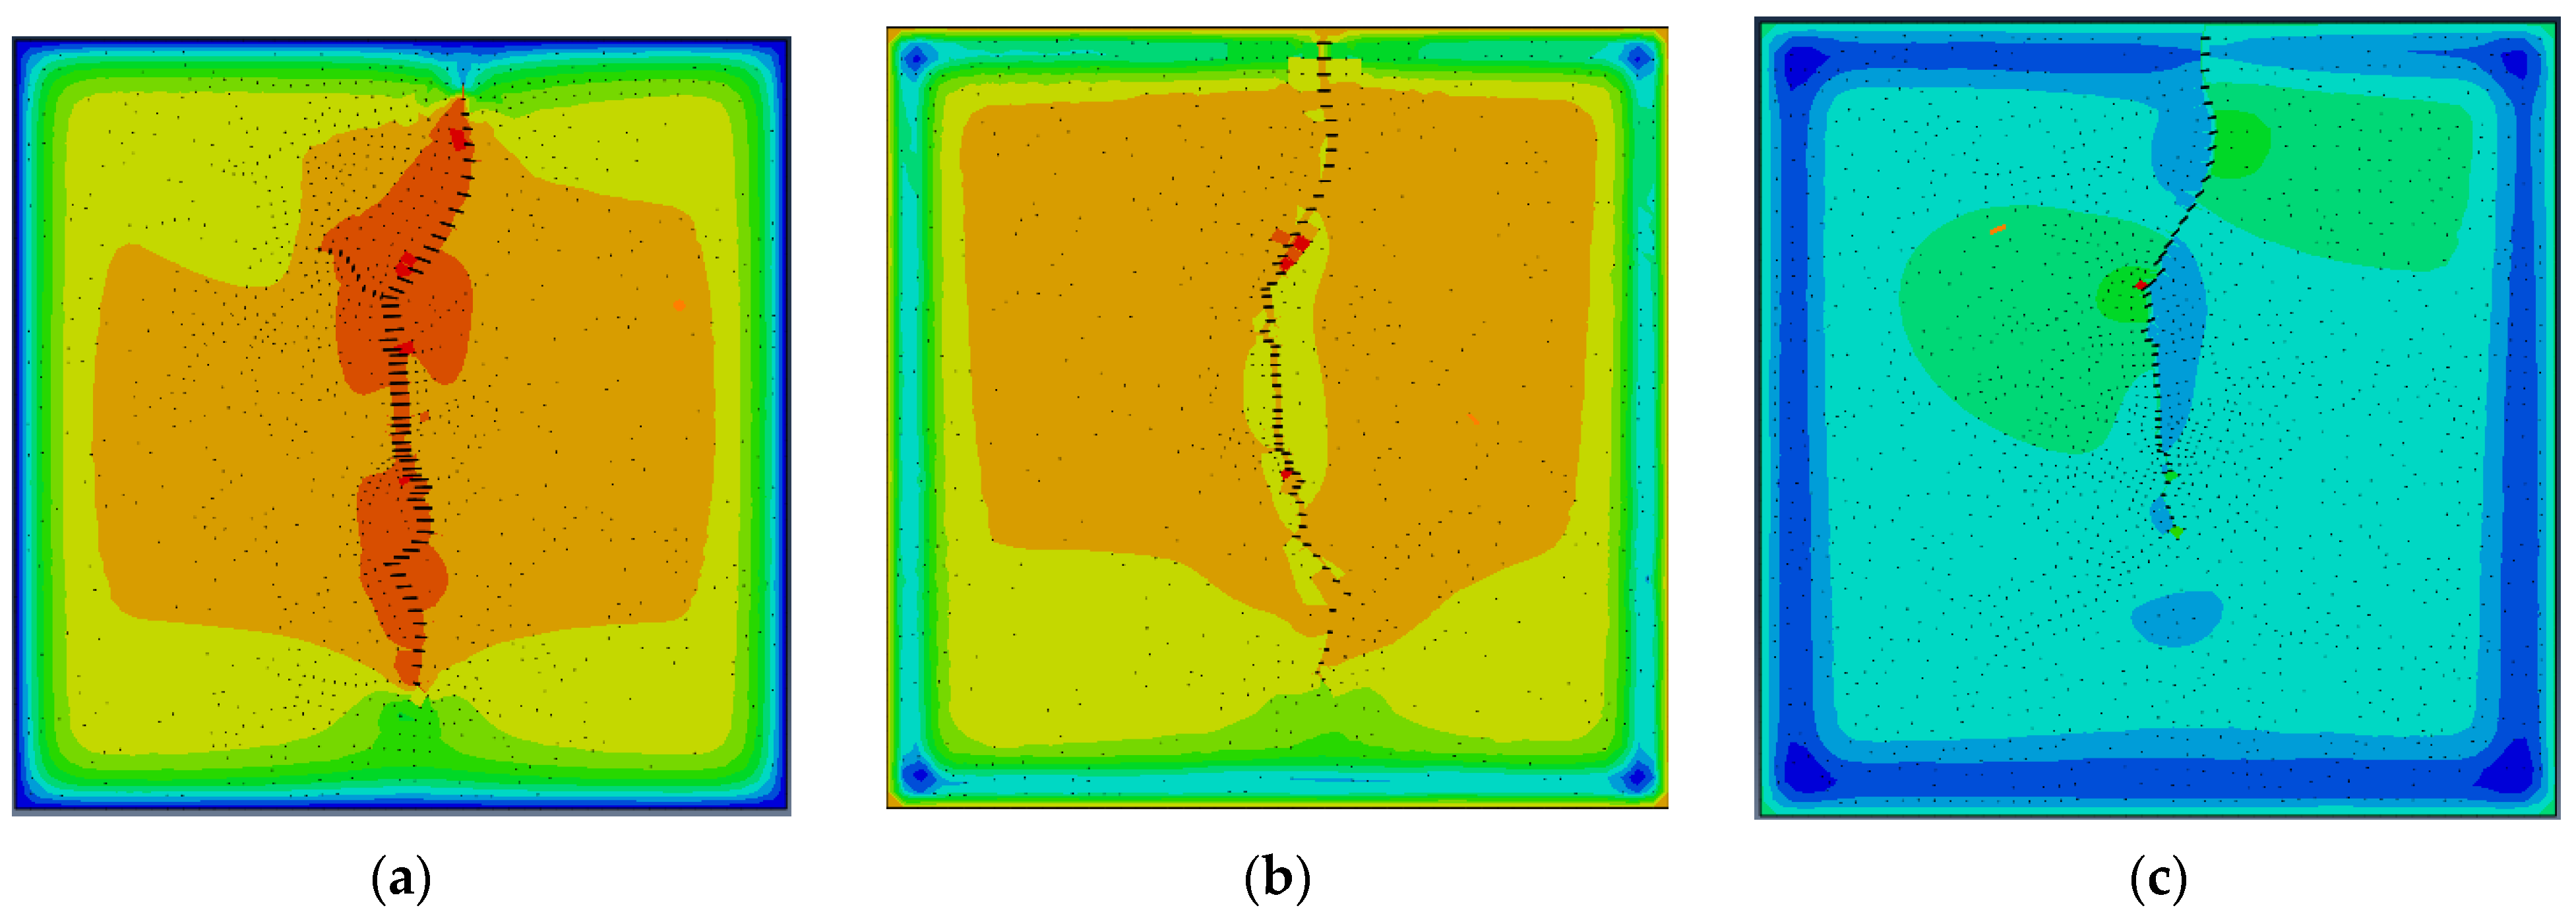
The distribution of pore pressure under different geostress differences is shown in Figure 11. The pore pressure around the fractured fracture gradually increases, and at the same time, the pore pressure value in the matrix also gradually increases. The pore fracturing at the intermediate nodes of cohesive bonding units is higher than the maximum pore pressure of the reservoir matrix. Figure 11a shows the distribution of pore pressure when the stress difference is 0 MPa, and the pore pressure around the crack varies greatly, including fracturing fluid filtration and fracturing fluid promoting crack tip expansion. Figure 11b shows the distribution of pore pressure when the stress difference is 1 MPa. The pore pressure at the crack tip is relatively high, forming a stress concentration area at the crack tip. Figure 11c shows the distribution of pore pressure when the stress difference is 5 MPa. The crack morphology is relatively simple, and the pore pressure around the crack is high.
(6)
Stiffness Reduction Rate (SDEG) Under Different Ground Stress Differences
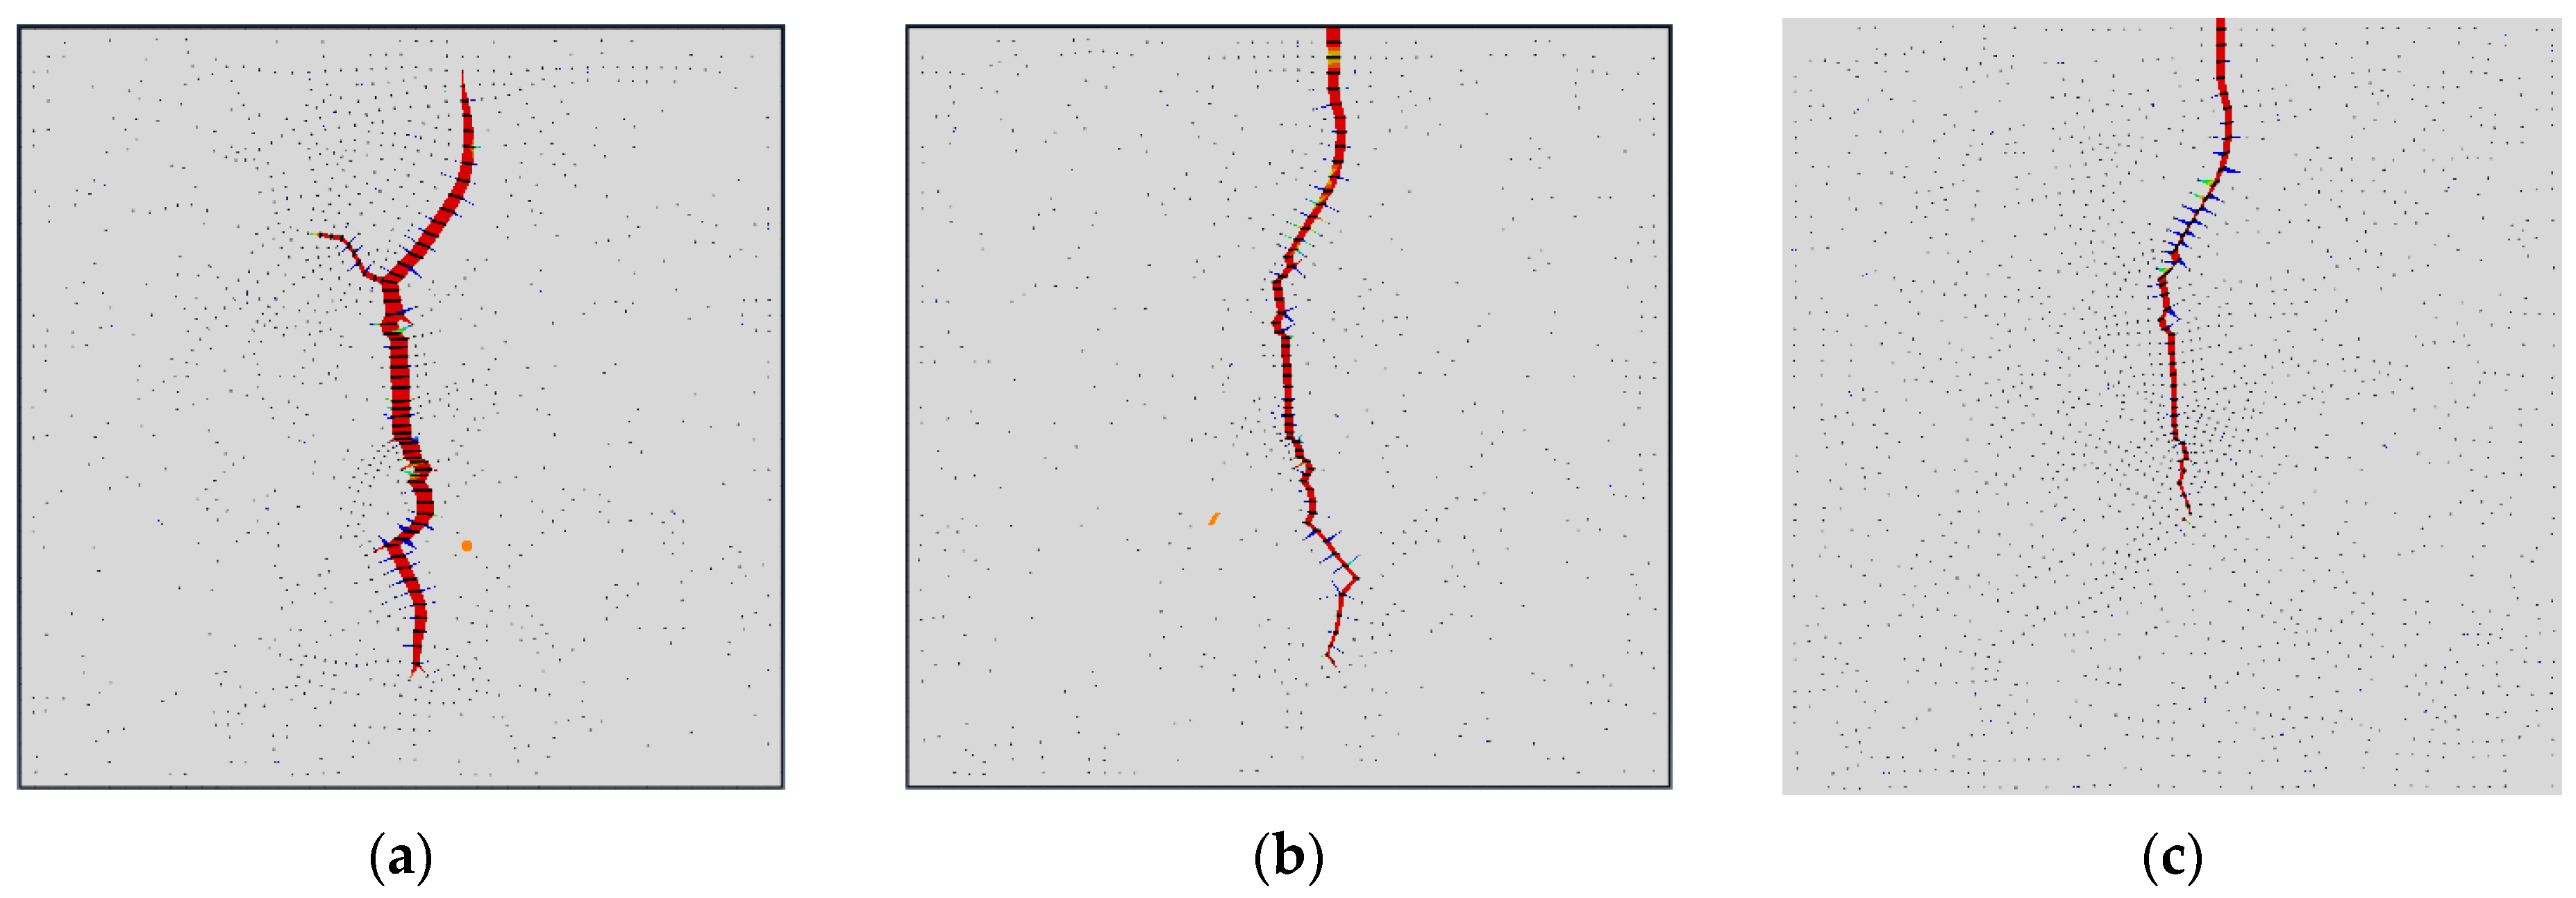
The stiffness reduction rate (SDEG) is a parameter used to describe the stiffness reduction caused by material damage, reflecting the degree to which the effective elastic stiffness of a material decreases relative to its original state due to the accumulation of damage. The stiffness reduction rate of the model is shown in Figure 12. The SDEG parameters of the model represent the failure status of fractures, and the propagation of fractured fractures can be observed based on the failure characteristics. The failure range of the unit is mainly the initial unit set, and as the fluid is continuously injected, the failure area of the crack continues to increase. In the early stage of fracturing fluid injection, the fluid filtration loss on the fracture surface is relatively small, and the expansion speed of fracturing fluid fractures is fast. With the continuous increase in injection time, the area of fracturing fractures continues to increase, the filtration loss of fracturing fluid continues to increase, the fracturing efficiency of the liquid continuously decreases, and the expansion speed of fracturing fractures continues to decrease.

3.3. Quantitative Characterization of Pore Pressure Changes and Crack Width at Injection Points Under Different Geostress Differences

During the injection process of fracturing fluid, some liquid enters the reservoir, and some liquid forms fracturing fractures. The injection of liquid causes changes in the pore pressure of the fracturing fractures and reservoir matrix, and the pore pressure values in different regions have certain differences.
The changes in pore pressure and crack width at the injection point when the stress difference is 0 MPa, 1 MPa, and 5 MPa, respectively, can clearly characterize the changes in the injection point during crack initiation and propagation.
(1)
Quantitative characterization of pore pressure changes and crack width at the injection point when the ground stress difference is 0 MPa
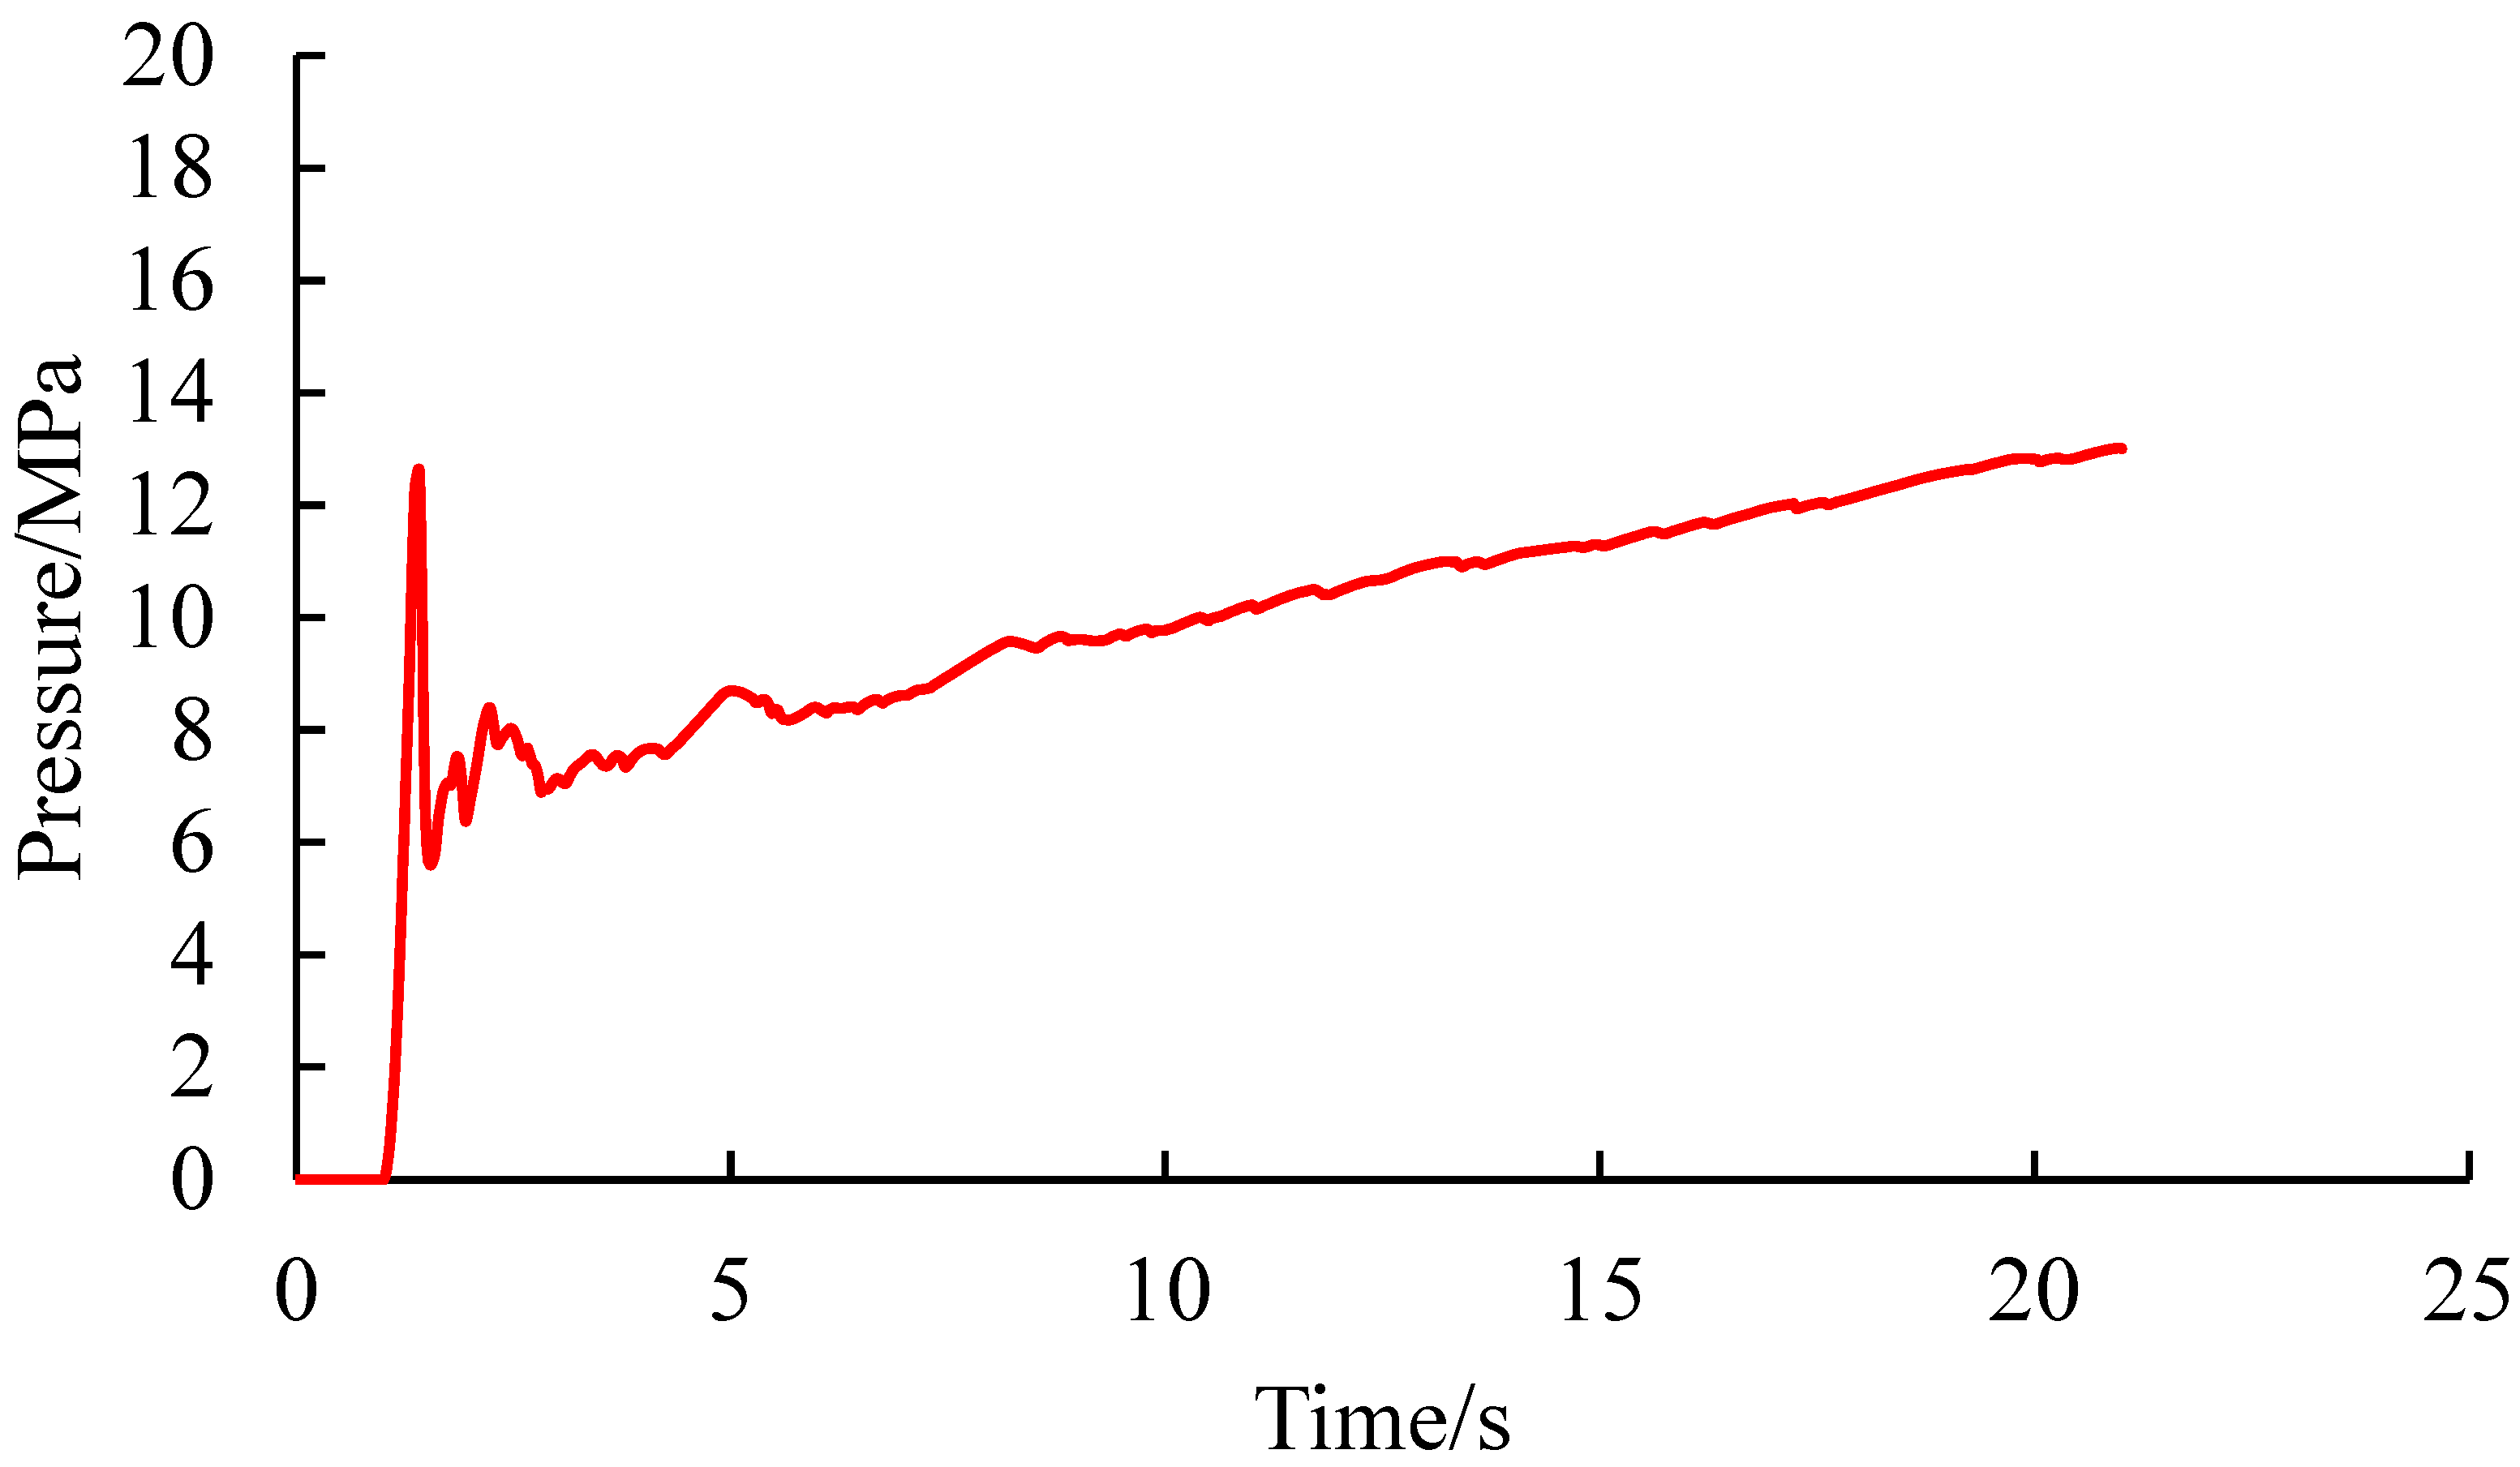
The extraction of pore pressure at the injection point when the ground stress difference is 0 MPa is shown in Figure 13. The injection point pressure rapidly increases at the beginning of injection, and there is a pressure holding process. As the fluid gradually fills the pores of the matrix, the water pressure rapidly increases, and the injection point pressure curve sharply increases. At 1.41 s, it reaches a maximum of 12.625 MPa and fractures. At the time of fracture, the pressure drops sharply, forming a peak. After 1.54 s, as the fracturing fluid continues to be injected, the cracks continue to expand, and wave-like pressure changes occur, indicating the continuous generation of microcracks. At this stage, the injection point pressure fluctuates between 5.60 MPa~13.02 MPa.
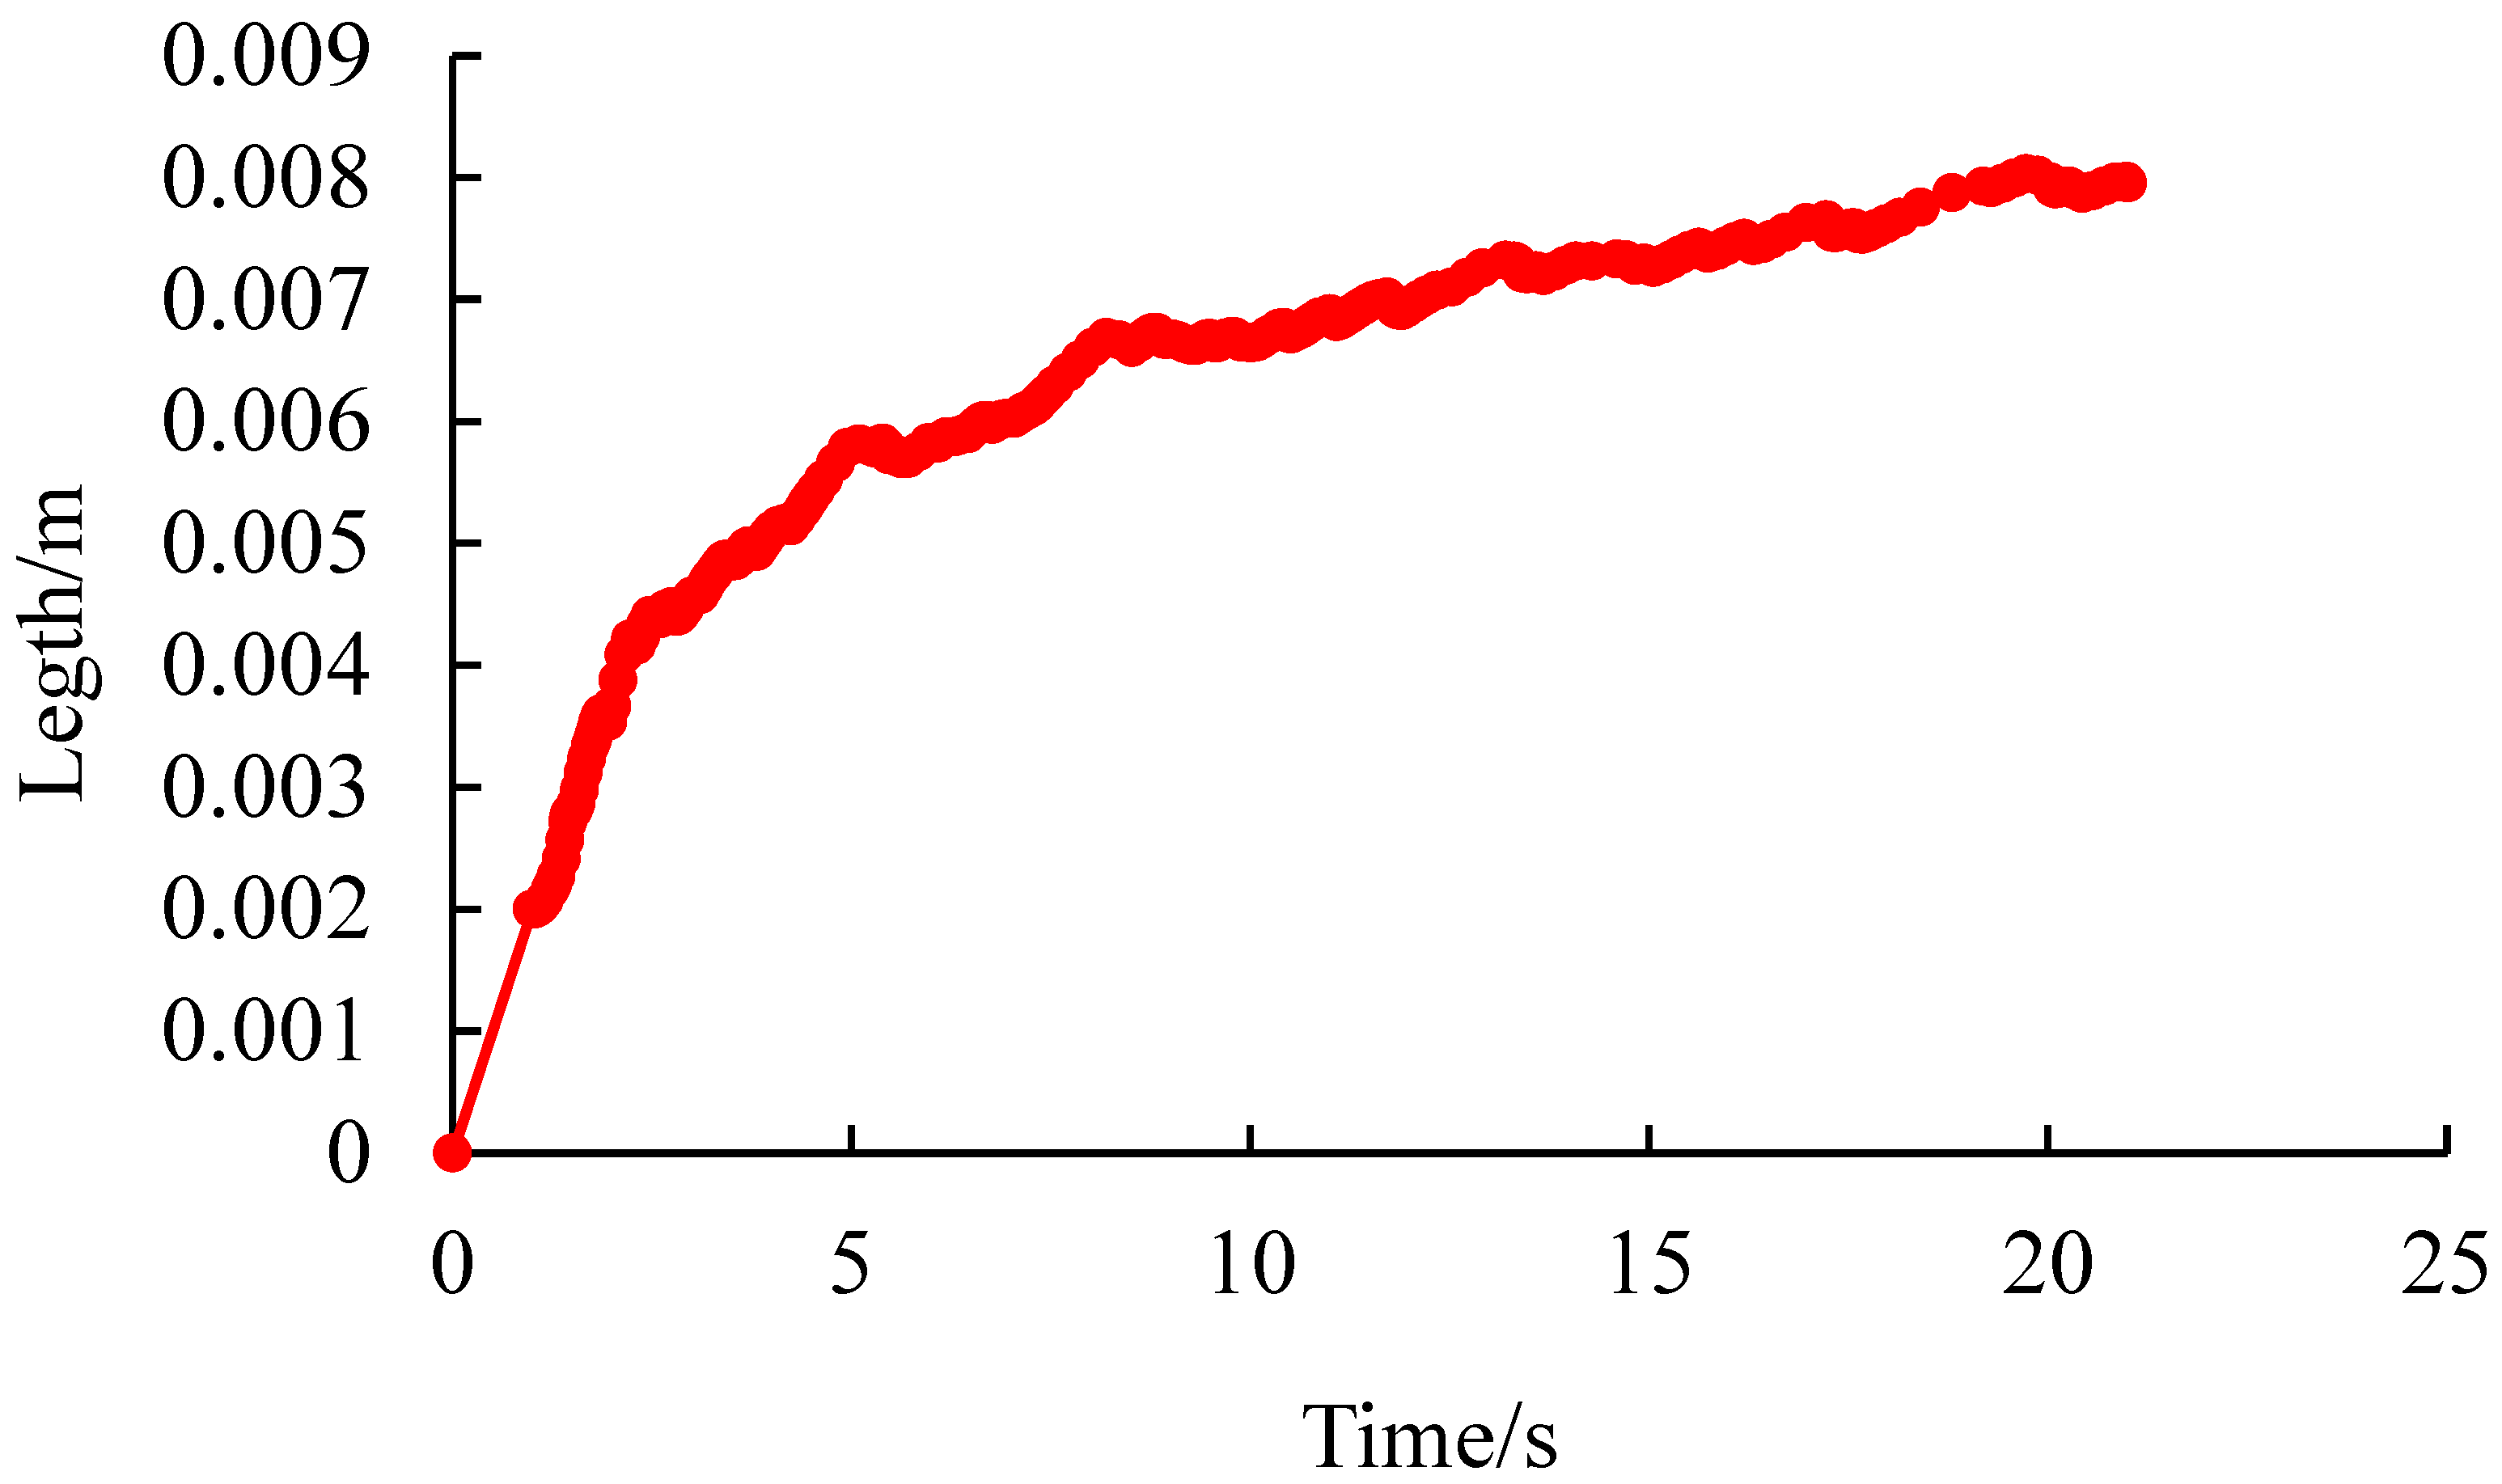
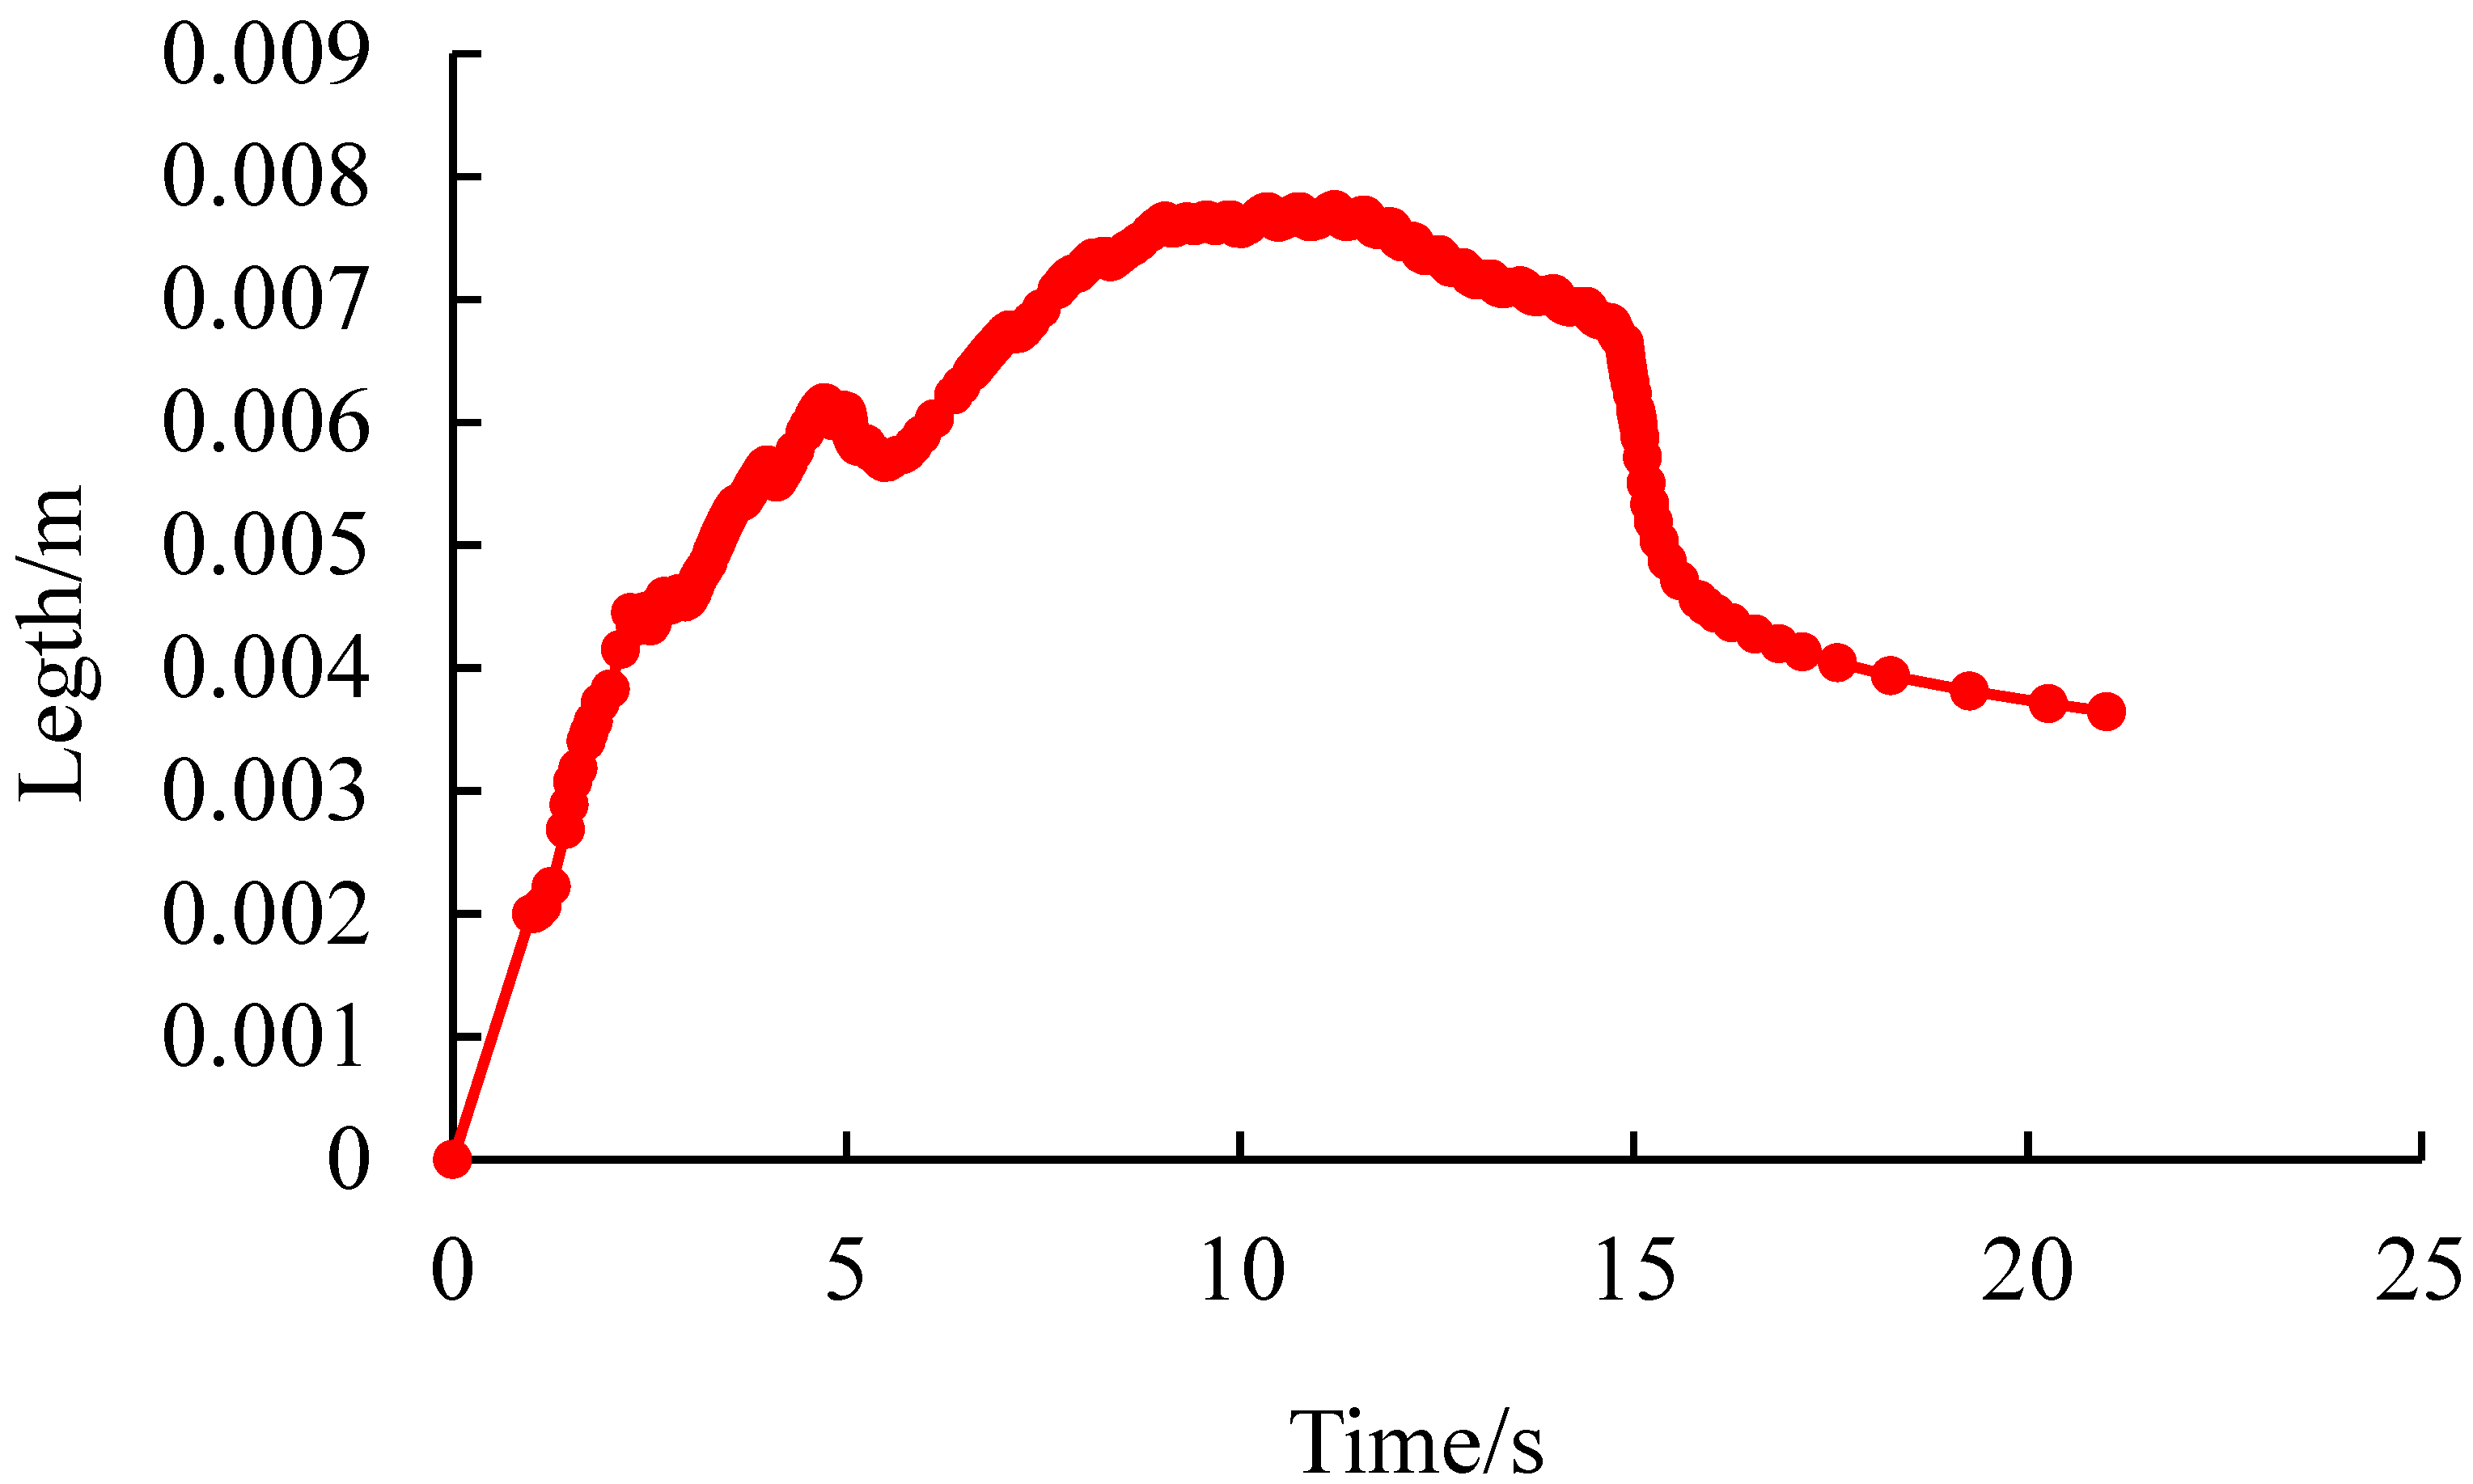
When the stress difference is 0 MPa, the crack opening at the injection point is shown in Figure 14. The initial crack opening at the injection point is 0, and as the fluid is injected into the reservoir and fractures, the overall crack opening tends to increase. When the fracturing process takes 20.98 s, the maximum crack opening is 0.797 cm.
(2)
Quantitative characterization of pore pressure changes and crack width at the injection point when the ground stress difference is 1 MPa
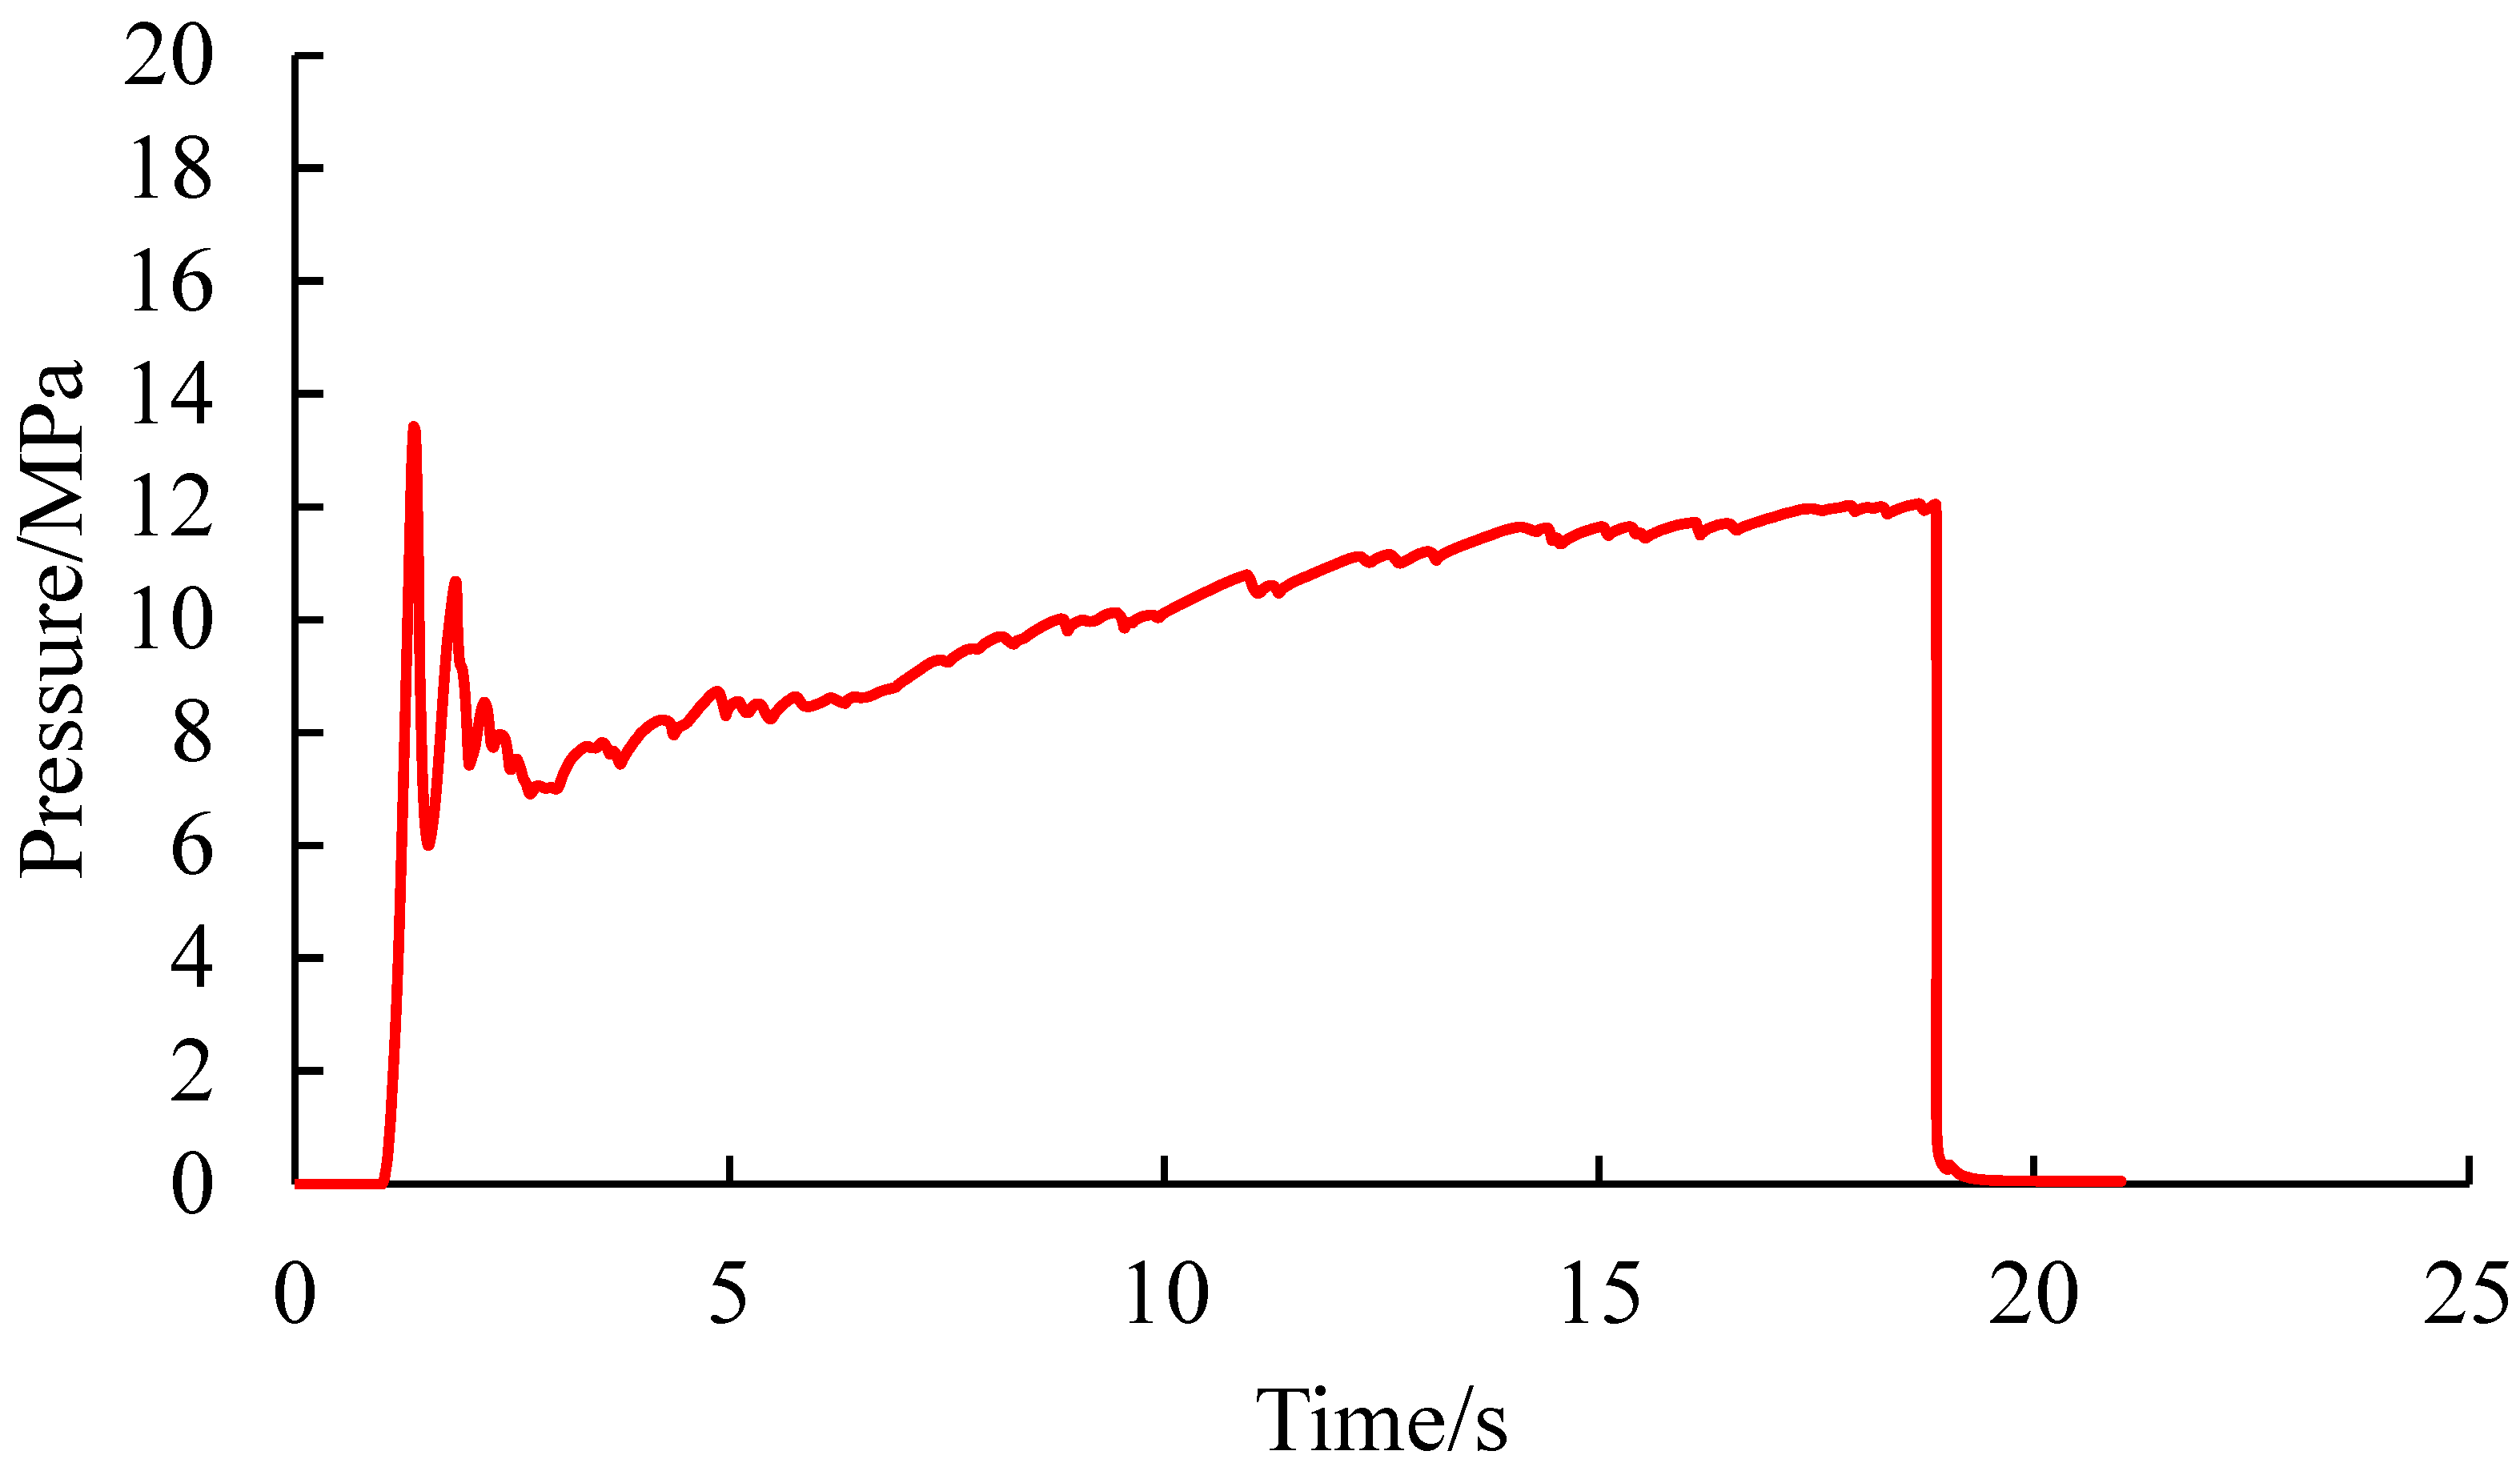
The extraction of pore pressure at the injection point when the ground stress difference is 1 MPa is shown in Figure 15. The injection point pressure rapidly increases at the beginning of injection, and there is a pressure holding process. At 1.36 s, it reaches the highest value of 13.42 MPa and fractures. When the fractures occur, the pressure drops sharply, forming a peak. After 1.53 s, as the fracturing fluid continues to be injected into the crack, a wave-like pressure change occurs, and the injection point pressure fluctuates between 5.99 MPa and 12.03 MPa during this stage. Until 18.87 s, the pressure dropped sharply, and the fracturing fluid flowed through, breaking through the boundary.
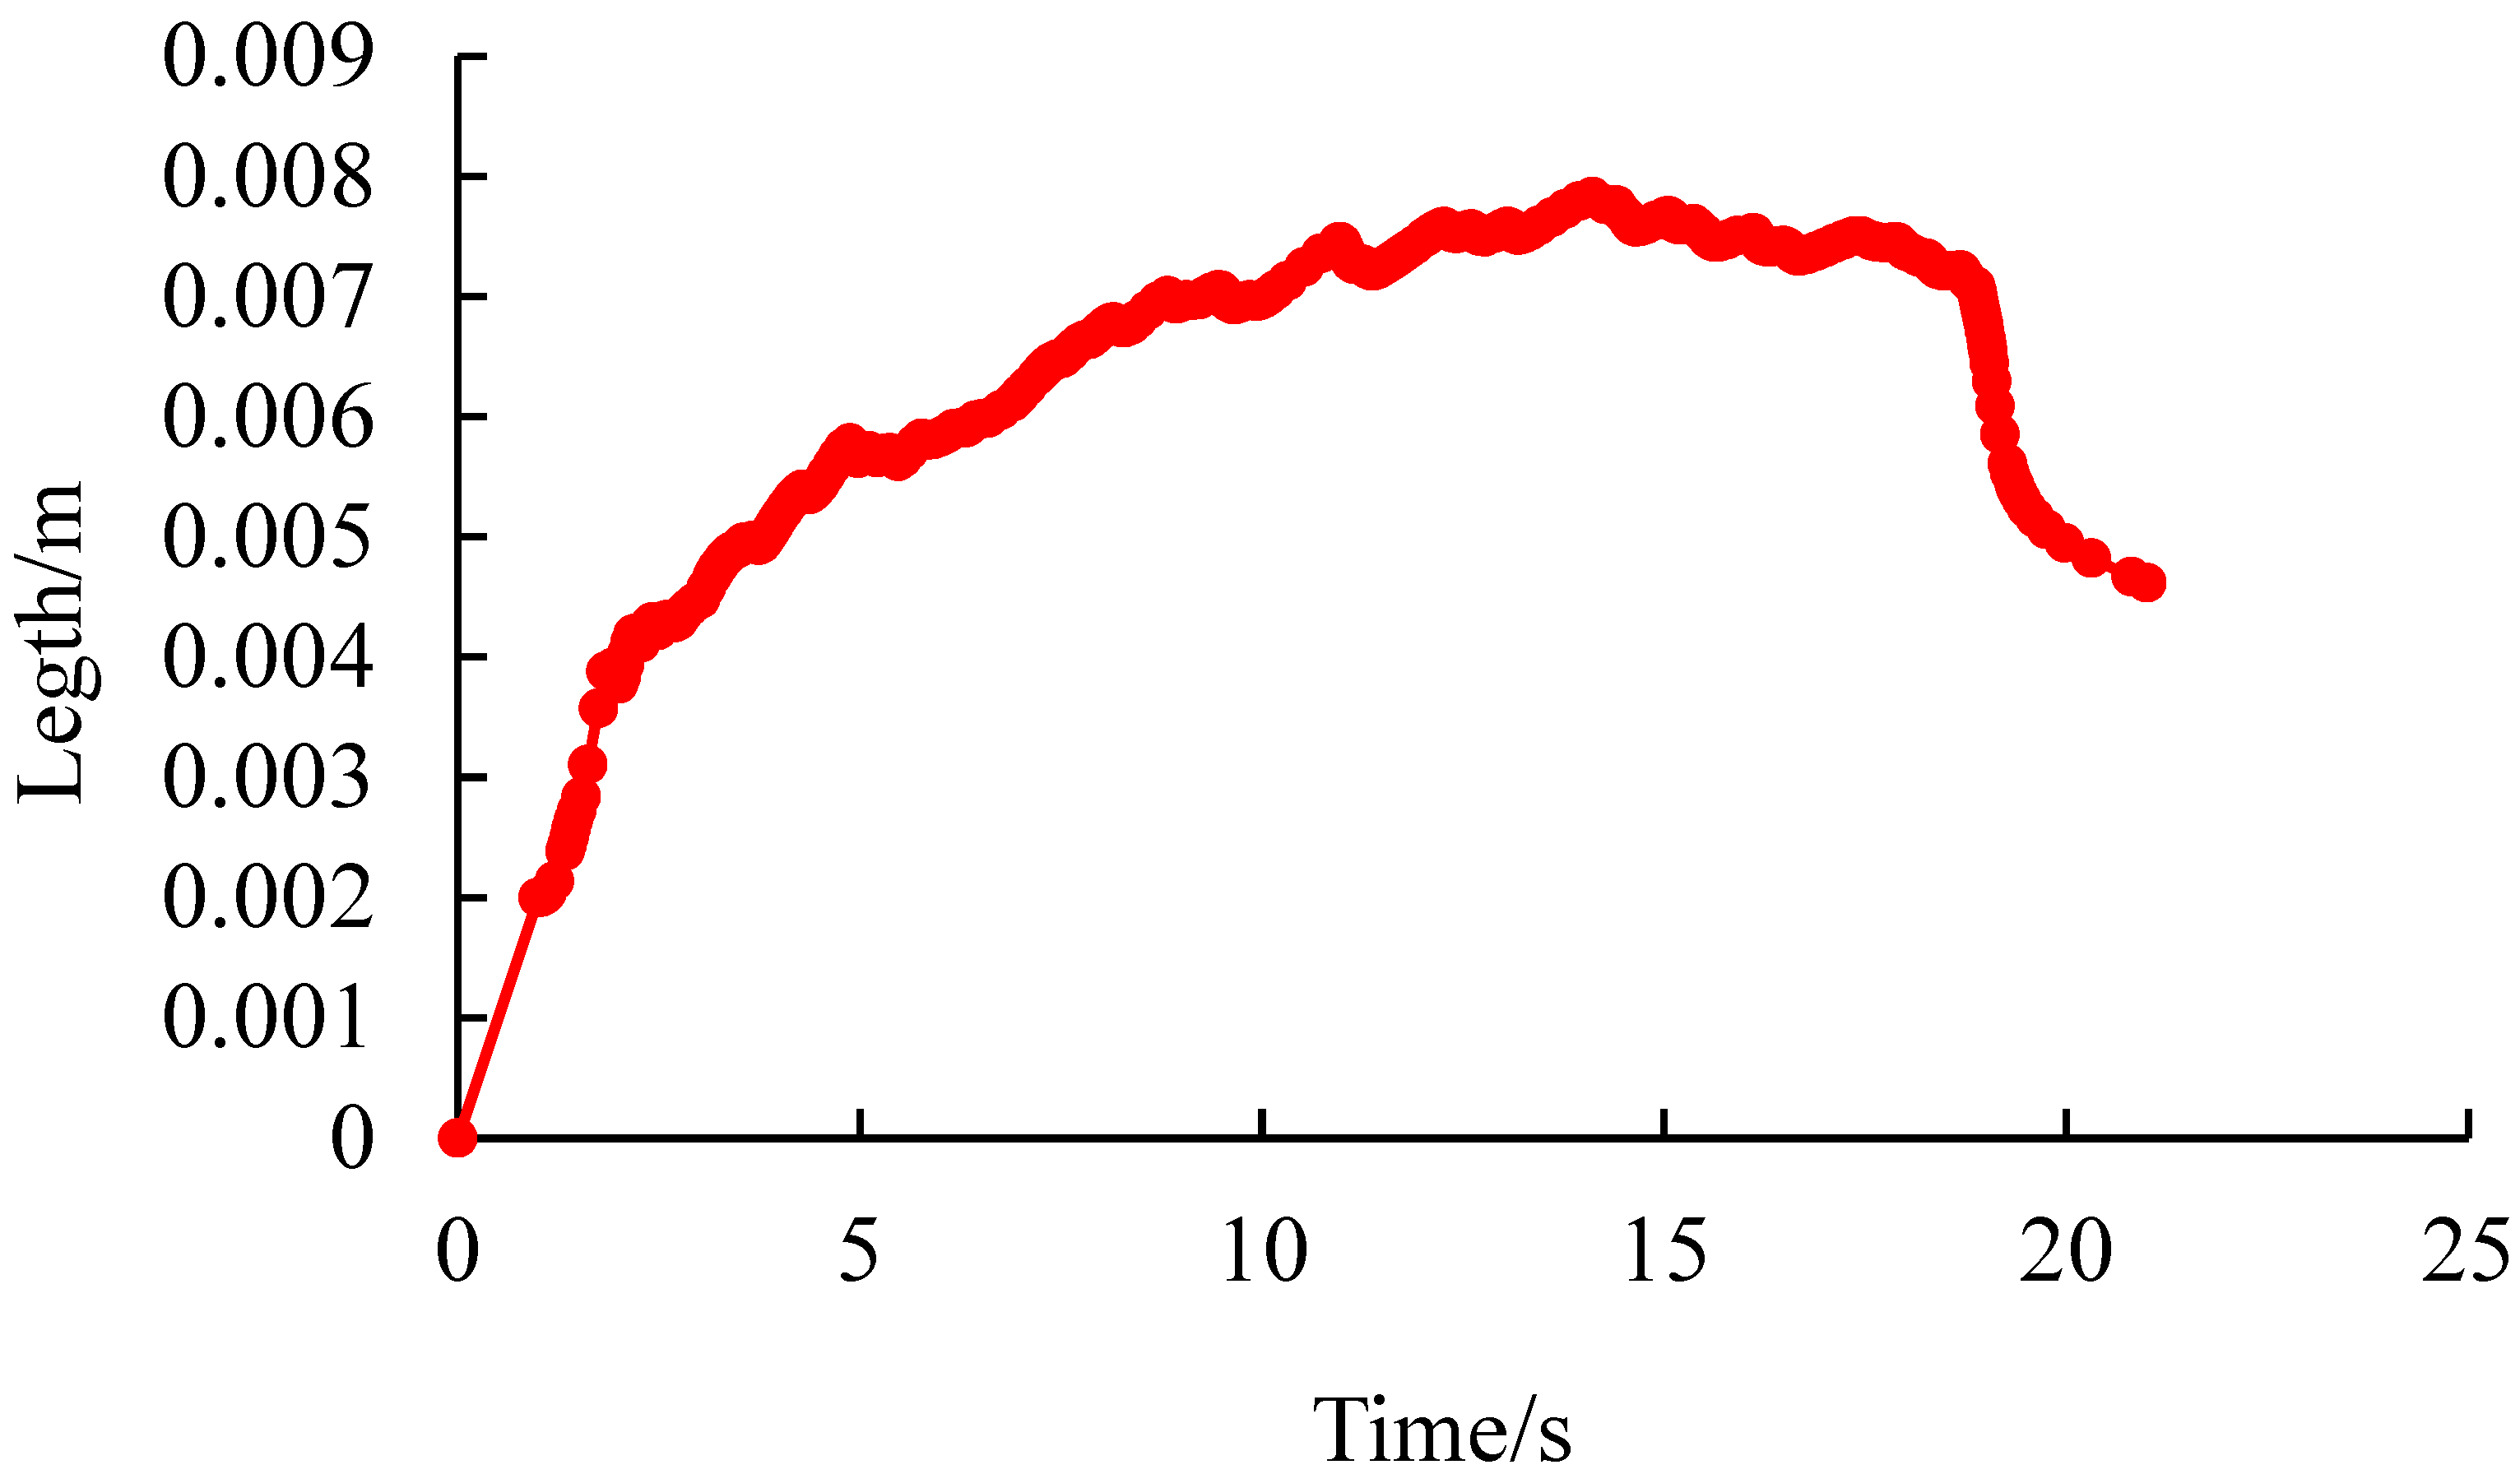
When the ground stress difference is 1 MPa, the crack opening at the injection point is shown in Figure 16. The initial crack opening at the injection point is 0. As the fluid is injected into the reservoir and fractures, the crack opening generally increases first and then decreases. When the fracturing process lasts for 13.93 s, the maximum crack opening is 0.779 cm.
(3)
Quantitative characterization of pore pressure changes and crack width at the injection point when the ground stress difference is 5 MPa
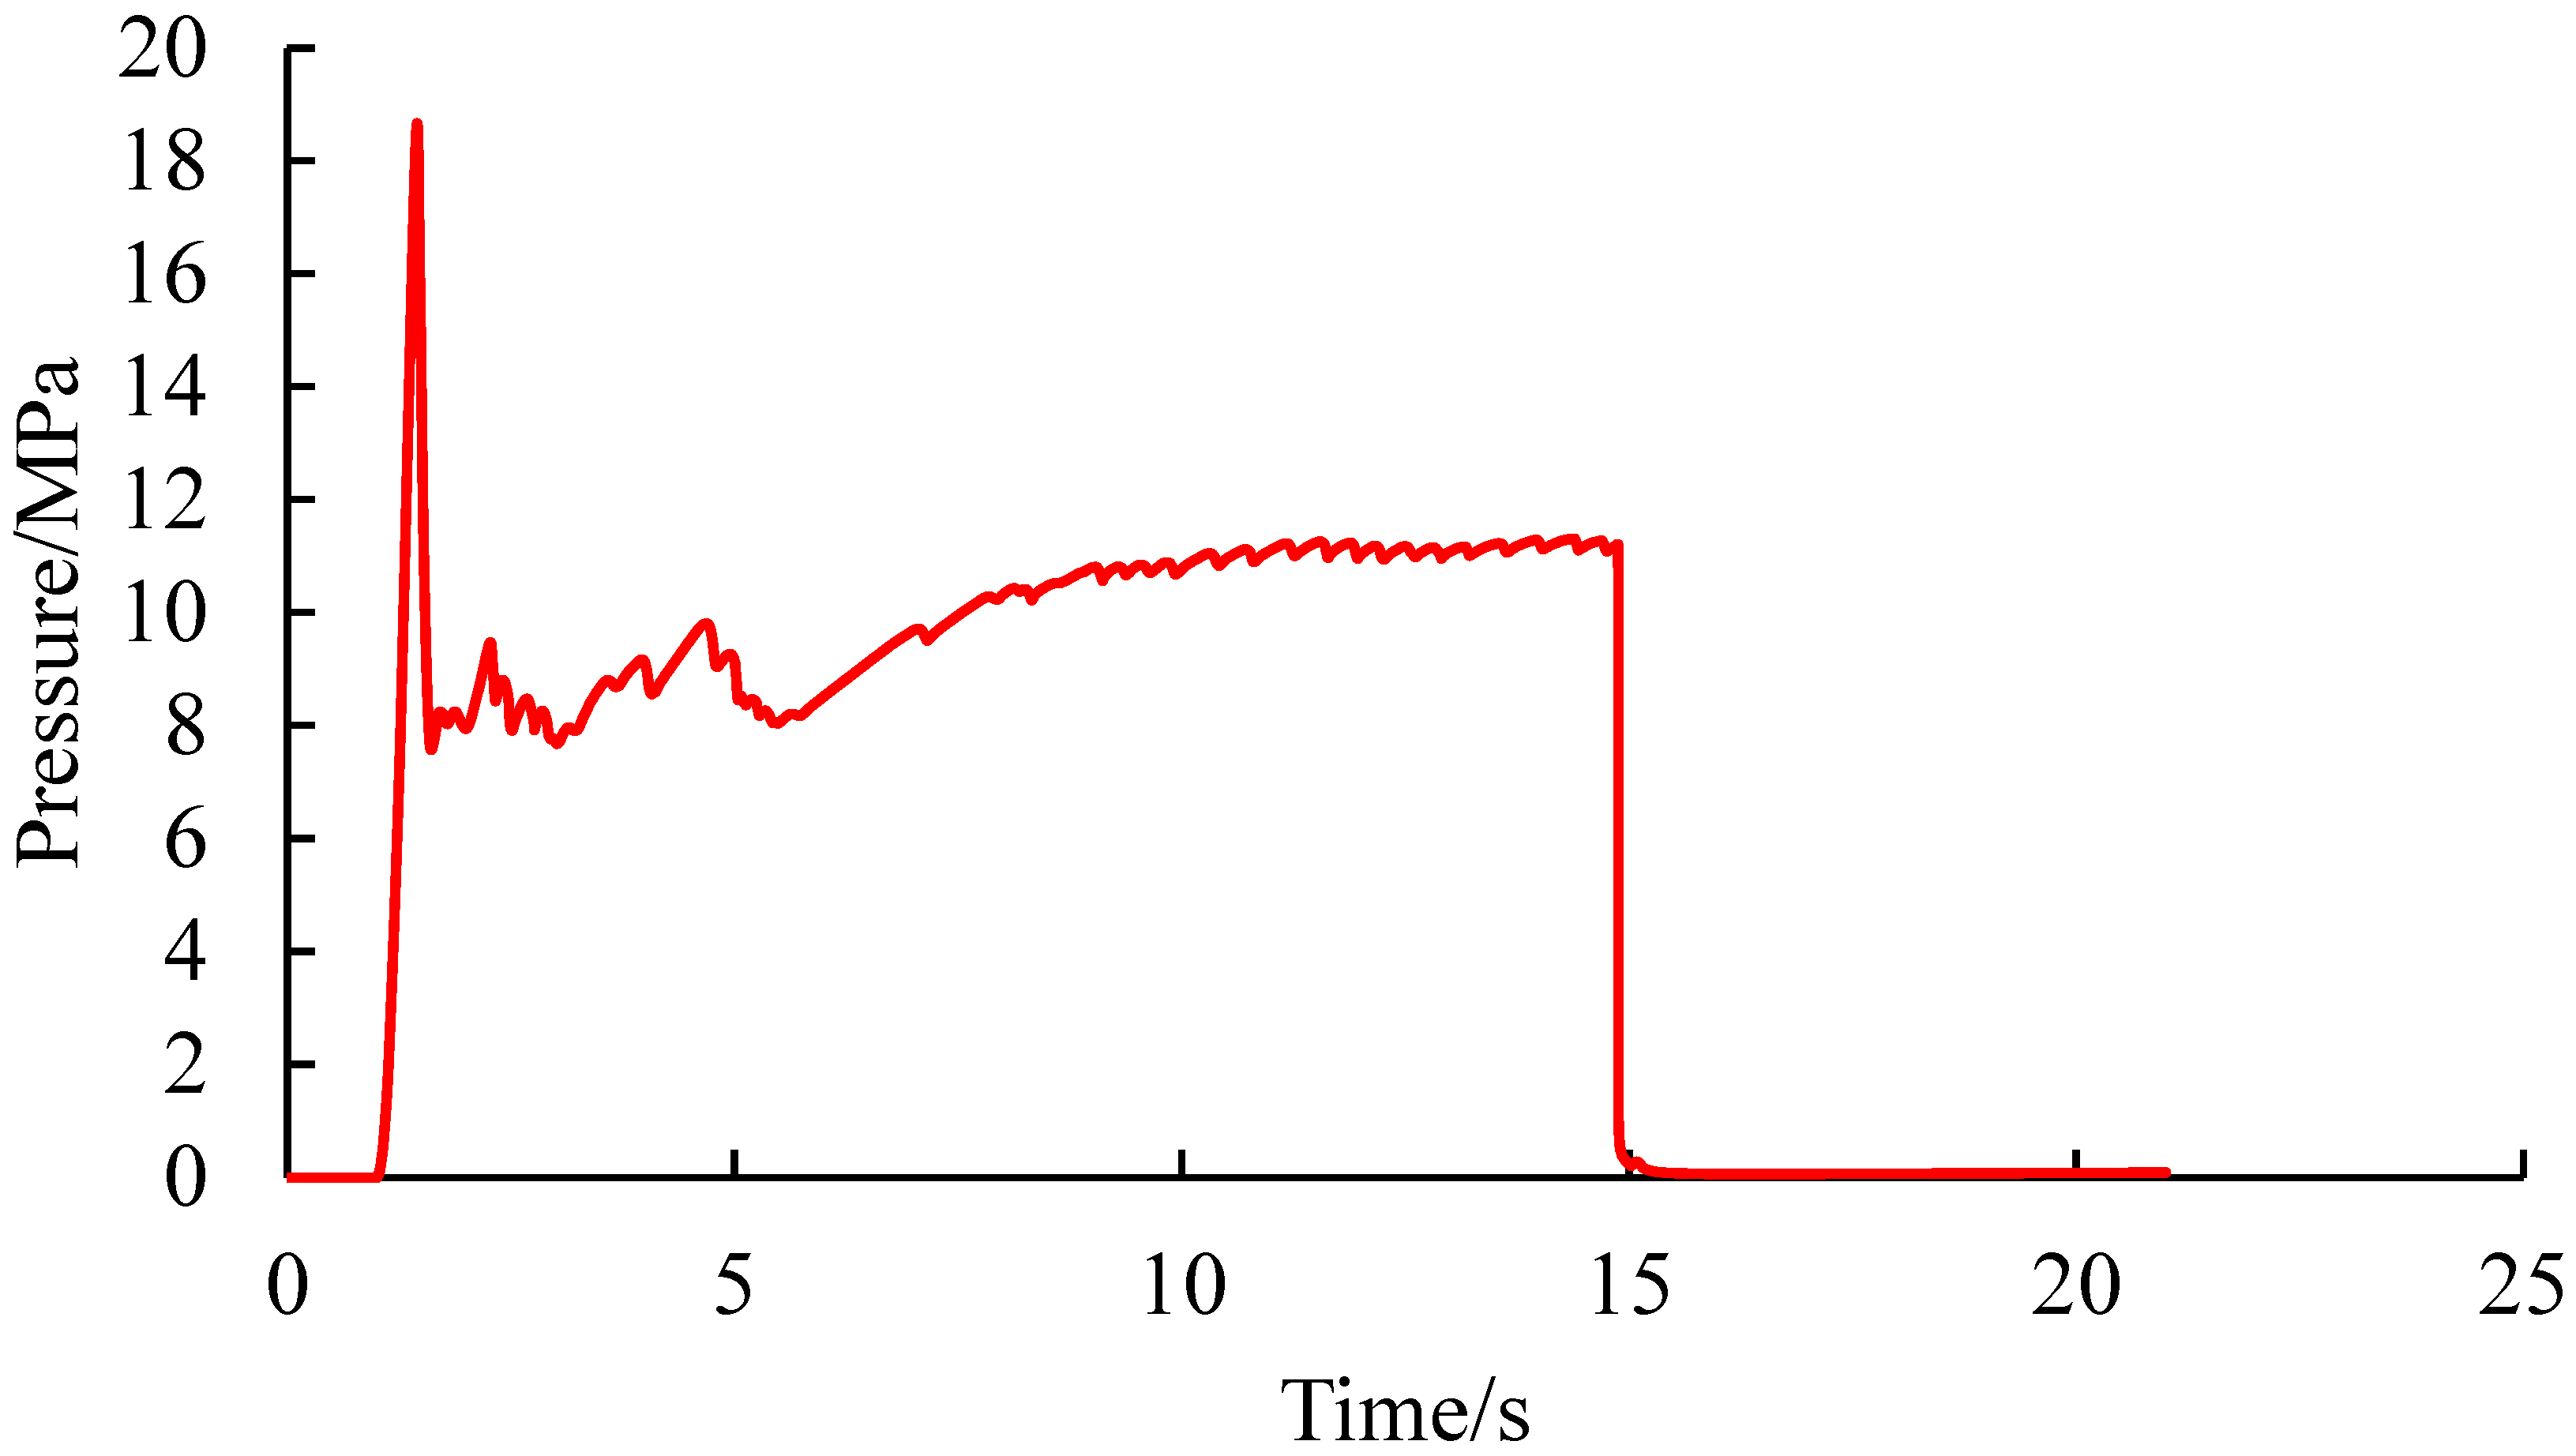
The extraction of pore pressure at the injection point with a stress difference of 5 MPa is shown in Figure 17. The injection point pressure rapidly increases at the beginning of injection and reaches a maximum of 18.33 MPa at 1.435 s, causing rupture. At rupture, the pressure drops sharply, forming a peak. After 1.59 s, as the fracturing fluid continues to be injected, the crack continues to expand, and a wave-like pressure change occurs. At this stage, the injection point pressure fluctuates between 7 MPa~11 MPa. Until 14.879 s, the pressure dropped sharply, and the fracturing fluid flowed through, breaking through the boundary.
When the ground stress difference is 5 MPa, the crack opening at the injection point is shown in Figure 18. The initial crack opening at the injection point is 0. As the fluid is injected into the reservoir and fractures, the crack opening generally increases first and then decreases. When the fracturing process lasts for 11.1 s, the maximum crack opening is 0.771 cm.

4. Conclusions

This article uses the finite element method and cohesive bonding element simulation method to study the formation law of the fracture network in fractured formations. It investigates how the difference in geostress and natural fractures affect the fracture morphology in shale reservoirs and links the anisotropy of geostress with the complexity of fractures. The following understanding is obtained:
(1)
During the fracturing process, as the fracturing fluid is continuously injected, the fracturing fractures continue to open and expand forward, generating double-wing cracks. At the same time, the fluid on the fracture wall leaks into the reservoir matrix, causing changes in pore pressure, displacement, and stress of the reservoir matrix, which in turn affects the size of the fracturing fractures. The existence of natural fractures has a significant impact on the direction of hydraulic fractures. The tip of hydraulic fractures will deflect towards natural fractures.
(2)
The difference in geostress has a significant impact on the complexity of cracks. The smaller the difference in geostress, the more complex the cracks, and the more branching cracks there are. When the stress difference in this model is 0 MPa, multiple branching cracks are generated. The larger the difference in geostress, the more likely it is to form a double-wing crack perpendicular to the minimum principal stress, with a simpler crack morphology.
(3)
When the geostress difference is 0 MPa, 1 MPa, and 5 MPa, the pore pressure at the injection point generally increases rapidly first and then decreases slightly, followed by a wave-like change. When the injection point pressure starts to increase rapidly, there is a pressure holding process. As the fluid gradually fills the pores, the water pressure rises rapidly, and the injection point pressure curve suddenly increases to the highest point, causing rupture. When rupture occurs, the pressure drops sharply, forming a peak. Subsequently, as the fracturing fluid continues to be injected, the cracks continue to expand, and wave-like pressure changes occur, indicating the continuous generation of microcracks. The crack width at the injection point shows an overall trend of increasing first and then decreasing. When the stress difference is 0 MPa, 1 MPa, and 5 MPa, the peak rupture pressures are 12.63 MPa, 13.42 MPa, and 18.33 MPa, respectively; the maximum crack opening degrees are 0.797 cm, 0.779 cm, and 0.771 cm, respectively. By simulating and analyzing the crack initiation and propagation laws under different stress differences, the optimal renovation plan and construction displacement can be determined. It has certain guiding significance for the design of hydraulic fracturing in mining sites.

Author Contributions

J.Z. and J.C. conceived and designed the experiments; J.X., H.W., and W.S. performed the numerical simulation analysis; J.Z. wrote the paper; Z.S. and J.L. revised the paper. All authors have read and agreed to the published version of the manuscript.

Funding

The authors would like to thank The National Natural Science Foundation of China project “Research on the evolution mechanism and effectiveness evaluation of dense cutting volume fracturing network in terrestrial shale oil reservoirs” (No. 52274040) and Graduate Innovation Fund of Xi’an Shiyou University “Research on the initiation and propagation laws of volume fracturing fractures in shale oil reservoirs in the Ordos Basin” (Program No. YCX2513076).

Data Availability Statement

The original contributions presented in this study are included in the article. Further inquiries can be directed to the corresponding authors.

Acknowledgments

The authors gratefully thank the anonymous reviewers and editors for their critical comments and valuable suggestions, which were very helpful to improve the manuscript.

Conflicts of Interest

Author Zhen Sun was employed by the No. 6 Gas Production Plant, Changqing Oilfield Company, PetroChina Company Limited. Author Junjie Lei was employed by the Exploration and Development Technology Research Center of Yanchang Oilfield Co., Ltd. The remaining authors declare that the research was conducted in the absence of any commercial or financial relationships that could be construed as a potential conflict of interest.

References

  1. Liu, X.; Lei, W.; Huang, J. The Investigation on Initiation and Propagation of Hydraulic Fractures in Shale Reservoir. Geofluids 2021, 2021, 2366709. [Google Scholar] [CrossRef]
  2. Benouadah, N.; Djabelkhir, N.; Song, X.; Rasouli, V.; Damjanac, B. Simulation of Competition Between Transverse Notches Versus Axial Fractures in Open Hole Completion Hydraulic Fracturing. Rock Mech. Rock Eng. 2021, 54, 2249–2265. [Google Scholar] [CrossRef]
  3. Suo, Y.; Chen, Z.; Rahman, S.S.; Yan, H. Numerical simulation of mixed-mode hydraulic fracture propagation and interaction with different types of natural fractures in shale gas reservoirs. Environ. Earth Sci. 2020, 79, 279. [Google Scholar] [CrossRef]
  4. Xu, W.; Zhao, S.; Zhang, W.; Zhao, X. Numerical Simulation of Crack Propagation and Branching Behaviors in Heterogeneous Rock-like Materials. Buildings 2024, 14, 158. [Google Scholar] [CrossRef]
  5. Zhang, L.; Jin, Y.; Dong, Z.; Yuan, R. A Numerical Study of Hydraulic Fracture Propagation Geometry in a Layered Shale Reservoir. Geofluids 2022, 2022, 6966791. [Google Scholar] [CrossRef]
  6. Bi, J.; Zhou, X.P.; Qian, Q.H. The 3D Numerical Simulation for the Propagation Process of Multiple Pre-existing Flaws in Rock-Like Materials Subjected to Biaxial Compressive Loads. Rock Mech. Rock Eng. 2016, 49, 1611–1627. [Google Scholar] [CrossRef]
  7. Shen, Z. Study on the Initiation and Propagation of Hydraulic Fracturing Fractures and Nonlinear Seepage Laws in Shale Under the Influence of Bedding. Ph.D. Thesis, Chongqing University, Chongqing, China, 2021. [Google Scholar]
  8. Zhang, Y. Study on the Mechanism of Hydraulic Fracture Initiation, Propagation, and Intersection Network Formation in Shale Driven by Non-Uniform Pressure Fluid. Ph.D. Thesis, Chongqing University, Chongqing, China, 2022. [Google Scholar]
  9. Cheng, T. Study on the Initiation and Propagation Mechanism of Perforation Fracturing Near the Wellbore in Horizontal Wells with Thin and Poor Shale Layers. Master’s Thesis, Northeast Petroleum University, Daqing, China, 2024. [Google Scholar]
  10. Liu, J. Study on the Mechanism of Crack Initiation and Propagation in Hydraulic Fracturing of Shale with Defects. Ph.D. Thesis, Liaoning Technical University, Fuxin, China, 2019. [Google Scholar]
  11. Suo, Y.; Chen, Z.; Rahman, S.S.; Song, H. Experimental and Numerical Investigation of the Effect of Bedding Layer Orientation on Fracture Toughness of Shale Rocks. Rock Mech. Rock Eng. 2020, 53, 3625–3635. [Google Scholar] [CrossRef]
  12. Irwin, P.G. Analysis of stress and strains near the end of a crack extension force. J. Appl. Mech. 1957, 24, 361–364. [Google Scholar] [CrossRef]
  13. Dong, Z. Theoretical and Numerical Simulation Study on the Initiation and Propagation Characteristics of Hydraulic Fractures in Rocks. Ph.D. Thesis, Dalian University of Technology, Dalian, China, 2020. [Google Scholar]
  14. Chang, X. Research on the Mechanism of Complex Fracture Expansion and Geometric Shape Optimization Design in Shale Reservoirs. Ph.D. Thesis, China University of Petroleum (East China), Dongying, China, 2016. [Google Scholar]
  15. Taliercio, A.; Landriani, G.S. A failure conditionfor layered rock. Int. J. Rock Mech. Min. Sci. Geomech. 1988, 25, 299–305. [Google Scholar] [CrossRef]
  16. Tien, Y.M.; Ien, Y.M.; Kuo, M.C. A failure criterion for transversely anisotropic rocks. Int. J. Rock Mech. Min. Sci. 2001, 38, 399–412. [Google Scholar] [CrossRef]
  17. Jaeger, J.C. Shear failure of anisotropic rock. Geol. Mag. 1960, 97, 65–72. [Google Scholar] [CrossRef]
  18. Nasseri, M.H.B.; Rao, K.S.; Ramamurthy, T. Anisotropic strength and deformational behavior of Himalayan schists. Int. J. Rock Mech. Min. Sci. 2003, 40, 3–23. [Google Scholar] [CrossRef]
  19. Ramamurthy, T. Strength, modulus responses of anisotropic rocks. Compressive Rock Eng. 1993, 4, 313–329. [Google Scholar]
  20. Niandou, H.; Shao, J.F.; Henry, J.P.; Fourmaintraux, D. Laboratory investigation of the mechanical behaviour of Tournemire shale. Int. J. Rock Mech. Min. Sci. 1997, 34, 3–16. [Google Scholar] [CrossRef]
  21. Yew, C.H.; Li, Y. Fracturing of a deviated wells. SPE Prod. Eng. 1988, 3, 429–437. [Google Scholar] [CrossRef]
  22. Deeg, W.F.J. Hydraulic fracture initiation in deviated or horizontal openhole wellbore. In Proceedings of the SPE/ISRM Rock Mechanics in Petroleum Engineering, Trondheim, Norway, 8–10 July 1998. SPE-47386. [Google Scholar]
  23. Anderson, G.D. Effects of friction on hydraulic fractures growth near unboneder interfaces in rocks. Soc. Pet. Eng. J. 1981, 21, 21–29. [Google Scholar] [CrossRef]
  24. Blanton, T.L. An experimental study of interaction between hydraulically induced and PreExisting Fractures. In Proceedings of the SPE Unconventional Gas Recovery Symposium, Pittsburgh, PA, USA, 16–18 May 1982. SPE-10847. [Google Scholar]
  25. Blanton, T.L. Propagation of hydraulically and dynamically induced fractures in naturally fractured reservoirs. In Proceedings of the SPE Unconventional Gas Technology Symposium, Louisville, Kentucky, 18–21 May 1986. SPE-15261. [Google Scholar]
  26. Warpinski, N.R. Hydraulic fracturing in tight, fissured media. J. Pet. Technol. 1991, 42, 146–151. [Google Scholar] [CrossRef]
  27. Fisher, M.K.; Heinze, J.R.; Harris, C.D.; Davidson, B.M.; Wright, C.A.; Dunn, K.P. Optimizing horizontal completion techniques in the Barnett shele using Micro-seismic fracture mapping. In Proceedings of the SPE Annual Technical Conference and Exhibition, Houston, TX, USA, 26–29 September 2004. SPE-90051. [Google Scholar]
  28. Fisher, M.K.; Wright, C.A.; Davidson, B.M.; Steinsberger, N.P.; Buckler, W.S.; Goodwin, A.; Fielder, E.O. Integrating fracture mapping technologies to improve stimulations in the Barnett shale. SPE Prod. Facil. 2005, 20, 85–93. [Google Scholar] [CrossRef]
  29. Weijers, L.; Wright, C.A.; Sugiyama, H.; Sato, K.; Zhigang, L. Simulataneous propagarion of multiple hydraulic fractures evidence impact and modeling implications. In Proceedings of the International Oil and Gas Conference and Exhibition in China, Beijing, China, 7–10 November 2000. SPE-64772. [Google Scholar]
  30. Mayerhofer, M.; Lolon, E.; Warpinski, N.; Cipolla, C.; Walser, D.; Rightmire, C. What is stimulated reservoir volume. SPE Prod. Oper. 2010, 25, 89–98. [Google Scholar] [CrossRef]
  31. Soliman, M.Y.; East, L.; Augustine, J. Fracturing design amied at enhancing fracture complexity. In Proceedings of the SPE EUROPEC/EAGE Annual Conference and Exhibition, Barcelona, Spain, 14–17 June 2010. SPE-130043. [Google Scholar]
  32. Munjiza, A.; Andrews, K.R. Discrete element modeling of rock failure. Rock Mech. Rock Eng. 2017, 50, 553–575. [Google Scholar]
  33. Peng, Y.; Kondo, D. A numerical simulation of rock fracture using lattice Boltzmann method. Eng. Fract. Mech. 2011, 78, 2843–2852. [Google Scholar]
  34. Chen, M.; Li, M.; Wu, Y.; Kang, B. Simulation of Hydraulic Fracturing Using Different Mesh Types Based on Zero Thickness Cohesive Element. Processes 2020, 8, 189. [Google Scholar] [CrossRef]
  35. Liu, Z. Research on the Initiation and Propagation Law of Fracturing Fractures in Fractured Reservoirs Based on Finite Element Discrete Element Method. Ph.D. Thesis, Northeast Petroleum University, Daqing, China, 2022. [Google Scholar]
  36. Crouch, S.L. Solution of plane elasticity problems by displacement discontinuity method. Int. J. Num. Methods Eng. 1976, 10, 301–343. [Google Scholar] [CrossRef]
  37. Cundall, P.A.; Strack, O. A discrete numerical model for granular assemblies. Géotechnique 1979, 19, 47–65. [Google Scholar] [CrossRef]
  38. Lecampion, B.; Bunger, A.; Zhang, X. Numerical methods for hydraulic fracture propagation: A review of recent trends. J. Nat. Gas. Sci. Eng. 2018, 49, 66–83. [Google Scholar] [CrossRef]
  39. Paluszny, A.; Zimmerman, R.W. Numerical simulation of multiple 3D fracture propagation using arbitrary meshes. Comput. Methods Appl. Mech. Eng. 2011, 200, 953–966. [Google Scholar] [CrossRef]
  40. Tang, X.; Rutqvist, J.; Hu, M.; Rayudu, N.M. Modeling three-dimensional fluid-driven propagation of multiple fractures using TOUGH-FEMM. Rock Mech. Rock Eng. 2019, 52, 611–627. [Google Scholar] [CrossRef]
  41. Belytschko, T.; Black, T. Elastic crack growth in finite elements with minimal remeshing. Int. J. Numer. Methods Eng. 1999, 45, 601–620. [Google Scholar] [CrossRef]
  42. Gao, S. Research on the Mechanism of Fracture Initiation and Extension in Hydraulic Fracturing of Oil Shale Horizontal Wells. Ph.D. Thesis, Jilin University, Changchun, China, 2017. [Google Scholar]
  43. Barenblatt, G.I. The formation of equilibrium cracks during brittle fracture. General ideas and hypotheses. Axially-Symmetric cracks. J. Appl. Math. Mech. 1959, 23, 622–636. [Google Scholar]
  44. Dugdale, D.S. Yielding of steel sheets containing slits. J. Mech. Phys. Solids 1960, 8, 100–104. [Google Scholar] [CrossRef]
  45. Guo, J.; Luo, B.; Lu, C.; Lai, J.; Ren, J. Numerical investigation of hydraulic fracture propagation in a layered reservoir using the cohesive zone method. Eng. Fract. Mech. 2017, 195–207. [Google Scholar] [CrossRef]
  46. Gonzalez, M.; Taleghani, A.D.; Olson, J.E. A cohesive model for modeling hydraulic fractures in naturally fractured formations. In Proceedings of the SPE Hydraulic Fracturing Technology Conference, The Woodlands, TX, USA, 3–5 February 2015; Society of Petroleum Engineers: Richardson, TX, USA, 2015. [Google Scholar]
  47. Dean, R.H.; Schmidt, J.H. Hydraulic-fracture predictions with a fully coupled geomechanical reservoir simulator. SPE J. 2009, 14, 707–714. [Google Scholar] [CrossRef]
  48. Zhang, G.M.; Liu, H.; Zhang, J.; Wu, H.A.; Wang, X.X. Three-dimensional finite element simulation and parametric study for horizontal well hydraulic fracture. J. Pet. Sci. Eng. 2010, 72, 310–317. [Google Scholar] [CrossRef]
  49. Liu, Q. Research on the Mechanism and Parameter Optimization of Hydraulic Jet Radial Horizontal Well Controlled Fracturing. Ph.D. Thesis, China University of Petroleum (Beijing), Beijing, China, 2019. [Google Scholar]
  50. Zhai, L. Research on the Mechanism of Fracture Initiation and Expansion in Hydraulic Fracturing of Perforated and Completed Oil Shale Horizontal Wells. Ph.D. Thesis, Jilin University, Changchun, China, 2021. [Google Scholar]
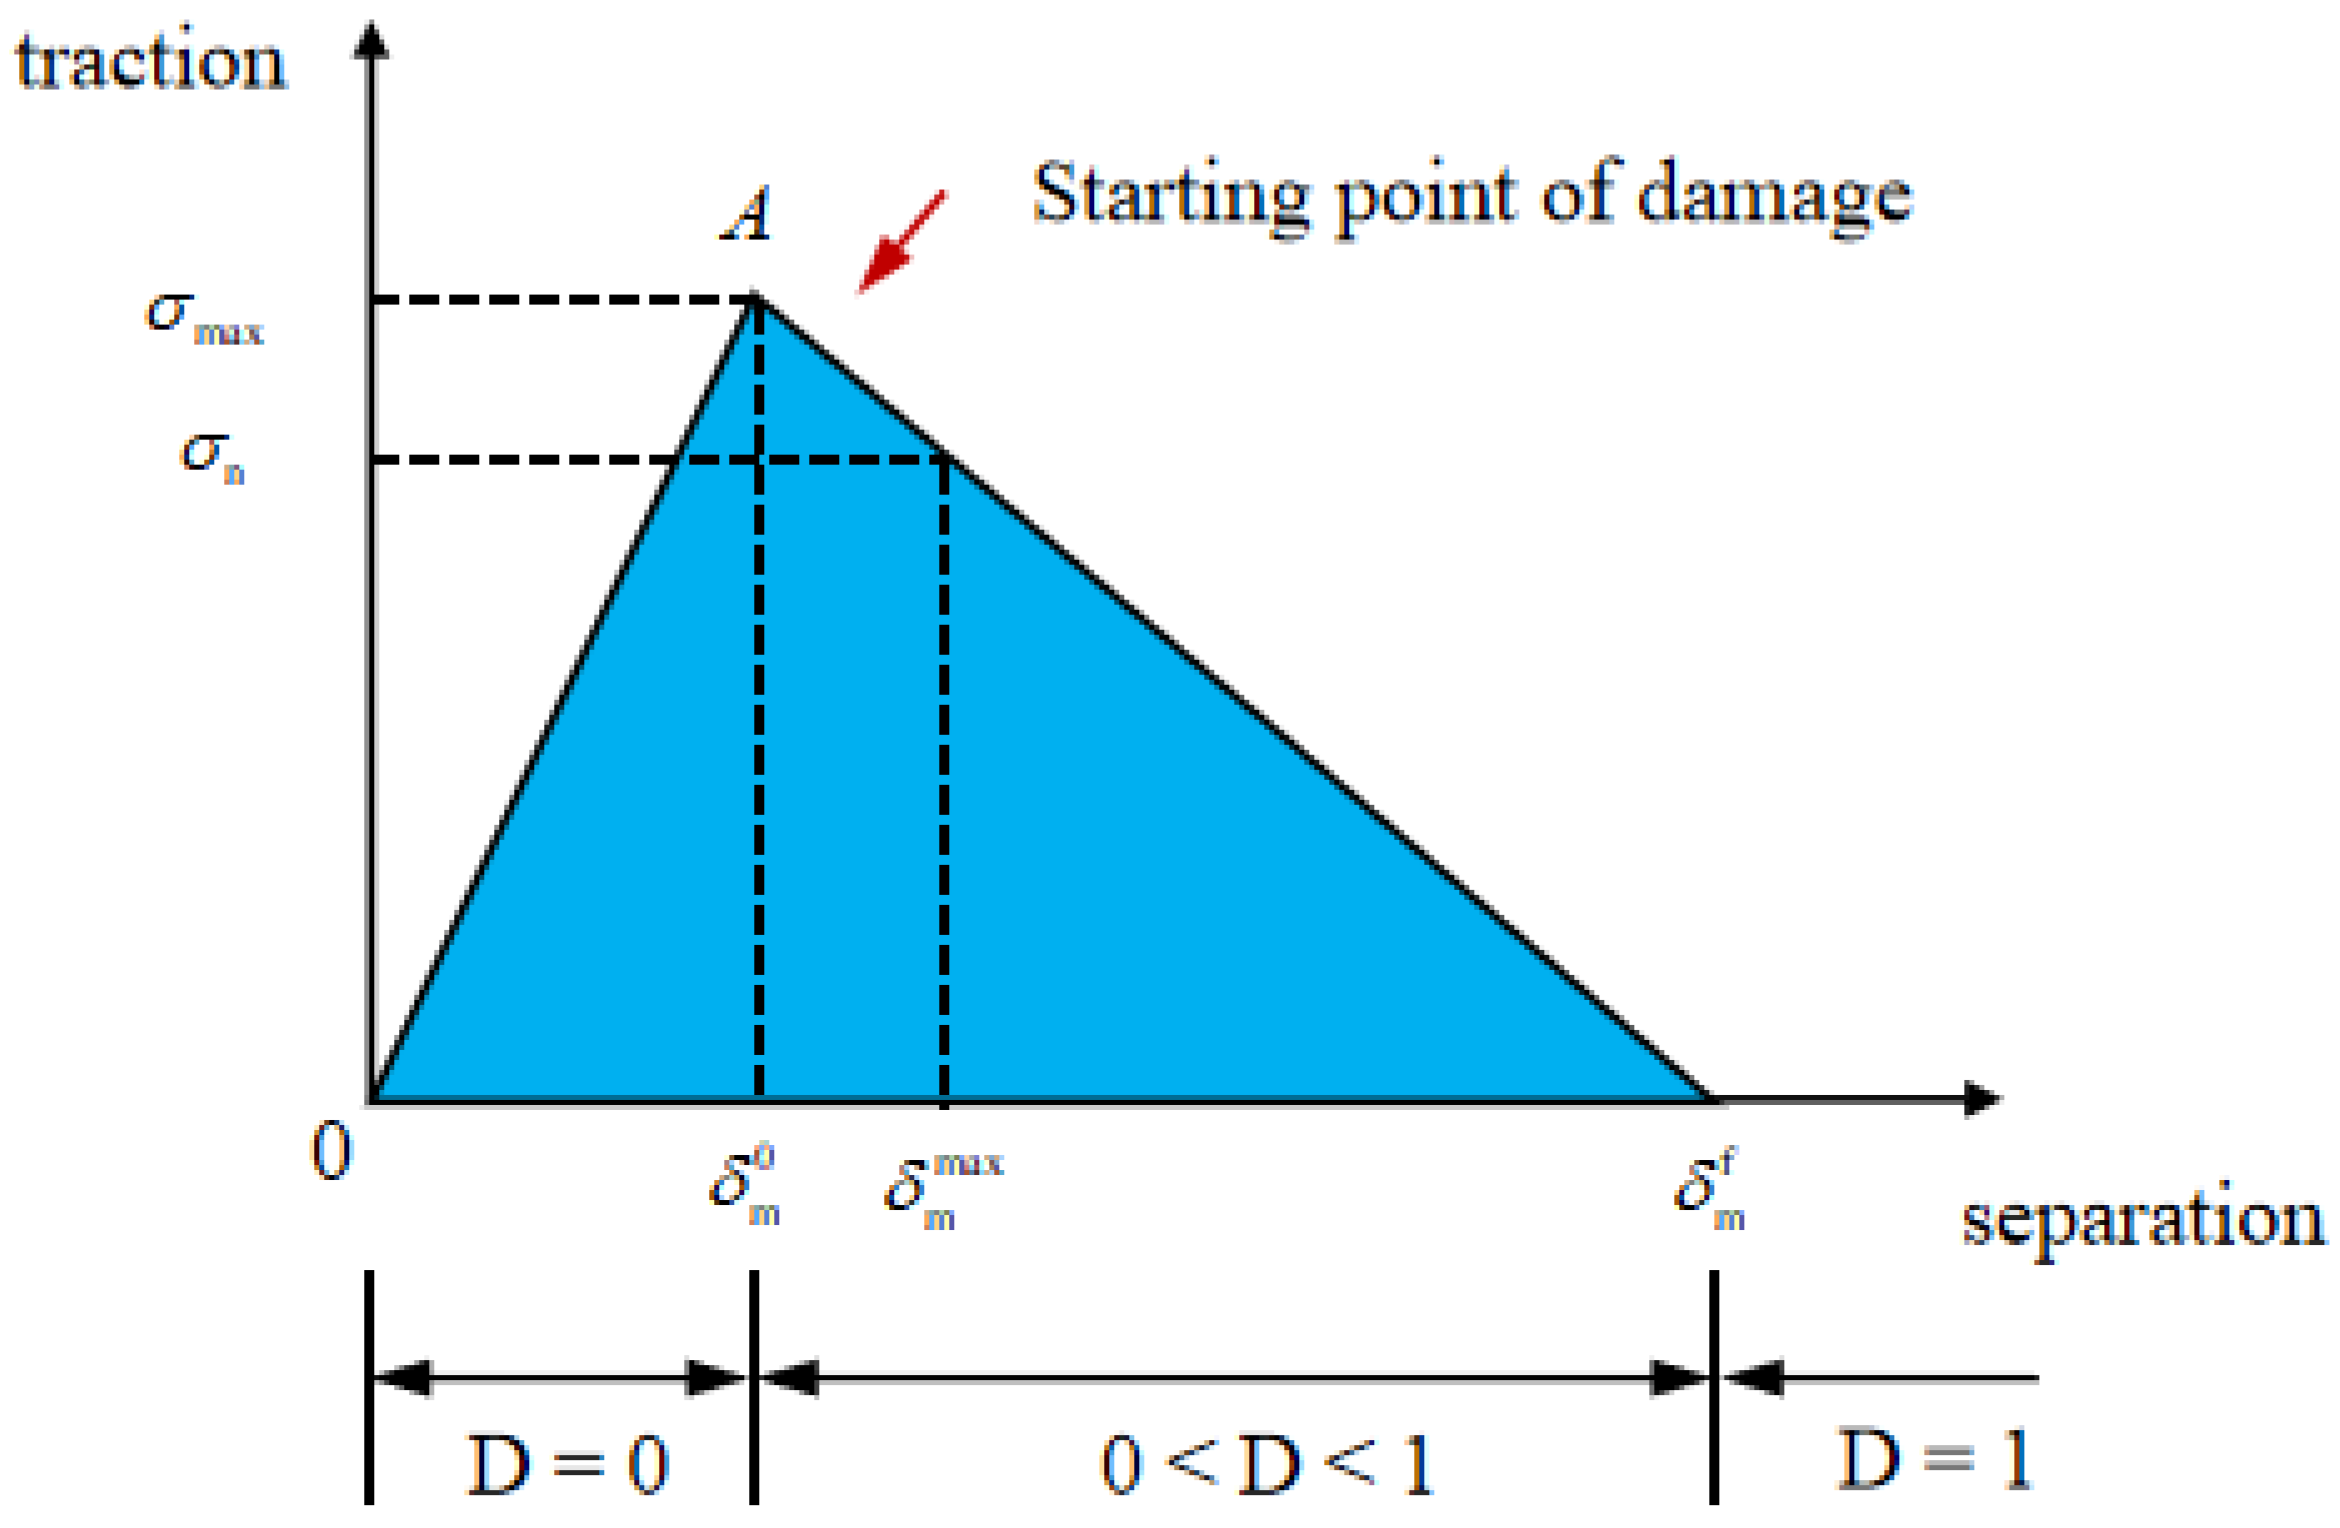
Figure 1. Bilinear traction separation failure criterion.
Processes 13 03356 g001
Figure 2. Fluid flow patterns in cohesive units.
Processes 13 03356 g002
Figure 3. Schematic diagram of natural cracks.
Processes 13 03356 g003
Figure 4. Schematic diagram of grid division.
Processes 13 03356 g004
Figure 5. Influence of natural crack location on crack direction. (a). Ground stress difference of 0 MPa; (b). ground stress difference of 1 MPa; and (c). ground stress difference of 5 MPa.
Processes 13 03356 g005
Figure 6. Effective velocity of pore fluid (FLVEL) plot. (a). Ground stress difference of 0 MPa; (b). ground stress difference of 1 MPa; and (c). ground stress difference of 5 MPa.
Processes 13 03356 g006
Figure 7. Maximum principal stress diagram. (a) Ground stress difference of 0 MPa; (b) ground stress difference of 1 MPa; and (c) ground stress difference of 5 MPa.
Processes 13 03356 g007
Figure 8. Intermediate principal stress diagram. (a) Ground stress difference of 0 MPa; (b) ground stress difference of 1 MPa; and (c) ground stress difference of 5 MPa.
Processes 13 03356 g008
Figure 9. Minimum principal stress diagram. (a) Ground stress difference of 0 MPa; (b) ground stress difference of 1 MPa; and (c) ground stress difference of 5 MPa.
Processes 13 03356 g009
Figure 10. Crack opening (PFOPEN) diagram. (a) Ground stress difference of 0 MPa; (b) ground stress difference of 1 MPa; and (c) ground stress difference of 5 MPa.
Processes 13 03356 g010
Figure 11. Pore Pressure Distribution (POR) diagram. (a) ground stress difference of 0 MPa; (b) ground stress difference of 1 MPa; and (c) ground stress difference of 5 MPa.
Processes 13 03356 g011
Figure 12. Model stiffness reduction rate (SDEG) graph. (a) Ground stress difference of 0 MPa; (b) ground stress difference of 1 MPa; and (c) ground stress difference of 5 MPa.
Processes 13 03356 g012
Figure 13. Shows the variation in pore pressure at the injection point when the stress difference is 0 MPa.
Processes 13 03356 g013
Figure 14. Variation in crack opening at injection point with a ground stress difference of 0 MPa.
Processes 13 03356 g014
Figure 15. Shows the variation in pore pressure at the injection point when the ground stress difference is 1 MPa.
Processes 13 03356 g015
Figure 16. Variation in crack opening at injection point with a ground stress difference of 1 MPa.
Processes 13 03356 g016
Figure 17. Shows the variation in pore pressure at the injection point when the stress difference is 5 MPa.
Processes 13 03356 g017
Figure 18. Variation in crack opening at injection point with a ground stress difference of 5 MPa.
Processes 13 03356 g018
Table 1. Model basic parameters table.
NameParameterNumerical ValueUnit
In situ stress fieldMaximum horizontal principal stress10 × 106Pa
Minimum horizontal principal stress5 × 106Pa
MatrixModulus of elasticity15GPa
Poisson’s ratio0.25/
Initial void ratio0.1/
Permeability coefficient1 × 10−7m/s
Pump injection parametersFracturing fluid viscosity0.001Pa·s
Fracturing fluid displacement0.1m3/min
injection time20s
Disclaimer/Publisher’s Note: The statements, opinions and data contained in all publications are solely those of the individual author(s) and contributor(s) and not of MDPI and/or the editor(s). MDPI and/or the editor(s) disclaim responsibility for any injury to people or property resulting from any ideas, methods, instructions or products referred to in the content.