Abstract
The rising penetration of electric vehicles is driving huge demand for lithium batteries, making low-carbon manufacturing a critical objective. This goal is challenged by insufficient production scheduling flexibility and the neglect of carbon-reduction technologies. To address these challenges, this paper develops a low-carbon planning methodology for lithium battery plant energy systems by leveraging manufacturing chain flexibilities. First, a lithium battery energy–carbon material modeling approach is developed that accounts for process production delays and intermediate product storage to capture schedulable process energy consumption patterns. A nitrogen–oxygen coupling production framework is introduced to facilitate oxygen-enriched combustion technology application, while energy recovery pathways are incorporated given the high energy consumption of the formation stage. Subsequently, a process scheduling-driven planning model for lithium battery industrial integrated energy systems (IIES) is developed. Finally, the planning model is validated through four contrasting case studies and systematically evaluated using multi-criteria decision analysis (MCDA). The results demonstrate three principal conclusions: (1) incorporating process scheduling effectively enhances process energy flexibility and reduces total system costs by 19.4%, with MCDA closeness coefficient improving from 0.257 to 0.665; (2) oxygen-enriched combustion increases maximum combustion and carbon capture (CCS) rates from 90% to 95%, reducing carbon tax to 40.5% of the baseline; (3) energy recovery on the basis of process scheduling further reduces costs and carbon emissions, with battery recovery achieving an additional 30.2% cost reduction compared to 24.1% for heat recovery, and MCDA identifies this integrated approach as the optimal solution with a closeness coefficient of 0.919.
1. Introduction
1.1. Motivations
Lithium batteries play a vital role in transport electrification [1], accelerating the pace of transportation decarbonization. By 2023, demand for electric vehicle lithium batteries in the world has reached more than 750 GWh, and it is set to grow more than seven times by 2035 compared to 2023 based on current policy settings [2]. However, the production of lithium batteries is characterized by high energy demand and high carbon emissions, with energy consumption of producing 1 kWh lithium battery ranging from 29 kWh to 37.5 kWh [3] and carbon emissions about 10.3 kg CO2/kWh [4]. Therefore, low-carbon planning for the lithium battery industry has become imperative [5,6].
To address this challenge, understanding the energy characteristics of lithium battery manufacturing is crucial. The lithium battery industry represents a typical process manufacturing industry characterized by sequential, tightly coupled unit operations. While different battery chemistries (e.g., LFP, NCM, NCA) exhibit distinct material properties, their manufacturing follows broadly similar process flows [7,8]. The energy consumed by lithium battery production primarily includes electricity and heat [9] along with cooling requirements and a certain amount of nitrogen used as a protective gas for the production line [10], making the energy supply system a typical IIES [11]. The high reliance on energy presents a substantial challenge for carbon reduction, especially when the energy supply is heavily dependent on fossil fuels [12,13]. In order to decarbonize the lithium battery industry, it is necessary to optimize energy supply systems, control the manufacturing process, and make full use of the energy storage features of the process. Hence, this paper proposes a low-carbon economic planning method for the lithium battery IIES, aiming to not only reduce the planning costs for industrial users but also to improve energy utilization efficiency whilst reducing societal carbon emissions.
1.2. Related Work
IIES leverage the synergies among heterogeneous energy carriers, including electricity, heat, gas, hydrogen, and so on to enable efficient energy utilization and foster green and sustainable industrial development [14,15]. Consequently, IIES have garnered significant attention in research and practical applications. Many researchers have constructed IIES for different energy-intensive industries. Authors in [16] presents an operation scheduling model for the chemical and metallurgical industries IIES, optimizing the integration and distribution of electric energy, heating energy, and hydrogen. A multi-stage planning model for a cement IIES considering cement production process including the rotary kiln system and low-temperature waste heat power generation technology is developed in [17], aiming to realize its carbon emission reduction targets. Researchers in [18] established an energy management system for an offshore oil and gas microgrid to optimize asset operation in the microgrid to reduce costs and emissions. Han et al. [19] proposed a granular-evolutionary hybrid computing framework to solve the scheduling of a steel IIES as a constrained multi-objective problem. A novel hydrogen-based cogeneration system in the paper and pulp industry is proposed in [20], aiming to satisfying the energy needs. Liu et al. studied the abandoned coal mine energy system in [21] to achieve the lowest operation cost and the minimal carbon emissions.
Many researchers have dedicated effort to achieving low-carbon planning of IIES [22]. In energy-intensive industries, low-carbon planning is crucial for enhancing energy efficiency and achieving environmental goals. Authors in [23,24] proposed a two-stage low-carbon robust planning method for the steel mill gas utilization system considering multiple low-carbon technologies to achieve the decarbonization of steelmaking plant. However, little consideration has been given to the adjustable industrial production processes. To address this, Zhang et al. [25] proposed an optimal dispatching approach based on a model of industrial process, aiming to the improve the yield of an off-grid industrial park. But the production process is reduced to a single shop floor, without considering the coupling between processes.
Moreover, low-carbon mechanisms such as carbon trading, green certificates, and low-carbon technologies can often play a significant role in IIES planning. Carbon trading, as an effective market mechanism, provides economic incentives for emission reduction [26]. An integrated energy trading model considering carbon emissions/green certificates equivalent interaction mechanisms was developed in [27], achieving a 4% reduction in system operating costs and an 11.4% reduction in carbon emissions. Energy recovery technologies, such as waste heat recovery, are integral to reducing energy consumption and emissions. In industries like cement and steel, waste heat recovery systems and low-temperature waste heat power generation have proven effective in cutting emissions and improving energy efficiency [28,29]. Carbon capture [30] and oxygen-enriched combustion [31] technologies can better utilize the carbon emission in IIES to make a better economy. Notably, electrolysis-based Power-to-Hydrogen technology produces high-purity oxygen as a by-product [32], which can be directly supplied to oxygen-enriched combustion systems. Integrating renewable energy sources like solar, wind, and biomass [33], along with energy storage systems, enables the balancing of supply and demand, reducing reliance on fossil fuels [34,35]. Therefore, to decarbonize the lithium battery industry, it is essential to corporate these methods to optimize production while lowering carbon emissions.
In summary, current planning researches neglect the differentiated characteristics and adjustable potential of processes and do not fully explore the energy-saving and carbon-reducing potential of production processes, resulting in suboptimal equipment capacity and energy waste.
1.3. Contributions and Organizations
To address the aforementioned issues, this paper proposes the energy consumption patterns according to the production processes in the lithium battery industry, thoroughly exploring the adjustable potential on the production side. A planning model for a typical lithium battery IIES is developed, incorporating process scheduling to reduce production costs and carbon emissions. The main innovations are as follows:
- An energy–carbon material flow modeling method for lithium battery industry is proposed considering process production and intermediate product storage, enabling a detailed characterization of energy use in schedulable processes.
- A nitrogen–oxygen coupling production framework is introduced to support the application of oxygen-enriched combustion technology in the lithium battery industry, considering the recycling of tail gas from nitrogen generators.
- A process scheduling-driven planning model for lithium battery IIES is developed considering the battery formation energy recovery.
Based on a lithium battery plant, this paper compares and analyzes the operational results of different planning schemes within the annual planning scope. This validates the flexibility of the proposed energy–carbon material flow model and explores the economic viability of the planning method for lithium battery IIES.
The content of this paper is organized as follows: Section 1 establishes the mathematical models of the lithium battery production and system equipment in the lithium battery IIES. Section 2 proposes a planning method considering the manufacturing chain flexibilities. Case studies are carried out in Section 3, with conclusions provided in Section 4. The flowchart of the study is shown in Figure 1.
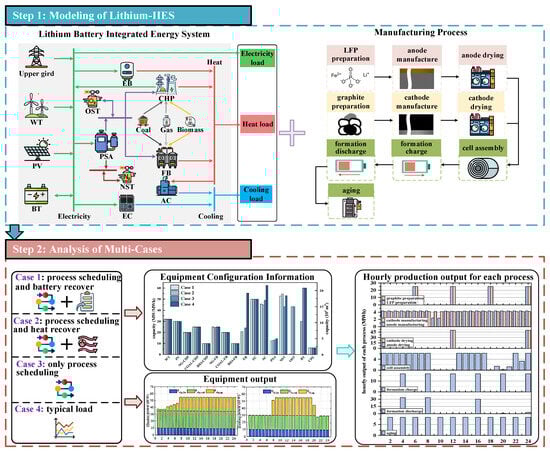
Figure 1.
Flowchart of this study.
2. Modeling of Lithium Battery Industry Integrated Energy Systems
2.1. Lithium Battery Industrial Integrated Energy System
Considering the actual energy consumption and energy supply equipment of lithium battery industry, a lithium battery IIES is established as shown in Figure 1. The energy production equipment includes combined heat and power (CHP) units and fired boilers (FB) using primary energy, as well as renewable energy units such as wind turbines (WT) and photovoltaic panels (PV). Energy conversion equipment includes electric boilers (EB), electric chillers (EC), and absorption chillers (AC). Energy storage equipment encompasses batteries (BT), nitrogen storage tanks (NST), and oxygen-enriched storage tanks (OST). Additionally, the system incorporates pressure swing adsorption (PSA) nitrogen generators, tail gas recovery devices for nitrogen generators, and oxygen-enriched CCS technologies.
Taking lithium iron phosphate (LFP) batteries as an example, the production process of lithium batteries can be reduced to ten steps after rational simplification, which are LFP preparation, graphite preparation, anode manufacture, cathode manufacture, anode drying, cathode drying, cell assembly, formation charge, formation discharge, and aging. These processes consume electricity, heat and cooling, which together constitute the production loads. Electrical loads cover nearly the entire manufacturing process. Heat loads primarily originates from the LFP preparation, graphite preparation, all the drying steps and aging. Cooling loads mainly arise from anode manufacturing and cathode manufacturing. Process energy consumption accounts for approximately 64% of the total energy use [12]. In addition to the above production loads, there are also basic loads to ensure the environmental temperature, humidity, and cleanliness of lithium battery production. The basic loads are weakly adjustable, originating from air conditioning units, air filtration equipment, and the lighting, heating, and cooling needs of living and office areas. The data requirements of the proposed model are obtainable in modern industrial practice through existing Manufacturing Execution Systems (MES) and energy management systems commonly deployed in contemporary lithium battery manufacturing facilities.
2.2. Lithium Battery Production Model
This section develops mathematical models for the lithium battery production processes. The modeling of lithium battery production is divided into four main aspects: process route, process production, energy recovery, and load integration. The process route defines the sequence, coupling, and material output ratio of each process, serving as a mathematical description of the process flowchart. Process production describes the relationship between production velocity and inventory for each process. Energy recovery focuses on the formation and discharging stages of lithium batteries, aiming to conserve energy. Load integration combines process loads and basic loads to form the total system load.
- Process route
To describe the sequential relationships of each production process, processes are numbered from 1 to z, ensuring that processes with smaller numbers precede those with larger numbers (parallel processes are not subject to this constraint). To describe the coupling relationships between processes, a matrix is established. Since processes are numbered sequentially from smaller to larger, processes with larger number can receive materials from processes with smaller number, but not vice versa, making the coupling matrix an upper triangular matrix, as shown in (1).
where denotes the required products output of process i to produce unit product of the process j.
As shown in (2), introduce the production capacity coefficient to connect intermediate products and final products, representing the required intermediate products of process i to produce unit final products of process z. For processes with direct material connections (such as graphite production and anode production), the corresponding matrix element is the negative value of the ratio of their production capacity coefficients. For processes without direct connections (such as graphite production and anode drying), the corresponding matrix element is 0. The diagonal elements of the matrix, describing the output of process i, are always 1.
- 2.
- Process production
Based on the production cycle, processes are categorized into continuous production processes (CP) and discontinuous production processes (DP). Continuous production processes have production cycles less than or equal to the minimum scheduling period (1 h), with outputs produced every hour. Discontinuous production processes have production cycles longer than the minimum scheduling period, producing outputs only after the completion of the production cycle with constant loads throughout. In this research, the production of anodes, cathodes, and cell assembly in lithium battery manufacturing are classified as CP processes, while the remaining processes are classified as DP processes. Lithium battery production is divided into two parts: production and intermediate product storage. The schematic diagram of modeling is depicted in Figure 2.
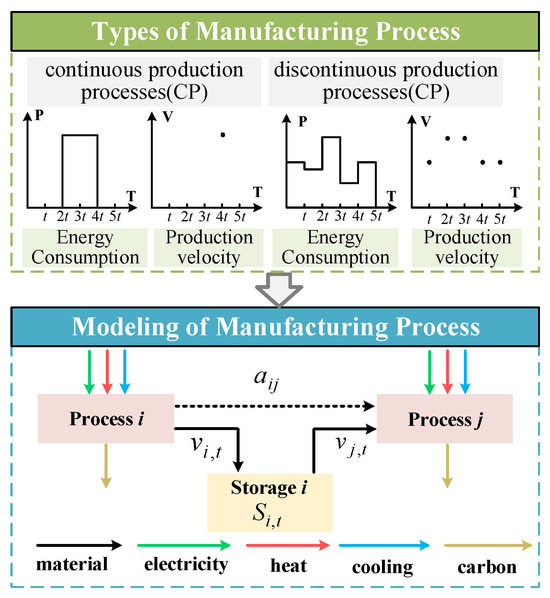
Figure 2.
Schematic of production model.
The storage of intermediate products depends on the types of the processes that use the materials. The inventories for CP and DP processes need to satisfy Equations (3)–(5) respectively.
Additionally, the storage capacities for both types of processes have to meet the constraints of upper and lower capacity limits and initial and final state conditions, as shown in (6).
where represents the inventory of process i at time t (MWh); denotes the upper limit of inventory for process i (MWh); and indicates the production rate of process i (MWh/h).
The production rates, along with the energy flow, carbon flow, and material characteristics, are dependent on the types of the production processes. Separate mathematical models are established for the two types of processes.
For DP processes, to describe the output delay characteristics of the processes, a 0–1 variable is introduced as the process initiation indicator. The production rate for DP processes has to satisfy the following relationship:
In the equations, denotes the production rate of process i at time t (MWh/h), represents the upper limit of production capacity for process i (MWh/h), and indicates the production cycle of process i (hours).
The energy–carbon material flows of the processes are expressed as in Equation (9):
where , and represent the electric, thermal, and cooling power consumption of process i at time t (MW); denotes the carbon emissions of process i at time t (tons); indicates the nitrogen consumption rate of process i (m3); represent the electric, thermal, and cooling power consumption per unit product of process i (MW); denotes the unit carbon emissions of process i (tons); and indicates the unit nitrogen consumption of process i (m3).
For CP processes, their production rate and energy–carbon material flows are shown respectively in (10) and (11):
To complete the production tasks of the factory, the production rate needs to satisfy the following relationship:
where represents the production task within the factory’s scheduling period (MWh) and denotes the set of all processes.
- 3.
- Energy recovery
In the stages of lithium battery production, besides the high energy consumption of the coating and drying processes, the formation and aging processes also consume significant energy, accounting for about 27% of total consumption due to the energy loss from charge–discharge cycles. The traditional formation process charges lithium battery cells and typically discharges them through load resistors, leading to an increase in equipment temperature. Recovering the energy from the formation discharge process can effectively save energy. There are two main approaches: one is heat recovery (HTR) from the high-temperature exhaust gas to the thermal bus, and the other is battery recovery (BTR), where the energy from the discharge phase is inverted and fed back into the electrical bus. However, the practical implementation of HTR and BTR pathways requires consideration of initial capital expenditure, potential maintenance complexity, and energy conversion losses. Despite these limitations, the net benefits of integrating energy recovery into lithium battery formation processes are substantial enough to justify the investment. The mathematical expression for the recoverable energy is shown in (13).
where and represent the heat recovery energy and battery recovery energy (MW), respectively. denotes the energy consumption of the formation charging process (MW). and are the efficiencies of heat recovery and battery recovery, respectively.
- 4.
- Load integration
In the lithium battery IIES, in addition to the adjustable process loads, there are also basic loads with limited adjustability, such as auxiliary production equipment, and lighting, heating, and cooling for production and office areas. The total system load demand can be represented as the sum of these two parts.
where , and represent the basic electrical, heating, and cooling loads (MW), respectively.
2.3. System Equipment Model
This section develops mathematical models for system equipment.
- 1.
- Wind turbine
The output of a WT primarily depends on the energy conversion efficiency, wind speed, and blade parameters. The predicted output of a WT can be expressed as follows:
where is the energy conversion efficiency of the WT, is the air density (kg/m3), is the radius of the WT blades (m), indicates the number of WTs installed, and denotes the wind speed at time t.
- 2.
- Photovoltaic
The output of a PV system depends on energy conversion efficiency, irradiance, panel area, and tilt angle. Its predicted output can be shown in (16):
where and represent the energy conversion efficiencies of the maximum power point tracking inverter and the PV modules, respectively. denotes the installed area of the PV panels (m2), indicates the irradiance at time t (kW/m2), and is the tilt angle of the PV panels in degrees.
- 3.
- Combined heating and power
Traditional CHP units predominantly use coal as fuel, termed coal-fired CHP. Substituting coal with natural gas or biomass can reduce primary energy use and carbon emissions. These alternatives can be called as natural gas-fired CHP (ng-fired CHP) and biomass-fired CHP (bio-fired CHP), respectively. According to the actual heat demand in industrial parks, all three types of CHP units operate in a heat-led mode. Their electrical and thermal efficiencies vary, and the power outputs can be described as (17) and (18).
where and represent the real-time electrical and thermal power outputs of the CHP units at time t (MW), respectively. and indicate the electrical and thermal power outputs of ng-fired, coal-fired, and bio-fired CHP units, respectively (MW). are the electrical conversion efficiencies of the three types of CHP. Additionally, represents the natural gas input for ng-fired CHP units in m3/h, while and represent the coal and biomass fuel inputs for their respective CHP units in tons/h. The thermal-to-electric ratios for the three types of CHP units are given by .
- 4.
- Fired boiler
The FB also can use coal, natural gas, and biomass as fuels, termed coal-fired FB, ng-fired FB, and bio-fired FB, respectively. The thermal power outputs of the three types of FBs can be expressed as follows:
where represents the total thermal power output of the FB units at time t (MW). The variables denote the real-time thermal power outputs of coal-fired, ng-fired, and bio-fired FB units (MW), respectively. The parameters represent the energy conversion efficiencies of the three types of FB units. Additionally, indicates the calorific values of the respective fuels, measured in kWh/m3 or kWh/ton. The variables , , and represent the inputs of natural gas, coal, and biomass for the respective FB units, measured in m3/h or ton/h.
- 5.
- Electric boiler
The EB use electrical to generate heat through electromagnetic induction or resistance heating. The thermal power output of an EB is described by Equation (20).
where and represent the thermal power output and electrical power input of the EB at time t in MW. The parameter denotes the conversion efficiency of the EB.
- 6.
- Electric chiller
The EC use electrical energy for cooling through a compression mechanism. The cooling power output of an EC is given by Equation (21):
where and represent the electrical power input and the cooling power output at time t in MW. The parameter is the coefficient of performance of the EC.
- 7.
- Absorption chiller
The AC converts low-grade thermal energy into cooling power, with the output cooling power represented as shown in Equation (22):
where and denote the cooling output power and thermal input power of the AC at time t (MW), respectively, while represents the coefficient of performance of the AC.
- 8.
- Energy storage equipment
The energy storage devices considered in this paper include NST, OST, and BT. The mathematical models for these three types of storage are similar, with the primary differences being the storage medium and the charge/discharge capabilities.
The state of energy storage at each time step can be described by the previous time step’s state and the current time step’s charge/discharge state. The storage state must satisfy the constraints of initial and final state consistency, as well as the upper and lower limits of storage capacity, as shown in (23).
The storage devices also should satisfy charge/discharge rate and power constraints, as shown in (24).
where and represent the charge and discharge rates, reflecting the relationship between charge/discharge flow and capacity, while and are 0–1 variables ensuring that charging and discharging do not occur simultaneously at any time t.
- 9.
- Nitrogen generators
Nitrogen generators are primarily employed in the lithium battery industry using pressure swing adsorption technology to produce high-purity nitrogen at 99.99% purity, serving as protective gas in lithium battery production. The nitrogen flow rate generated by the PSA is expressed as (25):
where denotes the nitrogen flow rate from the PSA at time t, measured in m3/h. represents the nitrogen production efficiency of the PSA, is the power consumption of the PSA, measured in MW, and is the coefficient for oxygen enrichment production.
- 10.
- Carbon capture after combustion and oxygen-enriched combustion technology
Oxygen-enriched combustion technology, as a mature technology in energy-intensive industries such as glass manufacturing, faces primary challenges of high oxygen production costs and substantial energy consumption, which can be effectively addressed within the proposed nitrogen–oxygen coupling framework [36,37]. By utilizing oxygen-enriched tail gas from nitrogen generators essential for pressure swing adsorption production lines, the system can acquire oxygen at minimal marginal cost. Consequently, the high-concentration CO2 flue gas generated from oxygen-enriched combustion can effectively enhance CCS rates while significantly reducing energy consumption and costs for carbon capture. Therefore, the application of CCS and storage combined with oxy-fuel combustion in lithium battery plants demonstrates robust technical and economic feasibility. This paper considers post-combustion carbon capture technology and oxygen-enriched combustion. The power consumption of the CCS unit and the corresponding oxygen consumption for each unit are given by Equations (26) and (27), respectively.
where represents the energy consumption for capturing one ton of CO2, MWh/ton, denotes the capture level of the CCS in the lithium battery manufacturing process, indicates the carbon capture efficiency of the CCS for the three types of CHP/FB units, represents the carbon emission intensity of the three types of CHP/FB units, ton/MWh, and is the oxygen consumption rate per unit power of CHP/FB units when operating under oxygen-enriched combustion conditions, m3/MW.
The carbon capture levels of the CCS for CHP and FB units depend on whether they undergo oxygen-enriched combustion. Binary variables and are introduced to indicate the oxygen-enriched combustion status of the units, as shown in Equation (28).
Considering oxygen-enriched combustion and carbon capture, the net carbon emissions can be calculated according to Equation (29).
3. Planning of the Lithium Battery IIES
This section establishes a planning model for a typical lithium battery IIES considering the scheduling of lithium battery production, including the objective function and constraints.
3.1. Objective Function
The objective of the system planning is to minimize economic expenditures over the planning period. This involves initial equipment investment costs and , electricity trading costs , various fuel purchase costs , operation and maintenance costs of system equipment , penalty costs for renewable energy curtailment and heat reduction , and carbon tax costs/revenues .
The formulation ensures that all relevant economic factors are accounted for in optimizing the energy system for lithium battery production.
where represents the number of years in the planning period and represents the number of typical days considered.
- 1.
- Equipment investment costs
The investment costs for equipment include the investment in integrated energy system (IES) equipment and lithium battery production equipment, as shown in Equations (31) and (32):
where represents the unit investment cost of equipment , which may be expressed in units such as CNY/MW, CNY/MWh, or CNY/m3 depending on the type of equipment. denotes the number of installed wind turbines, represents the installed area of photovoltaic panels in square meters, and indicates the capacity of the equipment in megawatts (MW).
- 2.
- Operation and maintenance costs
- 2.
- Electricity trading cost
- 4.
- Fuel purchase costs
Fuel purchases mainly consider the procurement of coal, natural gas, and biomass, as shown in (35).
where represents the purchase price of natural gas (CNY/m3), and denote the purchase prices of coal and biomass (CNY/ton), respectively. is the quantity of natural gas purchased at time t (m3/h), while and are the quantities of coal and biomass purchased at time t (tons).
- 5.
- Curtailment penalties
- 6.
- Carbon tax
The carbon tax cost to be paid is given by Equation (37):
where represents the carbon tax price (CNY/ton) and is the carbon emission factor of external grid (ton/MWh).
3.2. Constraints
- 1.
- Bus balancing
Bus balancing specifically includes electrical, thermal, cooling, nitrogen, and oxygen bus. For the electrical bus, its balance relationship is shown as Equation (38):
The thermal bus balances are given by expressions (39) and (40):
The cooling demand is primarily met by AC and EC and the cooling bus balance is shown as (41):
The nitrogen bus balance is represented by (42):
where indicates the amount of nitrogen purchased (m3).
Regarding the oxygen bus, as shown in (43), the oxygen is primarily sourced from the PSA nitrogen generator’s oxygen-rich tail gas, mainly used for oxygen-enriched combustion in CHP and FB units, with excess oxygen being vented. Additionally, OST participates in peak shaving and valley filling for oxygen supply and demand.
- 2.
- Installation capacity constraints
Various types of equipment within the lithium battery IIES must adhere to installation capacity requirements expressed by Equation (44).
where denotes the index for all equipment, and represents the upper limit of installation capacity for that equipment.
WT and PV, due to the specificity of their installation, should primarily be constrained by available construction area, as shown in expressions (45) and (46).
where and denote the installation limits for WT and PV, respectively.
- 3.
- Equipment operational constraints
The actual electrical output of WT and PV units should be less than their respective forecasts, as shown in (47) and (48). The electrical or thermal outputs from other equipment must adhere to the constraints in (49).
where and are the minimum and maximum ratio of the output to the capacity of equipment .
- 4.
- Energy purchase constraints
The internal purchasing of electricity within the system must satisfy Equation (50).
where and are binary variables indicating the purchase and sale status, and denote the upper and lower limits of electricity purchasing (MW).
The other purchasing constraints are defined as follow:
where and represent the upper and lower limits of natural gas purchasing (m3/h), while and denote the upper and lower limits of coal/biomass fuel purchasing (ton/h).
4. Case Study
4.1. Case Description
Based on the current lithium battery production lines, a planning study for the lithium battery IIES is conducted in the southeastern coastal region of China, with a total planning horizon of 20 years. This study assumes that the power structure remains unchanged throughout the entire planning period, with the grid carbon intensity factor consistent with China’s average electricity carbon footprint factor in 2023, which is 0.6205 kgCO2e/kWh [38].
To evaluate the comprehensive performance of process scheduling and energy recovery in the formation discharge process, four cases were designed for comparative analysis. The energy recovery methods selected were battery recycling and heat recovery technologies, which comprehensively cover the major recoverable energy forms (electrical and thermal) in lithium battery manufacturing processes, providing representative evaluation of available decarbonization pathways. Based on the controlled variable principle, the specific configurations are as follows: Cases 1 and 2 evaluate the synergistic effects of combining process scheduling with different energy recovery approaches. Case 1 considers process scheduling and battery recycling during the formation discharge process. The current formation discharge efficiency is approximately 90%, and the feedback efficiency of battery recycling technology ranges from 60% to 80%, resulting in a recovery efficiency of about 54% to 72% [39]. This case assumes a recovery efficiency of 60%. Case 2 considers process scheduling and heat recovery during the formation discharge process. Given that the efficiency of air-to-air heat exchangers ranges from 45% to 50%, the recovery efficiency is approximately 40% to 45% [40]. This case assumes a recovery efficiency of 40%. Case 3 considers process scheduling during the formation discharge process without energy recovery to demonstrate the singular impact of process scheduling. Case 4 serves as the control baseline, representing current industrial practice without optimization interventions. Therefore, the investment cost of lithium battery production equipment is not considered in this case.
The lithium battery factory produces 100 MWh of batteries per day. In addition to the core production processes, the electrical, heating, and cooling loads of the workshops, office buildings, and dormitory areas are illustrated in Figure 3. The time-of-use (TOU) pricing structure depicted in Figure 4 is derived from the large industrial electricity tariffs of Jiangsu Province, China in 2019, with peak periods at 9:00–12:00 and 19:00–22:00. The energy consumption and carbon emission parameters for each process in lithium battery production, as detailed in Table 1, are derived from life cycle analyses found in [41,42,43,44], ensuring alignment with current industry practices. Detailed technical specifications for related equipment and processes are provided in Appendix B. The equipment efficiency parameters are obtained from manufacturer specifications and industry standards, while the lithium battery production process parameters are derived from validated industrial sources [3,12].
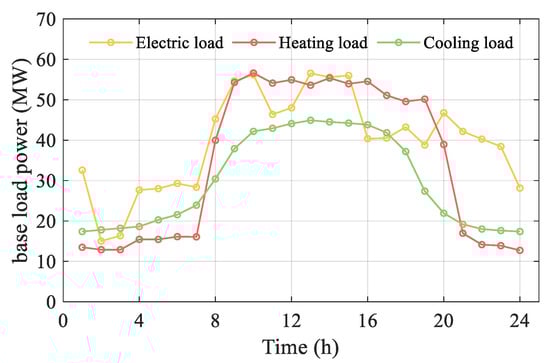
Figure 3.
Basic load.
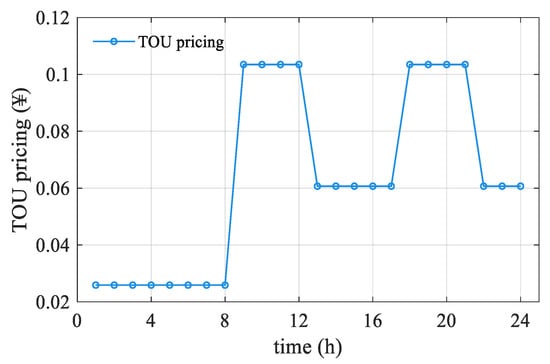
Figure 4.
TOU pricing.

Table 1.
Lithium battery production parameters.
4.2. Case Results
- 1.
- Economic Analysis
The economic results of each case are shown in Table 2.
Table 2.
Optimized configuration results: itemized costs.
In terms of economics, when excluding process equipment investment, Case 1 demonstrates the most favorable economic performance with the lowest total cost throughout the planning period. The cost reduction compared to the baseline Case 4 is most substantial in Case 1, achieving a 43.7% reduction in total cost. Case 2 and Case 3 show progressively smaller reductions of 38.8% and 19.4%, respectively, relative to Case 4. The superior performance of Case 1 over Case 2 stems from the higher efficiency of battery recovery compared to heat recovery, which is particularly impactful given electricity’s dominance in lithium battery production energy consumption. Overall, the implementation of process scheduling enables a 19.4% cost reduction versus the baseline, while incorporating battery recovery and heat recovery provides additional reductions of 30.2% and 24.1%, respectively, demonstrating the significant economic benefits of the proposed methodology.
From an environmental perspective, progressive reduction in carbon tax cost, which serves as a direct proxy for total carbon emissions, quantitatively demonstrates the contribution of each decarbonization strategy. Process scheduling (Case 3) establishes the foundation, reducing the carbon tax by 21.8% from the baseline (Case 4) by optimizing energy procurement. The integration of energy recovery technologies delivers further substantial reductions: heat recovery (Case 2) provides an additional 26.9% decrease, while the superior battery recovery (Case 1) achieves the highest incremental benefit of 29.1%, underscoring its greater efficacy in displacing carbon-intensive grid electricity and maximizing overall decarbonization. This is achieved by optimizing the energy use profile through process scheduling, reducing electricity consumption, and utilizing the oxygen-rich tail gas recovery from nitrogen generators for oxygen-enriched combustion and carbon capture.
- 2.
- Configuration Capacity and Investment
The configuration capacities and investment proportions are compared in Figure 5 and Figure 6, respectively.
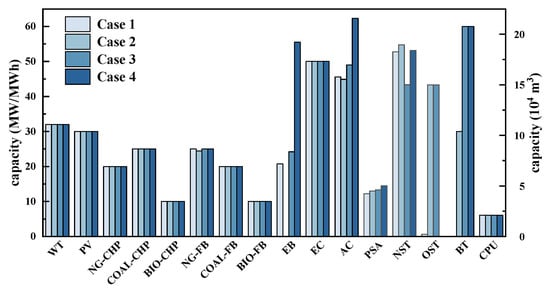
Figure 5.
System equipment configuration capacity.
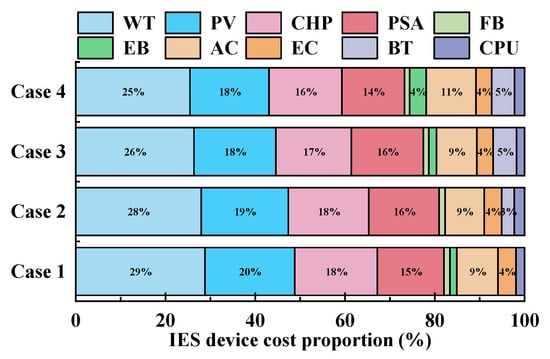
Figure 6.
System equipment investment proportion.
Due to the high construction and maintenance costs of renewable energy units, the total investment shares for WT and PV are approximately 29% and 20%. Each case configures 55 MW CHP units, accounting for about 18% of the total investment. Although the installed capacity of bio-fired CHP is not large, its relatively high investment cost—about 6.3 times that of coal-fired CHP and 3.7 times that of natural gas-fired CHP—results in an 8.48% share of the total investment. Additionally, since multiple processes in lithium battery manufacturing require protective gases and strict moisture control, the nitrogen generators represent about 15% of the investment. The cost of heating equipment FB accounts for 1% in all cases. In Case 1, the cost of configuring EB accounts for 1% of the total investment. The costs for two types of cooling equipment, EC and AC, represent approximately 4% and 9%, respectively. In Case 2, battery storage investment accounts for 3% of the total, while in Case 3 and Case 4, it accounts for 5%. This demonstrates that battery recovery during the formation process increases electrical flexibility, reduces the need for battery storage, and thereby lowers overall costs.
4.3. System Operation Analysis
- 1.
- Manufacturing schedules and production load
The manufacturing schedules of Case 1 to Case 3 are illustrated in Figure 7. It can be seen that the main difference focuses on the formation discharge stage. In Case 1 and Case 2, energy recovery predominantly occurs during off-peak hours of the TOU pricing to meet higher production demands during these times. The energy recover strategy significantly enhances the economic efficiency of the production process by leveraging lower electricity costs during off-peak periods. Case 3 is constrained by the upper limit of equipment production capacity and opted for less investment in production equipment and sustained production. Furthermore, the cell assembly stage also shows noticeable differences among the three cases. Furthermore, the anode manufacturing stage also shows noticeable differences among the three cases. Compared with Case 3, Case 1 and Case 2 attenuate the response to TOU pricing because the energy recovery strategy provides part of the production energy and reduces the dependence on equipment capacity. The cell assembly process follows similar trends.
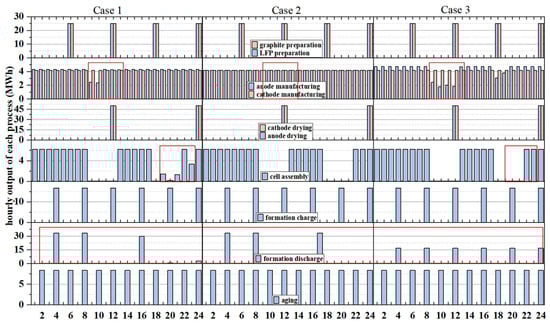
Figure 7.
Manufacturing schedules of Case 1 to Case 3.
However, the manufacturing schedules of the three cases also have common features. For interruptible processes such as anode manufacturing, cathode manufacturing and cell assembly, they are primarily adjusted based on TOU pricing. Production is increased during off-peak hours and reduced or halted during peak hours. For non-interruptible processes, including preparation of lithium iron phosphate and graphite, electrode drying, formation, and aging, high investment costs for production equipment necessitate minimizing equipment investment, leading to generally stable production.
The process loads of each case are shown in Figure 8. Compared to Case 4, the electrical loads of the other cases show two valleys, during 9:00 AM to 12:00 AM and 4:00 PM to 7:00 PM, respectively. This is consistent with the two peaks of the TOU pricing. That is to say, process scheduling can better enable production loads to respond to TOU pricing, resulting in significant savings in electricity costs. Compared with Case 3, the peak-to-valley difference between the electrical loads in Case 1 and Case 2 is larger, which indicates that the energy recover strategy can better supply peak loads. Additionally, due to the coupled electric heat–cooling nature of the processes, the heating and cooling loads also exhibit characteristics similar to those of the electric loads.
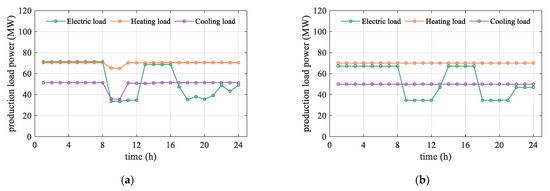
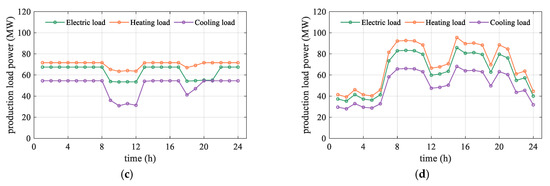
Figure 8.
Processes load: (a) Case 1; (b) Case 2; (c) Case 3; (d) Case 4.
- 2.
- Multi-energy bus balance
The system’s balance of electricity, heat, cooling, nitrogen, and oxygen-enriched buses is shown in Appendix A, Figure A1. The energy recover strategy significantly enhances the economic efficiency of the production process by leveraging lower electricity costs during off-peak periods. As illustrated in Figure A1a, the primary sources of electricity for the system include WT/PV output, electricity purchases, CHP electric output, and recovered electricity from the formation process. Major electricity demands encompass production power, EB, PSA, and CCS. Due to the influence of TOU pricing, two peak electricity consumption periods occur from 1:00 to 8:00 and 13:00 to 17:00. During high-price periods, the system reduces electricity purchases and utilizes stored energy from BT to meet power demands. As shown in Figure A1b, the system’s heat energy primarily supplies the thermal requirements of the lithium battery production process, such as anode manufacturing, cathode manufacturing, anode drying, cathode drying and aging, as well as the thermal needs of auxiliary production equipment (e.g., dehumidifiers) and non-production areas. The primary sources of heat are CHP units, FB, and EB. Figure A1c shows that the system’s cooling demand is primarily met by EC, with AC as a supplementary source. As depicted in Figure A1d, the PSA nitrogen generator, which supplies nitrogen for production processes, frequently operates at full capacity. Additionally, a 182,559 m3 nitrogen storage tank allows for increased nitrogen production during low electricity price periods to meet high-demand periods. Figure A1e illustrated that oxygen is sourced from the PSA tail gas recovery unit, providing a stable concentration of approximately 30%, suitable for oxygen-enriched combustion in CHP and FB. CHP consumes more oxygen overall, and an OST with a capacity of 2117 m3 is employed to balance supply and demand peaks and troughs.
- 3.
- Output of key equipment
Figure 9 and Figure 10 depict the output composition of CHP and FB. Within the CHP units, both coal-fired CHP and bio-fired CHP operate at full capacity throughout. This is because CHP operates in a heat-first mode in this paper where the thermal-to-electric ratio of coal/bio-fired CHP is higher than that of ng-fired CHP, prioritizing output to meet thermal demands. Regarding FB, bio-fired FB’s thermal efficiency is 0.9, surpassing coal-fired FB’s 0.6. Moreover, biomass fuels can achieve “negative carbon emissions” when combined with CCS to qualify for carbon trading subsidies, placing its output priority at the highest level, operating at full capacity for most periods.
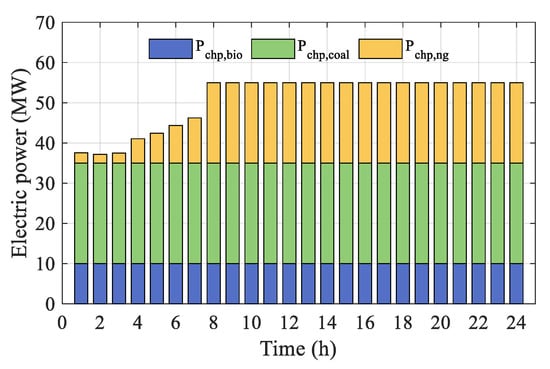
Figure 9.
Electrical power of CHP, Case 1.
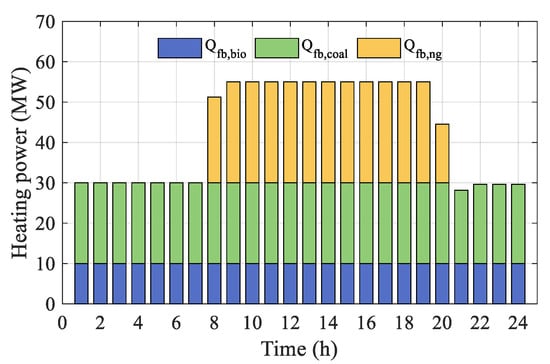
Figure 10.
Heating power of FB, Case 1.
- 4.
- Carbon capture status
The paper considers the impact of oxygen-enriched combustion in CHP and FB on the maximum carbon capture level of CCS. If oxygen-enriched combustion is employed, the maximum carbon capture level reaches 95%; otherwise, it remains at 90%. The oxygen-enriched combustion and carbon capture status for the three types of CHP and FB are illustrated in Figure 11. Among the CHP units, coal-fired CHP exhibits the highest carbon emission intensity, making it a priority candidate for oxygen-enriched combustion. Similarly, among FB units, coal-fired FB has the highest carbon emission intensity and is prioritized for oxygen-enriched combustion. Oxygen-enriched combustion in bio-fired CHP/FB can enhance negative carbon emission reward. In Case 1, negative carbon emission reward reaches CNY 65,207.04 million, significantly aiding in decarbonizing lithium battery production.
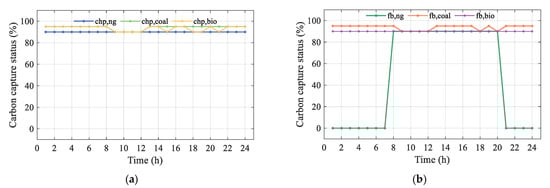
Figure 11.
Bus balance for each energy flow: (a) CHP; (b) FB.
4.4. Multi-Criteria Decision Analysis
Based on the comprehensive experimental results and analysis presented above, this section employs MCDA to conduct a systematic evaluation of the four cases and identify the optimal solution.
The specific evaluation criteria and their weights are presented in Table 3. Based on the characteristics of lithium battery manufacturing decarbonization and the requirements of industrial energy system planning, the criteria selection follows three fundamental principles: (1) alignment with decarbonization objectives; (2) consideration of industrial feasibility; (3) quantitative measurability from case study results. The criterion weights are determined through a hybrid approach combining the Analytic Hierarchy Process (AHP) with industrial expert consultation and literature review.
Table 3.
MCDA evaluation criteria system.
Subsequently, the TOPSIS (Technique for Order Preference by Similarity to Ideal Solution) method [45] is adopted due to its effectiveness in handling multiple conflicting criteria and its wide acceptance in energy system planning studies. Following the TOPSIS normalization and weighting procedures, the weighted normalized performance matrix is obtained. Table 4 shows the key intermediate results including the positive ideal solution (PIS) and negative ideal solution (NIS). The final MCDA evaluation results are presented in Table 5.
Table 4.
Weighted normalized matrix and ideal solutions.
Table 5.
MCDA evaluation results and ranking.
The comprehensive MCDA evaluation unequivocally identifies Case 1, which combines process scheduling with battery recovery technology, as the optimal solution among the four evaluated cases. Both Case 1 and Case 2 demonstrate competitive performance levels due to their incorporation of process scheduling optimization, with Case 1’s battery recycling technology (60% recovery efficiency) providing additional advantages over Case 2’s heat recovery approach (40% recovery efficiency). Case 3 exhibits a moderate performance level with a closeness coefficient of 0.665, as it benefits from process scheduling but lacks energy recovery mechanisms during the formation discharge process. Case 4, serving as the baseline scenario without process scheduling consideration, exhibits significantly lower performance.
5. Conclusions
To support low-carbon transitions in industry and transport, this paper models and plans an IIES for lithium battery manufacturing and proposes a planning methodology that incorporates process scheduling. By lowering the battery manufacturing cost, it holds substantial potential for reducing the lifetime levelized cost of energy (LCOE) of downstream energy storage systems. The conclusions of this paper are as follows:
- A lithium battery energy–carbon material flow model was developed considering delays in process production and intermediate product storage. This model accurately depicts schedulable processes, providing a realistic reflection of actual production activities and laying the foundation for the planning of lithium battery IIES.
- By considering process scheduling, the proposed planning methodology for lithium battery IIES effectively taps into the adjustable potential of lithium battery production. It can respond efficiently to time-of-use electricity pricing by adjusting production schedules, smoothing production loads, and reducing the need for equipment (especially storage equipment), cutting total system costs by 19.4%, with the closeness coefficient under MCDA increasing from 0.257 to 0.665.
- Given the high energy consumption of the formation stage, this study introduces energy recovery pathways. The battery recovery method achieves an additional cost reduction of 30.2%, which is 6.1 percentage points higher than the heat recovery method’s 24.1%, delivering superior economic performance. The MCDA further demonstrates that the integration of battery recovery with process scheduling achieves a closeness coefficient of 0.919, significantly outperforming the other three cases and representing the optimal balance between economic efficiency and environmental sustainability.
- Recovering oxygen-rich PSA tail gas reduces oxygen costs and enables oxygen-enriched combustion with CCS. With oxygen-enriched operation, the maximum CCS capture level increases from 90% to 95%, effectively reducing system carbon emissions. In Case 1, the negative carbon reward reaches CNY 652,070,400, and the carbon tax falls to 40.5% of the baseline (Case 4).
However, the modeling and planning research for lithium battery integrated energy systems presented in this manuscript still exhibits several limitations. Future work should pursue more in-depth investigations in the following areas:
- The planning methodology adopts perfect foresight assumptions without considering operational uncertainties and employs typical-day representation, which may inadequately capture seasonal variations and long-term trends. Future research should develop stochastic optimization frameworks accounting for renewable variability, demand uncertainties, and price fluctuations.
- The system model simplifies the production chain into continuous and discontinuous processes without capturing complex interdependencies, and limits energy recovery to two mature pathways with fixed efficiencies. Future research should integrate detailed process models, explore advanced energy recovery technologies, and develop multi-objective optimization frameworks.
- The case study focuses solely on LFP battery manufacturing without addressing other chemistries (NCM, NCA) or different production scales. Future investigations should extend the framework to diverse battery chemistries and production capacities, establishing scalable methodologies for heterogeneous manufacturing processes.
Author Contributions
Conceptualization, A.C. and Y.Q.; methodology, A.C. and R.L.; software, W.Z. and P.X.; validation, B.Y. and G.L.; writing—original draft preparation, A.C. and Y.Q.; writing—review and editing, Y.W., S.Z. and Z.L. All authors have read and agreed to the published version of the manuscript.
Funding
This research was funded by the Science and Technology Project of State Grid Corporation of China, grant number 1400-202457293A-1-1-ZN71804062, as well as the project “Research on the Planning and Operation of a Generalized Integrated Energy System Incorporating Energy and Heavy-Duty Transportation” supported by the Jiangsu Province Higher Education Institutions Basic Science (Natural Science) Research Fund.
Data Availability Statement
The original contributions presented in this study are included in the article. Further inquiries can be directed to the corresponding author(s).
Conflicts of Interest
Author Anlan Chen, Yue Qiu, Ruonan Li, Wennan Zhuang, Zhizhen Li, Suyang Zhou declare no conflicts of interest. Author Peng Xia, Bo Yuan, Gang Lu are employed by the company “State Grid Energy Research Institute Co., Ltd.”. Author Yingxiang Wang is employed by the company “Economic and Technological Research Institute of State Grid Hubei Electric Power Co., Ltd.”. These authors declare that the research was conducted in the absence of any commercial or financial relationships that could beconstrued as a potential conflict of interest.
Appendix A


Figure A1.
Bus balance for each energy flow: (a) electrical bus; (b) heat bus; (c) cooling bus; (d) nitrogen bus; (e) oxygen-enriched bus.
Appendix B
Table A1.
Factory fixed load.
Table A1.
Factory fixed load.
| Time (h) | Summer Typical Day (MW) | Transitional Season (Spring/Autumn) (MW) | Winter Typical Day (MW) | ||||||
|---|---|---|---|---|---|---|---|---|---|
| Power | Heating | Cooling | Power | Heating | Cooling | Power | Heating | Cooling | |
| 1 | 0.32588 | 0.13484 | 0.17387 | 9.24158 | 1.67117 | 1.63610 | 8.65017 | 6.09279 | 0.82512 |
| 2 | 0.15018 | 0.12886 | 0.17796 | 3.93350 | 1.77015 | 1.70645 | 3.34208 | 6.15369 | 0.82809 |
| 3 | 0.16346 | 0.12886 | 0.18205 | 4.47965 | 1.73026 | 1.77679 | 3.88823 | 6.08714 | 0.82544 |
| 4 | 0.27674 | 0.15448 | 0.18615 | 7.96857 | 1.79621 | 1.84714 | 7.37716 | 6.05280 | 0.82833 |
| 5 | 0.28013 | 0.15442 | 0.20272 | 7.93137 | 1.80671 | 2.13196 | 7.33996 | 6.19883 | 0.83368 |
| 6 | 0.29286 | 0.16118 | 0.21566 | 8.07599 | 2.09914 | 2.35419 | 7.36629 | 6.07910 | 0.83082 |
| 7 | 0.28354 | 0.16076 | 0.23893 | 6.85023 | 3.13749 | 2.75398 | 6.14053 | 5.97074 | 0.96024 |
| 8 | 0.45247 | 0.39975 | 0.30419 | 11.91805 | 3.67880 | 3.10024 | 11.20835 | 4.94652 | 1.53924 |
| 9 | 0.54670 | 0.54300 | 0.37906 | 14.74507 | 3.71767 | 3.69703 | 14.03537 | 5.08340 | 1.85076 |
| 10 | 0.56176 | 0.56611 | 0.42183 | 15.19675 | 3.74291 | 4.28489 | 14.48705 | 5.12417 | 2.07694 |
| 11 | 0.46371 | 0.54122 | 0.42937 | 12.72856 | 3.78326 | 4.38854 | 12.01886 | 5.03220 | 2.35930 |
| 12 | 0.47994 | 0.54937 | 0.44100 | 13.21548 | 3.72378 | 4.54844 | 12.50578 | 4.94449 | 2.39306 |
| 13 | 0.56557 | 0.53597 | 0.44919 | 15.42934 | 3.76787 | 4.66102 | 14.71965 | 5.06609 | 2.40171 |
| 14 | 0.55591 | 0.55383 | 0.44510 | 15.16322 | 3.81438 | 4.60474 | 14.45352 | 4.20648 | 2.40414 |
| 15 | 0.56001 | 0.53964 | 0.44228 | 15.38103 | 3.71394 | 4.56595 | 14.67133 | 4.19068 | 2.39276 |
| 16 | 0.40360 | 0.54554 | 0.43821 | 10.68854 | 3.63536 | 4.51002 | 9.97884 | 4.18629 | 2.38279 |
| 17 | 0.40521 | 0.51080 | 0.41838 | 10.73699 | 3.61823 | 4.23754 | 10.02729 | 5.12107 | 2.38279 |
| 18 | 0.43233 | 0.49563 | 0.37185 | 12.02370 | 3.61603 | 3.59786 | 11.31400 | 5.11572 | 2.36855 |
| 19 | 0.38807 | 0.50154 | 0.27383 | 10.93236 | 3.31138 | 2.68297 | 10.22266 | 5.17791 | 2.21199 |
| 20 | 0.46790 | 0.38922 | 0.21910 | 13.56385 | 2.41141 | 2.44041 | 12.85415 | 5.14159 | 1.62310 |
| 21 | 0.42163 | 0.16965 | 0.19174 | 11.22954 | 1.82857 | 1.94322 | 10.51984 | 4.96590 | 0.89911 |
| 22 | 0.40266 | 0.14147 | 0.18010 | 10.42378 | 1.86196 | 1.74331 | 9.71409 | 5.02169 | 0.82371 |
| 23 | 0.38438 | 0.13891 | 0.17619 | 9.87538 | 1.88014 | 1.67607 | 9.16568 | 5.12308 | 0.81914 |
| 24 | 0.28142 | 0.12727 | 0.17387 | 7.96934 | 1.82084 | 1.63610 | 7.25964 | 5.16140 | 0.81941 |
Table A2.
Process production parameters.
Table A2.
Process production parameters.
| Number | Process Name | Production Investment (k¥/MWh) | Production Investment (Cap/MWh) | Storage Investment (Cap/MWh) | Maximum Production (per Unit) |
|---|---|---|---|---|---|
| 1 | Lithium iron phosphate preparation | 10,000 | 500 | 100 | 25 t |
| 2 | Graphite preparation | 13,300 | 500 | 100 | 25 t |
| 3 | Anode manufacturing | 443,800 | 500 | 100 | m2/h |
| 4 | Cathode manufacturing | 443,800 | 500 | 100 | m2/h |
| 5 | Anode drying | 32,300 | 500 | 100 | m2/h |
| 6 | Cathode drying | 32,300 | 500 | 100 | m2/h |
| 7 | Cell assembly | 7740 | 500 | 100 | per/h |
| 8 | Formation charge | 8070 | 500 | 100 | per/h |
| 9 | Formation discharge | 1000 | 500 | 100 | per/h |
| 10 | Aging | 22,180 | 500 | 100 | per/h |
Table A3.
Maximum installed capacity of equipment.
Table A3.
Maximum installed capacity of equipment.
| Equipment | Value |
|---|---|
| Wind Turbine (Quantity, unit) | 80 |
| Photovoltaic (Area, m2) | 400,000 |
| Electric Boiler EB (Power, MW) | 100 |
| Electric Chiller EC (Power, MW) | 50 |
| Absorption Chiller AC (Power, MW) | 100 |
| Oxygen Storage Tank OST (Capacity, m3) | 150,000 |
| Battery BT (Capacity, MWh) | 60 |
| Carbon Capture, Compression, and Purification Unit CPU (Power, MW) | 15 |
| Pressure Swing Adsorption Nitrogen Generation Unit PSAN (Capacity, m3) | 4,000,000 |
| Nitrogen Storage Tank NST (Capacity, m3) | 300,000 |
| CHP_NG Unit (Power, MW) | 20 |
| CHP_coal Unit (Power, MW) | 25 |
| CHP_bio Unit (Power, MW) | 10 |
| Gas-fired Boiler FB_NG (Power, MW) | 25 |
| Gas-fired Boiler FB_coal (Power, MW) | 20 |
| Gas-fired Boiler FB_bio (Power, MW) | 10 |
Table A4.
Cell battery parameters.
Table A4.
Cell battery parameters.
| Model | CB310 |
| Nominal Voltage (V) | 3.2 |
| Rated Capacity (Ah) | 280 |
| Nominal Energy (kWh) | 0.896 |
| State of Charge (SOC) at Shipment | 0.4 |
| Self-discharge Rate (/day) | 0.001 |
| Cell Weight (kg) | 5.34 |
| Cell Dimensions (mm) | 173.9 |
| Standard Charge Power (kW) | 0.224 |
| Standard Discharge Power (kW) | 0.224 |
Table A5.
Economic parameters of key equipment.
Table A5.
Economic parameters of key equipment.
| Number | Equipment Name | Unit Investment Cost | Unit | Unit Operation & Maintenance Cost | Unit |
|---|---|---|---|---|---|
| 1 | Wind Turbine | 8970 | k¥/MW | 0.02 | k¥/MWh |
| 2 | Photovoltaic | 6630 | k¥/MW | 0.02 | k¥/MWh |
| 3 | Natural Gas-driven CHP | 2540 | k¥/MW | 0.01 | k¥/MWh |
| 4 | Coal-driven CHP | 1500 | k¥/MW | 0.01 | k¥/MWh |
| 5 | Biomass-driven CHP | 9500 | k¥/MW | 0.01 | k¥/MWh |
| 6 | Gas Turbine | 264 | k¥/MW | 0.01 | k¥/MWh |
| 7 | Coal-fired Turbine | 184 | k¥/MW | 0.01 | k¥/MWh |
| 8 | Biomass Turbine | 278 | k¥/MW | 0.01 | k¥/MWh |
| 9 | Electric Boiler | 750 | k¥/MW | 0.01 | k¥/MWh |
| 10 | Electric Chiller | 800 | k¥/MW | 0.01 | k¥/MWh |
| 11 | Absorption Chiller | 2000 | k¥/MW | 0.01 | k¥/MWh |
| 12 | Oxygen Storage Tank | 40 | ¥/m3 | 0.005 | ¥/m3 |
| 13 | Nitrogen Storage Tank | 45 | ¥/m3 | 0.005 | ¥/m3 |
| 14 | Hydrogen Storage Tank | 80 | ¥/m3 | 0.005 | ¥/m3 |
| 15 | Battery Storage | 950 | k¥/MWh | 0.05 | k¥/m3 |
| 16 | Nitrogen Generator | 0.35 | k¥/m3 | 0.84 | k¥/m3 |
Table A6.
Carbon emission reduction costs.
Table A6.
Carbon emission reduction costs.
| Equipment/Technology | Price | Unit | |
|---|---|---|---|
| The Carbon Capture Compression and Purification Unit | Investment Cost | 1810 | k¥/MW |
| Operating Cost | 0.01 | k¥/MWh | |
| Battery Recycling Technology | 4400 | k¥/MWh | |
| Waste Heat Recovery Technology | 3400 | k¥/MWh | |
References
- Rottoli, M.; Dirnaichner, A.; Pietzcker, R.; Schreyer, F.; Luderer, G. Alternative electrification pathways for light-duty vehicles in the European transport sector. Transp. Res. Part Transp. Environ. 2021, 99, 103005. [Google Scholar] [CrossRef]
- IEA. Global EV Outlook 2024. Available online: https://iea.blob.core.windows.net/assets/a9e3544b-0b12-4e15-b407-65f5c8ce1b5f/GlobalEVOutlook2024.pdf (accessed on 12 January 2025).
- Degen, F.; Winter, M.; Bendig, D.; Tübke, J. Energy consumption of current and future production of lithium-ion and post lithium-ion battery cells. Nat. Energy 2023, 8, 1284–1295. [Google Scholar] [CrossRef]
- Degen, F.; Schütte, M. Life cycle assessment of the energy consumption and GHG emissions of state-of-the-art automotive battery cell production. J. Clean. Prod. 2022, 330. [Google Scholar] [CrossRef]
- Liu, Y.; Zhang, R.; Wang, J.; Wang, Y. Current and future lithium-ion battery manufacturing. iScience 2021, 24, 102332. [Google Scholar] [CrossRef] [PubMed]
- Guan, A.; Zhou, S.; Gu, W.; Lu, S.; Zhao, A.P.; Zhang, X.-P. Thermal Dynamic Embedded Contingency Analysis for Heat-Electrical Integrated Energy System. IEEE Trans. Sustain. Energy 2024, 16, 1518–1530. [Google Scholar] [CrossRef]
- Sun, X.; Luo, X.; Zhang, Z.; Meng, F.; Yang, J. Life cycle assessment of lithium nickel cobalt manganese oxide (NCM) batteries for electric passenger vehicles. J. Clean. Prod. 2020, 273, 123006. [Google Scholar] [CrossRef]
- Degen, F. Lithium-ion battery cell production in Europe: Scenarios for reducing energy consumption and greenhouse gas emissions until 2030. J. Ind. Ecol. 2023, 27, 964–976. [Google Scholar] [CrossRef]
- Chordia, M.; Nordelöf, A.; Ellingsen, L.A.-W. Environmental life cycle implications of upscaling lithium-ion battery production. Int. J. Life Cycle Assess. 2021, 26, 2024–2039. [Google Scholar] [CrossRef]
- Preparation Method for Anode Material of Lithium Ion Battery, Involves Heating Mixture in Inert Gas Atmosphere at Predetermined Temperature, and Splitting, Crushing and Sieving It in Inert Gas Atmosphere. Available online: https://webofscience.clarivate.cn/wos/alldb/full-record/DIIDW:2011J84854 (accessed on 13 June 2024).
- Guan, A.; Zhou, S.; Gu, W.; Wu, Z.; Ai, X.; Fang, J.; Zhang, X.-P. A Dynamic Model-Based Minute-Level Optimal Operation Strategy for Alkaline Electrolyzers in Wind-Hydrogen Systems. IEEE Trans. Sustain. Energy 2025, 16, 2157–2170. [Google Scholar] [CrossRef]
- Du, Y.; Xiao, H.; Yang, Z.; Shi, W.; Wang, B.; Yu, Y. Investigation and analysis on energy consumption of a power lithium battery plant, Heat. Vent. Air Cond. 2022, 52, 88–93. [Google Scholar] [CrossRef]
- Zhang, S.; Hu, B.; Qiu, Y.; Hua, B.; Sun, D.; Nian, H. Asymmetrical Fault Ride-Through Enhancement for DFIG-based WT Based on Sequence Coupling Analysis. IEEE Trans. Ind. Electron. 2025; early access. [Google Scholar] [CrossRef]
- A Critical Survey of Integrated Energy System: Summaries, Methodologies and Analysis—ScienceDirect. Available online: https://www.sciencedirect.com/science/article/pii/S0196890422006598 (accessed on 6 January 2025).
- Guan, A.; Zhou, S.; Gu, W.; Wu, Z.; Gao, M.; Liu, H.; Zhang, X.-P. Dynamic Simulation and Parameter Calibration-Based Experimental Digital Twin Platform for Heat-Electric Coupled System. IEEE Trans. Sustain. Energy 2025. [Google Scholar] [CrossRef]
- Mu, C.; Ding, T.; Sun, Y.; Cheng, L.; Su, X. An Operation Scheduling Model for Carbon Neutrality in Industrial Integrated Energy System. In Proceedings of the 2021 6th International Conference on Power and Renewable Energy (ICPRE), Shanghai, China, 17–20 September 2021; pp. 824–829. [Google Scholar] [CrossRef]
- Guo, Z.; Zhou, S. Modeling and multi-stage planning of cement-iies considering carbon-green certificate trading. Processes 2023, 11, 1219. [Google Scholar] [CrossRef]
- Banihabib, R.; Assadi, M. Towards a low-carbon future for offshore oil and gas industry: A smart integrated energy management system with floating wind turbines and gas turbines. J. Clean. Prod. 2023, 423, 138742. [Google Scholar] [CrossRef]
- Han, Z.; Zhang, X.; Zhang, H.; Zhao, J.; Wang, W. A hybrid granular-evolutionary computing method for cooperative scheduling optimization on integrated energy system in steel industry. Swarm Evol. Comput. 2022, 73, 101123. [Google Scholar] [CrossRef]
- Ademollo, A.; Mati, A.; Pagliai, M.; Carcasci, C. Exploring the role of hydrogen in decarbonizing energy-intensive industries: A techno-economic analysis of a solid oxide fuel cell cogeneration system. J. Clean. Prod. 2024, 469, 143254. [Google Scholar] [CrossRef]
- Liu, J.; Li, R.; Wu, T. Short-term multi-objective optimal scheduling of the integrated power grid-abandoned coal mine energy system. Results Eng. 2024, 22, 102103. [Google Scholar] [CrossRef]
- Yang, W.; Fan, R.; Jin, A.; Cheng, M. Review and modeling: Approach to low-carbonize the whole industry chains of integrated energy systems. Energy Rep. 2023, 9, 176–188. [Google Scholar] [CrossRef]
- Wu, X.; Xi, H.; Qiu, R.; Lee, K.Y. Low carbon optimal planning of the steel mill gas utilization system. Appl. Energy 2023, 343, 121154. [Google Scholar] [CrossRef]
- Yang, F.; Meng, F.; Qiu, Y.; Zhou, S.; Zhuang, W.; Liu, H.; Gu, W.; Yang, Y. Multi-dimensional assessment of decarbonization technologies and pathways in China’s iron and steel industry: An energy-process chain perspective. Energy Strat. Rev. 2025, 61, 101810. [Google Scholar] [CrossRef]
- Zhang, Y.; Wang, X.; Xu, Y.; He, J.; Sun, W.; Li, Z.; Wu, G. Optimization of Off-grid Industrial Park Integrated Energy System Considering Production Process. In Proceedings of the 2020 IEEE Power & Energy Society General Meeting (PESGM), Montreal, QC, Canada, 2–6 August 2020; IEEE: New York, NY, USA, 2020. Available online: https://webofscience.clarivate.cn/wos/woscc/full-record/WOS:000679246601024 (accessed on 13 June 2024).
- Distributed Dispatch of Multiple Energy Systems Considering Carbon Trading. CSEE J. Power Energy Syst. 2023, 9, 459–469. [CrossRef]
- Tian, J.; Huang, B.; Wang, Q.; Du, P.; Zhang, Y.; He, B. A Multi-agent integrated energy trading strategy based on carbon emission/green certificate equivalence interaction. Sustainability 2023, 15, 15766. [Google Scholar] [CrossRef]
- Amiri, A.; Vaseghi, M.R. Waste Heat Recovery Power Generation Systems for Cement Production Process. In IEEE Transactions on Industry Applications; IEEE: New York, NY, USA. [CrossRef]
- Xia, L.; Liu, R.; Zeng, Y.; Zhou, P.; Liu, J.; Cao, X.; Xiang, S. A review of low-temperature heat recovery technologies for industry processes. Chin. J. Chem. Eng. 2019, 27, 2227–2237. [Google Scholar] [CrossRef]
- Liang, T.; Chai, L.; Tan, J.; Jing, Y.; Lv, L. Dynamic optimization of an integrated energy system with carbon capture and power-to-gas interconnection: A deep reinforcement learning-based scheduling strategy. Appl. Energy 2024, 367, 123390. [Google Scholar] [CrossRef]
- Khalid, Y.; Wu, M.; Silaen, A.; Martinez, F.; Okosun, T.; Worl, B.; Low, J.; Zhou, C.; Johnson, K.; White, D. Oxygen enrichment combustion to reduce fossil energy consumption and emissions in hot rolling steel production. J. Clean. Prod. 2021, 320, 128714. [Google Scholar] [CrossRef]
- Zhong, Z.; Fang, J.; Hu, K.; Huang, D.; Ai, X.; Yang, X.; Wen, J.; Pan, Y.; Cheng, S. Power-to-Hydrogen by Electrolysis in Carbon Neutrality: Technology Overview and Future Development. CSEE J. Power Energy Syst. 2023, 9, 1266–1283. [Google Scholar] [CrossRef]
- Irshad, A.S.; Ueda, S.; Furukakoi, M.; Zakir, M.N.; Ludin, G.A.; Elkholy, M.; Yona, A.; Elias, S.; Senjyu, T. Novel integration and optimization of reliable photovoltaic and biomass integrated system for rural electrification. Energy Rep. 2024, 11, 4924–4939. [Google Scholar] [CrossRef]
- Abdalla, A.N.; Nazir, M.S.; Tao, H.; Cao, S.; Ji, R.; Jiang, M.; Yao, L. Integration of energy storage system and renewable energy sources based on artificial intelligence: An overview. J. Energy Storage 2021, 40, 102811. [Google Scholar] [CrossRef]
- Wan, Y.; Wang, N.; Liu, X.; Wang, Y.; Blaabjerg, F.; Chen, Z. Inertia-emulation-based fast frequency response from EVs: A multi-level framework with game-theoretic incentives and DRL. IEEE Trans. Smart Grid, 2025; early access. [Google Scholar] [CrossRef]
- Nitrogen Generator Having a Function of Recovering Oxygen-Enriched Gas, Comprises a First Adsorption Column, a Second Adsorption Column and a Silencer, Which Are Connected via Pipeline. Available online: https://webofscience.clarivate.cn/wos/alldb/full-record/DIIDW:201545716M (accessed on 13 June 2024).
- Yang, S.; Zhu, C. Steel rolling process oxygen-enriched exhaust gas recycling nitrogen making machine applied in the study of oxygen-enriched combustion furnace. Energy Metall. Ind. 2017, 36, 27–28. [Google Scholar]
- Ministry of Ecology and Environment of the People’s Republic of China, National Bureau of Statistics, and National Energy Administration. Announcement on the Release of 2023 Power Carbon Footprint Factor Data, Announcement No. 3. 17 January 2025. Available online: https://www.mee.gov.cn/xxgk2018/xxgk/xxgk01/202501/t20250123_1101226.html (accessed on 23 September 2025).
- Hu, S.; Yang, B. Power Efficient Battery Formation, Analog Devices Technical Article. 2019. Available online: https://www.analog.com/en/resources/technical-articles/power-efficient-battery-formation.html (accessed on 15 January 2025).
- Jouhara, H.; Khordehgah, N.; Almahmoud, S.; Delpech, B.; Chauhan, A.; Tassou, S.A. Waste heat recovery technologies and applications. Therm. Sci. Eng. Prog. 2018, 6, 268–289. [Google Scholar] [CrossRef]
- Gaines, L.; Sullivan, J.; Burnham, A.; Belharouak, I. Life-cycle analysis for lithium-ion battery production and recycling. In Proceedings of the Transportation Research Board 90th Annual Meeting, Washington, DC, USA, 23–27 January 2011; pp. 23–27. [Google Scholar]
- Zackrisson, M.; Fransson, K.; Hildenbrand, J.; Lampic, G.; O’DWyer, C. Life cycle assessment of lithium-air battery cells. J. Clean. Prod. 2016, 135, 299–311. [Google Scholar] [CrossRef]
- Dai, Q.; Kelly, J.C.; Gaines, L.; Wang, M. Life cycle analysis of lithium-ion batteries for automotive applications. Batteries 2019, 5, 48. [Google Scholar] [CrossRef]
- Ellingsen, L.A.; Majeau-Bettez, G.; Singh, B.; Srivastava, A.K.; Valøen, L.O.; Strømman, A.H. Life cycle assessment of a lithium-ion battery vehicle pack. J. Ind. Ecol. 2013, 18, 113–124. [Google Scholar] [CrossRef]
- Hwang, C.-L.; Lai, Y.-J.; Liu, T.-Y. A new approach for multiple objective decision making. Comput. Oper. Res. 1993, 20, 889–899. [Google Scholar] [CrossRef]
Disclaimer/Publisher’s Note: The statements, opinions and data contained in all publications are solely those of the individual author(s) and contributor(s) and not of MDPI and/or the editor(s). MDPI and/or the editor(s) disclaim responsibility for any injury to people or property resulting from any ideas, methods, instructions or products referred to in the content. |
© 2025 by the authors. Licensee MDPI, Basel, Switzerland. This article is an open access article distributed under the terms and conditions of the Creative Commons Attribution (CC BY) license (https://creativecommons.org/licenses/by/4.0/).