Article

Ultimate Bearing Simulation of an 80 MN Compression–Shear–Torsion Multifunctional Bridge Bearing Testing Machine with a Plate-Column Composite Frame

1
School of Traffic Engineering, Henan Vocational College of Water Conservancy and Environment, Zhengzhou 450008, China
2
School of Computer Science and Artificial Intelligence, Zhengzhou University, Zhengzhou 450001, China
3
Henan Engineering Technology Research Center of Infrastructure Intelligent Detection Technology and Equipment, Henan Jiaoyuan Engineering Technology Group Co., Ltd., Zhengzhou 450005, China
*
Authors to whom correspondence should be addressed.
Processes 2025, 13(10), 3331; https://doi.org/10.3390/pr13103331
Submission received: 23 September 2025 / Revised: 13 October 2025 / Accepted: 15 October 2025 / Published: 17 October 2025

Abstract

Due to the existing shortcomings of small load and few functions in the current bridge bearing testing machine, a compression–shear–torsion multifunctional bridge bearing testing machine with a maximum vertical load of 80 MN is designed. It can enable five loading tests: static vertical compression, static double compression-shear, static single compression-shear, dynamic single compression-shear, and static compression-torsion. To ensure that the testing machine meets the strength and stiffness requirements under the above five ultimate loading conditions, a plate-column composite frame with lateral reaction plates is introduced. Next, the loading states of the bridge bearing and the testing machine under vertical compression, double compression-shear, single compression-shear, and compression-torsion are analyzed. On this basis, five ultimate loading simulations of this testing machine are carried out, respectively, and then compared with those of the traditional testing machine with a sole-column frame. The results show that because the lateral reaction plates increase the bearing area in the vertical direction and bear the load in the shear direction, the maximum stress position is successfully transferred from the high-cost columns to the low-cost lateral reaction plates, and both the maximum stress and the maximum displacement are decreased after introducing the lateral reaction plates. The lateral reaction plates have a great promoting effect on single compression-shear. During ultimate static single compression-shear and dynamic single compression-shear, the maximum total stress of the whole machine is reduced by 18.8% and 24.4%, respectively, and the maximum displacement of the whole machine is reduced by up to 72.5% and 75.0%, respectively. Under the five ultimate loading conditions, this testing machine meets the strength and stiffness requirements, indicating that it can bear the five ultimate loading tests and withstand an ultimate vertical load of 80 MN.

1. Introduction

Bridge bearings are supporting components with rubber as the core material. They are mainly used for transferring the structural loads and adapting to vibration, displacement, and seismic effects [1,2,3,4,5,6]. At present, bridge bearings no longer solely bear a single load from a certain direction. Instead, they need to bear multiple loads from different directions [7,8,9,10] and have to bear increasingly larger loads [11]. Therefore, for the compression-shear testing machine used to detect bridge bearings, large bearing capacity and multi-function requirements are put forward. Meanwhile, it is necessary to ensure that the testing machine can still meet the strength and stiffness requirements under the ultimate loading conditions. However, the current compression-shear testing machines have shortcomings of a small load capacity and few functions. Consequently, scholars have designed various types of compression-shear testing machines and then conducted mechanical analysis on them.
Wang et al. [12] carried out multi-objective topology optimization on the column of a 12 MN electro-hydraulic servo testing machine. The results indicate that after optimization, the weight of the column is decreased by 6.58%, and the first-order natural frequency and maximum deformation of the column are within the allowable range. Wu et al. [13] designed a 20 MN compression-shear testing machine, which can conduct vertical compression tests and single compression-shear tests on bridge bearings. To ensure strength and stiffness, static simulation and modal simulation are performed on the main frame. Yan et al. [14] proposed a 35 MN hydraulic press with a three-dimensional vertical arrangement, improved the energy efficiency of the hydraulic press by 20.0%, and reduced the average energy consumption of the pipeline-valve system by 65%. Xu et al. [15] designed a 50 MN compression-shear testing machine and conducted mechanical simulation on the upper beam and lower base using SolidWorks 2014 software. The results show that both meet the strength and stiffness requirements. Wu et al. [16] designed the main structure of a 50 MN compression-shear testing machine and conducted static simulation using Abaqus 2021 software. The results show that both the stress and deformation meet the design specifications. Zahalka [17] conducted a modal analysis of a 50 MN hydraulic press with a double-column frame, which was excited by a time-dependent work force. The simulation results are compared with measurements in the real condition. Wang et al. [18] designed a 60 MN compression-shear testing machine and conducted static simulation and modal simulation on the frame using ANSYS 2021 software. The results show that the frame meets the strength and stiffness requirements. Wu et al. [19] designed a 60 MN compression-shear testing machine frame and carried out the topology optimization by the variable density method. The results indicate that after topology optimization, the weight of the frame was decreased by 14.5% while still meeting the strength and stiffness requirements. Li et al. [20] conducted mechanical simulation and topology optimization on the frame of a 60 MN compression-shear testing machine. The results show that the frame after topology optimization still meets the strength and stiffness requirements. Zhang et al. [21] designed a 60 MN static and dynamic compression-shear testing machine and proposed a variable theory domain fuzzy PID control system. The results show that the system has no overshoot, no shock, and a shorter stability time. The error of the experimental displacement is within ±0.05%, and the error of the experimental force is within ±1%. Jadhav et al. [22] developed a bench-top biaxial tensile testing machine, which can conduct static and dynamic multi-axial loading and can be used to test bridge bearings. Oance et al. [23] proposed a tension and compression testing machine to easily obtain the mechanical behavior of different materials and components. Aydın et al. [24] designed a hydraulic press with four columns. For the four columns, six different cross sections were designed. Regarding the press head, three different models were designed. Additionally, three different loading conditions, namely axial, eccentric, and oblique, were conducted. Han et al. [25] simulated the plate-type hydroforming hydraulic press to obtain the stress and deformation under the ultimate loading condition. The results show that under the ultimate loading condition, the stress remains within the allowable range, and the stiffness meets the design requirements. In view of the deformation under the compression-shear process, Shan et al. [26] designed a large-scale compression-shear testing machine for shock-absorbing rubber bearings. To track triaxial displacements of bridge rubber bearings, Cai et al. [27] proposed an L-shaped lever structure cantilever-beam 3-D displacement sensor. The results show that the 3-D spatial displacement measurement error was less than 2 mm. The dynamic displacement measurement error was less than 0.4 mm. Wang et al. [28] conducted static single compression-shear by using a testing machine with a maximum vertical pressure capacity of 30 MN and a maximum horizontal loading force of 3 MN to investigate the mechanical properties of NR/EPDM blended rubber bearings. Wu et al. [29] conducted static single compression-shear by using a testing machine with vertical and horizontal loading capacities of 20 MN and 2 MN, respectively, for investigating horizontal and vertical mechanical properties of rubber bearings. Kuang et al. [30] conducted static single compression-shear by using a testing machine with vertical and horizontal loading capacities of 15 MN and 2 MN, respectively, for exploring the mechanical properties of high-damping thick-layer rubber bearings.
However, most of the above testing machines have a small bearing capacity with vertical loads not exceeding 60 MN. In contrast, the testing machine in this study has a vertical load as high as 80 MN. Moreover, most of the above testing machines have few functions and can only conduct static vertical compression, static double compression-shear, and static single compression-shear tests, lacking the capacities of dynamic single compression-shear and static compression-torsion tests. In fact, the loading conditions are more complex during the dynamic single compression-shear test under the combined action of vertical and horizontal loads and the compression-torsion test under the combined action of vertical loads and torsional loads. Thus, the traditional testing machine with a sole-column frame is difficult to meet the strength and stiffness requirements under such large and complex loading conditions. However, most of the above literature mainly conducts mechanical simulations for one or two components, rarely for the whole testing machine, so making it impossible to determine whether the whole testing machine meets the strength and stiffness requirements.
Therefore, a compression–shear–torsion multifunctional bridge bearing testing machine with a maximum vertical load of 80 MN is designed. It consists of a vertical compression device, a single shear device, a double shear device, and a torsion device, enabling five loading tests: static vertical compression, static double compression-shear, static single compression-shear, static compression-torsion, and dynamic single compression-shear. To ensure that the testing machine meets the strength and stiffness requirements under the above five ultimate loading conditions, a plate-column composite frame with lateral reaction plates is introduced, and five ultimate loading simulations of this compression–shear–torsion testing machine are carried out, respectively, and then compared with those of the traditional compression–shear–torsion testing machine with a sole-column frame.

2. Mechanical Structure Design

An 80 MN compression–shear–torsion multifunctional bridge bearing testing machine is shown in Figure 1. Its main frame consists of an upper beam 1, four columns 2, a lower base 3, a compression workbench 4, and four lateral reaction plates 5. The upper beam 1 and the lower base 3 are joined to the columns 2 via four locking nuts. Four lateral reaction plates 5 are mounted on both sides of the upper beam 1 and the lower base 3. Eventually, a closed self-reaction force system is formed. It consists of a vertical compression device, a single shear device, a double shear device, a torsion device, enabling five loading tests: static vertical compression, static double compression-shear, static single compression-shear, dynamic single compression-shear, and static compression-torsion, as shown in Table 1.
(1) Vertical compression device: It consists of a vertical compression hydraulic cylinder 6, rolling guide blocks 7, an upper pressure plate 8, four force sensors 9, transition flanges 10, etc. The vertical compression hydraulic cylinder 6 has an outer diameter of 1750 mm, an inner diameter of 1250 mm, and a height of 1200 mm. Its maximum vertical load and maximum vertical displacement are 80 MN, 1200 mm, respectively. It is installed on the upper beam 1 and operates with the upper pressure plate 8. The rolling guide blocks 7 are mounted on both sides of the upper pressure plate 8 and contact the four lateral reaction plates 5, which can transfer the effect of the horizontal load on the four columns to the four lateral reaction plates 5.
(2) Double shear device: It is installed outside the main frame. It consists of two friction plates 11, a shear plate 12, a front beam 13, and a double shear hydraulic cylinder 14, etc. The double shear hydraulic cylinder 14 can apply a horizontal load. Its maximum horizontal load and maximum horizontal displacement are 3 MN, 250 mm, respectively. The double compression-shear process is as follows: First, place a shear plate 12 between two specimens. Next, use the vertical compression hydraulic cylinder 6 to vertically load to a certain value. Finally, the double shear hydraulic cylinder 14 pulls the shear plate 12 to start the double compression-shear test.
(3) Single shear device: It is installed on the lower base 3. It consists of a single shear hydraulic cylinder 15, a single shear workbench 16, two guiding rail blocks 17, etc. The maximum horizontal load and maximum horizontal displacement are 3 MN, 250 mm, respectively. The single compression-shear test process is as follows: Firstly, the vertical compression hydraulic cylinder 6 vertically loads to a certain value. Subsequently, the single shear hydraulic cylinder 15 is horizontally loaded to start the single compression-shear test. The two guiding rail blocks 17 can ensure that the moving centerline of the single shear workbench 16 aligns with the moving centerline of the single shear hydraulic cylinder 15.
(4) Torsion device: It consists of a torsion plate 18, a mounting support 19, a torsion hydraulic cylinder 20, etc. To save space, it is installed on the upper pressure plate 8. The maximum torsional load and maximum torsional displacement are 1.8 MN, 100 mm, respectively. The compression-torsion process is as follows: First, place the corner plate 18 between two specimens. Next, the vertical compression hydraulic cylinder 6 is vertically loaded to a certain value. Finally, the torsion hydraulic cylinder 20 applies a vertical load to the torsion plate 18, initiating the compression-torsion test.
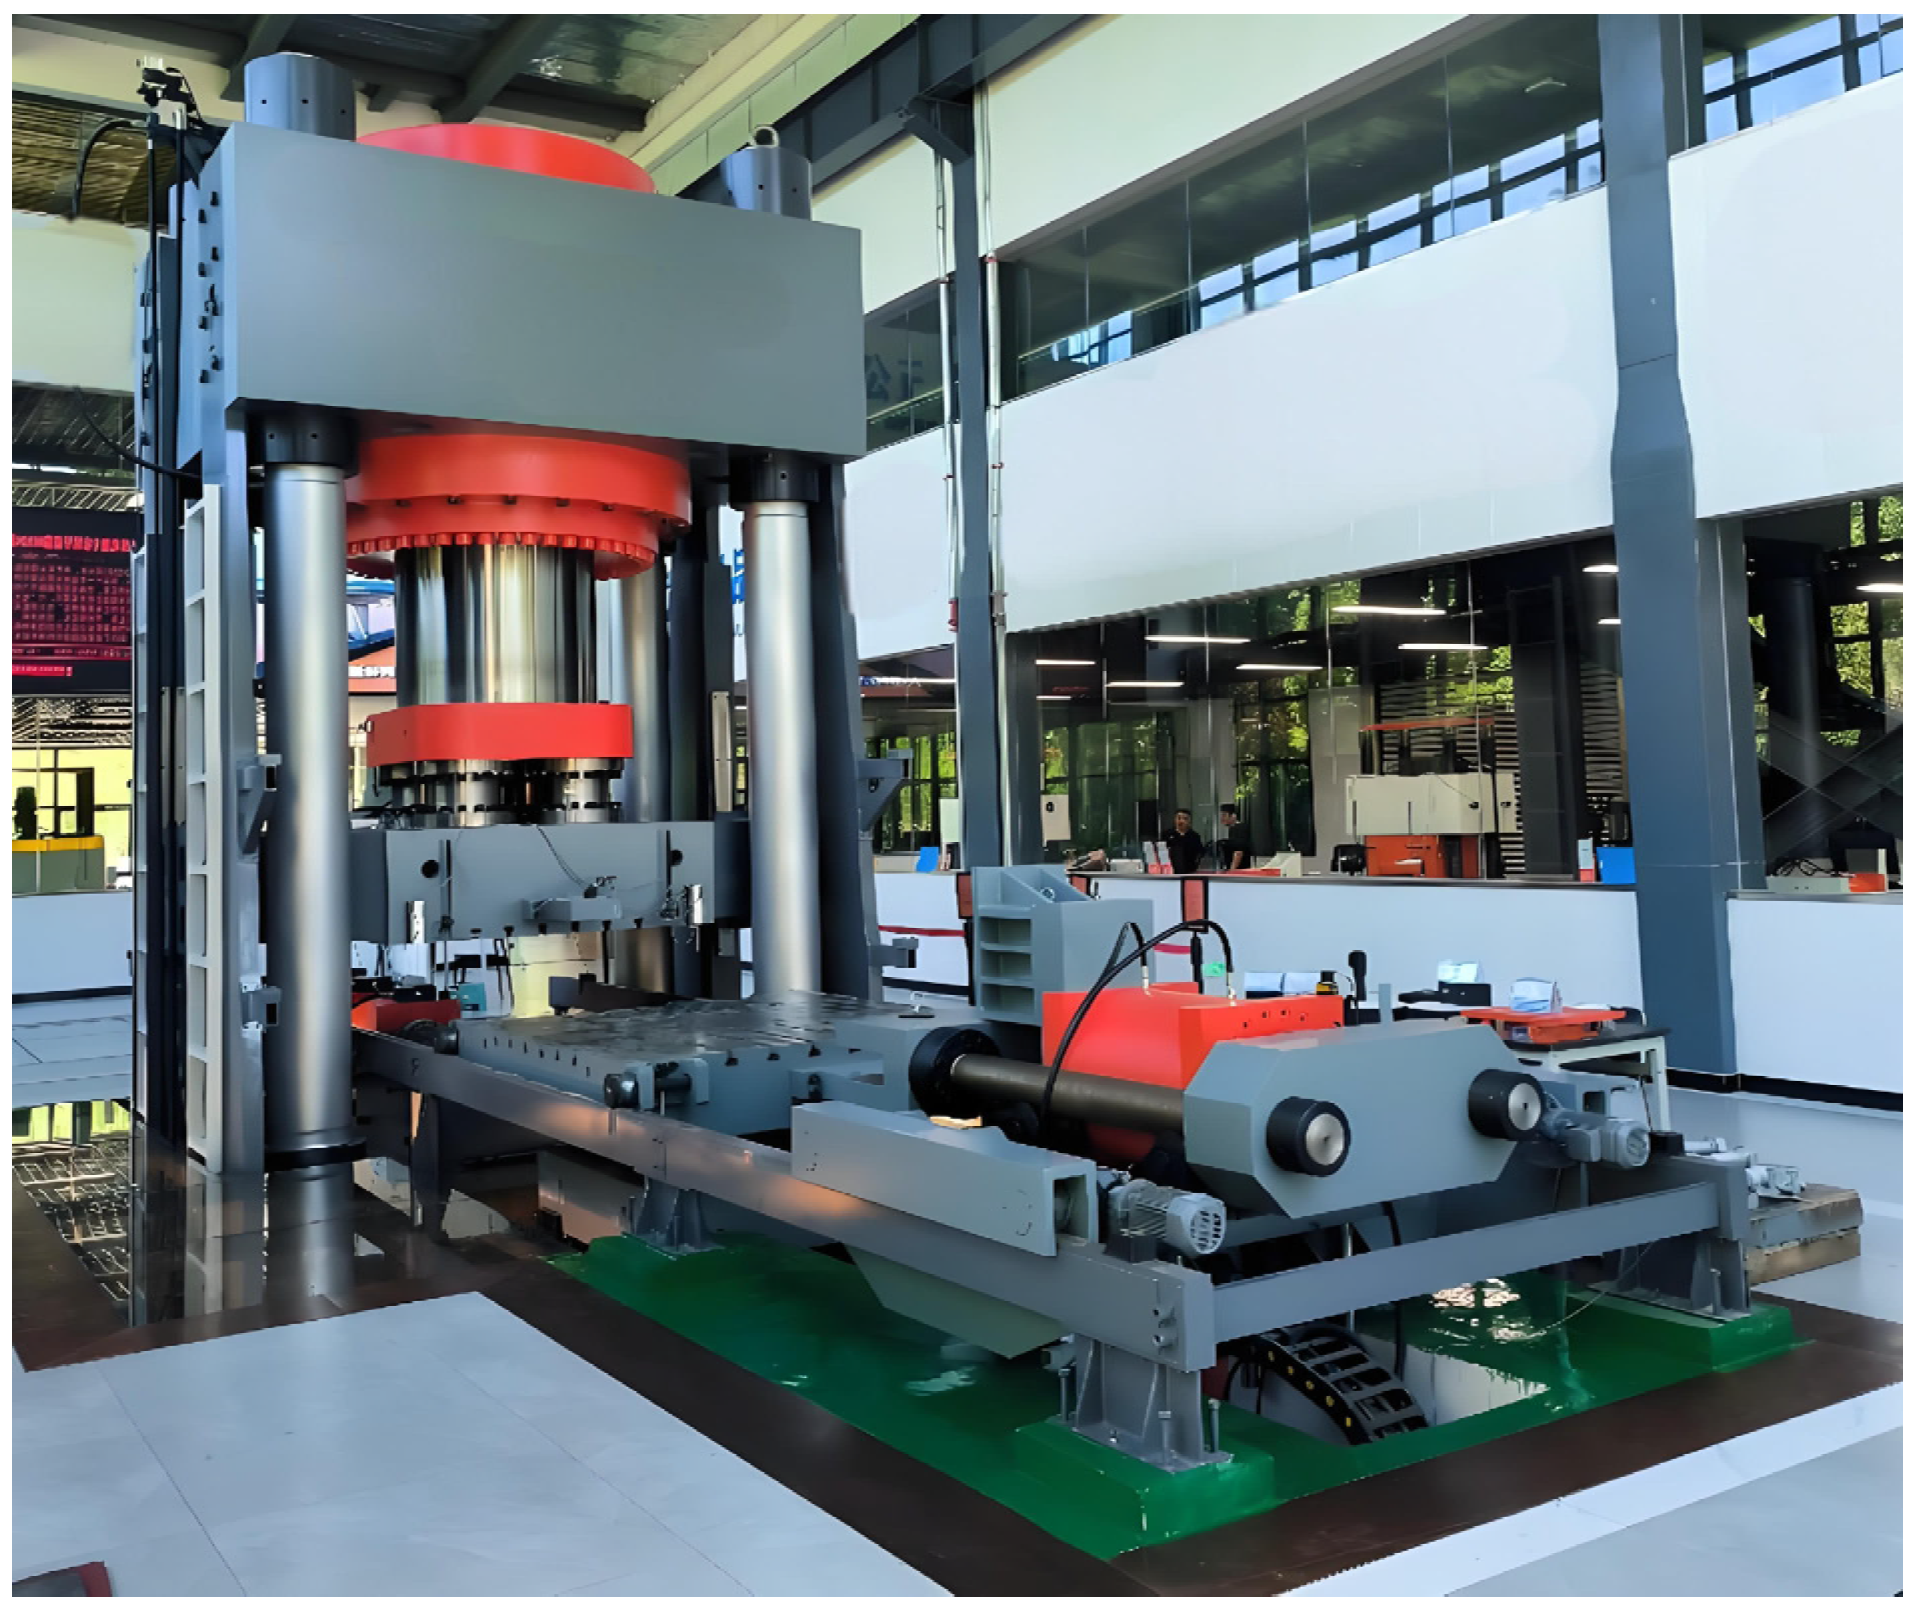
Based on the above structure design, the 80 MN compression–shear–torsion multifunctional bridge bearing testing machine with a plate-column composite frame is installed, as shown in Figure 2. It has a total mass of 400 t, overall dimensions of 12 m × 4 m × 8 m, and an occupied area of 300 m2.

3. Analysis of Loading States

The loading states of the specimen and the testing machine under vertical compression, double compression-shear, single compression-shear, and compression-torsion are analyzed below.

3.1. Loading State of Vertical Compression

Figure 3 shows the loading states of the specimen and the testing machine under vertical compression. For the specimen, the vertical loads satisfy the following equation:
P = N 1
where P is the vertical load applied to the specimen by the vertical compression hydraulic cylinder through the upper pressure plate, and N1 is the vertical load applied to the specimen by the lower base through the compression workbench. The two vertical loads reach a state of static equilibrium, allowing the specimen to undergo vertical compression. For the testing machine, the specimen generates a reaction load P0 on the upper pressure plate and a reaction load N10 on the lower base. These two reaction loads also reach static equilibrium on the testing machine.
When the specimen is subjected to the ultimate vertical compression load, that is, the vertical load P reaches its maximum value of 80 MN, substituting the parameters into Equation (1) gives: N1 = 80 MN. Consequently, the reaction loads P0 and N10 are also equal to 80 MN.

3.2. Loading State of Double Compression-Shear

Figure 4 shows the loading states of the specimen and the testing machine under double compression-shear.
(1) For the specimen, the vertical loads satisfy the following equation:
P = N 2 + N 3
where P is the vertical load applied to the specimen by the vertical compression hydraulic cylinder through the upper pressure plate, and N2 and N3 are the vertical loads applied to the specimen by the lower base through the compression workbench. These three vertical loads reach static equilibrium to achieve the vertical compression of the two specimens. For the testing machine, the specimen generates a reaction load P0 on the upper pressure plate and two reaction loads N20, N30 on the lower base. These three reaction loads also reach static equilibrium on the testing machine.
Figure 4. Loading states of (a) specimen and (b) testing machine under double compression-shear.
Processes 13 03331 g004
(2) For the specimen, the horizontal loads satisfy the following equations:
F 1 = f 1 + f 2
f 1 = f 2
where F1 is the horizontal load applied to the shear plate by the double shear hydraulic cylinder; f1 is the horizontal frictional force applied to the upper specimen by the upper pressure plate. f2 is the horizontal frictional force applied to the lower specimen by the compression workbench. These three loads reach static equilibrium to achieve the horizontal shear of the two specimens. According to the Chinese national standard “Rubber bearings—Part 4: Normal rubber bearings” (GB/T 20688.4-2023), the upper and lower specimens must be centered during double compression-shear [31]. Additionally, anti-slip friction pads must be pasted on the friction plates and the middle shear plates to prevent sliding. Therefore, it is assumed that it is symmetrical and the two frictional forces are equal f1 = f2. For the testing machine, the upper specimen generates a reaction load f10 on the upper pressure plate, and the lower specimen generates a reaction load f20 on the compression workbench.
Suppose the moving distance of the shear plate is x, the distances between F1 and f1, f2 are both H, and half of the distance of the rolling slider under the workbench is L. Based on the moment balance, Equation (5) can be derived as follows:
N 2 · ( L + x ) + f 1 · H = N 3 · ( L x ) + f 2 · H
By combining Equations (2)–(5), the following equations can be derived:
N 2 = P · ( L + x ) / 2 L
N 3 = P · ( L x ) / 2 L
f 1 = f 2 = F 1 / 2
When the specimen is subjected to the ultimate double compression-shear load, that is, when P reaches the maximum vertical load of 80 MN, F1 reaches the maximum horizontal load of 3 MN, and x reaches the maximum horizontal displacement of 250 mm, and L = 700 mm, substituting these parameters into Equations (11)–(13) gives N2 = 25.71 MN, N3 = 54.29 MN, f1 = f2 = 1.5 MN. Consequently, the reaction loads P0 = 80 MN, N20 = 25.71 MN, N30 = 54.29 MN, f10 = f20 = 1.5 MN.

3.3. Loading State of Single Compression-Shear
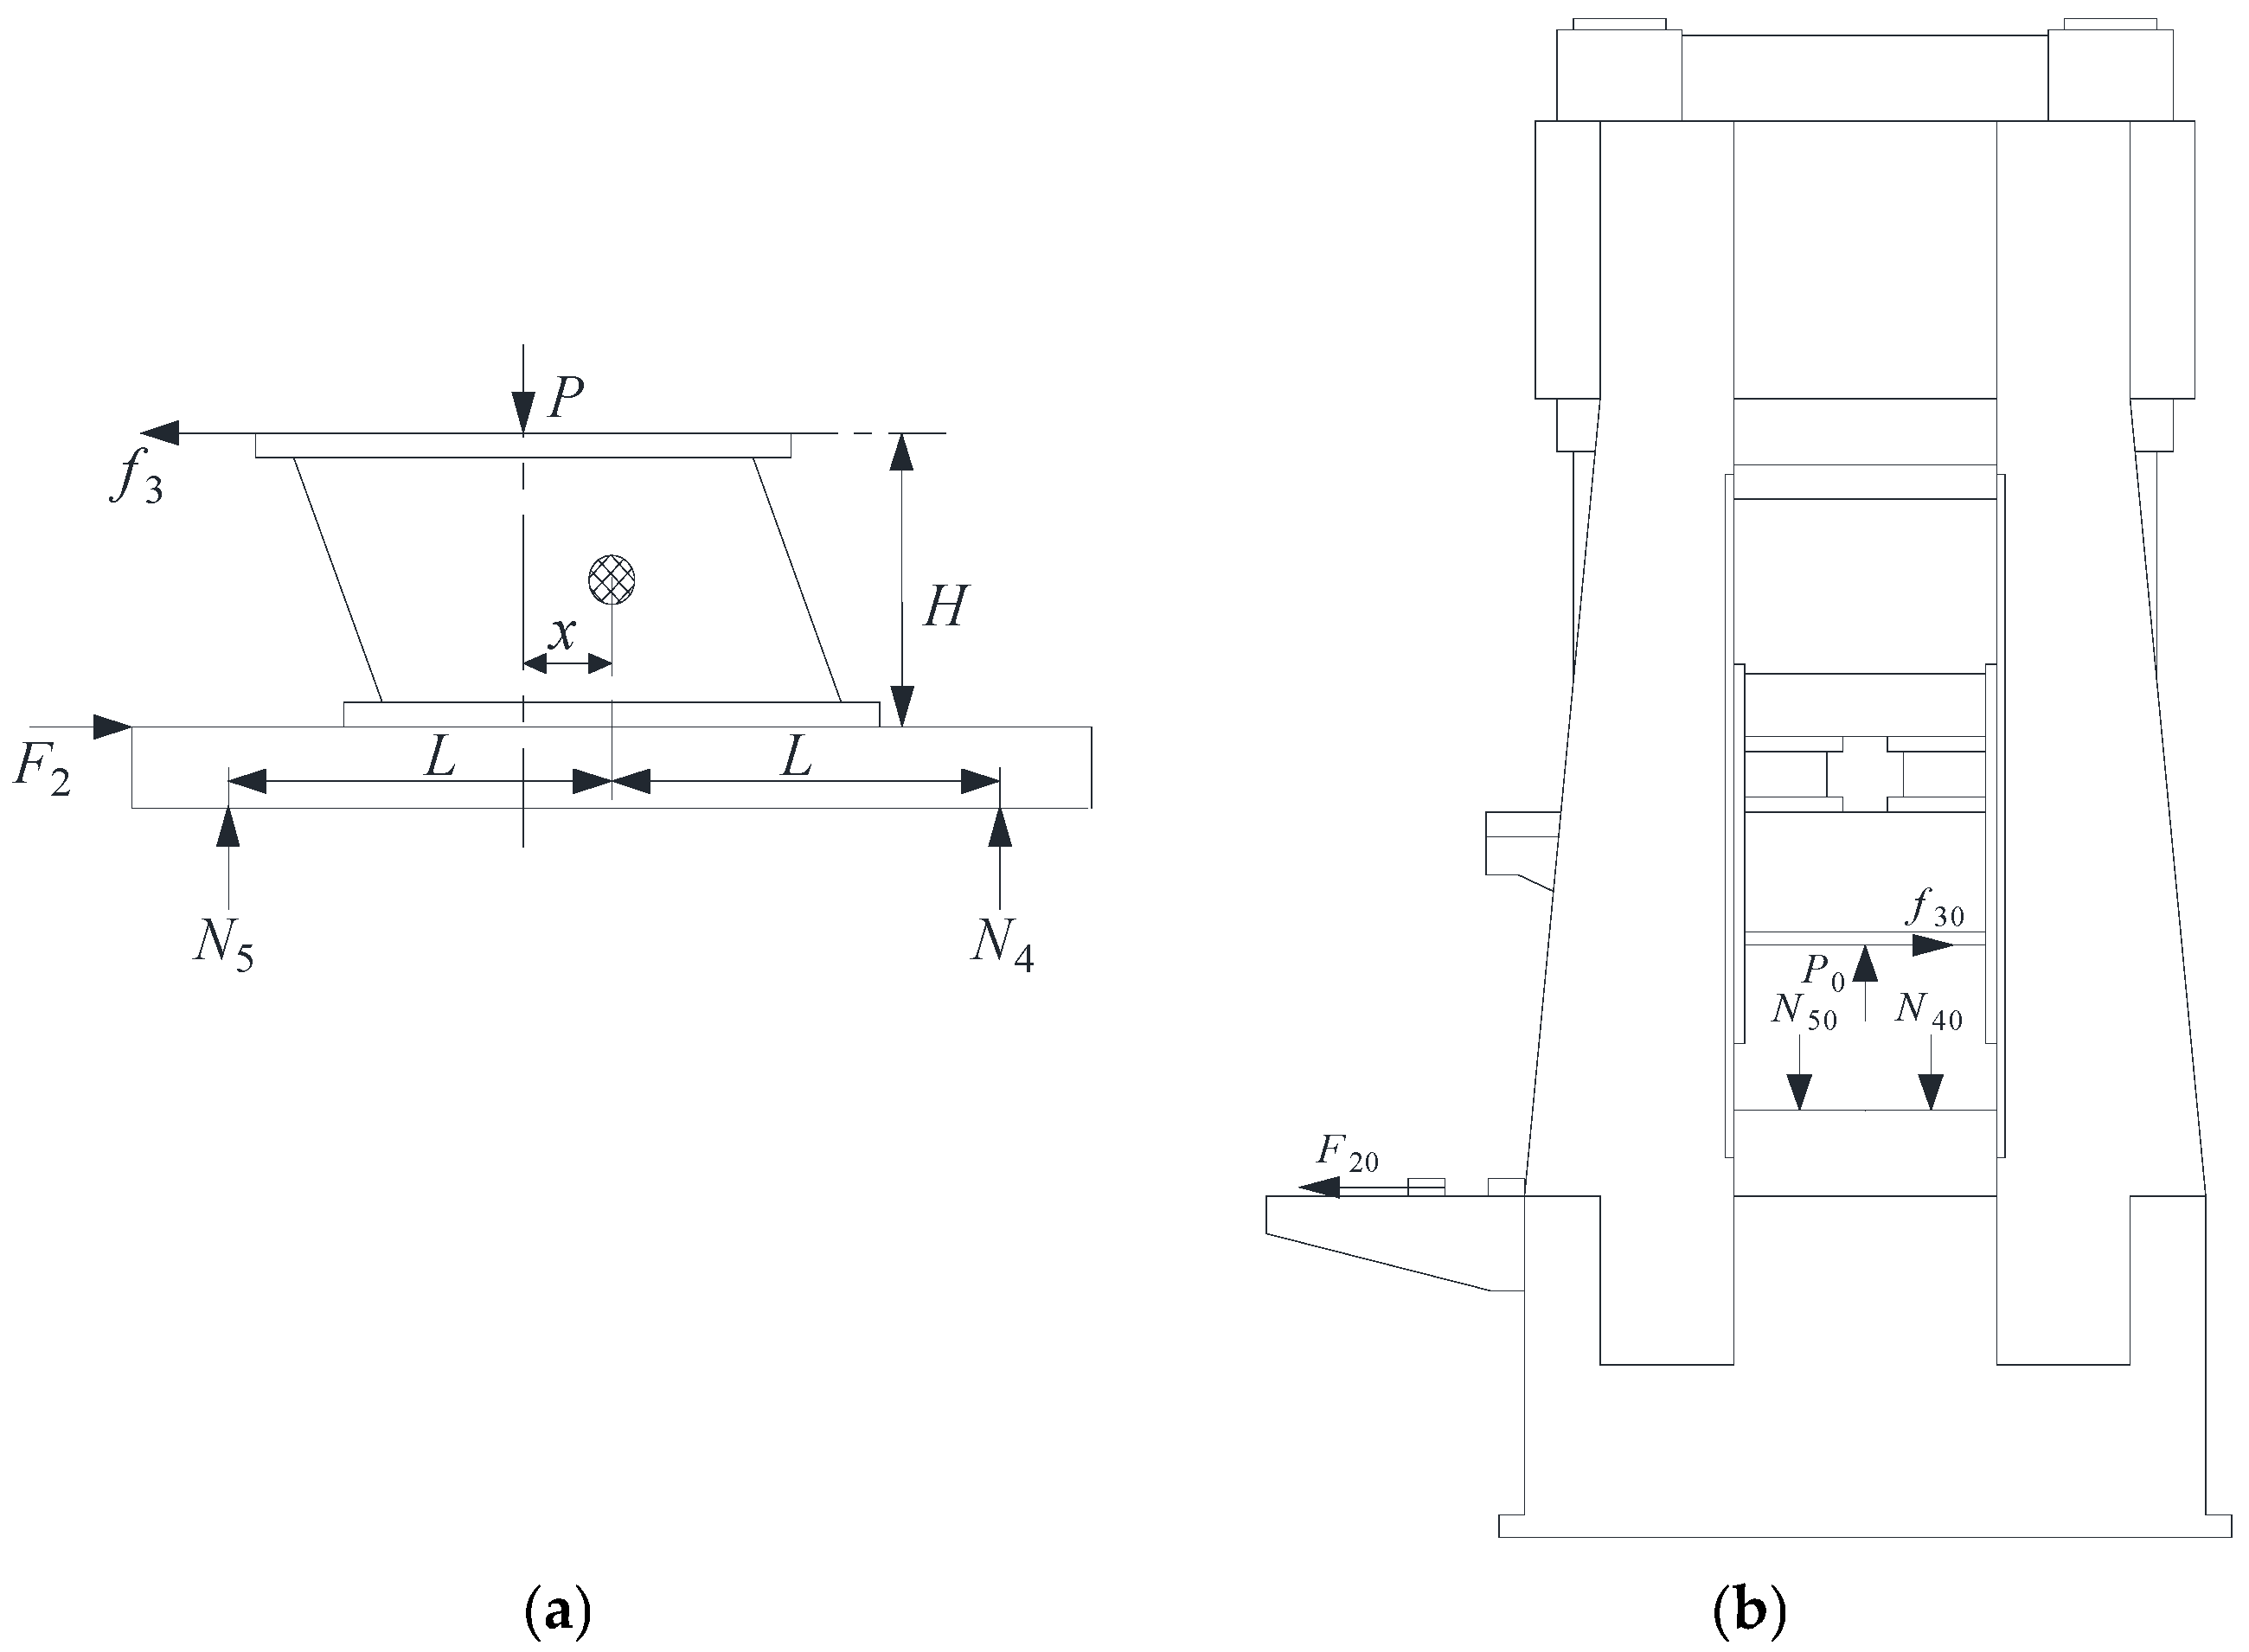
Figure 5 shows the loading states of the specimen and the testing machine under single compression-shear.
(1) For the specimen, the vertical loads satisfy the following equation:
P = N 4 + N 5
where P is the vertical load applied to the specimen by the vertical compression hydraulic cylinder through the upper pressure plate, and N4 and N5 are the vertical loads applied to the specimen by the lower base through the compression workbench. These three vertical loads reach static equilibrium to achieve the vertical compression of the specimen. For the testing machine, the specimen generates a reaction load P0 on the upper pressure plate and two reaction loads N40, N50 on the lower base. These three reaction loads will also reach static equilibrium on the testing machine.
Figure 5. Loading states of (a) specimen and (b) testing machine under single compression-shear.
Processes 13 03331 g005
(2) For the specimen, the horizontal loads satisfy the following equation:
F 2 = f 3
where F2 is the horizontal load applied by the single shear hydraulic cylinder; f3 is the horizontal frictional force applied by the upper pressure plate. These two horizontal loads reach static equilibrium to achieve the horizontal shear of the specimen. For the testing machine, the specimen generates a reaction load F20 on the lower base and a reaction frictional force f30 on the upper pressure plate. These two reaction loads will also reach static equilibrium on the testing machine.
Suppose the moving distance of the single shear workbench is x, the vertical distance between f3 and F2 is H, and half of the distance of the rolling slider under the single shear workbench is L. Based on the moment balance, Equation (4) can be derived as follows:
N 5 · ( L x ) = N 4 · ( L + x ) + f 3 · H
By combining Equations (9)–(11), the following equations can be derived:
N 4 = P · L x f 3 · H / 2 L
N 5 = P · L + x + f 3 · H / 2 L
When the specimen is subjected to the ultimate single compression-shear load, that is, when P reaches the maximum vertical load of 80 MN, F2 reaches the maximum horizontal load of 3 MN, and x reaches the maximum horizontal displacement of 250 mm, and L = 700 mm, substituting these parameters into Equations (12) and (13) gives: N4 = 24.43 MN, N5 = 55.57 MN, f 3 = 3   M N . Consequently, the reaction loads P0 = 80 MN, N40 = 24.43 MN, N50 = 55.57 MN, F 20 = f 30 = 3   M N .

3.4. Loading State of Compression-Torsion
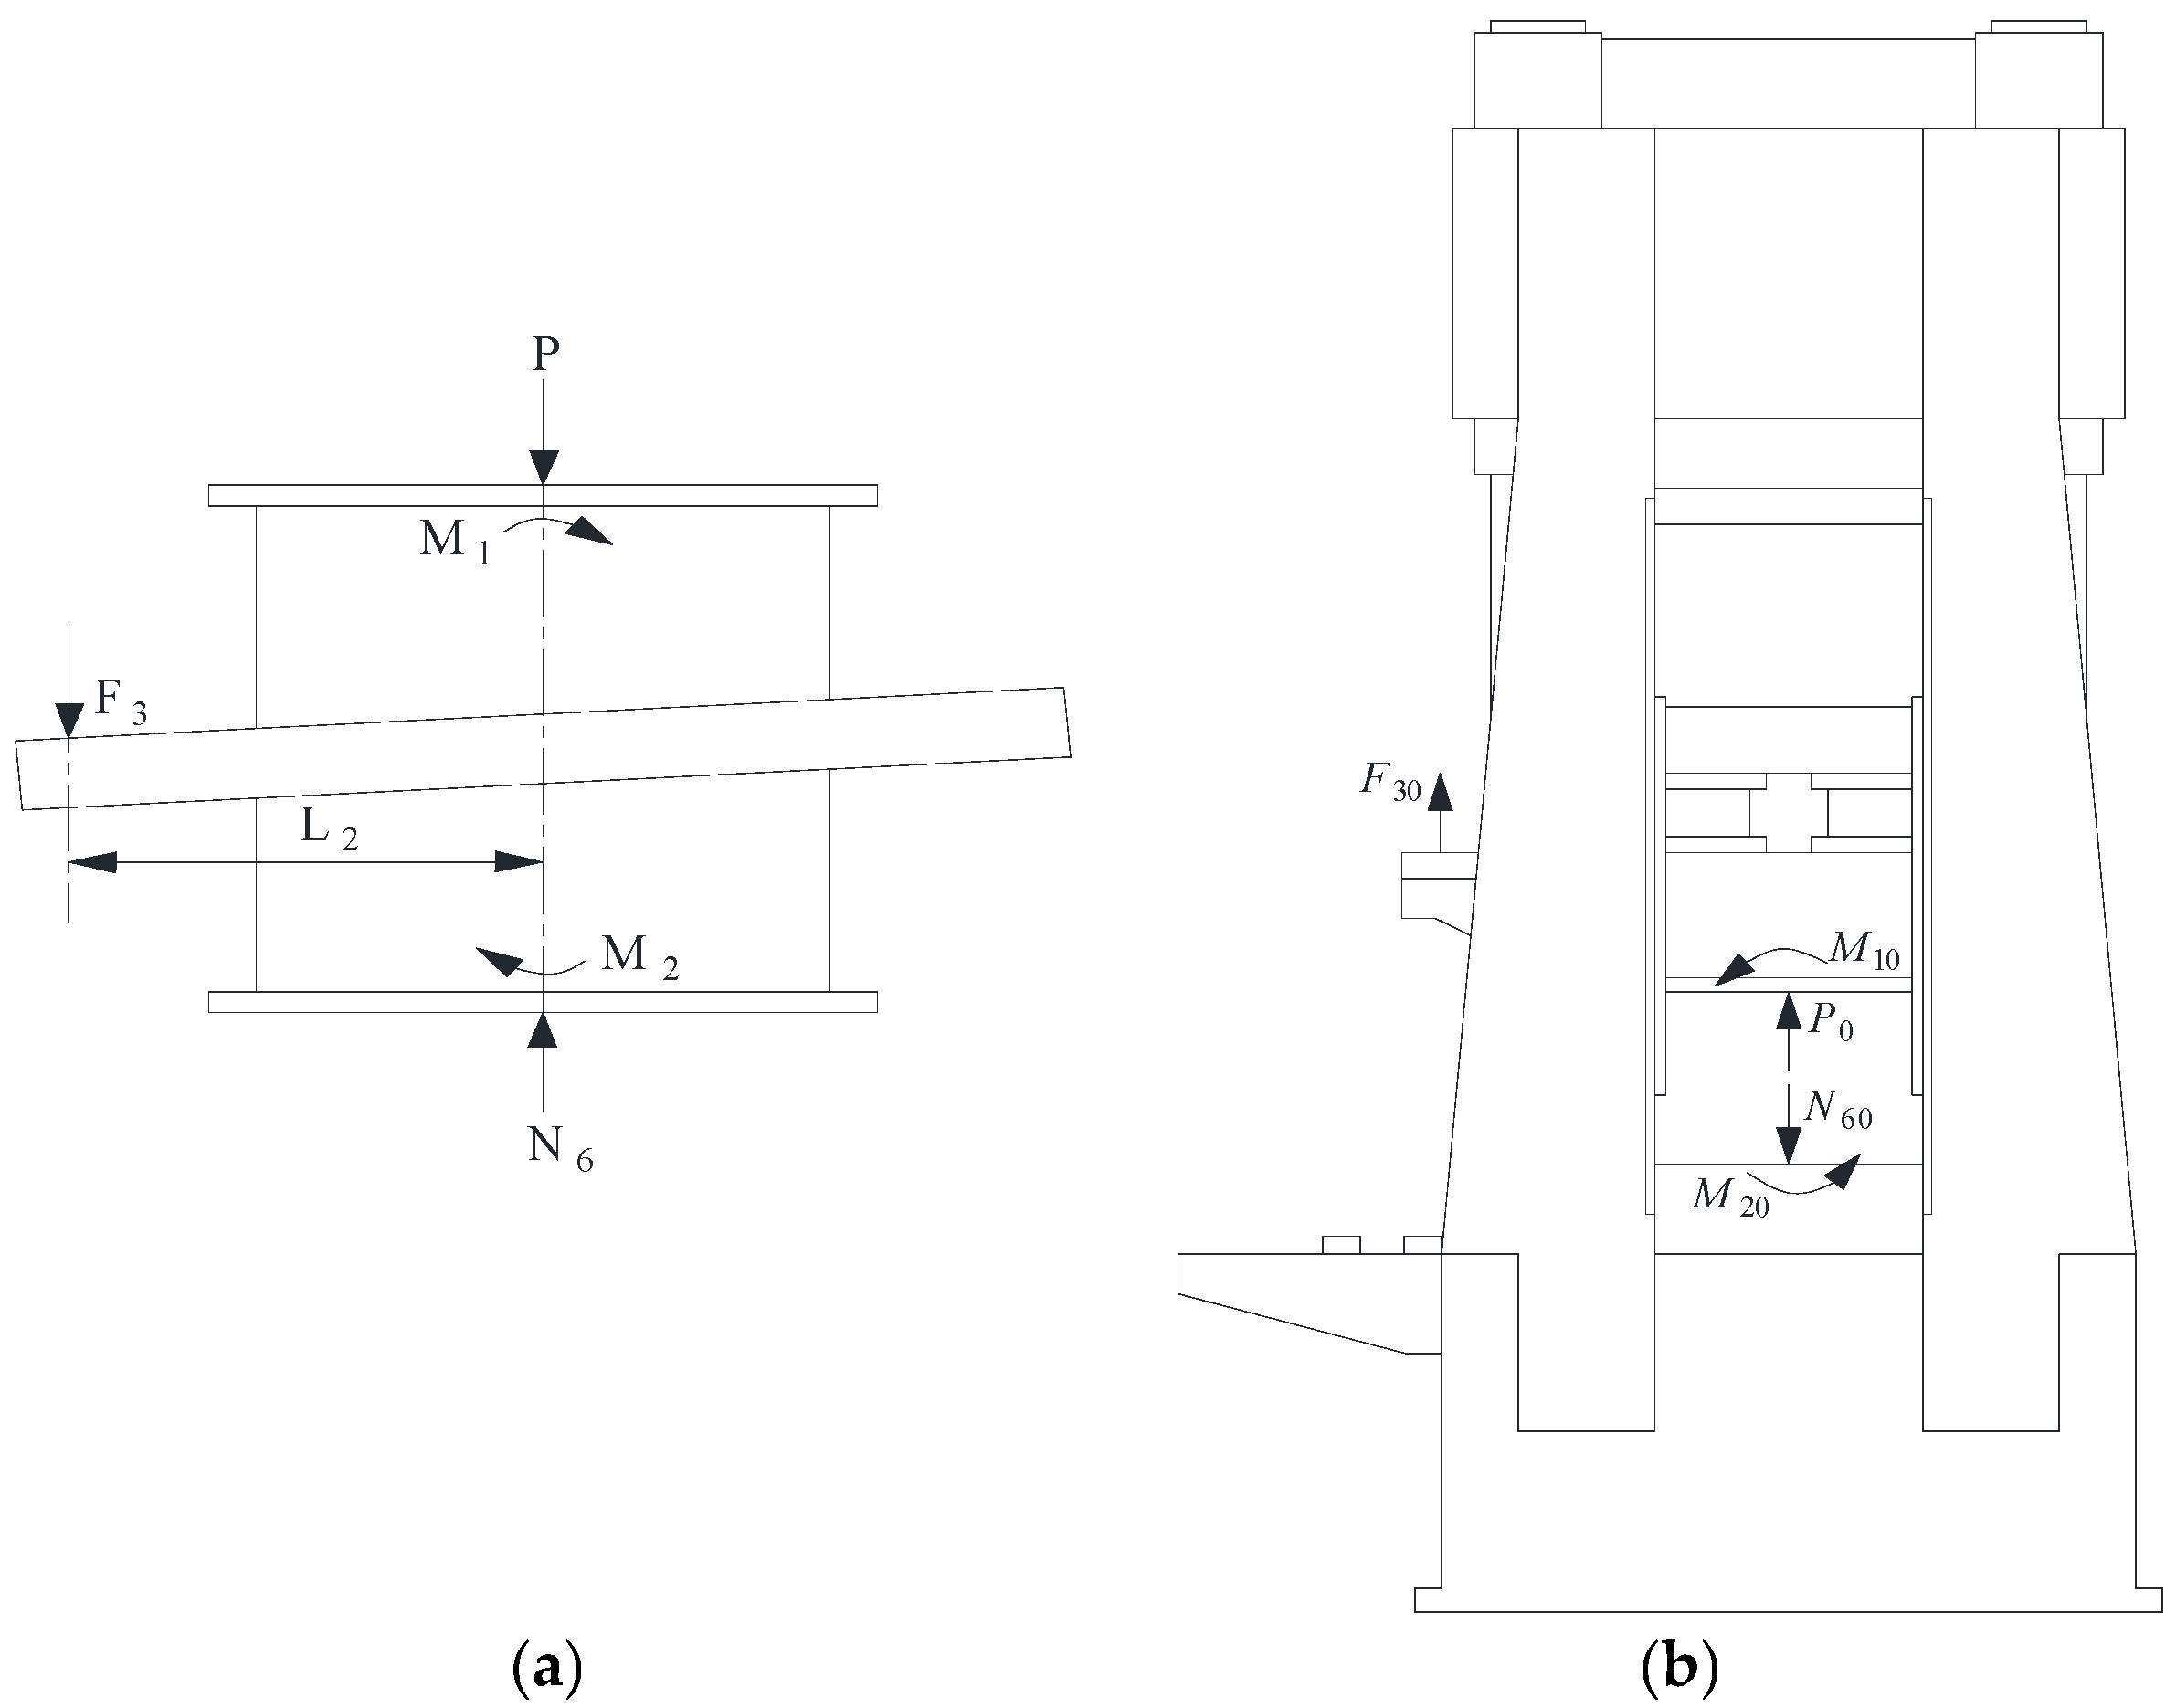
Figure 6 shows the loading states of the specimen and the testing machine under the compression-torsion process.
(1) For the specimen, the vertical loads satisfy the following equations:
N 6 = P + F 3
where P is the vertical load applied to the specimen by the vertical compression hydraulic cylinder through the upper pressure plate, and N6 is the vertical load applied to the specimen by the lower base through the compression workbench. F3 is the vertical load applied by the torsion hydraulic cylinder to the torsion plate. These three vertical loads reach static equilibrium to achieve the vertical compression of the specimen. For the testing machine, the specimen generates a reaction load P0 on the upper pressure plate and a reaction load N60 on the lower base. In addition, the torsion plate generates a reaction load F30 on the upper pressure plate through the torsion hydraulic cylinder. These three reaction loads also reach static equilibrium on the testing machine.
(2) For the specimen, the torque loads satisfy the following equations:
M = F 3 · L 2
M = M 1 + M 2
M 1 = M 2
where L2 is the distance between F3 and the moving centerline of the vertical compression hydraulic cylinder. M is the torque applied by the torsion hydraulic cylinder; M1 is the torque applied by the upper platen; M2 is the torque applied by the lower base through the compression workbench. These three torques reach moment balance to achieve the torsion of the two specimens. For the testing machine, the specimen generates a reaction torque M10 on the upper pressure plate and a reaction torque M20 on the lower base.
When the specimen is subjected to the ultimate compression-torsion load, that is, when P reaches the maximum vertical load of 80 MN, F3 reaches the maximum torsional load of 1.8 MN. Substituting these parameters into Equations (14)–(17) gives: N6 = 81.8 MN, M1 = M2 = 9 × 10⁸·(N·mm). Consequently, the reaction loads P0 = 80 MN, F30 = 1.8 MN, N60 = 81.8 MN, M10 = M20 = 9 × 10⁸·(N·mm).
Figure 6. Loading states of (a) specimen and (b) testing machine under compression-torsion.
Processes 13 03331 g006

4. Simulation Settings

To ensure that the testing machine meets the strength and stiffness requirements under the above ultimate loading states, five ultimate loading simulations are carried out, respectively, for static vertical compression, static double compression-shear, static single compression-shear, dynamic single compression-shear, and static compression-torsion.

4.1. Model Establishment

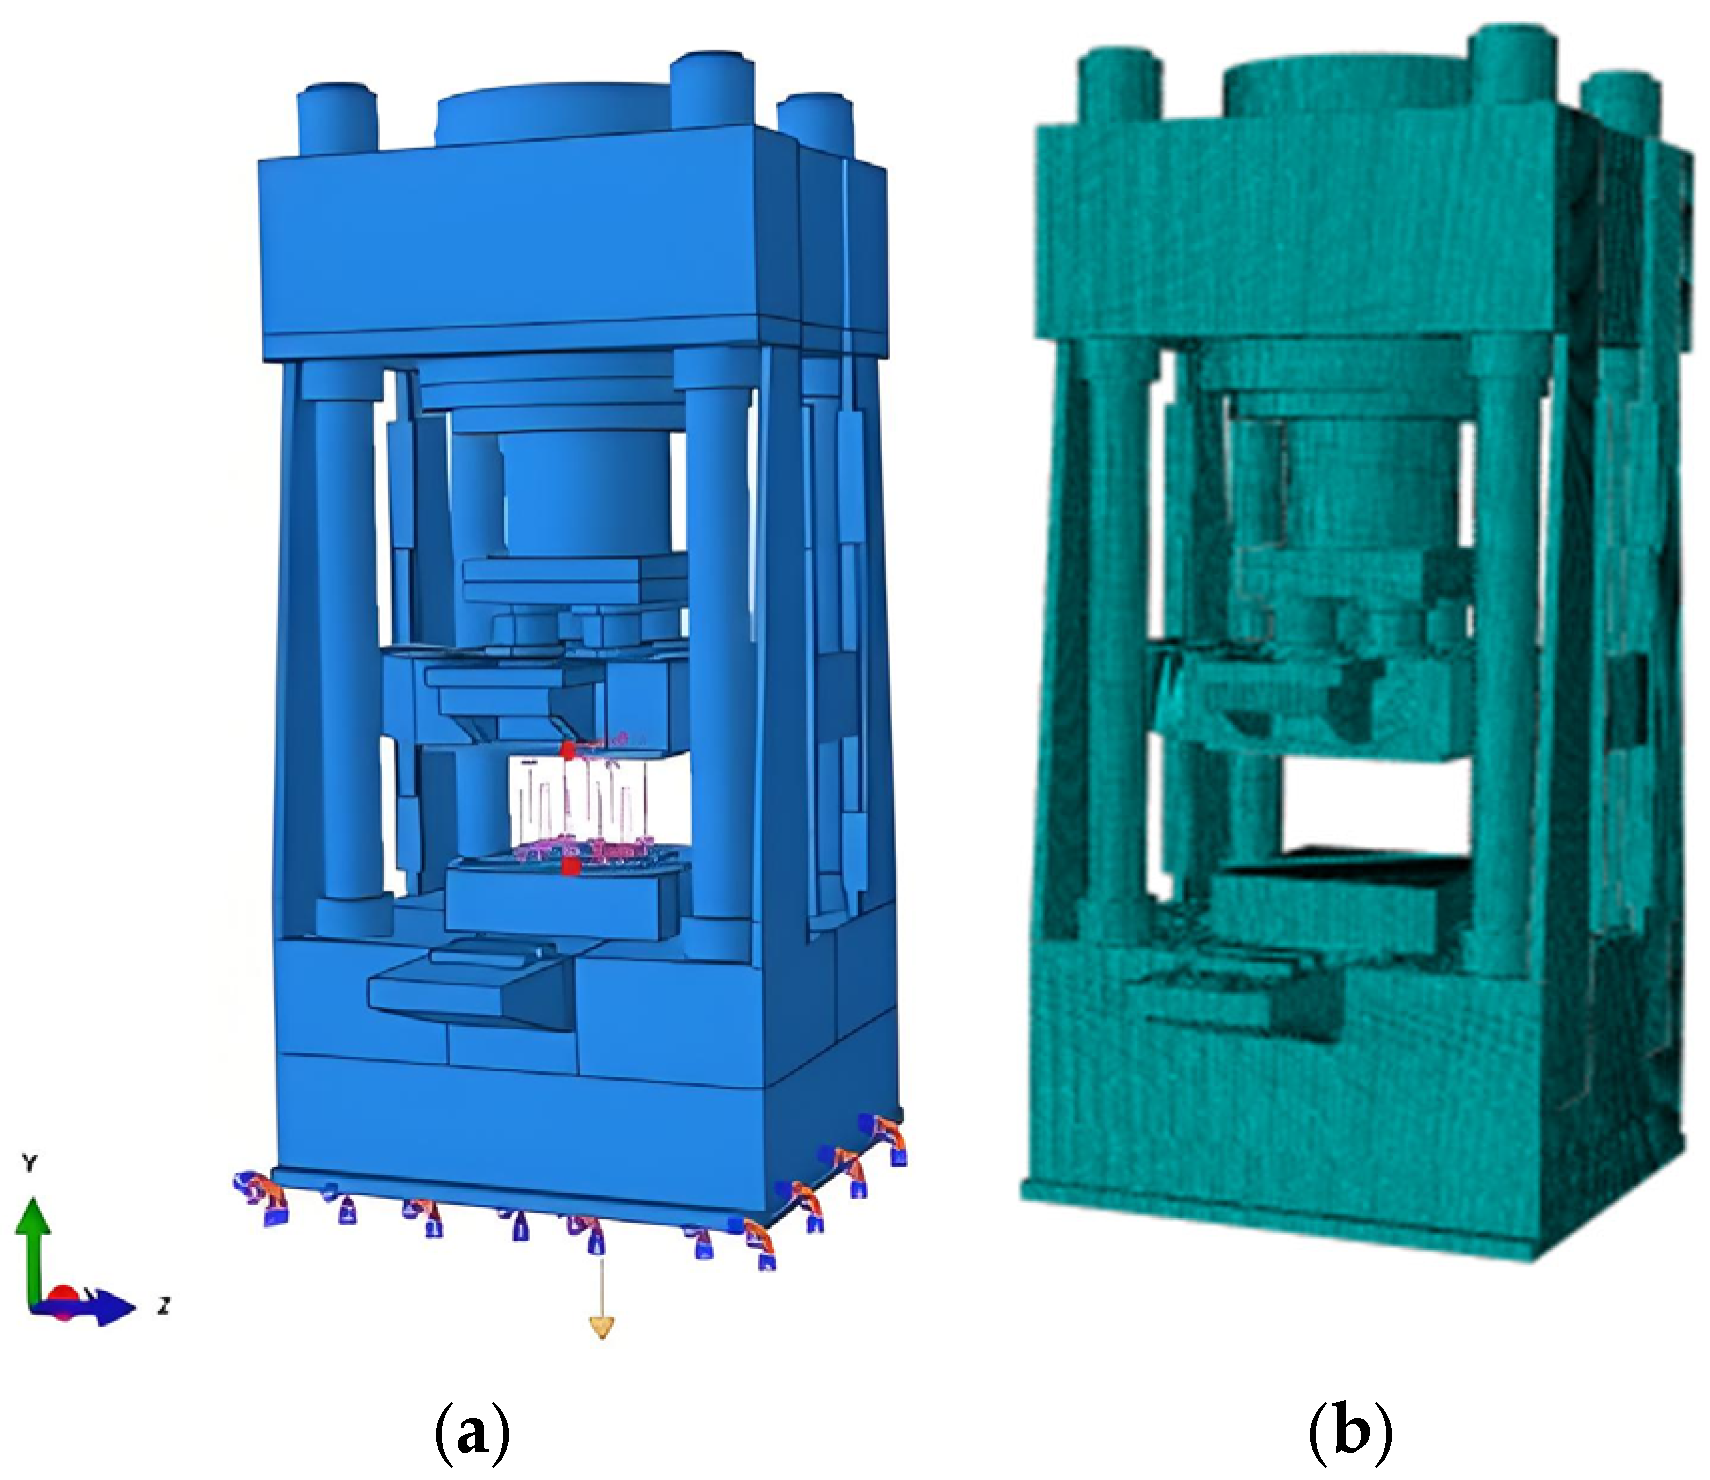
To enhance the calculation speed, simplify features such as bolts, round holes, chamfers, and fillets, and make the following assumption: all component materials are isotropic. Figure 7a shows the established three-dimensional model of this testing machine, which is then imported into ABAQUS. For comparison, a three-dimensional model of the traditional testing machine with a sole-column frame is also established, as shown in Figure 7b. The materials of the vertical compression hydraulic cylinder and flanges are 45 steel. The materials of the upper beam, upper pressure plate, workbench, and lower base are 20Mn. The material of the lateral reaction plates is Q345B. The material of the columns is 42Cr. The material of the locking nuts is 40Cr. The specific material parameters are shown in Table 2.

4.2. Boundary Conditions

Apply a fully fixed constraint to the bottom surface of the lower base. Adopt the friction contact type and set the friction coefficient of all contact surfaces to 0.2. Then add the self-gravity of each component. The ultimate reaction loads in Section 3 are applied to the upper compression plate and the lower base (taking double compression-shear as an example, as shown in Figure 8a). Subsequently, five ultimate loading simulations are carried out, namely static vertical compression, static double compression-shear, static single compression-shear, dynamic single compression-shear, and static compression-torsion.

4.3. Mesh Division and Independence Verification

Next, the hexahedron Solid186 (3D20N) is employed to divide the mesh, as shown in Figure 8b. To guarantee that the simulation results are not affected by the mesh size, a mesh independence verification is carried out. Four types of mesh sizes, namely coarse, medium, fine, and ultrafine, are, respectively, used to conduct ultimate static vertical compression simulations. The maximum stress and maximum displacement under the four mesh sizes are shown in Table 3. As the mesh size decreases, the relative error with respect to the ultrafine mesh continuously decreases. When using the fine mesh, the errors in the maximum stress and the maximum displacement are only 1.3% and 0.9%, respectively. However, as the mesh size decreases, the calculation speed significantly slows down, and the time consumption significantly increases. Comprehensively considering both the prediction accuracy and the calculation speed, a fine mesh with a size of 50 mm, an element number of 384,202, and a node number of 683,892 is employed in this study.

5. Results and Discussion

Next, five ultimate loading simulations of this compression–shear–torsion testing machine are carried out, respectively, and then compared with those of the traditional compression–shear–torsion testing machine with a sole-column frame.

5.1. Simulation on Ultimate Static Vertical Compression

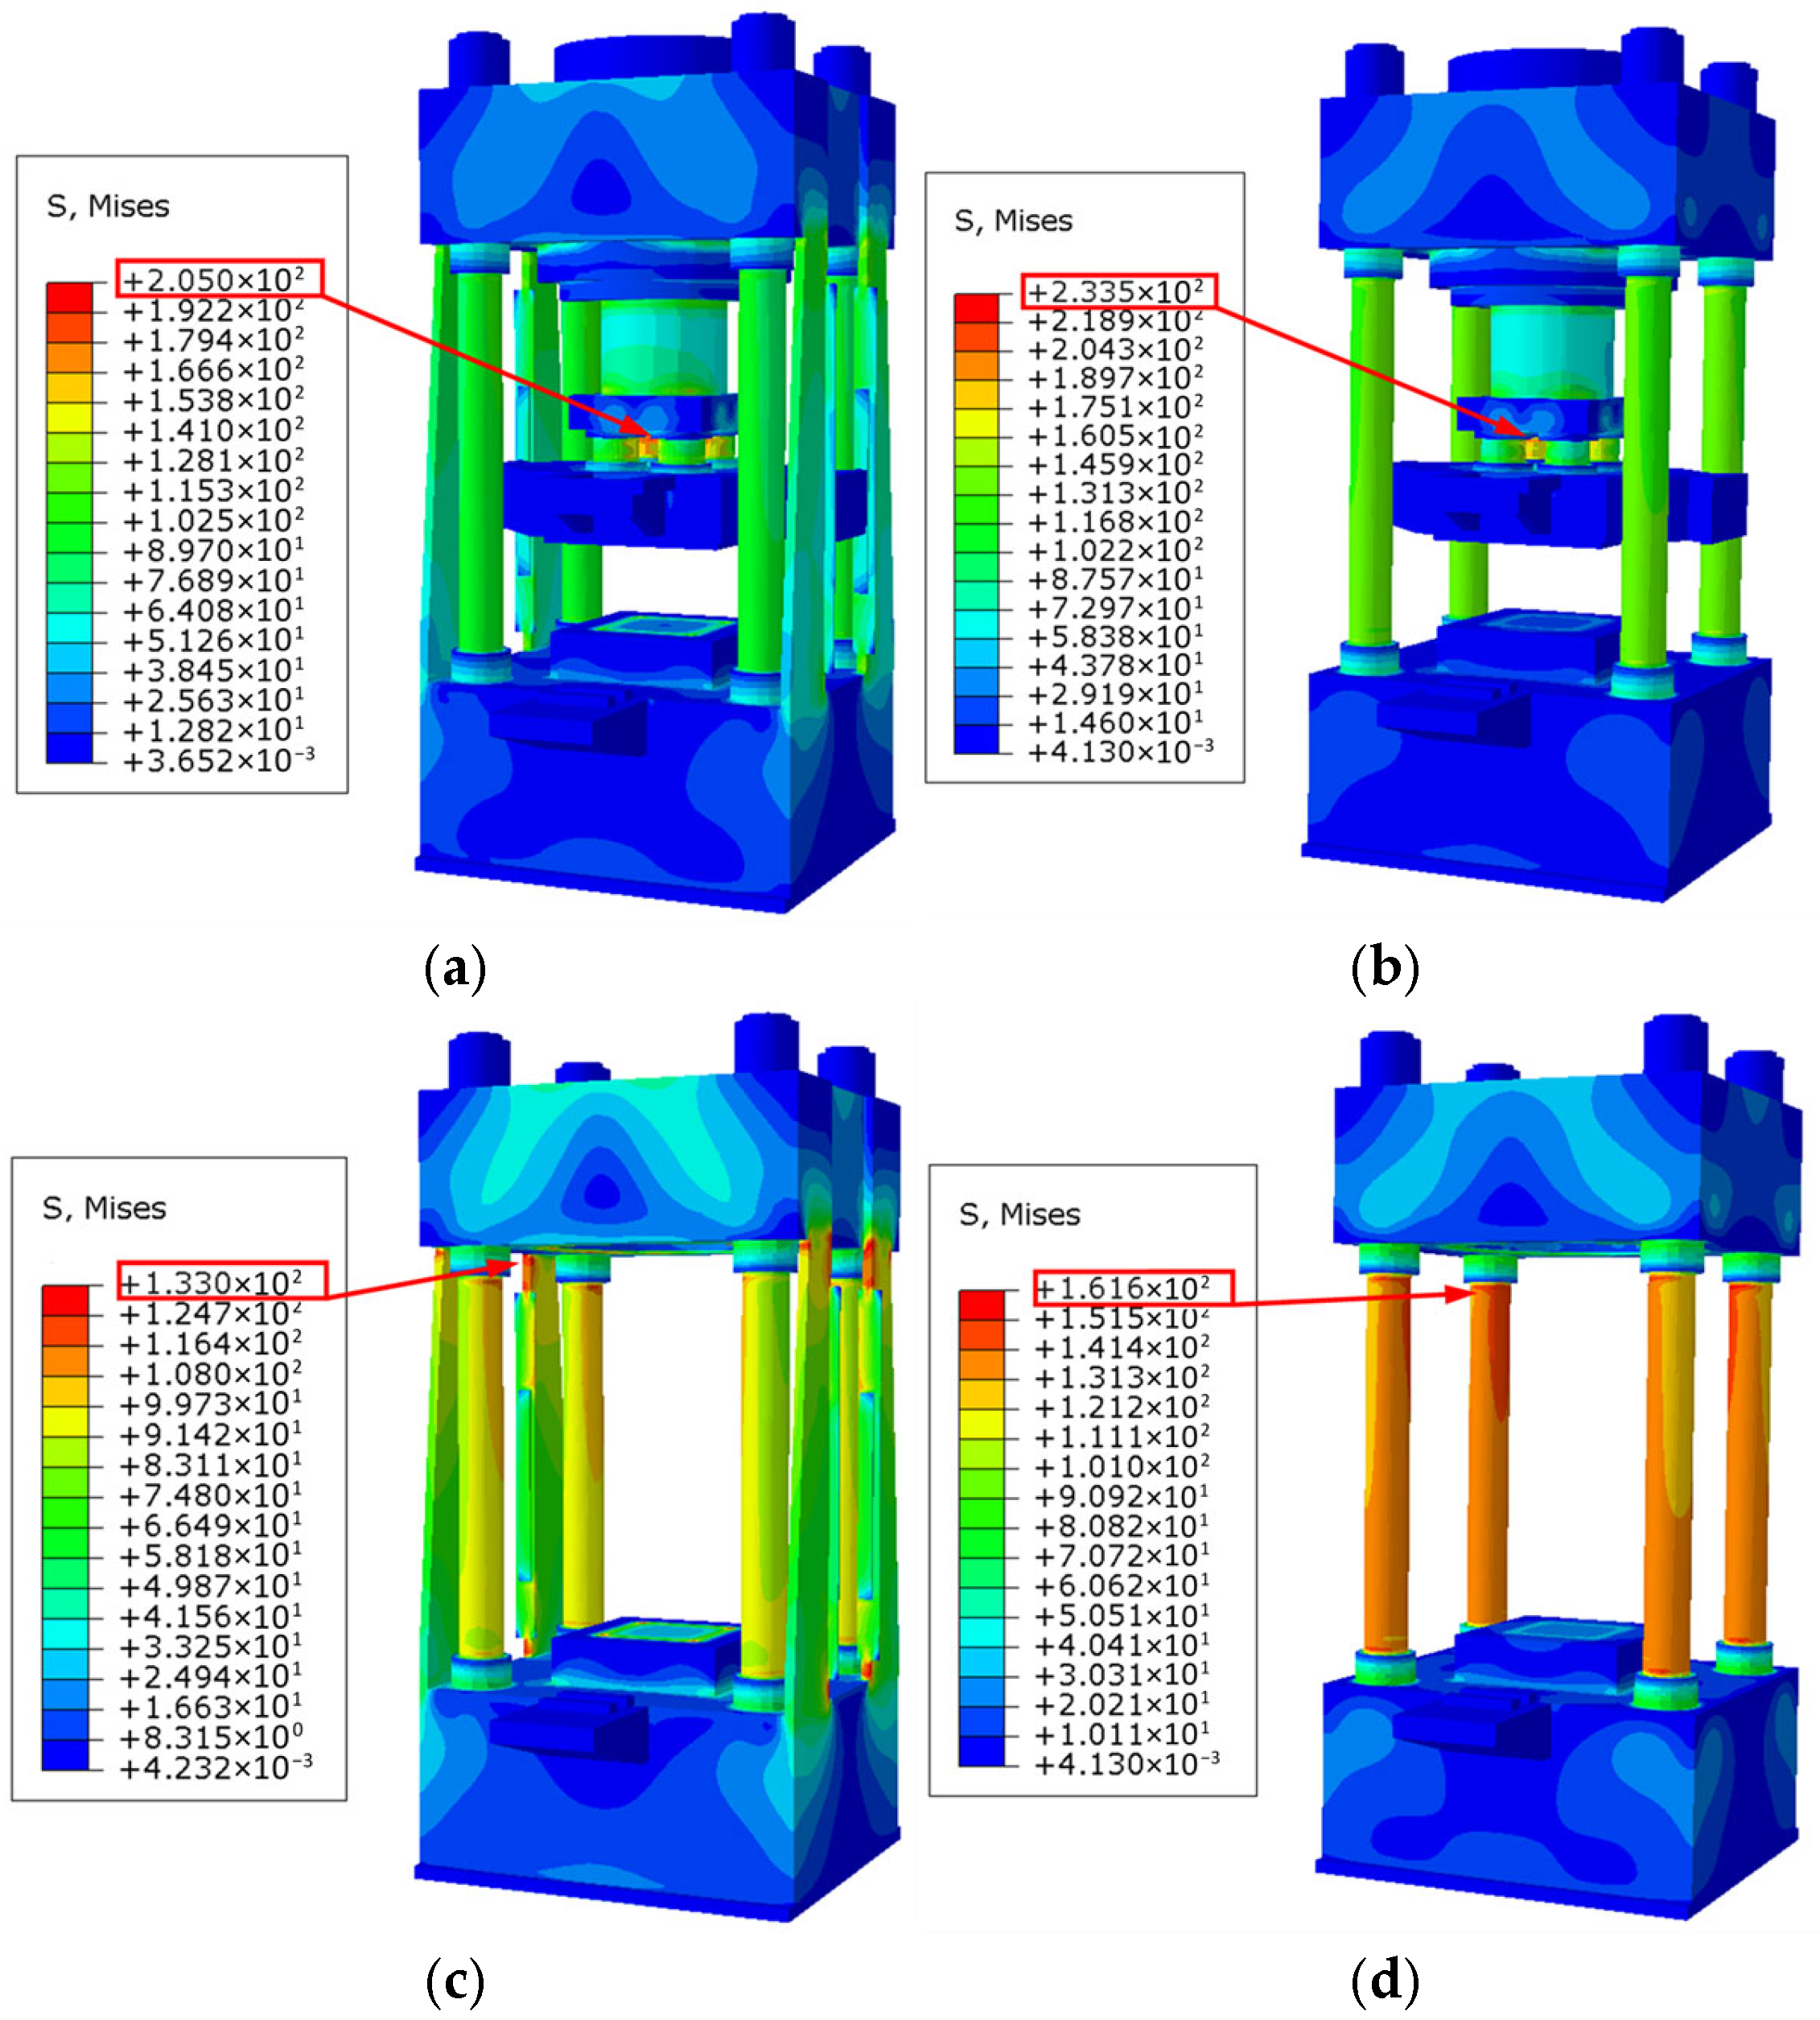
Figure 9 shows the stresses of the whole machine and the frame under ultimate static vertical compression. Regardless of the presence or absence of lateral reaction plates, the stresses in the lower base, upper pressure plate, and upper beam are relatively small; the stresses in the flanges, columns, and lateral reaction plates are relatively large, and the maximum stress of the whole machine is always located at the flanges. However, in the absence of lateral reaction plates, the maximum stress of the frame is located at the columns. While in the presence of lateral reaction plates, the maximum stress of the frame is located at the lateral reaction plates connected to the upper beam. In other words, the maximum stress position is successfully transferred from the columns, which are high-cost, high-precision, and difficult to replace, to the lateral reaction plates, which are low-cost, low-precision, and easy to replace. Not only is the position of the maximum stress successfully transferred, but the value of the maximum stress also significantly decreases. Because the lateral reaction plates increase the bearing area in the vertical direction, the maximum stresses of the whole machine and the frame with lateral reaction plates are both smaller than those without the lateral reaction plates. For the whole machine, the maximum stress decreases from 233.5 MPa without the lateral reaction plates to 205 MPa with the lateral reaction plates, showing a decrease of 12.2%. For the frame, the maximum stress decreases from 161.6 MPa without the lateral reaction plates to 133 MPa with the lateral reaction plates, showing a decrease of 17.7%. Consequently, compared to the traditional compression–shear–torsion testing machine with a sole-column frame, this compression–shear–torsion testing machine with a plate-column composite frame has higher strength and can bear ultimate static vertical compression.
Figure 10 shows the displacement of the whole machine and the frame under ultimate static vertical compression. Regardless of the presence or absence of lateral reaction plates, the displacement of the vertical compression device gradually decreases from bottom to top, and its maximum value is always located at the upper compression plate; Conversely, the displacement of the frame gradually increases from bottom to top, and its maximum value is always located at the upper beam. Whether it is the whole machine or the frame, the maximum displacement with lateral reaction plates is significantly smaller than that without lateral reaction plates. For the whole machine, the maximum displacement decreases from 4.387 mm without lateral reaction plates to 3.503 mm with lateral reaction plates, showing a decrease of 20.15%. For the frame, the maximum displacement decreases from 3.198 mm without lateral reaction plates to 2.421 mm with lateral reaction plates, showing a decrease of 24.3%. Consequently, compared to the traditional compression–shear–torsion testing machine with a sole-column frame, this compression–shear–torsion testing machine with a plate-column composite frame has higher stiffness and can bear ultimate static vertical compression.

5.2. Simulation on Ultimate Static Double Compression-Shear

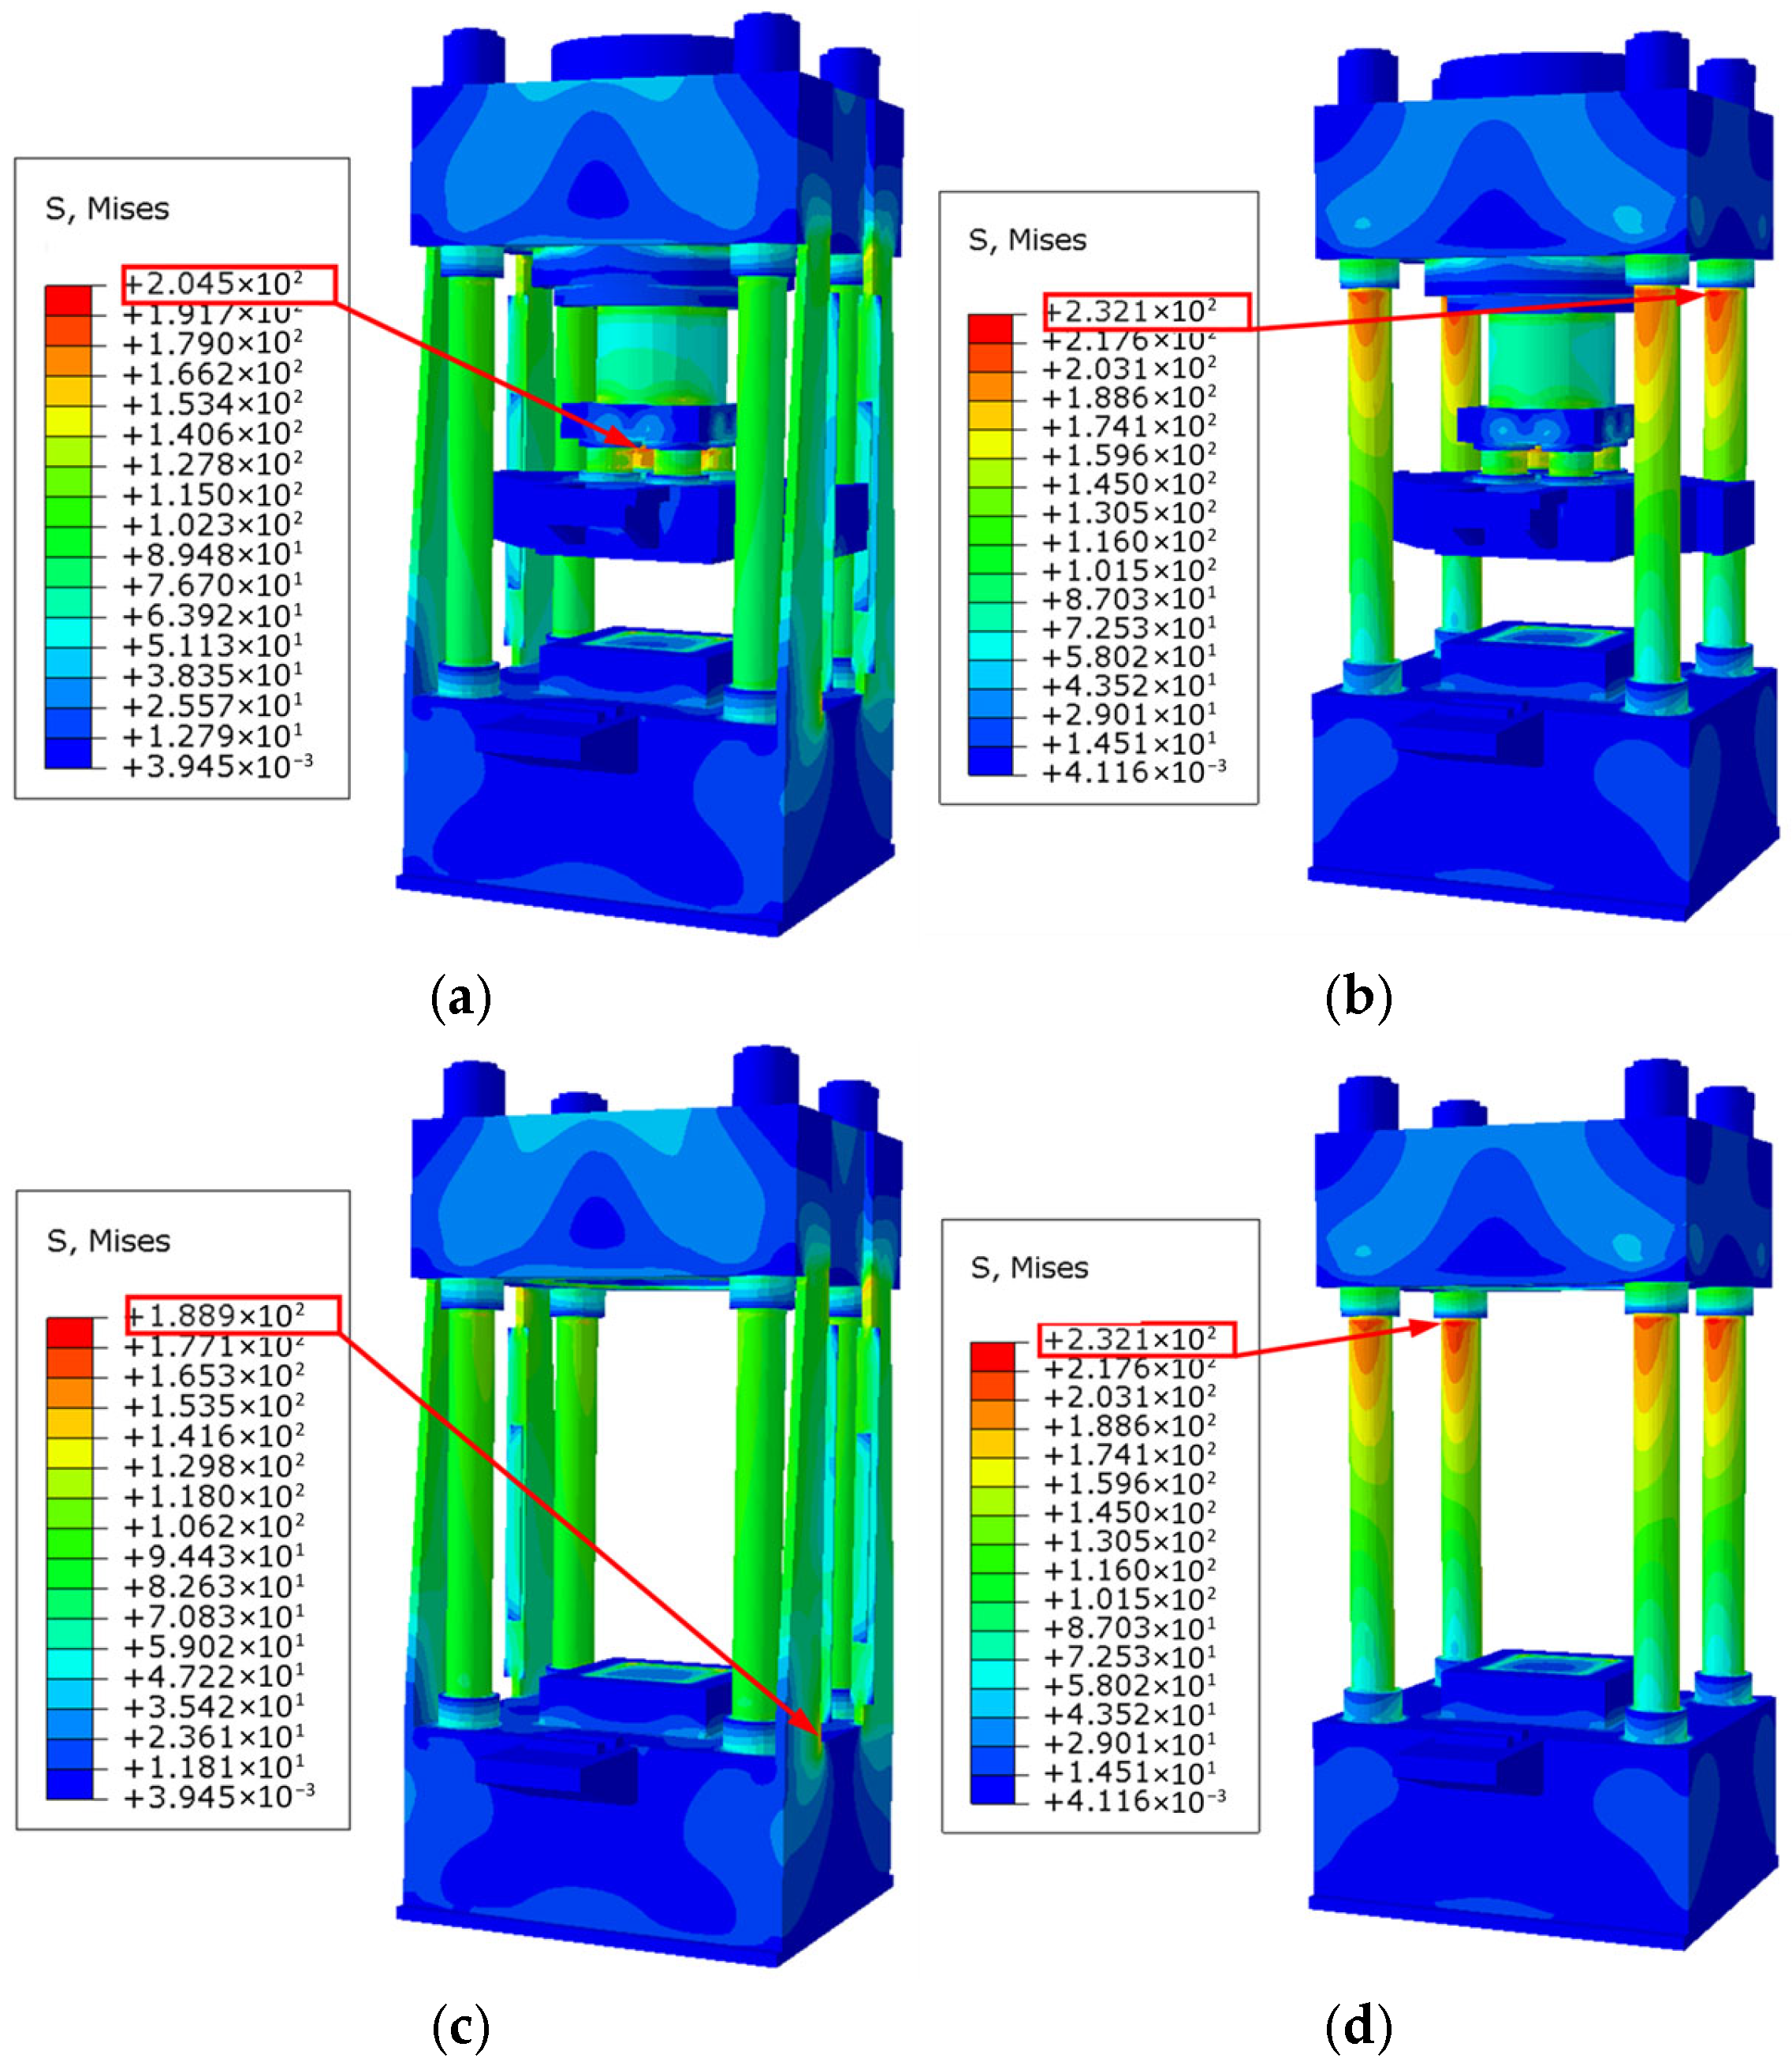
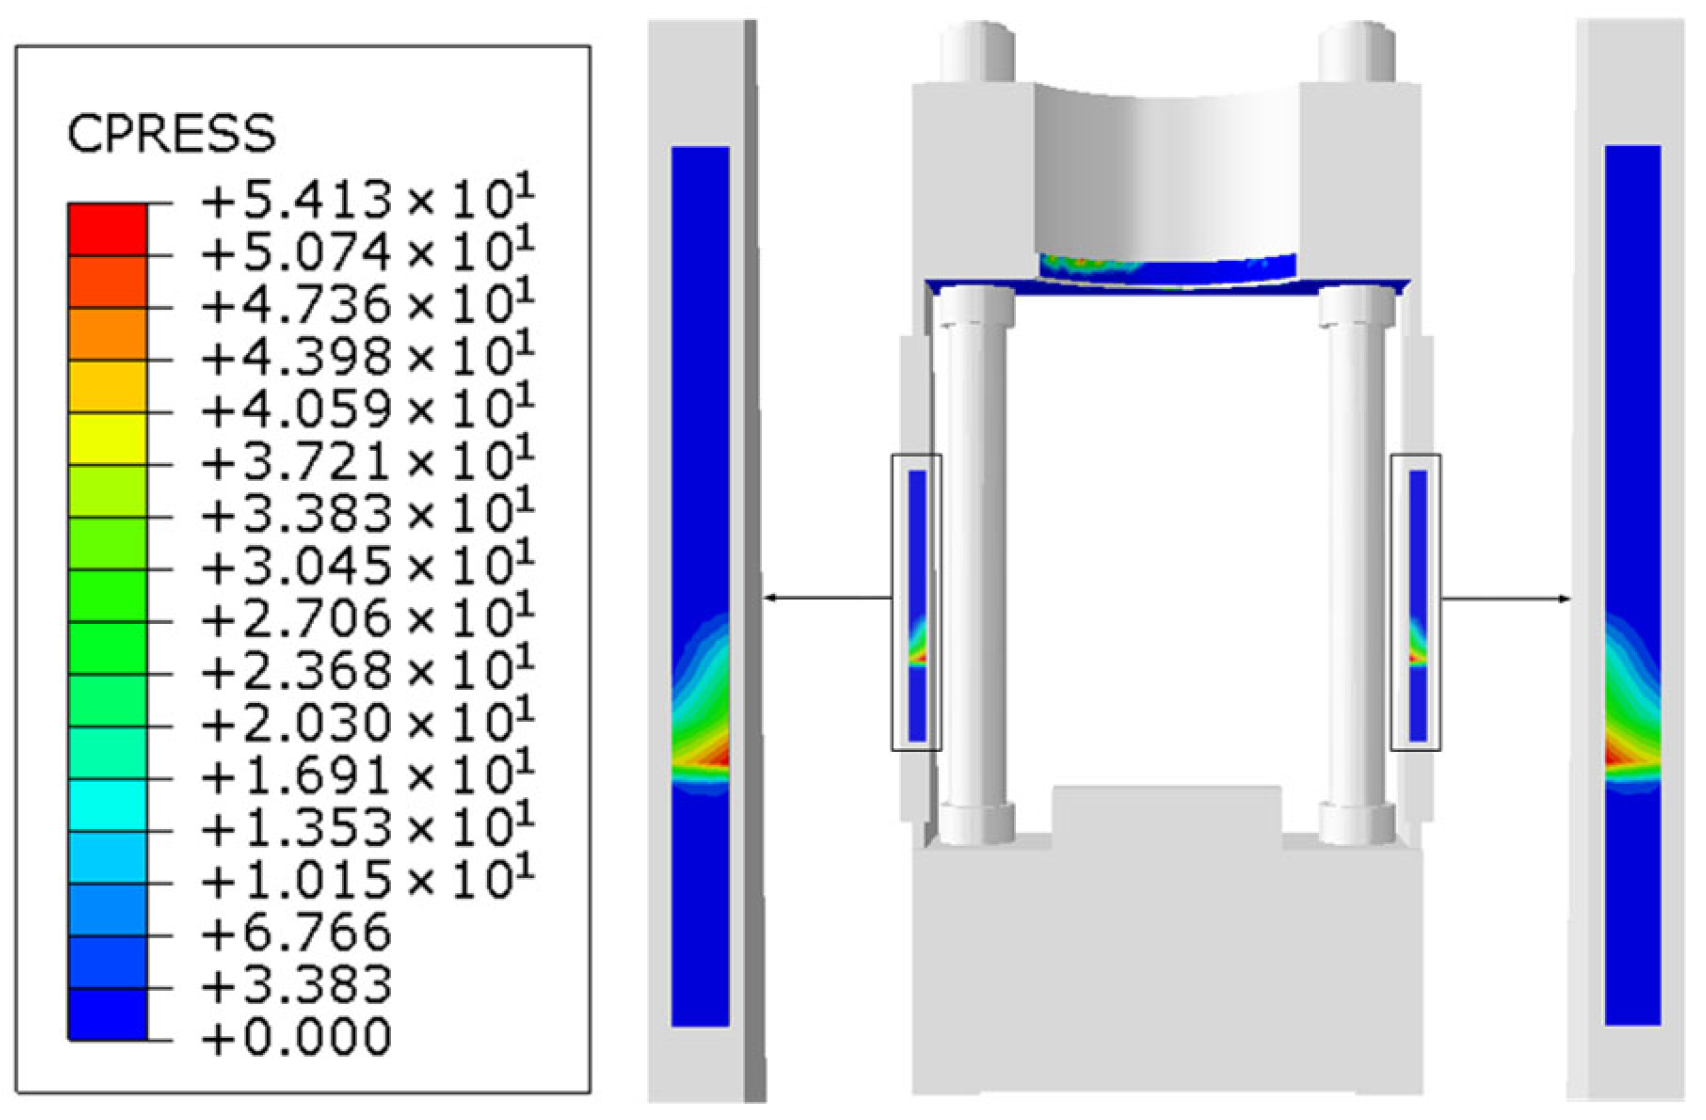
Figure 11 shows the stresses of the whole machine and the frame under ultimate static double compression-shear. Similarly, regardless of the presence or absence of lateral reaction plates, the stresses in the lower base, upper pressure plate, and upper beam are relatively small, and the stresses in the flanges, columns, and lateral reaction plates are relatively large. In the absence of lateral reaction plates, the maximum stress of the whole machine and frame is located at the columns. While in the presence of lateral reaction plates, the maximum stress of the whole machine is located at the flanges, and the maximum stress of the frame is located at the lateral reaction plates connected to the lower base. In other words, the maximum stress position is successfully transferred from the high-cost columns to the low-cost flanges and lateral reaction plates. Not only is the position of the maximum stress successfully transferred, but the value of the maximum stress also significantly decreases. The maximum stresses of the whole machine and the frame with lateral reaction plates are both smaller than those without the lateral reaction plates. For the whole machine, the maximum stress decreases from 232.1 MPa without the lateral reaction plates to 204.5 MPa with the lateral reaction plates, showing a decrease of 11.9%. For the frame, the maximum stress decreases from 232.1 MPa without the lateral reaction plates to 188.9 MPa with the lateral reaction plates, showing a decrease of 18.6%. This is because the lateral reaction plates contact the upper pressure plate and bear the load in the shear direction, thereby increasing the flexural rigidity of the whole frame and reducing the column stress, as shown in Figure 12. Consequently, compared to the traditional compression–shear–torsion testing machine with a sole-column frame, this compression–shear–torsion testing machine with a plate-column composite frame has higher strength and can bear ultimate static double compression-shear.
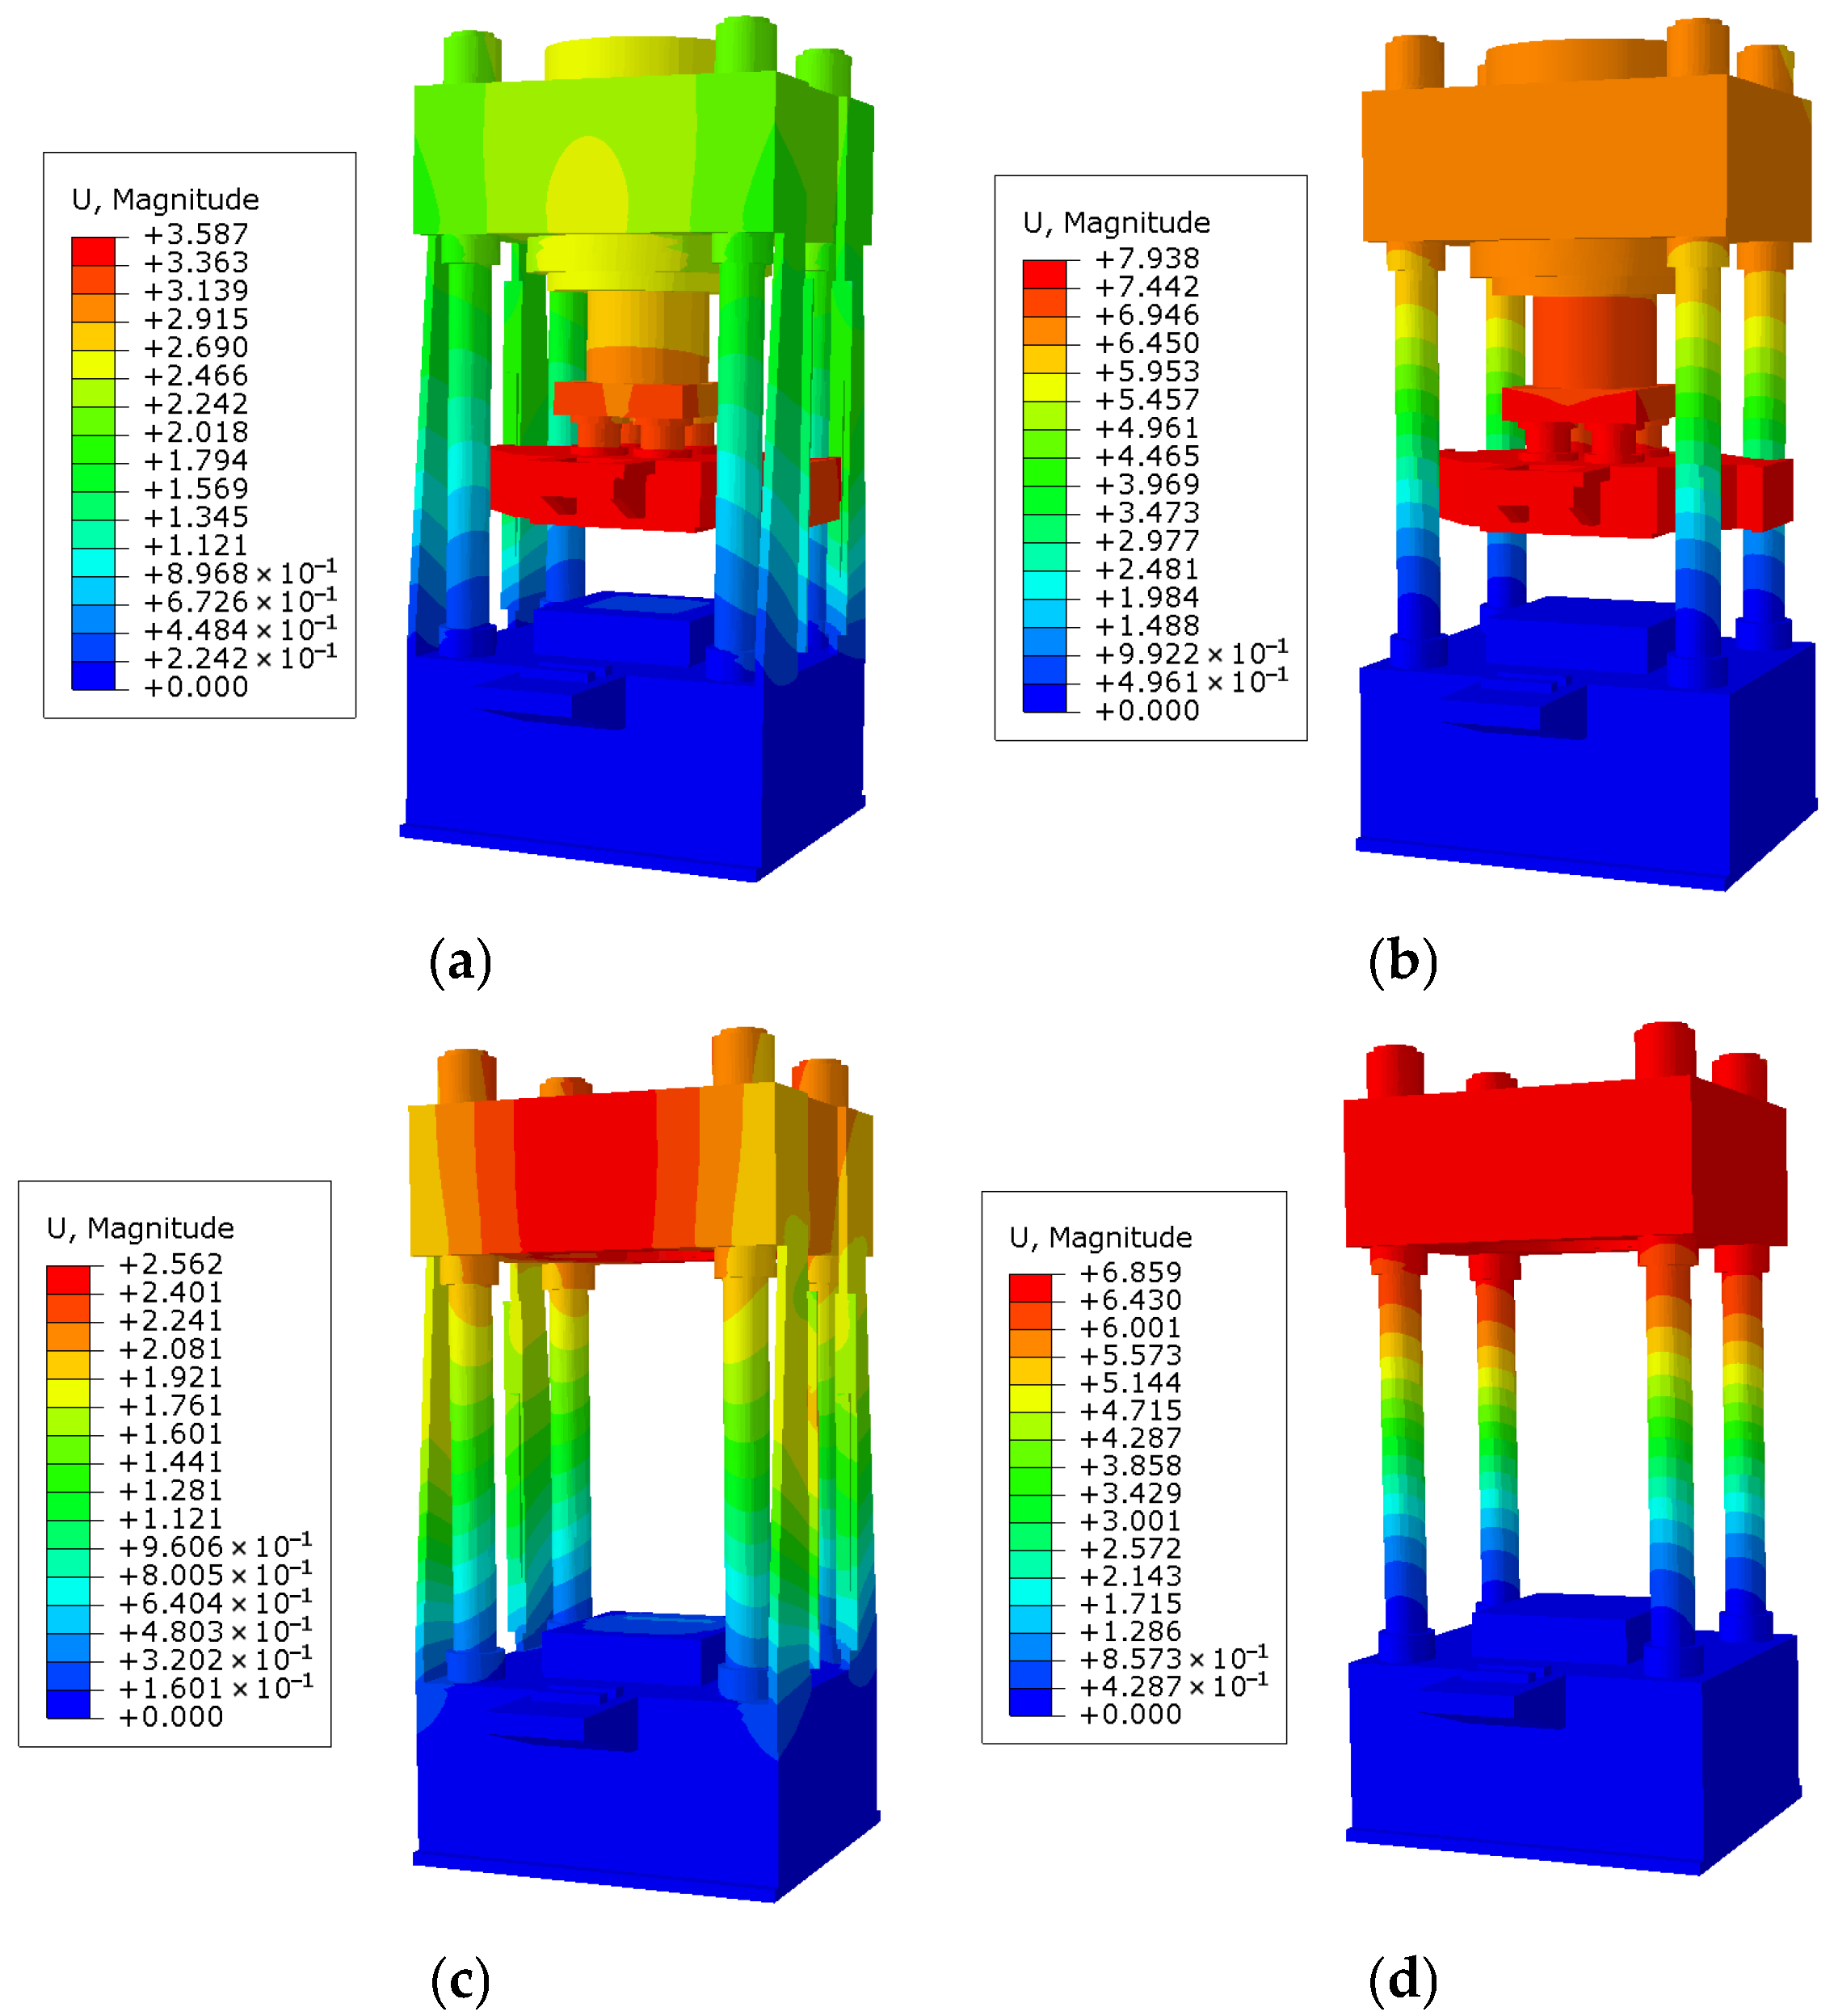
Figure 13 shows the displacement of the whole machine and the frame under ultimate static double compression-shear. Similarly, regardless of the presence or absence of lateral reaction plates, the displacement of the vertical compression device gradually decreases from bottom to top, and the displacement of the frame gradually increases from bottom to top. The maximum displacement of the whole machine is always located at the upper compression plate, while the maximum displacement of the frame is always located at the upper beam. Whether it is the whole machine or the frame, the maximum displacement with lateral reaction plates is much smaller than that without lateral reaction plates. For the whole machine, the maximum displacement decreases from 7.938 mm without lateral reaction plates to 3.587 mm with lateral reaction plates, showing a decrease of 54.8%. For the frame, the maximum displacement decreases from 6.859 mm without lateral reaction plates to 2.562 mm with lateral reaction plates, showing a decrease of 62.6%. Especially, the maximum displacement component in the shear direction decreases significantly from 6.061 mm without lateral reaction plates to 0.8523 mm with lateral reaction plates, showing a sharp decrease of 85.9%, as shown in Figure 14. This is because the lateral reaction plates contact the upper pressure plate and bear the load in the shear direction, thereby increasing the flexural rigidity of the whole frame and reducing the deformation of the upper beam and the upper compression plate in the shear direction. Consequently, compared to the traditional compression–shear–torsion testing machine with a sole-column frame, this compression–shear–torsion testing machine with a plate-column composite frame has higher stiffness and can bear ultimate static double compression-shear.

5.3. Simulation on Ultimate Static Single Compression-Shear

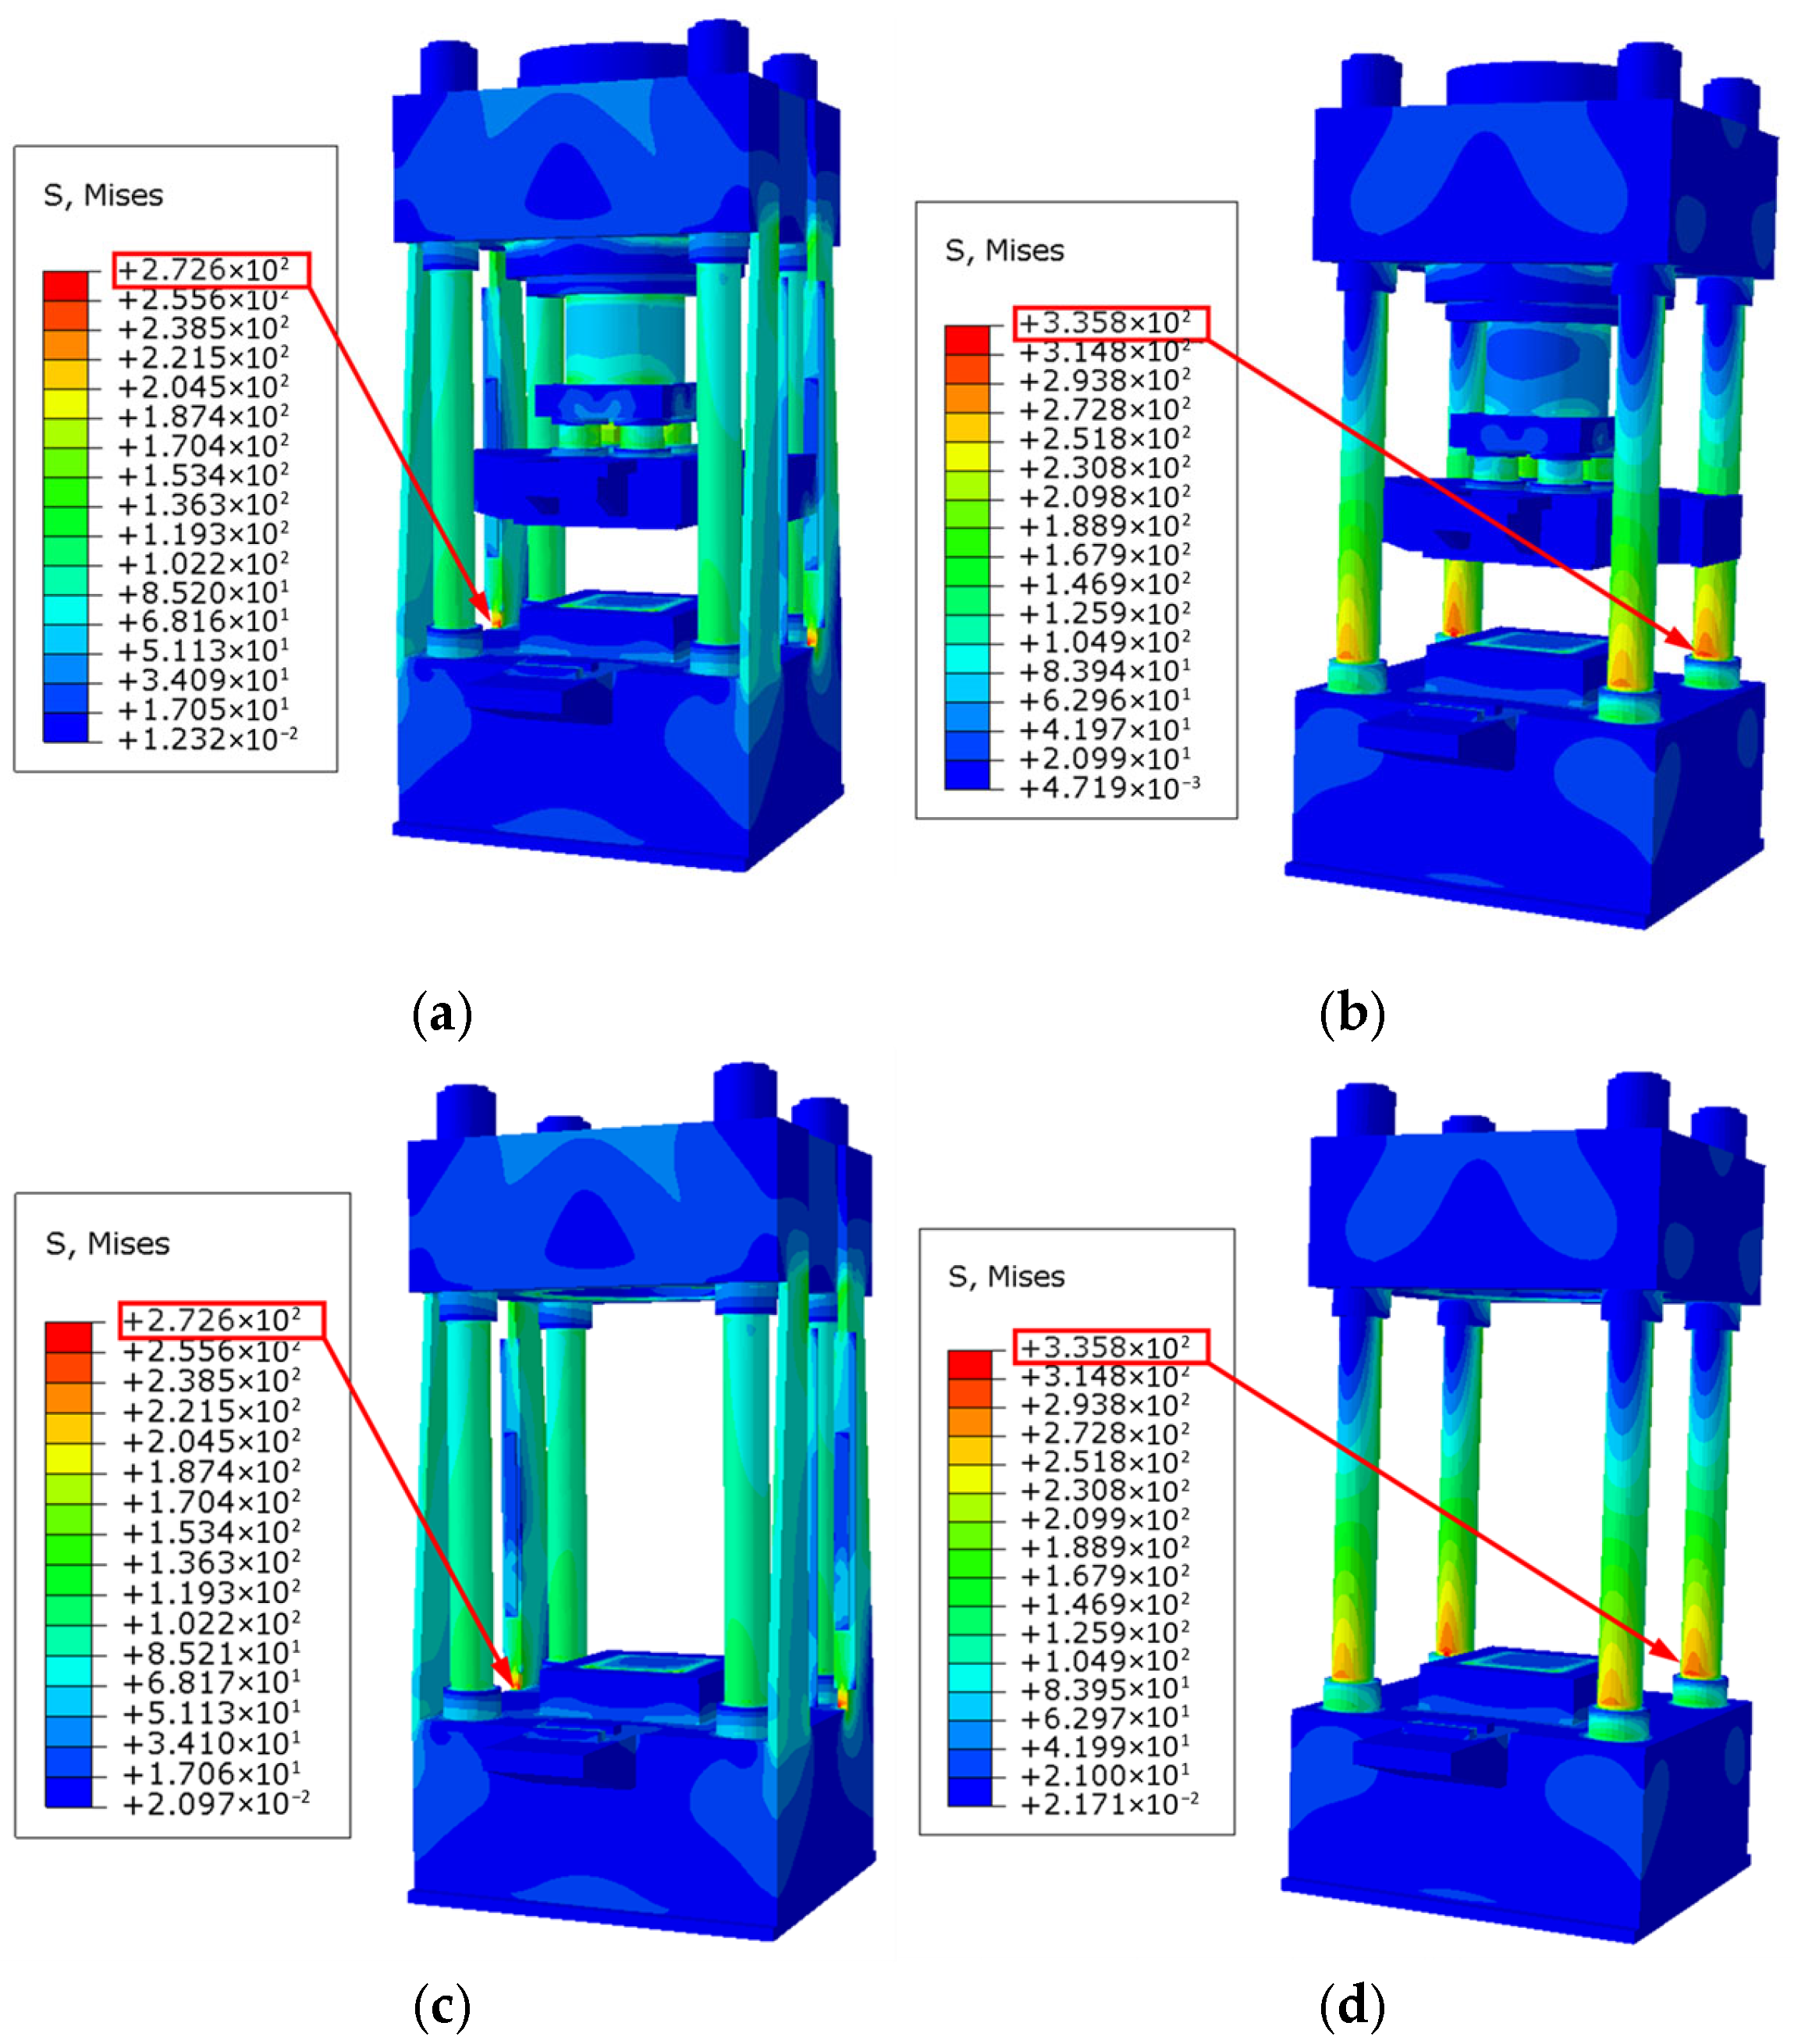
Figure 15 shows the stresses of the whole machine and the frame under ultimate static single compression-shear. In the absence of lateral reaction plates, the maximum stresses of the whole machine and the frame are both located at the columns connected to the lower base. While in the presence of lateral reaction plates, the maximum stress of the whole machine and the frame are both located at the lateral reaction plates connected to the lower base. In other words, the maximum stress position is successfully transferred from the high-cost column to the low-cost lateral reaction plates. The maximum stresses of the whole machine and the frame with lateral reaction plates are both smaller than those without the lateral reaction plates. For the whole machine and the frame, the maximum stress decreases from 335.8 MPa without the lateral reaction plates to 272.6 MPa with the lateral reaction plates, showing a decrease of 18.8%. This is also because the lateral reaction plates contact the upper pressure plate and bear the load in the shear direction, thereby increasing the flexural rigidity of the whole frame and reducing the column stress. Consequently, compared to the traditional compression–shear–torsion testing machine with a sole-column frame, this compression–shear–torsion testing machine with a plate-column composite frame has higher strength and can bear ultimate static single compression-shear.
Figure 16 shows the displacement of the whole machine and the frame under ultimate static single compression-shear. Similarly, regardless of the presence or absence of lateral reaction plates, the displacement of the vertical compression device gradually decreases from bottom to top, and the displacement of the frame gradually increases from bottom to top. In the absence of lateral reaction plates, the maximum displacements of the whole machine and the frame are 13.9 mm and 12.44 mm, respectively, which have exceeded the maximum allowable displacement (1/1000 of the overall dimensions: 12 mm). Under such a large displacement, yielding or fracture may occur in columns or other parts. As a result, the test data of the rubber bearings is no longer accurate, the whole testing machine is no longer stable, and the personal safety of testers cannot be guaranteed. So, the traditional testing machine with a sole-column frame cannot meet the stiffness requirements. The maximum displacement of the whole machine and the frame with lateral reaction plates is both much smaller than that without lateral reaction plates. For the whole machine, the maximum displacement decreases from 13.9 mm without lateral reaction plates to 3.819 mm with lateral reaction plates, showing a decrease of 72.5%. For the frame, the maximum displacement decreases from 12.44 mm without lateral reaction plates to 2.851 mm with lateral reaction plates, showing a decrease of 77.1%. This is also because the lateral reaction plates contact the upper pressure plate and bear the load in the shear direction, thereby increasing the flexural rigidity of the whole frame and reducing the deformation of the upper beam and the upper compression plate in the shear direction. Consequently, compared to the traditional compression–shear–torsion testing machine with a sole-column frame, this compression–shear–torsion testing machine with a plate-column composite frame has higher stiffness and can bear ultimate static single compression-shear.

5.4. Simulation on Ultimate Dynamic Single Compression-Shear

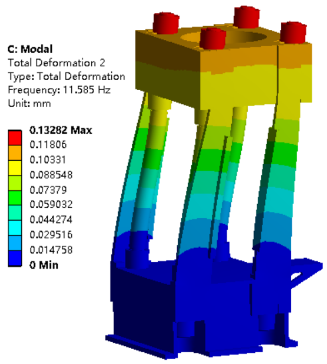
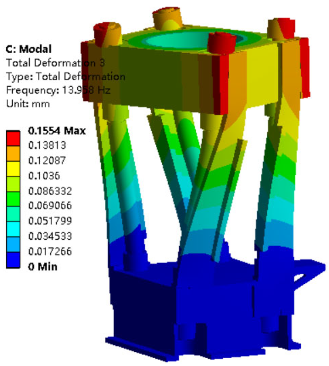
Although the testing machine meets the strength and stiffness requirements under the ultimate static single compression-shear, a simulation on the ultimate dynamic single compression-shear is still necessary, because the working frequency of the dynamic single compression-shear ranges from 0 to 5 Hz. Firstly, modal simulation is carried out to avoid resonance. Table 4 shows the first four natural frequencies, maximum displacements, and vibration modes. As the natural frequency increases, the maximum displacement gradually increases. Since the maximum operating frequency is less than the first natural frequency, it is judged that resonance will not occur. However, the maximum operating frequency is already close to the first natural frequency, so it is still essential to conduct a dynamic simulation at 5 Hz under the ultimate loading condition.
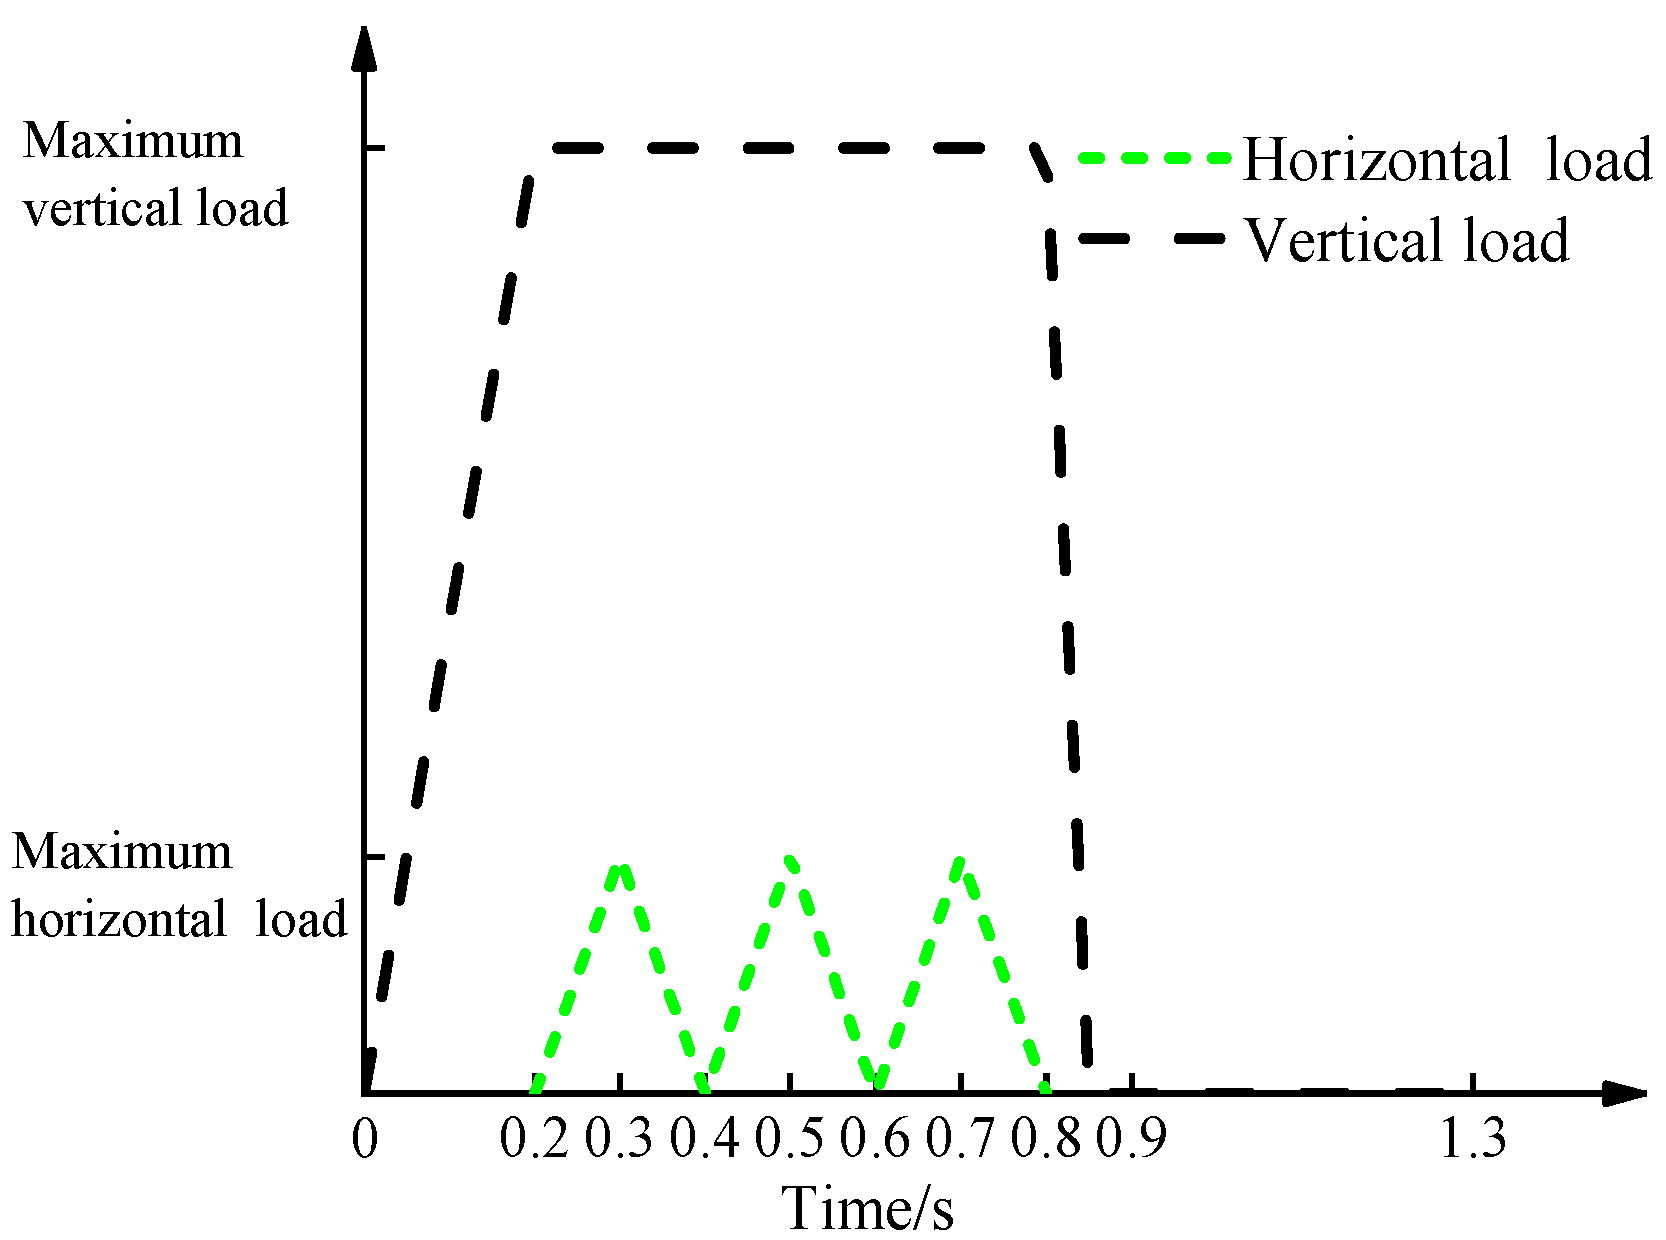
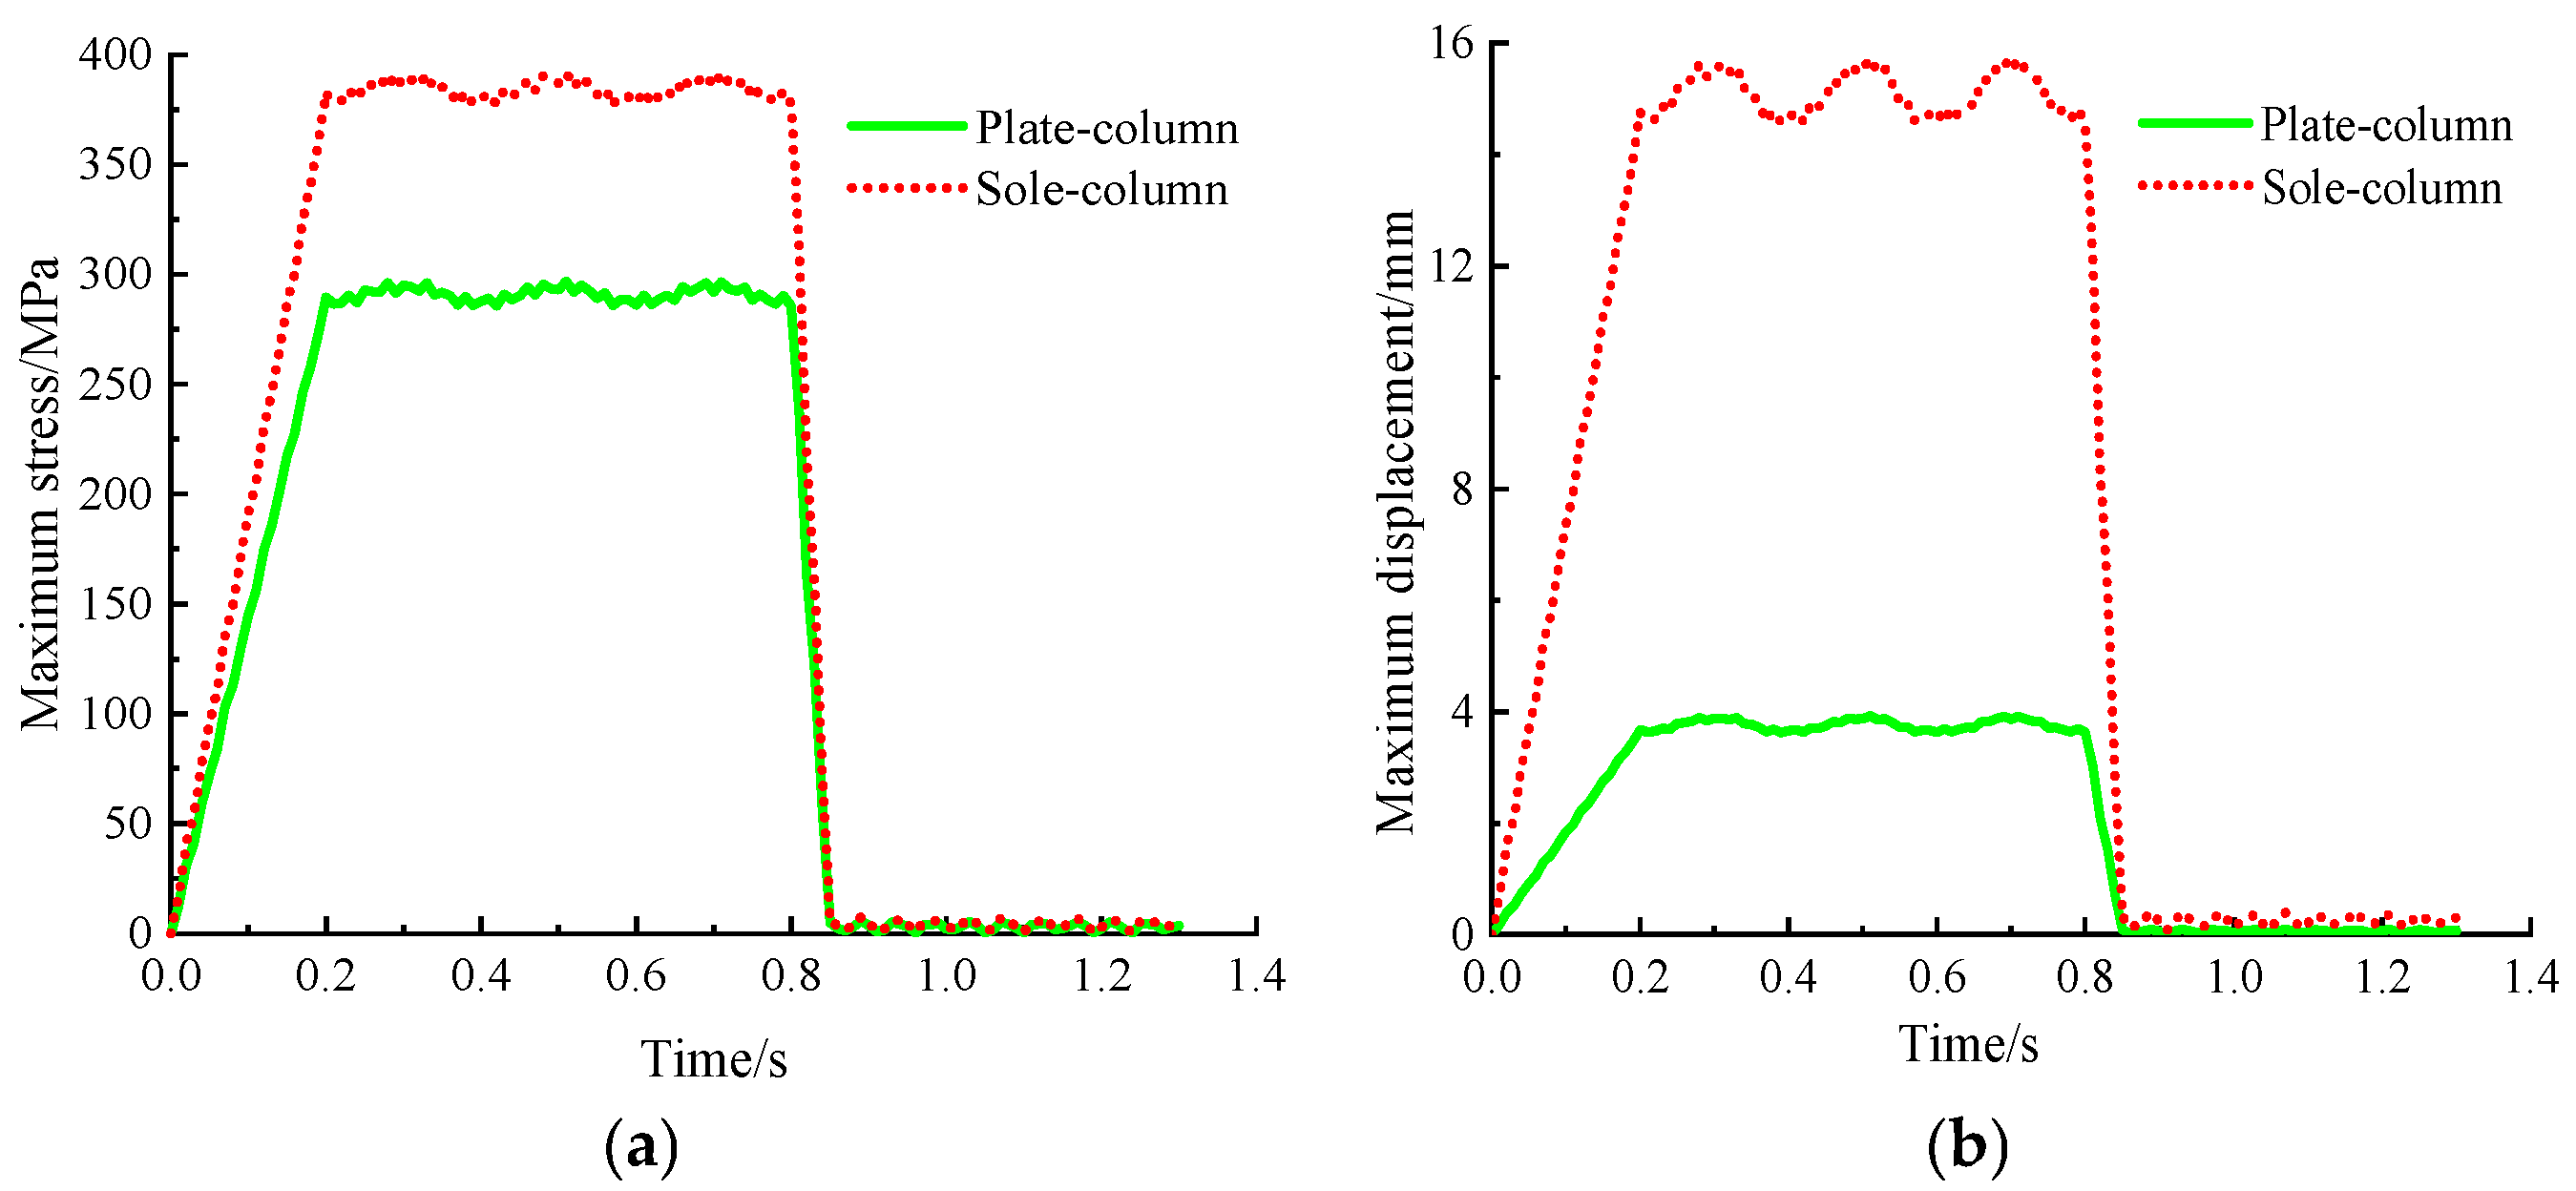
Figure 17 shows the loading process. Initially, from 0 to 0.2 s, the vertical reaction load P0 on the upper compression plate increases from 0 to the maximum value of 80 MN. Simultaneously, the vertical reaction loads on the two sides of the lower base, N40 and N50, increase from 0 to their maximum values of 55.57 MN and 24.43 MN, respectively, with the total load reaching 80 MN as well. Subsequently, from 0.2 to 0.8 s, the two horizontal loads F20 and f30 are applied. Specifically, from 0.2 to 0.3 s, the horizontal load gradually increases from 0 to the maximum value of 3 MN. Then, from 0.3 to 0.4 s, the horizontal load gradually drops back to 0, eventually completing one cycle of horizontal loading. This cycle is repeated 3 times. Next, from 0.8 to 0.85 s, the vertical loads are unloaded. At 0.85 s, the vertical loads and the horizontal loads all return to 0. Finally, the dynamic response process after unloading spans from 0.85 to 1.3 s.
Similarly, the maximum stress position is also successfully transferred from the high-cost columns to the low-cost lateral reaction plates. However, the maximum stress and the maximum displacement of the whole machine under the ultimate dynamic single compression-shear condition are slightly larger than those under the ultimate static single compression-shear condition. Moreover, regardless of the presence or absence of the lateral reaction plates, the maximum stress and the maximum displacement fluctuate periodically with a period of 0.2 s, which is consistent with the working period, as shown in Figure 18. In the absence of lateral reaction plates, the maximum stress of the whole machine fluctuates between 377.4~391.5 MPa, which is located on the column and is less than the yield strength of 930 MPa. However, the maximum displacement fluctuates between 14.6 and 15.7 mm, which has exceeded the maximum allowable displacement (1/1000 of the overall dimensions: 12 mm); therefore, the traditional testing machine with a sole-column frame cannot meet the stiffness requirements. In the presence of lateral reaction plates, the maximum stress and the maximum displacement of the whole machine are much smaller. The maximum stress of the whole machine fluctuates between 285.9~296.1 MPa, and the maximum displacement of the whole machine fluctuates between 3.65 and 3.92 mm, which is less than the maximum allowable displacement and can meet the stiffness requirements. Consequently, compared to the traditional compression–shear–torsion testing machine with a sole-column frame, this compression–shear–torsion testing machine with a plate-column composite frame has higher strength and stiffness and can bear ultimate dynamic single compression-shear.
Although this testing machine can bear ultimate dynamic single compression-shear and avoid resonance, operating near a natural frequency risks amplifying dynamic responses due to damping uncertainties. Once yielding or fracture occurs in some parts, the test data of the rubber bearings will no longer be accurate, the whole testing machine will no longer be stable, and the personal safety of testers cannot be guaranteed. Therefore, it is not advisable to conduct dynamic single compression-shear experiments within the frequency range close to the first-order natural frequency.

5.5. Simulation on Ultimate Static Compression-Torsion

Figure 19 shows the stresses of the whole machine and the frame under ultimate static compression-torsion. Regardless of the presence or absence of lateral reaction plates, the stresses in the lower base, upper pressure plate, and upper beam are relatively small, and the stresses in the flanges, columns, and lateral reaction plates are relatively large. The maximum stress of the whole machine is always located at the flanges. In the absence of lateral reaction plates, the maximum stress of the frame is located at the columns. While in the presence of lateral reaction plates, the maximum stress of the frame is the lateral reaction plates. In other words, the maximum stress position is successfully transferred from the high-cost columns to the low-cost lateral reaction plates. Not only is the position of the maximum stress successfully transferred, but the value of the maximum stress also significantly decreases. Because the lateral reaction plates increase the bearing area in the vertical direction, the maximum stresses of the whole machine and the frame with lateral reaction plates are both smaller than those without the lateral reaction plates. For the whole machine, the maximum stress decreases from 228.3 MPa without the lateral reaction plates to 215.4 MPa with the lateral reaction plates, showing a decrease of 5.6%. For the frame, the maximum stress decreases from 164.2 MPa without the lateral reaction plates to 141.9 MPa with the lateral reaction plates, showing a decrease of 13.5%. Consequently, compared to the traditional compression–shear–torsion testing machine with a sole-column frame, this compression–shear–torsion testing machine with a plate-column composite frame has higher strength and can bear ultimate static compression-torsion.
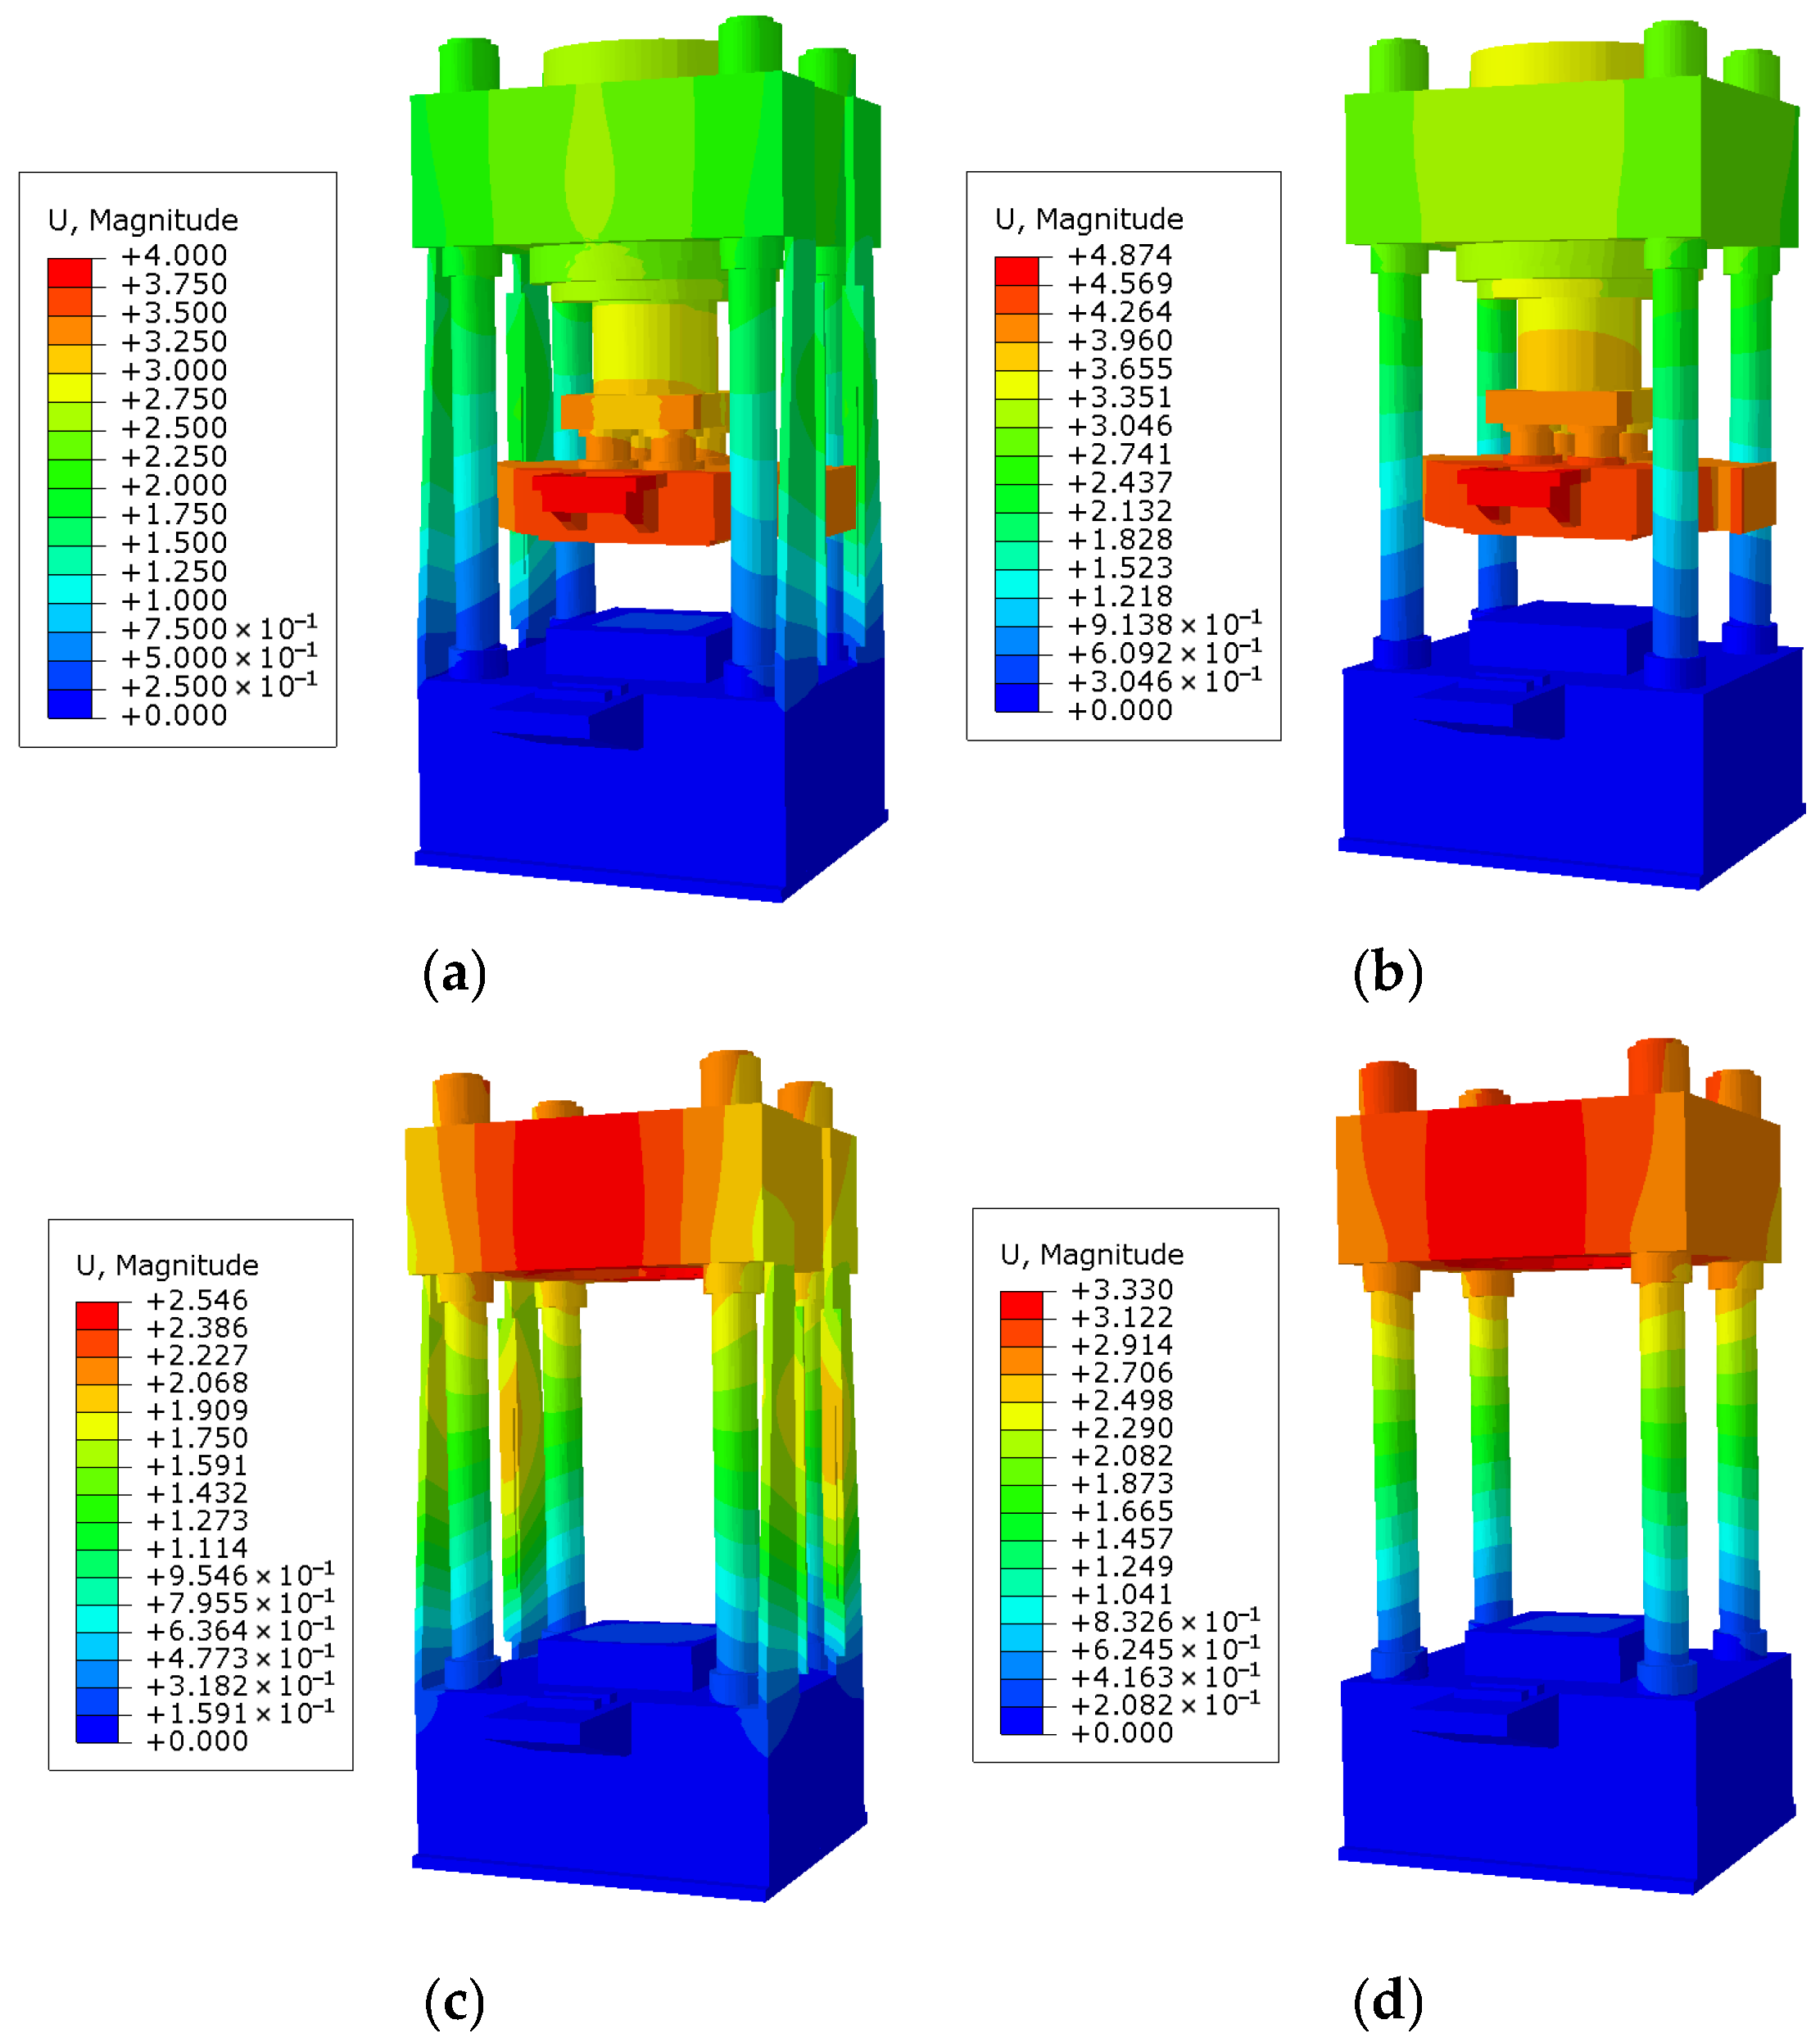
Figure 20 shows the displacement of the whole machine and the frame under ultimate static single compression-torsion. Regardless of the presence or absence of lateral reaction plates, the displacement of the vertical compression device gradually decreases from bottom to top, and the displacement of the frame gradually increases from bottom to top. Due to the action of the torsional load, the maximum displacement of the whole machine is always located at the torsional hydraulic cylinder support, while the maximum displacement of the frame is always located at the upper beam. Whether it is the whole machine or the frame, the maximum displacement with lateral reaction plates is significantly smaller than that without lateral reaction plates. For the whole machine, the maximum displacement decreases from 4.874 mm without lateral reaction plates to 4.000 mm with lateral reaction plates, a decrease of 17%. For the frame, the maximum displacement decreases from 3.330 mm without lateral reaction plates to 2.546 mm with lateral reaction plates, showing a decrease of 23.5%. Consequently, compared to the traditional compression–shear–torsion testing machine with a sole-column frame, this compression–shear–torsion testing machine with a plate-column composite frame has higher stiffness and can bear ultimate static compression-torsion.
Because the torsional load value is small and the testing machine has high stiffness in the vertical direction, there is no significant difference between static compression torsion and vertical compression on the stress diagram, except for a slight left-right asymmetry.

6. Simulation Comparison and Experimental Observation

6.1. Simulation Comparison

Table 5 and Table 6, respectively, show the maximum stress and maximum displacement of the testing machine under five ultimate loading conditions, namely static vertical compression, static single compression-shear, static double compression-shear, static compression torsion, and dynamic single compression-shear. No matter which ultimate loading condition, the lateral reaction plates can significantly reduce the maximum stress and maximum displacement, proving that the testing machine with a plate-column composite frame has higher strength and stiffness than the testing machine with a sole-column frame. Moreover, under static single compression-shear and dynamic single compression-shear, the maximum stress and maximum displacement are significantly larger than those under the other three conditions. The lateral reaction plates show the largest reduction amplitude under these two conditions. Specifically, the maximum total stress of the whole machine is reduced by 18.8% and 24.4%, respectively, and the maximum displacement of the whole machine is reduced by up to 72.5% and 75.0%, respectively.

6.2. Experimental Observation

For large-tonnage testing machines with a large number of components, experimental verification is challenging and complex. Thus, this study does not conduct mechanical experiments for verification but only conducts loading experiments for observation. Next, the Hubei Institute of Measurement and Testing Technology conducted the five ultimate bearing capacity experiments after adding pressure sensors, as shown in Figure 21. In the ultimate static vertical compression experiment, the maximum vertical load reached 80 MN. In the ultimate static single compression-shear, ultimate static double compression-shear, and ultimate dynamic single compression-shear experiments, the maximum vertical load reached 80 MN, and the maximum horizontal load reached 3 MN. In the ultimate static compression-torsion experiment, the maximum vertical load reached 80 MN, and the maximum torsional load reached 1.8 MN. No yielding or fracture occurred during the five ultimate loading experimental processes, further demonstrating that this testing machine, with a plate-column composite frame, can withstand the five ultimate loading tests.

6.3. Simulation Guidance

The simulation results show that due to the plate-column composite frame, the maximum stress and maximum displacement are still much smaller than the yield strength and the maximum allowable displacement. Thus, the testing machine can be continuously extended to a larger tonnage or three combined loading actions. However, because operating near a natural frequency risk amplifies dynamic responses due to damping uncertainties, it is not advisable to conduct dynamic single compression-shear experiments within the frequency range close to the first-order natural frequency. Moreover, this ultimate bearing simulation method can also be applied to other testing machines to replace experiments for determining the values and positions of the maximum stress and maximum displacement.

7. Conclusions

(1)
This compression–shear–torsion multifunctional bridge bearing testing machine consists of a vertical compression device, a single shear device, a double shear device, a torsion device, enabling five loading tests: static vertical compression, static double compression-shear, static single compression-shear, dynamic single compression-shear, and static compression-torsion.
(2)
Because the lateral reaction plates increase the bearing area in the vertical direction and bear the load in the shear direction, the maximum stress position is successfully transferred from the high-cost columns to the low-cost lateral reaction plates, and both the maximum stress and the maximum displacement under the five ultimate loading conditions are decreased after introducing the lateral reaction plates.
(3)
The lateral reaction plates have a great promoting effect on single compression-shear. During ultimate static single compression-shear and dynamic single compression-shear, the maximum total stress of the whole machine is reduced by 18.8% and 24.4%, respectively, and the maximum displacement of the whole machine is reduced by up to 72.5% and 75.0%, respectively.
(4)
Under the five ultimate loading conditions, the maximum stress is less than the yield strength, and the maximum displacement is less than the maximum allowable displacement, indicating that this testing machine meets the strength and stiffness requirements and can bear the five ultimate loading tests and withstand an ultimate vertical load of 80 MN.
(5)
As a result of the plate-column composite frame, the maximum stress and maximum displacement become smaller than the yield strength and the maximum allowable displacement. Thus, the testing machine can be continuously extended to a larger tonnage or three combined loading actions. Moreover, this ultimate bearing simulation method can also be applied to other testing machines to replace experiments for determining the values and positions of the maximum stress and maximum displacement.

Author Contributions

Conceptualization, S.M.; methodology, M.C.; software, J.S.; validation, T.L.; formal analysis, S.M.; investigation, M.C.; resources, J.S.; data curation, T.L.; writing—original draft preparation, S.M.; writing—review and editing, M.C.; visualization, J.S.; supervision, T.L.; project administration, S.M.; funding acquisition, S.M. All authors have read and agreed to the published version of the manuscript.

Funding

This research was funded by the Key Scientific and Technological Project of Henan Province, grant number 252102230050, the Key Research and Development Project of Henan Province, grant number 221111220600, and the Science and Technology Project of Henan Provincial Department of Transportation, grant number 2023-1-2.

Data Availability Statement

The original contributions presented in this study are included in the article. Further inquiries can be directed to the corresponding author.

Conflicts of Interest

Author Jinggan Shao was employed by the company Henan Jiaoyuan Engineering Technology Group Co., Ltd. The remaining authors declare that the research was conducted in the absence of any commercial or financial relation-ships that could be construed as a potential conflict of interest.

References

  1. Zhang, B.; Lu, G.; Yang, C.; Xu, M.; Wang, K. Seismic damage assessment of bonded versus unbonded laminated rubber bearings: A deep learning perspective. Eng. Struct. 2024, 321, 118996. [Google Scholar] [CrossRef]
  2. Shi, Q.; Bu, Z. Numerical Simulation of Quasi-Static Tests on Prefabricated Composite Rubber-Concrete Bridge Piers. J. Phys. Conf. Ser. 2025, 3027, 012067. [Google Scholar] [CrossRef]
  3. Zhou, J.; Tang, T.; Wang, X.; Huang, C.; Su, J.; Yi, J.; Guo, J. Influence of Bridge Bearings on Mitigating Nonlinear Seismic Responses of Straddle-Type Monorail Trains. Struct. Control Health Monit. 2025, 6724029. [Google Scholar] [CrossRef]
  4. Wang, J.; Liang, C.; Miao, F.; Xu, J.; Qi, W. Research on Seismic Mitigation Performance of Zinc-Aluminum-Core GFRP High-Damping Rubber Bearings for Long-Span Continuous Girder Bridge. Bridge Constr. 2025, 55, 25–33. [Google Scholar]
  5. Shen, J.; Igarashi, A.; Dang, J.; Hamada, Y.; Himeno, T. Low-temperature effect on seismic performance of isolated highway bridges with high damping rubber bearings. Eng. Struct. 2025, 343, 121008. [Google Scholar] [CrossRef]
  6. Yang, J.; Pan, W.; Zhang, Y.; Cai, Z. A study on mechanical properties of variable stiffness rubber bearings based on the stiffness matrix analysis method. J. Vib. Shock 2024, 43, 106–118. [Google Scholar]
  7. Sebaq, S.M.; Zhou, Y.; Zhang, Z. Hysteretic and seismic behavior of thick rubber bearings under bidirectional shear loading. Soil Dyn. Earthq. Eng. 2025, 191, 109279. [Google Scholar] [CrossRef]
  8. Simsek, A.; Ozdemir, G.; Yazgan, U. Effect of lead core heating on residual displacements of lead rubber bearings under bi-directional earthquake excitations. J. Earthq. Eng. 2024, 28, 4621–4643. [Google Scholar] [CrossRef]
  9. Zhong, H.; Yuan, W.; Dang, X.; Deng, X. Seismic Performance of Composite Rubber Bearings for Highway Bridges, Bearing Test and Numerical Parametric Study. Eng. Struct. 2022, 253, 113680. [Google Scholar] [CrossRef]
  10. Xue, B.; Lu, W.; Ren, X.; Wen, W. Coupled Thermal and Mechanical Behavior of Lead–Rubber Bearings: Full-Scale Testing and Numerical Modeling Methodology. Struct. Control Health Monit. 2025, 8186890. [Google Scholar] [CrossRef]
  11. Wang, B.; Niu, Q.; Chen, P.; Zhang, Z.; Karavasilis, T.L. Experimental and numerical investigations on mechanical properties of high-damping rubber bearings under large strain loading. Constr. Build. Mater. 2025, 467, 140390. [Google Scholar] [CrossRef]
  12. Wang, X.; Wang, L.; Sun, R.; Zhang, W. Electro-hydraulic servo testing machine of analysis and optimization based on FEM. J. Changchun Univ. Technol. 2018, 39, 243–247. [Google Scholar]
  13. Wu, T. Direct Drive Electro-Hydraulic Servo Control System and Its Application in 20MN Pressure-Shear Testing Machine. Master’s Thesis, Jilin University, Jilin, China, 2018. [Google Scholar]
  14. Yan, X.; Chen, B. Analysis of a novel energy-efficient system with 3-D vertical structure for hydraulic press. Energy 2021, 218, 119518. [Google Scholar] [CrossRef]
  15. Xu, M. Development of 50MN bridge bearing compression-shear-rotation multi-functional testing machine. Eng. Constr. 2016, 30, 499–501. [Google Scholar]
  16. Wu, C.; Shi, W. Structural design of large compression and shear testing machine. Struct. Eng. 2023, 39, 30–37. [Google Scholar]
  17. Zahalka, M. Modal analysis of hydraulic press frames for open die forging. Procedia Eng. 2014, 69, 1070–1075. [Google Scholar] [CrossRef]
  18. Wand, J. Main Structure Design and Performance Analysis of 60MN Compression Shear Testing Machine. Master’s Thesis, Zhengzhou University, Zhengzhou, China, 2022. [Google Scholar]
  19. Wu, G.; Cui, B.; Li, Y.; Shao, J.; He, Z.; Zhao, S.; Li, C.; Yu, J. Static topology optimization and dynamic characteristics analysis of 6000T compression-shear test machine frame. Adv. Civ. Eng. 2021, 6954576. [Google Scholar] [CrossRef]
  20. Li, Y.; Li, C. Topology optimization and simulation of compression-shear test machine frame. Mech. Tool Hydraul. 2023, 51, 189–195. [Google Scholar]
  21. Zhang, J.; Liu, K.; Wu, G. Research on Fuzzy PID Control System of 60MN Pressure Shear Tester in Variable Theory Domain. Mech. Design Manuf. 2025, 408, 198–202. [Google Scholar]
  22. Amar, J.; Priam, V.P.; Salim, J. Development of bench top biaxial tensile testing machine. Mater. Sci. Eng. 2020, 810, 012028. [Google Scholar]
  23. Oance, I.S.; Gelmambet, S.; Popa, A.R. Tension and compression testing machine for friction dampers. Ovid. Univ. Ann. Constanta-Ser. Civil Eng. 2019, 21, 105–108. [Google Scholar] [CrossRef]
  24. Aydın, M.; Yasin, K. Hydraulic press design under different loading conditions using finite element analysis. Eng. Sci. Technol. Int. J. 2013, 16, 129–138. [Google Scholar]
  25. Han, B.; Wang, D.; Liu, L. Structural analysis of plate-type hydroforming hydraulic press. Ferroelectrics 2024, 618, 2101–2111. [Google Scholar] [CrossRef]
  26. Shan, G.; Guo, J. Structure and Hydraulic System Design of Large-Scale Compression-Shear Testing Machine for Shock-Absorbing Rubber Bearings. Mech. Tool Hydraul. 2022, 50, 101–106. [Google Scholar]
  27. Cai, J.; Li, Z.; Wang, C.; Shi, Y.; Su, B. A High-Sensitivity 3-D Displacement Sensor for Deformation Monitoring of Rubber Bearing. IEEE Sens. J. 2024, 24, 31114–31130. [Google Scholar] [CrossRef]
  28. Wang, S.; Wu, Q.; Li, Y.; Zi, D.; Wei, L.; Liang, Y. Experimental investigation on mechanical and aging properties of novel high durability NR/EPDM blended rubber bearings. Constr. Build. Mater. 2025, 492, 142832. [Google Scholar] [CrossRef]
  29. Wu, D.; Li, C.; Yang, Z.; Liu, Y.; Xiong, Y.; Jiang, G. Probability Distribution Characteristics of Horizontal and Vertical Mechanical Properties of Rubber Bearings. Materials 2022, 15, 8031. [Google Scholar] [CrossRef]
  30. Kuang, C.; Tan, P.; Chen, M.; Li, Z.; Luo, H. Experimental research on mechanical properties of high damping thick rubber bearings. J. Vib. Eng. 2024, 37, 1584–1592. [Google Scholar]
  31. GB/T 20688.4-2023; Rubber Bearings—Part 4: Normal Rubber Bearings. State Administration for Market Regulation: Beijing, China, 2023.
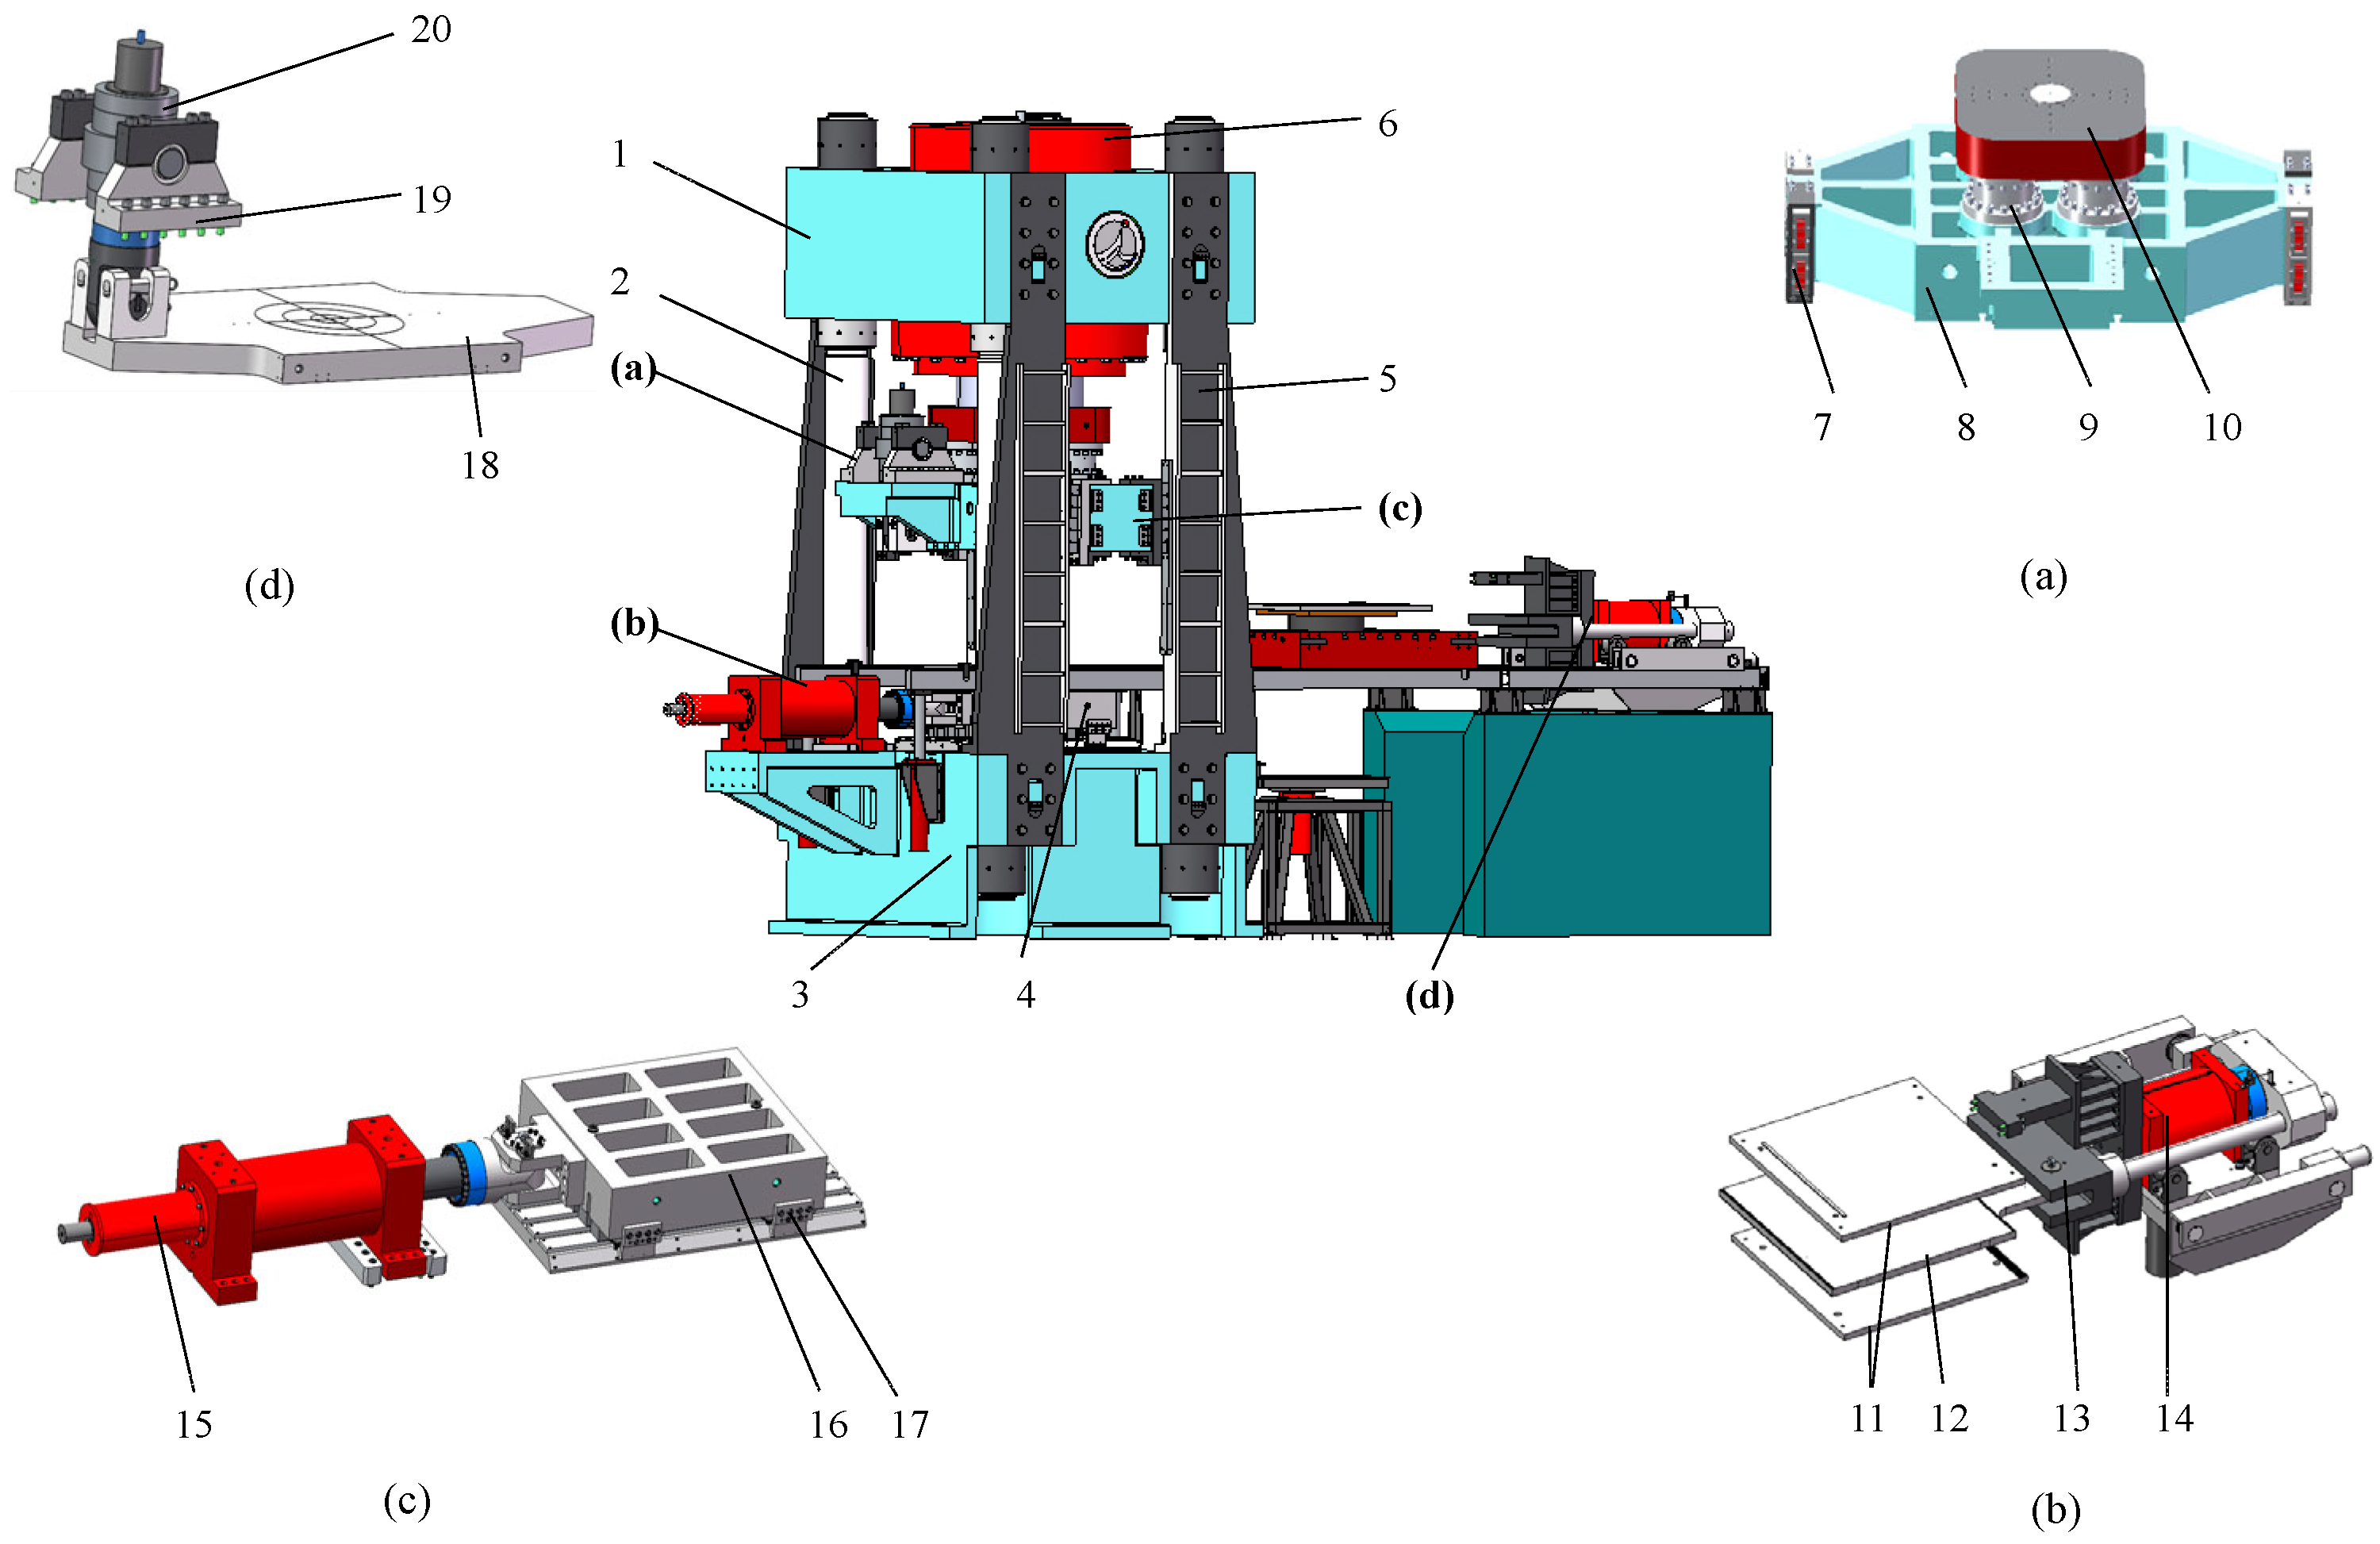
Figure 1. Three-dimensional model of the compression–shear–torsion testing machine (a) Vertical compression device, (b) Single shear device, (c) Double shear device, and (d) Torsion device. 1—Upper beam, 2—Column, 3—Lower base, 4—Compression workbench, 5—Lateral reaction plates, 6—Vertical compression hydraulic cylinder, 7—Rolling guide block, 8—Upper pressure plate, 9—Force sensor, 10—Transition flanges, 11—Friction plate, 12—Shear plate, 13—Front beam, 14—Double shear hydraulic cylinder, 15—Single shear hydraulic cylinder, 16—Single shear workbench, 17—Guiding rail block, 18—Torsion plate, 19—Mounting support, 20—Torsion hydraulic cylinder.
Processes 13 03331 g001
Figure 2. On-site photo of 80 MN compression–shear–torsion multifunctional bridge bearing testing machine with a plate-column composite frame.
Processes 13 03331 g002
Figure 3. Loading states of (a) specimen and (b) testing machine under vertical compression.
Processes 13 03331 g003
Figure 7. Three-dimensional model of (a) the testing machine with a plate-column composite frame and (b) the traditional testing machine with a sole-column frame.
Processes 13 03331 g007
Figure 8. (a) Boundary conditions and (b) Mesh division.
Processes 13 03331 g008
Figure 9. Stresses of the whole machine (a) with a plate-column composite frame and (b) with a sole-column frame, and stresses of (c) plate-column composite frame and (d) sole-column frame under ultimate vertical compression.
Processes 13 03331 g009
Figure 10. Displacements of the whole machine (a) with a plate-column composite frame and (b) with a sole-column frame, and displacements of (c) plate-column composite frame and (d) sole-column frame under ultimate vertical compression.
Processes 13 03331 g010aProcesses 13 03331 g010b
Figure 11. Stresses of the whole machine (a) with a plate-column composite frame and (b) with a sole-column frame, and stresses of (c) plate-column composite frame and (d) sole-column frame under ultimate static double compression-shear.
Processes 13 03331 g011
Figure 12. Contact pressure under ultimate static double compression-shear.
Processes 13 03331 g012
Figure 13. Displacements of the whole machine (a) with a plate-column composite frame and (b) with a sole-column frame, and displacements of (c) plate-column composite frame and (d) sole-column frame under ultimate static double compression-shear.
Processes 13 03331 g013
Figure 14. Displacement component in the shear direction of the testing machine (a) with a plate-column composite frame and (b) with a sole-column frame under ultimate static double compression-shear.
Processes 13 03331 g014
Figure 15. Stresses of the whole machine (a) with a plate-column composite frame and (b) with a sole-column frame, and stresses of (c) plate-column composite frame and (d) sole-column frame under ultimate static single compression-shear.
Processes 13 03331 g015
Figure 16. Displacements of the whole machine (a) with a plate-column composite frame and (b) with a sole-column frame, and displacements of (c) plate-column composite frame and (d) sole-column frame under ultimate static single compression-shear.
Processes 13 03331 g016
Figure 17. Loading process.
Processes 13 03331 g017
Figure 18. Curves of (a) maximum stress and (b) maximum displacement of the whole machine under dynamic single compression-shear.
Processes 13 03331 g018
Figure 19. Stresses of the whole machine (a) with a plate-column composite frame and (b) with a sole-column frame, and stresses of (c) plate-column composite frame and (d) sole-column frame under ultimate static single compression-torsion.
Processes 13 03331 g019
Figure 20. Displacements of the whole machine (a) with a plate-column composite frame and (b) with a sole-column frame, and displacements of (c) plate-column composite frame and (d) sole-column frame under ultimate static compression-torsion.
Processes 13 03331 g020
Figure 21. Ultimate bearing capacity experiment.
Processes 13 03331 g021
Table 1. Summary of this testing machine.
DeviceMaximum LoadMaximum DisplacementFunction
Vertical compression device80 MN1200 mmStatic vertical compression
Double shear device3 MN250 mmStatic double compression-shear
Single shear device3 MN250 mmStatic single compression-shear
dynamic single compression-shear
Torsion device1.8 MN100 mmStatic compression-torsion
Table 2. Specific material parameters.
Elastic Modulus
(GPa)
Density
(kg/m3)
Poisson RatioYield Strength
(MPa)
Tensile Strength
(MPa)
20Mn21078100.28275450
Q345B20678200.3345480
45 Steel20978900.269355600
40Cr21178500.277785890
42Cr21278500.2869301080
Table 3. Variation in the maximum stress and maximum displacement with mesh size.
MeshMaximum StressMaximum Displacement
TypeSize (mm)Value (MPa)Relative ErrorValue (mm)Relative Error
Coarse 100208.2912.3%4.246.4%
Medium75223.546.1%4.383.3%
Fine50234.971.3%4.490.9%
Ultrafine25238.1504.530
Table 4. Modal simulation results.
Order 1st2nd3rd4th
Natural frequency7.1699 Hz11.585 Hz13.958 Hz40.618 Hz
Maximum displacement0.12217 mm0.13282 mm0.1554 mm0.58928 mm
Processes 13 03331 i001Processes 13 03331 i002Processes 13 03331 i003Processes 13 03331 i004
Table 5. Maximum stress under the five ultimate loading conditions.
Static Vertical CompressionStatic Double Compression-ShearStatic Single Compression-ShearDynamic Single Compression-ShearStatic Compression Torsion
Whole MachineFrameWhole MachineFrameWhole MachineFrameWhole MachineWhole MachineFrame
Sole-column (MPa)233.5161.6232.1232.1335.8335.8391.5228.3164.2
Plate-column (MPa)205133204.5188.9272.6272.6296.1215.4141.9
Reduction amplitude12.2%17.7%11.9%18.6%18.8%18.8%24.4%5.6%13.5%
In the sole-column testing machine, the maximum stress is located in the columns. In the plate-column testing machine, the maximum stress is located in the lateral reaction plates or the columns. The materials of the lateral reaction plates and columns are Q345B and 42Cr, respectively, and their yield strengths are 345 MPa and 930 MPa, respectively.
Table 6. Maximum displacement under the five ultimate loading conditions.
Static Vertical CompressionStatic Double Compression-ShearStatic single Compression-ShearDynamic Single Compression-ShearStatic Compression Torsion
Whole machineFrameWhole machineFrameWhole MachineFrameWhole MachineWhole MachineFrame
Sole-column (mm)4.3873.1987.9386.85913.912.4415.74.8743.33
Plate-column (mm)3.5032.4213.5872.5623.8192.8513.924.0002.546
Reduction amplitude20.15%24.3%54.8%62.6%72.5%77.1%75.0%17%23.5%
The maximum allowable displacement is 1/1000 of the overall dimensions: 12 mm.
Disclaimer/Publisher’s Note: The statements, opinions and data contained in all publications are solely those of the individual author(s) and contributor(s) and not of MDPI and/or the editor(s). MDPI and/or the editor(s) disclaim responsibility for any injury to people or property resulting from any ideas, methods, instructions or products referred to in the content.