1. Introduction
Sucrose is composed of a glucose unit linked to a fructose unit by the glycosidic bond and it is the most abundant disaccharide in nature [
1]. This disaccharide can serve as a carbon source for a wide variety of bacteria. Sucrose can be cleaved by sucrose-6-phosphate hydrolases and sucrose phosphorylases after uptake into the bacterial cytoplasm [
2]. Recently, attempts for utilisation of sucrose as a cheap and easily degradable feedstock for biochemical production through microbial fermentation have attracted significant interest due to its widespread availability, low cost, and high fermentability, making it an attractive substrate for industrial bioprocesses [
3].
In
Bacillus subtilis, the
sacA gene encodes sucrase A, a sucrose-6-phosphate hydrolase that is part of the phosphoenolpyruvate:sugar phosphotransferase system (PTS). Through this system, sucrose is internalised and phosphorylated to sucrose-6-phosphate, which is subsequently hydrolysed by SacA into glucose-6-phosphate and fructose [
4]. This mechanism enables
B. subtilis to efficiently utilise sucrose as a carbon source. By contrast,
E. coli lacks the chromosomal sucrose operon, which encodes the PTS transporter and the associated catabolic enzymes; therefore, it is naturally unable to metabolise sucrose.
Enzymatic characterisation of SacA is essential to elucidate its catalytic properties, substrate specificity, and biotechnological potential. Moreover, when SacA is heterologously expressed in
E. coli, it remains confined into the cytoplasm, where it cannot interact with extracellular sucrose due to the bacterium’s lack of a functional uptake system. Therefore, effective hydrolysis requires the enzyme to be secreted or displayed on the outer membrane [
3]. To overcome the limitations of intracellular localisation and enhance substrate interaction, surface display strategies have been widely employed, enabling active enzymes to function at the cell surface without disrupting cell integrity [
5].
One of the most widely studied systems for surface expression in
Escherichia coli is the Adhesin Involved in Diffuse Adherence (AIDA-I), a type V secretion system. AIDA-I comprises three main components: an N-terminal signal peptide that directs the protein to the Sec translocon for periplasmic translocation, a central passenger domain that may contain the catalytic activity, and a C-terminal β-barrel domain that anchors the protein to the outer membrane [
6]. When a heterologous protein is genetically fused to the β-barrel domain of AIDA-I, the passenger domain can be translocated through the β-barrel pore and exposed on the cell surface. This architecture enables the extracellular localisation of functional enzymes, while the autodisplay system allows the expression of more than 10
5 recombinant molecules per cell and represents a robust tool for displaying active enzymes on the bacterial surface [
7].
In this study, SacA from B. subtilis was fused to the AIDA-I autotransporter system and expressed in E. coli cells. The constructed pAIDA-sacA plasmid allowed the generation of strains that exhibited saccharolytic activity, whereas native E. coli strains were unable to hydrolyse sucrose due to the absence of a functional sucrose utilisation system. This work demonstrates the feasibility of employing the AIDA-I system for the surface display of SacA, offering a robust platform for future biocatalytic processes using whole cells.
2. Materials and Methods
2.1. Construction of the pAIDA-sacA Plasmid
The construction of the pAIDA-
sacA plasmid has been previously reported by [
3]. Briefly, the
sacA gene, encoding sucrase A from
Bacillus subtilis (GenBank accession number CP053102.1), was amplified by PCR using genomic DNA as the template with the primers sacA FW (5′-GGCGCGCCTACAGCACATGACCAGGAG-3′) and sacA RV (5′-CTCGAGCGCATAAGTGTCCAAATTCC-3′). The PCR product was cloned into the pGEM-T vector (Promega, Madison, WI, USA), digested with
AscI and
XhoI, and ligated into the pre-digested pAIDA plasmid, originally developed by [
5]. The final construct contains the
ctxB signal peptide from
Vibrio cholerae, a flexible linker region, and the β-barrel domain of the AIDA-I autotransporter fused to
sacA, all under the control of the constitutive gapAP1 promoter. Assembly and sequence verification were performed using MacVector (MacVector Inc., Version 10.1, Apex, NC, USA) and SnapGene software (GSL Biotech LLC, Version 3.3, San Diego, CA, USA). The plasmid was subsequently introduced into
E. coli strains W3110 and DH5α via heat-shock transformation.
2.2. Structural Prediction of AIDA-SacA
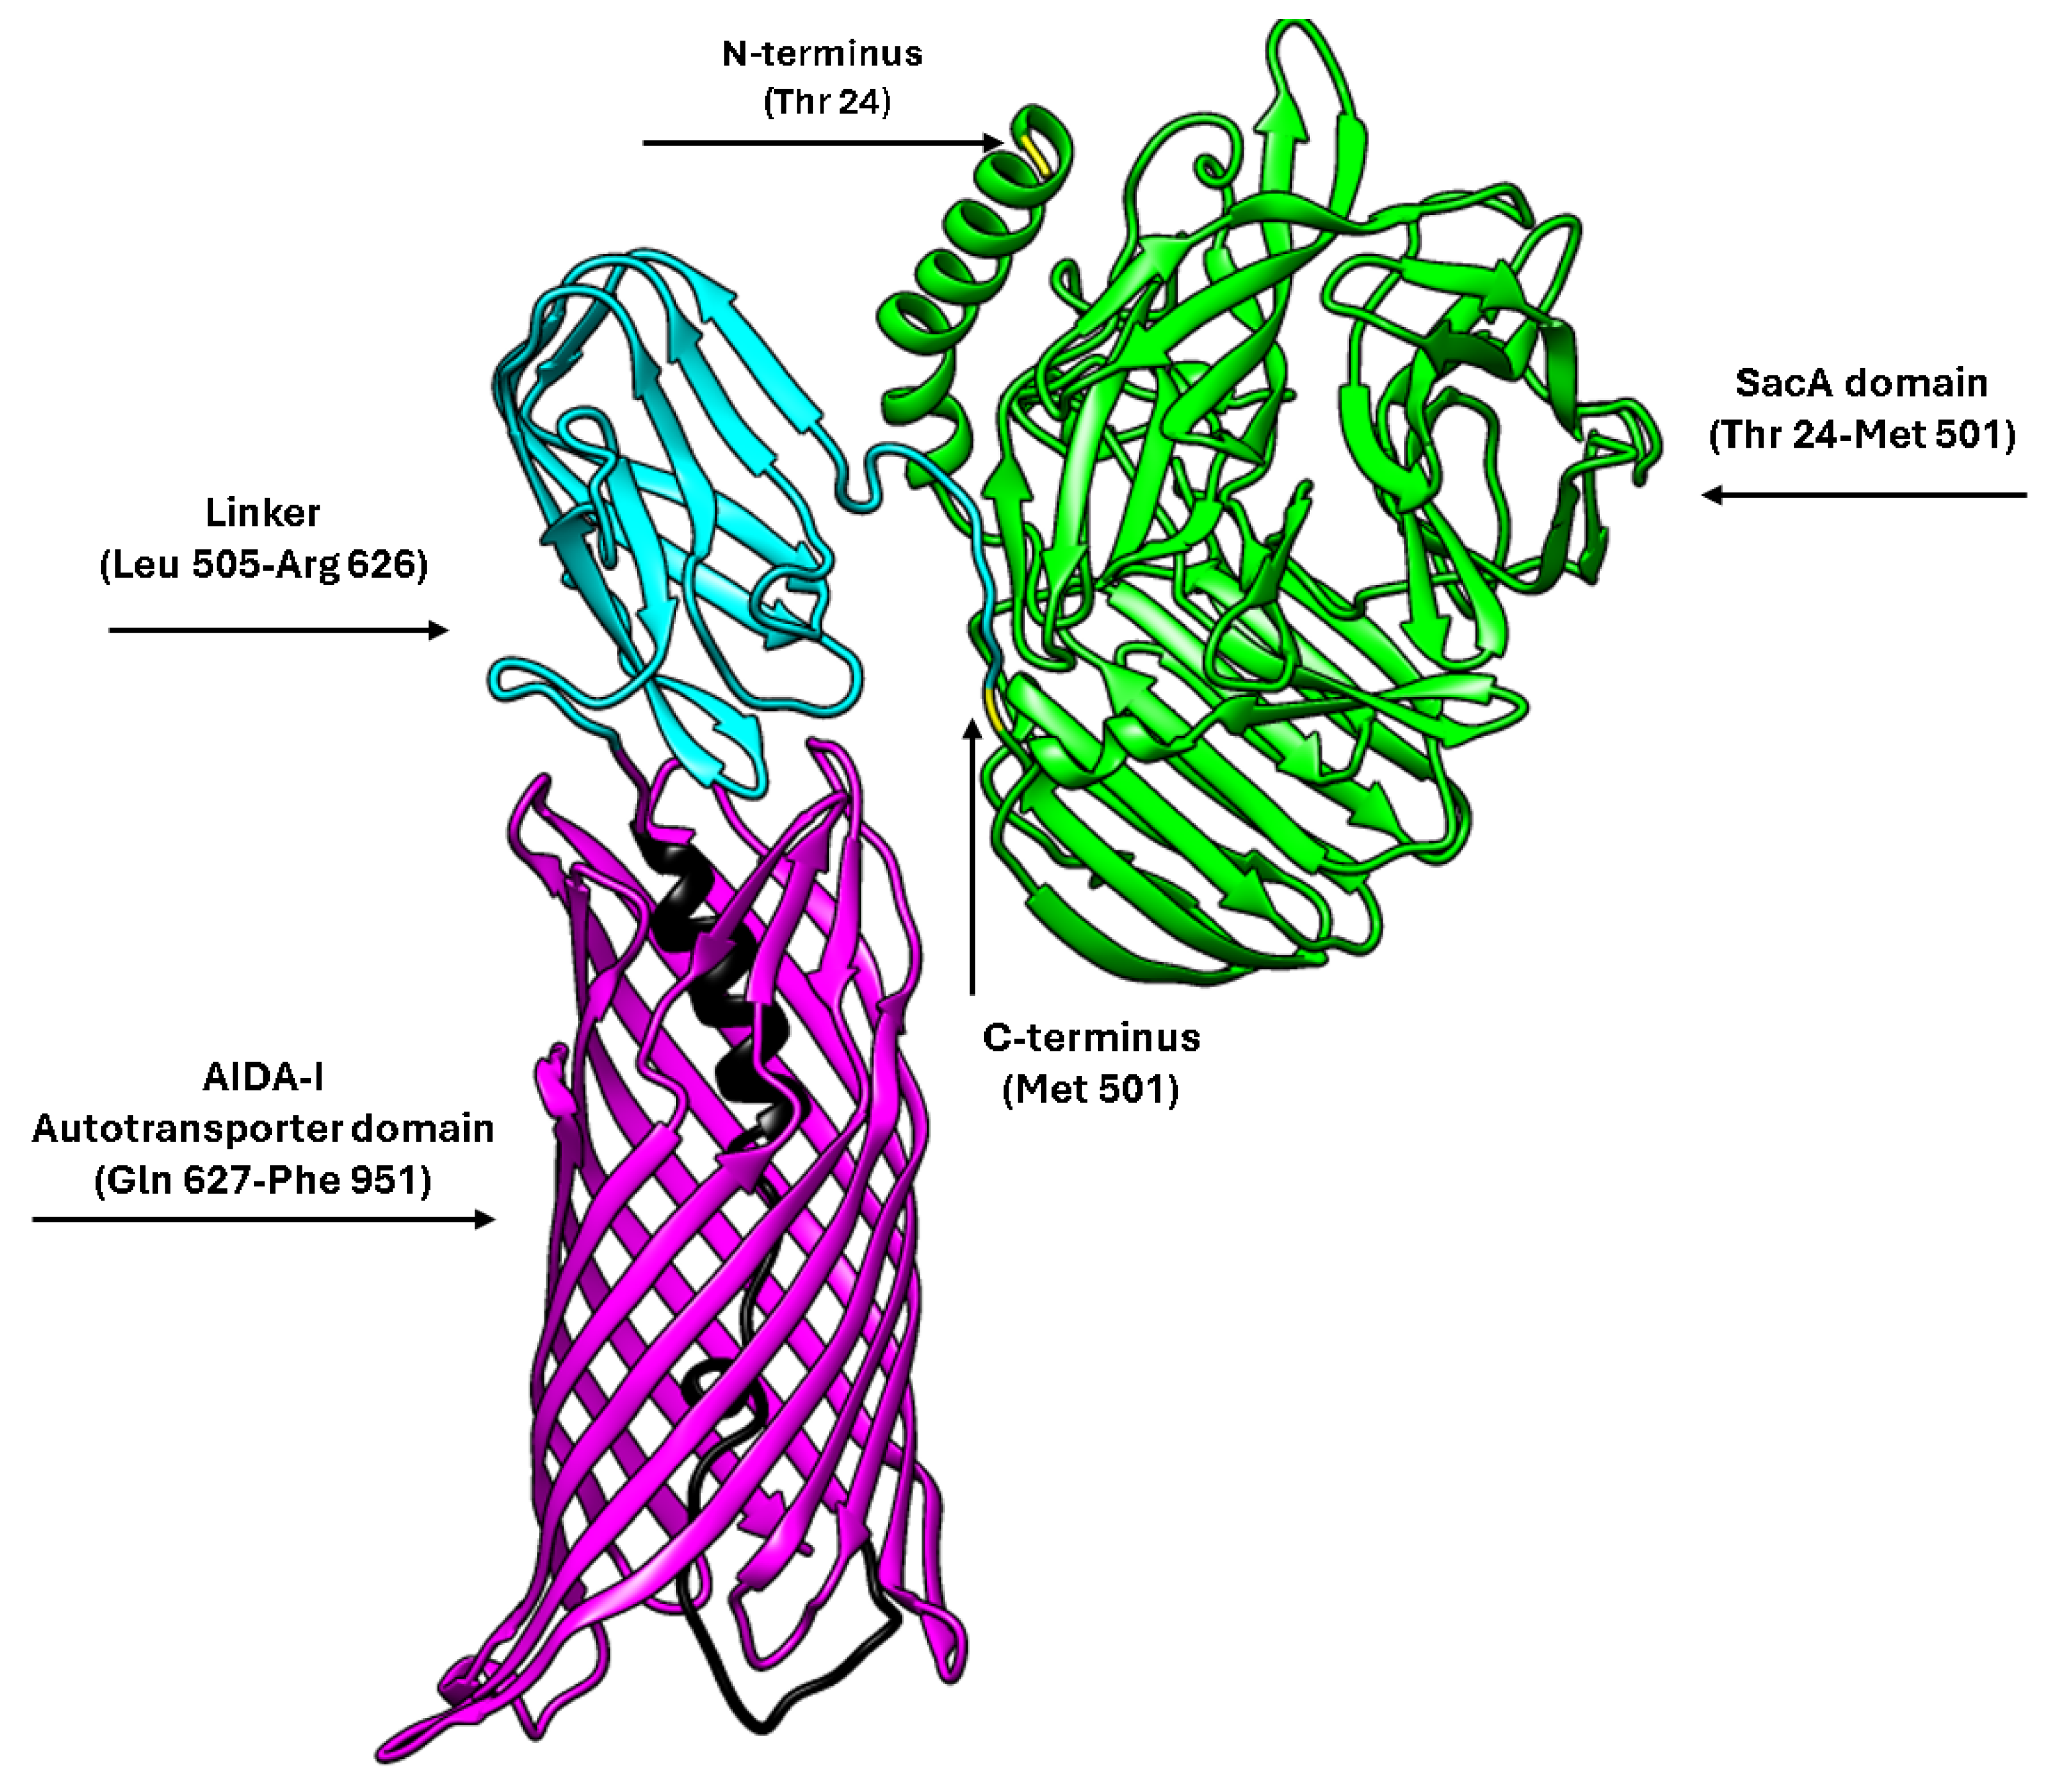
The structure of the AIDA-SacA fusion protein was predicted using the ColabFold v1.5.5 implementation of AlphaFold 2 (
https://colab.research.google.com/github/sokrypton/ColabFold/blob/main/AlphaFold2.ipynb (accessed on 5 October 2025)) which integrates MMseqs2 for multiple sequence alignment and AlphaFold 2 inference. The complete amino acid sequence, including the signal peptide, SacA domain, linker, and AIDA-I β-barrel domain, was submitted to generate the model. The resulting structural model was visualised and manipulated using UCSF Chimera software (University of California, San Francisco, CA, USA; Version 1.19) for domain identification and graphical representation.
2.3. Sodium Dodecyl Sulphate–Polyacrylamide Gel Electrophoresis (SDS-PAGE)
The presence of the AIDA-SacA fusion protein was confirmed by sodium dodecyl sulphate–polyacrylamide gel electrophoresis (SDS-PAGE) under denaturing conditions. Cell pellets were resuspended in phosphate buffer and subjected to sonication using short pulses while kept on ice to minimise thermal denaturation. The resulting lysates were mixed with Laemmli buffer (5×) (Bio-Rad Laboratories, Hercules, CA, USA) containing 10% SDS (Sigma-Aldrich, Burlington, MA, USA) and 5% β-mercaptoethanol (Bio-Rad Laboratories, Hercules, CA, USA) in a 4:1 (v/v) ratio, and the samples were then boiled at 95 °C for five min. Protein separation was carried out using a 12% polyacrylamide resolving gel with a 5% stacking gel (Bio-Rad Laboratories, Hercules, CA, USA), operated at a constant voltage of 120 V until the tracking dye reached the base of the gel. After electrophoresis, gels were stained with Coomassie Brilliant Blue R-250 (Bio-Rad Laboratories, Hercules, CA, USA) and subsequently destained overnight using a 40% (v/v) methanol–10% (v/v) acetic acid solution (CTR Scientific, Guadalajara, Mexico; reagent grade) until a clear background and well-resolved bands were obtained. Protein molecular weights were estimated using the Prestained PageRuler™ Protein Ladder (Thermo Fisher Scientific, Waltham, MA, USA; catalogue no. 266164) as a reference, which was run in parallel to determine the apparent sizes of the expressed proteins.
2.4. Assessment of Saccharolytic Activity Using Phenol Red Agar
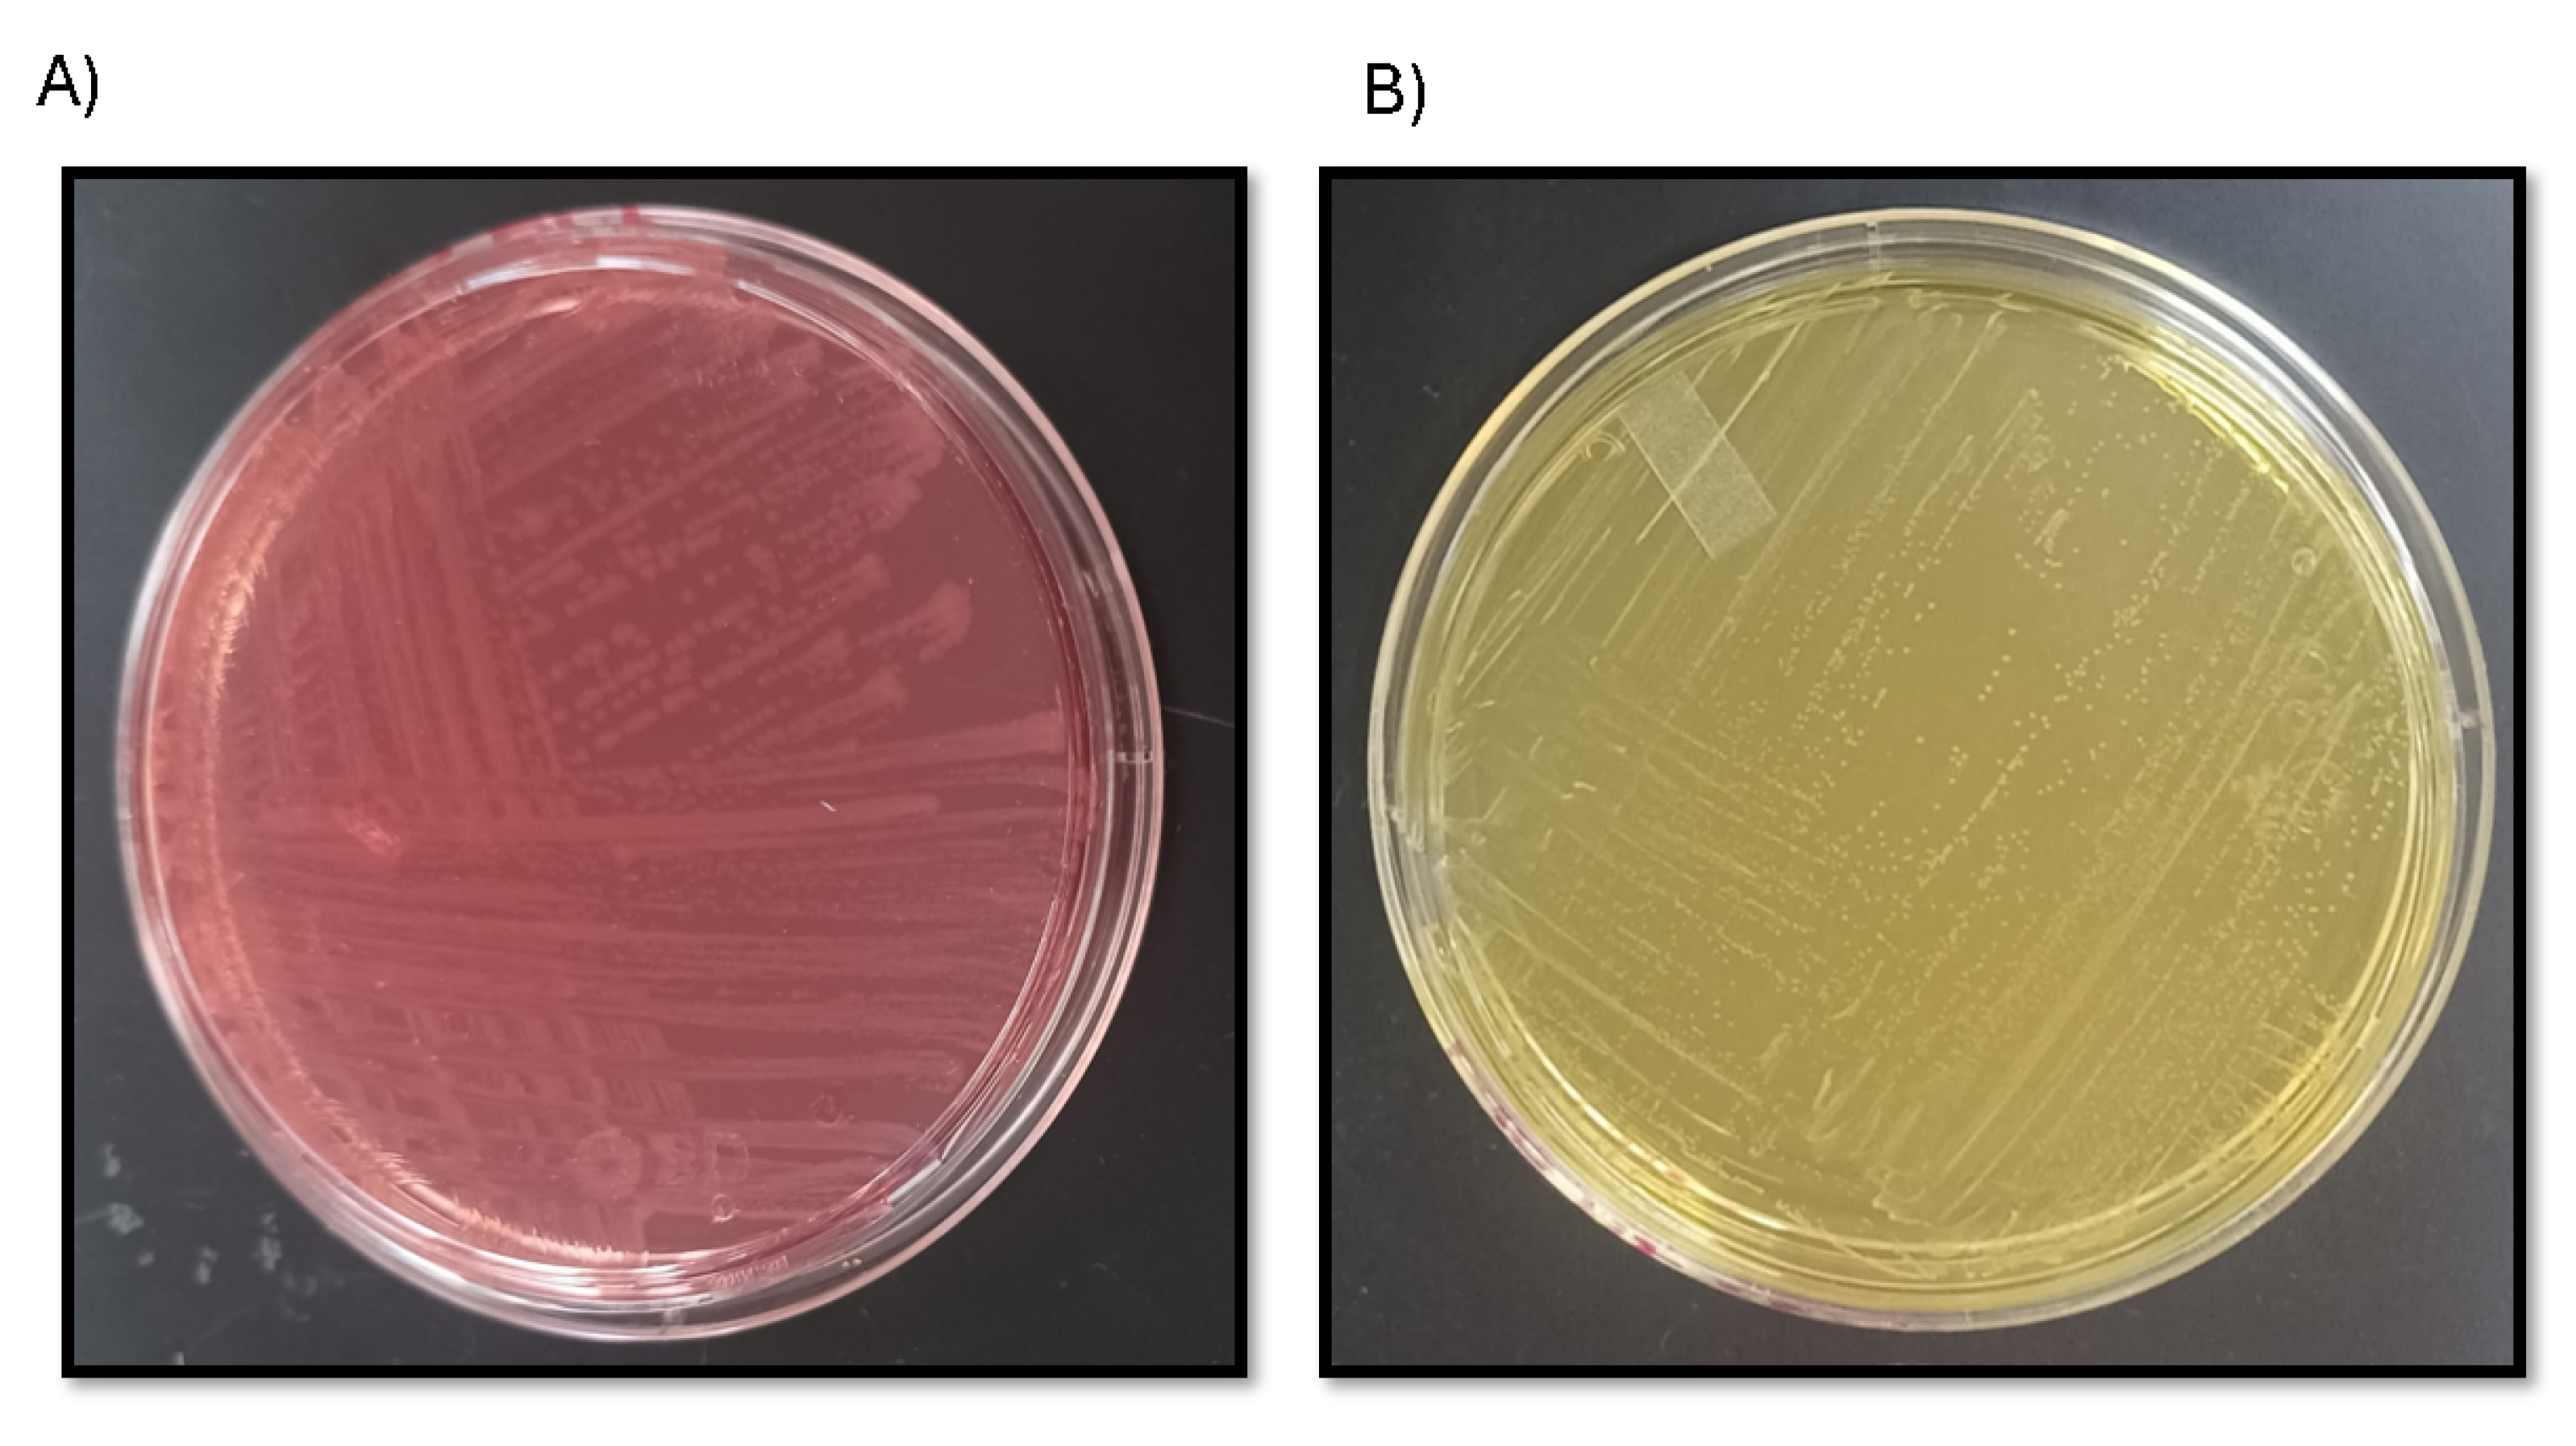
The saccharolytic activity of Escherichia coli expressing AIDA-SacA was evaluated using a phenol red sucrose fermentation assay. E. coli W3110 strains harbouring pAIDA-sacA and a control strain without the plasmid were streaked onto phenol red agar plates containing 10 g L−1 peptone (Sigma-Aldrich, Burlington, MA, USA), 5 g L−1 sodium chloride (Karal, León, Mexico), 0.018 g L−1 phenol red (Sigma-Aldrich, Burlington, MA, USA), 5 g L−1 sucrose (Materiales y Abastos Especializados, Zapopan, Mexico; ACS grade) as the sole carbon source and ampicillin (Pharmalife, Laboratorios Pisa, Guadalajara, Mexico, ≥99% purity) at a final concentration of 100 µg mL−1. Plates were incubated at 37 °C for 48 h, and colour changes in the medium were recorded as an indicator of acid production from red to yellow resulting from sucrose metabolism.
2.5. Enzymatic Activity Assay
To evaluate the enzymatic activity of AIDA-SacA, assays were performed using whole cells.
Escherichia coli W3110 carrying pAIDA-
sacA was cultivated overnight in Luria–Bertani medium (Sigma-Aldrich, Burlington, MA, USA) supplemented with 100 µg mL
−1 ampicillin (Pharmalife, Laboratorios Pisa, Guadalajara, Mexico; ≥99% purity) at 37 °C with shaking at 200 rpm. Cells were harvested by centrifugation at 8000×
g for 10 min at 4 °C, washed twice with 100 mM potassium phosphate buffer (pH 6.5), prepared by mixing appropriate proportions of 100 mM KH
2PO
4 (CTR Scientific, Guadalajara, Mexico, reagent grade) and 100 mM K
2HPO
4 (CTR Scientific, Guadalajara, Mexico; reagent grade) until the desired pH was reached, and resuspended in the same buffer. For whole-cell activity assays, the biomass concentration was adjusted to an optical density at 600 nm (OD
600) of 10, and the cells were incubated with 5 mM sucrose at 37 °C for 60 min. A control assay was included in which the cell suspension was heat-inactivated at 95 °C for 5 min before substrate addition. Reactions were stopped by heating at 95 °C for 5 min, and the concentration of reducing sugars was determined using the dinitrosalicylic acid (DNS) method [
8]. The concentration of reducing sugars was quantified using a calibration curve generated with glucose standards (1.0–0.0625 g L
−1; R
2 = 0.99). Absorbance was recorded at 540 nm after DNS treatment, and the calibration curve was used to calculate the equivalent amount of reducing sugars in µmol. All assays were performed in 100 mM potassium phosphate buffer (pH 6.5). One unit of sucrase activity was defined as the amount of enzyme required to release 1 µmol of reducing sugars per minute under the specified assay conditions.
2.6. Enzymatic Optimum Temperature
The optimum temperature for AIDA-SacA activity was determined by performing enzymatic assays at 20, 30, 40, 50, 60, and 70 °C. Reactions were conducted in 100 mM potassium phosphate buffer (pH 6.5) with 5 mM sucrose as the substrate. The enzymatic activity was measured by quantifying the reducing sugars released using the DNS method. The enzyme was incubated at each temperature for 60 min, and reactions were stopped by heating at 95 °C for 5 min. The activity at each temperature was expressed as a percentage relative to the maximum observed activity. All experiments were performed in triplicate, and results were reported as the mean ± standard deviation.
2.7. Enzymatic Optimum pH
The optimum pH for AIDA-SacA activity was determined by performing enzymatic assays at pH 3, 4, 5, 6, 7, 8, and 9. Reactions were carried out in 50 mM Robinson’s buffer, which consists of 50 mM phosphoric acid (Karal, Guanajuato, Mexico; reagent grade), 50 mM boric acid (CTR Scientific, Guadalajara, Mexico; reagent grade), and 50 mM acetic acid (Karal, Guanajuato, Mexico; reagent grade). The assays were performed at the optimum temperature determined from the temperature experiments, using 5 mM sucrose as the substrate. Enzymatic activity was measured by quantifying the reducing sugars released using the DNS method. The enzyme preparation was incubated at each pH for 60 min, and reactions were stopped by heating at 95 °C for 5 min. Activity at each pH was expressed as a percentage relative to the maximum observed activity. All experiments were performed in triplicate, and results were reported as the mean ± standard deviation.
2.8. Enzymatic Thermal Stability
The thermal stability of AIDA-SacA was evaluated by incubating the enzyme at 45, 55, and 65 °C for 15, 30, 45, and 60 min. After each incubation period, aliquots were withdrawn and immediately cooled on ice to halt enzymatic activity. Residual activity was assessed under standard assay conditions using 5 mM sucrose in potassium phosphate buffer (pH 6.5). The amount of reducing sugars released was quantified using the DNS method. Enzymatic activity was expressed as a percentage relative to the initial (non-incubated) enzyme activity. All experiments were performed in triplicate, and results were reported as the mean ± standard deviation.
2.9. Kinetic Parameters Calculation
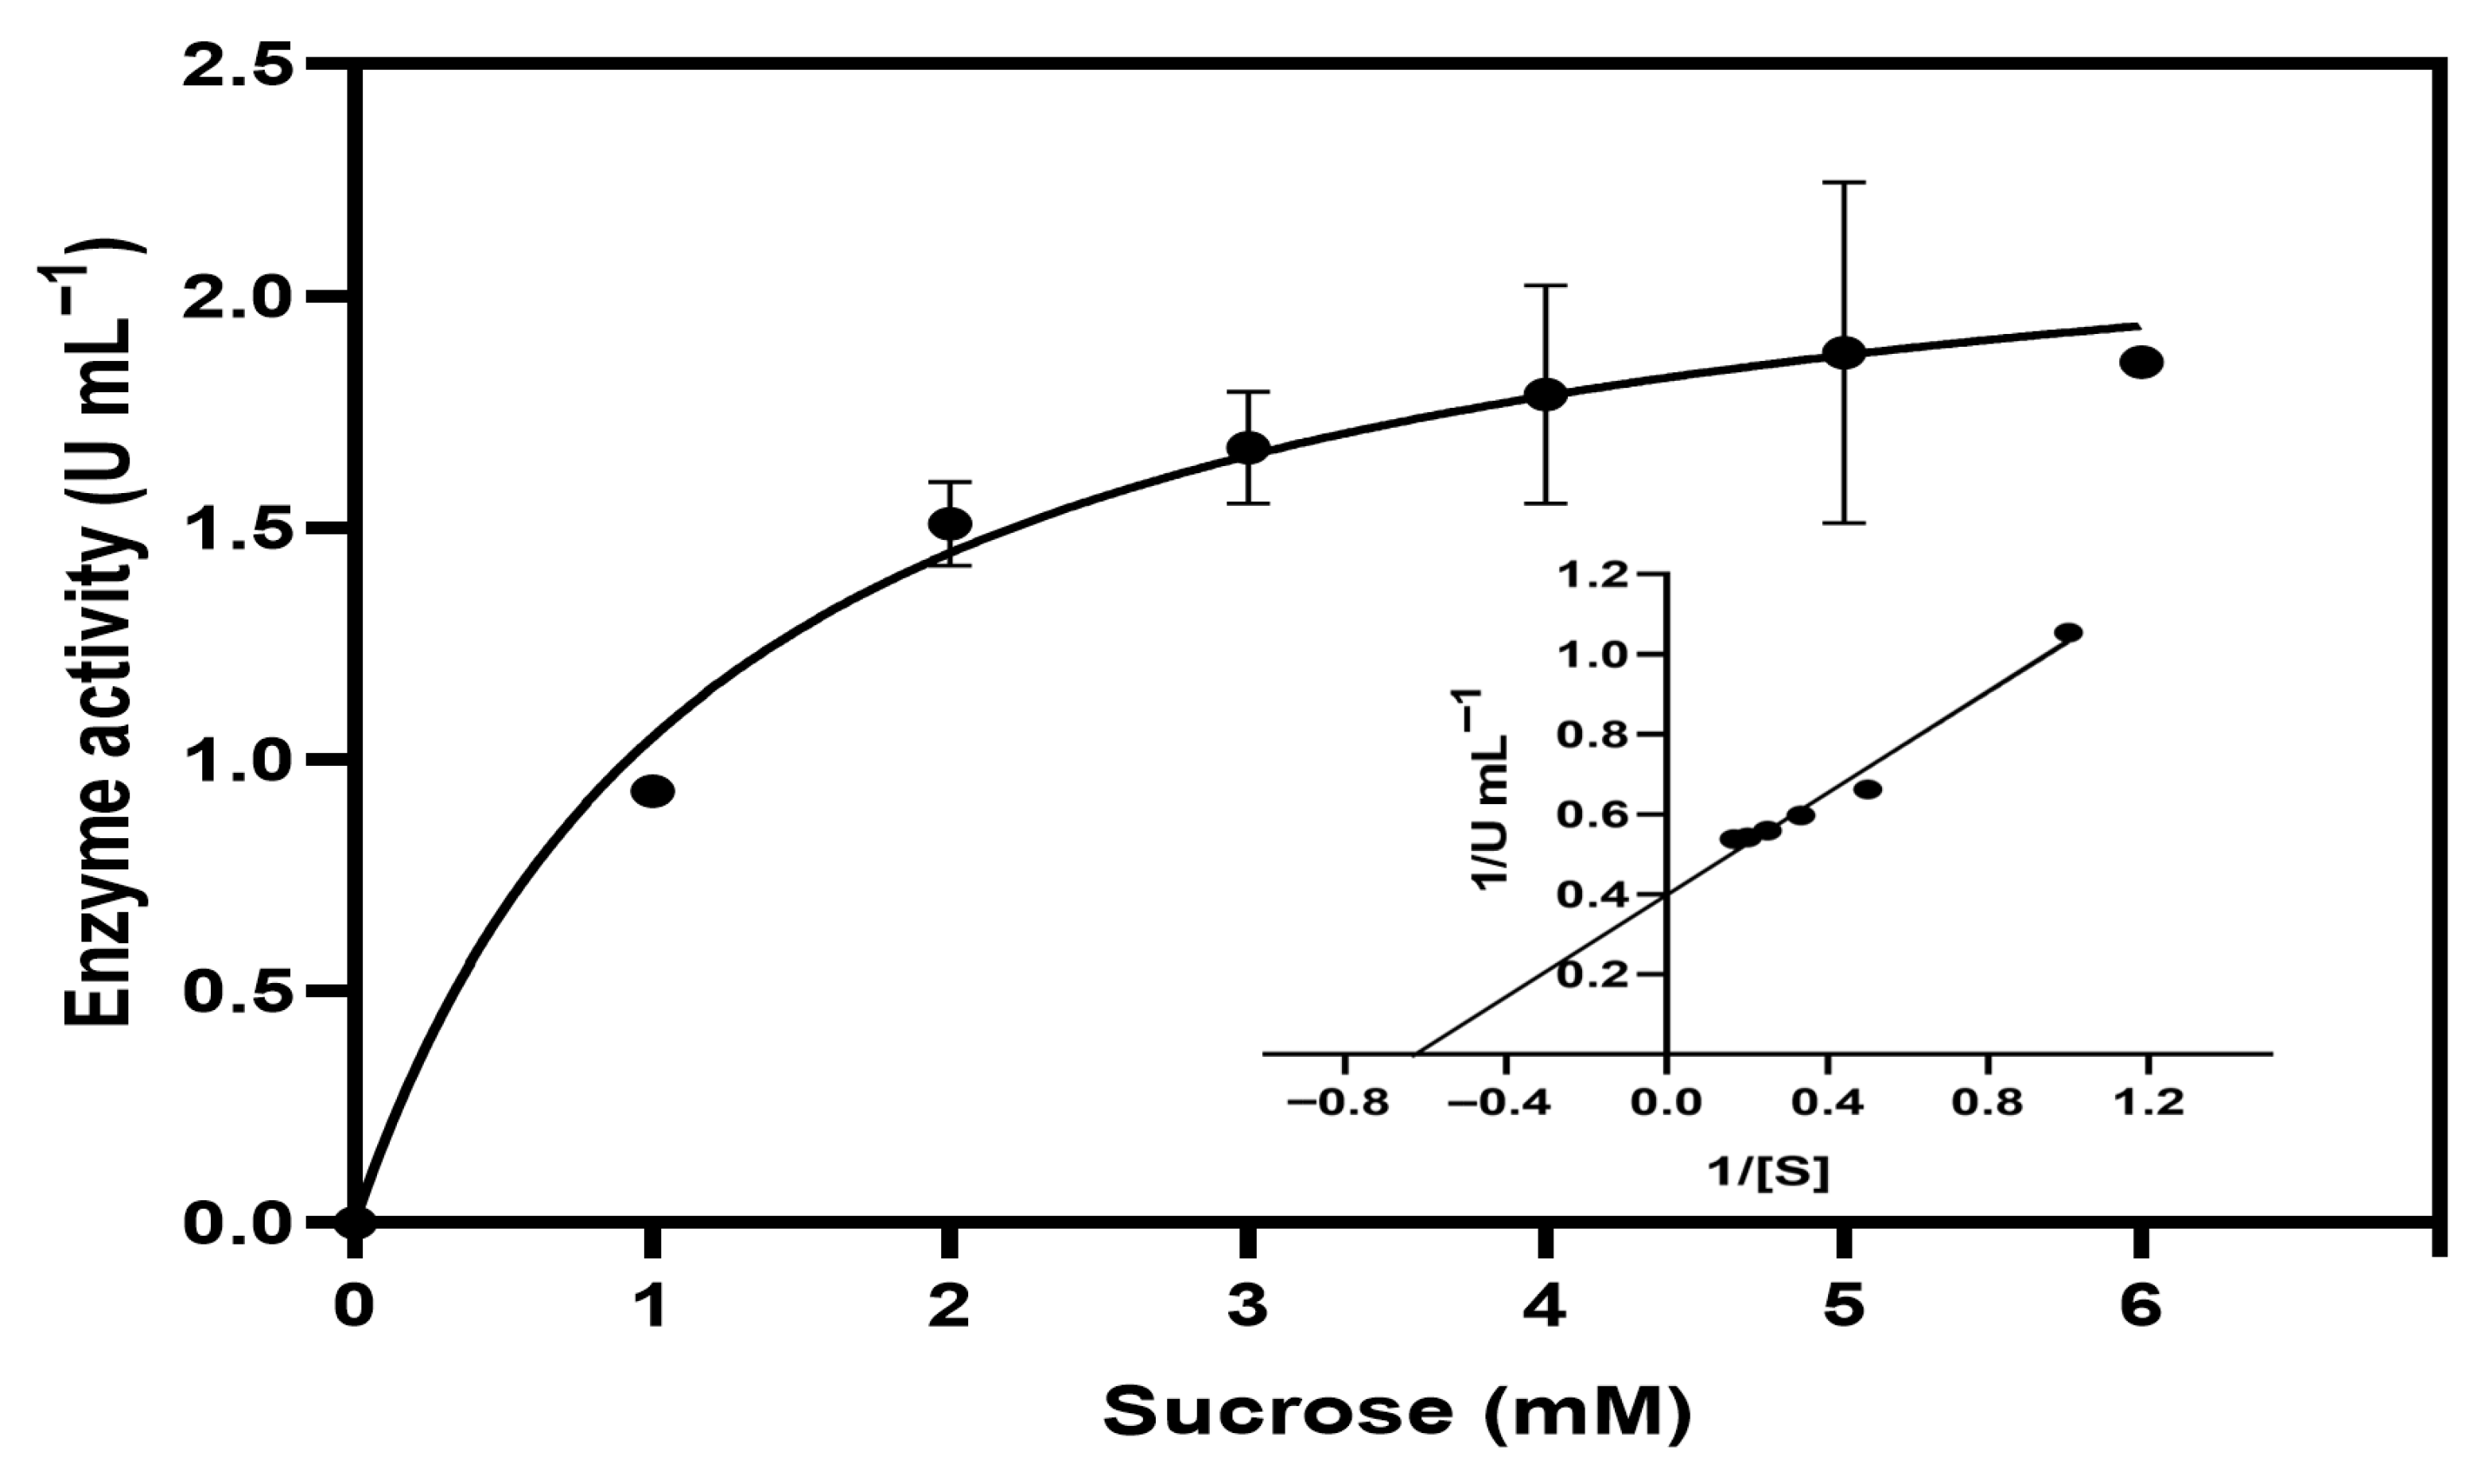
Enzymatic activity was measured at increasing sucrose concentrations (1, 2, 3, 4, 5, and 6 mM). Reactions were carried out at 40 °C using whole cells of
Escherichia coli W3110/pAIDA-
sacA at an optical density (OD600) of 10, suspended in 100 mM potassium phosphate buffer (pH 6.5). An initial-rate time range was established from time-course assays; all kinetic points were collected at a fixed time within this linear interval with low substrate conversion. The amount of reducing sugars released was quantified using the DNS method. The kinetic parameters Km and Vmax of AIDA–SacA were determined by fitting the experimental data to the Michaelis–Menten equation using GraphPad Software version 8.0.2 (Boston, MA, USA), as follows:
where
v represents the initial velocity,
[S] the substrate concentration,
Km the Michaelis constant, and
Vmax the maximum velocity. The data were also linearised using the Lineweaver–Burk representation:
confirming agreement between the non-linear regression and linear transformation. All experiments were performed in triplicate, and results are expressed as the mean ± standard deviation.
2.10. Assessment of Metal Ion and Chemical Modulator Effects on AIDA-SacA Activity
To determine the effect of various metals and compounds on the enzymatic activity of AIDA-SacA, enzymatic assays were conducted using whole cells of Escherichia coli W3110/pAIDA-sacA at an optical density (OD600) of 10, incubated with different treatments. Reactions were carried out in a final volume of 1 mL, containing cell suspension, sucrose at a final concentration of 5 mM, the corresponding metal or additive at a final concentration of 1 mM, and 100 mM potassium phosphate buffer (pH 6.5) as diluent. The tested metal ions included: KCl (J.T. Baker, Phillipsburg, NJ, USA), NaCl (Karal, Nuevo León, Mexico), ZnCl2 (Karal, Nuevo León, Mexico), CuCl2 (Karal, Nuevo León, Mexico), FeSO4 (Fermont, Nuevo León, Mexico; ACS grade), CaCl2 (Karal, Nuevo León, Mexico), and MgSO4 (Fermont, Nuevo León, Mexico). The tested chemical compounds included: EDTA (J.T. Baker, Phillipsburg, NJ, USA), DTT (Bio-Rad, Hercules, CA, USA), and acetic acid (Karal, Guanajuato, Mexico; reagent grade) which was added at a final concentration of 10 mM. Reactions were incubated at 40 °C for 2 h under mild agitation (100 rpm), and glucose release was quantified using the DNS colorimetric method. Relative enzymatic activity was calculated with respect to the control condition without additives (set as 100%).
4. Conclusions
The Escherichia coli strain transformed with the pAIDA–sacA plasmid, which expresses the AIDA–SacA fusion protein, exhibits functional activity as indicated by saccharolytic assays, structural modelling, and enzymatic characterisation. The enzyme shows a Km of 1.18 mM, optimal activity at 40 °C and pH 7.0, and retains over 80% of its activity after 60 min at 45 °C, reflecting good thermal stability under mesophilic conditions. Potassium ions enhance enzymatic activity, whereas zinc, copper, and magnesium act as inhibitors. Protein expression is further confirmed by SDS–PAGE, which reveals a distinct band at approximately 114 kDa, consistent with the predicted molecular mass of the AIDA–SacA fusion. Collectively, these findings support the notion that SacA is surface-associated through the AIDA-I system and demonstrate the functional expression of a sucrase on E. coli cells. Further studies incorporating biochemical assays such as protease accessibility, immunofluorescence, or cell fractionation are required to provide direct evidence of surface display and to confirm the robustness of this platform.


